PDL BioPharma Initiation of coverage - Baystreet · PDL BioPharma is a research client of ... PDL...
14
21 July 2015 PDL BioPharma is a research client of Edison Investment Research Limited PDL BioPharma is reinventing itself as a healthcare-focused finance company through a two-pronged strategy, investing in royalty streams and providing high-yield financing life science companies with near-term product launches. This strategy allows investors to gain exposure in healthcare through a relatively low-risk, diversified vehicle. We currently value PDL at $6.84 per basic share. Year end Revenue ($m) PBT* ($m) EPS* ($) DPS ($) P/E (x) Yield (%) 12/14 581.2 501.3 2.04 0.60 3.1 9.4 12/15e 569.6 512.8 2.00 0.60 3.2 9.4 12/16e 201.4 149.3 0.56 0.60 11.4 9.4 12/17e 62.3 7.6 0.03 0.60 N/A 9.4 Note: *PBT and EPS are normalised, excluding intangible amortisation, exceptional items and share-based payments. Several royalty streams For the next year, PDL will still be receiving royalties from its Queen et al patents, which enabled some of biotechnology’s most successful monoclonal antibodies (eg Avastin, Herceptin, etc). PDL will also be receiving royalties on Glumetza, Janumet XR and other medications into the next decade, which should provide some income, albeit not at the level of the Queen et al patents. High-yield debt financing business has potential PDL has funded several companies through high-yield notes with interest ranging from 12-15%, providing a healthy return given the current low interest rate environment and PDL’s ability to raise funds with low single-digit rate interest. Lower-risk play on solanezumab Solanezumab is a Phase III antibody, which PDL has the right to receive a 2% royalty, being developed by Lilly for Alzheimer’s disease. After missing the primary endpoints in the EXPEDITION 1 & 2 trials in mild to moderate Alzheimer’s patients, Lilly has focused the EXPEDITION 3 trial on mild patients, where it saw efficacy and tightened up the entry criteria to ensure that participants are truly Alzheimer’s patients with β amyloid plaques. Valuation: $6.84 per basic share Using an NPV model that values each revenue stream, we value the company at $1,114m or $6.84 per basic share. On a fully diluted basis, we value the company at $6.54 per share. PDL is fully funded currently and should remain profitable, albeit at a lower level, through 2018. We project that PDL will be able to continue its dividend at the current level of $0.60 per share (~$100m total) per year through 2018 (currently yielding 9.2%). However, there remains a significant risk that the company will not be able to maintain profitability post-2018, when it will need to pay off $300m in debt, limiting its ability to make further investments or continue paying dividends. PDL BioPharma Initiation of coverage Low-risk, diversified healthcare play Price US$6.38 Market cap US$1039m Net debt ($m) at 31 March 2015 113 Shares in issue 162.8m Free float 92.3% Code PDLI Primary exchange NASDAQ Secondary exchange N/A Share price performance % 1m 3m 12m Abs (1.8) (10.8) (32.3) Rel (local) (2.7) (11.9) (37.1) 52-week high/low US$10.26 US$6.01 Business description PDL BioPharma has reinvented itself through a two-pronged strategy of investing in royalty streams of marketed and development-stage therapeutics and providing high-yield debt financing to medical device and diagnostic companies with near-term product launches. Next events Additional royalty and note deals 2015 Solanezumab Phase III data H216 Analysts Maxim Jacobs +1 646 653 7027 Christian Glennie +44 (0)20 3077 5727 [email protected] Edison profile page Pharma & biotech
Transcript of PDL BioPharma Initiation of coverage - Baystreet · PDL BioPharma is a research client of ... PDL...

21 July 2015
PDL BioPharma is a research client of Edison Investment Research Limited
PDL BioPharma is reinventing itself as a healthcare-focused finance
company through a two-pronged strategy, investing in royalty streams and
providing high-yield financing life science companies with near-term
product launches. This strategy allows investors to gain exposure in
healthcare through a relatively low-risk, diversified vehicle. We currently
value PDL at $6.84 per basic share.
Year end Revenue ($m)
PBT* ($m)
EPS* ($)
DPS ($)
P/E (x)
Yield (%)
12/14 581.2 501.3 2.04 0.60 3.1 9.4
12/15e 569.6 512.8 2.00 0.60 3.2 9.4
12/16e 201.4 149.3 0.56 0.60 11.4 9.4
12/17e 62.3 7.6 0.03 0.60 N/A 9.4
Note: *PBT and EPS are normalised, excluding intangible amortisation, exceptional items and share-based payments.
Several royalty streams
For the next year, PDL will still be receiving royalties from its Queen et al patents,
which enabled some of biotechnology’s most successful monoclonal antibodies (eg
Avastin, Herceptin, etc). PDL will also be receiving royalties on Glumetza, Janumet
XR and other medications into the next decade, which should provide some
income, albeit not at the level of the Queen et al patents.
High-yield debt financing business has potential
PDL has funded several companies through high-yield notes with interest ranging
from 12-15%, providing a healthy return given the current low interest rate
environment and PDL’s ability to raise funds with low single-digit rate interest.
Lower-risk play on solanezumab
Solanezumab is a Phase III antibody, which PDL has the right to receive a 2%
royalty, being developed by Lilly for Alzheimer’s disease. After missing the primary
endpoints in the EXPEDITION 1 & 2 trials in mild to moderate Alzheimer’s patients,
Lilly has focused the EXPEDITION 3 trial on mild patients, where it saw efficacy
and tightened up the entry criteria to ensure that participants are truly Alzheimer’s
patients with β amyloid plaques.
Valuation: $6.84 per basic share
Using an NPV model that values each revenue stream, we value the company at
$1,114m or $6.84 per basic share. On a fully diluted basis, we value the company
at $6.54 per share. PDL is fully funded currently and should remain profitable, albeit
at a lower level, through 2018. We project that PDL will be able to continue its
dividend at the current level of $0.60 per share (~$100m total) per year through
2018 (currently yielding 9.2%). However, there remains a significant risk that the
company will not be able to maintain profitability post-2018, when it will need to pay
off $300m in debt, limiting its ability to make further investments or continue paying
dividends.
PDL BioPharma Initiation of coverage
Low-risk, diversified healthcare play
Price US$6.38
Market cap US$1039m
Net debt ($m) at 31 March 2015 113
Shares in issue 162.8m
Free float 92.3%
Code PDLI
Primary exchange NASDAQ
Secondary exchange N/A
Share price performance
% 1m 3m 12m
Abs (1.8) (10.8) (32.3)
Rel (local) (2.7) (11.9) (37.1)
52-week high/low US$10.26 US$6.01
Business description
PDL BioPharma has reinvented itself through a
two-pronged strategy of investing in royalty streams
of marketed and development-stage therapeutics
and providing high-yield debt financing to medical
device and diagnostic companies with near-term
product launches.
Next events
Additional royalty and note deals 2015
Solanezumab Phase III data H216
Analysts
Maxim Jacobs +1 646 653 7027
Christian Glennie +44 (0)20 3077 5727
Edison profile page
Pharma & biotech

PDL BioPharma | 21 July 2015 2
Investment summary
Company description: A plethora of revenue streams
PDL, which originated as biotechnology company Protein Design Labs in 1986, has morphed from
a standard biotechnology company with drugs and high R&D expenses to a diversified manager of
royalty and debt assets. This change in business type has enabled it to have an infrastructure with
$30m in operating expenses, only 10 employees and a very high profit margin (55% net margin). As
a reference, in 2005, it had a total of 977 full-time employees and $445m in operating expenses
(and a net loss of over $166m). It is currently receiving royalties from some of the most successful
biotech drugs ever (Avastin, Herceptin, etc) and receives a steady stream of high-interest payments
from notes it has written for small medical device and diagnostic companies.
Valuation: $6.84 per basic share
Using an NPV model that values each revenue stream, we value the company at $1,114m or $6.84
per basic share. On a fully diluted basis, we value the company at $6.54 per share. The company is
fully funded currently and should remain profitable through 2018. It plans to make additional
investments over the next few years, including $250-300m forecast in 2015 alone (note that in 2013
and 2014 it had targeted $200m in additional investments and actually invested $390m in 2013 and
$311m in 2014).These should have near-term, income-generating prospects (on or near market
revenue streams, as well as regular interest payments on debt), which should help PDL retain its
cash flow-positive qualities longer term.
Financials: Highly profitable now, not so much later
PDL reported $418.9m in cash and cash equivalents in Q115. With PDL still receiving royalties for
the Queen et al patents through 2015 and the beginning of 2016, we expect it to be very profitable
and cash flow positive through this period. The bulk of the company’s debt balance is $300m due in
February 2018, which will either need to be paid or refinanced.
Sensitivities: Will PDL have enough capital to do deals?
With the royalties associated with the Queen et al patents expiring over the next 9-12 months, the
big risk is that PDL will not find enough income through royalty and debt deals to be sustainably
profitable. Given low ongoing operating costs, the hurdle rate or ROIC for new investments is not
high. However, given the lack of Queens cash flow, its source of funds will to some extent be limited
by its ability to access the debt markets and the cost of debt funding. In addition, a robust
investment process is required to avoid a repeat of the Depomed issues or defaults that occurred
with Wellstat and Hyperion.
Also, on the royalty side it will be facing giants like Drug Royalty Corporation and Royalty Pharma,
funds that have billions in capital at their fingertips. PDL will likely need to focus on the smaller end
of the royalty spectrum and be more flexible on terms to win deals, ie do deals the royalty fund
powerhouses will not do. On the debt side of the business, PDL does have some interest rate risk.
It has an attractive business currently as it can borrow in low single digits (the February 2018 notes
have a 4% coupon), but lend out at 12-15.5%. A different interest rate environment where PDL’s
borrowing costs increase and defaults increase could affect the profitability of this business.
While we project that PDL will be able to continue its dividend at the current level of $0.60 per share
per year through 2018 (currently yielding 9.2%), this does put continual pressure on its balance
sheet and it may need to be reduced in the future.

PDL BioPharma | 21 July 2015 3
A business model in transformation
PDL used to be a typical biotech company, with high R&D expenditures and large operating losses.
After selling its commercial assets in 2007-08 through several transactions totalling over $500m
(which was distributed to shareholders) and spinning off its drug development business in 2008 (as
Facet Biotech, which was bought by Abbott in 2010 and then spun off again as part of AbbVie), PDL
has become a finance company investing in royalty streams and debt (see Exhibit 1). The bulk of its
royalty revenues come from the Queen et al patents, which enable the company to receive royalties
on some of the most successful biotech products in history (eg Herceptin, Avastin). It currently has
three other royalty agreements through which it is or will be receiving royalties, although they pale
in comparison to the Queen et al patent revenue. It also has debt agreements with seven
companies (although two are in default), where it receives 12-15.5% annual interest. They have
had three deals that have successfully matured, bringing the total number of deals they have
signed within the new business model framework to 13.
Exhibit 1: Comparison of select income statement items
$000s 2005 2014
Royalties 130,068 532,630
Product sales 121,191 0
Interest revenue 0 48,020
Licence and other 28,395 575
Total revenues 279,654 581,225
COGS 60,257 0
SG&A 82,386 34,914
R&D 172,039 0
Operating income (loss) (165,148) 546,311
Net income (loss) (166,577) 322,244
Source: PDL
PDL is very actively engaged in scouring the healthcare universe for assets in which to invest
through the use of its internal business development team as well as its advisors. It is also a target
account for investment bankers, which represent universities and companies that are conducting
auctions on royalty streams, as well as debt placement agents.
As PDL has less capital to invest than some of the other royalty-focused companies, its focus is on
“diamonds in the rough” as they can always be outbid for their obviously excellent assets. It also
actively pursues off-target disease area royalty streams at companies that are focused on different
disease areas (eg PDL licensed diabetes-related royalties from Depomed, which focuses on pain).
PDL limits its risk by focusing on products that are either at or near the market and by having a third
party (usually a consulting firm) conduct due diligence on market size and revenue projections. The
company has not disclosed any of its hurdle rates for deals but, based on the carrying values listed
in its regulatory filings, it appears that the deals tend to be NPV neutral, with the return roughly
equal to the discount rate.
PDL conducts extensive due diligence on intellectual property and the management team, while
speaking extensively to the current investors of the company that currently owns the asset, as well
as key opinion leaders (KOLs) in the target market. Only after this extensive period of due diligence
and board approval does it issue a binding term sheet.
The Queen et al patents: A great source of capital, but going away
The Queen et al patents covered methods and materials used in the manufacture of humanized
monoclonal antibodies. Before humanization, antibodies tended to be chimeric, a mix of mouse and
human properties and ran the risk of a patient’s immune system viewing the antibody as foreign
and attacking it. Humanization helped to catapult monoclonal antibodies from a niche therapeutic

PDL BioPharma | 21 July 2015 4
type to one that is much more widely used. Ownership of these patents has helped PDL profit from
some of the most successful biotechnology drugs (see Exhibit 2).
Exhibit 2: Queen et al royalty summary
Product Company 2014 revenue ($000s)
2014 royalty ($000s)
Effective royalty rate
Royalty end
Avastin Genentech/Roche 7,370,929 156,632 2.1% Q116
Herceptin Genentech/Roche 7,265,621 154,394 2.1% Q116
Lucentis Genentech/Roche 3,188,031 67,746 2.1% Q115
Xolair Genentech/Roche 1,866,512 39,663 2.1% Q116
Perjeta Genentech/Roche 883,153 18,767 2.1% Q116
Kadcyla Genentech/Roche 514,685 10,937 2.1% Q116
Tysabri Biogen Idec 1,906,510 57,270 3.0% Q3/Q415
Actemra Chugai 567,082 17,202 3.0% Q115
Gazyva Roche 36,750 1,094 3.0% Q116
Entyvio Takeda 63,848 2,344 3.7% Q115
Source: PDL
Unfortunately, all patent exclusivities must come to an end and the Queen et al patents expired on
2 December 2014. Thanks to a settlement with Genentech/Roche, PDL will be receiving royalties
on all sales through the end of 2015 and, since it is paid one quarter in arrears, it will receive its
final royalty payments for all the Genentech/Roche products except Lucentis in the first quarter of
2016. Lucentis had separate terms and PDL will only receive royalties through 28 December 2014,
which means the first quarter of 2015 was the final quarter of royalties for that product. In the cases
of Actemra from Chugai and Entyvio from Takeda, the final payment will also have been in the first
quarter of 2015. For Tysabri, the licence covers all product manufactured up to the end of the
patent. As it has a 9-12 month shelf life, PDL could be receiving royalties through the third or fourth
quarter of 2015.
Solanezumab: Rights to a potential multi-billion dollar blockbuster?
There is a chance that PDL may get a 2% royalty on another potential multi-billion dollar
blockbuster. PDL is entitled to a 2% royalty on Lilly’s antibody treatment for Alzheimer’s,
solanezumab. Unlike the other royalty agreements, this licence agreement for “know how” runs for
12.5 years after commercialisation and is not tied to any particular patent. Also, unlike traditional
partnerships, PDL has little direct contact with Lilly on this programme so its insight is limited to
what is publicly disclosed.
Solanezumab is a humanized monoclonal antibody, which binds to the Amyloid β that makes up the
plaques in Alzheimer’s patients. It is a relatively controversial compound after the failure of two
large Phase III trials, dubbed EXPEDITION 1 & 2, which tested the use of solanezumab in mild to
moderate Alzheimer’s patients. The original primary endpoints were the changes from baseline to
week 80 in the 11-item cognitive subscale of the Alzheimer’s Disease Assessment Scale (ADAS-
cog11) and the Alzheimer’s Disease Cooperative Study-Activities of Daily Living Scale.
Solanezumab did not meet these endpoints in either EXPEDITION 1 or 2. As EXPEDITION 1
completed first, analysis of the data led Lilly to change the primary outcome of EXPEDITION 2 to
ADAS-cog14 (the 14-item ADAS-cog questionnaire) in mild patients as moderate patients generally
did not see as much of a benefit (see Exhibit 3). Unfortunately, the new primary endpoint also
missed (albeit barely at p=0.06), but the original primary endpoints hit statistical significance in this
subset of patients.

PDL BioPharma | 21 July 2015 5
Exhibit 3: Solanezumab data
EXPEDITION 1 Difference
(N=1012)
EXPEDITION 1 p-value
EXPEDITION 2 Difference
(N=1040)
EXPEDITION 2 p-value
EXPEDITION 2-Mild difference
(N=647)
EXPEDITION 2-Mild p-value
EXPEDITION 2-Moderate
difference) (N=393)
EXPEDITION 2-Moderate p-
value
ADAS-cog11 -0.8 0.24 -1.3 0.06 -1.5 0.05 -0.9 0.43
ADAS-cog14 -1.4 0.09 -1.6 0.04 -1.7 0.06 -1.5 0.26
ADCS-ADL -0.4 0.64 1.6 0.08 2.3 0.04 0.5 0.77
MMSE 0.6 0.06 0.8 0.17 0.7 0.10 1.0 0.04
Source: New England Journal of Medicine
After a full analysis of the data and discussions with regulators, Lilly has initiated the EXPEDITION
3 trial of solanezumab vs placebo in 2,100 mild Alzheimer’s patients. The primary endpoints will be
ADAS-cog14 and ADCS-iADL (which focuses on instrumental tasks of daily living that tend to be
more complex, like shopping, cooking and handling finances). In both those endpoints, data in mild
solanezumab treated patients were consistently better than those on placebo (see Exhibits 4 and
5). Two-year data from the extension study following patients in EXPEDITION 1 and 2 will be
available in mid-2015. Data from EXPEDITION 3 are expected by the end of 2016 with potential
launch in 2018.
Exhibit 4: ADAS-cog14 results in mild patients Exhibit 5: ADCS-iADL results in mild patients
Source: American Neurological Association 2012 Source: American Neurological Association 2012
While many have written off solanezumab due to this prior data, we believe that EXPEDITION 3
has a reasonable chance of success for the following reasons:
The focus is on mild patients, who typically had better results on most endpoints than moderate
patients, who may already have had extensive brain damage.
The size of the trial is much larger. There will be triple the number of mild patients as in the
EXPEDITION 2 trial, which increases the chance of statistically significant results if it sees a
similar treatment effect.
All patients enrolled in the trial must have confirmed Amyloid β deposits, unlike in EXPEDITION
1 and 2, where there were no such criteria for inclusion in the trial. Lilly estimates that around
25% of the patients in the EXPEDITION 1 and 2 trials did not have Amyloid β, which would
make it difficult for a drug that binds to Amyloid β to exhibit efficacy. Lilly said on its Q4
conference call that patients without Amyloid β do not respond to treatment for its drug and that
those in the placebo arm outperform the placebo patients that do have plaques.
There were no major safety signals and adverse events were similar to placebo in the pooled
safety data from the EXPEDITION 1 and 2 trials. Importantly, the amyloid-related imaging
abnormalities, a potentially serious side effect of amyloid targeting agents, were also very
similar to placebo, providing a safety advantage over potential competitors, especially BIIB037,
which had very high levels of ARIA.
Alzheimer’s is a major unmet medical need with only six approved drugs from two classes, four
cholinesterase inhibitors, one NMDA receptor antagonist and one combination cholinesterase
inhibitor/NMDA receptor antagonist (see Exhibit 6). According to analysis by the Alzheimer’s
Association, 244 were tested in clinical trials to treat Alzheimer’s, but only one was approved in

PDL BioPharma | 21 July 2015 6
2002-12. Also, according to the Alzheimer’s Association, there are 5.3 million Alzheimer’s sufferers
in the US and the European Commission estimates another 5.1 million in the EU. There is a lot of
pent-up demand in the developed world for a new therapy for this devastating disease.
Exhibit 6: Approved drugs for Alzheimer’s
Generic Name Brand name
Mechanism 2014 market share
Donepezil Aricept Cholinesterase inhibitor 53%
Memantine Namenda NMDA receptor antagonist 35%
Rivastigmine Exelon Cholinesterase inhibitor 10%
Galantamine Reminyl Cholinesterase inhibitor 2%
Tacrine Cognex Cholinesterase inhibitor 0%
Donepezil + Memantine Namzaric Combination pill 0% (approved 24 December 2014)
Source: Wolters Kluwer
There are currently several monoclonal antibodies targeting Amyloid β in development (see Exhibit
7) with solanezumab being the farthest ahead, but with BIIB037 potentially the most exciting,
although that excitement is based on limited Phase Ib data. As 41% of patients in the high dose
arm (55% of ApoE ε4 carriers, who represent ~70% of alzheimer’s patients) had incidence of
amyloid-related imaging abnormalities (ARIA-E), which means that fluid was found in the grooves of
the brain, this safety signal needs to be watched closely and could affect the approvability of
BIIB037.
Exhibit 7: Late-stage amyloid targeting therapies
Product Stage Mechanism Comments
AZD3293 Phase II/III Beta-site amyloid precursor protein cleaving enzyme (BACE) inhibitor
Oral once-daily therapy being evaluated in 2,200 patients with early AD, data expected in 2019.
BIIB037 Phase III planned Anti-beta amyloid antibody Phase Ib data extremely promising, although with high incidence of ARIA-E. 18-month Phase III programme to be initiated in 2015.
Solanezumab Phase III Anti-beta amyloid antibody Antibody that demonstrated efficacy in mild patients. EXPEDITION3 data from 2,100 mild patients expected in late 2016. Safety is relatively clean.
MK-8931 Phase III Beta-site amyloid precursor protein cleaving enzyme (BACE) inhibitor
Oral once-daily therapy being evaluated in 3,460 prodromal, mild and moderate AD patients, data expected in 2017-18.
Gantenerumab Phase III Anti-beta amyloid antibody Roche recently stopped its Phase III in prodromal patients. The trial in 1,000 mild patients continues with data expected in mid-2018.
Crenezumab Phase III planned Anti-beta amyloid antibody An antibody that previously showed trends towards efficacy in mild patients. A Phase III in 2,700 patients is currently being planned.
Source: Lilly, Merck, Biogen, Roche, Clinicaltrials.gov
Given the large unmet need, the fact that solanezumab would be the first biologic (with biologic
premium pricing), it would not take much in terms of penetration to see meaningful sales registered.
Based on our calculations, a 9% market share in mild Alzheimer’s patients (40% of Alzheimer’s
patients) with an initial $40,000 pa price tag at launch would lead to sales of over $7bn a year by
2030. For PDL, such a sales level would result in it receiving $140m in annual royalties, which
would help it fund its operating expenses and current dividend level. We currently believe
solanezumab has a 70% chance of success in the EXPEDITION 3 trial based on the reasons cited
above.
The DepoMed royalties
In October 2013, PDL acquired the royalty and milestone rights related to several products (see
Exhibit 8) for the treatment of type 2 diabetes from Depomed for a total of $241.3m, the largest
royalty acquisition deal that PDL has made to date.

PDL BioPharma | 21 July 2015 7
Exhibit 8: Royalties acquired from Depomed
Product Company Royalty rate 2014 sales
Glumetza (extended release metformin) Santarus/Salix/Valeant 32% until 2014, 34.5% from 2015, gross margin split post generic intro (~45%)
$298m
Janumet XR (Januvia + extended release metformin) Merck ~2% $419m
Invokana + extended release metformin Jannsen Unknown N/A
Jentadueto XR (Tradjenta + extended release metformin) Boehringer Ingelheim Unknown N/A
Jardiance + extended release metformin Boehringer Ingelheim Unknown N/A
Extended release metformin in Korea and Canada LG Life Sciences and Valeant Unknown Unknown
Source: PDL, Wolters Kluwer
Currently the bulk of the Depomed royalties comes from Glumetza, an extended-release metformin,
which is the number one metformin on the market today. It had been receiving a 32% royalty until
the end of 2014, will receive a 34.5% royalty for 2015 and later and then will split the gross margin
once a generic is introduced (we estimate this should translate to effectively a 45% royalty,
depending on the final price). Lupin is expected to launch generic Glumetza on 1 February 2016
with another two generic entrants coming in August, and more possibly coming in September.
Glumetza had been a fast growing product, beating expectations handily. However, in November
2014 Salix announced its discovery that there was a lot more product in the channel than it had
previously thought. There was seven months’ worth of inventory, up from less than one month at
the time of the finalisation of the Santarus acquisition in January 2014. As this excess inventory has
to be sold before the introduction of generics in February 2016, there have been months when PDL
did not receive any royalties related to Glumetza and had to reduce its fair value estimates for that
asset. Before the Salix announcement, PDL had been forecasting $88m in 2015 Depomed royalties
and now expects $49m. With the introduction of generics coming so early in 2016, Glumetza royalty
payments will only recede further. However, one positive recent development is that following the
acquisition of Salix by Valeant, Glumetza’s price increased by 500% as of 18 June.
The Glumetza inventory issue, besides causing PDL to significantly miss Q414 estimates, has cast
a shadow on its largest royalty deal to date and may be causing investors to question the ability of
management to sign quality royalty deals. However, two items that provide comfort are that 2014
had been $37.5m above forecast, so a $39m hit to the 2015 forecast means that on the whole the
asset effectively performed as expected over the two-year period. Also, it is not known exactly how
PDL would have found out about the channel stuffing when Salix’s management appeared not to
know (the CFO of Salix was replaced immediately on the announcement, which covered four of its
largest products, not just Glumetza) and had been communicating far lower inventory levels to
investors on quarterly conference calls.
None of the other assets acquired from Depomed will likely be meaningful enough for PDL to fully
replace Glumetza, but on the whole, they might approach Glumetza in terms of size as all or nearly
all of them will likely be multi-billion dollar assets. Janumet, for example, had $2.1bn in sales for
Merck in 2014 and Januvia (which is combined with extended-release metformin to create
Janumet) sells another $3.9bn.
While it is challenging to value an asset when precise royalty rates and milestone payments are
unknown, as the Depomed royalties are a financial asset, PDL does include a carrying value of
$176.2m on its balance sheet. This is the value of its expected cash flows through the end of the
deal (currently expected to be in 2024) discounted back 21-25%. This is an extremely conservative
discount rate, especially given that it is very likely that all the pipeline products will be approved
(they are just combinations of two approved products). Backing into their carrying value through
product-by-product forecasts and a 10% discount rate (as well as a 70% probability adjustment for
the unapproved medications), we get to a value of $225m.
However, one very important item to note is that when PDL reports results, $1 worth of Depomed
royalties is not reported as $1 worth of revenues. As these royalty rights are considered to be a
financial asset, a fair value adjustment needs to be made on a quarterly basis. The fair value

PDL BioPharma | 21 July 2015 8
adjustment can vary depending on whether the company has had to make any adjustments to its
forecasts of cash flows for the estimated life of the asset, as well as the discount rate used and the
effect of the time value of money. For 2014 as a whole, $102.5m in “proceeds from the royalty
rights – at fair value” on the cash flow statement turned into $45.7m in revenues in the “royalty
rights – at fair value” on the income statement. While it is always important to look at cash flow
statements for any company, this is especially true for PDL where the accounting can obfuscate
analysis of true profitability. It is also noteworthy that PDL lost its auditor, Ernst & Young, in
September 2014, followed by its chief accounting officer, who resigned in April 2015.
VB royalty agreement
In June 2014, PDL signed a royalty agreement with Viscogliosi Brothers, LLC (VB), a venture
capital/private equity and merchant banking firm focused on the musculoskeletal and orthopaedics
segments of the healthcare industry. PDL paid $15.5m for the royalties due to VB from Paradigm
Spine for an FDA-approved spinal implant. Neither the royalty rate nor any information about the
product has been disclosed, but PDL does disclose a fair value of $16.1m for the asset with a
17.5% discount rate. Using our standard 12.5% discount rate, we estimate the asset is worth
$19.3m.
University of Michigan royalties
In November 2014, PDL acquired 75% of the royalty payments due to the University of Michigan for
Cerdelga, an oral therapy for Gaucher disease, which received US approval in August 2014 and EU
approval in January 2015 and is marketed by Genzyme/Sanofi. The deal runs until patent
expiration, currently expected in April 2022. Gaucher is an extremely rare disease with an estimated
10,000 sufferers worldwide.
Gaucher is a genetic disorder in which a missing enzyme, glucocerebrosidase, leads to the
accumulation of fatty substances, sphingolipids, in organs like the spleen, liver, kidneys, lungs,
brain and bone marrow. It is a serious disorder that can lead to death, even while the patient is still
in infancy.
The current standard of care is enzyme replacement therapy, which replace the missing enzyme,
although Cerezyme (Genzyme/Sanofi) and Elylyso have a one amino acid error in the sequence,
and only VPRIV (Shire) has an entirely correct sequence. Cerdelga acts by effectively inhibiting
sphingolipid synthesis so that it can’t accumulate in vital organs. While it seems simpler to just
replace the enzyme, the enzyme replacement therapies are administered by intravenous infusions
that could take 1-2 hours and can be administered up to three times a week if at a low dose per
infusion, or once every two weeks if at a higher dose. Cerdelga is just a twice a day pill that has the
extra advantage that patients do not need to travel to have it administered.
Based on the data from the ENCORE study, where Cerezyme patients were either switched to
Cerdelga or remain on Cerezyme, the vast majority of Cerdelga patients were stable across
multiple endpoints 52 weeks past the switch. Based on the results of the study, Cerdelga met the
criteria for non-inferiority to Cerezyme (see Exhibit 9).
Exhibit 9: Cerdelga vs Cerezyme ENCORE data
Variable Cerdelga (N=99) Cerezyme (N=47)
Patients meeting hemoglobin criteria 94.9% 100%
Patients meeting platelets criteria 92.9% 100%
Patients meeting spleen volume criteria 94.4% 100%
Patients meeting liver volume criteria 96.0% 93.6%
Percent of patients stable 83.8% 93.6%
Source: FDA, Genzyme

PDL BioPharma | 21 July 2015 9
That said, we expect a relatively slow launch as the physicians who treat Gaucher patients do not
like to switch patients to other drugs (even other enzyme replacement therapies) if a patient is
stable. Initially, it will likely be patients who are naïve to therapy and those that are unable to
tolerate enzyme replacement who will receive the drug. However, given the drug’s $310,250 annual
cost, it will not take many patients to lead to meaningful sales.
In terms of valuation, the company’s $66.9m fair value estimate seems high. Based on the results
of both Sanofi and PDL for the first quarter, we project that the University of Michigan receives a 3%
royalty, of which PDL receives 75%, or 2.25% of Cerdelga sales. To justify the fair value estimate,
those peak sales would need to be almost $2bn globally, more than double 2014 sales of
Cerezyme, which could be aggressive. We currently assume $839m in peak sales, so there is a risk
that PDL will have to take a write-down on the fair value of this royalty. However, even if PDL writes
down half the value, it would only affect the valuation of the company as a whole by 2.5%. The
biggest hit would be to its reputation as a result of selecting royalties poorly.
Debt-based, income-generating assets
Besides the various royalty agreements that PDL has signed, it has also acquired some income-
generating assets in the form of notes and credit agreements from various companies, typically
medical device and diagnostic companies with products on the market (see Exhibit 10). PDL
typically receives a high rate of interest and the debt is backed by the company’s assets, so even if
the company defaults, PDL should be able to receive what is owed.
Exhibit 10: PDL Income-generating assets
Note Types Principal ($m)
Interest End date
Comments
Wellstat Diagnostics
Note receivable and credit agreement
$50.19 Impaired Duff & Phelps have been engaged to sell company. LEK is preparing a valuation of assets.
Hyperion Royalty-backed debt $1.20 Impaired
Avinger Note receivable, credit and royalty agreement
$20 12% plus low single-digit royalties
Apr-18 510(k) to be filed in late 2015.
LENSAR Credit agreement $40 18.50% (in violation of liquidity covenants)
Oct-18 Pursuing sale and equity raise for the company. Wells Fargo is managing the sale process.
Direct Flow Credit agreement $50 13.50% Nov-18 Hired CEO of CoreValve, a pioneer in transcatheter valves (bought by Medtronic) in May 2015.
Paradigm Spine
Credit agreement $50 13 Feb-19 Company is EBIDTA positive. Recently released four-year follow-up data confirming superiority to fusion.
Kaléo Note purchase $150 13 Jun-29 PDL expects notes will be repaid by 2020.
CareView Credit agreement $40 13-13.5% Five year
Signed 29/06/2015, principal has not yet been made available to CareView. First tranche of $20m at 13.5%, second tranche at 13.0%
Source: PDL
PDL currently has two impaired assets, a note receivable and credit agreement with Wellstat
Diagnostics and a royalty-backed debt agreement with Hyperion. Wellstat is a diagnostics company
founded by Samuel Wohlstadter, who also founded Amgen, Applied Biosystems, IGEN and
BioVeris. It focuses on electrochemiluminescence, an assay technology that has enhanced
sensitivity, reduced time to result and broad dynamic range. Unfortunately, it has run out of cash
and is currently in receivership, with the receiver currently preparing Wellstat’s assets for sale, and
Duff & Phelps engaged to sell the company. As of the most recent 10-K, PDL believes that the
value of the assets are higher than the carrying value on PDL’s balance sheet ($50.2m) and so PDL
should be able to recoup the full value once it sells the company. The other impaired asset is a
small debt deal with Hyperion Catalysis, a carbon nanotube company. Hyperion is currently looking
at strategic alternatives including financing and selling the company to pay the $1.2m debt to PDL.
Again, even if the company is liquidated, PDL believes the value of the assets is greater than the
value of the amount owed to PDL.

PDL BioPharma | 21 July 2015 10
Avinger develops image-guided, catheter-based systems for the treatment of peripheral arterial
disease. Avinger markets a product for total blockages of blood vessels in the leg and is developing
one to treat partial blockages (510(k) filing expected in late 2015). It currently owes $20m to PDL
and is paying 12% interest as well as a 1.8% royalty on the net revenues of the company (Avinger
is guiding $12-14m in revenues for 2015, so the royalty income is likely to be between $200,000
and $400,000 this year). In January 2015, it conducted an initial public offering on the NASDAQ
and raised $56.8m which, coupled with its year-end balance of $12.3m and subtracting its likely
burn in Q1, means it probably has about $60m in the bank, enough to fund two years of operations.
Avinger should be a relatively low credit risk and be able to pay PDL back in full.
LENSAR is commercialising its laser cataract surgery system in both the US and EU. This is a
competitive area where the systems are expensive (~$400,000 per machine) and, based on
comments from refractive surgeons, it remains unclear whether it improves outcomes. LENSAR
currently owes $40m at an 18.5% interest rate (previously 15.5%). As it is a private company with
non-public financials, the exact state of its balance sheet is unknown, although PDL recently
announced on the Q115 earnings release that it is in violation of its liquidity covenants, which are at
an unknown level. PDL and LENSAR are currently in discussions on a forbearance agreement to
allow time for LENSAR to raise additional capital or sell the company. If LENSAR raises additional
capital (it was able to secure $27m in equity financing in 2013), it will continue to make interest
payments as planned and if it sells, PDL will be entitled to a change of control premium. PDL has
advanced around $2.3m to the company through June 2015 and Wells Fargo is managing the sale.
Direct Flow Medical is a transcatheter heart valve company that has a product on the market in
Europe and is conducting a 912-subject clinical trial in the US to gain approval. This is a very
competitive area where Edwards and Medtronic are dominant. It currently owes $50m to PDL and
is paying 13.5% interest. As a private company, its balance sheet is unknown but it has been able
to raise $92m in private funding. If its clinical trial is positive, new financing is unlikely to be much of
an issue but, if negative, repayment of the PDL debt may become challenging. As a positive sign,
Daniel Lemaitre, former CEO of CoreValve, which was acquired by Medtronic for $800m, joined as
president and CEO in May 2015.
Paradigm Spine is a spine implant technology company. Its coflex interlaminar stabilization device
is approved in the US and 40 other countries across six continents. It currently owes $50m to PDL
and is paying 13% interest. As it is a private company, its financials are unknown, although it is
EBITDA positive. Other than the debt raised from PDL, it has not raised any other capital recently,
so the extent to which it is a credit risk is unclear. The company recently released four-year follow-
up data, which confirmed coflex’s superiority to spinal fusion.
Kaléo is a drug delivery company with two FDA-approved products Auvi-Q (epinephrine) and Evzio
(naloxone) using its proprietary auto-injector technology. North American rights for Auvi-Q were
licensed to Sanofi and it reported $72m in 2014 sales. Kaléo is receiving double-digit royalties on
this product. It owes PDL $150m at 13% interest, with the principal due in 2029, which means PDL
could receive $19.5m per year in interest income for the next 14 years. As Kaléo is private, the
state of its financials is unknown. With such a high interest payment it seems likely that if the
company becomes successful it would want to refinance this debt at a lower interest rate. If it is
unsuccessful, both the annual payment and especially the principal payment are unlikely to be
tenable. Either way, it seems unlikely that the note, as it is, will last all the way to 2029 and PDL
expects it to be repaid by 2020.
On 29 June 2015, PDL announced a new credit agreement with CareView, a company focused on
patient care monitoring. Their products include virtual bed rails, which detect if a patient is in danger
of falling out of bed. They also allow for remote patient monitoring, reducing the cost of having a
sitter in the room with high risk patients. PDL will provide two tranches of $20m each based upon
the achievement of milestones. The first tranche will be paid upon attainment of a milestone on or

PDL BioPharma | 21 July 2015 11
before the end of October 2015 and will have a 13.5% coupon. The second will be based upon a
milestone attained on or before the end of June 2017 and will have a 13% coupon. Each tranche
will last for five years. PDL also received a warrant to purchase 4.4 million shares of stock at $0.45
per share (approximately 5% warrant coverage) that expires on June 26, 2025. We have not yet
included CareView in our NPV, as it does not seem that any principal has yet been put to work. We
do see some financial risk associated with this transaction as the company is annualizing $4m
worth of revenue, burning around $4m a year and currently has $44.3m in convertible debt (though
that is subordinate to any debt incurred to PDLI).
PDL is currently able to raise capital in the low single-digit range, as evidenced by its $300m note at
4% and its $100m term loan at 1.75% above Libor. With all its note asset acquisitions providing
income with an interest rate over 12%, this is an attractive business to be in and it makes sense for
the company to increase leverage to do more of these types of deals. Upside is not as high as with
royalties, but the risk is much lower as, if the company defaults, the debt is backed up by the assets
of the company.
Sensitivities
With the royalties associated with the Queen et al patents expiring over the next nine to 12 months,
the big risk is that PDL does not find enough income through royalty and debt deals to be
sustainably profitable. Given low ongoing operating costs, the hurdle rate or ROIC for new
investments is not high. However, given the lack of Queens cash flow, its source of funds will to
some extent be limited by its ability to access the debt markets and the cost of debt funding. In
addition, a robust investment process is required to avoid a repeat of the Depomed issues or
defaults that occurred with Wellstat and Hyperion.
Also, on the royalty side it will be facing giants like Drug Royalty Corporation and Royalty Pharma,
funds that have billions in capital at their fingertips. PDL will likely need to focus on the smaller end
of the royalty spectrum and be more flexible on terms to win deals, ie do deals the royalty fund
powerhouses will not do. This could lead to a higher risk that it will need to write down the value of
some of its deals if the royalties received do not meet the estimates in its valuation model (the
University of Michigan royalty on Cerdelga is potentially one such royalty). It is also important to
note that investors in PDL are at a tax disadvantage compared to investors in the funds above. PDL
investors are essentially taxed twice, with PDL paying a corporate tax and the investors paying
taxes on dividends and capital gains. Investors in royalty funds are only taxed once.
PDL faces some macroeconomic risks if its interest rates rise and the equity markets become less
exuberant, but there will be some benefits in a downturn. While PDL may no longer be able to raise
cash at 4%, many biotech companies may no longer be able to obtain cash through the equity
markets, so demand for PDL’s capital will increase, raising the coupon on the debt deals it signs. As
most of these income-generating deals expire in the 2018-19 timeframe, PDL will need to continue
to find these deals to maintain enough income to cover its operating costs, as this segment of the
business is doing today.
There is also a risk that it might overleverage the company so that it can do more deals and
maintain the dividend payments (currently around $100m). If it reaches $1bn in debt and the debt is
at 4% interest, it would need to pay $40m in interest payments every year. If that debt is at a more
normal 6% or 8% interest it would mean it would need to have revenues of $100m or more just to
break even when operating expenses are added to interest payments. If defaults increase because
of tough economic times then even though assets are backed up, there would be a delay in
payment of interest and principal, which could create a funding issue for the company in the future.

PDL BioPharma | 21 July 2015 12
Valuation
Using an NPV model that values each revenue stream, we value the company at $1,114 or $6.84
per basic share. On a fully diluted basis, we value the company at $6.54 per share. The company is
fully funded currently and should remain profitable through 2018. It plans to make additional
investments over the next few years, including $250-300m in 2015 alone. These should have near-
term income-generating prospects, which should help PDL retain its cash flow-positive qualities.
However, there is a question mark over the long-term sustainability of its model, as most of its
income-generating deals are set to expire in 2018-19. However, if solanezumab reaches the market
as we expect in 2018, it could be a turning point for PDL’s long-term prospects and cash flow
position as it is expected to be a multi-billion product. Solanezumab royalties would last 12.5 years
and would not be associated with any additional costs.
Exhibit 11: PDL valuation
Royalty/Note Type Expiration Year PDL Balance Sheet Carrying Value
NPV
Queen et al Royalty 2015 N/A $357.3
Depomed Royalty on Glumetza and other products
2024 $176.2 $279.1
VB Royalty on Spine Implant Undisclosed $16.1 $23.6
University of Michigan Royalty on Cerdelga 2022 $66.9 $29.4
Lilly Royalty on solanezumab 2030 N/A $161.4
DirectFlow Note 2018 $50.4 $49.8
Wellstat Note (Impaired) Unknown $50.2 $50.2
Hyperion Note (Impaired) Unknown $1.2 $1.2
Avinger Note 2018 $20.6 $26.8
Lensar Note 2018 $39.7 $44.2
Paradigm Spine Note 2019 $49.6 $49.3
Kaleo Note 2029 $151.6 $155.0
Total $1,227
Net debt (Q115) ($m) ($113.0)
Total firm value ($m) $1,114
Total basic shares (m) 162.8
Value per basic share ($) $6.84
Total options 7.6
Total number of shares 170.4
Diluted value per share ($) $6.54
Source: Edison Investment Research
Financials
PDL reported $418.9m in cash and cash equivalents in Q115. This increase was mainly due to a
term loan of $100m taken in March and helped pay for the May 2015 retirement of $155.1m in
aggregate principal of its May 2015 notes. With PDL still receiving royalties for the Queen et al
patents through 2015 and the beginning of 2016, we expect it to be very profitable and cash flow
positive through this period. In February 2018, it has $300m in debt due, which will either need to
be paid or refinanced. The company has guided that it will make $250-$300m in additional
investments in 2015, which we have not modelled as we do not know what the type or terms of
those investments will be. While these investments would improve the income statement over the
next few years as the company would be receiving royalties or debt payments, it would put a near-
term strain on the balance sheet, especially given the annual dividend payments and the debt due
in 2018.
PDL BioPharma | 21 July 2015 13
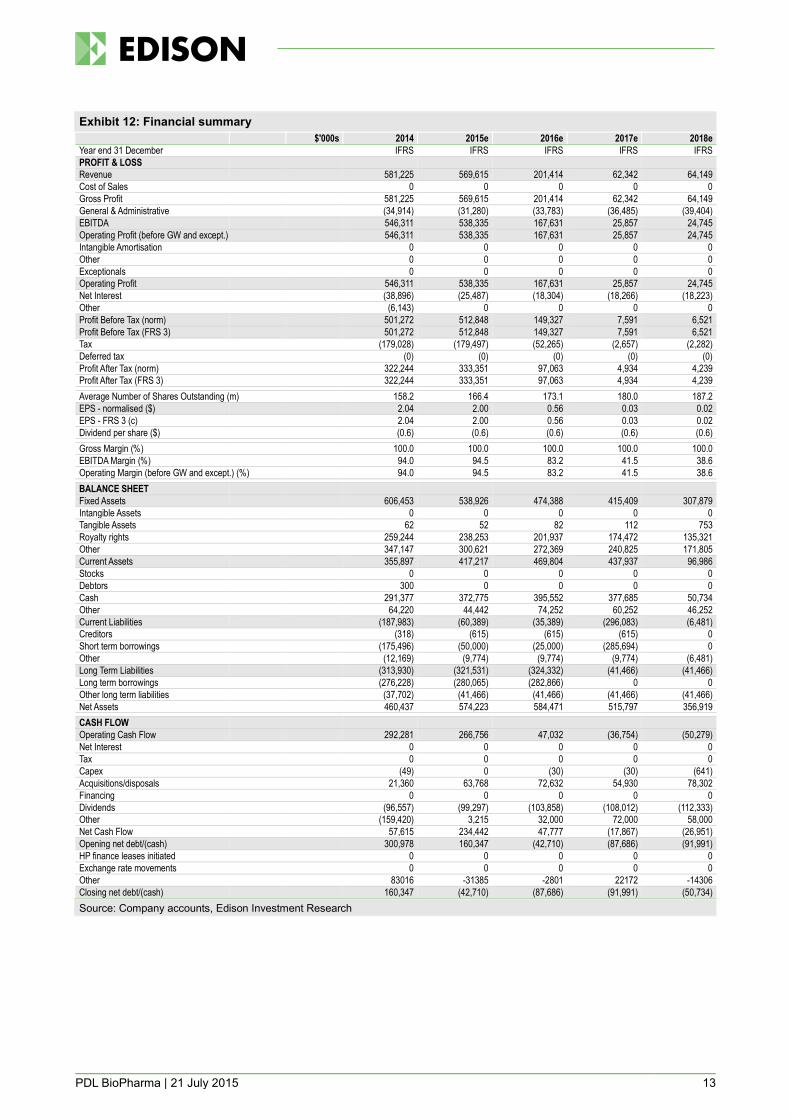
Exhibit 12: Financial summary
$'000s 2014 2015e 2016e 2017e 2018e
Year end 31 December IFRS IFRS IFRS IFRS IFRS
PROFIT & LOSS
Revenue 581,225 569,615 201,414 62,342 64,149
Cost of Sales 0 0 0 0 0
Gross Profit 581,225 569,615 201,414 62,342 64,149
General & Administrative (34,914) (31,280) (33,783) (36,485) (39,404)
EBITDA 546,311 538,335 167,631 25,857 24,745
Operating Profit (before GW and except.) 546,311 538,335 167,631 25,857 24,745
Intangible Amortisation 0 0 0 0 0
Other 0 0 0 0 0
Exceptionals 0 0 0 0 0
Operating Profit 546,311 538,335 167,631 25,857 24,745
Net Interest (38,896) (25,487) (18,304) (18,266) (18,223)
Other (6,143) 0 0 0 0
Profit Before Tax (norm) 501,272 512,848 149,327 7,591 6,521
Profit Before Tax (FRS 3) 501,272 512,848 149,327 7,591 6,521
Tax (179,028) (179,497) (52,265) (2,657) (2,282)
Deferred tax (0) (0) (0) (0) (0)
Profit After Tax (norm) 322,244 333,351 97,063 4,934 4,239
Profit After Tax (FRS 3) 322,244 333,351 97,063 4,934 4,239
Average Number of Shares Outstanding (m) 158.2 166.4 173.1 180.0 187.2
EPS - normalised ($) 2.04 2.00 0.56 0.03 0.02
EPS - FRS 3 (c) 2.04 2.00 0.56 0.03 0.02
Dividend per share ($) (0.6) (0.6) (0.6) (0.6) (0.6)
Gross Margin (%) 100.0 100.0 100.0 100.0 100.0
EBITDA Margin (%) 94.0 94.5 83.2 41.5 38.6
Operating Margin (before GW and except.) (%) 94.0 94.5 83.2 41.5 38.6
BALANCE SHEET
Fixed Assets 606,453 538,926 474,388 415,409 307,879
Intangible Assets 0 0 0 0 0
Tangible Assets 62 52 82 112 753
Royalty rights 259,244 238,253 201,937 174,472 135,321
Other 347,147 300,621 272,369 240,825 171,805
Current Assets 355,897 417,217 469,804 437,937 96,986
Stocks 0 0 0 0 0
Debtors 300 0 0 0 0
Cash 291,377 372,775 395,552 377,685 50,734
Other 64,220 44,442 74,252 60,252 46,252
Current Liabilities (187,983) (60,389) (35,389) (296,083) (6,481)
Creditors (318) (615) (615) (615) 0
Short term borrowings (175,496) (50,000) (25,000) (285,694) 0
Other (12,169) (9,774) (9,774) (9,774) (6,481)
Long Term Liabilities (313,930) (321,531) (324,332) (41,466) (41,466)
Long term borrowings (276,228) (280,065) (282,866) 0 0
Other long term liabilities (37,702) (41,466) (41,466) (41,466) (41,466)
Net Assets 460,437 574,223 584,471 515,797 356,919
CASH FLOW
Operating Cash Flow 292,281 266,756 47,032 (36,754) (50,279)
Net Interest 0 0 0 0 0
Tax 0 0 0 0 0
Capex (49) 0 (30) (30) (641)
Acquisitions/disposals 21,360 63,768 72,632 54,930 78,302
Financing 0 0 0 0 0
Dividends (96,557) (99,297) (103,858) (108,012) (112,333)
Other (159,420) 3,215 32,000 72,000 58,000
Net Cash Flow 57,615 234,442 47,777 (17,867) (26,951)
Opening net debt/(cash) 300,978 160,347 (42,710) (87,686) (91,991)
HP finance leases initiated 0 0 0 0 0
Exchange rate movements 0 0 0 0 0
Other 83016 -31385 -2801 22172 -14306
Closing net debt/(cash) 160,347 (42,710) (87,686) (91,991) (50,734)
Source: Company accounts, Edison Investment Research

PDL BioPharma | 21 July 2015 14
Contact details Revenue by geography
PDL BioPharma, inc. 932 Southwood Blvd. Incline Village, NV 89451 US 775-832-8500 www.pdl.com
N/A
Management team
CEO: John McLaughlin CFO: Peter Garcia
John McLaughlin has been president and CEO since December 2008 after the company spun off Facet Biotech Corporation (Facet Biotech). From 6 November 2008 until the spin-off, he served as a senior advisor to the company. He was the CEO and a director of Anesiva, formerly known as Corgentech, from January 2000 to June 2008. He received a BA from the University of Notre Dame and a J.D. from the Catholic University of America.
Peter Garcia, VP and CFO, joined the company in May 2013. Before joining PDL, he served as CFO of BioTime, which he joined in 2011. From 1996 to 2011, he was CFO of six biotech and high-tech companies, including Marina Biotech, Nanosys, Nuvelo, Novacept, IntraBiotics Pharmaceuticals and Dendreon Corporation. Mr Garcia holds a BA in economics and sociology with honors from Stanford University and an MBA with an emphasis in finance and accounting from UCLA.
General Counsel: Christopher Stone VP Business Development: Danny Hart
Christopher Stone, VP, general counsel and secretary, joined the company in February 2009. He brings more than 25 years’ legal experience to the role. Before joining PDL, he served as VP of legal affairs and corporate secretary at LS9, an advanced biofuels development company, where his work included a focus on intellectual property protection and licensing. Previously, he was VP of US intellectual assets at Danisco, a global producer of food ingredients, enzymes and bio-based solutions. He received a J.D. from George Washington University and a B.S. in biochemistry from the University of Massachusetts.
Danny Hart joined PDL BioPharma in January 2010 as corporate counsel. In September 2014, he was promoted to VP of business development, a non-legal role evaluating and structuring PDL’s investment transactions. From 2006 until he joined PDL, he worked as an associate with Hogan & Hartson LLP (now Hogan Lovells US LLP), a leading international law firm, where his practice focused on securities, corporate governance and mergers and acquisitions. He received a J.D. from Vanderbilt University Law School and a B.A. from the University of Washington in Seattle.
Principal shareholders (%)
First Trust Advisors 8.6%
BlackRock Fund Advisors 8.1%
Renaissance Technologies 7.3%
Vanguard 7.0%
Acadian Asset Management 3.9%
Advisors Asset Management 3.2%
BlackRock Institutional Trust 2.8%
Companies named in this report
DepoMed (DEPO); Lilly (LLY); Abbott (ABT); Abbvie (ABBV); Roche (RHHBY); Biogen (BIIB); Chugai (4519:JP); Takeda (4502:JP); Valeant (VRX); Merck (MRK); Johnson & Johnson (JNJ); LG Life Sciences (068870:KS); Sanofi (SNY); Shire (SHPG)
Edison, the investment intelligence firm, is the future of investor interaction with corporates. Our team of over 100 analysts and investment professionals work with leading companies, fund managers and investment banks worldwide to support their capital markets activity. We provide services to more than 400 retained corporate and investor clients from our offices in London, New York, Frankfurt, Sydney and Wellington. Edison is authorised and regulated by the Financial Conduct Authority (www.fsa.gov.uk/register/firmBasicDetails.do?sid=181584). Edison Investment Research (NZ) Limited (Edison NZ) is the New Zealand subsidiary of Edison. Edison NZ is registered on the New Zealand Financial Service Providers Register (FSP number 247505) and is registered to provide wholesale and/or generic financial adviser services only. Edison Investment Research Inc (Edison US) is the US subsidiary of Edison and is regulated by the Securities and Exchange Commission. Edison Investment Research Limited (Edison Aus) [46085869] is the Australian subsidiary of Edison and is not regulated by the Australian Securities and Investment Commission. Edison Germany is a branch entity of Edison Investment Research Limited [4794244]. www.edisongroup.com
DISCLAIMER Copyright 2015 Edison Investment Research Limited. All rights reserved. This report has been commissioned by PDL BioPharma and prepared and issued by Edison for publication globally. All information used in the publication of this report has been compiled from publicly available sources that are believed to be reliable, however we do not guarantee the accuracy or completeness of this report. Opinions contained in this report represent those of the research department of Edison at the time of publication. The securities described in the Investment Research may not be eligible for sale in all jurisdictions or to certain categories of investors. This research is issued in Australia by Edison Aus and any access to it, is intended only for "wholesale clients" within the meaning of the Australian Corporations Act. The Investment Research is distr ibuted in the United States by Edison US to major US institutional investors only. Edison US is registered as an investment adviser with the Securities and Exchange Commission. Edison US relies upon the "publishers' exclusion" from the definition of investment adviser under Section 202(a)(11) of the Investment Advisers Act of 1940 and corresponding state securities laws. As such, Edison does not offer or provide personalised advice. We publish information about companies in which we believe our readers may be interested and this information reflects our sincere opinions. The information that we provide or that is derived from our website is not intended to be, and should not be construed in any manner whatsoever as, personalised advice. Also, our website and the information provided by us should not be construed by any subscriber or prospective subscriber as Edison’s solicitation to effect, or attempt to effect, any transaction in a security. The research in this document is intended for New Zealand resident professional financial advisers or brokers (for use in their roles as financial advisers or brokers) and habitual investors who are “wholesale clients” for the purpose of the Financial Advisers Act 2008 (FAA) (as described in sections 5(c) (1)(a), (b) and (c) of the FAA). This is not a solicitation or inducement to buy, sell, subscribe, or underwrite any securities mentioned or in the topic of this document. This document is provided for information purposes only and should not be construed as an offer or solicitation for investment in any securities mentioned or in the topic of this document. A marketing communication under FCA Rules, this document has not been prepared in accordance with the legal requirements designed to promote the independence of investment research and is not subject to any prohibition on dealing ahead of the dissemination of investment research. Edison has a restrictive policy relating to personal dealing. Edison Group does not conduct any investment business and, accordingly, does not itself hold any positions in the securities mentioned in this report. However, the respective directors, officers, employees and contractors of Edison may have a position in any or related securities mentioned in this report. Edison or its affiliates may perform services or solicit business from any of the companies mentioned in this report. The value of securities mentioned in this report can fall as well as rise and are subject to large and sudden swings. In addition it may be difficult or not possible to buy, sell or obtain accurate information about the value of securities mentioned in this report. Past performance is not necessarily a guide to future performance. Forward-looking information or statements in this report contain information that is based on assumptions, forecasts of future results, estimates of amounts not yet determinable, and therefore involve known and unknown risks, uncertainties and other factors which may cause the actual results, performance or achievements of their subject matter to be materially different from current expectations. For the purpose of the FAA, the content of this report is of a general nature, is intended as a source of general information only and is not intended to constitute a recommendation or opinion in relation to acquiring or disposing (including refraining from acquiring or disposing) of securities. The distribution of this document is not a “personalised service” and, to the extent that it contains any financial advice, is intended only as a “class service” provided by Edison within the meaning of the FAA (ie without taking into account the particular financial situation or goals of any person). As such, it should not be relied upon in making an investment decision. To the maximum extent permitted by law, Edison, its affiliates and contractors, and their respective directors, officers and employees will not be liable for any loss or damage arising as a result of reliance being placed on any of the information contained in this report and do not guarantee the returns on investments in the products discussed in this publication. FTSE International Limited (“FTSE”) © FTSE 2015. “FTSE®” is a trade mark of the London Stock Exchange Group companies and is used by FTSE International Limited under license. All rights in the FTSE indices and/or FTSE ratings vest in FTSE and/or its licensors. Neither FTSE nor its licensors accept any liability for any errors or omissions in the FTSE indices and/or FTSE ratings or underlying data. No further distribut ion of FTSE Data is permitted without FTSE’s express written consent.
Frankfurt +49 (0)69 78 8076 960
Schumannstrasse 34b
60325 Frankfurt
Germany
London +44 (0)20 3077 5700
280 High Holborn
London, WC1V 7EE
United Kingdom
New York +1 646 653 7026
245 Park Avenue, 39th Floor
10167, New York
US
Sydney +61 (0)2 9258 1161
Level 25, Aurora Place
88 Phillip St, Sydney
NSW 2000, Australia
Wellington +64 (0)48 948 555
Level 15, 171 Featherston St
Wellington 6011
New Zealand