
TOURISM, HOSPITALITY AND EVENTS - oph.fi - Etusivu Hospitality and Events environmental scan ... •...
44
SERVICESKILLS AUSTRALIA E TRENDS & INTELLIGENCE S TOURISM, HOSPITALITY AND EVENTS ENVIRONMENTAL SCAN 2011 2011
Transcript of TOURISM, HOSPITALITY AND EVENTS - oph.fi - Etusivu Hospitality and Events environmental scan ... •...
SERVICESKILLSA U S T R A L I AENVIRONMENTAL
TRENDS & INTELLIGENCE
SCAN2010
TOURISM, HOSPITALITY AND EVENTSENVIRONMENTAL SCAN 2011
2011
This document supports the Service Skills Australia 2011 Environmental Scan.For information on trends in other service industries, see our Environmental Scan findings for:
Community Pharmacy• Funeral Services• Hairdressing and Beauty Services • Retail, Wholesale and Floristry• Sport, Fitness, Community and Outdoor Recreation•
All of these documents can be viewed and downloaded from our website, www.serviceskills.com.au
ContentsIntroduction . . . . . . . . . . . . . . . . . . . . . . . . . . . . . . . . . . . . . . . . . . . . . . . . . . . . . 1
The Role of Service Skills Australia . . . . . . . . . . . . . . . . . . . . . . . . . . . . . . . . . .1Objectives . . . . . . . . . . . . . . . . . . . . . . . . . . . . . . . . . . . . . . . . . . . . . . . . . . . . . .1Key messages . . . . . . . . . . . . . . . . . . . . . . . . . . . . . . . . . . . . . . . . . . . . . . . . . . .2
Latest industry intelligence . . . . . . . . . . . . . . . . . . . . . . . . . . . . . . . . . . . . . . . .2Understanding the industry . . . . . . . . . . . . . . . . . . . . . . . . . . . . . . . . . . . . . . . .2Industry factors. . . . . . . . . . . . . . . . . . . . . . . . . . . . . . . . . . . . . . . . . . . . . . . . . .3Economic factors and tourism, hospitality and events industry dynamics . .4
Distribution and purchasing . . . . . . . . . . . . . . . . . . . . . . . . . . . . . . . . . . . . .5Regional aspects . . . . . . . . . . . . . . . . . . . . . . . . . . . . . . . . . . . . . . . . . . . . . . . .6Macro-environment factors . . . . . . . . . . . . . . . . . . . . . . . . . . . . . . . . . . . . . . .11
Sustainability: Driven by consumer need . . . . . . . . . . . . . . . . . . . . . . . . . .12Understanding the labour market . . . . . . . . . . . . . . . . . . . . . . . . . . . . . . . . . .13
Ageing population . . . . . . . . . . . . . . . . . . . . . . . . . . . . . . . . . . . . . . . . . . . .17
Identified workforce development needs . . . . . . . . . . . . . . . . . . . . . . . . . . . .18Picture of current training supply . . . . . . . . . . . . . . . . . . . . . . . . . . . . . . . . . .19Solutions and potential sources of labour . . . . . . . . . . . . . . . . . . . . . . . . . . .19
Entrepreneurial skills. . . . . . . . . . . . . . . . . . . . . . . . . . . . . . . . . . . . . . . . . .20Recognition of prior learning . . . . . . . . . . . . . . . . . . . . . . . . . . . . . . . . . . . .20Completion rates . . . . . . . . . . . . . . . . . . . . . . . . . . . . . . . . . . . . . . . . . . . . .21VET in schools . . . . . . . . . . . . . . . . . . . . . . . . . . . . . . . . . . . . . . . . . . . . . . .22
Current impact of training packages . . . . . . . . . . . . . . . . . . . . . . . . . . . . . . . .23Participation in vocational education . . . . . . . . . . . . . . . . . . . . . . . . . . . . . . .23
International students . . . . . . . . . . . . . . . . . . . . . . . . . . . . . . . . . . . . . . . . .28
Future directions for endorsed components of training packages. . . . . . . .29
Appendix A – Report of continuous improvement of SIT07. . . . . . . . . . . . . .30
Appendix B – Tourism, hospitality and events occupations in demand . . . .36
Endnotes . . . . . . . . . . . . . . . . . . . . . . . . . . . . . . . . . . . . . . . . . . . . . . . . . . . . . . .38
© 2011 published by Service Skills Australia
Tourism, Hospitality and Events environmental scan 2011 1.
IntroduCtIonthe role of servICe skIlls AustrAlIAService Skills Australia (SSA) is the Industry Skills Council for the service industries. Skills councils are the recognised national bodies providing advice to government and industry on industry training and skill development needs.
SSA is an independent, not-for-profit body, managed by industry members and funded by the Australian government. The strategic goals of SSA, developed in partnership with the industries, are to:
develop a culture within the service industries which promotes • and enhances the skills development of its workforce
develop policies, programs and services, including • industry training packages, that support industry needs in relation to skills and workforce development
achieve quality skills outcomes throughout the service industries•
produce quality workforce development information and • use industry intelligence to inform decision making.
SSA represents the tourism, hospitality and events; sport, fitness and recreation; and retail, wholesale and personal services sectors.
objeCtIvesThis environmental scan provides an industry-specific overview of current and future trends and developments in the tourism, hospitality and events industries in relation to workforce development and vocational education and training (VET). Developed in partnership with industry and based on data mostly collected between February and December 2010, the scan reflects key issues and provides information on current and future skill demands, and their context, to inform the continuous improvement of SSA’s suite of skills and workforce development strategies, including training package.

2. service skills Australia
key messAgesDriven by changes in consumer trends and the demography of the Australian and international population, the nature of tourism and hospitality is changing. The complexity of the businesses, organisations and workforce that make up the industry needs to be understood by skill markets and policy makers to avoid a ‘one size fits all’ response to productivity and participation outcomes.
Any consideration of strategies to improve the capability of the tourism, hospitality and events workforce needs to be predicated on a clear understanding of these changes.
Industry has unanimously described its needs for the education and training system in the Tourism and Hospitality Workforce Development Strategy 20091. Minister Ferguson has recommended that the Tourism Ministers’ Council work with SSA to implement the strategy2.
lAtest Industry IntellIgenCe
understAndIng the IndustryTourism and hospitality businesses are at the frontline of Australia’s economy — providing consumer goods and personal and leisure services to both domestic and overseas consumers. The industries are influenced by continual changes in national and international customer demands and expectations, as well as by an increasingly global marketplace.
The tourism, hospitality and events industries include accommodation, restaurants, cafés, bars, catering, gaming, meetings, events (business and leisure), conference organisers, tour operations, tourist information services, tour guiding, holiday parks and resorts, cultural tourism, casinos and caravan park operations.
Markets within tourism and hospitality, such as business travel, major events and education travel provide potential benefits for other industries in promoting Australia and Australian products and services3.
Tourism is a sector made up of a number of industry participants. It is generally accepted that the tourism product, the visitor experience, is provided through an amalgam of services across a broad range of industry participants; including but not limited to hospitality, hotels, restaurants, tourism operators, tourist attractions, transport, retail, business and major events, recreation, and educational and cultural services4. This is also true of the hospitality industry, which shares many of the service providers in the tourism sector.
As tourism is not an industry in the conventional sense, it does not appear in the national accounts or in international statistical classifications. In order to establish adequate statistical standards, an exact definition of tourism and the tourist has been agreed on by the United Nations World Tourism Organisation: ‘Tourism comprises the activities of persons travelling to and staying in places outside their usual environment for not more than one consecutive year for leisure, business and other purposes not related to the exercise of an activity remunerated from within the place visited.’5
Industries are usually classified according to the product or service being provided but instead, tourism is defined according to the consumer of the product or service, and so may be considered a market. Additionally, a high number of businesses in tourism, hospitality and events are active in two or more sectors. Hotels, for example, need tourism to generate part of their business, and events cooperate with tourism to promote their location6.
“Any consideration of strategies to improve the capability of the tourism, hospitality and events workforce needs to be predicated on a clear understanding of these changes.”

Tourism, Hospitality and Events environmental scan 2011 3.
Industry fACtorsKey tourism, hospitality and events information includes:
In November 2010, the accommodation and food services industry employed almost 764,000 • people (6.7% of the total workforce), an increase of 7.3% since November 20087. By 2015, the employment requirements for chef and fast food occupations are forecast to be about 18,000 and 13,000 respectively. While growth is the main factor affecting requirements for qualified chefs, both growth and replacement needs are affecting requirements for qualified fast food chefs8.
At the end of the 2009 financial year, there were 77,087 businesses operating in • the accommodation and food services industry—a decrease of 1.3% on the previous financial year9. Also for this period, large tourism and hospitality businesses—200 or more employees—represented less than 1% of the businesses by number, whereas companies with 1—19 employees comprised the majority of the industries (54.6%)10.
In 2009-10, direct tourism employment - including an overlap with the hospitality industry - • increased 1.4% (or 6,900 jobs) to 500,500. At the same time, total employment increased 1.3%. This resulted in tourism’s share of total employment remaining stable at 4.5%11.
In addition to directly employing half a million people, direct tourism contributed $33.9 billion • to Australia’s Gross Domestic Product (GDP) in 2009-2010. Tourism exports decreased 2.1% from 2008-09 to $22.9 billion. At the same time, total Australian exports fell 10.6%, Tourism imports rose by 1.8% to $27.9 billion. Consequently, the tourism trade was in deficit of $5.0 billion. This follows a trade deficit of $4.1 billion in 2008-0912.
Industries that recorded an increase in tourism-related employment included accommodation; • cafes, restaurants and food services; clubs, pubs, taverns and bars; rail transport; travel agency and tour operator services; casinos and other gambling services; and education and training. Meanwhile cultural services experienced the most significant decrease (proportionately) at 1.1%13.
Australians made 66.8 million domestic overnight trips in the year ended 30 September 2010, • spending 261 million nights away from home. Two thirds of visitors travelled within their State or Territory of residence; the remaining 34% travelled interstate. Expenditure by overnight visitors amounted to $42.9 billion, an increase of 2% compared with the same period in 200914.
In 2009-10, Australians made 6.8 million outbound trips. The latest available trade data • shows that while Australian outbound travel was worth $33 billion in 2008-2009, $5.5 billion of this was consumed in Australia before or after the trip. In 2008-09, domestic tourism contributed $23 billion to the Australian economy, or nearly 2% of Australia’s GDP15.
In 2009-10, there were 5.7 million international arrivals in Australia, up from 5.5 million in 2008-• 09. In 2008-09 (latest data), these visitors contributed $9.5 billion to Australia’s GDP16.
There were 4750 travel agencies in 2009, with 299 approvals to become a travel agency• 17.
At the end of 2009, 27,602 people were employed in the main categories of business in the • travel agency industry—more than two-thirds of which is female (69.2% or 19,108)18.
There is a diverse employment mix across the sectors, with many young people commencing work • in one of the sectors. Traditionally the industry has a high percentage of casual and part-time workers (within the accommodation and food services industry 57.6% of the jobs are part-time19).
Business Event (BE) visitor spending in Australia was worth around $9.7 billion • in 2008. BE visitors are also high yielding, spending on average $234 per night in 2008, compared with $163 per night for all visitors20.
4. service skills Australia
There were an estimated 16 million business event travellers in 2009. Of these, 7.8 million • were domestic overnight visitors, 7.4 million domestic day visitors, and 758,000 international visitors. Business events and incentive travellers accounted for 3% of all visitors, 5% of visitor nights and 7% of tourism expenditure in Australia in that year21.
Business events attracted the majority of international (69%), domestic • overnight (75%) and domestic day (65%) visitors22.
The importance of the tourism, hospitality and events industries to Australia is widely under-estimated. Through the number and geographic spread of the jobs they create, the small businesses they support, the contribution they make to national exports, their economic role in Australia’s regional and remote communities, as well as their capacity to protect and maintain Australia’s natural heritage and built environment, they bring enormous benefits.
An economic analysis commissioned by the Department of Resources, Energy and Tourism demonstrated that the tourism industry has very strong linkages to the rest of the economy. The gross output multiplier for the industry is estimated to be 1.85. This means that every dollar directly spent on tourism generates an additional 85 cents of activity in the rest of the economy23.
eConomIC fACtors And tourIsm, hospItAlIty And events Industry dynAmICsIn the pre-GFC period 2007—08, the domestic share of tourism GDP was $30.1 billion (74.0% of total tourism GDP), up 3.4% on 2006—07 levels. Total domestic tourism consumption was $65.1 billion (73.4% of total tourism consumption), up 4.0% on 2006—07 levels24.
However, recent data for the restaurant and catering industry shows that the 12 months to December 2010 closed at $17.6 billion (9.9% up on the previous corresponding period). During this period, December 2009 turned over nearly one-tenth of this figure ($1.6 billion)—14.5% up on December 2008. Furthermore, December 2009 was the first (and only) month to date in which the industry in NSW achieved over $0.5 billion25.
According to DEEWR, employment growth in accommodation and food services has shown strong long-term growth over the last decade. In the ten years to February 2010, employment in the industry rose by 133,100 (or 21.9%) to 741,700. This represents an average growth rate of 2.0%26.
In light of the strong appreciation of the Australian dollar, the growth forecast by Tourism Research Australia regarding inbound arrivals for 2010 was recently revised downward marginally from 5.5% to 5.3%, yet around 5.9 million visitors were still expected to visit Australia for the year27.
Other key factors influencing tourism demand in Australia include:
reduced oil prices, which led to cuts or reductions in airline fuel surcharges and • allowed airlines to reduce airfares more heavily on long-haul routes
increased aviation capacity into Australia, particularly on routes to • and from the United States, the Middle East and Asia
considerably cheaper international airfares and package travel • following the sharp discounting of international airfares.
Trends in consumer demographics and behaviour have changed and continue to change the tourism environment, making it necessary for the industry to take a more strategic destination-management approach to its planning to remain competitive28.
The tourism industry has been affected by the strength of the Australian dollar, coupled with a strong Australian economy and increased international air capacity. This has increased opportunities for Australians to travel overseas, while at the same time reducing the competitiveness

Tourism, Hospitality and Events environmental scan 2011 5.
of Australia as a destination for international visitors29. Furthermore, the Reserve Bank has increased interest rates progressively since their low of 3.0% in May 2009. The official rate, as of November 2010 was 4.75%, still below the national long-term average but high compared with most other developed countries, particularly Japan, parts of Europe and the US, where interest rates are at or near zero. This gradual upward movement in interest rates is likely to place pressure on discretionary consumer spending such as travel and tourism30.
Tourism businesses have indicated that the strength of the Australian dollar is a major issue, with 71% saying it is negatively affecting their businesses. Only one in ten tourism businesses reported that the currency’s strength is not having any negative repercussions on their business. Tourism businesses have called for greater government focus on tourism, including support for the development of critical tourism infrastructure and new products and experiences31.
Distribution and purchasing
The global distribution system for tourism and travel products has developed in recent years, with a greater access and range on offer in the online environment. This has mainly been led by major airlines, which have chosen to target a direct selling model to the consumer; a strategy that the airlines have had in place for almost a decade in relation to the domestic market. With regard to accommodation products, major chains have also enhanced their internet model to present a more competitive pricing model to the consumer. This change has led to the development of more sophisticated online travel agent (OTA) websites, and there is a new arena of competition emerging in the direct selling model of travel and tourism products between these OTAs and the suppliers themselves. Meanwhile, the traditional distribution system, which makes up the majority of the workforce in the travel sector, continues to enjoy strong growth by way of a service differential model to the consumer and in outbound overseas airline bookings as well as the fast emerging cruise sector. For inbound tour operators, the traditional distribution model continues to play the primary role for international inbound visitors who are still accessing the ‘Aussie Specialist’ program established by Tourism Australia to support the inbound industry by way of better education for overseas travel agents.
Travel agents have had to increase their service offer, become more competitive on price and demonstrate an enhanced advantage to the consumer in order to remain relevant and in business. Product training and enhanced skills become paramount in order for travel agents to compete.
In addition to the changing face of travel distribution, the federal and state governments are undertaking a review of consumer protection in the travel and travel related service industries. The review may bring a range of new legislative changes that could have a material impact upon the way the travel industry is regulated and any changes could further influence the need for workforce development and the training needs of the travel industry.
In general, the travel industry has grown over the last 12 months, however the way the consumer has elected to purchase their travel has seen a shift in the market share of the various different channels involved in the distribution of travel products.
From a labour and skills perspective, lifestyle transitions provide a point of reference for understanding market impacts. Individuals’ purchasing habits are a case in point. For instance, industry reports an increase in online and just in time purchasing of products. Distribution of messages and advertising of tourism destinations are increasingly promoted informally through social networking and instant communication vehicles, such as Facebook and Twitter. Employers involved in wholesaling and the distribution of tourism products will need to consider adopting more flexible and modern business models and seek leverage from these consumer trends32.

6. service skills Australia
regIonAl AspeCtsWith most industries in SSA’s scope, businesses are located in direct proportion to population size. Obviously, the population level of each state directly influences the number of potential customers, with more densely populated states usually having a higher proportion of businesses to service consumer demand. However, this is not always the case in tourism, hospitality and events, as some remote and less-populated areas in Australia are popular tourist destinations.
14,000
12,000
10,000
8,000
6,000
4,000
2,000
0NSW QLD Vic WA SA Tas NT ACT
1.0
2.0
3.0
4.0
5.0
6.0
7.0
8.0
9.0
10.0
0NSWAUS QLD Vic WA SA Tas NT ACT
6,000
5,000
4,000
3,000
2,000
1,000
0NSW QLD Vic WA SA Tas NT ACT
11,7
824.
8
4.7 5.
7
4.2
3.7
6.2
9.3
4.0
4.0
7463
7208
3102
1917
864
800
596
5440
.4
3335
.3 4831
.1
2221
.9
1018
.9
215.
2
202.
4
215.
2fIgure 1 estImAtes of dIreCt ContrIbutIon to AustrAlIA’s tourIsm gross vAlue Added (gvA)
by state and territory in aUd million (2007―2008)33
14,000
12,000
10,000
8,000
6,000
4,000
2,000
0NSW QLD Vic WA SA Tas NT ACT
1.0
2.0
3.0
4.0
5.0
6.0
7.0
8.0
9.0
10.0
0NSWAUS QLD Vic WA SA Tas NT ACT
6,000
5,000
4,000
3,000
2,000
1,000
0NSW QLD Vic WA SA Tas NT ACT
11,7
824.
8
4.7 5.
7
4.2
3.7
6.2
9.3
4.0
4.0
7463
7208
3102
1917
864
800
596
5440
.4
3335
.3 4831
.1
2221
.9
1018
.9
215.
2
202.
4
215.
2
FigUre 2 Percentage oF toUrism share oF emPloyment by state/territory (2007―2008)34
14,000
12,000
10,000
8,000
6,000
4,000
2,000
0NSW QLD Vic WA SA Tas NT ACT
1.0
2.0
3.0
4.0
5.0
6.0
7.0
8.0
9.0
10.0
0NSWAUS QLD Vic WA SA Tas NT ACT
6,000
5,000
4,000
3,000
2,000
1,000
0NSW QLD Vic WA SA Tas NT ACT
11,7
824.
8
4.7 5.
7
4.2
3.7
6.2
9.3
4.0
4.0
7463
7208
3102
1917
864
800
596
5440
.4
3335
.3 4831
.1
2221
.9
1018
.9
215.
2
202.
4
215.
2
fIgure 3 retAIl turnover for CAfes, restAurAnts And CAterIng servICes by stAte And terrItory In Aud mIllIon (CAlendAr yeAr 2010)35

Tourism, Hospitality and Events environmental scan 2011 7.
New South Wales
As illustrated by the above graph (Figure 4), cafes, restaurants and catering services in New South Wales (NSW) recorded a turnover of $5440.4million for the 2010 calendar year. This represents an increase of $434.3million (8.7%) from the 2009 calendar year and reflects the national consumer trend of Australians increasingly choosing to dine out36.
NSW had the highest number of tourism and hospitality businesses in Australia in 200737 and in 2007—08 at 4.8% direct tourism employment was slightly above the Australia-wide percentage of 4.7%38.
Data from 2009/10 indicates that visitors in NSW spent $23.5 billion, with domestic overnight visitors accounting for 52% of total spending. In the same year, 75.0 million people visited the state, of which 66% were domestic day visitors. Interestingly, the experiences that visitors sought out were strongly linked to the state’s food and wine sectors. Of note is that international visitors who were in NSW for education purposes took a 34% share of the nights stayed of international visitors39.
Victoria
In 2007, Victoria had the second highest number of tourism and hospitality businesses in Australia after NSW40. The tourism industry brought $16.2 billion to the Victorian economy in 2009/10 with 56.4 million visitors, of which 69% were domestic day visitors. Crucially, 40% of the nights share for international visitors was based on the state’s education market41.
In 2010, cafes, restaurants and catering services in Victoria recorded a turnover of $4831.1million, an increase of $361.1 million (8.1%) from 200942.
As a reaction to the growing interest in sustainability issues, Tourism Victoria released its Environmentally Sustainable Tourism Strategic Plan 2009–2012 in 2009. The plan promotes businesses that demonstrate environmental credentials, through accreditation programs, developing and distributing a carbon footprint toolkit for use by businesses and destinations, and working with the Victorian Employers’ Chamber of Commerce and Industry to ensure that tourism is an integral part of the ‘Grow Me the Money’ and ‘CarbonDown’ programs. The plan also promotes and continues to enhance the Sustainability in Tourism section of the Tourism Excellence program43.
In 2010, Service Skills Victora undertook a best practice case study of a number of service industry businesses in Victoria, including those from the tourism, hospitality and events sector, to measure their commitment to workforce development. The case study found that the contributing businesses valued staff development and employed good management skills, processes, practices and policies. One constant among the participants was the commitment to staff training, with 80% of businesses confirming that all of their staff undertakes training, with the remaining 20% in the process of training their staff44.
8. service skills Australia
Queensland
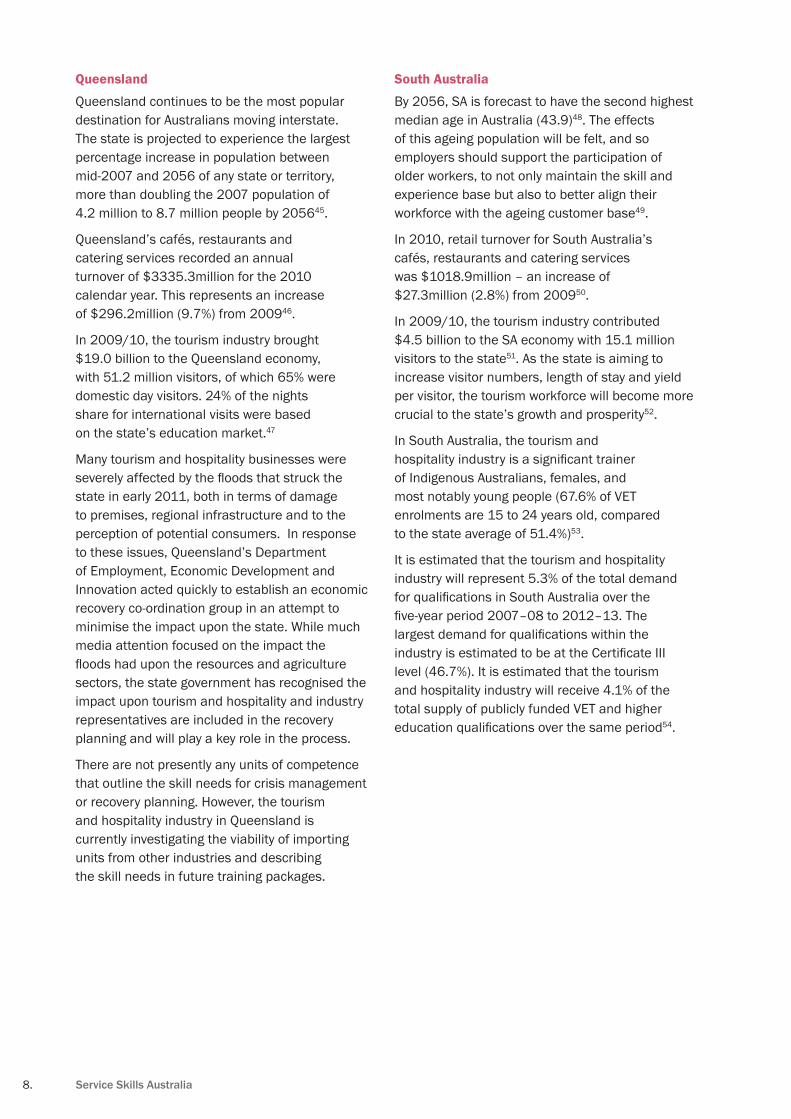
Queensland continues to be the most popular destination for Australians moving interstate. The state is projected to experience the largest percentage increase in population between mid-2007 and 2056 of any state or territory, more than doubling the 2007 population of 4.2 million to 8.7 million people by 205645.
Queensland’s cafés, restaurants and catering services recorded an annual turnover of $3335.3million for the 2010 calendar year. This represents an increase of $296.2million (9.7%) from 200946.
In 2009/10, the tourism industry brought $19.0 billion to the Queensland economy, with 51.2 million visitors, of which 65% were domestic day visitors. 24% of the nights share for international visits were based on the state’s education market.47
Many tourism and hospitality businesses were severely affected by the floods that struck the state in early 2011, both in terms of damage to premises, regional infrastructure and to the perception of potential consumers. In response to these issues, Queensland’s Department of Employment, Economic Development and Innovation acted quickly to establish an economic recovery co-ordination group in an attempt to minimise the impact upon the state. While much media attention focused on the impact the floods had upon the resources and agriculture sectors, the state government has recognised the impact upon tourism and hospitality and industry representatives are included in the recovery planning and will play a key role in the process.
There are not presently any units of competence that outline the skill needs for crisis management or recovery planning. However, the tourism and hospitality industry in Queensland is currently investigating the viability of importing units from other industries and describing the skill needs in future training packages.
South Australia
By 2056, SA is forecast to have the second highest median age in Australia (43.9)48. The effects of this ageing population will be felt, and so employers should support the participation of older workers, to not only maintain the skill and experience base but also to better align their workforce with the ageing customer base49.
In 2010, retail turnover for South Australia’s cafés, restaurants and catering services was $1018.9million – an increase of $27.3million (2.8%) from 200950.
In 2009/10, the tourism industry contributed $4.5 billion to the SA economy with 15.1 million visitors to the state51. As the state is aiming to increase visitor numbers, length of stay and yield per visitor, the tourism workforce will become more crucial to the state’s growth and prosperity52.
In South Australia, the tourism and hospitality industry is a significant trainer of Indigenous Australians, females, and most notably young people (67.6% of VET enrolments are 15 to 24 years old, compared to the state average of 51.4%)53.
It is estimated that the tourism and hospitality industry will represent 5.3% of the total demand for qualifications in South Australia over the five-year period 2007–08 to 2012–13. The largest demand for qualifications within the industry is estimated to be at the Certificate III level (46.7%). It is estimated that the tourism and hospitality industry will receive 4.1% of the total supply of publicly funded VET and higher education qualifications over the same period54.

Tourism, Hospitality and Events environmental scan 2011 9.
Western Australia
The continuous increase in Western Australia’s (WA) population, which is projected to more than double between 2007 and 2056, reaching 4.3 million people55, will further boost the demand for service industries.
Cafés, restaurants and catering services recorded a retail turnover of $2221.9million in WA in 2010. This represents an increase of $425.2 from the turnover recorded in 2009. The percentage increase of 23.7% was the second highest of all the states and territories, after the Northern Territory56.
The tourism sector brought $6.6 billion to the economy in 2009/10, with 17.4 million visitors staying 43.1 million nights. In WA, the education market accounted for 24% of the share of international visitor night stays57.
Tasmania
Tasmania is forecast to have the fastest ageing population in Australia, which will result in Australia’s highest median age of 45.7 in 2056, compared to an Australia wide median age of 42.458. This trend is mainly because Tasmania traditionally experiences a loss to interstate migration in younger age groups and a gain in older age groups59. The major effect that this age demographic signals is the even greater competition it will mean for available workers in the tourism, hospitality and events industries.
In 2010, cafés, restaurants and catering services recorded a retail turnover of $215.2million. This represents a decrease in turnover from the 2009 calendar year, when turnover was recorded as $227.4million60. The tourism industry brought $2.4 billion to the Tasmanian economy in 2009/10, with 6.6 million visitors spending 11.4 million nights61.
For the year ending March 2009, overall visits to Tasmania increased by 7% compared to the year ending March 2008. Total visitor nights grew by 4% to 7.45 million nights, and total spending in Tasmania rose by 7% to $1.43 billion. Growth was strongest in the number of interstate holiday visitors to the state62.
Industry feedback to SSA has revealed concern about fewer people visiting Tasmania and has suggested the introduction of a marketing strategy to encourage more tourists to visit, especially during the winter months. Regional areas in particular are finding it increasingly difficult to attract visitors, with the majority of short-term visitors preferring to visit the major towns. Events such as the Lumina Festival and the hosting of AFL matches in Launceston have helped to attract visitors, particularly from Melbourne, which is seen as a largely untapped market.
In the face of ongoing employment issues, the industry has also identified the need to attract people to the industry and highlight the career paths available. The seasonal nature of industry in Tasmania means that many employers are unable to offer full-time, permanent employment. Therefore, the industry currently relies on part-time and casual staff, but struggles to access funds to train these employees adequately. Given the range of tasks employees are required to undertake, the multi-skilling of staff has also become vital. During industry consultation, the Tasmanian Minister for Hospitality identified the need to build a solid, sustainable work environment with industry buy-in.
10. service skills Australia
Northern Territory
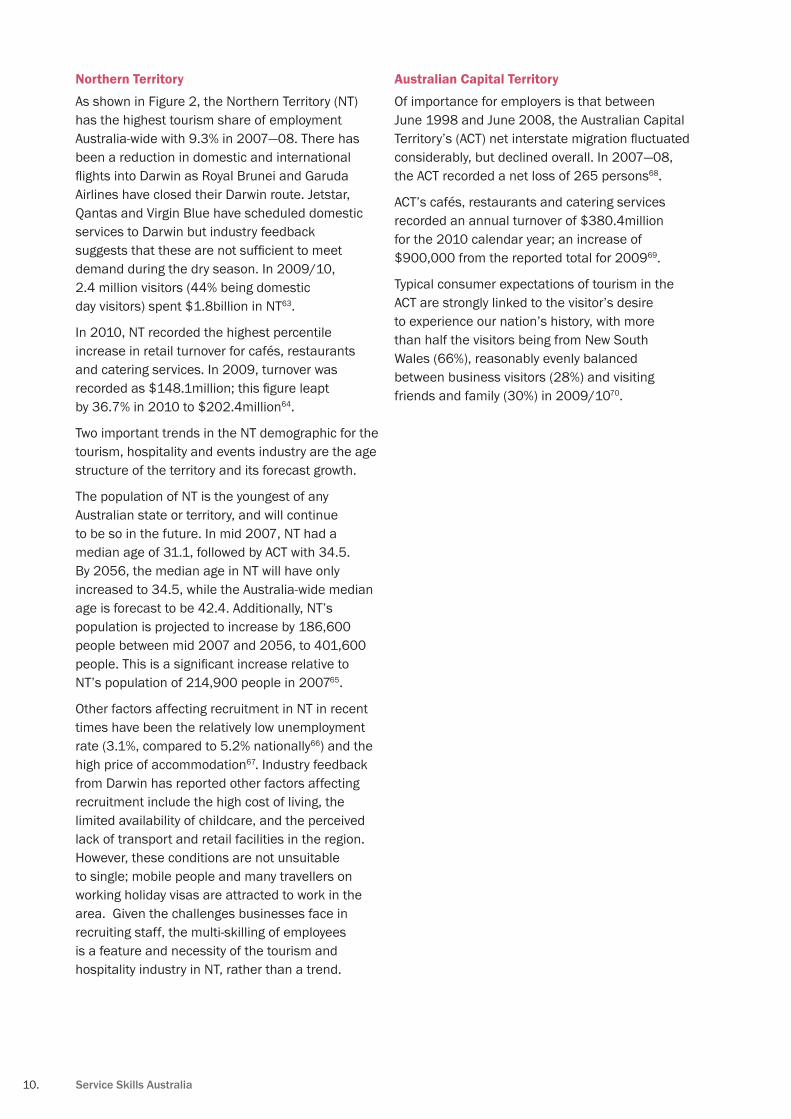
As shown in Figure 2, the Northern Territory (NT) has the highest tourism share of employment Australia-wide with 9.3% in 2007—08. There has been a reduction in domestic and international flights into Darwin as Royal Brunei and Garuda Airlines have closed their Darwin route. Jetstar, Qantas and Virgin Blue have scheduled domestic services to Darwin but industry feedback suggests that these are not sufficient to meet demand during the dry season. In 2009/10, 2.4 million visitors (44% being domestic day visitors) spent $1.8billion in NT63.
In 2010, NT recorded the highest percentile increase in retail turnover for cafés, restaurants and catering services. In 2009, turnover was recorded as $148.1million; this figure leapt by 36.7% in 2010 to $202.4million64.
Two important trends in the NT demographic for the tourism, hospitality and events industry are the age structure of the territory and its forecast growth.
The population of NT is the youngest of any Australian state or territory, and will continue to be so in the future. In mid 2007, NT had a median age of 31.1, followed by ACT with 34.5. By 2056, the median age in NT will have only increased to 34.5, while the Australia-wide median age is forecast to be 42.4. Additionally, NT’s population is projected to increase by 186,600 people between mid 2007 and 2056, to 401,600 people. This is a significant increase relative to NT’s population of 214,900 people in 200765.
Other factors affecting recruitment in NT in recent times have been the relatively low unemployment rate (3.1%, compared to 5.2% nationally66) and the high price of accommodation67. Industry feedback from Darwin has reported other factors affecting recruitment include the high cost of living, the limited availability of childcare, and the perceived lack of transport and retail facilities in the region. However, these conditions are not unsuitable to single; mobile people and many travellers on working holiday visas are attracted to work in the area. Given the challenges businesses face in recruiting staff, the multi-skilling of employees is a feature and necessity of the tourism and hospitality industry in NT, rather than a trend.
Australian Capital Territory
Of importance for employers is that between June 1998 and June 2008, the Australian Capital Territory’s (ACT) net interstate migration fluctuated considerably, but declined overall. In 2007—08, the ACT recorded a net loss of 265 persons68.
ACT’s cafés, restaurants and catering services recorded an annual turnover of $380.4million for the 2010 calendar year; an increase of $900,000 from the reported total for 200969.
Typical consumer expectations of tourism in the ACT are strongly linked to the visitor’s desire to experience our nation’s history, with more than half the visitors being from New South Wales (66%), reasonably evenly balanced between business visitors (28%) and visiting friends and family (30%) in 2009/1070.
Tourism, Hospitality and Events environmental scan 2011 11.
mACro-envIronment fACtorsIn 2008, Tourism Research Australia reported increasing pressures on discretionary time and income coming from growing choices and changes in the social environment, especially around work culture. At the same time, cultural and technological changes have resulted in lowered tolerance for deferring gratification, and an increasingly frequent need to update possessions71.
This research went on to identify a range of factors affecting tourism, including changing demographics and social issues such as:
the ageing population•
changing family structures•
increasing preference to purchase ‘stress relieving activities’, • which extend to value for money transactions.
Consumer research undertaken by industry clearly identifies the impact of consumer sentiment upon the tourism market.
A person’s attitude to travel as a suitable way of using disposable income or spare time depends on a combination of his or her life stage and psychographic profile; each factor on its own insufficient to explain the attitude fully. The psychographic profile is driven by the extent to which the sense of self is defined by the approval of others or by ourselves, the individual feeling comfortable or secure about him or herself and where he or she is in life, and whether doing (or experiencing) rather than having fulfils needs72.
When viewed alongside the regional variability associated with different demographics and economic impacts of tourism briefly described earlier, this complexity of consumer behaviour combines to present a complex picture of the nature of the tourism business.
Industry ConsultAtIons hAve IdentIfIed A number of emergIng Consumer And teChnology trends thAt wIll AffeCt future workforCe plAnnIng.
The hotel industry has noted that customer expectations are changing with exposure to overseas destinations, particularly in Asia. Domestic travellers are expecting similar levels of service to those experienced overseas; however, the flexibility and level of staffing required to meet these expectations presents a challenge for some businesses. It was also noted that hotel guests are increasingly expecting the same levels of technology to be available to them as they have in their homes, such as fast broadband, pay TV and movie downloads, and are resistant to paying extra for these services. An increasing number of hotels are also using mobile technology to modernise their own services and reduce costs; one example of this is the use of iPads in restaurants for menus and ordering.
Hotels are also seeking to find ways to engage with social networking sites productively in a way that shows real return on investment. Effective communication skills, along with sound judgement and discretion will be required skills for employees who utilise these new tools. Industry consultation also sounded a note of caution about the reliability of websites such as TripAdvisor which provide consumer-led feedback and information on tourism and hospitality services and are increasing the first port of call for travellers. Feedback from the hospitality sector has also identified increased consumer awareness about the variety of foods available and noted an increase in customer expectations about quality, choice and value for money. Consumers are more health conscious and have a greater expectation for fresher, locally sourced produce. This increased sophistication is attributed in part to high-profile television programs such as Masterchef, which have had an influence on the perception of restaurant standards.
“(the) complexity
of consumer
behaviour combines
to present a
complex picture of
the nature of the
tourism business.”

12. service skills Australia
Middle and higher income households with their busy lifestyles (and lack of time to prepare meals and/or to share a meal with family members) have meant that over time there has been an increase in spending on eating out at cafes and restaurants by these people. Eating out is now more of a family enjoyment/get together experience – away from the busy home life. The choice is either to eat in or to take away from a fast food outlet or restaurant/cafe. Therefore, competition will always be significant. The café and restaurant industry is also affected by general economic conditions in terms of how much is spent on meals and drinks73. It is estimated by Restaurant and Catering Australia that this trend for increased spending on eating out has accounted for $4-$6 billion in revenue growth over the last decade.
Sustainability: Driven by consumer need
Given the high level of customer contact in the tourism, hospitality and events industries, they are in a strong position to build awareness of sustainability issues.
Green skills are driven by consumer demand. Companies are being urged to become more environmentally friendly because customers are looking for companies that incorporate sustainable practice and provide green products and services.
Furthermore, so-called ‘green collar’ skills are not only covering areas like trade skills (such as green plumbing, construction of energy efficient buildings, renewable energy and low input gardening) but also business leadership, entrepreneurialism and project management.
Making the transition to a sustainable and more resource-efficient economy will require innovation across all industry sectors. For many employers in the tourism, hospitality and events industry, green skills have always been a part of best practice activity. The issue for the service industries is contextualising existing skills and changing behaviour. When a customer sees sustainable practice in a hotel, or local food supported in their favourite café, it promotes sustainable practice, engages customers and helps to change their existing mindsets. Given the growth predicted for the service industries, such sustainable business practice can be promoted to existing and potential customers and used to increase productivity and save energy and money.
Waste management and energy conservation to reduce costs are effective strategies to influence business bottom line. In the hospitality sector, programs like Green Table, EC3 and Ecotourism Australia promote sustainable practices and support companies to adapt sustainable solutions (including programs to provide skills to business operators). This includes recycling waste, energy saving through the use of special light bulbs and insulation, green purchasing by buying local, water reduction activities in relation to garden design and the use of efficient appliances, using special cleaning products, reducing laundry and grey water disposal, and changing stationery use (e.g. green printing and use of recycled paper)74.
Tourism, Hospitality and Events environmental scan 2011 13.
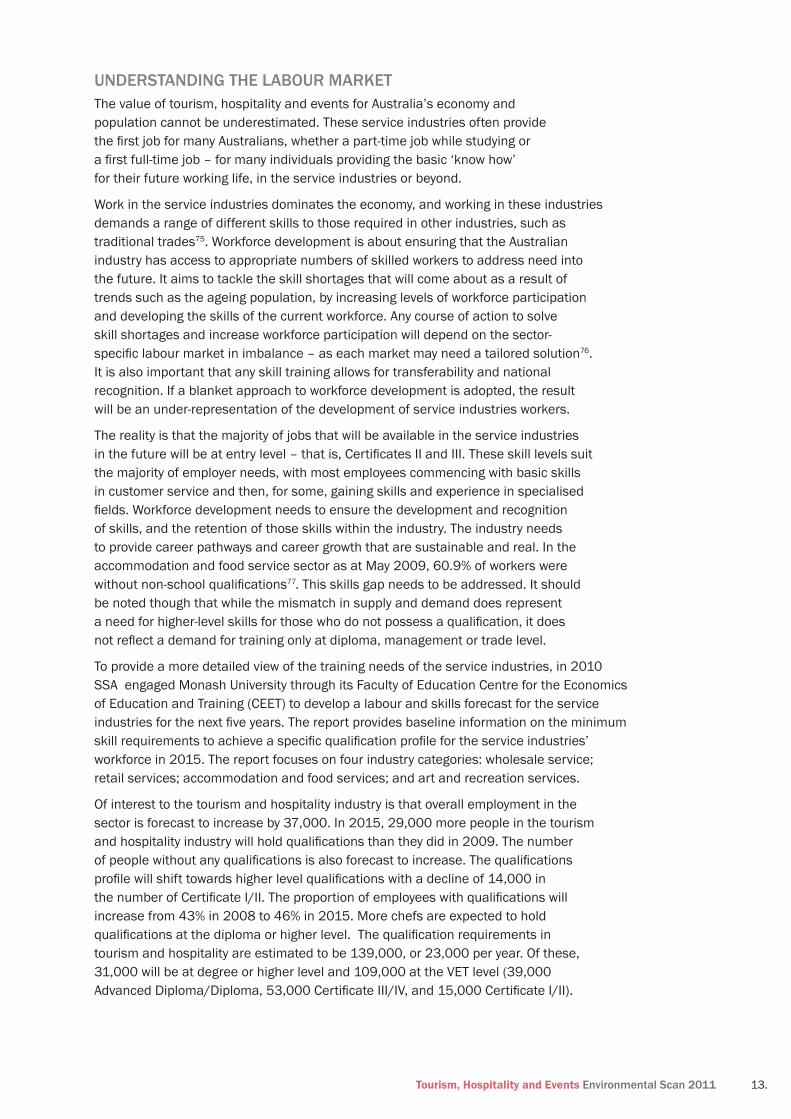
understAndIng the lAbour mArketThe value of tourism, hospitality and events for Australia’s economy and population cannot be underestimated. These service industries often provide the first job for many Australians, whether a part-time job while studying or a first full-time job – for many individuals providing the basic ‘know how’ for their future working life, in the service industries or beyond.
Work in the service industries dominates the economy, and working in these industries demands a range of different skills to those required in other industries, such as traditional trades75. Workforce development is about ensuring that the Australian industry has access to appropriate numbers of skilled workers to address need into the future. It aims to tackle the skill shortages that will come about as a result of trends such as the ageing population, by increasing levels of workforce participation and developing the skills of the current workforce. Any course of action to solve skill shortages and increase workforce participation will depend on the sector-specific labour market in imbalance – as each market may need a tailored solution76. It is also important that any skill training allows for transferability and national recognition. If a blanket approach to workforce development is adopted, the result will be an under-representation of the development of service industries workers.
The reality is that the majority of jobs that will be available in the service industries in the future will be at entry level – that is, Certificates II and III. These skill levels suit the majority of employer needs, with most employees commencing with basic skills in customer service and then, for some, gaining skills and experience in specialised fields. Workforce development needs to ensure the development and recognition of skills, and the retention of those skills within the industry. The industry needs to provide career pathways and career growth that are sustainable and real. In the accommodation and food service sector as at May 2009, 60.9% of workers were without non-school qualifications77. This skills gap needs to be addressed. It should be noted though that while the mismatch in supply and demand does represent a need for higher-level skills for those who do not possess a qualification, it does not reflect a demand for training only at diploma, management or trade level.
To provide a more detailed view of the training needs of the service industries, in 2010 SSA engaged Monash University through its Faculty of Education Centre for the Economics of Education and Training (CEET) to develop a labour and skills forecast for the service industries for the next five years. The report provides baseline information on the minimum skill requirements to achieve a specific qualification profile for the service industries’ workforce in 2015. The report focuses on four industry categories: wholesale service; retail services; accommodation and food services; and art and recreation services.
Of interest to the tourism and hospitality industry is that overall employment in the sector is forecast to increase by 37,000. In 2015, 29,000 more people in the tourism and hospitality industry will hold qualifications than they did in 2009. The number of people without any qualifications is also forecast to increase. The qualifications profile will shift towards higher level qualifications with a decline of 14,000 in the number of Certificate I/II. The proportion of employees with qualifications will increase from 43% in 2008 to 46% in 2015. More chefs are expected to hold qualifications at the diploma or higher level. The qualification requirements in tourism and hospitality are estimated to be 139,000, or 23,000 per year. Of these, 31,000 will be at degree or higher level and 109,000 at the VET level (39,000 Advanced Diploma/Diploma, 53,000 Certificate III/IV, and 15,000 Certificate I/II).
14. service skills Australia
The employment requirements for chef and fast food occupations are estimated to be about 18,000 and 13,000 respectively. While growth is the main factor affecting requirements for qualified chefs, both growth and replacement needs are affecting requirements for qualified fast food chefs78.
The high replacement rate identified by CEET creates a cost for accommodation and food services businesses in terms of the additional training required to meet the high net replacement rate.
As part of the Labour and Skills Forecast, CEET also produced a report on the productivity growth in selected industries. These industry-specific estimates provide a positive view of productivity growth in some service industries over the last decade.
The productivity changes in accommodation and food services over the last decade and the last five years have been characterised by declining (but still positive) absolute levels of labour productivity growth. Nevertheless, labour productivity has grown at about the average rate of the market sector over the last 10 years or so. The changes in labour productivity are associated with less than average capital deepening and variable but low levels of multifactor productivity (MFP) growth.
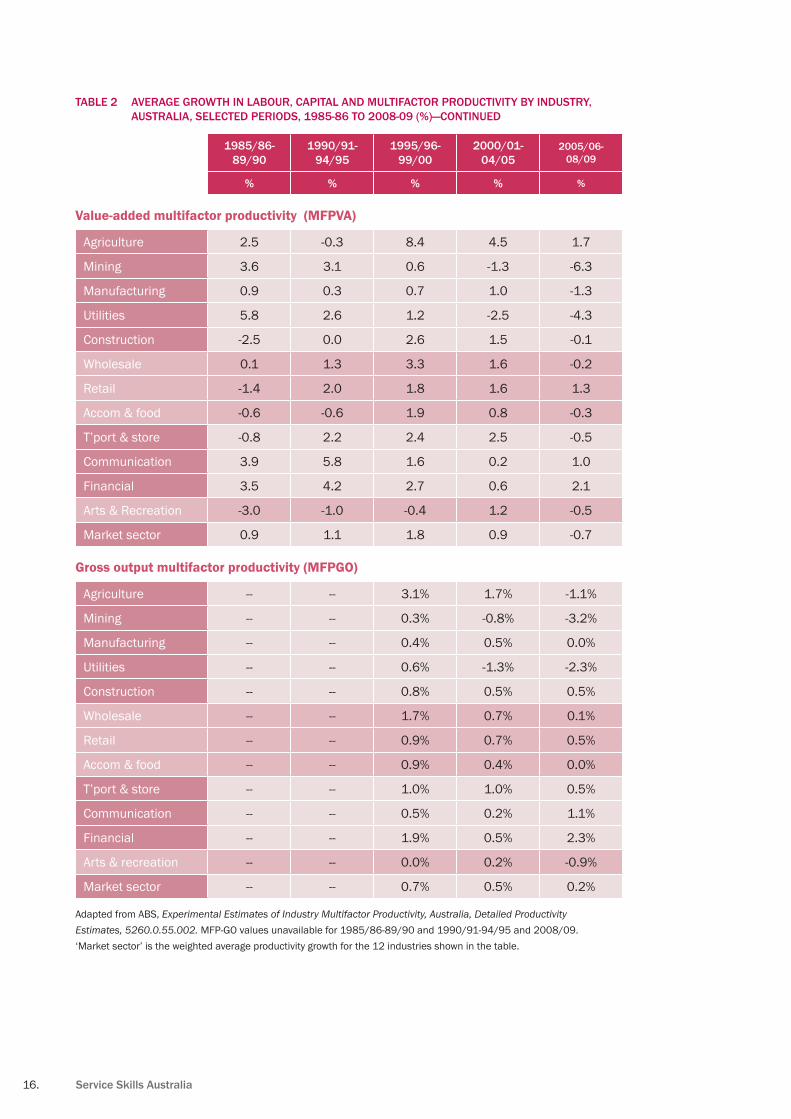
MFP growth in the accommodation and food services industry peaked in the five years 1995/6 to 1999/2000 (1.9% per year) and then declined in subsequent periods to 0.8% and more recently to -0.3%. The decline over the last 15 years or so mostly reflects the broader changes in the MFP of the market sector of the Australian economy. In the period 2004/5 to 2008/9 the decline in MFP experienced by the accommodation and food services industry (-0.3% per year) was slightly less than the corresponding decline for the market sector as a whole (-0.7% per year).
From the mid-1990s onwards, labour productivity in the accommodation and food services industry increased after an earlier period of decline. The increase has generally been slower than that of the market sector overall, but over the period 2005/6 to 2008/9 exceeded overall growth by 0.4 percentage points.

Tourism, Hospitality and Events environmental scan 2011 15.
The productivity report does note, however, that the measured output for the accommodation and food services industry may not adequately capture improvements in the quality of service. If this is the case, and if the quality of the service has been increasing, estimates of productivity growth will generally be too low79.
AverAge growth In multIfACtor, lAbour And CApItAl produCtIvIty by Industry, tAble 1 aUstralia, selected Periods, 1985-86 to 2008-09 (%)
1985/86-89/90
1990/91-94/95
1995/96-99/00
2000/01-04/05
2005/06-08/09
% % % % %
Labour productivity
Agriculture 3.6 0.2 7.8 7.8 2.1
Mining 4.6 6.7 5.7 -2.4 -6.9
Manufacturing 1.4 1.6 2.8 2.7 1.2
Utilities 9.3 5.3 5.4 -3.2 -5.5
Construction -1.6 0.4 2.3 1.6 0.4
Wholesale 0.1 2.1 4.3 3.7 1.6
Retail -0.9 2.4 2.4 2.4 2.9
Accom & food -0.4 -1.3 2.6 1.8 1.5
T’port & store 1.7 2.4 2.5 2.9 -0.1
Communication 7.9 8.6 5.0 2.9 5.2
Financial 5.3 6.3 4.0 2.0 2.3
Arts & recreation -2.6 -0.5 1.3 1.9 -1.3
Market sector 1.5 2.1 3.1 2.2 1.1
Capital productivity
Agriculture 2.2 -0.6 8.7 2.8 1.5
Mining 3.1 1.5 -1.5 -0.9 -6.1
Manufacturing -0.4 -1.4 -1.5 -0.8 -4.0
Utilities 2.3 0.9 -0.9 -2.2 -3.7
Construction -5.4 -1.0 3.4 1.3 -1.3
Wholesale -1.3 -0.3 1.8 -2.3 -3.5
Retail -4.6 0.7 -0.1 -1.0 -3.0
Accom & food -1.9 1.3 0.0 -1.1 -3.3
T’port & store -4.1 1.9 2.2 2.0 -1.1
Communication 0.8 4.1 -0.5 -1.3 -1.6
Financial -4.6 0.4 0.5 -1.1 2.0
Arts & recreation -4.4 -1.6 -3.8 0.2 0.7
Market sector 0.0 -0.3 0.2 -0.6 -2.6
Adapted from ABS, Experimental Estimates of Industry Multifactor Productivity, Australia, Detailed Productivity Estimates, 5260.0.55.002.
16. service skills Australia
AverAge growth In lAbour, CApItAl And multIfACtor produCtIvIty by Industry, tAble 2 aUstralia, selected Periods, 1985-86 to 2008-09 (%)—continUed
1985/86-89/90
1990/91-94/95
1995/96-99/00
2000/01-04/05
2005/06-08/09
% % % % %
Value-added multifactor productivity (MFPVA)
Agriculture 2.5 -0.3 8.4 4.5 1.7
Mining 3.6 3.1 0.6 -1.3 -6.3
Manufacturing 0.9 0.3 0.7 1.0 -1.3
Utilities 5.8 2.6 1.2 -2.5 -4.3
Construction -2.5 0.0 2.6 1.5 -0.1
Wholesale 0.1 1.3 3.3 1.6 -0.2
Retail -1.4 2.0 1.8 1.6 1.3
Accom & food -0.6 -0.6 1.9 0.8 -0.3
T’port & store -0.8 2.2 2.4 2.5 -0.5
Communication 3.9 5.8 1.6 0.2 1.0
Financial 3.5 4.2 2.7 0.6 2.1
Arts & Recreation -3.0 -1.0 -0.4 1.2 -0.5
Market sector 0.9 1.1 1.8 0.9 -0.7
Gross output multifactor productivity (MFPGO)
Agriculture -- -- 3.1% 1.7% -1.1%
Mining -- -- 0.3% -0.8% -3.2%
Manufacturing -- -- 0.4% 0.5% 0.0%
Utilities -- -- 0.6% -1.3% -2.3%
Construction -- -- 0.8% 0.5% 0.5%
Wholesale -- -- 1.7% 0.7% 0.1%
Retail -- -- 0.9% 0.7% 0.5%
Accom & food -- -- 0.9% 0.4% 0.0%
T’port & store -- -- 1.0% 1.0% 0.5%
Communication -- -- 0.5% 0.2% 1.1%
Financial -- -- 1.9% 0.5% 2.3%
Arts & recreation -- -- 0.0% 0.2% -0.9%
Market sector -- -- 0.7% 0.5% 0.2%
Adapted from ABS, Experimental Estimates of Industry Multifactor Productivity, Australia, Detailed Productivity Estimates, 5260.0.55.002. MFP-GO values unavailable for 1985/86-89/90 and 1990/91-94/95 and 2008/09. ‘Market sector’ is the weighted average productivity growth for the 12 industries shown in the table.

Tourism, Hospitality and Events environmental scan 2011 17.
Ageing population
Population ageing is occurring globally, with a substantial shift in the age structure towards older ages. The median age of Australia’s population (36.8 years at June 2009)80 is projected to increase to between 38.7―40.7 in 2026 and to between 41.9―45.2 in 205681.
One effect of the ageing population is the reduction of the proportion of younger people. Australia’s population aged 15―64, which encompasses much of the working-age population, is projected to decline from 67% in 2004, to between 57―59% in 205182. As labour force growth is forecast to be slower than population growth, participation rate decreases.
This is a significant issue for the many sectors within tourism, hospitality and events as they have traditionally looked to younger labour to fulfil their workforce needs. The accommodation and food services industry has a relatively young workforce, with 45.7% of workers aged 15 to 24, compared with 16.8% for all Australian industries. Hence, in 2009, the median age of workers in accommodation and food services was 26, compared to the median age for all industries of 39. Mirroring this, accommodation and food services has currently the lowest share of all industries of workers aged 45 and over, with only 1.2% of the industry workforce being aged 65 and over, compared with 2.6% for all industries. The accommodation and food services industry also has the lowest share of workers aged 45 to 54 (12.3%) and 55 to 64 (7.8%)83.
As a result of projected population growth and current workforce participation rates, tourism, hospitality and events will have to increase their share of total national employment to meet labour demand forecasts. However, as many companies are already struggling in the short term to find appropriate employees to sustain their business, long-term strategies often do not exist. Having said this, SSA applauds the forward-looking Indigenous training initiatives being undertaken by leading industry stakeholders who are investing in training and workforce development, for example such as Seaworld Gold Coast (Queensland), Burswood Entertainment Complex (WA), Accor Group, Tourism WA, Hospitality Pty Ltd (WA), and Compass Group (WA).
It is forecast that the effect of an ageing population as described above, while still noticeable, will not be felt as keenly in NT, which will continue to have the youngest population in Australia; as opposed to South Australia and Tasmania, which are forecast to have the oldest.
The industry does provide good opportunities for older people looking for lifestyle changes and moving into the industry as small business operators in bars, cafés and motels offers an attractive option. Bearing in mind though that for many operators and employees, much of the work is physically demanding and the effort and energy required to do it can have its own lifespan.

18. service skills Australia
IdentIfIed workforCe development needsIf one combines the nature of the tourism, hospitality and events industry, the evolution of consumer trends and patterns, as well as the changes in the available labour market, it is evident that solutions to improve the capacity and capability of the labour market must be as nuanced and tailored as the industry that they serve.
Access to, and retention of, a sufficient quantity and quality of labour inputs are fundamental for the tourism, hospitality and events industries84. Faced with increased competition for skilled labour, often from mining and construction industries, a typical context that operators find themselves in will be:
There is growth in restaurant and café business • in major and growing population centres.
The way that consumers are spending their money and the • channels that this is typically flowing through are changing.
The available labour market is ageing.•
Often in response to the above, operators find themselves ‘making do’ with what is available and hiring at a skill level below that which is required, which can result in a fall in productivity. Other organisations are changing their way of operating. For example, to accommodate a lack of available labour, some organisations are centralising the production of food and then focusing energies on effective distribution of the product.
Furthermore, in 2010, the Australian Federation of Travel Agents (AFTA), the Australian Tourism Export Council (ATEC) and SSA hosted a forum for industry leaders to discuss critical issues and possible responses concerning workforce development in the travel and tourism sectors. The forum identified three key areas to address:
Industry must understand and embrace the needs of their workforce • through better communication and the development of appropriate and targeted strategies to attract and retain employees.
Put systems in place that allow for continuous improvements in • training and education on par with developments of the industry and further integration of the industry in the training/education process.
To develop a greater value proposition that • better attracts workers to the sector.
Consultation with a range of stakeholders since the forum indicated that the travel sector could address these issues by:
Taking action to create better links and collaboration • between education providers and industry
Take a particular focus in the short to medium term on defining better • and developing skills in business practice (including innovation), leadership capability, selling and customer service skills
Create industry recognised and supported career pathways • that better retain skilled labour within industry.
“...operators find
themselves ‘making
do’ with what is
available and hiring
at a skill level
below that which is
required...”

Tourism, Hospitality and Events environmental scan 2011 19.
pICture of Current trAInIng supplyThere is a discrepancy between the required supply of skilled labour to the tourism, hospitality and events industries and that which is being delivered. This discrepancy is linked to both issues in the quality and the quantity of supply.
A significant amount of tourism and hospitality labour sits at Australian Qualifications Framework (AQF) levels 2 and 3 and a range of qualifications have been developed to accommodate the breadth of industry requirements at these levels. Industry has noticed that through a range of changes in the system, skill shortages in the sectors are still prevalent. A change in policy focus would improve the supply of skilled labour to tourism.
Industry feedback indicates that there is:
a focus on higher level qualifications at the expense of lower level qualifications•
a focus on workforce planning based on higher level occupations•
a decrease in funding for AQF level 2 qualifications.•
The above factors have resulted in significant challenges and barriers to effective provision of appropriate skilled labour supply.
As mentioned on page 17, Australia’s working age population is projected to substantially decline, resulting in a reduced labour pool. This, together with the forecast growth in several hospitality sectors, highlights emerging holes in labour supply. Furthermore, with regard to skills shortages, the economic downturn has not left the industry in a better position in the short term and the industry may still struggle to attract sufficient quality workers over the long term85. Industry feedback indicates that the availability of staff at the junior or frontline level continues to be an area of great concern86.
The Federal Government’s decision not to include cooks and chefs on the 2010 Skilled Occupation List was also of concern to a number of SSA’s stakeholders in the tourism and hospitality industry, who believe that that this will lead to significant labour and skills shortages and a reduction in the number of enrolments for hospitality courses.
solutIons And potentIAl sourCes of lAbourThe development of a draft Hospitality Supervisor skill set is currently underway in Western Australia where ‘bite sized’ skill sets of core units of competency are clustered for flexible delivery. Components include an option for employees with previous experience and training: ‘Lead and manage people’, ‘Recruit, select and induct staff’, ‘Roster staff’ and ‘Monitor work operations’. For employees with no previous training or experience, additional units such as ‘Work with colleagues and customers’ and ‘Coach others in job skills’ have been added. The use of skill sets to provide a group of potential employees with a ready-to-use core set of skills for frontline work in the industry is also a potential way to maximise the efficiencies of the skilling system.
For instance, providing new entrants to the workplace with skill sets in responsible service of alcohol, customer service, food hygiene and responsible service of gaming services would be an effective introduction to training for industry and may lead to employees considering undertaking a full qualification or further professional development. Another factor employees consider when thinking about engaging in training is the extent to which there is a return on the training in terms of career progression opportunities.
Linked to this is whether employers recognise these skills and qualifications and whether employees are provided with support to undertake further training. An enabler to this is to continue the current work being undertaken by the Council of Australian Governments (COAG) to harmonise licensing requirements across jurisdictions.
20. service skills Australia
Entrepreneurial skills
Improving business productivity helps industry grow and maximises the use of available skills. At the business level, there can be productivity gains through entrepreneurialism and a culture of innovation that drives improved business practices. Product offerings must be refreshed to anticipate changing consumer needs and purchasing behaviours87. Entrepreneurs, a key source of innovation within the industry, emerge from a range of inputs which include genes, modelling, learning and opportunity. Government policy can stimulate entrepreneurial activities through providing access to funds, tax concessions, and programs and strategies that provide support, networks and skills. There are initiatives now that address these in many industry areas, such as Enterprise Connect88 for the manufacturing sector, Innovation Centres in Mining, Creative Industries, Clean Energy as well as Commercialisation Australia89 to support the commercialisation of research and ideas.
However, there appear to be few initiatives to support entrepreneurialism and innovation in the service industries. Traditional classroom learning may not be the best training methodology for developing skills and attitudes that underpin entrepreneurialism. An approach that combines policy and strategy to support vocational training is needed.
A 2010 report by the Organisation for Economic Co-operation and Development (OECD), ‘SMEs, entrepreneurship and innovation’, also cited innovation as being one of the most fundamental processes underpinning economic growth, the driver of growth in output per unit of labour and capital invested, and an important basis for developing solutions to economic and social challenges. SMEs have a vital role to play in innovation and can be the drivers of, and influences on, innovation performance90.
Recognition of prior learning
During 2009, SSA worked with industry to develop a new model for the recognition of prior learning (RPL), as feedback had indicated that employees in the service industries found the existing RPL processes and procedures too demanding, requiring a considerable investment in time and effort in an industry where time is crucial.
These concerns were confirmed through the results of a survey of registered training organisations about the ease of access to RPL, which identified the critical barriers being: Lack of understanding / resources of assessors; inequitable funding mechanisms and Australian Qualification Framework requirements / inconsistencies with audit practices.
SSA therefore proposes a skill recognition approach that is specifically tailored to respond to the needs of industry. A process is required that (from the candidate and employer’s perspective) is simple, quick and appropriate whilst retaining the necessary rigour to enable a qualification to be awarded with confidence. The shortened timeframes in this process also make it cost effective.
‘Discuss, Display, Do’ is a project that aims to develop and pilot an RPL model suitable to the needs workers in the service industries. The project intends to investigate and identify how the national training system can respond to meet the needs of the service industries. In doing so, the project addresses the following Australian Government Priorities:
A new national approach to Apprenticeships, • Training and Skills Recognition
Supporting the development of the • National Volunteer Strategy
The National Reform Agenda •
The Social Inclusion Agenda.•
Tourism, Hospitality and Events environmental scan 2011 21.
Completion rates
Completion rates continue to be a concern to this industry. Critically, industry overall and the service industry in particular, believe that they have been unnecessarily disadvantaged by use of completion rates as a measure of success of industry training. This situation remains a concern in 2011.
There is a range of measures that assesses the inputs, outputs and outcomes of the VET sector. A primary outcome measure is recording the number of students who complete government-funded VET courses. Government funding is usually provided through traineeships, short course programs and skill shortage courses.
The completion rates of government-funded courses vary significantly across industry sectors and qualification levels. While completion rates are considered quite high, there is minimal information on the context in which this data is collected.
Currently, information publicly available on VET effort is limited to public-funded training and accredited training delivered to international students as part of immigration requirements. SSA is aware that the existing data only provides part of the picture and is looking forward to the implementation of the National VET Data Strategy.
The issue of completion rates and how VET is measured is currently a high profile issue, as the federal government outlined in its response to the Bradley Review of Higher Education91. The federal Minister for Education has stated that VET course completion rates should be a primary indicator of success when looking to increase the number of students who receive a qualification.
In response to these concerns, SSA has engaged JMA Analytics to undertake a research project to determine if the current assumptions about the reasons for non-completions are correct and to mount a case for a more consistent and accurate national measurement system. The project considers what non-completion data is currently being collected in VET, what non-completion data isn’t being collected that should be, and aims to find out what is the preferred structure, frequency and collection methodology for data on non-completions.
The first phase of the project involved an initial qualitative investigation that included a literature review, which revealed a high attrition rate for members of minority groups - suggesting that non-completion is not always about choice – and recognition of the role employers play in the completion rates of apprentices. Reports on stakeholder interviews, and consultations with the National Centre for Vocational Education Research (NCVER) have also been completed, as well as a critique of Australian Vocational Education and Training Management Information Statistical System (AVETMISS)92.
The second stage of the project involves working with three RTOs (one private, one public and one enterprise-based) to review their data collection processes and develop a tool that compliments AVETMISS and enables more detailed information on the reasons for non-completions to be captured. The final report will be published in March 2011.
22. service skills Australia
VET in schools
Industry feedback to SSA indicated problems around the delivery of vocational education and training in schools (VETiS).
Feedback suggested that typical delivery of VETiS does not achieve required industry outcomes and, often in school environments, VET training requirements are in competition with a fundamentally different pedagogical approach. Furthermore, inconsistency of VETiS practice and delivery across the states and territories makes delivery difficult for those providers and employers who employ across state borders. Such inconsistencies between state jurisdictions may also prevent learners from accessing future vocational education opportunities.
VETiS is seen as critical area for action due to the involvement of a significant number of Australian students and the recent rapid growth of VETiS programs. While there has been huge growth in the participation numbers, there is increasing concern about the quality of VETiS delivery and particularly, lack of employment outcomes.
Demographics, economic growth, competitiveness and increased skill requirements are creating even greater demand for skilled youth in Australia. Today’s younger generations have more opportunities and therefore have become ‘cherry pickers’, which has consequences for the service industries as they are often seen as a short term, second-rate career choice.
Working with industry, SSA has worked to address these issues through its VETiS project in 2010, which included the development of an industry position paper and ‘rules of engagement’ for the service industries. Further, it aims to develop ‘resource ready’ tools to assist VETiS delivery, as well as case studies that reflect what is occurring in industry.
A literature search and review highlighted the variety of interpretations of the term VETiS; each state or territory system locates VET in a different curricular context. The major concern is the inconsistency between VETiS, both within a jurisdiction as well as across Australia. Currently there are no common standards around approval, regulation, resourcing, administration, delivery and monitoring of VETiS.
Consultations occurred across the country over a period of four months to gather critical information on industry position and best practice example of VETiS.
The industry consultation process found:
Key stakeholders in VETiS have such • fundamental differences in what they consider to be the purpose and expected outcomes that some wish to walk away or ignore this nationally critical skilling opportunity.
Quality issues (not just limited to VETiS) were • a key component of consultations. There is massive variability (excellent to indefensible) in VETiS modules across Australia.
Many stakeholders expressed a desire • for clear and explicit guidelines.
The diversity across the services industries • requires different VETiS pathways, industry engagement, links to regulation, award conditions considerations and workplace engagement, such that VETiS must be considered on an individual industry sector (training package) basis.
There was a consistent strong industry • message about VETiS focused on job skills.
Given the imperatives and importance of VETiS, the services industries need to take a strategic, pragmatic and holistic approach to VETiS in order to maintain their share of youth employees recruited via VETiS pathways and ensure they can meet future workforce needs93.
Tourism, Hospitality and Events environmental scan 2011 23.
Current ImpACt of trAInIng pACkAgesFuture domestic, social and economic changes will have multiple effects on the workforce within tourism, hospitality and events. Leadership and entrepreneurial skills are particularly important for handling changes in Australian society, for example growth in the cultural diversity of employees and the reduced proportion of younger people.
Recruitment, retention and motivation of skilled employees are vital tasks for supervisors and managers; tasks of increasing significance for continued growth and productivity. High staff turnover has a major impact upon the quality and continuity of the product or service offered. The development of flexible career pathways and progression opportunities for employees will increase retention rates and improve job satisfaction. It is important that these factors are viewed in the context of other employment and industry factors, in order to improve workforce development and ensure sustainability in the tourism and hospitality sector.
The quality of training and work readiness of graduates has been an issue for many employers in tourism, hospitality and events. Employers have mixed experiences with the content of training and assessment and of the capacities of some trainers94. SSA’s 2010 Environmental Scan reported industry concern that institute or wholly classroom-based learning in training kitchens is seen as inadequate, unable to produce work-ready employees. It is imperative for the economic survival and competitiveness of the industry that trainees are able to ‘hit the ground running’. Having work experience is a key to success in these industries rather than just having a piece of paper with a qualification. Feedback to SSA also stated that the skill and knowledge level of qualified commercial cooks is decreasing because they are often being supervised or trained in the workplace by unqualified cooks. Hence, there is the need to better balance on-the-job and off-the-job training, as well as to better connect workplaces, enterprises and businesses in tourism, hospitality and events with the training. These issues remain valid for industry in 2011.
Increased knowledge about training options in VET as pathways to training, as well as pathways to further education opportunities, are essential to increasing industry’s skill base and to working towards improving workforce development, particularly in areas of skill shortage95.
pArtICIpAtIon In voCAtIonAl eduCAtIonInformation publicly available96 on VET effort is limited to public-funded training and accredited training delivered to international students as part of immigration requirements. SSA is aware that the existing data only provides part of the picture and is looking forward to the implementation of the National VET Data Strategy.
Most course enrolments in tourism and hospitality training packages in 2009 were in Certificate II in Hospitality Operations, Certificate III in Hospitality Operations, Certificate II in Tourism (Operations), Certificate III in Tourism (International Retail Travel Sales) and Diploma of Event Management. This latter qualification mirrors the image of events as a ‘sexy’ industry, attracting an increasing number of students.
The tourism, hospitality and events industry’s commitment to training is evidenced by a comparison with other industries. The below table provides a comparison of the number of apprenticeship and traineeships commencements and completions in 2009 across a number of industries.
24. service skills Australia
30,000
25,000
20,000
15,000
10,000
5,000
0
Commencements
Completions
ManufacturingConstructionCommunity Services
MiningTourism, Hospitality and Events
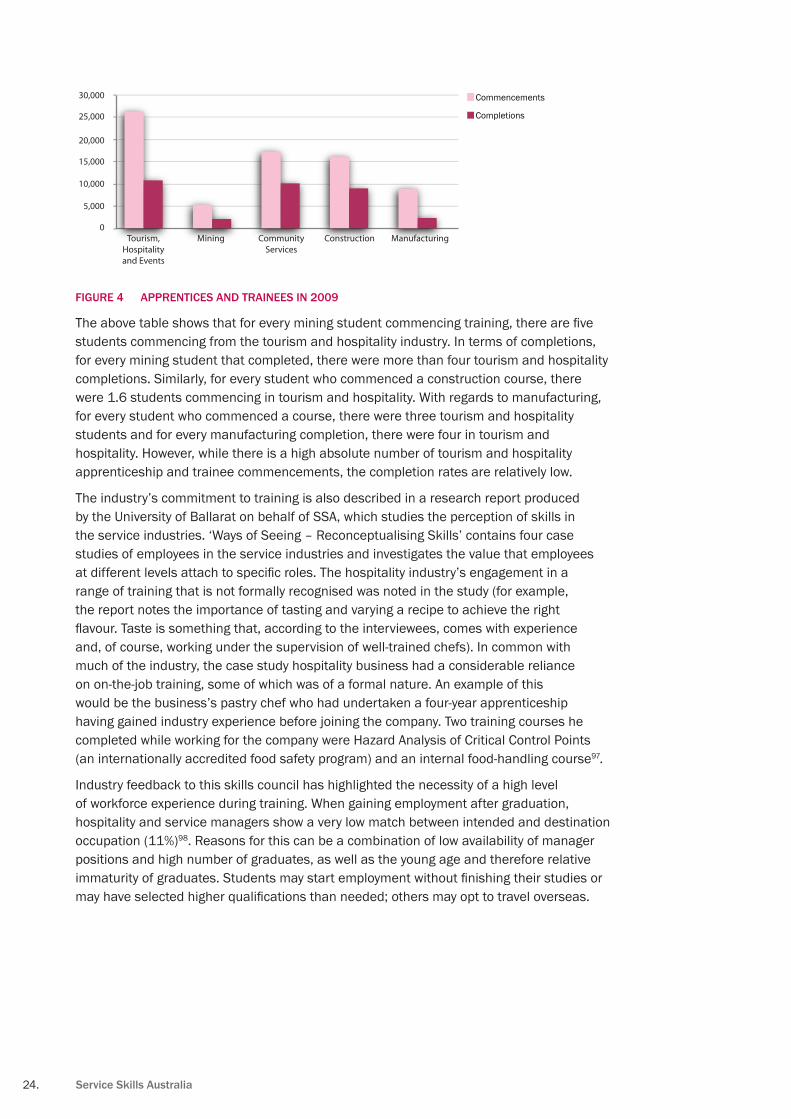
fIgure 4 ApprentICes And trAInees In 2009
The above table shows that for every mining student commencing training, there are five students commencing from the tourism and hospitality industry. In terms of completions, for every mining student that completed, there were more than four tourism and hospitality completions. Similarly, for every student who commenced a construction course, there were 1.6 students commencing in tourism and hospitality. With regards to manufacturing, for every student who commenced a course, there were three tourism and hospitality students and for every manufacturing completion, there were four in tourism and hospitality. However, while there is a high absolute number of tourism and hospitality apprenticeship and trainee commencements, the completion rates are relatively low.
The industry’s commitment to training is also described in a research report produced by the University of Ballarat on behalf of SSA, which studies the perception of skills in the service industries. ‘Ways of Seeing – Reconceptualising Skills’ contains four case studies of employees in the service industries and investigates the value that employees at different levels attach to specific roles. The hospitality industry’s engagement in a range of training that is not formally recognised was noted in the study (for example, the report notes the importance of tasting and varying a recipe to achieve the right flavour. Taste is something that, according to the interviewees, comes with experience and, of course, working under the supervision of well-trained chefs). In common with much of the industry, the case study hospitality business had a considerable reliance on on-the-job training, some of which was of a formal nature. An example of this would be the business’s pastry chef who had undertaken a four-year apprenticeship having gained industry experience before joining the company. Two training courses he completed while working for the company were Hazard Analysis of Critical Control Points (an internationally accredited food safety program) and an internal food-handling course97.
Industry feedback to this skills council has highlighted the necessity of a high level of workforce experience during training. When gaining employment after graduation, hospitality and service managers show a very low match between intended and destination occupation (11%)98. Reasons for this can be a combination of low availability of manager positions and high number of graduates, as well as the young age and therefore relative immaturity of graduates. Students may start employment without finishing their studies or may have selected higher qualifications than needed; others may opt to travel overseas.
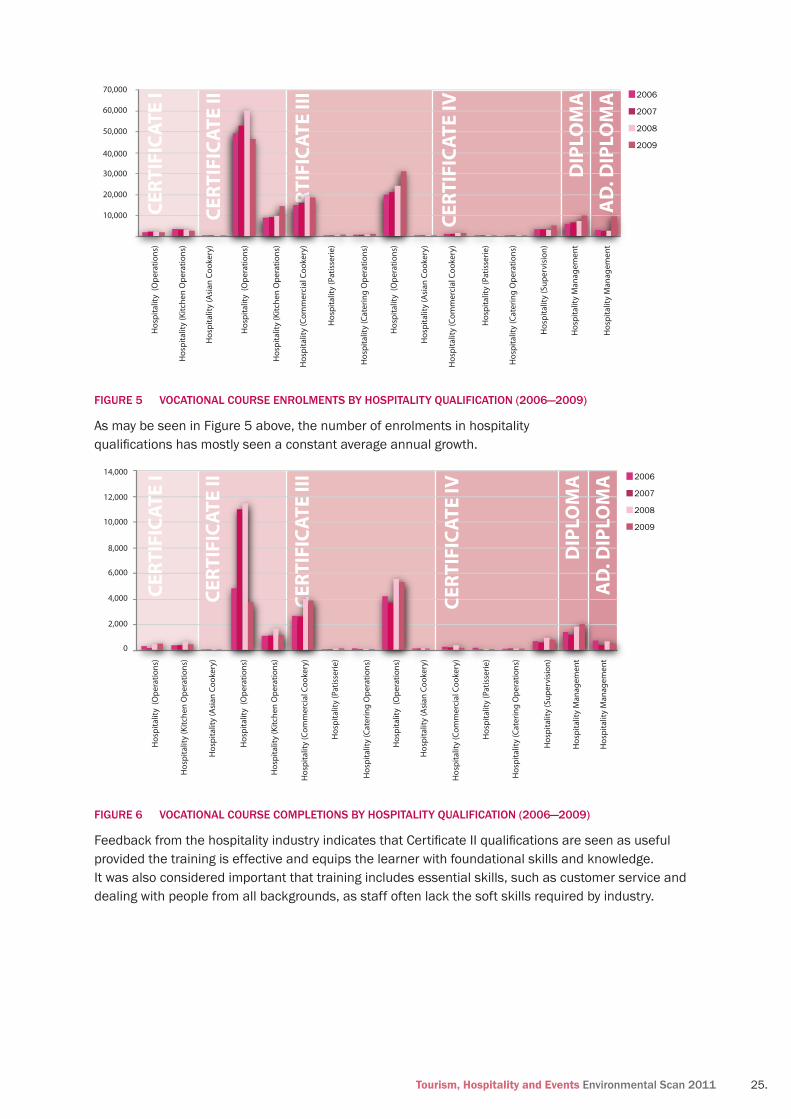
Tourism, Hospitality and Events environmental scan 2011 25.
CERT
IFIC
ATE
III
CERT
IFIC
ATE
IV
DIP
LOM
AA
D. D
IPLO
MA
CERT
IFIC
ATE
I
CERT
IFIC
ATE
II70,000
60,000
50,000
40,000
30,000
20,000
10,000
Hos
pita
lity
(Asi
an C
ooke
ry)
Hos
pita
lity
(Asi
an C
ooke
ry)
Hos
pita
lity
(Pat
isse
rie)
Hos
pita
lity
(Pat
isse
rie)
Hos
pita
lity
Man
agem
ent
Hos
pita
lity
Man
agem
ent
Hos
pita
lity
(Sup
ervi
sion
)
Hos
pita
lity
(Kitc
hen
Ope
ratio
ns)
Hos
pita
lity
(Kitc
hen
Ope
ratio
ns)
Hos
pita
lity
(Cat
erin
g O
pera
tions
)
Hos
pita
lity
(Cat
erin
g O
pera
tions
)
Hos
pita
lity
(Ope
ratio
ns)
Hos
pita
lity
(Ope
ratio
ns)
Hos
pita
lity
(Ope
ratio
ns)
Hos
pita
lity
(Com
mer
cial
Coo
kery
)
Hos
pita
lity
(Com
mer
cial
Coo
kery
)
2006
2007
2008
2009
FigUre 5 Vocational coUrse enrolments by hosPitality qUaliFication (2006―2009)
As may be seen in Figure 5 above, the number of enrolments in hospitality qualifications has mostly seen a constant average annual growth.
CERT
IFIC
ATE
III
CERT
IFIC
ATE
IV
DIP
LOM
AA
D. D
IPLO
MA
CERT
IFIC
ATE
I
CERT
IFIC
ATE
II14,000
12,000
10,000
8,000
6,000
4,000
2,000
0
Hos
pita
lity
(Asi
an C
ooke
ry)
Hos
pita
lity
(Asi
an C
ooke
ry)
Hos
pita
lity
(Pat
isse
rie)
Hos
pita
lity
(Pat
isse
rie)
Hos
pita
lity
Man
agem
ent
Hos
pita
lity
Man
agem
ent
Hos
pita
lity
(Sup
ervi
sion
)
Hos
pita
lity
(Kitc
hen
Ope
ratio
ns)
Hos
pita
lity
(Kitc
hen
Ope
ratio
ns)
Hos
pita
lity
(Cat
erin
g O
pera
tions
)
Hos
pita
lity
(Cat
erin
g O
pera
tions
)
Hos
pita
lity
(Ope
ratio
ns)
Hos
pita
lity
(Ope
ratio
ns)
Hos
pita
lity
(Ope
ratio
ns)
Hos
pita
lity
(Com
mer
cial
Coo
kery
)
Hos
pita
lity
(Com
mer
cial
Coo
kery
)
2006
2007
2008
2009
FigUre 6 Vocational coUrse comPletions by hosPitality qUaliFication (2006―2009)
Feedback from the hospitality industry indicates that Certificate II qualifications are seen as useful provided the training is effective and equips the learner with foundational skills and knowledge. It was also considered important that training includes essential skills, such as customer service and dealing with people from all backgrounds, as staff often lack the soft skills required by industry.

26. service skills Australia
CERT
IFIC
ATE
III
CERT
IFIC
ATE
IV
DIP
LOM
A
AD
. DIP
LOM
A
CERT
IFIC
ATE
ICE
RTIF
ICAT
E II
3,500
3,000
4,500
4,000
2,500
2,000
1,500
1,000
500
2006
2007
2008
2009
Tour
ism
(Aus
tral
ian
Indi
geno
us C
ultu
re)
Tour
ism
(Ope
ratio
ns)
Tour
ism
(Ope
ratio
ns)
Tour
ism
(Ope
ratio
ns)
Tour
ism
(Ope
ratio
ns)
Tour
ism
(Ret
ail T
rave
l Sal
es)
Tour
ism
(Tou
r Who
lesa
ling)
Tour
ism
(Vis
itor
Info
rmat
ion
Serv
ices
)
Tour
ism
(Att
ract
ions
an
d Th
eme
Park
s)
Tour
ism
(Nat
ural
and
Cu
ltura
l Her
itage
)
Tour
ism
(Mar
ketin
g an
d Pr
oduc
t Dev
elop
men
t)
Tour
ism
Man
agem
ent
Even
ts
Even
ts
Even
t Man
agem
ent
Tour
ism
(Gui
ding
)
Tour
ism
(Gui
ding
)
Tour
ism
(Sal
es &
Mar
ketin
g)
Tour
ism
(Int
erna
tiona
l Re
tail
Trav
el S
ales
)
Mee
tings
and
Eve
nts
Vocational course enrolments by tourism quali�cation (2006-2009)
FigUre 7 Vocational coUrse enrolments by toUrism qUaliFication (2006-2009)
CERT
IFIC
ATE
III
CERT
IFIC
ATE
IV
DIP
LOM
A
AD
. DIP
LOM
A
CERT
IFIC
ATE
ICE
RTIF
ICAT
E II
1,400
1,200
1,800
2,000
1,600
1,000
800
600
400
200
2006
2007
2008
2009
Tour
ism
(Aus
tral
ian
Indi
geno
us C
ultu
re)
Tour
ism
(Ope
ratio
ns)
Tour
ism
(Ope
ratio
ns)
Tour
ism
(Ope
ratio
ns)
Tour
ism
(Ope
ratio
ns M
anag
emen
t)
Tour
ism
(Ret
ail T
rave
l Sal
es)
Tour
ism
(Tou
r Who
lesa
ling)
Tour
ism
(Vis
itor
Info
rmat
ion
Serv
ices
)
Tour
ism
(Att
ract
ions
an
d Th
eme
Park
s)
Tour
ism
(Nat
ural
and
Cu
ltura
l Her
itage
)
Tour
ism
(Mar
ketin
g an
d Pr
oduc
t Dev
elop
men
t)
Tour
ism
Man
agem
ent
Even
ts
Even
t Man
agem
ent
Tour
ism
(Gui
ding
)
Tour
ism
(Gui
ding
)
Tour
ism
(Sal
es &
Mar
ketin
g)
Tour
ism
(Int
erna
tiona
l Re
tail
Trav
el S
ales
)
Mee
tings
and
Eve
nts
Vocational course completions by tourism quali�cation (2006-2009)
FigUre 8 Vocational coUrse comPletions by toUrism qUaliFication (2006-2009)

Tourism, Hospitality and Events environmental scan 2011 27.
900
800
700
600
500
400
300
200
100
0Caravan Park
OperationsCaravan Park
OperationsCaravan Park
Operations Caravan Park Management
2006
2007
2008
2009
CERT
IFIC
ATE
III
CERT
IFIC
ATE
IV
DIP
LOM
A
CERT
IFIC
ATE
II
FigUre 9 Vocational coUrse enrolments by caraVan Park qUaliFication (2006-2009)
Vocational course completions by caravan park quali�cations (2006-2009)
450
400
350
300
250
200
150
100
50
0 Caravan Park
OperationsCaravan Park
OperationsCaravan Park
OperationsCaravan Park Management
2006
2007
2008
2009
CERT
IFIC
ATE
III
CERT
IFIC
ATE
IV
DIP
LOM
A
CERT
IFIC
ATE
II
FigUre 10 Vocational coUrse comPletions by caraVan Park qUaliFications (2006-2009)
As a result of the review of THC04 Caravan Industry Training Package, the contents of the training package were absorbed as components of other relevant training packages.
The qualifications in Holiday Parks and Resorts were subsumed into • SIT07 Tourism, Hospitality and Events Training Package.
The qualifications in recreational vehicle manufacturing and recreational vehicle • servicing were subsumed into manufacturing training packages.
The qualifications in recreational vehicle and accessories retailing were removed • due to poor take-up and given the existing option to achieve similar and appropriate qualifications through SIT07 Retail Services or automotive training packages.
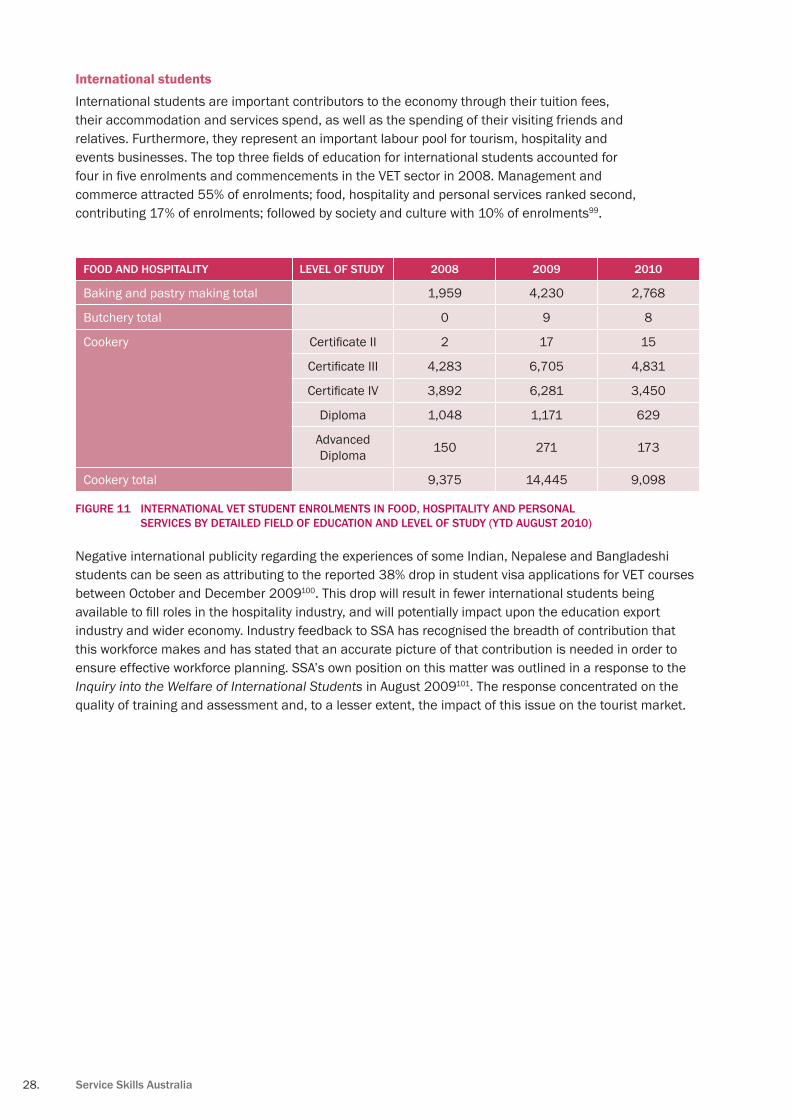
28. service skills Australia
International students
International students are important contributors to the economy through their tuition fees, their accommodation and services spend, as well as the spending of their visiting friends and relatives. Furthermore, they represent an important labour pool for tourism, hospitality and events businesses. The top three fields of education for international students accounted for four in five enrolments and commencements in the VET sector in 2008. Management and commerce attracted 55% of enrolments; food, hospitality and personal services ranked second, contributing 17% of enrolments; followed by society and culture with 10% of enrolments99.
food And hospItAlIty level of study 2008 2009 2010
Baking and pastry making total 1,959 4,230 2,768
Butchery total 0 9 8
Cookery Certificate II 2 17 15
Certificate III 4,283 6,705 4,831
Certificate IV 3,892 6,281 3,450
Diploma 1,048 1,171 629
Advanced Diploma 150 271 173
Cookery total 9,375 14,445 9,098
fIgure 11 InternAtIonAl vet student enrolments In food, hospItAlIty And personAl servICes by detAIled fIeld of eduCAtIon And level of study (ytd August 2010)
Negative international publicity regarding the experiences of some Indian, Nepalese and Bangladeshi students can be seen as attributing to the reported 38% drop in student visa applications for VET courses between October and December 2009100. This drop will result in fewer international students being available to fill roles in the hospitality industry, and will potentially impact upon the education export industry and wider economy. Industry feedback to SSA has recognised the breadth of contribution that this workforce makes and has stated that an accurate picture of that contribution is needed in order to ensure effective workforce planning. SSA’s own position on this matter was outlined in a response to the Inquiry into the Welfare of International Students in August 2009101. The response concentrated on the quality of training and assessment and, to a lesser extent, the impact of this issue on the tourist market.
Tourism, Hospitality and Events environmental scan 2011 29.
future dIreCtIons for endorsed Components of trAInIng pACkAgesThe SIT07 Tourism, Hospitality and Events Training Package will undergo a review in 2011 as part of the continuous improvement cycle. The review will be conducted via a staged approach, commencing with the Tourism components, Hospitality, and then Events.
The Tourism, Hospitality and Events Training Package Review may result in:
Updated Qualification Pathways - a review of the pathways between the • Tourism (Guiding) qualifications and the Outdoor Recreation qualifications in the SIS10 Sport, Fitness and Recreation Training Package will be conducted. The Events qualifications pathway has been highlighted for a thorough review.
Additional skills sets - skills set may be required for sustainability and innovation. •
Additional units of competencies - new units may be required for • emerging sectors, customer service, and eMarketing.
Rationalisation of units of competencies - it may be appropriate • to rationalise BSBWOR204A Use business technology and SITXCOM004A Communicate on the telephone.
Rationalisation of requisites - there may be opportunities to rationalise the pre-• requisite and co-requisite rules for the Hospitality units of competencies.
Policy-related considerations affecting the training packages:
The Streamlining of Training Packages policy, as proposed in VET Products for • 21st Century, will result in significant structural changes to training packages.
National Quality Council (NQC) policy allows information about the vocational • competence of trainers and assessors to be incorporated into training packages.
Implementation
The reviewed Tourism, Hospitality and Events Training Package will be the foundation for the development of the training package’s Quality Implementation Framework. The Quality Implementation Framework consists of two (2) components:
Training Package User Guide – The SIT07 User Guide: Doing it Right will be reviewed • and aligned with the reviewed Tourism, Hospitality and Events Training Package.
Right Way Program – The Right Way Program will be rolled out during • implementation. The Right Way Program for the reviewed Tourism, Hospitality and Events Training Package will include facility certification, professional development of trainers and assessors, and resource/material certification, as appropriate.
For detailed information on the continuous improvement of SIT07 Tourism, Hospitality and Events Training Package, refer to Appendix A. For a list of occupations in demand, refer to Appendix B.

30. service skills Australia
AppendIx A – report of ContInuous Improvement of sIt07 tourIsm, hospItAlIty And events
trAInIng pACkAge sIt07 tourIsm, hospItAlIty And events trAInIng pACkAge
brIef summAry of ChAnge Industry ImperAtIves/rAtIonAle for ChAnge
dAte submItted to nQC seCretArIAt
dAte endorsed by nQC/or IsC upgrAde
dAte mAde publIC through ntIs – thIs Is now mAnAged by tvet
Editorial changes made to the summary of units competency table and qualification rules lists in Volume 1 to ensure consistency in content across all tables.
Consistency with Training Package Development Standards.
Submitted as Version 2.1 via the ISC Upgrade process.
March 2010
hospitality:The following changes made to SIT10307 Certificate I in Hospitality (Kitchen Operations):
The unit SITHIND001A Develop and update • hospitality industry knowledge is removed from the core and added to the elective group of this qualification.
The unit SITXCOM002A Work in a socially • diverse environment is removed from the core and added to the elective group of this qualification.
Elective list broadened to include selection • from other Training Packages and accredited courses.
tourism:The following changes made to SIT30207 Certificate III in Tourism (Retail Travel Sales):
The unit BSBITU306A Produce Business • Documents is removed from the core and added to the elective group of this qualification.
Elective list broadened to include selection • from other Training Packages and accredited courses.
Compliance with Flexibility Policy.
Changes reviewed by the Industry Skills Council to ensure currency with industry standards, skill and workplace requirements.
Submitted as Version 2.2 via the interim ISC Upgrade process.
June 2010

Tourism, Hospitality and Events environmental scan 2011 31.
trAInIng pACkAge sIt07 tourIsm, hospItAlIty And events trAInIng pACkAge
brIef summAry of ChAnge Industry ImperAtIves/rAtIonAle for ChAnge
dAte submItted to nQC seCretArIAt
dAte endorsed by nQC/or IsC upgrAde
dAte mAde publIC through ntIs – thIs Is now mAnAged by tvet
The elective list for most qualifications broadened to include selection from other Training Packages and accredited courses.
hospitality:The following changes made to SIT20207 Certificate II in Hospitality:
Specialisation units re-categorised as elective • groups.
The following changes made to SIT30707 Certificate III in Hospitality:
Specialisation units re-categorised as elective • groups.
tourism:The following changes made to SIT30207 Certificate III in Tourism (Retail Travel Sales):
The following units are removed from • Specialisation Group A – International and added to the core of this qualification: SITTTSL003A Source and provide international destination information and advice, SITTTSL013A Construct normal international airfares, and SITTTSL014A Construct promotional international airfares.The following units are removed from the • core and added to the elective group of this qualification: BSBWOR204A Use business technology, SITXADM001A Perform office procedures, and SITXCOM004A Communicate on the telephone.
The following changes made to SIT30307 Certificate III in Tourism (Tour Wholesaling):
Specialisation units re-categorised as core • options.
The following changes made to SIT50107 Diploma of Tourism:
Specialisation units re-categorised as core • options.
events:The following changes made to SIT60207 Advanced Diploma of Events:
The following units are removed from the • core and added to the elective group of this qualification: SITXMPR005A Develop and manage marketing strategies, CUVADM08B Develop and manage public relations strategies.
Compliance with Flexibility Policy.
Changes reviewed by the Industry Skills Council to ensure currency with industry standards, skill and workplace requirements.
Submitted as Version 2.3 via the interim ISC Upgrade process.
January 2011
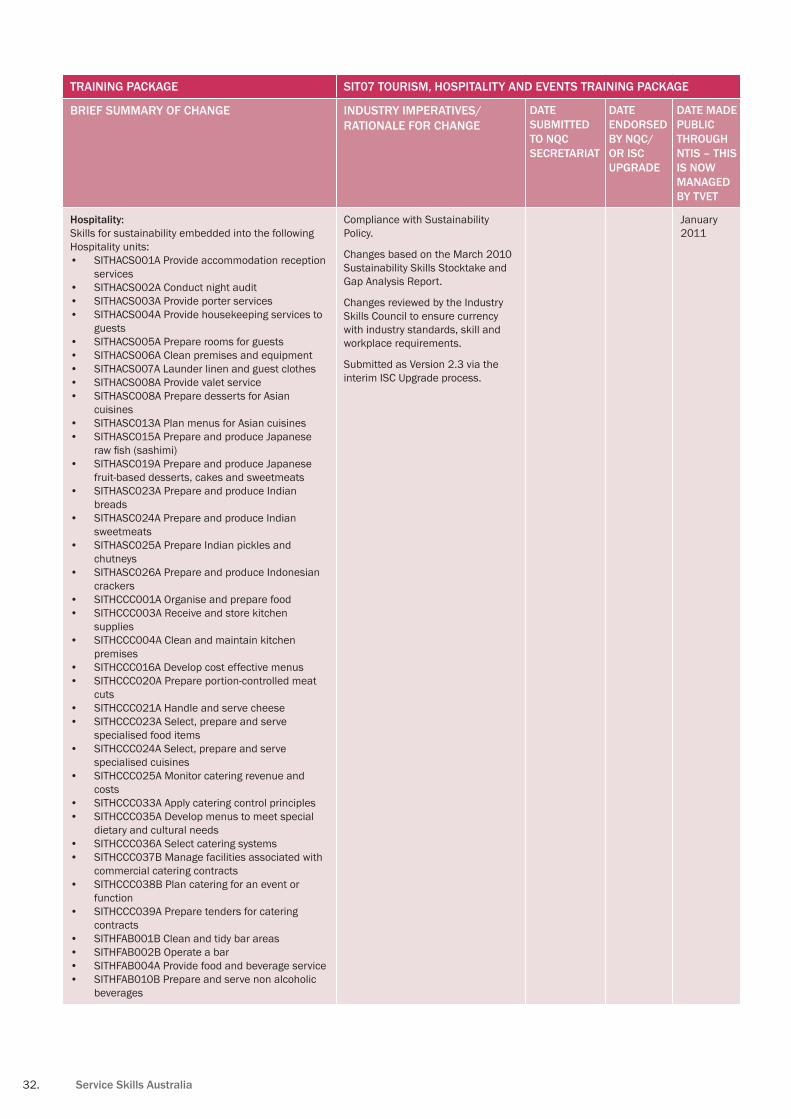
32. service skills Australia
trAInIng pACkAge sIt07 tourIsm, hospItAlIty And events trAInIng pACkAge
brIef summAry of ChAnge Industry ImperAtIves/rAtIonAle for ChAnge
dAte submItted to nQC seCretArIAt
dAte endorsed by nQC/or IsC upgrAde
dAte mAde publIC through ntIs – thIs Is now mAnAged by tvet
hospitality:Skills for sustainability embedded into the following Hospitality units:
SITHACS001A Provide accommodation reception • servicesSITHACS002A Conduct night audit• SITHACS003A Provide porter services• SITHACS004A Provide housekeeping services to • guestsSITHACS005A Prepare rooms for guests• SITHACS006A Clean premises and equipment• SITHACS007A Launder linen and guest clothes• SITHACS008A Provide valet service• SITHASC008A Prepare desserts for Asian • cuisinesSITHASC013A Plan menus for Asian cuisines• SITHASC015A Prepare and produce Japanese • raw fish (sashimi)SITHASC019A Prepare and produce Japanese • fruit-based desserts, cakes and sweetmeatsSITHASC023A Prepare and produce Indian • breadsSITHASC024A Prepare and produce Indian • sweetmeatsSITHASC025A Prepare Indian pickles and • chutneysSITHASC026A Prepare and produce Indonesian • crackersSITHCCC001A Organise and prepare food• SITHCCC003A Receive and store kitchen • suppliesSITHCCC004A Clean and maintain kitchen • premisesSITHCCC016A Develop cost effective menus• SITHCCC020A Prepare portion-controlled meat • cutsSITHCCC021A Handle and serve cheese• SITHCCC023A Select, prepare and serve • specialised food itemsSITHCCC024A Select, prepare and serve • specialised cuisinesSITHCCC025A Monitor catering revenue and • costsSITHCCC033A Apply catering control principles• SITHCCC035A Develop menus to meet special • dietary and cultural needsSITHCCC036A Select catering systems• SITHCCC037B Manage facilities associated with • commercial catering contractsSITHCCC038B Plan catering for an event or • functionSITHCCC039A Prepare tenders for catering • contractsSITHFAB001B Clean and tidy bar areas• SITHFAB002B Operate a bar• SITHFAB004A Provide food and beverage service• SITHFAB010B Prepare and serve non alcoholic • beverages
Compliance with Sustainability Policy.
Changes based on the March 2010 Sustainability Skills Stocktake and Gap Analysis Report.
Changes reviewed by the Industry Skills Council to ensure currency with industry standards, skill and workplace requirements.
Submitted as Version 2.3 via the interim ISC Upgrade process.
January 2011

Tourism, Hospitality and Events environmental scan 2011 33.
trAInIng pACkAge sIt07 tourIsm, hospItAlIty And events trAInIng pACkAge
brIef summAry of ChAnge Industry ImperAtIves/rAtIonAle for ChAnge
dAte submItted to nQC seCretArIAt
dAte endorsed by nQC/or IsC upgrAde
dAte mAde publIC through ntIs – thIs Is now mAnAged by tvet
SITHFAB012A Prepare and serve espresso • coffeeSITHFAB016A Plan and monitor espresso coffee • service
• SITHFAB227A Operate and monitor cellar systems
• SITHGAM004A Analyse and report on gaming machine data
• SITHIND001A Develop and update hospitality industry knowledge
tourism:Skills for sustainability embedded into the following Tourism units:• SITTGDE001A Work as a guide• SITTGDE003A Coordinate and operate a tour• SITTGDE004A Lead tour groups• SITTGDE005A Manage extended touring
programs• SITTGDE006A Prepare and present tour
commentaries or activities• SITTHPR301A Plan and organise daily work• SITTHPR302A Plan and organise in-house
recreational activities• SITTIND001A Develop and update tourism
industry knowledge• SITTIND202A Develop and update caravan
industry knowledge• SITTPPD001A Research, assess and develop
tourism products• SITTPPD003A Source and package tourism
products• SITTPPD004A Plan and implement minimal
impact operations• SITTPPD006A Plan and develop ecologically
sustainable tourism operations• SITTPPD007A Plan and develop culturally
appropriate tourism operations• SITTPPD008A Develop host community
awareness of tourism• SITTPPD009A Assess tourism opportunities for
local communities• SITTPPD010A Develop and implement local or
regional tourism plan• SITTTOP001A Allocate tour resources• SITTTOP002A Load touring equipment and
conduct pre departure checks• SITTTOP003A Operate and maintain a 4WD tour
vehicle• SITTTOP004A Set up and operate a camp site• SITTTOP005A Provide camp site catering• SITTTOP006A Operate tours in a remote area• SITTTSL001A Operate an online information
system• SITTTSL002A Access and interpret product
information

34. service skills Australia
trAInIng pACkAge sIt07 tourIsm, hospItAlIty And events trAInIng pACkAge
brIef summAry of ChAnge Industry ImperAtIves/rAtIonAle for ChAnge
dAte submItted to nQC seCretArIAt
dAte endorsed by nQC/or IsC upgrAde
dAte mAde publIC through ntIs – thIs Is now mAnAged by tvet
• SITTTSL003A Source and provide international destination information and advice.
• SITTTSL004A Source and provide Australian destination information and adviceSITTTSL005A Sell tourism products and • services
• SITTTSL006A Prepare quotations• SITTTSL007A Receive and process reservations• SITTTSL008A Book and coordinate supplier
services• SITTTSL009A Process travel related
documentation• SITTTSL010A Control reservations or
operations using a computerised system• SITTTSL011A Maintain a product inventory• SITTTSL012A Construct domestic airfares• SITTTSL013A Construct normal international
airfares• SITTTSL014A Construct promotional
international airfares• SITTTSL016A Administer billing and settlement
plan• SITTVAF001A Provide venue information and
assistance• SITTVAF003A Operate a ride location• SITTVAF005A Operate a games location
events:Skills for sustainability embedded into the following Events units:• SITXEVT001A Develop and update event
industry knowledge• SITXEVT002A Provide event staging support• SITXEVT003A Process and monitor event
registrations• SITXEVT004A Coordinate on site event
registrations• SITXEVT005A Organise in house events or
functions• SITXEVT007A Determine event feasibility• SITXEVT008A Plan and develop event
proposals and bids• SITXEVT009A Develop event concepts• SITXEVT010A Evaluate and address event
regulatory requirements• SITXEVT011A Develop crowd control plans and
procedures• SITXEVT012A Select event venues and sites• SITXEVT015A Manage exhibitions• SITXEVT016A Organise and monitor event
infrastructure• SITXEVT017A Provide on site event
management services• SITXEVT018A Develop a transport strategy for
an event
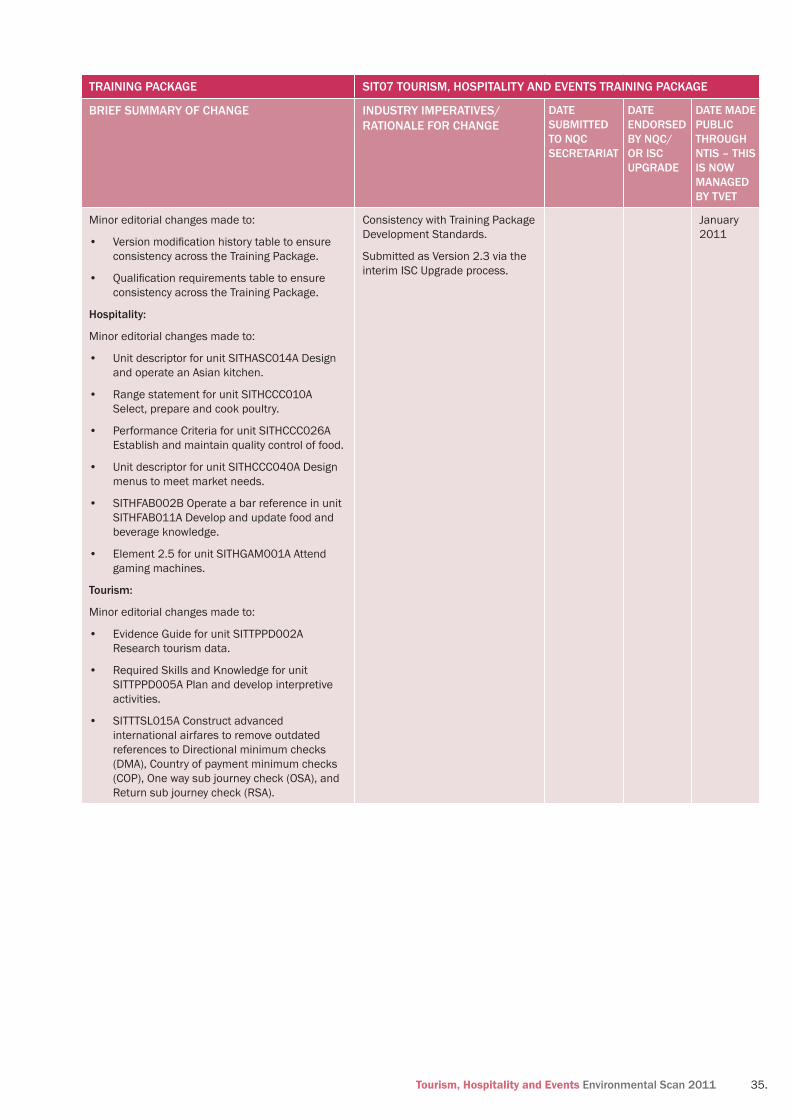
Tourism, Hospitality and Events environmental scan 2011 35.
trAInIng pACkAge sIt07 tourIsm, hospItAlIty And events trAInIng pACkAge
brIef summAry of ChAnge Industry ImperAtIves/rAtIonAle for ChAnge
dAte submItted to nQC seCretArIAt
dAte endorsed by nQC/or IsC upgrAde
dAte mAde publIC through ntIs – thIs Is now mAnAged by tvet
Minor editorial changes made to:
Version modification history table to ensure • consistency across the Training Package.
Qualification requirements table to ensure • consistency across the Training Package.
hospitality:
Minor editorial changes made to:
Unit descriptor for unit SITHASC014A Design • and operate an Asian kitchen.
Range statement for unit SITHCCC010A • Select, prepare and cook poultry.
Performance Criteria for unit SITHCCC026A • Establish and maintain quality control of food.
Unit descriptor for unit SITHCCC040A Design • menus to meet market needs.
SITHFAB002B Operate a bar reference in unit • SITHFAB011A Develop and update food and beverage knowledge.
Element 2.5 for unit SITHGAM001A Attend • gaming machines.
tourism:
Minor editorial changes made to:
Evidence Guide for unit SITTPPD002A • Research tourism data.
Required Skills and Knowledge for unit • SITTPPD005A Plan and develop interpretive activities.
SITTTSL015A Construct advanced • international airfares to remove outdated references to Directional minimum checks (DMA), Country of payment minimum checks (COP), One way sub journey check (OSA), and Return sub journey check (RSA).
Consistency with Training Package Development Standards.
Submitted as Version 2.3 via the interim ISC Upgrade process.
January 2011
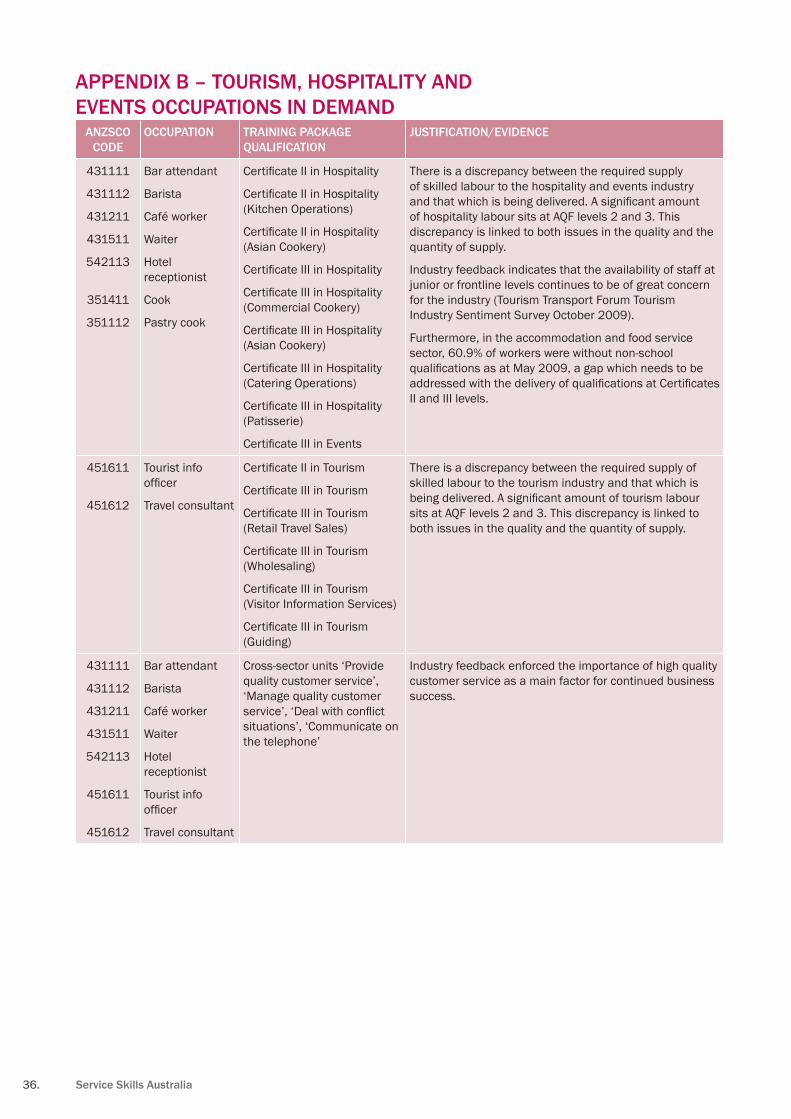
36. service skills Australia
AppendIx b – tourIsm, hospItAlIty And events oCCupAtIons In demAnd
AnZsCo Code
oCCupAtIon trAInIng pACkAge QuAlIfICAtIon
justIfICAtIon/evIdenCe
431111
431112
431211
431511
542113
351411
351112
Bar attendant
Barista
Café worker
Waiter
Hotel receptionist
Cook
Pastry cook
Certificate II in Hospitality
Certificate II in Hospitality (Kitchen Operations)
Certificate II in Hospitality (Asian Cookery)
Certificate III in Hospitality
Certificate III in Hospitality (Commercial Cookery)
Certificate III in Hospitality (Asian Cookery)
Certificate III in Hospitality (Catering Operations)
Certificate III in Hospitality (Patisserie)
Certificate III in Events
There is a discrepancy between the required supply of skilled labour to the hospitality and events industry and that which is being delivered. A significant amount of hospitality labour sits at AQF levels 2 and 3. This discrepancy is linked to both issues in the quality and the quantity of supply.
Industry feedback indicates that the availability of staff at junior or frontline levels continues to be of great concern for the industry (Tourism Transport Forum Tourism Industry Sentiment Survey October 2009).
Furthermore, in the accommodation and food service sector, 60.9% of workers were without non-school qualifications as at May 2009, a gap which needs to be addressed with the delivery of qualifications at Certificates II and III levels.
451611
451612
Tourist info officer
Travel consultant
Certificate II in Tourism
Certificate III in Tourism
Certificate III in Tourism (Retail Travel Sales)
Certificate III in Tourism (Wholesaling)
Certificate III in Tourism (Visitor Information Services)
Certificate III in Tourism (Guiding)
There is a discrepancy between the required supply of skilled labour to the tourism industry and that which is being delivered. A significant amount of tourism labour sits at AQF levels 2 and 3. This discrepancy is linked to both issues in the quality and the quantity of supply.
431111
431112
431211
431511
542113
451611
451612
Bar attendant
Barista
Café worker
Waiter
Hotel receptionist
Tourist info officer
Travel consultant
Cross-sector units ‘Provide quality customer service’, ‘Manage quality customer service’, ‘Deal with conflict situations’, ‘Communicate on the telephone’
Industry feedback enforced the importance of high quality customer service as a main factor for continued business success.
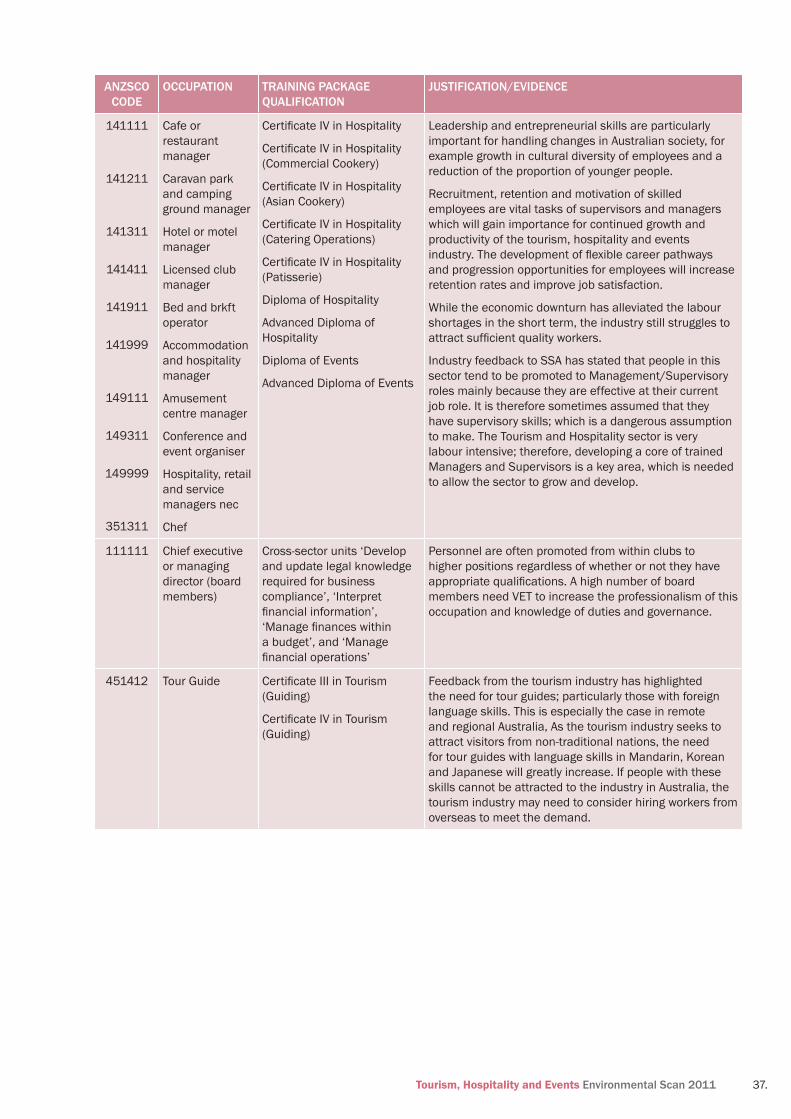
Tourism, Hospitality and Events environmental scan 2011 37.
AnZsCo Code
oCCupAtIon trAInIng pACkAge QuAlIfICAtIon
justIfICAtIon/evIdenCe
141111
141211
141311
141411
141911
141999
149111
149311
149999
351311
Cafe or restaurant manager
Caravan park and camping ground manager
Hotel or motel manager
Licensed club manager
Bed and brkft operator
Accommodation and hospitality manager
Amusement centre manager
Conference and event organiser
Hospitality, retail and service managers nec
Chef
Certificate IV in Hospitality
Certificate IV in Hospitality (Commercial Cookery)
Certificate IV in Hospitality (Asian Cookery)
Certificate IV in Hospitality (Catering Operations)
Certificate IV in Hospitality (Patisserie)
Diploma of Hospitality
Advanced Diploma of Hospitality
Diploma of Events
Advanced Diploma of Events
Leadership and entrepreneurial skills are particularly important for handling changes in Australian society, for example growth in cultural diversity of employees and a reduction of the proportion of younger people.
Recruitment, retention and motivation of skilled employees are vital tasks of supervisors and managers which will gain importance for continued growth and productivity of the tourism, hospitality and events industry. The development of flexible career pathways and progression opportunities for employees will increase retention rates and improve job satisfaction.
While the economic downturn has alleviated the labour shortages in the short term, the industry still struggles to attract sufficient quality workers.
Industry feedback to SSA has stated that people in this sector tend to be promoted to Management/Supervisory roles mainly because they are effective at their current job role. It is therefore sometimes assumed that they have supervisory skills; which is a dangerous assumption to make. The Tourism and Hospitality sector is very labour intensive; therefore, developing a core of trained Managers and Supervisors is a key area, which is needed to allow the sector to grow and develop.
111111 Chief executive or managing director (board members)
Cross-sector units ‘Develop and update legal knowledge required for business compliance’, ‘Interpret financial information’, ‘Manage finances within a budget’, and ‘Manage financial operations’
Personnel are often promoted from within clubs to higher positions regardless of whether or not they have appropriate qualifications. A high number of board members need VET to increase the professionalism of this occupation and knowledge of duties and governance.
451412 Tour Guide Certificate III in Tourism (Guiding)
Certificate IV in Tourism (Guiding)
Feedback from the tourism industry has highlighted the need for tour guides; particularly those with foreign language skills. This is especially the case in remote and regional Australia, As the tourism industry seeks to attract visitors from non-traditional nations, the need for tour guides with language skills in Mandarin, Korean and Japanese will greatly increase. If people with these skills cannot be attracted to the industry in Australia, the tourism industry may need to consider hiring workers from overseas to meet the demand.

38. service skills Australia
endnotes1 The Tourism and Hospitality Workforce Development Strategy, 2009, can be downloaded from the SSA website:
http://www.serviceskills.com.au/index.php?option=com_content&task=view&id=1015&Itemid=22872 National Long-Term Tourism Strategy Steering Committee, The Jackson Report,
informing the National Long-Term Tourism Strategy, 20093 Australian Government, Department of Resources, Energy and Tourism,
National Long-Term Tourism Strategy, Discussion Paper 20094 As also described in the ‘Australian Accommodation Industry Issues Agenda’,
The Hotel, Motel and Accommodation Association, January 20085 ABS 5249.0 Tourism Satellite Account 2006/076 ABS 5249.0 Tourism Satellite Account 2007/087 ABS 6291.0.55.003 Labour Force, Australia, Detailed, Quarterly, Table 04.
Employed persons by Industry, Trend, Seasonally Adjusted, Original8 Centre for the Economics of Education and Training, ‘Forecasts of labour and
skills requirements in the service industries, 2010-15’, 20109 ABS 8165.0 Counts of Australian Businesses, including Entries and Exits, June 2007-June 2009; The scope of
this release is significantly different to previously released (and discontinued) ABS business counts publications. In particular, this publication only includes businesses that actively traded in goods or services during the reference period in question, whereas the scope of previous releases focused on different populations.
10 ABS 8165.0 Counts of Australian Businesses, including Entries and Exits, June 2007-June 200911 ABS 5249.0 Tourism Satellite Account 2009-10, Table 12 Direct tourism employment, By industry people employed
in tourism, p.25; Please note that this figure (500,500) overlaps with the hospitality industry, where Accommodation, Cafes, restaurants and takeaway food services, and Clubs, pubs, taverns and bars account for 225,900 employees.
12 ABS 5249.0 Tourism Satellite Account 2009-10, Analysis of results13 ABS 5249.0 Tourism Satellite Account 2009-10, Table 12 Direct tourism
employment, By industry people employed in tourism.14 Tourism Research Australia, Travel by Australians, Quarterly results of the national visitor survey, September 2010.15 Tourism Research Australia, State of the Industry, 2010.16 Tourism Research Australia, State of the Industry, 2010.17 Travel Compensation Fund Annual Report 2009, Statistics of Participant Travel Agents 2004-2009,
p.13; Please note that these figures only account for those employers registered under the Travel Compensation Fund structure and, therefore, are not entirely representative of the travel sector.
18 Travel Compensation Fund Annual Report 2009, Employment – 2009 Participants, p.17; Please note that these figures only account for those employers registered under the Travel Compensation Fund structure and, therefore, are not entirely representative of the travel sector.
19 Skillsinfo.gov.au, Employment Outlook for Accommodation and Food Services, 201020 Tourism Research Australia, Business Events: Latest Industry Performance, 201021 Tourism Research Australia, Business Events: Latest Industry Performance, 201022 Tourism Research Australia, Business Events in Australia, 200923 National Long-Term Tourism Strategy Steering Committee, The Jackson Report,
informing the National Long-Term Tourism Strategy, 200924 ABS 5249.0 Tourism Satellite Account 2007/08, Table 2 - Tourism Industry GDP
by type of visitor, Table 7 – Tourism consumption by type of visitor25 8501.0 Retail Trade, Australia, December 2010, TABLE 11. Retail Turnover, State by Industry Subgroup, Original26 Skillsinfo.gov.au, Employment Outlook for Accommodation and Food Services, 201027 Tourism Research Australia, Tourism Forecasting Committee, Forecast 2010, Issue 2, November 2010, p.528 Also noted in analysis of national, state, regional and local tourism strategies and
plans, Cooperative Research Centre for Sustainable Tourism, 200829 Tourism Research Australia, State of the Industry, 2010.30 Tourism Research Australia, Tourism Forecasting Committee, Forecast 2010, Issue 2, November 2010, p.931 Tourism Transport Forum – MasterCard Industry Sentiment Survey, October 201032 It should be noted that the issues associated with changes in distribution of products and
services are something that many in the service industries are having to deal with33 Sustainable Tourism Cooperative Research Centre, Tourism Satellite Accounts 2007–08: Summary Spreadsheets34 Sustainable Tourism Cooperative Research Centre, Tourism Satellite Accounts 2007–08: Summary Spreadsheets
Tourism, Hospitality and Events environmental scan 2011 39.
35 8501.0 Retail Trade, Australia, December 2010, TABLE 11. Retail Turnover, State by Industry Subgroup, Original36 8501.0 Retail Trade, Australia, December 2010, TABLE 11. Retail Turnover, State by Industry Subgroup, Original37 ABS 8165.0 Counts of Australian Businesses, including entries and exits, June 200738 Sustainable Tourism Cooperative Research Centre, Tourism Satellite Accounts 2007–08: Summary Spreadsheets39 Tourism Research Australia, Regional Tourism Profile 2009/10, New South Wales40 ABS 8165.0 Counts of Australian Businesses, including entries and exits, June 200741 Tourism Research Australia, Regional Tourism Profiles 2009/10, Victoria, p.1-242 8501.0 Retail Trade, Australia, December 2010, TABLE 11. Retail Turnover, State by Industry Subgroup, Original43 Tourism Victoria, Environmentally Sustainable Tourism Strategic Plan 2009–201244 Service Skills Victoria, Your business is only as good as your people –
Best practice in the Victorian service industries, 2010.45 ABS 3222.0 Population projections, Australia, 2006 to 210146 8501.0 Retail Trade, Australia, December 2010, TABLE 11. Retail Turnover, State by Industry Subgroup, Original47 Tourism Research Australia, Regional Tourism Profile, 2009/10 Queensland48 ABS 3222.0 Population Projections, Australia, 2006 to 2101, Series B49 Business Council of Australia, Age can work: A business guide for supporting older workers, 200350 8501.0 Retail Trade, Australia, December 2010, TABLE 11. Retail Turnover, State by Industry Subgroup, Original51 Tourism Research Australia, Regional Tourism Profiles 2009/10, South Australia, p.152 South Australian Tourism Alliance Workforce Development Strategy 2007-201253 Government of South Australia, Training and Skills Commission, Skills for Jobs report, Tourism and Hospitality54 Government of South Australia, Training and Skills Commission, Skills for Jobs report, Tourism and Hospitality55 ABS 3222.0 Population Projections, Australia, 2006 to 2101 56 8501.0 Retail Trade, Australia, December 2010, TABLE 11. Retail Turnover, State by Industry Subgroup, Original57 Tourism Research Australia, Regional Tourism Profile 2009/10, Western Australia58 ABS 3222.0 Population Projections, Australia, 2006 to 2101, Series B59 ABS 3412.0 Migration Australia, 2006-0760 8501.0 Retail Trade, Australia, December 2010, TABLE 11. Retail Turnover, State by Industry Subgroup, Original61 Tourism Research Australia, Regional Tourism Profiles 2009/10, Tasmania62 Press release ‘Record Tourist Numbers Visiting Tasmania’, Michelle O’Byrne,
MP Minister for Tourism Wednesday, 17 June 200963 Tourism Research Australia, Regional Tourism Profiles 2009/10, Northern Territory, p.164 8501.0 Retail Trade, Australia, December 2010, TABLE 11. Retail Turnover, State by Industry Subgroup, Original65 ABS 3222.0 Population Projections, Australia, 2006 to 2101, Series B66 ABS 6202.0 Labour Force Australia, October 201067 NT News, 8 October 2010, Nick Calacouras,‘Highest rents are still in Top End’68 ABS 3412.0 Migration, Australia, 2007-08 69 8501.0 Retail Trade, Australia, December 2010, TABLE 11. Retail Turnover, State by Industry Subgroup, Original70 Tourism Research Australia , Regional Tourism Profiles, 2009/10, p.2 71 Tourism Research Australia, The future of domestic tourism in Australia February 2008, p172 Tourism Research Australia, Changing consumer behaviour: Impact on the Australian domestic tourism market, 200773 IBISWorld Industry Report H5731, Cafes and restaurants in Australia, October 201074 Sustainable Tourism Cooperative Research Centre, Environmentally
sustainable practices of Victorian tourism enterprises, 200775 Lowry, Molloy and McGlennon, 2008, Future Skill Needs: Projections and
Employers’ Views, Australian Bulletin of Labour, Vol 34 No 276 Shah & Bourke, 2005, Skills Shortages: Concepts, Measurements and
Policy Responses Australian Bulletin of Labour, Vol 31 No 177 Skillsinfo.gov.au, Employment Outlook for Accommodation and Food Services, 201078 Centre for the Economics of Education and Training, ‘Forecasts of labour and
skills requirements in the service industries, 2010-15’, 201079 Centre for the Economics of Education and Training ‘Productivity in the Service Industries’ 201080 ABS 3235.0 Population by Age and Sex, Regions of Australia, 2009

40. service skills Australia
81 ABS 3222.0 Population Projections, Australia 2006 to 210182 ABS 3222.0 Population Projections, Australia, 2006 to 2101 83 Skillsinfo.gov.au, Employment Outlook for Accommodation and Food Services, 201084 Australian Government, Department of Resources, Energy and Tourism,
National Long-Term Tourism Strategy, Discussion Paper85 National Long-Term Tourism Strategy Steering Committee, The Jackson Report,
Informing the National Long-Term Tourism Strategy, 200986 Tourism Transport Forum Tourism Industry Sentiment Survey, October 200987 National Long-Term Tourism Strategy Steering Committee, The Jackson Report,
Informing the National Long-Term Tourism Strategy, 200988 http://www.enterpriseconnect.gov.au/Pages/AlternateHome.aspx89 http://www.innovation.gov.au/Section/Innovation/Pages/CommercialisationAustralia.aspx99 OECD, Studies on SMEs, entrepreneurship and innovation, 201091 Department of Education, Employment and Workplace Relations
‘Transforming Australia’s Higher Education System’ 200992 For further information on the project and full copies of the research reports, please refer
to http://www.serviceskills.com.au/completion-rates-for-the-service-industries93 Service Industries VET in Schools project progress report, October 2010, prepared
for Service Skills Australia by Service Skills South Australia94 As also noted in Outcomes: Tourism and Hospitality Industry Workforce Development Forums,
Service Skills Australia, 2009 and ClubsNSW, 2010 Environmental Scan, Registered Clubs95 As also noted in Outcomes: Tourism and Hospitality Industry Workforce
Development Forums, Service Skills Australia, 200996 NCVER Vocational Course enrolments and completions 2005 to 2008; information collected by NCVER encompasses
TAFE institutes, some universities, secondary schools offering VET, industry organisations, Adult Migrant Education Scheme providers, private enterprises in receipt of government funding for training, agricultural colleges, community education providers and other government providers, but no private training organisations which do not receive government funding. NCVER Australian vocational education and training statistics: Explained, updated March 2008
97 University of Ballarat ‘Ways of seeing – reconceptualising skills’, Erica Smith and Julian Teicher, 201098 NCVER Is VET vocational? The relevance of training to vocational education and training
graduates, 2008; please note that the figures are based on the student outcomes survey, which is conducted approximately six months after the end of training
99 Australian Education International, International Student Enrolments in the VET sector by broad and detailed field of education and level of study, 2008-2010
100 As widely reported in the Australian media in February 2010. http://www.theage.com.au/national/education/overseas-student-applications-rise-despite-drop-from-india-20100202-nb56.html
101 A full version of the submission can be downloaded from the Publications and Reports section of the SSA website: http://www.serviceskills.com.au/index.php?option=com_content&task=view&id=849&Itemid=2241


published by Service Skills Australia
2011