TOP 20 HISPANIC MARKET...
55
TOP 20 HISPANIC MARKET PROFILES 2016/2017 Albuquerque Chicago Dallas Denver El Paso Fresno Harlingen Houston Los Angeles Miami New York Orlando Philadelphia Phoenix Sacramento San Antonio San Diego San Francisco Tampa Washington DC
Transcript of TOP 20 HISPANIC MARKET...

TOP 20 HISPANIC MARKET PROFILES 2016/2017
Albuquerque Chicago Dallas Denver El Paso Fresno Harlingen Houston Los Angeles Miami New York Orlando Philadelphia Phoenix Sacramento San Antonio San Diego
San Francisco Tampa Washington DC
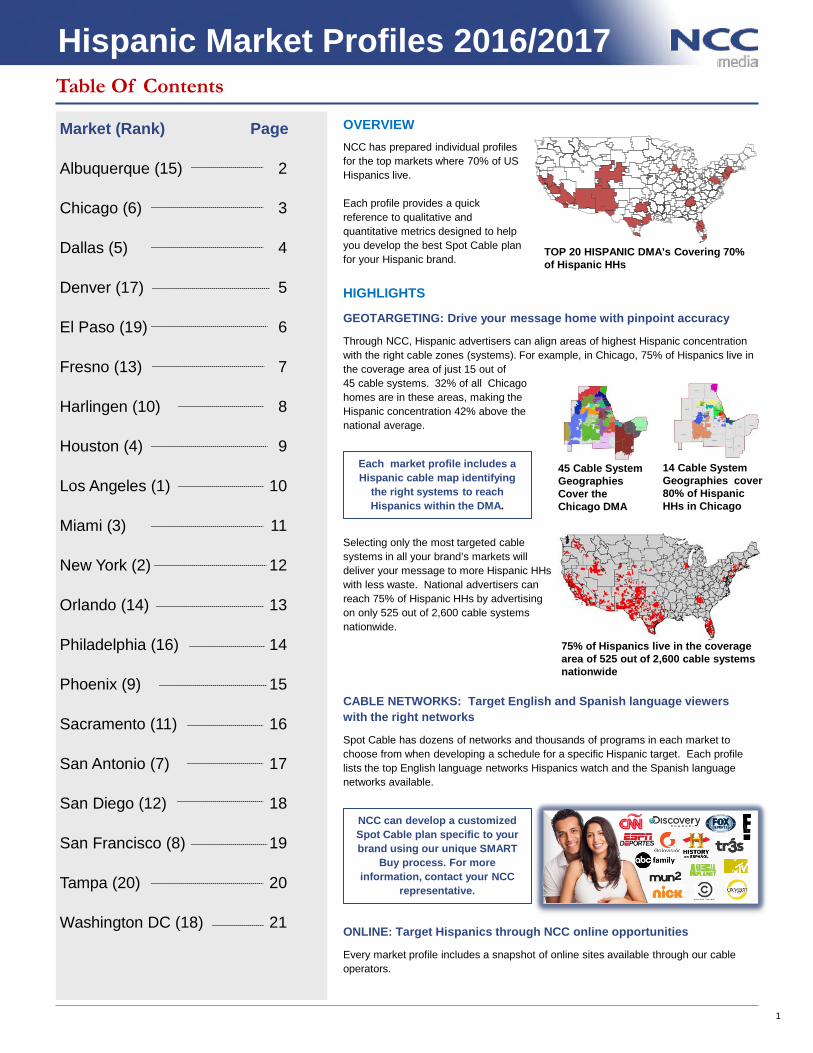
Table Of Contents
Hispanic Market Profiles 2016/2017
OVERVIEW NCC has prepared individual profiles for the top markets where 70% of US Hispanics live. Each profile provides a quick reference to qualitative and quantitative metrics designed to help you develop the best Spot Cable plan for your Hispanic brand.
TOP 20 HISPANIC DMA’s Covering 70% of Hispanic HHs
HIGHLIGHTS
GEOTARGETING: Drive your message home with pinpoint accuracy
Through NCC, Hispanic advertisers can align areas of highest Hispanic concentration with the right cable zones (systems). For example, in Chicago, 75% of Hispanics live in the coverage area of just 15 out of 45 cable systems. 32% of all Chicago homes are in these areas, making the Hispanic concentration 42% above the national average.
45 Cable System Geographies Cover the Chicago DMA
14 Cable System Geographies cover 80% of Hispanic HHs in Chicago
75% of Hispanics live in the coverage area of 525 out of 2,600 cable systems nationwide
Selecting only the most targeted cable systems in all your brand’s markets will deliver your message to more Hispanic HHs with less waste. National advertisers can reach 75% of Hispanic HHs by advertising on only 525 out of 2,600 cable systems nationwide.
Each market profile includes a Hispanic cable map identifying
the right systems to reach Hispanics within the DMA.
CABLE NETWORKS: Target English and Spanish language viewers with the right networks
Spot Cable has dozens of networks and thousands of programs in each market to choose from when developing a schedule for a specific Hispanic target. Each profile lists the top English language networks Hispanics watch and the Spanish language networks available.
NCC can develop a customized Spot Cable plan specific to your brand using our unique SMART
Buy process. For more information, contact your NCC
representative.
ONLINE: Target Hispanics through NCC online opportunities
Every market profile includes a snapshot of online sites available through our cable operators.
Market (Rank) Page
Albuquerque (15) 2
Chicago (6) 3
Dallas (5) 4
Denver (17) 5
El Paso (19) 6
Fresno (13) 7
Harlingen (10) 8
Houston (4) 9
Los Angeles (1) 10
Miami (3) 11
New York (2) 12
Orlando (14) 13
Philadelphia (16) 14
Phoenix (9) 15
Sacramento (11) 16
San Antonio (7) 17
San Diego (12) 18
San Francisco (8) 19
Tampa (20) 20
Washington DC (18) 21
1

42%
8% 19%
31%
1%
English Ad Supported Cable OrigSpanish Cable OriginationEnglish BroadcastSpanish BroadcastSpanish Independents
2%
38%
40%
10%
10%
English AndSpanish Equally
English More ThanSpanish
English Only
Spanish MoreThan English
Spanish Only
M A R K E T P R O F I L E
ALBUQUERQUE
Hispanic Market Rank 15 Albuquerque Market Snapshot
HH % Penetration Hispanic TV HHs 257,080 38.8% Hispanic Population 2+ 830,298 43.2% Hispanic Wired Cable, Telco & Satellite 192,660 74.9% Hispanic Wired Cable & Telco 55,510 21.6% Hispanic Median Age 31.2 Hispanic Median Income $39,755
Albuquerque Cable Footprint
Galavision
Covers 81.5% of Hispanic Americans in DMA
Other Cable
No Cable
Hispanic HH Penetration in Cable System Coverage Areas System Name % Conc % of HA HHs/Mkt Comcast/South Zone, NM 59.58% 20.85% Comcast/North Zone, NM 34.96% 16.11% Comcast/East Zone, NM 31.86% 10.17% Comcast/Santa Fe, NM 41.95% 7.83% Comcast/Rio Rancho, NM 33.79% 4.15% Comcast/Hobbs, NM 46.76% 3.5% Comcast/Roswell, NM 43.53% 3.24% Ad Systems/Espanola, NM 63.23% 3.02% Comcast/Farmington, NM 19.26% 2.5% Comcast/Alamogordo-Ruidoso, NM 25.76% 2.42% Comcast/Las Vegas, NM 77.54% 2.19% Prime Media/Artesia, NM 41.79% 2.07% Comcast/Deming, NM 54.94% 1.83% Comcast/Silver City, NM 42.37% 1.64%
Targeted Programming
Network Program Name HA A25-54 RTG AMC WALKING DEAD 9.99 MTV TEEN MOM 2.84 USA WWE ENTERTAINMENT 2.08 VH1 LOVE AND HIP HOP 2.06 E! KEEPING UP KARDASHIANS 1.90 BRAVO VANDERPUMP RULES 1.58 DISC GOLD RUSH 1.36 HGTV FIXER UPPER 1.16 LIFE LITTLE WOMEN LA 1.13
Online Market Snapshot – Xfinity Hispanic Cume 80,000
Female 58.8%
Male 41.3%
Spot Cable Networks to Reach Hispanic Americans To Read: Hispanic Americans A25-54 in wired cable HHs are 67% more likely to watch MTV than the average Adult in Albuquerque
Hispanic A25-54 Composition Index
NCC Media in Albuquerque
Share of TV Viewing among Hispanic HHs
Language Preference
1% 1%
58% 41%
Puerto Rican
Cuban
Mexican
Other
Hispanic Origin
Insertable Sp. Language Nets
Source: Mkt Snapshot -Nielsen UE, Feb’16 & US Census'15; Language, Cable Networks-Alb/Santa Fe, Oc14-Se15 Scarborough; Hispanic Origin-US Census'15/Claritas; Cable System Pen-US Census'15, CableTrack ‘16; Share of Viewing, Targeted Programming-Nielsen N-Power Feb'16 (Nat’l data); NCC Media -CableTrack ‘16; Online Mkt Snapshot-Scarborough Albuquerque Oct14-Sep15; Acculturated Hispanic: Hispanic Adults 18-49 Prefer to Speak English More Than Spanish or English Only
Local HA Demographic & Consumer Profile Compared to Acculturated
% of HA in Market
% of Acculturated
Hispanics HHI $50k+ 39.6% 48.6% 1 or more Children in HH 56.8% 68.2% Own Residence 54.1% 54.2% Any College 19.1% 29.9% 2+ times to Sit Down Restaurant Past Mo. 63.9% 59.8% 4+ times to a Quick Serve Restaurant Past Mo. 64.6% 72.0% Bought New Vehicle 42.4% 43.0% Used Credit Card in Past 3 Months 76.0% 78.5% Taken 1+ plane trips past yr. 39.5% 39.3% To Read: Among Albuquerque Hispanic Americans A18+ 39.6% have a Household Income of $50,000+ compared to 48.6% Acculturated Hispanic Americans in the market.
167 135 133 127 124 121 111 108 105 102
020406080
100120140160180
2

35%
10% 18%
37%
1%
English Ad Supported Cable OrigSpanish Cable OriginationEnglish BroadcastSpanish BroadcastSpanish Independents
2%
36%
27%
19%
16%
English AndSpanish Equally
English More ThanSpanish
English Only
Spanish MoreThan English
Spanish OnlyLanguage Preference
10%
1%
79%
10% Puerto Rican
Cuban
Mexican
Other
Hispanic Origin
M A R K E T P R O F I L E
CHICAGO
Hispanic Market Rank 6 Chicago Market Snapshot
HH % Penetration Hispanic TV HHs 528,900 15.2% Hispanic Population 2+ 2,110,675 21.7% Hispanic Wired Cable, Telco & Satellite 434,710 82.2% Hispanic Wired Cable & Telco 220,800 41.7% Hispanic Median Age 27.7 Hispanic Median Income $48,444
FOX Deportes Galavision History en Español
Hispanic HH Penetration in Cable System Coverage Areas
System Name % Conc. % of HA HHs/Mkt Comcast/Chicago Southwest, IL 33.44% 11.88% Comcast/Oak Park, IL 28.17% 8.27% Comcast/Chicago Central, IL 27.94% 8.06% Comcast/Chicago Northwest, IL 25.61% 6.43% Comcast/Aurora-Naperville, IL 18.24% 4.17% Comcast/Oak Park U-verse, IL 28.12% 3.04% Comcast/RCN-Lakefront, IL 11.45% 3.03% Comcast/Gurnee, IL 28.63% 2.86% Comcast/Joliet West, IL 16.05% 2.8% Comcast/City North, IL 8.63% 2.63% Comcast/Chicago SouthWest U-verse, IL 33.81% 2.41% Comcast/Chicago So-Central U-verse, IL 21.77% 2.25% Comcast/Bloomingdale, IL 18.87% 2.22% Comcast/North Lake, IN 21.03% 2.16% Comcast/Orland Park, IL 10.12% 2.03% Comcast/Mt. Prospect, IL 11.74% 1.95% Comcast/Chicago South, IL 8.75% 1.77% Comcast/South Lake Indiana, IN 8.38% 1.73% Comcast/Chicago City N-NW U-verse, IL 15.91% 1.61% Comcast/South Suburban, IL 8.86% 1.58% Comcast/McHenry, IL 11.19% 1.53% Comcast/Elgin, IL 28.98% 1.51% Comcast/Joliet W-Frankfort U-verse, IL 12.0% 1.49% Comcast/Crystal Lake, IL 10.8% 1.34%
Targeted Programming
Network Program Name HA A25-54 RTG AMC WALKING DEAD 9.43 HIST VIKINGS 2.78 MTV SHANNARA 2.41 VH1 LOVE AND HIP HOP 2.40 BRAVO REAL HOUSEWIVES ATLANTA 2.25 USA WWE SMACKDOWN 1.32 HGTV FIXER UPPER 1.06 E! HOLLYWOOD MEDIUM 0.84 LIFE LITTLE WOMEN LA 0.73
Online Market Snapshot – Xfinity Hispanic Page Views 3.0 million
Hispanic Unique Visitors 107,000 Female 50.0%
HA Time Spent (min/visitor) 26.5 Male 50.0%
Spot Cable Networks to Reach Hispanic Americans To Read: Hispanic Americans A18+ in wired cable HHs are 413% more likely to watch Galavision than the average Adult in Chicago
Hispanic A18+ Composition Index
NCC Media in Chicago
Chicago Cable Footprint Covers 80% of Hispanic Americans in DMA
Other Cable
No Cable
Share of TV Viewing among Hispanic HHs in Chicago
Insertable Sp. Language Nets CNN en Español Discovery en Español ESPN Deportes
TR3S
Source: Mkt Snapshot - Nielsen UE, Feb’16 & US Census'15; Language & Cable Networks - Chicago, Se14-Au15 Scarborough; Hispanic Origin - US Census'15/Claritas; Cable System Pen - US Census'15 & CableTrack ‘16; Share of Viewing & Targeted Programming - Nielsen N-Power Feb'16 (LPM); NCC Media - CableTrack ‘16; Online Mkt Snapshot - ComScore Apr’16; Acculturated Hispanic: Hispanic Adults 18-49 Prefer to Speak English More than Spanish or English Only.
Local HA Demographic & Consumer Profile Compared to Acculturated
% of HA in Market
% of Acculturated
Hispanics HHI $50k+ 39.6% 48.6% 1 or more Children in HH 56.8% 68.2% Own Residence 54.1% 54.2% Any College 19.1% 29.9% 2+ times to Sit Down Restaurant Past Mo. 63.9% 59.8% 4+ times to a Quick Serve Restaurant Past Mo. 64.6% 72% Bought New Vehicle 42.4% 43% Used Credit Card in Past 3 Months 76% 78.5% Taken 1+ plane trips past yr. 39.5% 39.3% To Read: Among Chicago Hispanic Americans A18+ 39.6% have a Household Income of $50,000+ compared to 48.6% Acculturated Hispanic Americans in the market.
513 450
187 164 139 137 125 123 122 118
0100200300400500600
3

32%
7%
15%
45%
1%
English Ad Supported Cable OrigSpanish Cable OriginationEnglish BroadcastSpanish BroadcastSpanish Independents
2%
20%
30% 34%
14%
English AndSpanish Equally
English MoreThan Spanish
English Only
Spanish MoreThan English
Spanish Only
M A R K E T P R O F I L E
DALLAS-FT. WORTH
Hispanic Market Rank 5 Dallas-Ft. Worth Market Snapshot
HH % Penetration Hispanic TV HHs 534,760 20.2% Hispanic Population 2+ 2,080,040 27.5% Hispanic Wired Cable, Telco & Satellite 360,090 67.3% Hispanic Wired Cable & Telco 197,980 37% Hispanic Median Age 26.2 Hispanic Median Income $41,445
Dallas-Ft. Worth Cable Footprint
CNN en Español Discovery en Español FOX Deportes
Covers 80% of Hispanic Americans in DMA
Other Cable
No Cable
Hispanic HH Penetration in Cable System Coverage Areas
System Name %
Conc. % of HA HHs/Mkt
Time Warner/Dallas East U-verse, TX 27.32% 6.46% Time Warner/Dallas East-Mesquite, TX 30.09% 6.46% Time Warner/Dallas South U-verse, TX 29.9% 5.71% Time Warner/Dallas South-DeSoto, TX 30.0% 5.68% Time Warner/FTW South U-verse, TX 21.33% 5.56% Time Warner/Arlington U-verse, TX 25.39% 5.37% Time Warner/TW ONLY-North Dallas, TX 25.93% 5.35% Time Warner/TW ONLY-Ft. Worth-North, TX 30.74% 4.25% Time Warner/FTW North U-verse, TX 19.11% 4.21% Time Warner/Ft. Worth - South , TX 23.14% 4.18% Time Warner/Dallas North U-verse, TX 27.24% 4.1% Time Warner/Arlington-Grand Prairie, TX 25.39% 3.78% Time Warner/TW ONLY-Irv-Coppel-Lewis, TX 28.09% 3.2% Time Warner/VZN ONLY-Irving, TX 29.69% 3.17% Time Warner/VZN ONLY-Richardson, TX 22.07% 2.84% Time Warner/McKinney U-verse, TX 12.14% 2.75% Time Warner/TW ONLY-Richards-Garlnd, TX 18.73% 2.43% Time Warner/TW ONLY-MKn-Alln-Frsc-Gvl,TX 12.25% 1.52% Time Warner/VZN ONLY-Denton, TX 14.7% 1.36% Time Warner/VZN ONLY-Plano, TX 10.75% 1.31% Time Warner/VZN ONLY-Dallas North, TX 19.74% 1.19%
Targeted Programming
Network Program Name HA A25-54 RTG AMC WALKING DEAD 7.59 HGTV FIXER UPPER 2.99 MTV TEEN MOM 2.01 E! HOLLYWOOD MEDIUM 1.73 DISC FAST N LOUD 1.68 USA WWE ENTERTAINMENT 1.58 VH1 MOB WIVES 0.70 BRAVO REAL HOUSEWIVES BEV HILLS 0.64 HIST VIKINGS 0.59
Online Market Snapshot – TWC Central Hispanic Cume 367,000
Female 56.6%
Male 43.4%
Spot Cable Networks to Reach Hispanic Americans To Read: Hispanic Americans A18+ in wired cable HHs are 36% more likely to watch VH1 than the average Adult in Dallas-Ft. Worth
Hispanic A18+ Composition Index
NCC Media in Dallas-Ft. Worth
Language Preference
2% 1%
83%
14% Puerto Rican
Cuban
Mexican
Other
Hispanic Origin
Share of TV Viewing among Hispanic HHs in Dallas-Ft. Worth
Insertable Sp. Language Nets Galavision History en Español
TR3S UVSO
Source: Mkt Snapshot - Nielsen UE, Feb'16 & US Census'15; Language & Cable Networks - Dallas, Se14-Au15 Scarborough; Hispanic Origin - US Census'15/Claritas; Cable System Pen - US Census'15 & CableTrack ‘16; Share of Viewing & Targeted Programming - Nielsen N-Power Feb'16 (LPM); NCC Media - CableTrack ‘16; Online Mkt Snapshot – Scarborough Dallas Sep14-Aug15; Acculturated Hispanic: Hispanic Adults 18-49 Prefer to Speak English More Than Spanish or English Only
Local HA Demographic & Consumer Profile Compared to Acculturated
% of HA in Market
% Acculturated
Hispanics HHI $50k+ 39.2% 45% 1 or more Children in HH 65.6% 67.1% Own Residence 54.5% 59.3% Any College 12.5% 25.7% 2+ times to Sit Down Restaurant Past Mo. 75.8% 76.4% 4+ times to a Quick Serve Restaurant Past Mo. 65% 73.6% Bought New Vehicle 30.4% 40% Used Credit Card in Past 3 Months 77.2% 82.1% Taken 1+ plane trips past yr. 24.3% 26.4%
To Read: Among Dallas-Ft. Worth Hispanic Americans A18+ 39.2% have a Household Income of $50,000+ compared to 45% Acculturated Hispanic Americans in the market.
136 118 111 111 102 100
020406080
100120140160
VH1 -TV FS1 -TV ENT -TV NICK-TV DISC-TV HIST-TV
4

44%
3% 27%
26%
0%
English Ad Supported Cable OrigSpanish Cable OriginationEnglish BroadcastSpanish BroadcastSpanish Independents
1%
18%
39%
24%
19%
English AndSpanish Equally
English MoreThan Spanish
English Only
Spanish MoreThan English
Spanish Only
M A R K E T P R O F I L E
DENVER
Hispanic Market Rank 17 Denver Market Snapshot
HH % Penetration Hispanic TV HHs 242,680 15.4% Hispanic Population 2+ 921,664 21.3% Wired Cable, Telco & Satellite 202,970 83.6% Hispanic Wired Cable & Telco 97,720 40.3% Hispanic Median Age 26.9 Hispanic Median Income $43,340
Denver Cable Footprint
Galavision UNIV
Covers 80% of Hispanic Americans in DMA
Other Cable
No Cable
Hispanic HH Penetration in Cable System Coverage Areas System Name % Conc. % of HA HHs/Mkt Comcast/Central West, CO 30.1% 14.34% Comcast/East, CO 18.85% 11.78% Comcast/North East, CO 27.44% 10.27% Comcast/North West, CO 20.78% 8.85% Comcast/Central East, CO 14.03% 8.37% Comcast/West, CO 16.82% 6.59% Comcast/Greeley, CO 24.98% 5.71% Comcast/Longmont, CO 18.56% 3.51% Comcast/South West, CO 7.58% 3.23% Comcast/Ft. Collins, CO 8.62% 2.25% Comcast/South East, CO 6.21% 2.16% Comcast/New North, CO 8.73% 1.93% Comcast/Aspen-Glenwood-Rifle, CO 15.73% 1.81%
Targeted Programming
Network Program Name HA A25-54 RTG AMC WALKING DEAD 5.51 MTV TEEN MOM 4.45 VH1 MOB WIVES 3.63 E! KEEPING UP KARDASHIANS 3.45 DISC GOLD RUSH 2.88 HGTV FIXER UPPER 2.24 HIST VIKINGS 1.82 USA WWE SMACKDOWN 1.31 LIFE LITTLE WOMEN LA 1.23
Online Market Snapshot – Xfinity Hispanic Page Views 1 million
Hispanic Unique Visitors 50,000 Female 65.3%
HA Time Spent (min/visitor) 7.1 Male 34.7%
Spot Cable Networks to Reach Hispanic Americans To Read: Hispanic Americans A18+ in wired cable HHs are 154% more likely to watch TRU than the average Adult in Denver
Hispanic A18+ Composition Index
NCC Media in Denver
Language Preference
2% 1%
75%
23% Puerto Rican
Cuban
Mexican
Other
Hispanic Origin
Share of TV Viewing among Hispanic HHs in Denver
Insertable Sp. Language Nets
Source: Mkt Snapshot - Nielsen UE, Feb’16 & US Census'15; Language & Cable Networks - Denver, Se14-Au15 Scarborough; Hispanic Origin - US Census'15/Claritas; Cable System Pen - US Census'15 & CableTrack ‘16; Share of Viewing & Targeted Programming - Nielsen N-Power Feb'16 (LPM); NCC Media - CableTrack ‘16; Online Mkt Snapshot - ComScore Apr’16; Acculturated Hispanic: Hispanic Adults 18-49 Prefer to Speak English More than Spanish or English Only.
Local HA Demographic & Consumer Profile Compared to Acculturated
% of HA in Market
% of Acculturated
Hispanics HHI $50k+ 30.8% 39.8% 1 or more Children in HH 53.9% 56.1% Own Residence 50.8% 48% Any College 12.4% 32.7% 2+ times to Sit Down Restaurant Past Mo. 51.9% 58.2% 4+ times to a Quick Serve Restaurant Past Mo. 55.8% 69.4% Bought New Vehicle 36.3% 33.7% Used Credit Card in Past 3 Months 69.3% 74.5% Taken 1+ plane trips past yr. 34.8% 40.8% To Read: Among Denver Hispanic Americans A18+ 30.8% have a Household Income of $50,000+ compared to 39.8% Acculturated Hispanic Americans in the market.
254 243 197 194 186 171 161 160 149 143
050
100150200250300
5
42%
8% 19%
31%
1%
English Ad Supported Cable OrigSpanish Cable OriginationEnglish BroadcastSpanish BroadcastSpanish Independents
1%
35%
30%
18%
16%
English AndSpanish Equally
English MoreThan Spanish
English Only
Spanish MoreThan English
Spanish Only
M A R K E T P R O F I L E
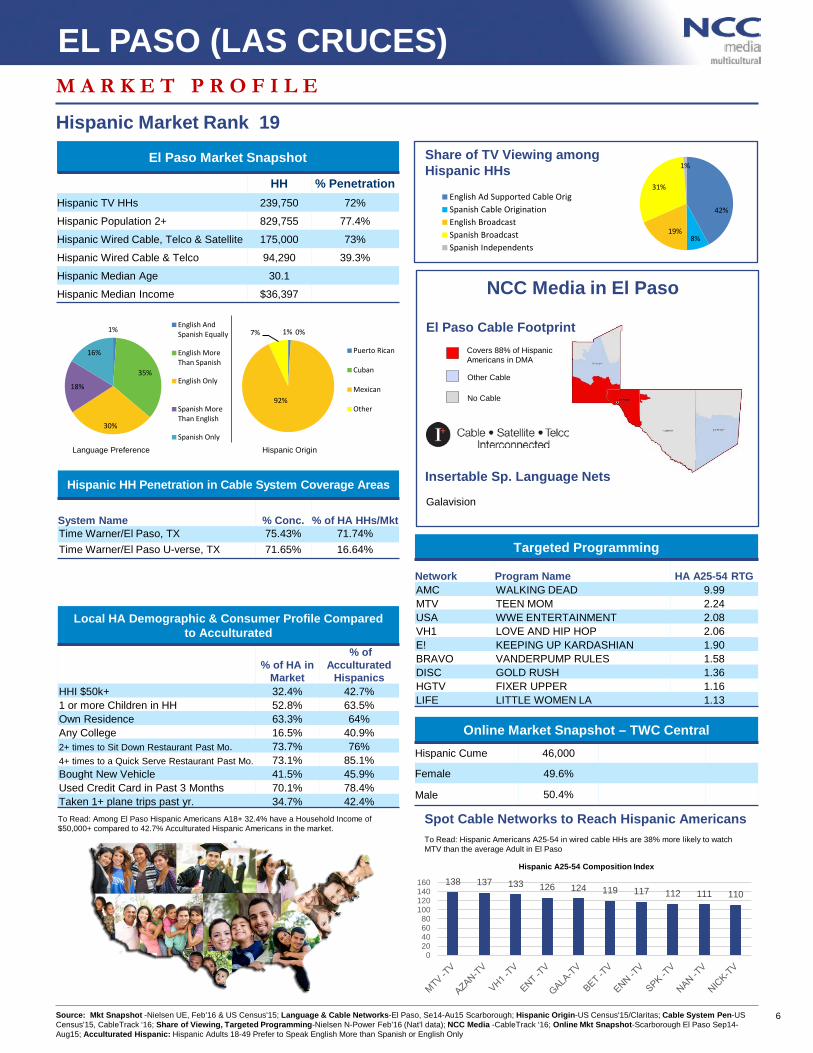
EL PASO (LAS CRUCES)
Hispanic Market Rank 19
El Paso Market Snapshot
HH % Penetration Hispanic TV HHs 239,750 72%
Hispanic Population 2+ 829,755 77.4%
Hispanic Wired Cable, Telco & Satellite 175,000 73%
Hispanic Wired Cable & Telco 94,290 39.3%
Hispanic Median Age 30.1
Hispanic Median Income $36,397
El Paso Cable Footprint Covers 88% of Hispanic Americans in DMA
Other Cable
No Cable
Hispanic HH Penetration in Cable System Coverage Areas
System Name % Conc. % of HA HHs/Mkt Time Warner/El Paso, TX 75.43% 71.74% Time Warner/El Paso U-verse, TX 71.65% 16.64% Targeted Programming
Network Program Name HA A25-54 RTG AMC WALKING DEAD 9.99 MTV TEEN MOM 2.24 USA WWE ENTERTAINMENT 2.08 VH1 LOVE AND HIP HOP 2.06 E! KEEPING UP KARDASHIAN 1.90 BRAVO VANDERPUMP RULES 1.58 DISC GOLD RUSH 1.36 HGTV FIXER UPPER 1.16 LIFE LITTLE WOMEN LA 1.13
Online Market Snapshot – TWC Central Hispanic Cume 46,000
Female 49.6%
Male 50.4%
Spot Cable Networks to Reach Hispanic Americans To Read: Hispanic Americans A25-54 in wired cable HHs are 38% more likely to watch MTV than the average Adult in El Paso
Hispanic A25-54 Composition Index
NCC Media in El Paso
Language Preference
1% 0%
92%
7%
Puerto Rican
Cuban
Mexican
Other
Hispanic Origin
Galavision
Share of TV Viewing among Hispanic HHs
Insertable Sp. Language Nets
Source: Mkt Snapshot -Nielsen UE, Feb’16 & US Census'15; Language & Cable Networks-El Paso, Se14-Au15 Scarborough; Hispanic Origin-US Census'15/Claritas; Cable System Pen-US Census'15, CableTrack ‘16; Share of Viewing, Targeted Programming-Nielsen N-Power Feb'16 (Nat’l data); NCC Media -CableTrack ‘16; Online Mkt Snapshot-Scarborough El Paso Sep14-Aug15; Acculturated Hispanic: Hispanic Adults 18-49 Prefer to Speak English More than Spanish or English Only
Local HA Demographic & Consumer Profile Compared to Acculturated
% of HA in Market
% of Acculturated
Hispanics HHI $50k+ 32.4% 42.7% 1 or more Children in HH 52.8% 63.5% Own Residence 63.3% 64% Any College 16.5% 40.9% 2+ times to Sit Down Restaurant Past Mo. 73.7% 76% 4+ times to a Quick Serve Restaurant Past Mo. 73.1% 85.1% Bought New Vehicle 41.5% 45.9% Used Credit Card in Past 3 Months 70.1% 78.4% Taken 1+ plane trips past yr. 34.7% 42.4% To Read: Among El Paso Hispanic Americans A18+ 32.4% have a Household Income of $50,000+ compared to 42.7% Acculturated Hispanic Americans in the market.
138 137 133 126 124 119 117 112 111 110
020406080
100120140160
6

42%
8%
19%
31%
1%
English Ad Supported Cable OrigSpanish Cable OriginationEnglish BroadcastSpanish BroadcastSpanish Independents
2%
31%
37%
12%
19%
English AndSpanish Equally
English MoreThan Spanish
English Only
Spanish MoreThan English
Spanish Only
M A R K E T P R O F I L E
FRESNO-VISALIA
Hispanic Market Rank 13 Fresno Market Snapshot
HH % Penetration Hispanic TV HHs 261,390 46.3% Hispanic Population 2+ 1,122,198 55.5% Hispanic Wired Cable, Telco & Satellite 198,850 76.1% Hispanic Wired Cable & Telco 75,620 28.9% Hispanic Median Age 26.1 Hispanic Median Income $35,246
Fresno Cable Footprint
FOX Deportes Galavision
Covers 77% of Hispanic Americans in DMA
Other Cable
No Cable
Hispanic HH Penetration in Cable System Coverage Areas
System Name % Conc. % of HA HHs/Mkt Comcast/Fresno, CA 44.66% 40.89% Comcast/Fresno U-verse, CA 44.2% 11.59% Comcast/Visalia, CA 43.1% 9.18% Comcast/Porterville, CA 59.68% 7.73% Comcast/Visalia U-verse, CA 52.24% 7.63%
Targeted Programming
Network Program Name HA A25-54 RTG AMC WALKING DEAD 9.99 MTV TEEN MOM 2.24 USA WWE ENTERTAINMENT 2.08 VH1 LOVE AND HIP HOP 2.06 E! KEEPING UP KARDASHIAN 1.90 BRAVO VANDERPUMP RULES 1.58 DISC GOLD RUSH 1.36 HGTV FIXER UPPER 1.16 LIFE LITTLE WOMEN LA 1.13
Online Market Snapshot – Xfinity Hispanic Cume 107,000
Female 46.3%
Male 53.7%
Spot Cable Networks to Reach Hispanic Americans To Read: Hispanic Americans A25-54 in wired cable HHs are 124% more likely to watch Galavision than the average Adult in Fresno
Hispanic A25-54 Composition Index
NCC Media in Fresno
Language Preference
1% 0%
92%
7%
Puerto Rican
Cuban
Mexican
Other
Hispanic Origin
Share of TV Viewing among Hispanic HHs
Insertable Sp. Language Nets
Source: Mkt Snapshot -Nielsen UE, Feb’16 & US Census'15; Language & Cable Networks- Fresno, Au14-Jl15 Scarborough; Hispanic Origin-US Census'15/Claritas; Cable System Pen-US Census'15, CableTrack ‘16; Share of Viewing, Targeted Programming-Nielsen N-Power Feb'16 (Nat’l data); NCC Media -CableTrack ‘16; Online Mkt Snapshot-Scarborough Fresno Aug14-Jul15.; Acculturated Hispanic: Hispanic Adults 18-49 Prefer to Speak English More than Spanish or English Only
Local HA Demographic & Consumer Profile Compared to Acculturated
% of HA in Market
% of Acculturated
Hispanics HHI $50k+ 30% 33% 1 or more Children in HH 62.9% 70.1% Own Residence 44.5% 41.5% Any College 8.7% 26.2% 2+ times to Sit Down Restaurant Past Mo. 60.8% 63.9% 4+ times to a Quick Serve Restaurant Past Mo. 61.9% 74.5% Bought New Vehicle 36.5% 41.2% Used Credit Card in Past 3 Months 65% 71.1% Taken 1+ plane trips past yr. 17.5% 19%
To Read: Among Fresno-Visalia Hispanic Americans A18+ 30% have a Household Income of $50,000+ compared to 33% Acculturated Hispanic Americans in the market
224
169 134 134 130 125 114 114 109 108
0
50
100
150
200
250
7

42%
8%
19%
31%
1%
English Ad Supported Cable OrigSpanish Cable OriginationEnglish BroadcastSpanish BroadcastSpanish Independents
1%
36%
18%
22%
24%
English AndSpanish Equally
English MoreThan Spanish
English Only
Spanish MoreThan English
Spanish Only
M A R K E T P R O F I L E
HARLINGEN-WSLCO-BRNSVL-MCALLEN
Hispanic Market Rank 10 Harlingen Market Snapshot
HH % Penetration Hispanic TV HHs 316,640 87.1% Hispanic Population 2+ 1,223,219 90.5% Hispanic Wired Cable, Telco & Satellite 224,760 71% Hispanic Wired Cable & Telco 122,350 38.6% Hispanic Median Age 28.4 Hispanic Median Income $31,162
Harlingen Cable Footprint
Covers 74% of Hispanic Americans in DMA Other Cable
No Cable
Hispanic HH Penetration in Cable System Coverage Areas
System Name % Conc. % of HA HHs/Mkt Time Warner/RGV Master Zone, TX 84.77% 45.93%
Time Warner/McAllen, TX 85.89% 27.98% Targeted Programming
Network Program Name HA A25-54 RTG AMC WALKING DEAD 9.99 MTV TEEN MOM 2.24 USA WWE ENTERTAINMENT 2.08 VH1 LOVE AND HIP HOP 2.06 E! KEEPING UP KARDASHIAN 1.90 BRAVO VANDERPUMP RULES 1.58 DISC GOLD RUSH 1.36 HGTV FIXER UPPER 1.16 LIFE LITTLE WOMEN LA 1.13
Online Market Snapshot – TWC Central Hispanic Cume N/A
Female (est) 49.5%
Male (est) 54.1%
Spot Cable Networks to Reach Hispanic Americans To Read: Hispanic Americans A25-54 in wired cable HHs are 14% more likely to watch VH1 than the average Adult in Harlingen
Hispanic A25-54 Composition Index
NCC Media in Harlingen
Language Preference
0% 0%
93%
7%
Puerto Rican
Cuban
Mexican
Other
Hispanic Origin
Share of TV Viewing among Hispanic HHs
Insertable Sp. Language Nets
Galavision
Source: Mkt Snapshot -Nielsen UE, Feb’16 & US Census'15; Language & Cable Networks- Harlingen, Au14-Jl15 Scarborough; Hispanic Origin-US Census'15/Claritas; Cable System Pen-US Census'15, CableTrack ‘16; Share of Viewing, Targeted Programming-Nielsen N-Power Feb'16 (Nat’l data); NCC Media -CableTrack ‘16; Online Mkt Snapshot – Scarborough Avg of TWC Central in San Antonio & Austin; Acculturated Hispanics: Hispanic Adults 18-49 Prefer to Speak English More than Spanish or English Only
Local HA Demographic & Consumer Profile Compared to Acculturated
% of HA in Market
% Acculturated
Hispanics HHI $50k+ 23.9% 31.9% 1 or more Children in HH 56.8% 65.4% Own Residence 67.6% 65.7% Any College 12.4% 31% 2+ times to Sit Down Restaurant Past Mo. 67.5% 75.3% 4+ times to a Quick Serve Restaurant Past Mo. 67.4% 79.2% Bought New Vehicle 37.4% 40.2% Used Credit Card in Past 3 Months 62.3% 64.3% Taken 1+ plane trips past yr. 23.1% 29.1% To Read: Among Harlingen Hispanic Americans A18+ 23.9% have a Household Income of $50,000+ compared to 31.9% Acculturated Hispanic Americans in the market
114
110 109 109 108 108 108 106 105 105
100102104106108110112114116
8

36%
6% 17%
39%
2%
English Ad Supported Cable OrigSpanish Cable OriginationEnglish BroadcastSpanish BroadcastSpanish Independents
1%
34%
22%
25%
19%
English AndSpanish Equally
English MoreThan Spanish
English Only
Spanish MoreThan English
Spanish Only
M A R K E T P R O F I L E
HOUSTON
Hispanic Market Rank 4 Houston Market Snapshot
HH % Penetration Hispanic TV HHs 667,160 28.1% Hispanic Population 2+ 2,465,078 36.1% Hispanic Wired Cable, Telco & Satellite 457,770 68.6% Hispanic Wired Cable & Telco 243,400 36.5% Hispanic Median Age 27.5 Hispanic Median Income $42,993
Houston Cable Footprint
ESPN Deportes FOX Deportes
Covers 80% of Hispanic Americans in DMA
Other Cable
No Cable
Hispanic HH Penetration in Cable System Coverage Areas System Name % Conc. % of HA HHs/Mkt Comcast/Humble-Atascocita, TX 35.08% 6.92% Comcast/North Houston, TX 39.95% 6.88% Comcast/Baytown-Crosby-Highlands, TX 39.58% 6.87% Comcast/Pasadena, TX 47.63% 5.12% Comcast/Houston North U-verse, TX 42.19% 5.07% Comcast/Pearland-Friendswood, TX 33.49% 5.04% Comcast/Westchase U-verse, TX 31.19% 4.47% Comcast/Pasadena U-verse, TX 52.43% 4.44% Comcast/Westchase, TX 27.68% 3.81% Comcast/Pearland U-verse, TX 30.51% 3.67% Comcast/Sugar Land, TX 22.0% 3.55% Comcast/Galleria-Memorial, TX 33.7% 3.55% Comcast/Katy U-verse, TX 31.27% 2.51% Comcast/Inner Loop, TX 18.75% 2.16% Comcast/Baytown U-verse, TX 48.01% 2.12% Comcast/Humble U-verse, TX 36.49% 1.98% Comcast/Katy Bear Creek, TX 28.31% 1.96% Comcast/Galveston Bay, TX 21.51% 1.79% Comcast/Clear Lake, TX 15.09% 1.74% Comcast/Champions U-verse, TX 21.42% 1.65% Comcast/Champions, TX 21.39% 1.62% Comcast/Cypress, TX 24.85% 1.6% Comcast/Galleria U-verse, TX 31.66% 1.53%
Targeted Programming
Network Program Name HA A25-54 RTG AMC WALKING DEAD 10.55 UNIV LIGA MX L 4.60 USA WWE ENTERTAINMENT 3.26 BRAVO REAL HOUSEWIVES BEV HILLS 3.21 E! TOTAL DIVAS 2.56 MTV TEEN MOM 1.51 DISC FAST N LOUD 1.04 HGTV FLIP OR FLOP 1.24 VH1 MOB WIVES 0.62
Online Market Snapshot – Xfinity Hispanic Page Views 1 million
Hispanic Unique Visitors 85,000 Female 40.2%
HA Time Spent (min/visitor) 10.7 Male 59.8%
Spot Cable Networks to Reach Hispanic Americans To Read: Hispanic Americans A18+ in wired cable HHs are 209% more likely to watch ESPD than the average Adult in Houston
Hispanic A18+ Composition Index
NCC Media in Houston
Language Preference
1% 1%
75%
22% Puerto Rican
Cuban
Mexican
Other
Hispanic Origin
Share of TV Viewing among Hispanic HHs in Houston
Insertable Sp. Language Nets Galavision TR3S
Source: Mkt Snapshot - Nielsen UE, Feb’16 & US Census'15; Language & Cable Networks - Houston, Se14-Au15 Scarborough; Hispanic Origin - US Census'15/Claritas; Cable System Pen - US Census'15 & CableTrack ‘16; Share of Viewing & Targeted Programming - Nielsen N-Power Feb'16 (LPM); NCC Media - CableTrack ‘16; Online Mkt Snapshot - ComScore Apr’16; Acculturated Hispanics: Hispanic Adults 18-49 Prefer to Speak English More than Spanish or English Only
Local HA Demographic & Consumer Profile Compared to Acculturated
% of HA in Market
% of Acculturated
Hispanics HHI $50k+ 43.9% 51.6% 1 or more Children in HH 56.9% 61.8% Own Residence 63.1% 62.4% Any College 13.3% 29.9% 2+ times to Sit Down Restaurant Past Mo. 76.3% 80.9% 4+ times to a Quick Serve Restaurant Past Mo. 73.8% 80.3% Bought New Vehicle 42.3% 42% Used Credit Card in Past 3 Months 81.1% 82.8% Taken 1+ plane trips past yr. 31.5% 35.7%
To Read: Among Houston Hispanic Americans A18+ 43.9% have a Household Income of $50,000+ compared to 51.6% Acculturated Hispanic Americans in the market..
UVSO
309 287
147 104
0
50
100
150
200
250
300
350
AZAN-TV GALA-TV NICK-TV ENT -TV
9

39%
8% 15%
38%
1% Share of TV Viewing among Hispanic HHs in Los Angeles
English Ad Supported Cable OrigSpanish Cable OriginationEnglish BroadcastSpanish BroadcastSpanish Independents
1.6
31
20.9
25.7
20.8
English AndSpanish Equally
English MoreThan Spanish
English Only
Spanish MoreThan English
Spanish OnlyLanguage Preference
1% 1%
79%
19% Puerto Rican
Cuban
Mexican
Other
Hispanic Origin
M A R K E T P R O F I L E
LOS ANGELES
Hispanic Market Rank 1 Los Angeles Market Snapshot
HH % Penetration Hispanic TV HHs 1,924,270 35.1% Hispanic Population 2+ 8,396,518 46.1% Wired Cable, Telco & Satellite 1,538,970 80% Hispanic Wired Cable & Telco 740,590 38.5% Hispanic Median Age 29 Hispanic Median Income $47,481
ESPN Deportes FOX Deportes Galavision
Hispanic HH Penetration in Cable System Coverage Areas
System Name % Conc. % of HA HHs/Mkt Time Warner/Central Los Angeles, CA 46.64% 4.18% Time Warner/Los Feliz, CA 50.99% 4.15% Time Warner/East San Fernando Valley, CA 49.9% 4.13% Time Warner/Hacienda Heights, CA 62.27% 3.75% Time Warner/Los Angeles U-verse, CA 41.72% 3.59% Time Warner/Downey-MidCities, CA 64.57% 3.56% Time Warner/Hollywood, CA 34.64% 3.43% Time Warner/San Gabriel Vly U-verse, CA 40.45% 3.05% Time Warner/San Bernardino County, CA 56.02% 2.86% Time Warner/San Pedro, CA 53.4% 2.68% Time Warner/Frontier-San Gabriel, CA 65.53% 2.53% Time Warner/West San Fernando Valley, CA 30.98% 2.38% Time Warner/South Orange County, CA 45.81% 2.26% Time Warner/East Ventura, CA 45.77% 2.14% Time Warner/Central Orange County, CA 35.08% 2.01% Time Warner/Moreno Valley, CA 42.82% 1.93% Time Warner/Antelope Valley, CA 38.22% 1.85% Time Warner/South OC U-verse, CA 30.7% 1.85% Time Warner/Riverside-Corona U-verse, CA 40.77% 1.77% Time Warner/Norwalk-Whittier, CA 59.62% 1.76% Time Warner/Frontier-Ontario-Pomona, CA 42.54% 1.72% Time Warner/Redlands, CA 42.0% 1.7% Time Warner/Riverside, CA 42.22% 1.66% Time Warner/Frontier-Long Beach, CA 29.79% 1.57% Time Warner/Torrance, CA 31.33% 1.55% Time Warner/Alhambra, CA 38.79% 1.53%
Targeted Programming
Network Program Name HA A25-54 RTG AMC WALKING DEAD 9.94 MTV TEEN MOM 3.61 BRAVO VANDERPUMP RULES 3.55 VH1 MOB WIVES 2.94 E! KEEPING UP KARDASHIANS 2.36 DISC FAST N LOUD 1.86 VH1 LOVE AND HIP HOP 1.85 USA WWE ENTERTAINMENT 1.42 HGTV FLIP OR FLOP 1.29
Online Market Snapshot – NCC Gateway Hispanic Page Views 2 million
Hispanic Unique Visitors 124,000 Female 52.8%
HA Time Spent (min/visitor) 11.3 Male 47.2%
Spot Cable Networks to Reach Hispanic Americans To Read: Hispanic Americans A25-54 in wired cable HHs are 158% more likely to watch CNNE than the average Adult in Los Angeles
Hispanic A25-54 Composition Index
NCC Media in Los Angeles
Insertable Sp. Language Nets
Los Angeles Cable Footprint Covers 81% of Hispanic Americans in DMA
Other Cable
No Cable
TWCD
Source: Mkt Snapshot - Nielsen UE, Feb’16 & US Census'15; Language & Cable Networks – Los Angeles, Au14-Jl15 Scarborough; Hispanic Origin - US Census'15/Claritas; Cable System Pen - US Census'15 & CableTrack ‘16; Share of Viewing & Targeted Programming - Nielsen N-Power Feb'16 (LPM); NCC Media - CableTrack ‘16; Online Mkt Snapshot - ComScore Apr’16; Acculturated Hispanic: Hispanic Adults 18-49 Prefer to Speak English More than Spanish or English Only
Local HA Demographic & Consumer Profile Compared to Acculturated
% of HA in Market
% of Acculturated
Hispanics HHI $50k+ 36.1% 49.1% 1 or more Children in HH 58.5% 66.1% Own Residence 38.8% 45.1% Any College 11.9% 29.7% 2+ times to Sit Down Restaurant Past Mo. 68.9% 72.8% 4+ times to a Quick Serve Restaurant Past Mo. 67.8% 76.9% Bought New Vehicle 43.5% 48.8% Used Credit Card in Past 3 Months 71.4% 78.6% Taken 1+ plane trips past yr. 28.9% 35.4%
To Read: Among Los Angeles Hispanic Americans A18+ 36.1% have a Household Income of $50,000+ compared to 49.1% Acculturated Hispanic Americans in the market.
258 254 245 226 213 188 153 142 141 139
050
100150200250300
10

31%
10%
13%
41%
5%
English Ad Supported Cable OrigSpanish Cable OriginationEnglish BroadcastSpanish BroadcastSpanish Independents
2%
28%
15% 30%
26%
English AndSpanish Equally
English MoreThan Spanish
English Only
Spanish MoreThan English
Spanish Only
M A R K E T P R O F I L E
MIAMI-FT. LAUDERDALE
Hispanic Market Rank 3 Miami-Ft. Lauderdale Market Snapshot
HH % Penetration Hispanic TV HHs 770,180 46.4% Hispanic Population 2+ 2,236,253 48.5% Hispanic Wired Cable, Telco & Satellite 658,480 85.5% Hispanic Wired Cable & Telco 480,660 62.4% Hispanic Median Age 39.2 Hispanic Median Income $41,890
Miami-Ft. Lauderdale Cable Footprint
BEINE CANL CNN en Español Discovery en Español
Covers 80% of Hispanic Americans in DMA
Other Cable
No Cable
Hispanic HH Penetration in Cable System Coverage Areas
System Name % Conc. % of HA HHs/Mkt Comcast/Miami, FL 58.55% 12.99% Comcast/Doral-Hialeah, FL 90.18% 10.63% Comcast/North Dade, FL 41.2% 7.28% Comcast/Homestead-Redlands, FL 62.63% 6.26% Comcast/South Dade, FL 76.6% 6.03% Comcast/Miami Beach, FL 49.23% 5.65% Comcast/South Dade U-verse, FL 80.51% 5.43% Comcast/Kendall-Perrine, FL 67.13% 5.27% Comcast/South Broward, FL 34.29% 4.55% Comcast/Sunrise-Plantation, FL 22.63% 3.27% Comcast/Mia and Bchs U-verse, FL 58.91% 3.21% Comcast/Kendall U-Verse, FL 65.14% 3.01% Comcast/Coral Gables, FL 76.44% 2.67% Comcast/Davie, FL 26.74% 2.19% Comcast/Homestead U-Verse, FL 49.29% 1.98%
Targeted Programming
Network Program Name HA A25-54 RTG AMC WALKING DEAD 4.59 HGTV FIXER UPPER 1.11 HIST VIKINGS 1.07 MTV TEEN MOM 0.99 E! KEEPING UP KARDASHIANS 0.98 DISC GOLD RUSH 0.83 BRAVO REAL HOUSWIVES ATLANTA 0.83 VH1 LOVE AND HIP HOP 0.68 USA WWE ENTERTAINMENT 0.44
Online Market Snapshot – Xfinity Hispanic Page Views 5 million
Hispanic Unique Visitors 231,000 Female 48.8%
HA Time Spent (min/visitor) 16.2 Male 51.2%
Spot Cable Networks to Reach Hispanic Americans To Read: Hispanic Americans A25-54 in wired cable HHs are 78% more likely to watch DSE than the average Adult in Miami-Ft. Lauderdale
Hispanic A25-54 Composition Index
NCC Media in Miami-Ft. Lauderdale
Language Preference
9%
45%
4%
43%
Puerto Rican
Cuban
Mexican
Other
Hispanic Origin
Insertable Sp. Language Nets
Share of TV Viewing among Hispanic HHs in Miami
ESPN Deportes FOX Deportes Galavision History en Español
SUR TR3s UVSO
Source: Mkt Snapshot - Nielsen UE, Feb’16 & US Census'15; Language & Cable Networks - Miami, Au14-Jl15 Scarborough; Hispanic Origin - US Census'15/Claritas; Cable System Pen - US Census'15 & CableTrack ‘16; Share of Viewing & Targeted Programming - Nielsen N-Power Feb'16 (LPM); NCC Media - CableTrack ‘16; Online Mkt Snapshot - ComScore Apr’16; Acculturated Hispanic: Hispanic Adults 18-49 Prefer to Speak English More than Spanish or English Only
Local HA Demographic & Consumer Profile Compared to Acculturated
% of HA in Market
% of Acculturated
Hispanics HHI $50k+ 43.6% 62.2% 1 or more Children in HH 41.1% 51.9% Own Residence 50.4% 51.9% Any College 22.6% 47.1% 2+ times to Sit Down Restaurant Past Mo. 67% 75.3% 4+ times to a Quick Serve Restaurant Past Mo. 57% 74.6% Bought New Vehicle 45% 50.9% Used Credit Card in Past 3 Months 78.2% 84.2% Taken 1+ plane trips past yr. 37.6% 48.5% To Read: Among Miami Hispanic Americans A18+ 43.6% have a Household Income of $50,000+ compared to 62.2% Acculturated Hispanic Americans in the market.
178 172 130 124 118 117 114 113 109 102
0
50
100
150
200
11
43%
7%
17%
33%
1% Share of TV Viewing among Hispanic HHs in New York
English Ad Supported Cable OrigSpanish Cable OriginationEnglish BroadcastSpanish BroadcastSpanish Independents
2%
28%
25%
25%
21%
English AndSpanish Equally
English MoreThan Spanish
English Only
Spanish MoreThan English
Spanish OnlyLanguage Preference
28%
3%
13%
56%
Puerto Rican
Cuban
Mexican
Other
Hispanic Origin
M A R K E T P R O F I L E
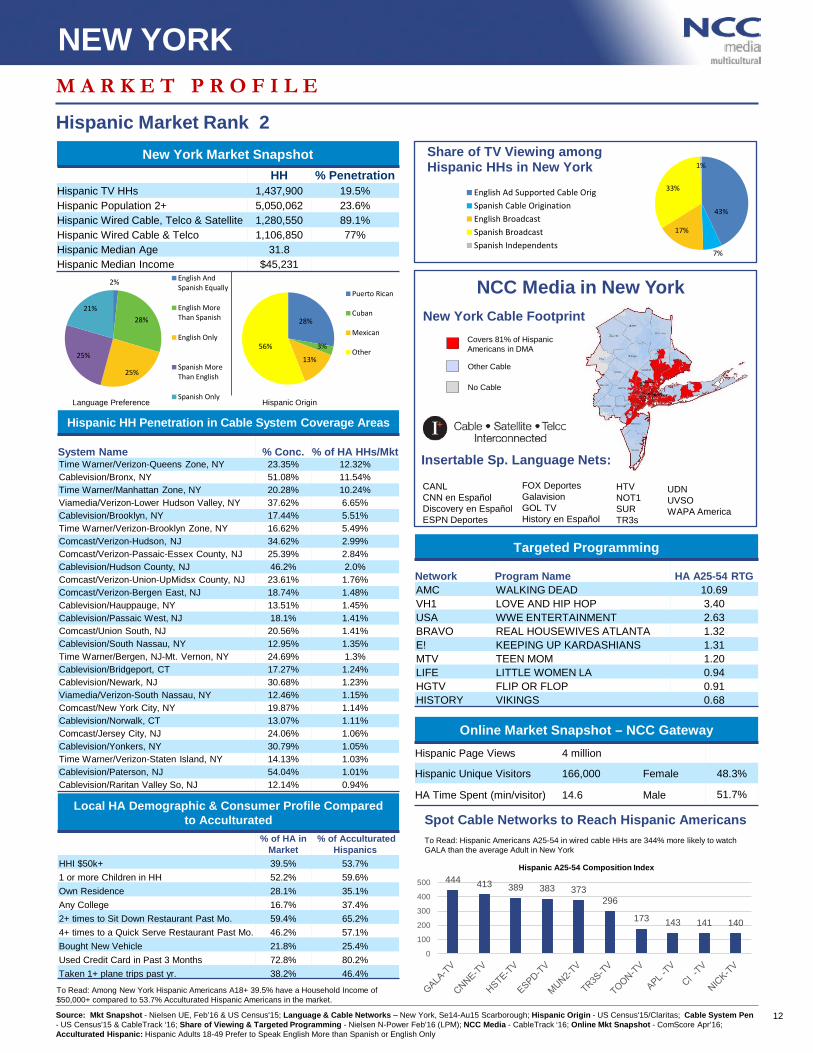
NEW YORK
Hispanic Market Rank 2 New York Market Snapshot
HH % Penetration Hispanic TV HHs 1,437,900 19.5% Hispanic Population 2+ 5,050,062 23.6% Hispanic Wired Cable, Telco & Satellite 1,280,550 89.1% Hispanic Wired Cable & Telco 1,106,850 77% Hispanic Median Age 31.8 Hispanic Median Income $45,231
CANL CNN en Español Discovery en Español ESPN Deportes
Hispanic HH Penetration in Cable System Coverage Areas
System Name % Conc. % of HA HHs/Mkt Time Warner/Verizon-Queens Zone, NY 23.35% 12.32% Cablevision/Bronx, NY 51.08% 11.54% Time Warner/Manhattan Zone, NY 20.28% 10.24% Viamedia/Verizon-Lower Hudson Valley, NY 37.62% 6.65% Cablevision/Brooklyn, NY 17.44% 5.51% Time Warner/Verizon-Brooklyn Zone, NY 16.62% 5.49% Comcast/Verizon-Hudson, NJ 34.62% 2.99% Comcast/Verizon-Passaic-Essex County, NJ 25.39% 2.84% Cablevision/Hudson County, NJ 46.2% 2.0% Comcast/Verizon-Union-UpMidsx County, NJ 23.61% 1.76% Comcast/Verizon-Bergen East, NJ 18.74% 1.48% Cablevision/Hauppauge, NY 13.51% 1.45% Cablevision/Passaic West, NJ 18.1% 1.41% Comcast/Union South, NJ 20.56% 1.41% Cablevision/South Nassau, NY 12.95% 1.35% Time Warner/Bergen, NJ-Mt. Vernon, NY 24.69% 1.3% Cablevision/Bridgeport, CT 17.27% 1.24% Cablevision/Newark, NJ 30.68% 1.23% Viamedia/Verizon-South Nassau, NY 12.46% 1.15% Comcast/New York City, NY 19.87% 1.14% Cablevision/Norwalk, CT 13.07% 1.11% Comcast/Jersey City, NJ 24.06% 1.06% Cablevision/Yonkers, NY 30.79% 1.05% Time Warner/Verizon-Staten Island, NY 14.13% 1.03% Cablevision/Paterson, NJ 54.04% 1.01% Cablevision/Raritan Valley So, NJ 12.14% 0.94%
Targeted Programming
Network Program Name HA A25-54 RTG AMC WALKING DEAD 10.69 VH1 LOVE AND HIP HOP 3.40 USA WWE ENTERTAINMENT 2.63 BRAVO REAL HOUSEWIVES ATLANTA 1.32 E! KEEPING UP KARDASHIANS 1.31 MTV TEEN MOM 1.20 LIFE LITTLE WOMEN LA 0.94 HGTV FLIP OR FLOP 0.91 HISTORY VIKINGS 0.68
Online Market Snapshot – NCC Gateway Hispanic Page Views 4 million
Hispanic Unique Visitors 166,000 Female 48.3%
HA Time Spent (min/visitor) 14.6 Male 51.7%
Spot Cable Networks to Reach Hispanic Americans To Read: Hispanic Americans A25-54 in wired cable HHs are 344% more likely to watch GALA than the average Adult in New York
Hispanic A25-54 Composition Index
NCC Media in New York
Insertable Sp. Language Nets:
New York Cable Footprint Covers 81% of Hispanic Americans in DMA
Other Cable
No Cable
FOX Deportes Galavision GOL TV History en Español
HTV NOT1 SUR TR3s
UDN UVSO WAPA America
Source: Mkt Snapshot - Nielsen UE, Feb’16 & US Census'15; Language & Cable Networks – New York, Se14-Au15 Scarborough; Hispanic Origin - US Census'15/Claritas; Cable System Pen - US Census'15 & CableTrack ‘16; Share of Viewing & Targeted Programming - Nielsen N-Power Feb'16 (LPM); NCC Media - CableTrack ‘16; Online Mkt Snapshot - ComScore Apr’16; Acculturated Hispanic: Hispanic Adults 18-49 Prefer to Speak English More than Spanish or English Only
Local HA Demographic & Consumer Profile Compared to Acculturated
% of HA in Market
% of Acculturated Hispanics
HHI $50k+ 39.5% 53.7% 1 or more Children in HH 52.2% 59.6% Own Residence 28.1% 35.1% Any College 16.7% 37.4% 2+ times to Sit Down Restaurant Past Mo. 59.4% 65.2% 4+ times to a Quick Serve Restaurant Past Mo. 46.2% 57.1% Bought New Vehicle 21.8% 25.4% Used Credit Card in Past 3 Months 72.8% 80.2% Taken 1+ plane trips past yr. 38.2% 46.4%
To Read: Among New York Hispanic Americans A18+ 39.5% have a Household Income of $50,000+ compared to 53.7% Acculturated Hispanic Americans in the market.
444 413 389 383 373 296
173 143 141 140
0
100
200
300
400
500
12
38%
12% 17%
32%
1%
English Ad Supported Cable OrigSpanish Cable OriginationEnglish BroadcastSpanish BroadcastSpanish Independents
0%
30%
25%
32%
14%
English AndSpanish Equally
English MoreThan Spanish
English Only
Spanish MoreThan English
Spanish Only
M A R K E T P R O F I L E
ORLANDO-DAYTONA BCH-MELBRN
Hispanic Market Rank 14 Orlando Market Snapshot
HH % Penetration Hispanic TV HHs 257,140 17.3% Hispanic Population 2+ 837,400 21.2% Hispanic Wired Cable, Telco & Satellite 217,760 84.7% Hispanic Wired Cable & Telco 161,250 62.7% Hispanic Median Age 31.7 Hispanic Median Income $37,881
Orlando Cable Footprint
CNN en Español ESPN Deportes FOX Deportes
Covers 82% of Hispanic Americans in DMA
Other Cable
No Cable
Hispanic HH Penetration in Cable System Coverage Areas
System Name % Conc. % of HA HHs/Mkt Bright House Networks/Orl East-Com Z, FL 30.18% 29.0% Bright House Networks/Orlando South, FL 44.96% 16.55% Bright House Networks/Orlando North, FL 16.37% 8.87% Bright House Networks/Orlando West, FL 17.03% 8.46% Bright House Networks/Lake (Z 4), FL 8.88% 7.24% Bright House Networks/Volusia (Z 3), FL 8.55% 6.85% Bright House Networks/Brevard (Z 2), FL 7.17% 5.48%
Targeted Programming
Network Program Name HA A25-54 RTG AMC WALKING DEAD 12.52 BRAVO REAL HOUSEWIVES ATLANTA 6.22 VH1 LOVE AND HIP HOP 5.54 USA WWE ENTERTAINMENT 3.91 E! KEEPING UP KARDASHIANS 2.02 MTV TEEN MOM 1.70 HGTV FLIP OR FLOP 1.22 LIFE LITTLE WOMEN LA 1.13 DISC FAST N LOUD 0.76
Online Market Snapshot – NCC Gateway Hispanic Page Views 1 million
Hispanic Unique Visitors 44,000 Female 36.8%
HA Time Spent (min/visitor) 46.4 Male 63.2%
Spot Cable Networks to Reach Hispanic Americans To Read: Hispanic Americans A18+ in wired cable HHs are 440% more likely to watch GALA than the average Adult in Orlando
Hispanic A18+ Composition Index
NCC Media in Orlando
Language Preference
49%
7%
13%
31%
Puerto Rican
Cuban
Mexican
Other
Hispanic Origin
Share of TV Viewing among Hispanic HHs in Orlando
Insertable Sp. Language Nets Galavision InfoMas WAPA
Source: Mkt Snapshot - Nielsen UE, Feb'16 & US Census'15; Language & Cable Networks - Orlando, Au14-Jl15 Scarborough; Hispanic Origin - US Census'15/Claritas; Cable System Pen - US Census'15 & CableTrack ‘16; Share of Viewing & Targeted Programming - Nielsen N-Power Feb'16 (LPM); NCC Media - CableTrack ‘16; Online Mkt Snapshot - ComScore Apr’16; Acculturated Hispanic: Hispanic Adults 18-49 Prefer to Speak English More than Spanish or English Only.
Local HA Demographic & Consumer Profile Compared to Acculturated
% of HA in Market
% of Acculturated
Hispanics HHI $50k+ 34.9% 43.9% 1 or more Children in HH 41% 54.5% Own Residence 49.7% 42.4% Any College 18.5% 37.9% 2+ times to Sit Down Restaurant Past Mo. 56.3% 63.6% 4+ times to a Quick Serve Restaurant Past Mo. 63.3% 65.2% Bought New Vehicle 36.8% 42.4% Used Credit Card in Past 3 Months 79% 75.8% Taken 1+ plane trips past yr. 46.6% 54.5% To Read: Among Orlando Hispanic Americans A18+ 34.9% have a Household Income of $50,000+ compared to 43.9% Acculturated Hispanic Americans in the market.
540 461 424
134 122 114 111 106 101
0100200300400500600
13

45%
8%
21%
26%
0%
English Ad Supported Cable OrigSpanish Cable OriginationEnglish BroadcastSpanish BroadcastSpanish Independents
0%
29%
38%
19%
14%
English AndSpanish Equally
English MoreThan Spanish
English Only
Spanish MoreThan English
Spanish Only
M A R K E T P R O F I L E
PHILADELPHIA
Hispanic Market Rank 16 Philadelphia Market Snapshot
HH % Penetration Hispanic TV HHs 248,030 8.5% Hispanic Population 2+ 910,288 11.2% Hispanic Wired Cable, Telco & Satellite 232,680 93.8% Hispanic Wired Cable & Telco 168,900 68.1% Hispanic Median Age 27.2 Hispanic Median Income $38,806
Philadelphia Cable Footprint
ESPN Deportes FOX Deportes Galavision
Covers 82% of Hispanic Americans in DMA
Other Cable
No Cable
Hispanic HH Penetration in Cable System Coverage Areas System Name % Conc. % of HA HHs/Mkt Comcast/NE Philadelphia, PA 15.4% 8.14% Comcast/Berks County, PA 20.55% 7.86% Comcast/Verizon-Philly, PA 10.87% 7.75% Comcast/Camden County West, NJ 15.22% 7.59% Comcast/Lehigh Valley, PA 13.71% 7.24% Viamedia/Svc Electric-Lehigh Valley, PA 11.57% 6.1% Comcast/SW Jersey, NJ 16.2% 5.74% Comcast/Mercer County, NJ 12.66% 5.36% Comcast/Wilmington, DE 7.04% 5.32% Comcast/Atlantic County, NJ 13.21% 4.82% Comcast/Center City, PA 10.02% 4.63% Comcast/Burlington County, NJ 5.44% 3.44% Comcast/University City-Manayunk, PA 6.23% 3.03% Comcast/Chester County, PA 4.84% 2.63% Comcast/Chestnut Hill-Mt. Airy, PA 9.37% 2.45%
Targeted Programming
Network Program Name HA A25-54 RTG AMC WALKING DEAD 12.21 USA WWE ENTERTAINMENT 4.02 VH1 LOVE AND HIP HOP 3.75 UNIV LIGA MX L 3.58 MTV TEEN MOM 3.39 E! KEEPING UP KARDASHIANS 1.91 DISC FAST N LOUD 1.82 HGTV FLIP OR FLOP 1.14 BRAVO REAL HOUSEWIVES ATLANTA 0.84
Online Market Snapshot – Xfinity Hispanic Page Views 13 million
Hispanic Unique Visitors 139,000 Female 46.7%
HA Time Spent (min/visitor) 163.1 Male 53.3%
Spot Cable Networks to Reach Hispanic Americans To Read: Hispanic Americans A18+ in wired cable HHs are 28% more likely to watch TRAV than the average Adult in Philadelphia
Hispanic A18+ Composition Index
NCC Media in Philadelphia
Language Preference
50%
2%
19%
29%
Puerto Rican
Cuban
Mexican
Other
Hispanic Origin
Share of TV Viewing among Hispanic HHs in Philadelphia
Insertable Sp. Language Nets
Source: Mkt Snapshot - Nielsen UE, Feb'16 & US Census'15; Language & Cable Networks - Philadelphia, Au14-Jl15 Scarborough; Hispanic Origin - US Census'15/Claritas; Cable System Pen - US Census'15 & CableTrack ‘16; Share of Viewing & Targeted Programming - Nielsen N-Power Feb'16 (LPM); NCC Media - CableTrack ‘16; Online Mkt Snapshot - ComScore Apr’16; Acculturated Hispanic: Hispanic Adults 18-49 Prefer to Speak English more than Spanish or English Only.
Local HA Demographic & Consumer Profile Compared to Acculturated
% of HA in Market
% of Acculturated
Hispanics HHI $50k+ 45% 55.6% 1 or more Children in HH 49.8% 63.6% Own Residence 51.3% 58.6% Any College 19.5% 29.3% 2+ times to Sit Down Restaurant Past Mo. 64.7% 69.7% 4+ times to a Quick Serve Restaurant Past Mo. 64.5% 71.7% Bought New Vehicle 41.3% 51.5% Used Credit Card in Past 3 Months 67.8% 81.8% Taken 1+ plane trips past yr. 35.4% 36.4% To Read: Among Philadelphia Hispanic Americans A18+ 45% have a Household Income of $50,000+ compared to 55.6% Acculturated Hispanic Americans in the market.
128 127 114 107 107 103
0
20
40
60
80
100
120
140
TRAV-TV ESP2-TV FAM -TV ESPN-TV CMDY-TV SYFY-TV
14

41%
6% 17%
36%
1%
English Ad Supported Cable OrigSpanish Cable OriginationEnglish BroadcastSpanish BroadcastSpanish Independents
2%
30%
30%
24%
16%
English AndSpanish Equally
English MoreThan Spanish
English Only
Spanish MoreThan English
Spanish Only
M A R K E T P R O F I L E
PHOENIX (PRESCOTT)
Hispanic Market Rank 9 Phoenix Market Snapshot
HH % Penetration Hispanic TV HHs 376,070 20.3% Hispanic Population 2+ 1,500,730 28.3% Hispanic Wired Cable, Telco & Satellite 255,890 68% Hispanic Wired Cable & Telco 108,160 28.8% Hispanic Median Age 26.1 Hispanic Median Income $38,731
Phoenix Cable Footprint
CNN en Español ESPN Deportes DisneyXD
Covers 83% of Hispanic Americans in DMA
Other Cable
No Cable
Hispanic HH Penetration in Cable System Coverage Areas
System Name % Conc. % of HA HHs/Mkt Cox Media/Phoenix, AZ 43.28% 35.97% Cox Media/East Valley, AZ 17.05% 12.6% Cox Media/West Valley, AZ 18.21% 11.27% Cox Media/North Phoenix, AZ 14.5% 9.21% Viamedia/Phoenix, AZ 20.46% 7.04% Cox Media/Southeast Valley, AZ 15.43% 6.99%
Targeted Programming
Network Program Name HA A25-54 RTG AMC WALKING DEAD 12.21 USA WWE ENTERTAINMENT 4.02 VH1 LOVE AND HIP HOP 3.75 MTV TEEN MOM 3.39 E! KEEPING UP KARDASHIANS 1.91 DISC FAST N LOUD 1.82 HGTV FLIP OR FLOP 1.14 BRAVO REAL HOUSEWIVES ATLANTA 0.84 LIFE LITTLE WOMEN LA 0.32
Online Market Snapshot –Cox.com Hispanic Page Views 386,000
Hispanic Unique Visitors 67,000 Female 53.7%
HA Time Spent (min/visitor) 3.4 Male 44.3%
Spot Cable Networks to Reach Hispanic Americans To Read: Hispanic Americans A18+ in wired cable HHs are 66% more likely to watch MTV than the average Adult in Phoenix
Hispanic A18+ Composition Index
NCC Media in Phoenix
Language Preference
2% 1%
86%
11% Puerto Rican
Cuban
Mexican
Other
Hispanic Origin
Share of TV Viewing among Hispanic HHs in Phoenix
Insertable Sp. Language Nets FOX Deportes Galavision History en Español
Source: Mkt Snapshot - Nielsen UE, Feb'16 & US Census'15; Language & Cable Networks - Phoenix, Au14-Jl15 Scarborough; Hispanic Origin - US Census'15/Claritas; Cable System Pen - US Census'15 & CableTrack ‘16; Share of Viewing & Targeted Programming - Nielsen N-Power Feb'16 (LPM); NCC Media - CableTrack ‘16; Online Mkt Snapshot - ComScore Apr’16; Acculturated Hispanic: Hispanic Adults 18-49 Prefer to Speak English More Than Spanish or English Only.
Local HA Demographic & Consumer Profile Compared to Acculturated
% of HA in Market
% of Acculturated
Hispanics HHI $50k+ 34.9% 52.7% 1 or more Children in HH 61.4% 65.9% Own Residence 42.9% 44.2% Any College 13.3% 31.8% 2+ times to Sit Down Restaurant Past Mo. 63.2% 69.8% 4+ times to a Quick Serve Restaurant Past Mo. 63.7% 68.2% Bought New Vehicle 36.9% 41.1% Used Credit Card in Past 3 Months 68.2% 73.6% Taken 1+ plane trips past yr. 24.2% 34.9%
To Read: Among Phoenix Hispanic Americans A18+ 34.9% have a Household Income of $50,000+ compared to 52.7% Acculturated Hispanic Americans in the market.
166 143
124 111
020406080
100120140160180
MTV -TV CMDY-TV APL -TV SPK -TV
15
49%
6%
18%
27%
0%
English Ad Supported Cable OrigSpanish Cable OriginationEnglish BroadcastSpanish BroadcastSpanish Independents
1%
27%
38%
18%
17%
English AndSpanish Equally
English MoreThan Spanish
English Only
Spanish MoreThan English
Spanish Only
M A R K E T P R O F I L E
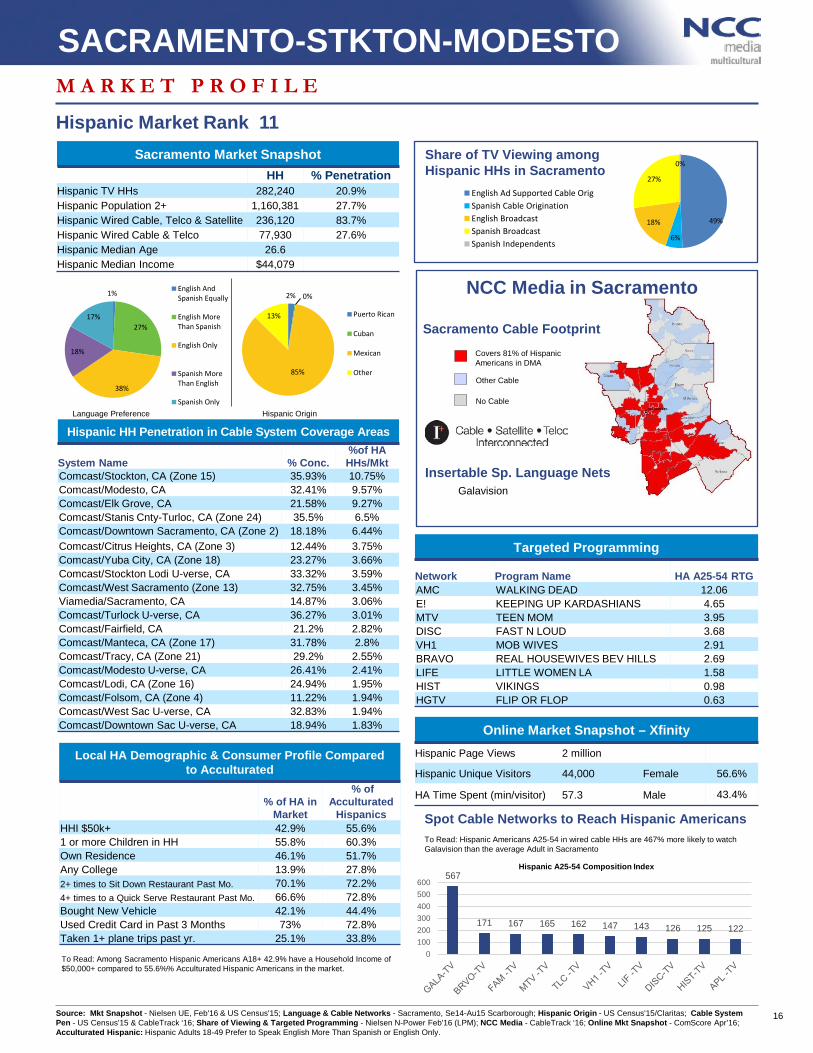
SACRAMENTO-STKTON-MODESTO
Hispanic Market Rank 11 Sacramento Market Snapshot
HH % Penetration Hispanic TV HHs 282,240 20.9% Hispanic Population 2+ 1,160,381 27.7% Hispanic Wired Cable, Telco & Satellite 236,120 83.7% Hispanic Wired Cable & Telco 77,930 27.6% Hispanic Median Age 26.6 Hispanic Median Income $44,079
Sacramento Cable Footprint
Galavision
Covers 81% of Hispanic Americans in DMA
Other Cable
No Cable
Hispanic HH Penetration in Cable System Coverage Areas
System Name % Conc. %of HA HHs/Mkt
Comcast/Stockton, CA (Zone 15) 35.93% 10.75% Comcast/Modesto, CA 32.41% 9.57% Comcast/Elk Grove, CA 21.58% 9.27% Comcast/Stanis Cnty-Turloc, CA (Zone 24) 35.5% 6.5% Comcast/Downtown Sacramento, CA (Zone 2) 18.18% 6.44% Comcast/Citrus Heights, CA (Zone 3) 12.44% 3.75% Comcast/Yuba City, CA (Zone 18) 23.27% 3.66% Comcast/Stockton Lodi U-verse, CA 33.32% 3.59% Comcast/West Sacramento (Zone 13) 32.75% 3.45% Viamedia/Sacramento, CA 14.87% 3.06% Comcast/Turlock U-verse, CA 36.27% 3.01% Comcast/Fairfield, CA 21.2% 2.82% Comcast/Manteca, CA (Zone 17) 31.78% 2.8% Comcast/Tracy, CA (Zone 21) 29.2% 2.55% Comcast/Modesto U-verse, CA 26.41% 2.41% Comcast/Lodi, CA (Zone 16) 24.94% 1.95% Comcast/Folsom, CA (Zone 4) 11.22% 1.94% Comcast/West Sac U-verse, CA 32.83% 1.94% Comcast/Downtown Sac U-verse, CA 18.94% 1.83%
Targeted Programming
Network Program Name HA A25-54 RTG AMC WALKING DEAD 12.06 E! KEEPING UP KARDASHIANS 4.65 MTV TEEN MOM 3.95 DISC FAST N LOUD 3.68 VH1 MOB WIVES 2.91 BRAVO REAL HOUSEWIVES BEV HILLS 2.69 LIFE LITTLE WOMEN LA 1.58 HIST VIKINGS 0.98 HGTV FLIP OR FLOP 0.63
Online Market Snapshot – Xfinity Hispanic Page Views 2 million
Hispanic Unique Visitors 44,000 Female 56.6%
HA Time Spent (min/visitor) 57.3 Male 43.4%
Spot Cable Networks to Reach Hispanic Americans To Read: Hispanic Americans A25-54 in wired cable HHs are 467% more likely to watch Galavision than the average Adult in Sacramento
Hispanic A25-54 Composition Index
NCC Media in Sacramento
Language Preference
2% 0%
85%
13% Puerto Rican
Cuban
Mexican
Other
Hispanic Origin
Share of TV Viewing among Hispanic HHs in Sacramento
Insertable Sp. Language Nets
Source: Mkt Snapshot - Nielsen UE, Feb'16 & US Census'15; Language & Cable Networks - Sacramento, Se14-Au15 Scarborough; Hispanic Origin - US Census'15/Claritas; Cable System Pen - US Census'15 & CableTrack ‘16; Share of Viewing & Targeted Programming - Nielsen N-Power Feb'16 (LPM); NCC Media - CableTrack ‘16; Online Mkt Snapshot - ComScore Apr’16; Acculturated Hispanic: Hispanic Adults 18-49 Prefer to Speak English More Than Spanish or English Only.
Local HA Demographic & Consumer Profile Compared to Acculturated
% of HA in Market
% of Acculturated
Hispanics HHI $50k+ 42.9% 55.6% 1 or more Children in HH 55.8% 60.3% Own Residence 46.1% 51.7% Any College 13.9% 27.8% 2+ times to Sit Down Restaurant Past Mo. 70.1% 72.2% 4+ times to a Quick Serve Restaurant Past Mo. 66.6% 72.8% Bought New Vehicle 42.1% 44.4% Used Credit Card in Past 3 Months 73% 72.8% Taken 1+ plane trips past yr. 25.1% 33.8%
To Read: Among Sacramento Hispanic Americans A18+ 42.9% have a Household Income of $50,000+ compared to 55.6%% Acculturated Hispanic Americans in the market.
567
171 167 165 162 147 143 126 125 122
0100200300400500600
16

42%
8% 19%
31%
1%
English Ad Supported Cable OrigSpanish Cable OriginationEnglish BroadcastSpanish BroadcastSpanish Independents
1%
35%
42%
15%
8%
English AndSpanish Equally
English MoreThan Spanish
English Only
Spanish MoreThan English
Spanish Only
M A R K E T P R O F I L E
SAN ANTONIO
Hispanic Market Rank 7 San Antonio Market Snapshot
HH % Penetration Hispanic TV HHs 443,440 48.9% Hispanic Population 2+ 1,487,980 55.8% Hispanic Wired Cable, Telco & Satellite 365,490 82.4% Hispanic Wired Cable & Telco 215,190 48.5% Hispanic Median Age 30.3 Hispanic Median Income $43,219
San Antonio Cable Footprint Covers 82% of Hispanic Americans in DMA
Other Cable
No Cable
Hispanic HH Penetration in Cable System Coverage Areas
System Name % Conc. % of HA HHs/Mkt
Time Warner/San Antonio Central, TX 65.63% 31.47% Time Warner/North West, TX 49.09% 9.85% Time Warner/SA South West U-verse, TX 75.33% 8.74% Suddenlink/Del Rio-Eagle Pass-Uvalde, TX 80.28% 8.19% Time Warner/SA North West U-verse, TX 49.09% 7.05% Time Warner/North Central, TX 34.78% 6.32% Time Warner/North East, TX 29.82% 6.19% Time Warner/SA North Central U-verse, TX 35.65% 3.7%
Targeted Programming
Network Program Name HA A25-54 RTG AMC WALKING DEAD 9.99 MTV TEEN MOM 2.84 USA WWE ENTERTAINMENT 2.08 VH1 LOVE AND HIP HOP 2.06 E! KEEPING UP KARDASHIANS 1.90 BRAVO VANDERPUMP RULES 1.58 DISC GOLD RUSH 1.36 HGTV FIXER UPPER 1.16 LIFE LITTLE WOMEN LA 1.13
Online Market Snapshot – TWC Central Hispanic Cume 118,000
Female 45.8%
Male 54.2%
Spot Cable Networks to Reach Hispanic Americans To Read: Hispanic Americans A25-54 in wired cable HHs are 81% more likely to watch Galavision than the average Adult in San Antonio
Hispanic A25-54 Composition Index
NCC Media in San Antonio
Language Preference
2% 0%
85%
14% Puerto Rican
Cuban
Mexican
Other
Hispanic Origin
Share of TV Viewing among Hispanic HHs
Insertable Sp. Language Nets Galavision UVSO
Source: Mkt Snapshot -Nielsen UE, Feb’16 & US Census'15; Language & Cable Networks- San Antonio, Au14-Jl15 Scarborough; Hispanic Origin-US Census'15/Claritas; Cable System Pen-US Census'15, CableTrack ‘16; Share of Viewing, Targeted Programming-Nielsen N-Power Feb'16 (Nat’l data); NCC Media -CableTrack ‘16; Online Mkt Snapshot-Scarborough San Antonio Aug14-Jul15; Acculturated Hispanics: Hispanic Adults 18-49 Prefer to Speak English More than Spanish or English Only.
Local HA Demographic & Consumer Profile Compared to Acculturated
% of HA in Market
% of Acculturated
Hispanics HHI $50k+ 41.6% 44.8% 1 or more Children in HH 43.8% 62.3% Own Residence 58.8% 49.6% Any College 13.7% 26.6% 2+ times to Sit Down Restaurant Past Mo. 73.5% 75.8% 4+ times to a Quick Serve Restaurant Past Mo. 74% 82.1% Bought New Vehicle 39.7% 35.7% Used Credit Card in Past 3 Months 71% 77% Taken 1+ plane trips past yr. 26.6% 29.8% To Read: Among San Antonio Hispanic Americans A18+ 41.6% have a Household Income of $50,000+ compared to 44.8% Acculturated Hispanic Americans in the market.
181 169 155 147 145 145 138 138 137 137
0
50
100
150
200
17

42%
8% 19%
31%
1%
English Ad Supported Cable OrigSpanish Cable OriginationEnglish BroadcastSpanish BroadcastSpanish Independents
0%
34%
23%
21%
22%
English AndSpanish Equally
English MoreThan Spanish
English Only
Spanish MoreThan English
Spanish Only
M A R K E T P R O F I L E
SAN DIEGO
Hispanic Market Rank 12 San Diego Market Snapshot
HH % Penetration Hispanic TV HHs 263,390 25.0% Hispanic Population 2+ 1,086,596 33.4% Hispanic Wired Cable, Telco & Satellite 215,760 81.9% Hispanic Wired Cable & Telco 148,340 56.3% Hispanic Median Age 28.4 Hispanic Median Income $46,030
San Diego Cable Footprint
CNN en Español ESPN Deportes FOX Deportes
Covers 87% of Hispanic Americans in DMA
Other Cable
No Cable
Hispanic HH Penetration in Cable System Coverage Areas
System Name % Conc. % of HA HHs/Mkt Cox Media/Central-South Zone, CA 36.28% 35.3% Cox Media/San Diego U-verse Zone, CA 24.36% 26.56% Cox Media/North Zone, CA 24.29% 15.91% Cox Media/East Zone, CA 19.72% 9.2%
Targeted Programming
Network Program Name HA A25-54 RTG AMC WALKING DEAD 9.99 MTV TEEN MOM 2.84 USA WWE ENTERTAINMENT 2.08 VH1 LOVE AND HIP HOP 2.06 E! KEEPING UP KARDASHIANS 1.90 BRAVO VANDERPUMP RULES 1.58 DISC GOLD RUSH 1.36 HGTV FIXER UPPER 1.16 LIFE LITTLE WOMEN LA 1.13
Online Market Snapshot – Cox.com Hispanic Page Views 1 million
Hispanic Unique Visitors 54,000 Female 38.2%
HA Time Spent (min/visitor) 8.9 Male 61.8%
Spot Cable Networks to Reach Hispanic Americans To Read: Hispanic Americans A25-54 in wired cable HHs are 269% more likely to watch GALA than the average Adult in San Diego
Hispanic A25-54 Composition Index
NCC Media in San Diego
Language Preference
2% 1%
88%
10% Puerto Rican
Cuban
Mexican
Other
Hispanic Origin
Share of TV Viewing among Hispanic HHs
Insertable Sp.Language Nets
Galavision TWCD UVSO
Source: Mkt Snapshot -Nielsen UE, Feb’16 & US Census'15; Language & Cable Networks- San Diego, Au14-Jl15 Scarborough; Hispanic Origin-US Census'15/Claritas; Cable System Pen-US Census'15, CableTrack ‘16; Share of Viewing, Targeted Programming-Nielsen N-Power Feb'16 (Nat’l data); NCC Media -CableTrack ‘16; Online Mkt Snapshot-ComScore Apr’16; Acculturated Hispanic: Hispanic Adult 18-49 Prefer to Speak English More Than Spanish or English Only.
Local HA Demographic & Consumer Profile Compared to Acculturated
% of HA in Market
% of Acculturated
Hispanics HHI $50k+ 42.4% 51.5% 1 or more Children in HH 57.7% 67% Own Residence 43% 43.2% Any College 13.5% 27.3% 2+ times to Sit Down Restaurant Past Mo. 69.8% 73.6% 4+ times to a Quick Serve Restaurant Past Mo. 67.5% 70.9% Bought New Vehicle 51% 48.9% Used Credit Card in Past 3 Months 75.4% 77.1% Taken 1+ plane trips past yr. 36.3% 37.9%
To Read: Among San Diego Hispanic Americans A18+ 42.4% have a Household Income of $50,000+ compared to 51.5% Acculturated Hispanic Americans in the market.
369
216
129 120 119 114 111 109 109 108
050
100150200250300350400
18

42%
9% 19%
30%
0%
English Ad Supported Cable OrigSpanish Cable OriginationEnglish BroadcastSpanish BroadcastSpanish Independents
2%
29%
34%
19%
17%
English AndSpanish Equally
English MoreThan Spanish
English Only
Spanish MoreThan English
Spanish Only
M A R K E T P R O F I L E
SAN FRANCISCO-OAK-SAN JOSE
Hispanic Market Rank 8 San Francisco Market Snapshot
HH % Penetration Hispanic TV HHs 426,450 17.2% Hispanic Population 2+ 1,775,830 23.9% Hispanic Wired Cable, Telco & Satellite 374,870 87.9% Hispanic Wired Cable & Telco 221,690 52.0% Hispanic Median Age 29.2 Hispanic Median Income $58,261
San Francisco Cable Footprint
FOX Deportes Galavision
Covers 81% of Hispanic Americans in DMA
Other Cable
No Cable
Hispanic HH Penetration in Cable System Coverage Areas
System Name % Conc. % of HA HHs/Mkt Comcast/San Jose Zone, CA 25.2% 15.4% Comcast/San Francisco Zone, CA 11.63% 9.14% Comcast/Hayward Zone, CA 23.27% 6.49% Comcast/Berkeley Zone, CA 18.48% 5.26% Comcast/Oakland Zone, CA 16.36% 5.12% Comcast/Mid-Peninsula Zone, CA 16.3% 4.92% Comcast/Delta Valley Zone, CA 27.2% 4.65% Comcast/San Jose U-verse, CA 27.84% 4.46% Comcast/North Peninsula Zone, CA 20.88% 3.36% Comcast/Silicon Valley East, CA 13.85% 3.28% Comcast/Gilroy Zone, CA 38.76% 3.04% Comcast/Contra Costa Valley Zone, CA 10.38% 3.02% Comcast/Fremont Zone, CA 15.13% 2.94% Comcast/Santa Rosa Zone, CA 19.49% 2.85% Comcast/Napa Zone, CA 21.09% 2.63% Comcast/Redwood Empire Zone, CA 13.82% 2.62% Comcast/Marin Zone, CA 9.99% 2.14%
Targeted Programming
Network Program Name HA A25-54 RTG AMC WALKING DEAD 7.25 DISC FAST N LOUD 2.39 HGTV FLIP OR FLOP 2.10 BRAVO REAL HOUSEWIVES BEV HILLS 1.45 VH1 MOB WIVES 1.10 USA WWE ENTERTAINMENT 1.10 E! KEEPING UP KARDASHIANS 1.02 HIST VIKINGS 0.55 MTV TEEN MOM 0.47
Online Market Snapshot – Xfinity Hispanic Page Views 7 million
Hispanic Unique Visitors 86,000 Female 52.4%
HA Time Spent (min/visitor) 115.2 Male 47.6%
Spot Cable Networks to Reach Hispanic Americans To Read: Hispanic Americans A25-54 in wired cable HHs are 394% more likely to watch Galavision than the average Adult in San Francisco
Hispanic A25-54 Composition Index
NCC Media in San Francisco
Language Preference
2% 1%
73%
23%
Puerto Rican
Cuban
Mexican
Other
Hispanic Origin
Share of TV Viewing among Hispanic HHs in San Francisco
Insertable Sp. Language Nets
Source: Mkt Snapshot - Nielsen UE, Feb’16 & US Census'15; Language & Cable Networks – San Francisco, Au14-Jl15 Scarborough; Hispanic Origin - US Census'15/Claritas; Cable System Pen - US Census'15 & CableTrack ‘16; Share of Viewing & Targeted Programming - Nielsen N-Power Feb'16 (LPM); NCC Media - CableTrack ‘16; Online Mkt Snapshot - ComScore Apr’16; Acculturated Hispanic: Hispanic Adults 18-49 Prefer to Speak English More than Spanish or English Only.
Local HA Demographic & Consumer Profile Compared to Acculturated
% of HA in Market
% of Acculturated
Hispanics HHI $50k+ 46.8% 64.6% 1 or more Children in HH 59% 59.9% Own Residence 37% 43.1% Any College 19.2% 36% 2+ times to Sit Down Restaurant Past Mo. 63% 67.3% 4+ times to a Quick Serve Restaurant Past Mo. 52.2% 59.9% Bought New Vehicle 48.9% 46.5% Used Credit Card in Past 3 Months 78% 84.5% Taken 1+ plane trips past yr. 34.2% 46.5%
To Read: Among San Francisco Hispanic Americans A18+ 46.8% have a Household Income of $50,000+ compared to 64.6% Acculturated Hispanic Americans in the market.
494 476 411 389
190 159 143 141 139 138
0100200300400500600
19

44%
8% 16%
32%
0%
English Ad Supported Cable OrigSpanish Cable OriginationEnglish BroadcastSpanish BroadcastSpanish Independents
1%
35%
15%
30%
20%
English AndSpanish Equally
English MoreThan Spanish
English Only
Spanish MoreThan English
Spanish Only
M A R K E T P R O F I L E
TAMPA-ST. PETE (SARASOTA)
Hispanic Market Rank 20 Tampa-St. Pete Market Snapshot
HH % Penetration Hispanic TV HHs 234,260 12.6% Hispanic Population 2+ 773,429 16.9% Hispanic Wired Cable, Telco & Satellite 201,860 86.2% Hispanic Wired Cable & Telco 146,140 62.4% Hispanic Median Age 29.9 Hispanic Median Income $38,598
Tampa-St. Pete Cable Footprint
ESPN Deportes FOX Deportes Galavision
Covers 82% of Hispanic Americans in DMA
Other Cable
No Cable
Hispanic HH Penetration in Cable System Coverage Areas
System Name %
Conc. % of HA HHs/Mkt
Viamedia/Verizon-Hillsborough North, FL 24.96% 13.86% Bright House Networks/North Tampa, FL 24.91% 10.37% Bright House Networks/Polk County, FL 12.88% 9.83% Viamedia/Verizon-Hillsborough South, FL 16.77% 8.37% Bright House Net/Hillsborough East, FL 17.5% 7.02% Bright House Networks/South Tampa, FL 23.5% 6.41% Bright House Networks/Pasco County, FL 10.09% 5.15% Bright House Network/Citrus-Hernando, FL 7.03% 3.98% Bright House Networks/Manatee, FL 9.6% 3.79% Bright House Networks/North Pinellas, FL 7.42% 3.69% Comcast/Sebring, FL 16.02% 3.45% Bright House Network/Middle Pinellas, FL 6.73% 3.37% Viamedia/Verizon-Pas-Citrus-Hernando, FL 9.27% 3.12%
Targeted Programming
Network Program Name HA A25-54 RTG AMC WALKING DEAD 9.72 USA WWE ENTERTAINMENT 3.79 HIST VIKINGS 2.00 VH1 MOB WIVES 1.71 E! TOTAL DIVAS 1.58 MTV TEEN MOM 1.57 BRAVO VANDERPUMP RULES 1.35 DISC FAST N LOUD 0.75 HGTV FLIP OR FLOP 0.60
Online Market Snapshot – BAYNEWS9.COM Hispanic Cume 82,000
Female 53.0%
Male 47.0%
Spot Cable Networks to Reach Hispanic Americans To Read: Hispanic Americans A18+ in wired cable HHs are 503% more likely to watch Galavision than the average Adult in Tampa-St. Pete
Hispanic A18+ Composition Index
NCC Media in Tampa-St. Pete
Language Preference
30%
14% 30%
26%
Puerto Rican
Cuban
Mexican
Other
Hispanic Origin
Share of TV Viewing among Hispanic HHs in Tampa-St. Pete
Insertable Sp. Language Nets InfoMas WAPA
Source: Mkt Snapshot - Nielsen UE, Feb'16 & US Census'15; Language & Cable Networks – Tampa-St. Pete, Au14-Jl15 Scarborough; Hispanic Origin - US Census'15/Claritas; Cable System Pen - US Census'15 & CableTrack ‘16; Share of Viewing & Targeted Programming - Nielsen N-Power Feb'16 (LPM); NCC Media – CableTrack ‘16; Online Mkt Snapshot – Scarborough Tampa Aug14-Jul15; Acculturated Hispanic: Hispanic Adults 18-49 Prefer to Speak English More than Spanish or English Only.
Local HA Demographic & Consumer Profile Compared to Acculturated
% of HA in Market
% of Acculturated
Hispanics HHI $50k+ 31.1% 38.2% 1 or more Children in HH 54.4% 64% Own Residence 49.3% 59.6% Any College 18.8% 34.8% 2+ times to Sit Down Restaurant Past Mo. 69.5% 62.9% 4+ times to a Quick Serve Restaurant Past Mo. 59.1% 56.2% Bought New Vehicle 33% 42.7% Used Credit Card in Past 3 Months 74% 74.2% Taken 1+ plane trips past yr. 40.1% 27% To Read: Among Tampa Hispanic Americans A18+ 31.1% have a Household Income of $50,000+ compared to 38.2% Acculturated Hispanic Americans in the market. 603
160 124 122 118 117 113 113 107 107
0100200300400500600700
20

41%
15% 14%
30%
0%
English Ad Supported Cable OrigSpanish Cable OriginationEnglish BroadcastSpanish BroadcastSpanish Independents
4%
25%
19% 33%
19%
English AndSpanish Equally
English MoreThan Spanish
English Only
Spanish MoreThan English
Spanish Only
M A R K E T P R O F I L E
WASHINGTON DC
Hispanic Market Rank 18 Washington DC Market Snapshot
HH % Penetration Hispanic TV HHs 241,770 9.9% Hispanic Population 2+ 959,084 14.0% Hispanic Wired Cable, Telco & Satellite 227,210 94.0% Hispanic Wired Cable & Telco 184,890 76.5% Hispanic Median Age 29.3 Hispanic Median Income $68,769
Washington DC Cable Footprint
CNN en Español Discovery en Español ESPN Deportes
Covers 82% of Hispanic Americans in DMA
Other Cable
No Cable
Hispanic HH Penetration in Cable System Coverage Areas
System Name % Conc. % of HA HHs/Mkt Comcast/Prince George's, MD-North 16.07% 10.72% Comcast/The District Of Columbia, DC 8.14% 8.85% Comcast/Montgomery, MD-East 15.94% 8.7% Comcast/Fairfax County, VA 11.63% 8.19% Comcast/Verizon-Fairfax South, DC 14.77% 6.89% Comcast/Montgomery North, MD 15.71% 6.73% Comcast/Prince William, VA-East 17.89% 5.78% Comcast/Prince William West, VA 12.49% 5.38% Comcast/Loudoun, VA 9.82% 4.81% Comcast/Arlington, VA 10.74% 4.77% Comcast/Montgomery Central, MD 8.64% 4.68% Comcast/Verizon-Fairfax North, DC 9.22% 3.24% Comcast/Alexandria, VA 11.24% 2.91%
Targeted Programming
Network Program Name HA A25-54 RTG AMC WALKING DEAD 8.09 HIST VIKINGS 3.63 BRAVO REAL HOUSEWIVES ATLANTA 2.93 MTV TEEN MOM 2.72 LIFE LITTLE WOMEN LA 1.11 USA WWE ENTERTAINMENT 0.66 E! KEEPING UP KARDASHIANS 0.57 DISC GOLD RUSH 0.45 VH1 MOB WIVES 0.18
Online Market Snapshot – NCC Gateway Hispanic Page Views 1 million
Hispanic Unique Visitors 89,000 Female 33.5%
HA Time Spent (min/visitor) 10.3 Male 66.5%
Spot Cable Networks to Reach Hispanic Americans To Read: Hispanic Americans A18+ in wired cable HHs are 685% more likely to watch CNNE than the average Adult in Washington DC
Hispanic A18+ Composition Index
NCC Media in Washington DC
Language Preference
7%
2%
16%
75%
Puerto Rican
Cuban
Mexican
Other
Hispanic Origin
Share of TV Viewing among Hispanic HHs in Washington DC
Insertable Sp. Language Nets FOX Deportes Galavision History en Español
TR3S UDN UVSO
Source: Mkt Snapshot - Nielsen UE, Feb’16 & US Census'15; Language & Cable Networks – Washington DC, Se14-Au15 Scarborough; Hispanic Origin - US Census'15/Claritas; Cable System Pen - US Census'15 & CableTrack ‘16; Share of Viewing & Targeted Programming - Nielsen N-Power Feb'16 (LPM); NCC Media – CableTrack ‘16; Online Mkt Snapshot - ComScore Apr’16; Acculturated Hispanic: Hispanic Adults 18-49 Prefer to Speak English More than Spanish or English Only.
Local HA Demographic & Consumer Profile Compared to Acculturated
% of HA in Market
% of Acculturated
Hispanics HHI $50k+ 49.2% 67.7% 1 or more Children in HH 57.1% 64.6% Own Residence 37.6% 48.5% Any College 20.6% 40.8% 2+ times to Sit Down Restaurant Past Mo. 68.1% 77.7% 4+ times to a Quick Serve Restaurant Past Mo. 59.9% 73.1% Bought New Vehicle 41.7% 55.4% Used Credit Card in Past 3 Months 81.4% 85.4% Taken 1+ plane trips past yr. 40.1% 52.3%
To Read: Among Washington DC Hispanic Americans A18+ 49.2% have a Household Income of $50,000+ compared to 67.7% Acculturated Hispanic Americans in the market. 785 778 735
623
168 162 132 107 101
0100200300400500600700800900
21


NCC Media The Chrysler Building 405 Lexington Ave. 6th Floor New York, NY 10174 Phone: 212.548.3300
Atlanta 404.267.0254 Boston 617.267.0077 Chicago 312.527.5755 Cleveland 216.901.9295 Dallas 214.932.2910 Denver 303.273.0012 Detroit 248.728.0800 Kansas City 913.663.5013 Los Angeles 310.254.2220 Miami 305.443.9050 Minneapolis 612.334.3310 San Francisco 415.844.1440 Seattle 206.903.6440 St. Louis 314.290.7000 Washington, DC 301.951.2620

TARGETING
HISPANIC
CONSUMERS ON
EVERY SCREEN

ARE HISPANICS INTEGRAL TO YOUR MEDIA AND MARKETING STRATEGY?
Marketers under pressure to find expansion opportunities
55 Million U.S. Hispanic market today
75–90 Million U.S. Hispanic market 2020
Growing bi-cultural, bi-lingual consumer audience
28.1 Median age of U.S. Hispanic
Population. Significant Millennial
population 10 years younger than
average U.S. 37.6 years
There’s ample opportunity to build business for your brand:
$1.5 Trillion 2015 consumer buying power
If not they should be…
U.S. Hispanic Population Growth (in millions)
9.6 14.5
22.6
35.7
50.8 55.4
75.0
90.0
0.0
20.0
40.0
60.0
80.0
100.0
1970 1980 1990 2000 2010 2014 2020

HOW SIGNIFICANT IS HISPANIC ECONOMIC BUYING POWER?
If Hispanic consumers 18–49 stopped buying cars the
auto industry would lose $2.2B in revenue in a week.
AUTO
Weekly: –$2.2B
Monthly: –$9B
Yearly: –$115B
Source: 2015 Doublebase GfK MRI; Respondents who identify them selves as Hispanic
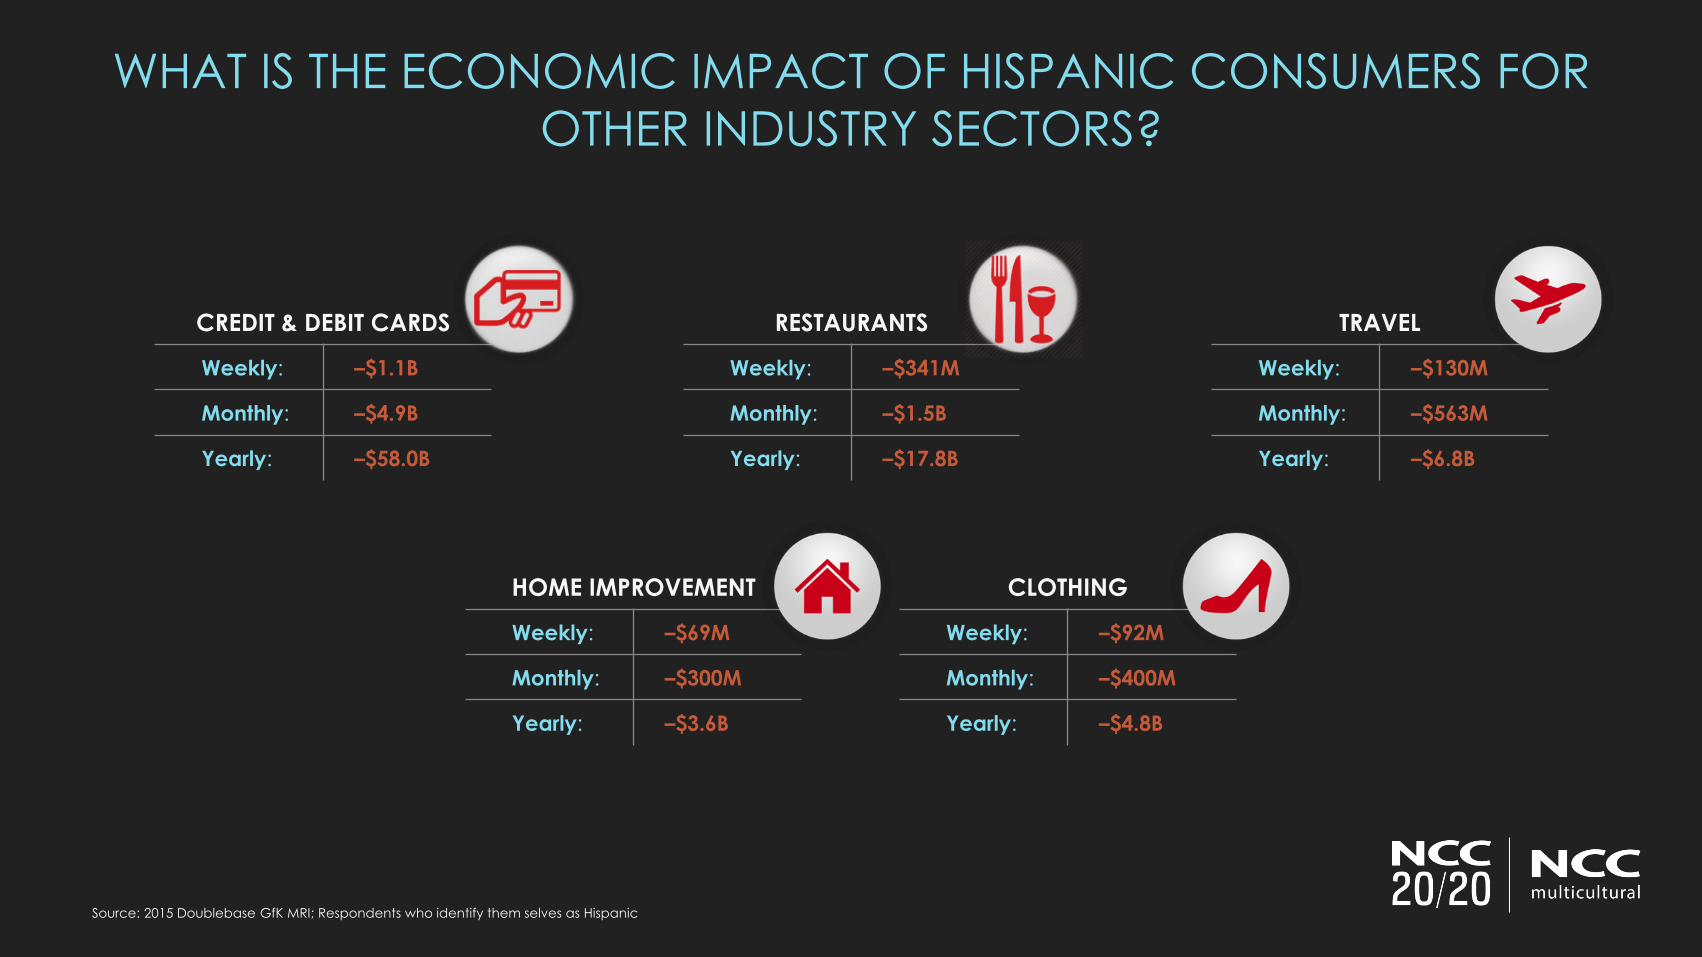
WHAT IS THE ECONOMIC IMPACT OF HISPANIC CONSUMERS FOR
OTHER INDUSTRY SECTORS?
CLOTHING
Weekly: –$92M
Monthly: –$400M
Yearly: –$4.8B
HOME IMPROVEMENT
Weekly: –$69M
Monthly: –$300M
Yearly: –$3.6B
RESTAURANTS
Weekly: –$341M
Monthly: –$1.5B
Yearly: –$17.8B
CREDIT & DEBIT CARDS
Weekly: –$1.1B
Monthly: –$4.9B
Yearly: –$58.0B
TRAVEL
Weekly: –$130M
Monthly: –$563M
Yearly: –$6.8B
Source: 2015 Doublebase GfK MRI; Respondents who identify them selves as Hispanic
Hispanics are 54% more likely to watch video on a Smartphone and 43%
more likely to watch video on a PC than the general population.
HISPANICS SPEND MORE TIME WITH SMARTPHONE AND PC VIDEO
(Monthly Hours : Minutes)
Smartphone
Video
PC
Video
Hispanic 3:24 19:49
Total
Composite 2:12 13:52
Hispanic
Index 154 143
Source: Nielsen Total Audience Report 4Q15; Hispanic data reflects English and Spanish dominate

That’s 3 times the growth rate for cable subscribers in general.
HISPANICS DROVE CABLE GROWTH BY +12% IN RECENT YEARS
2008-2015 CABLE & SATELLITE
HH UNIVERSE COMPARISON (000)
Year Hispanic
2008 11,023
2015 12,320
% Growth +12%
# HHs 1,297
Source: VAB Nielsen Media Universe Estimates, 2008-2015

WHAT DO HISPANIC VIEWERS WATCH?
• Hispanics 18–49 in general spend 58% of
their television viewing time with ad-
supported English or Spanish language
cable
• As of 2nd Q 2016, Galavision is now
insertable on DirecTV
Hispanic viewers prefer ad supported cable over English and Spanish
language broadcast programming.
Source: Nielsen N-Power, P18-49 November 2015 (M-Su 6a-12a), Spanish Language Broadcast defined as Univision, Telemundo, MundoMAX, Estrella, TV Azteca and Unimas.
English Broadcast defined as ABC, NBC, CBS, FOX, CW. Ad Supported Cable defined all Spanish & English language ad supported networks
% of Viewing
P18-49 Hispanic TV Viewers
21%
21%
58%
English Broadcast
Spanish Broadcast
Ad –Supported Cable
According to Nielsen NPower, in November 2015, 60% of Hispanics tuned to
one of the Spanish language broadcasters for at least 6 minutes.
DO HISPANIC BROADCAST NETWORKS DELIVER ALL HISPANICS?
What does that mean???
40% of all Hispanics NEVER tuned to any Spanish language broadcaster in
an entire month
52% didn’t tune in for more than an hour cumulatively in a month.
Source: NPower November 2015.

PROGRAMMING APPEAL AMONG HISPANICS What are Hispanic audiences watching?
Nearly 60% of all Hispanic 18-49 viewing goes to ad supported cable.

ENTERTAINMENT & MUSIC
AMC’s “The Walking Dead” was the highest rated English language program among all Hispanics in 2015
SPORTS
Alysia
Montaño
Running
In 2015, Monday Night Football ranked as the highest rated non-Spanish language program among Hispanics.

AVAILABLE SPANISH LANGUAGE CABLE NETWORKS
FOR AD INSERTION
LOS
AN
GEL
ES
NEW
YO
RK
MIA
MI
HO
UST
ON
DA
LLA
S
CH
ICA
GO
SAN
AN
TON
IO
SAN
FR
AN
CIS
CO
PH
OEN
IX
HA
RLI
NG
EN
SAC
RA
MEN
TO
SAN
DIE
GO
FRES
NO
OR
LAN
DO
ALB
UQ
UER
QU
E
PH
ILA
DEL
PH
IA
DEN
VER
WA
SHIN
GTO
N,
DC
EL P
ASO
TAM
PA
BO
STO
N
AU
STIN
ATL
AN
TA
LAS
VEG
AS
TUC
SON
SEA
TTLE
CO
RP
US
CH
RIS
TI
WES
T P
ALM
BEA
CH
HA
RTF
OR
D
BA
KER
SFIE
LD
PO
RTL
AN
D
SALT
LA
KE
CIT
Y
RA
LEIG
H
MO
NTE
REY
CH
AR
LOTT
E
LAR
EDO
YU
MA
WA
CO
-TEM
PLE
-BR
YA
N
MIL
WA
UK
EE
SAN
TA B
AR
BA
RA
-SA
NTA
MA
RIA
-SA
N L
UIS
OB
ISP
O
NETS Hispanic Mkt Rank: 1 2 3 4 5 6 7 8 9 10 11 12 13 14 15 16 17 18 19 20 21 22 23 24 25 26 27 28 29 30 31 32 33 34 35 36 37 38 39 40
BEINE BeIN Sports Español
CNNE CNN en Español
DSPA / DSE Discovery en Español
DXDE Disney XD en Español
ELLA Canal ELLA
ESPD ESPN Deportes
FOXD FOX Deportes
GALA Galavisión
GOL GOL TV
HESP / HSTE History Channel en Español
HTV HTV Hispanic
INFO / IMAS InfoMás
NOT1 Noticias 1
SUR Canal Sur
TDEP / TWCDTime Warner Deportes
TDES Toon Disney en Español
TMND / TELE Telemundo
TR3s MTV 3
UDN Univisión Deportes
UNV / UNI Univisión
UVSO NBC Universo (formerly Mun2)
WAPA WAPA America

UTILIZE SPANISH LANGUAGE AD CREATIVE ON ENGLISH AD
SUPPORTED CABLE NETWORKS IN SELECTED MARKETS
NCC Media offers opportunities to place culturally-themed or Spanish language ad creative
on English ad-supported cable networks in select Top 20 Hispanic markets
New York / Los Angeles / Dallas
/ San Antonio / El Paso
Miami / Houston / Sacramento San Diego
30 Networks Including: 5 Networks All Networks Including

Make deep brand impressions with passionate Hispanic consumers by running
sponsorship messages across dozens of cable networks and digital platforms.
IN-MARKET PROMOTIONS, SPONSORSHIPS AND
BRANDING OPPORTUNITIES
Olympics Promotional Example
:20 Second Profile
Market relevant local athlete
profiles feature hometown
connections
:10 Second Tag
Voice over and video tag copy:
brought to you locally by…
:10 Announcer Tag:
“Lexus. En busca de
la perfeccion.”
Some Other Opportunities For Sponsorship
Alysia
Montaño
Running
HOW DOES TV VIEWERSHIP AMONG HISPANICS BREAK
DOWN BY AGE?
Cable has millennials covered
Half of all Hispanic viewers watching ad
supported cable are under 35
Only a third of English and Spanish language
broadcast Hispanic audiences are under 35
27.0% 13.0% 16.3%
23.2%
19.9% 20.3%
50.7%
64.0% 68.1%
0%
20%
40%
60%
80%
100%
Ad Supported Cable English Broadcast Spanish Broadcast
P2-17 P18-34 P35+
Median
Age 34 46 42
Source: Nielsen NPower, November 2015

Who are they?
Why are they important to you?
How do they consume media differently than the Hispanic market in general?
ACCULTURATED HISPANICS

WHO ARE ACCULTURATED HISPANICS?
What is Acculturation?
• Incorporating/Acquiring a new culture without foregoing past cultural traditions
• They tend to be younger with an income over $50k
and prefer to speak English at home
How big is this segment?
• Geoscape identifies 45% of the Hispanic population is acculturated
• Both Hispanic households with income over $50k+
& $75k+ experienced growth in their respective
universes
Brand marketers who target acculturated Hispanic consumers will grow
their market shares
Source: Geoscape, American Landscape. DataStream. Geoscape defined Acculturated Hispanics as English dominate /
English preferred & 2nd/3rd generation. UE’s for A18-49 Acculturated Hispanic Cable Subscribers 2008 to 2015

ACCULTURATED HISPANICS STRONGLY PREFER AD SUPPORTED
CABLE OVER ENGLISH & SPANISH BROADCAST
• Acculturated Hispanics spend virtually all their TV
time with English Language networks especially Ad
Supported Cable
• Only 1% of their Television time is spent watching
Spanish Broadcast networks like Univision or Telemundo
They watch virtually no Spanish broadcast
Source: : NPower November 2015; Acculturated Hispanic defined as P1849 who speak mostly or only English and
have household income $50K+
Share of Viewing Among Acculturated Hispanics Hispanic 18-49 & HHI $50k+ & Prefer to speak only or mostly English
35%
1%
64%
English Broadcast Spanish Broadcast
Ad Supported Cable
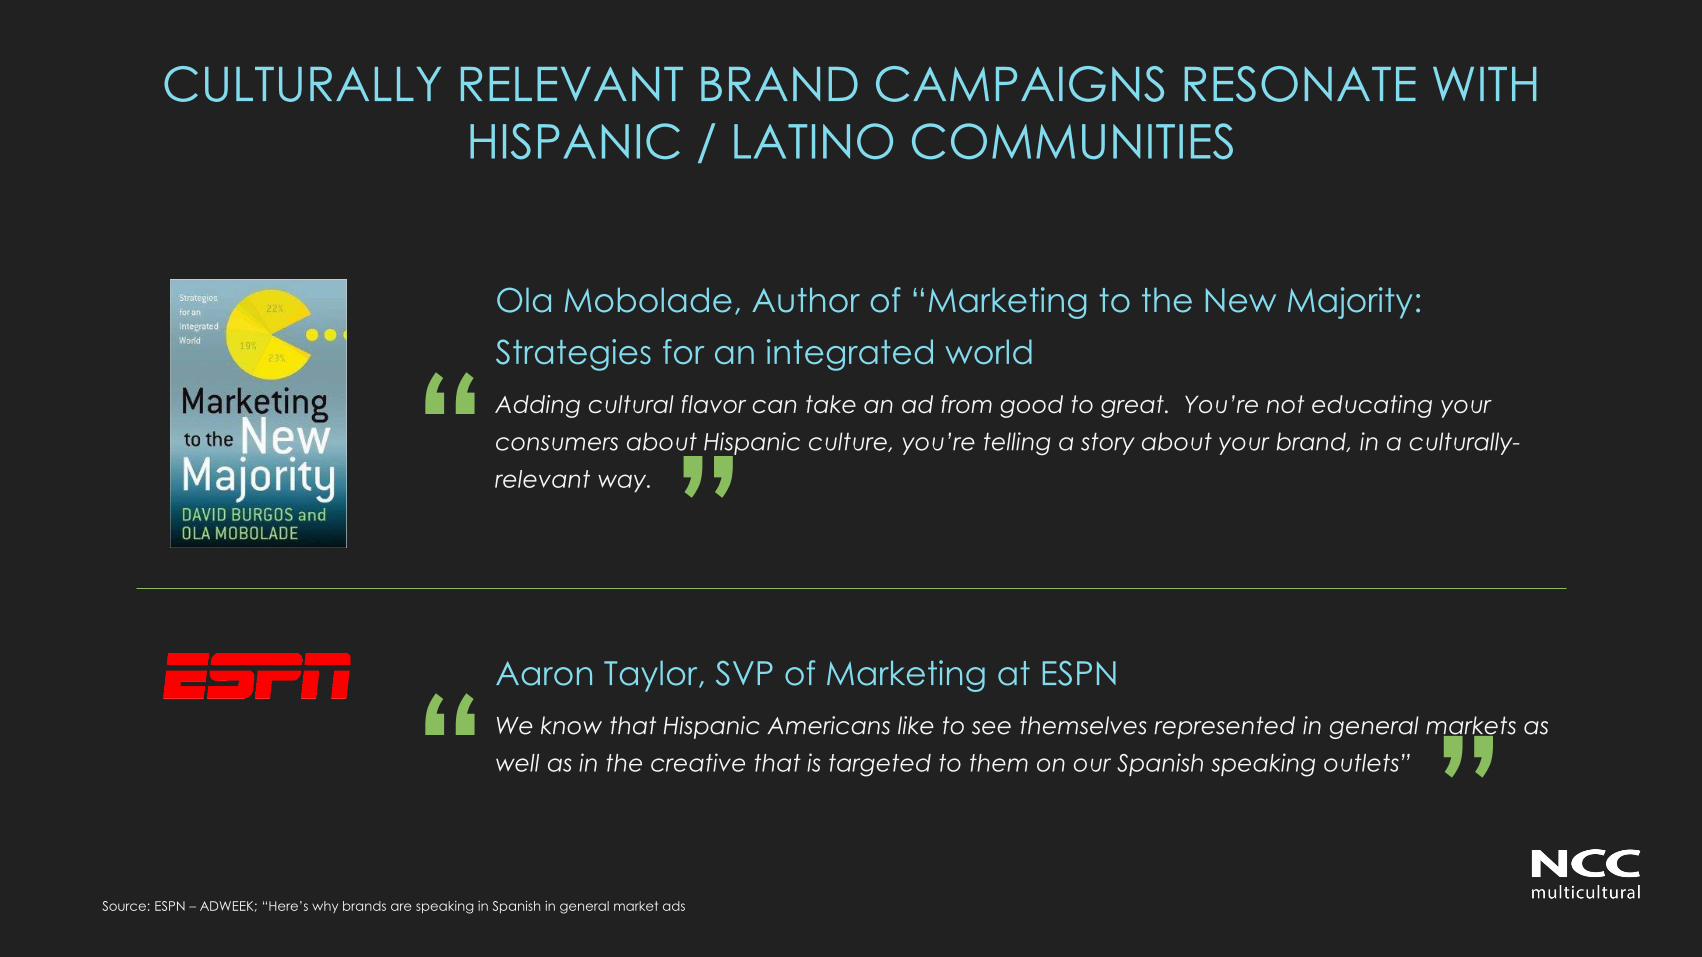
CULTURALLY RELEVANT BRAND CAMPAIGNS RESONATE WITH
HISPANIC / LATINO COMMUNITIES
Source: ESPN – ADWEEK; “Here’s why brands are speaking in Spanish in general market ads
Ola Mobolade, Author of “Marketing to the New Majority:
Strategies for an integrated world
Adding cultural flavor can take an ad from good to great. You’re not educating your
consumers about Hispanic culture, you’re telling a story about your brand, in a culturally-
relevant way.
Aaron Taylor, SVP of Marketing at ESPN
We know that Hispanic Americans like to see themselves represented in general markets as
well as in the creative that is targeted to them on our Spanish speaking outlets”
“
“
“
“

WHAT DO ACCULTURATED HISPANICS WATCH?
• Hispanic Passion Point Networks
– Food – Food Network & Cooking Channel
– Entertainment / Music – E!, MTV, LOGO,
Bravo
– Sports – MLBN, NFLN, FS1, ESPN, Reg Sports
Nets
Acculturated Hispanics 18-49
Network
Accul Hisp w/ $50k+ HHI
Indexed to Median P2+ UE
E! 206
MLBN 205
ADSM 192
FX 153
NFLN 150
Cooking Channel 145
SPK 143
AMC 143
Fox Sports 1 140
MTV 137
ESPN 135
FXX 132
TBSC 132
FAM 131
TRU 127
FOOD 126
CMDY 121
BRVO 121
CNBC 118
CNN 116
APL 115
BBCA 115
DIY 114
TLC 110
Network
Accul Hisp w/ $75k+ HHI
Indexed to Median P2+ UE
MLBN 287
ADSM 159
E! 144
NFLN 140
BRVO 135
TBSC 132
Fox Sports 1 131
ESPN 128
AMC 125
FOOD 117
ESQ 116
FYI 116
FX 115
MTV 115
FBN 114
CMDY 113
SPK 111
CNBC 110
CMT 109
NGC 109
TRU 107
POP 105
LIF 104
CNN 103
Source: Nielsen Npower ; November 2015 M-Su 6a-12a
Index of performance for $50k+ and
$75k+ 18-49 Acculturated Hispanics

Acculturated Hispanics 18-49 are much less inclined to watch English broadcast
WHAT AREN’T ACCULTURATED HISPANICS WATCHING?
An index of audience
compositions shows
Acculturated Hispanics
are 29% less likely to watch
English language
broadcast networks
Source: Nielsen Npower ; November 2015 M-Su 6a-12a
Hispanic P18-49 & mostly or only speak English & HHI $50k+
English Language
Broadcast
Acculturated Hispanic
Index to Median 2+
67
50
74
95
69
Average Index 71
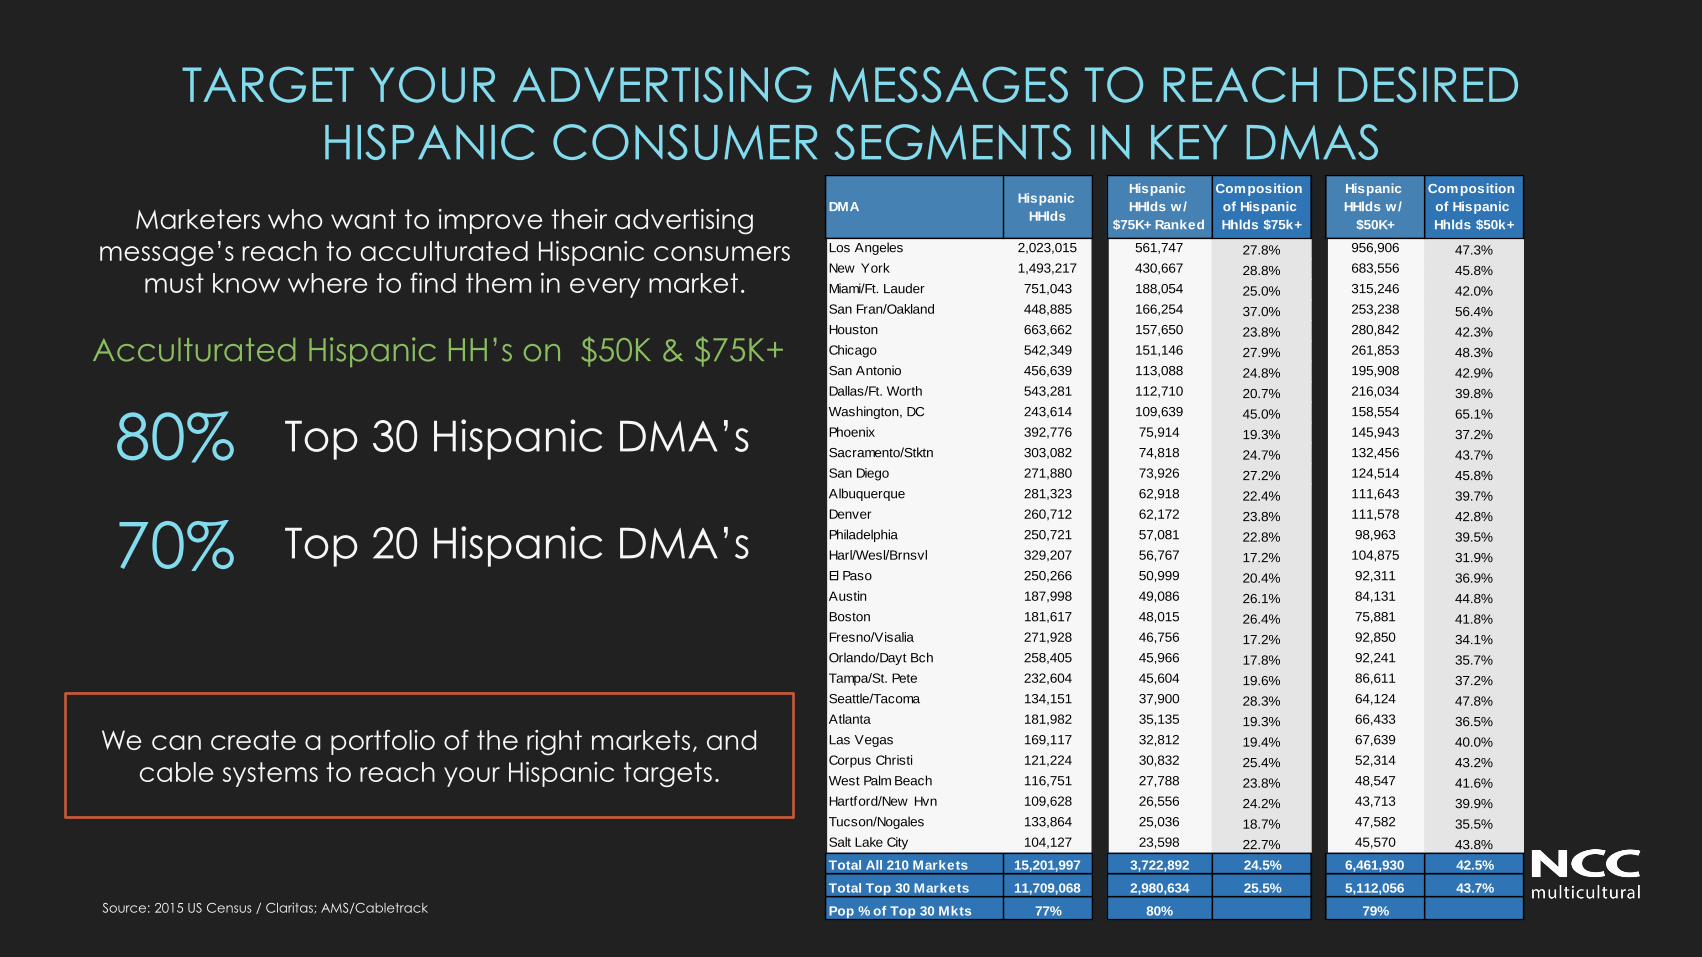
TARGET YOUR ADVERTISING MESSAGES TO REACH DESIRED
HISPANIC CONSUMER SEGMENTS IN KEY DMAS
Marketers who want to improve their advertising
message’s reach to acculturated Hispanic consumers
must know where to find them in every market.
Source: 2015 US Census / Claritas; AMS/Cabletrack
Top 30 Hispanic DMA’s
Top 20 Hispanic DMA’s
80%
70%
We can create a portfolio of the right markets, and cable systems to reach your Hispanic targets.
Acculturated Hispanic HH’s on $50K & $75K+
DMAHispanic
HHlds
Hispanic
HHlds w/
$75K+ Ranked
Composition
of Hispanic
Hhlds $75k+
Hispanic
HHlds w/
$50K+
Composition
of Hispanic
Hhlds $50k+
Los Angeles 2,023,015 561,747 27.8% 956,906 47.3%
New York 1,493,217 430,667 28.8% 683,556 45.8%
Miami/Ft. Lauder 751,043 188,054 25.0% 315,246 42.0%
San Fran/Oakland 448,885 166,254 37.0% 253,238 56.4%
Houston 663,662 157,650 23.8% 280,842 42.3%
Chicago 542,349 151,146 27.9% 261,853 48.3%
San Antonio 456,639 113,088 24.8% 195,908 42.9%
Dallas/Ft. Worth 543,281 112,710 20.7% 216,034 39.8%
Washington, DC 243,614 109,639 45.0% 158,554 65.1%
Phoenix 392,776 75,914 19.3% 145,943 37.2%
Sacramento/Stktn 303,082 74,818 24.7% 132,456 43.7%
San Diego 271,880 73,926 27.2% 124,514 45.8%
Albuquerque 281,323 62,918 22.4% 111,643 39.7%
Denver 260,712 62,172 23.8% 111,578 42.8%
Philadelphia 250,721 57,081 22.8% 98,963 39.5%
Harl/Wesl/Brnsvl 329,207 56,767 17.2% 104,875 31.9%
El Paso 250,266 50,999 20.4% 92,311 36.9%
Austin 187,998 49,086 26.1% 84,131 44.8%
Boston 181,617 48,015 26.4% 75,881 41.8%
Fresno/Visalia 271,928 46,756 17.2% 92,850 34.1%
Orlando/Dayt Bch 258,405 45,966 17.8% 92,241 35.7%
Tampa/St. Pete 232,604 45,604 19.6% 86,611 37.2%
Seattle/Tacoma 134,151 37,900 28.3% 64,124 47.8%
Atlanta 181,982 35,135 19.3% 66,433 36.5%
Las Vegas 169,117 32,812 19.4% 67,639 40.0%
Corpus Christi 121,224 30,832 25.4% 52,314 43.2%
West Palm Beach 116,751 27,788 23.8% 48,547 41.6%
Hartford/New Hvn 109,628 26,556 24.2% 43,713 39.9%
Tucson/Nogales 133,864 25,036 18.7% 47,582 35.5%
Salt Lake City 104,127 23,598 22.7% 45,570 43.8%
Total All 210 Markets 15,201,997 3,722,892 24.5% 6,461,930 42.5%
Total Top 30 Markets 11,709,068 2,980,634 25.5% 5,112,056 43.7%
Pop % of Top 30 Mkts 77% 80% 79%

HOW IS NCC MEDIA ABLE TO GEO-TARGET YOUR DESIRED
CONSUMER SEGMENTS?
• We use client proprietary data to reach
intended consumer targets
• We apply Zip Code targeting to markets
and cable systems
– brand sales
– media, lifestyle or purchasing
behaviors
Consumer Expenditure Survey
US Vehicle Registrations
Health Care Analytics
Proprietary sources can add
critical value to targeting
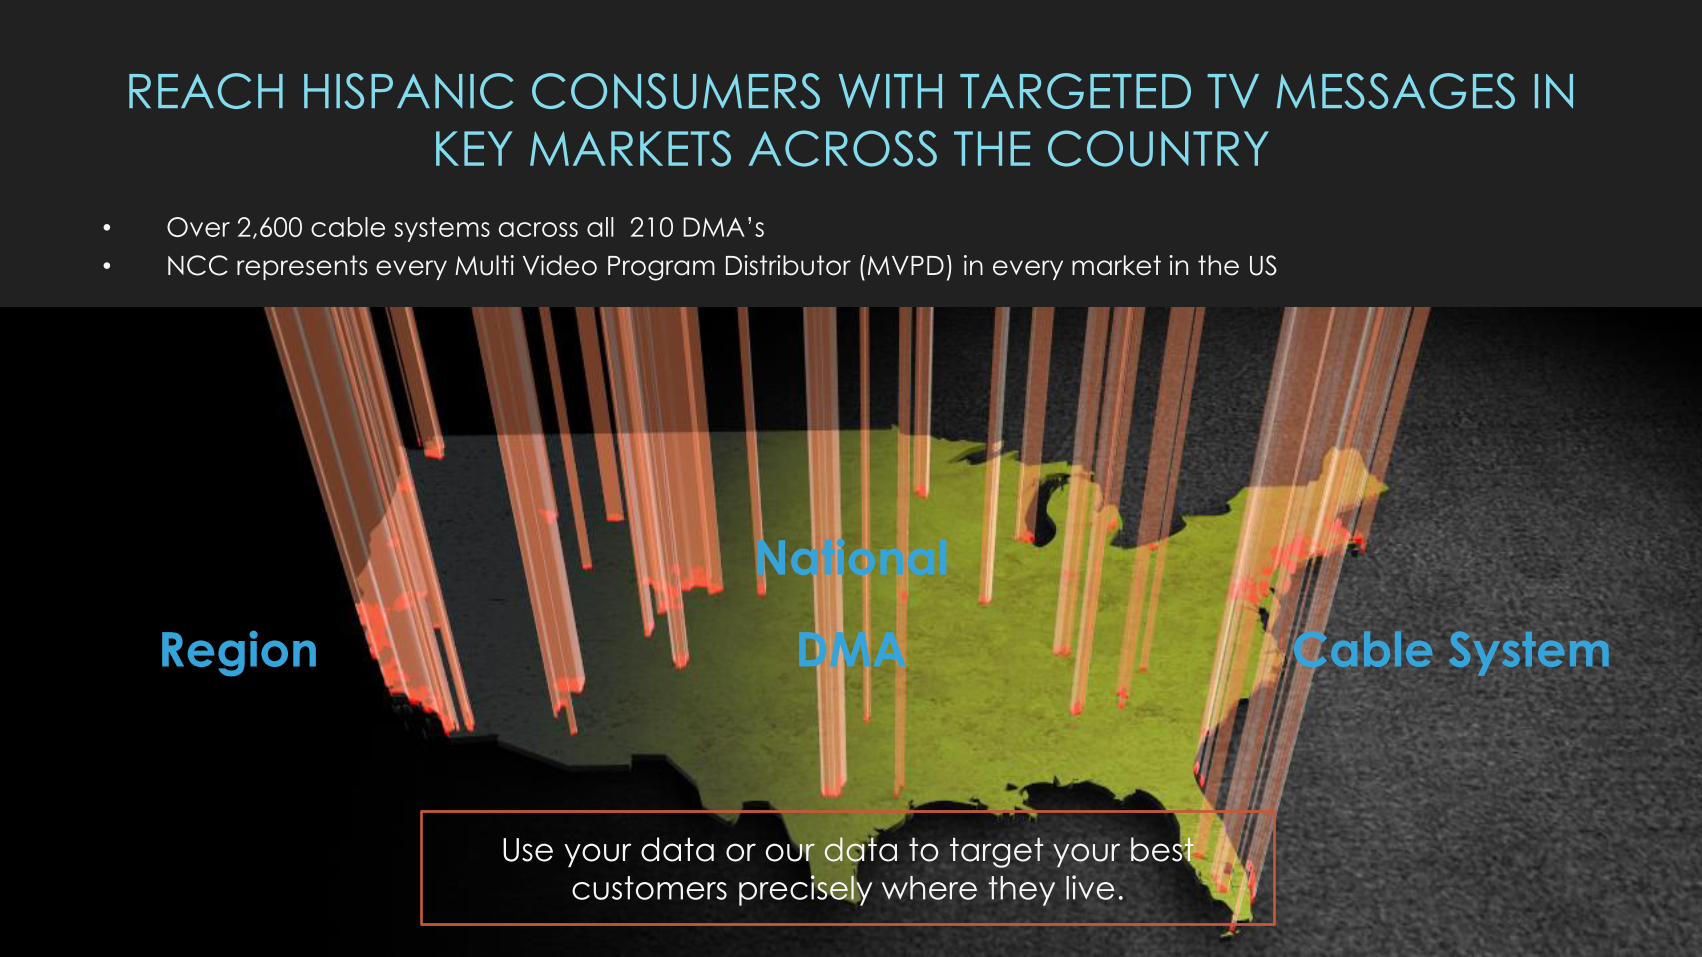
REACH HISPANIC CONSUMERS WITH TARGETED TV MESSAGES IN
KEY MARKETS ACROSS THE COUNTRY
• Over 2,600 cable systems across all 210 DMA’s
• NCC represents every Multi Video Program Distributor (MVPD) in every market in the US
Region DMA Cable System
National
Use your data or our data to target your best
customers precisely where they live.
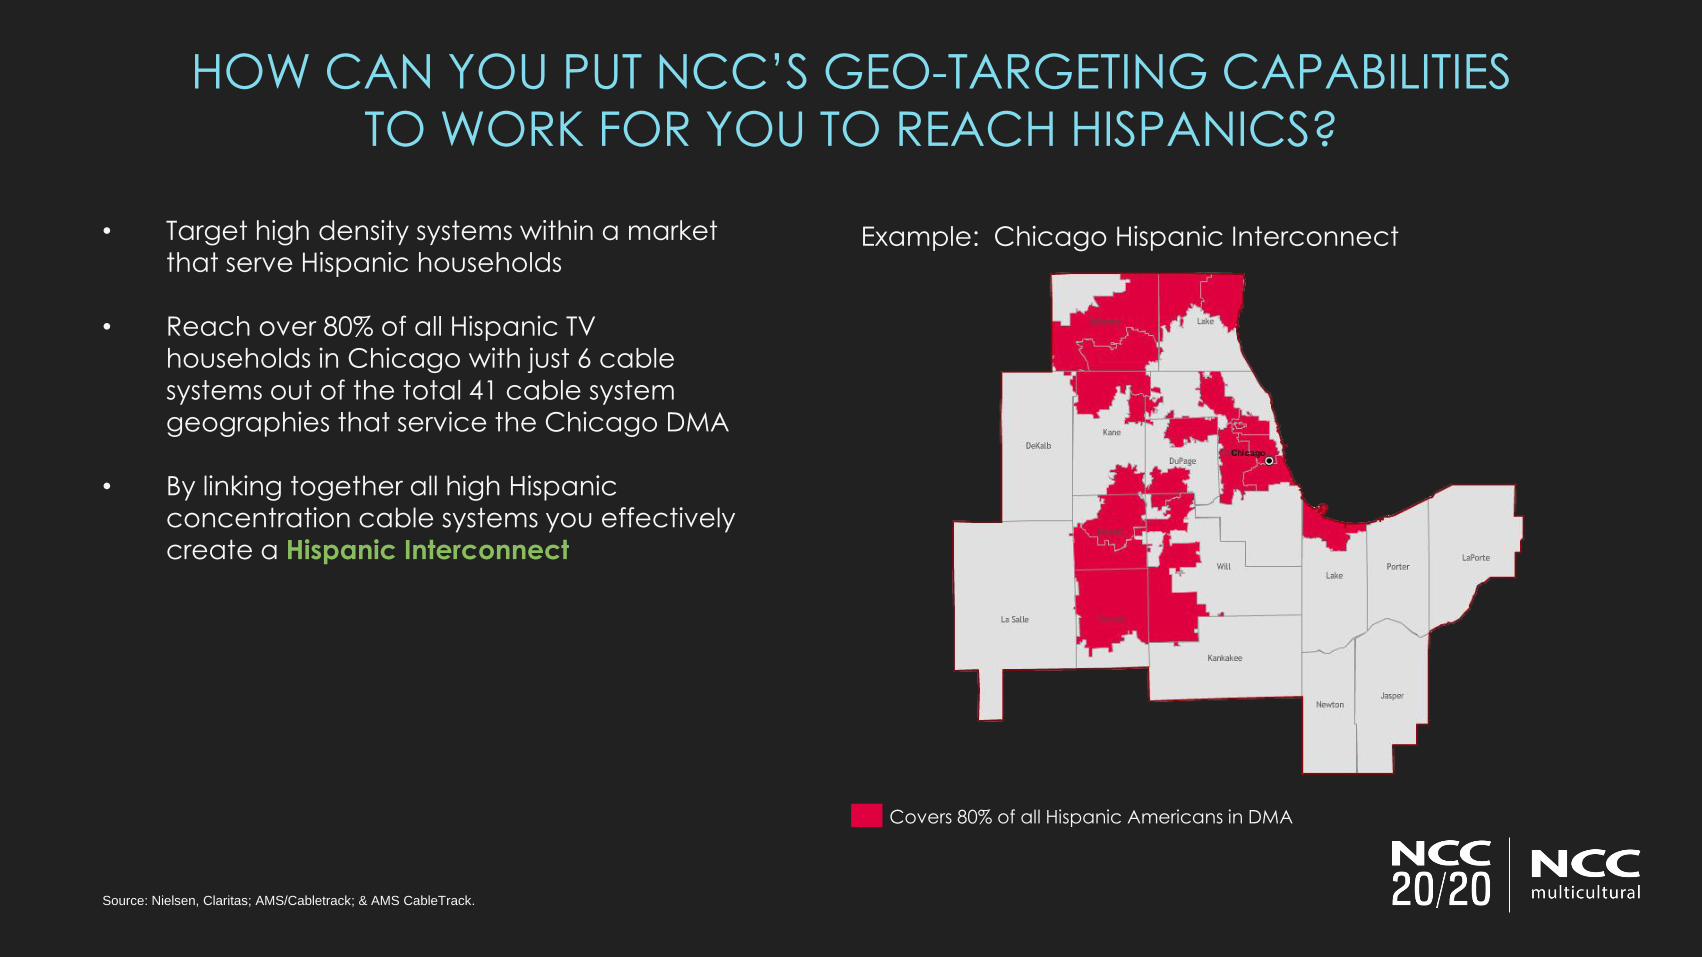
HOW CAN YOU PUT NCC’S GEO-TARGETING CAPABILITIES
TO WORK FOR YOU TO REACH HISPANICS?
• Target high density systems within a market
that serve Hispanic households
• Reach over 80% of all Hispanic TV
households in Chicago with just 6 cable
systems out of the total 41 cable system geographies that service the Chicago DMA
• By linking together all high Hispanic
concentration cable systems you effectively
create a Hispanic Interconnect
Example: Chicago Hispanic Interconnect
Source: Nielsen, Claritas; AMS/Cabletrack; & AMS CableTrack.
Covers 80% of all Hispanic Americans in DMA

NCC MEDIA CAN HELP MARKETERS TARGET ACCULTURATED
HISPANICS THROUGHOUT A DMA
Targeting Acculturated Consumers
• Target the highest concentration of
Hispanic households with income $50k+
• One third of cable systems in the Boston
DMA represents half of the population but 80% Acculturated Hispanics
• NCC Media can create an Acculturated
Hispanic Interconnect for your brand
Example: Boston Hispanic Interconnect
Of the 45 total cable systems in Boston, only 17 systems are
needed to reach 80% of all Hispanics with a HHI $50k+.
Source: Nielsen, Claritas and AMS CableTrack
Covers 80% of all Hispanics w/ HHI $50k+ in DMA

According to PWC study, 43 percent of Hispanics stream video on their smartphones
and tablets, compared to just 25 percent of the general U.S. population.
HISPANICS ARE AMONG THE LEADERS IN MULTI-SCREEN
MEDIA USE
Source: PWC - http://www.fierceonlinevideo.com/special-reports/hispanic-audiences-and-15t-buying-power-trend-toward-ott
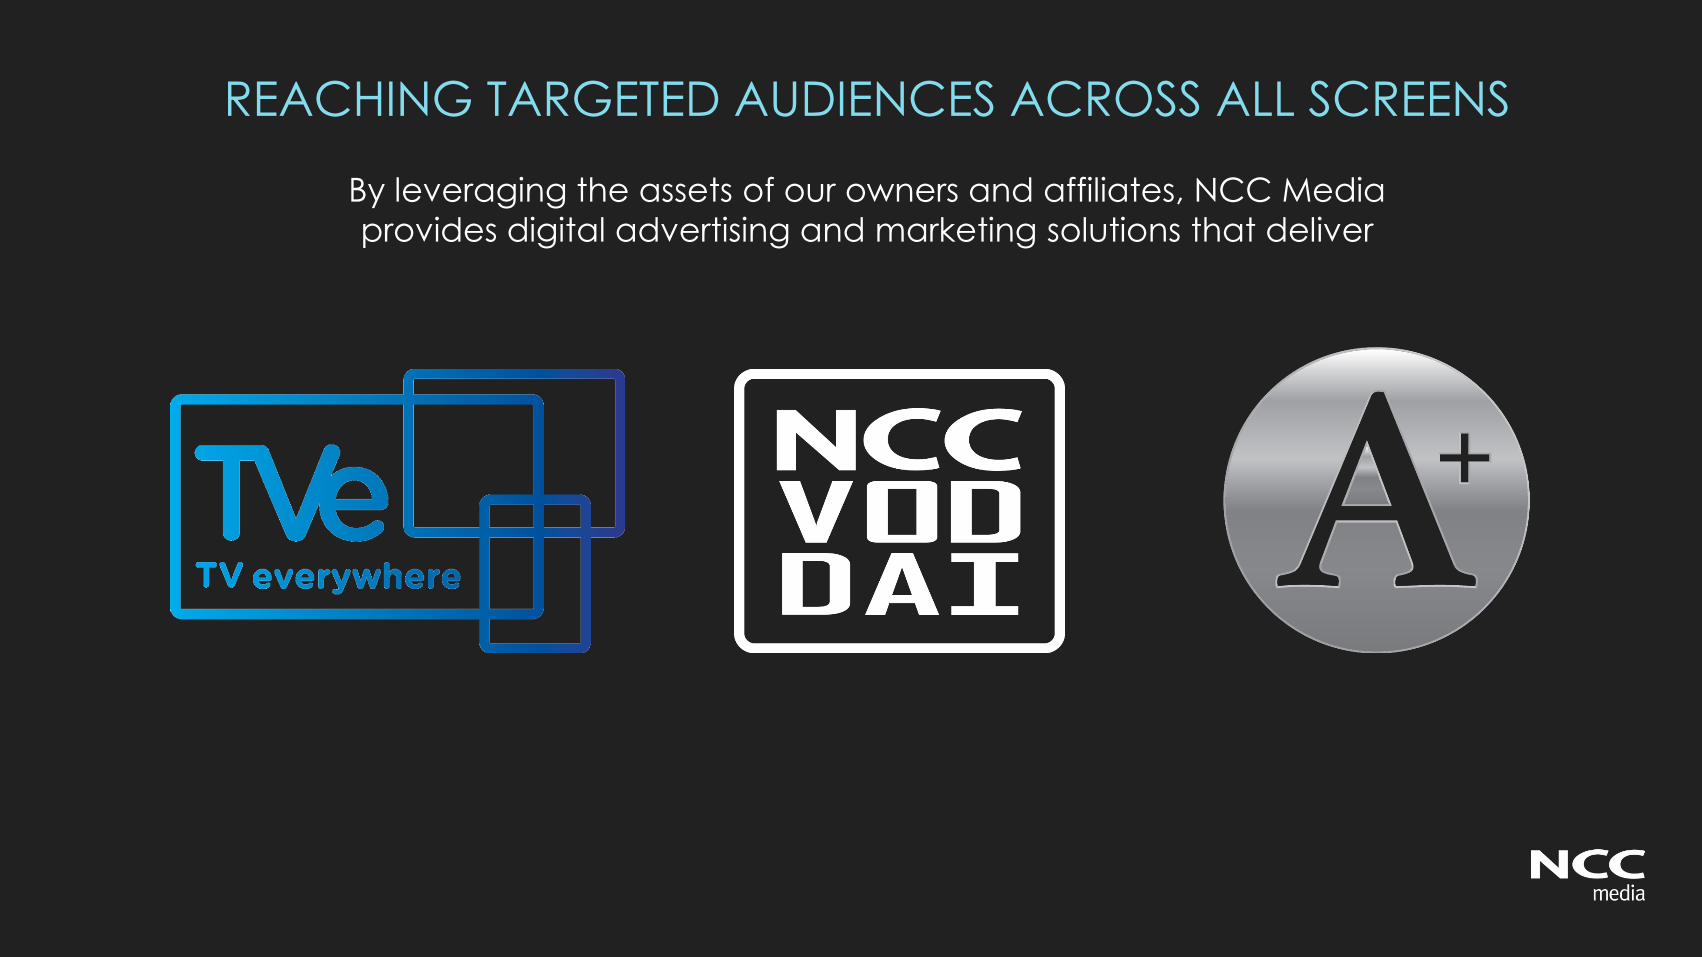
By leveraging the assets of our owners and affiliates, NCC Media
provides digital advertising and marketing solutions that deliver
REACHING TARGETED AUDIENCES ACROSS ALL SCREENS
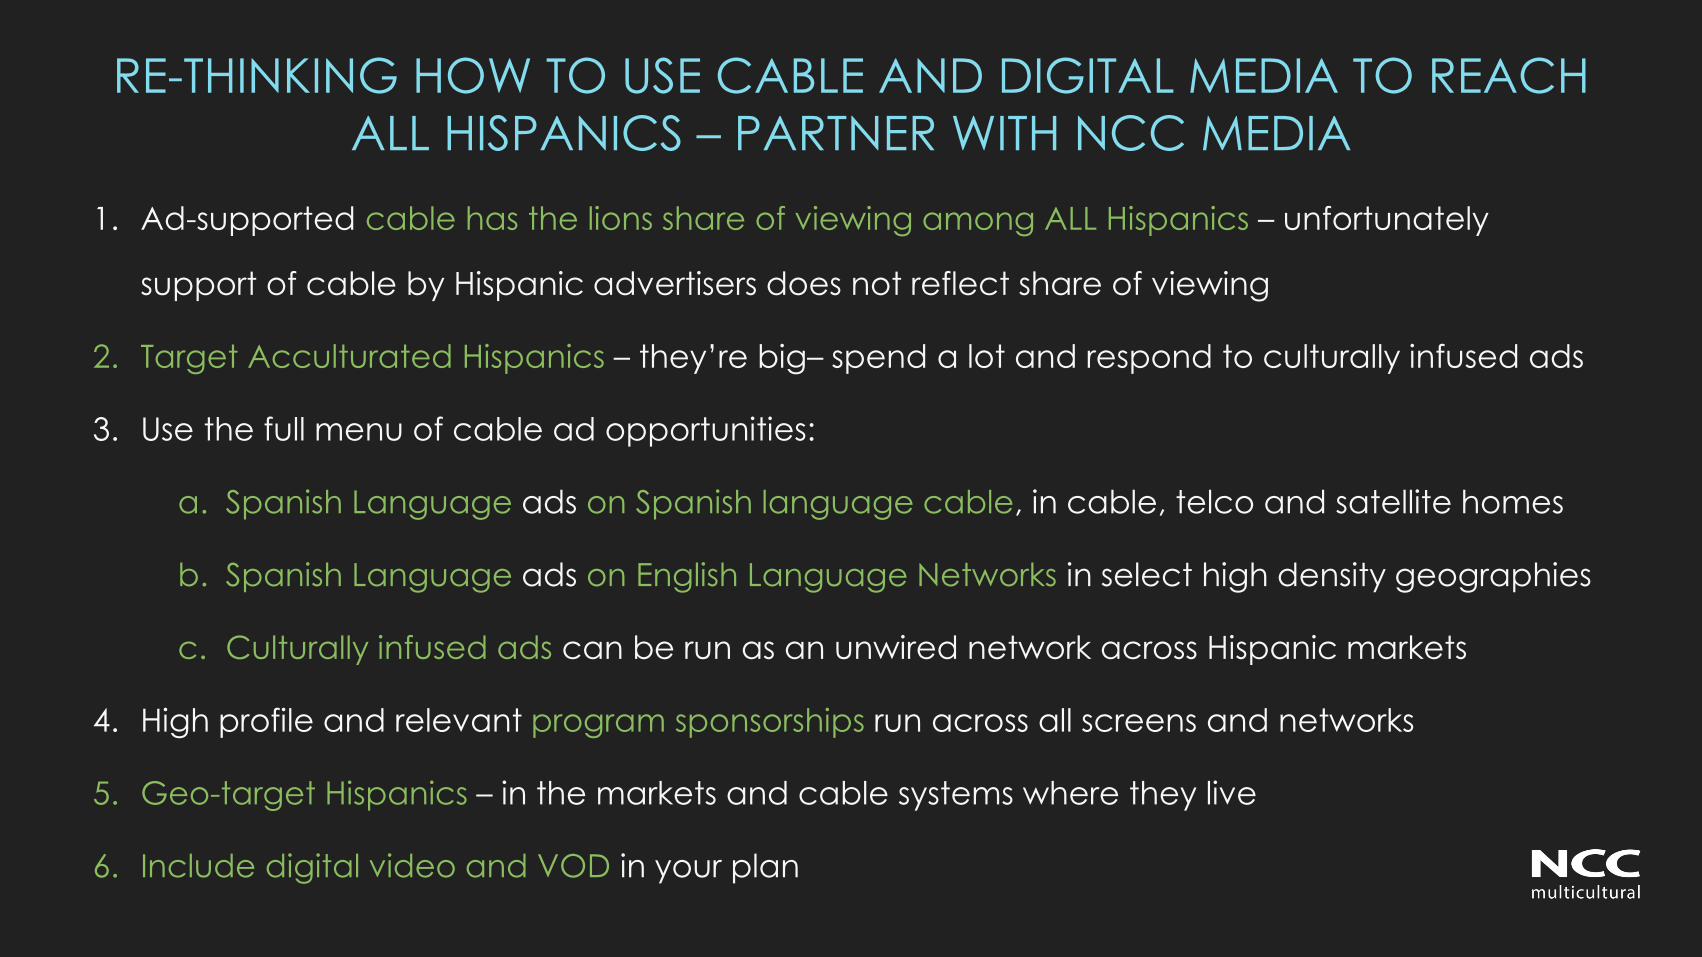
RE-THINKING HOW TO USE CABLE AND DIGITAL MEDIA TO REACH
ALL HISPANICS – PARTNER WITH NCC MEDIA
1. Ad-supported cable has the lions share of viewing among ALL Hispanics – unfortunately
support of cable by Hispanic advertisers does not reflect share of viewing
2. Target Acculturated Hispanics – they’re big– spend a lot and respond to culturally infused ads
3. Use the full menu of cable ad opportunities:
a. Spanish Language ads on Spanish language cable, in cable, telco and satellite homes
b. Spanish Language ads on English Language Networks in select high density geographies
c. Culturally infused ads can be run as an unwired network across Hispanic markets
4. High profile and relevant program sponsorships run across all screens and networks
5. Geo-target Hispanics – in the markets and cable systems where they live
6. Include digital video and VOD in your plan

Presentation materials from today’s webinar are available from NCC and include the presentation itself and the Top 20 Hispanic Market Profiles that will guide decision making
WANT A DEEPER DIVE ON THE ACCULTURATED HISPANIC MARKET?
Chris Foley VP, Sales Marketing
NCC Media
212-548-3392
Yasmin Mitchell VP Research
NCC Media
212-548-3371
Madelaine Casanovas Director of Sales
NCC Media
305-443-9050
THANK YOU


![Welcome! [asphn.org] · –Hispanics and non-Hispanic blacks have a higher prevalence of obesity (47%) than non-Hispanic whites (38%) and non-Hispanic Asians (13%) –Women have a](https://static.fdocuments.in/doc/165x107/5f05313b7e708231d411bc46/welcome-asphnorg-ahispanics-and-non-hispanic-blacks-have-a-higher-prevalence.jpg)