
The Role of Transit in Emergency Evacuation emergency preparedness for minority, low-income, and...
227
Special Report 294 Special Report 294 The Role of Transit in Emergency Evacuation Prepublication Copy Uncorrected Proofs
Transcript of The Role of Transit in Emergency Evacuation emergency preparedness for minority, low-income, and...

Special Report 294Special Report 294
The Role of Transit inEmergency Evacuation
Prepublication Copy � Uncorrected Proofs

TRANSPORTATION RESEARCH BOARD 2008 EXECUTIVE COMMITTEE* Chair: Debra L. Miller, Secretary, Kansas Department of Transportation, Topeka Vice Chair: Adib K. Kanafani, Cahill Professor of Civil Engineering, University of California, Berkeley Executive Director: Robert E. Skinner, Jr., Transportation Research Board J. Barry Barker, Executive Director, Transit Authority of River City, Louisville, Kentucky Allen D. Biehler, Secretary, Pennsylvania Department of Transportation, Harrisburg John D. Bowe, President, Americas Region, APL Limited, Oakland, California Larry L. Brown, Sr., Executive Director, Mississippi Department of Transportation, Jackson Deborah H. Butler, Executive Vice President, Planning, and CIO, Norfolk Southern Corporation, Norfolk, Virginia William A. V. Clark, Professor, Department of Geography, University of California, Los Angeles David S. Ekern, Commissioner, Virginia Department of Transportation, Richmond Nicholas J. Garber, Henry L. Kinnier Professor, Department of Civil Engineering, University of Virginia, Charlottesville Jeffrey W. Hamiel, Executive Director, Metropolitan Airports Commission, Minneapolis, Minnesota Edward A. (Ned) Helme, President, Center for Clean Air Policy, Washington, D.C. Will Kempton, Director, California Department of Transportation, Sacramento Susan Martinovich, Director, Nevada Department of Transportation, Carson City Michael D. Meyer, Professor, School of Civil and Environmental Engineering, Georgia Institute of Technology, Atlanta (Past
Chair, 2006) Michael R. Morris, Director of Transportation, North Central Texas Council of Governments, Arlington Neil J. Pedersen, Administrator, Maryland State Highway Administration, Baltimore Pete K. Rahn, Director, Missouri Department of Transportation, Jefferson City Sandra Rosenbloom, Professor of Planning, University of Arizona, Tucson Tracy L. Rosser, Vice President, Corporate Traffic, Wal-Mart Stores, Inc., Bentonville, Arkansas Rosa Clausell Rountree, Executive Director, Georgia State Road and Tollway Authority, Atlanta Henry G. (Gerry) Schwartz, Jr., Chairman (retired), Jacobs/Sverdrup Civil, Inc., St. Louis, Missouri C. Michael Walton, Ernest H. Cockrell Centennial Chair in Engineering, University of Texas, Austin (Past Chair, 1991) Linda S. Watson, CEO, LYNX–Central Florida Regional Transportation Authority, Orlando (Past Chair, 2007) Steve Williams, Chairman and CEO, Maverick Transportation, Inc., Little Rock, Arkansas Thad Allen (Adm., U.S. Coast Guard), Commandant, U.S. Coast Guard, Washington, D.C. (ex officio) Joseph H. Boardman, Administrator, Federal Railroad Administration, U.S. Department of Transportation (ex officio) Rebecca M. Brewster, President and COO, American Transportation Research Institute, Smyrna, Georgia (ex officio) Paul R. Brubaker, Administrator, Research and Innovative Technology Administration, U.S. Department of Transportation (ex
officio) George Bugliarello, Chancellor, Polytechnic University of New York, Brooklyn; Foreign Secretary, National Academy of
Engineering, Washington, D.C. (ex officio) Sean T. Connaughton, Administrator, Maritime Administration, U.S. Department of Transportation (ex officio) LeRoy Gishi, Chief, Division of Transportation, Bureau of Indian Affairs, U.S. Department of the Interior, Washington, D.C. (ex
officio) Edward R. Hamberger, President and CEO, Association of American Railroads, Washington, D.C. (ex officio) John H. Hill, Administrator, Federal Motor Carrier Safety Administration, U.S. Department of Transportation (ex officio) John C. Horsley, Executive Director, American Association of State Highway and Transportation Officials, Washington, D.C.
(ex officio) Carl T. Johnson, Administrator, Pipeline and Hazardous Materials Safety Administration, U.S. Department of Transportation,
Washington, D.C. (ex officio) J. Edward Johnson, Director, Applied Science Directorate, National Aeronautics and Space Administration, John C. Stennis
Space Center, Mississippi (ex officio) William W. Millar, President, American Public Transportation Association, Washington, D.C. (ex officio) (Past Chair, 1992) Nicole R. Nason, Administrator, National Highway Traffic Safety Administration, U.S. Department of Transportation (ex
officio) James Ray, Acting Administrator, Federal Highway Administration, U.S. Department of Transportation (ex officio) James S. Simpson, Administrator, Federal Transit Administration, U.S. Department of Transportation (ex officio) Robert A. Sturgell, Acting Administrator, Federal Aviation Administration, U.S. Department of Transportation (ex officio) Robert L. Van Antwerp (Lt. General, U.S. Army), Chief of Engineers and Commanding General, U.S. Army Corps of
Engineers, Washington, D.C. (ex officio) * Membership as of July 2008.

The Role of Transit in
Emergency Evacuation
Committee on the Role of Public Transportation in Emergency Evacuation
Special Report 294
Transportation Research Board
Washington, D.C.
2008
www.TRB.org

Transportation Research Board Special Report 294 Subscriber Category VI public transit Transportation Research Board publications are available by ordering individual publications directly from the TRB Business Office, through the Internet at www.TRB.org or national-academies.org/trb, or by annual subscription through organizational or individual affiliation with TRB. Affiliates and library subscribers are eligible for substantial discounts. For further information, contact the Transportation Research Board Business Office, 500 Fifth Street, NW, Washington, DC 20001 (telephone 202-334-3213; fax 202-334-2519; or e-mail [email protected]). Copyright 2008 by the National Academy of Sciences. All rights reserved. Printed in the United States of America. NOTICE: The project that is the subject of this report was approved by the Governing Board of the National Research Council, whose members are drawn from the councils of the National Academy of Sciences, the National Academy of Engineering, and the Institute of Medicine. The members of the committee responsible for the report were chosen for their special competencies and with regard for appropriate balance. This report has been reviewed by a group other than the authors according to the procedures approved by a Report Review Committee consisting of members of the National Academy of Sciences, the National Academy of Engineering, and the Institute of Medicine. This study was requested by Congress and funded by the Federal Transit Administration and the Transit Cooperative Research Program. Library of Congress Cataloging-in-Publication Data Information will be provided in the printed publication. ISBN 978-0-309-11333-5

The National Academy of Sciences is a private, nonprofit, self-perpetuating society of distinguished scholars engaged in scientific and engineering research, dedicated to the furtherance of science and technology and to their use for the general welfare. On the authority of the charter granted to it by the Congress in 1863, the Academy has a mandate that requires it to advise the federal government on scientific and technical matters. Dr. Ralph J. Cicerone is president of the National Academy of Sciences. The National Academy of Engineering was established in 1964, under the charter of the National Academy of Sciences, as a parallel organization of outstanding engineers. It is autonomous in its administration and in the selection of its members, sharing with the National Academy of Sciences the responsibility for advising the federal government. The National Academy of Engineering also sponsors engineering programs aimed at meeting national needs, encourages education and research, and recognizes the superior achievements of engineers. Dr. Charles M. Vest is president of the National Academy of Engineering. The Institute of Medicine was established in 1970 by the National Academy of Sciences to secure the services of eminent members of appropriate professions in the examination of policy matters pertaining to the health of the public. The Institute acts under the responsibility given to the National Academy of Sciences by its congressional charter to be an adviser to the federal government and, on its own initiative, to identify issues of medical care, research, and education. Dr. Harvey V. Fineberg is president of the Institute of Medicine. The National Research Council was organized by the National Academy of Sciences in 1916 to associate the broad community of science and technology with the Academy’s purposes of furthering knowledge and advising the federal government. Functioning in accordance with general policies determined by the Academy, the Council has become the principal operating agency of both the National Academy of Sciences and the National Academy of Engineering in providing services to the government, the public, and the scientific and engineering communities. The Council is administered jointly by both the Academies and the Institute of Medicine. Dr. Ralph J. Cicerone and Dr. Charles M. Vest are chair and vice chair, respectively, of the National Research Council. The Transportation Research Board is one of six major divisions of the National Research Council. The mission of the Transportation Research Board is to provide leadership in transportation innovation and progress through research and information exchange, conducted within a setting that is objective, interdisciplinary, and multimodal. The Board’s varied activities annually engage about 7,000 engineers, scientists, and other transportation researchers and practitioners from the public and private sectors and academia, all of whom contribute their expertise in the public interest. The program is supported by state transportation departments, federal agencies including the component administrations of the U.S. Department of Transportation, and other organizations and individuals interested in the development of transportation. www.TRB.org
www.national-academies.org
Committee on the Role of Public Transportation in Emergency Evacuation
Richard A. White, Chair, DMJM Harris, Arlington, Virginia Evelyn Blumenberg, University of California, Los Angeles Kenneth A. Brown, New York City Transit, New York, New York John M. Contestabile, Maryland Department of Transportation, Hanover Ali Haghani, University of Maryland, College Park Arnold M. Howitt, John F. Kennedy School of Government, Cambridge, Massachusetts Thomas C. Lambert, Metropolitan Transit Authority of Harris County, Houston, Texas Betty Hearn Morrow, SocResearch Miami, Florida Michael H. Setzer, Veolia Transportation, Cincinnati, Ohio Ellis M. Stanley, Sr., Dewberry, LLC, Los Angeles, California Andrew Velásquez III, Illinois Emergency Management Agency, Springfield Transportation Research Board Staff Nancy P. Humphrey, Study Director, Transportation Research Board

vii
Preface
he terrorist attacks of September 11, 2001, and the damaging hurricane seasons of 2004 and 2005 focused attention on the nation’s capacity to respond to emergencies and evacuate its
citizenry in a safe and timely manner. Transportation professionals are part of emergency management teams in some urban areas, but the potential for transportation in general and transit in particular to play a more significant role in emergency response and evacuation is far from being realized. This study was requested by Congress and funded by the Federal Transit Administration (FTA) and the Transit Cooperative Research Program to explore the capacity of transit systems serving the nation’s 38 largest urbanized areas to accommodate the evacuation, egress, or ingress of people from or to critical locations in times of emergency. The Transportation Research Board (TRB), which conducted the study, formed an 11-member committee comprising managers of transportation, transit, and emergency management agencies, as well as representatives of academia, to respond to the congressional request.1 The committee was chaired by Richard A. White, Executive Vice President and Director of Project Development at DMJM Harris, and former General Manager and Chief Executive Officer of the Washington Metropolitan Area Transit Authority. To carry out its charge, the committee reviewed the literature; analyzed the emergency response and evacuation plans of the 38 largest urbanized areas and their respective states; and conducted five case studies representing different regions of the country, types of transit systems, and types of emergencies. Working under the direction of the committee, Sylvia He, Ph.D. candidate in the School of Policy, Planning and Development at the University of Southern California, developed a statistical profile of the 38 urbanized areas, and Aaron D. Green and Joseph M. Maltby, JD candidates in the George Mason University School of Law, conducted the review of those areas’ emergency response and evacuation plans.
The committee also supplemented its expertise with briefings presented at its meetings by a wide range of experts. In particular, the committee would like to thank Ben Rich, Chief of Staff in the Office of William Pascrell, Jr., U.S. House of Representatives, and Irving Chambers, recently retired Project Manager from the Office of Research, Demonstration and Innovation at FTA, who provided the committee with their perspectives on the objectives and anticipated outcomes of the study. The committee would also like to thank David Schneider, Equal Opportunity Specialist in FTA’s Office of Civil Rights, for his presentation on an agency study of emergency preparedness for minority, low-income, and limited-English-proficiency persons; John Renne, Associate Director of the Transportation Center at the University of New Orleans, and Brian Wolshon, Associate Professor in the Department of Civil and Environmental Engineering at Louisiana State University, who briefed the committee on disaster planning for the carless and on a related national conference held in New Orleans in February 2007, respectively; and John Benison, Chief of the Policy Division in the Office of Civil Rights at the U.S. Department of Transportation (USDOT) for his remarks on evacuating the disabled in an emergency. Special thanks go to Donald (Doc) Lumpkins, Program Specialist in the Technical 1 Frank Day, Emergency Officer at the Florida Department of Transportation, and Frederick C. Goodine, Assistant General Manager of the Department of System Safety Risk Management at the Washington Metropolitan Area Transit Authority, also served until their respective retirements in June 2007.
T
viii Special Report 294: The Role of Transit in Emergency Evacuation
Assistance Division of the U.S. Department of Homeland Security, who briefed the committee on the Nationwide Plan Review, Phase 2 Report; Kimberly Vásconez, Team Leader for Emergency Transportation Operations at the Federal Highway Administration, who presented the results of a companion USODT Report to Congress on Hurricane Evacuation Plan Evaluation; and Katherine Siggerud, Director of Physical Infrastructure Issues at the Government Accountability Office, who briefed the committee on that agency’s study on Transportation-Disadvantaged Populations: Actions Needed to Clarify Responsibilities and Increase Preparedness for Evacuations. Finally, the committee would like to thank Greg Hull, Director of Operations, Safety and Security at the American Public Transportation Association (APTA), and Michael H. Setzer, Vice President of Veolia Transportation and committee member, for their presentation on APTA’s Emergency Response and Preparedness Program; and Joseph Kammerman, Homeland Security Coordinator for the Department of Transportation of the District of Columbia, and Robert Young, Public Safety Planner at the Metropolitan Washington Council of Governments, for their briefings on the D.C. Emergency Evacuation Plan and development of an evacuation plan for the metropolitan Washington region. The committee would also like to thank those individuals who helped organize and who participated in the case study interviews. Their names are listed at the end of each of the case studies presented in Appendix D.
This report has been reviewed in draft form by individuals chosen for their diverse perspectives and technical expertise, in accordance with procedures approved by the National Research Council’s (NRC) Report Review Committee. The purpose of this independent review is to provide candid and critical comments that assist the authors and the NRC in making the published report as sound as possible and to ensure that the report meets institutional standards for objectivity, evidence, and responsiveness to the study charge. The content of the review comments and draft manuscript remain confidential to protect the integrity of the deliberative process. The committee wishes to thank the following individuals for their participation in the review of this report: C. Douglas Bass, Emergency Management and Homeland Security Department, Miami-Dade County, Florida; A. Brent Eastman, Scripps Health, San Diego, California; Ann Flemer, Metropolitan Transportation Commission, Oakland, California; Thomas Greufe, Forsythe Transportation, Inc., Phoenix, Arizona; Kumares C. Sinha, Purdue University, West Lafayette, Indiana; Brian Wolshon, Louisiana State University, Baton Rouge, Louisiana; and Michael J. Zamiska, Port Authority of Allegheny County, Pittsburgh, Pennsylvania.
Although the reviewers listed above provided many constructive comments and suggestions, they were not asked to endorse the committee’s conclusions or recommendations, nor did they see the final draft of the report before its release. The review of this report was overseen by Susan Hanson, Clark University, Worcester, Massachusetts, and C. Michael Walton, University of Texas at Austin. Appointed by the NRC, they were responsible for making certain that an independent examination of the report was carried out in accordance with institutional procedures and that all review comments were carefully considered. Responsibility for the final content of this report rests entirely with the authoring committee and the institution.
Nancy P. Humphrey of TRB drafted the final report under the guidance of the committee and the supervision of Stephen R. Godwin, Director of TRB’s Studies and Special Programs Division. Suzanne Schneider, Associate Executive Director of TRB, managed the report review process. Special appreciation is expressed to Rona Briere, who edited the report. Jennifer J. Weeks, Editorial Services Specialist, formatted the prepublication edition of the report for posting to the TRB website, under the supervision of Javy Awan, Director of Publications.

Preface ix
Laura Toth assisted with meeting arrangements and communications with committee members, and Alisa Decatur provided word processing support for preparation of the final manuscript.

Contents
Summary.........................................................................................................................................1 1 Introduction.........................................................................................................................15
Study Charge, Scope, and Audience.....................................................................................15 Study Approach ....................................................................................................................17 Organization of the Report....................................................................................................20
2 Emergency and Evacuation Planning and Response.......................................................23 A Typology of Major Disasters ............................................................................................23 Emergency Planning and Response ......................................................................................24 Evacuation Planning and Response ......................................................................................30 The Potential Contribution of Transportation Planning Agencies........................................33 Sources of Funding for Emergency Evacuation Planning and Operations...........................34 Conclusion ............................................................................................................................37
3 The Role of Transit in Emergency Evacuation ................................................................39 Factors Affecting the Role of Transit in an Emergency .......................................................39 Results of the Committee’s Literature Review.....................................................................45 Summary and Findings .........................................................................................................53
4 Evidence from the 38 Largest Urbanized Areas ..............................................................57 Profile of the 38 Urbanized Areas ........................................................................................57 Results of the Committee’s Plan Assessment.......................................................................62 Results of the Committee’s Case Studies .............................................................................63 Findings.................................................................................................................................80 Annex 4-1 Detailed Statistical Profile of 38 Urbanized Areas ............................................84
5 Enhancing Transit’s Role...................................................................................................93 Setting the Context................................................................................................................93 Incorporating Transit as a Full Partner in Emergency Evacuation .......................................97 Complementary Transportation System Improvements .....................................................103 Research Needs...................................................................................................................104 Moving Forward .................................................................................................................106
Appendices A Congressional Request for Study ....................................................................................109 B Literature Review .............................................................................................................111 C Assessment of Transit’s Role in Emergency Response and Evacuation Plans of 33 Urbanized Areas and Related States.......................................133 D Case Studies.......................................................................................................................137
Study Committee Biographical Information...........................................................................211


1
Summary
ransit1 can play a vitally important role in an emergency evacuation, as the terrorist attacks of September 11, 2001, vividly demonstrated. Following the attack on the World Trade
Center during the morning rush hour, the New York Metropolitan Transportation Authority and New Jersey Transit began shuttling passengers out of Lower Manhattan and also rushed employees, buses, and equipment to the World Trade Center site to support emergency responders. In Washington, D.C., shutdown of the federal government following the strike on the Pentagon clogged local roads, and Metrorail became the mode of choice for transport from the area. In 2005, transit could have played an important role in New Orleans in advance of Hurricane Katrina by assisting in the evacuation of an estimated 100,000 to 200,000 vulnerable residents who lacked access to a private vehicle. A plan for the purpose existed, but failed utterly when few transit drivers reported to work, transit equipment proved inadequate and was left unprotected, and communications and incident control were nonexistent. Emergency plans that inadequately represent transit or are poorly executed risk significant loss of life, particularly among those who are dependent on transit for evacuation out of harm’s way. STUDY CHARGE AND SCOPE The purpose of this study, which was requested by Congress2 and funded by the Federal Transit Administration (FTA) and the Transit Cooperative Research Program, is to evaluate the potential role of transit systems in accommodating the evacuation, egress, and ingress of people from or to critical locations in times of emergency. Its focus is on transit systems serving the 38 largest urbanized areas in the United States—a proxy for those systems serving populations larger than 1 million. Transit is defined broadly to include bus and rail systems, paratransit and demand-responsive transit, commuter and intercity rail, and ferries, whether publicly operated or privately contracted. Highways and their capacity are also considered because many transit systems provide only bus service and must share the highways with private vehicles in an emergency evacuation. The study is also focused on major incidents that could necessitate a partial to full evacuation of the central business district or other large portion of an urban area. Meeting the surge requirements and coordination demands of such incidents is likely to strain the capacity of any single jurisdiction or transit agency and exceed local resources. (See Figure S-1 for examples of incidents of this scale.)
1 The terms transit, public transit, mass transit, and public transportation are frequently used interchangeably. This study uses the term transit, which is broadly defined as indicated in the text. 2 The study request originated with Congressman William Pascrell, Jr., who represents Northern New Jersey, and was included in the most recent reauthorization of surface transportation legislation—the 2005 Safe, Accountable, Flexible, Efficient Transportation Equity Act: A Legacy for Users.
T
2 Special Report 294: The Role of Transit in Emergency Evacuation
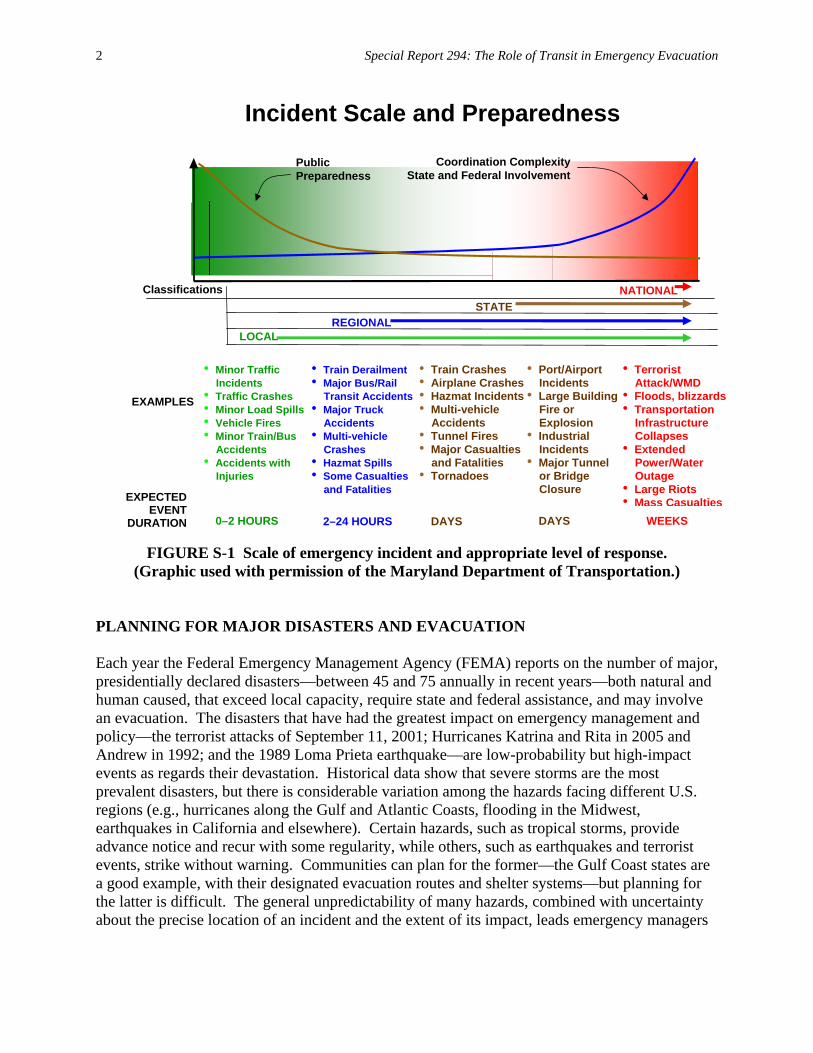
FIGURE S-1 Scale of emergency incident and appropriate level of response.
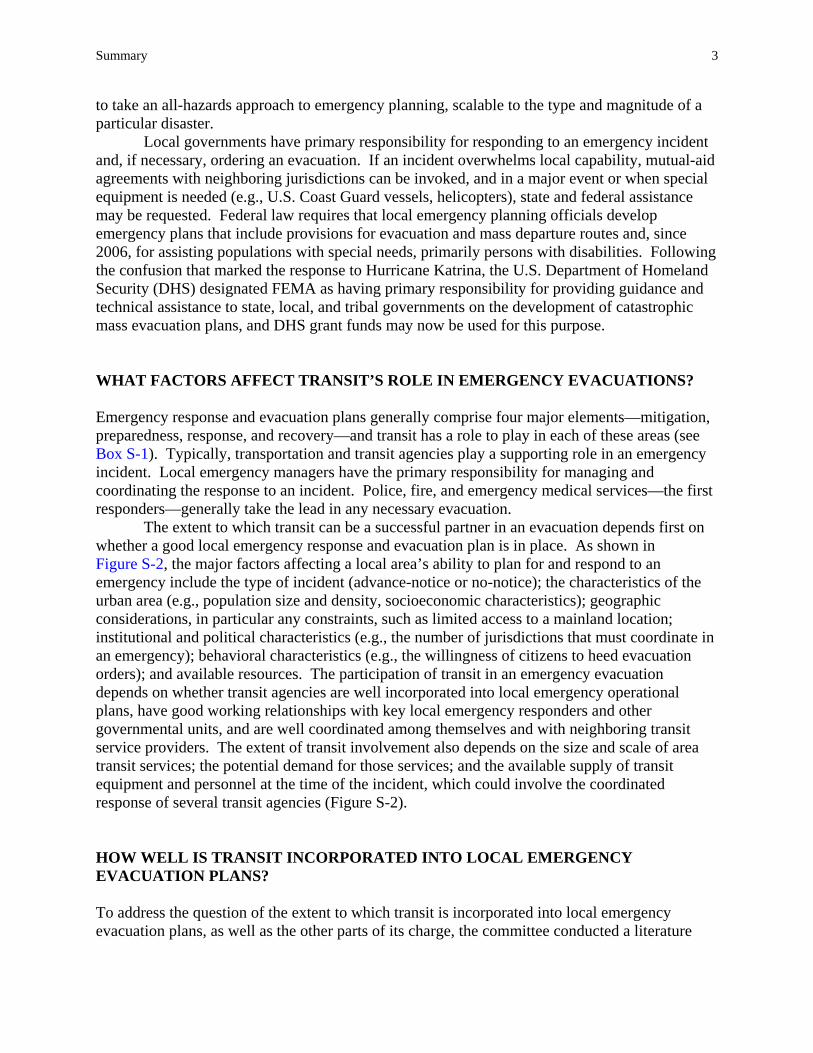
(Graphic used with permission of the Maryland Department of Transportation.) PLANNING FOR MAJOR DISASTERS AND EVACUATION Each year the Federal Emergency Management Agency (FEMA) reports on the number of major, presidentially declared disasters—between 45 and 75 annually in recent years—both natural and human caused, that exceed local capacity, require state and federal assistance, and may involve an evacuation. The disasters that have had the greatest impact on emergency management and policy—the terrorist attacks of September 11, 2001; Hurricanes Katrina and Rita in 2005 and Andrew in 1992; and the 1989 Loma Prieta earthquake—are low-probability but high-impact events as regards their devastation. Historical data show that severe storms are the most prevalent disasters, but there is considerable variation among the hazards facing different U.S. regions (e.g., hurricanes along the Gulf and Atlantic Coasts, flooding in the Midwest, earthquakes in California and elsewhere). Certain hazards, such as tropical storms, provide advance notice and recur with some regularity, while others, such as earthquakes and terrorist events, strike without warning. Communities can plan for the former—the Gulf Coast states are a good example, with their designated evacuation routes and shelter systems—but planning for the latter is difficult. The general unpredictability of many hazards, combined with uncertainty about the precise location of an incident and the extent of its impact, leads emergency managers
Incident Scale and Preparedness
LOCAL REGIONALSTATE
NATIONALClassifications
EXAMPLES
EXPECTED EVENT
DURATION
Coordination ComplexityState and Federal Involvement
PublicPreparedness
0–2 HOURS 2–24 HOURS WEEKSDAYSDAYS
• Minor Traffic Incidents
• Traffic Crashes • Minor Load Spills • Vehicle Fires • Minor Train/Bus
Accidents • Accidents with
Injuries
• Train Derailment • Major Bus/Rail
Transit Accidents • Major Truck
Accidents • Multi-vehicle
Crashes • Hazmat Spills • Some Casualties
and Fatalities
• Train Crashes • Airplane Crashes• Hazmat Incidents• Multi-vehicle
Accidents • Tunnel Fires • Major Casualties
and Fatalities • Tornadoes
• Port/Airport Incidents
• Large Building Fire or Explosion
• Industrial Incidents
• Major Tunnel or Bridge Closure
• Terrorist Attack/WMD
• Floods, blizzards • Transportation
Infrastructure Collapses
• Extended Power/Water Outage
• Large Riots • Mass Casualties
Summary 3
to take an all-hazards approach to emergency planning, scalable to the type and magnitude of a particular disaster. Local governments have primary responsibility for responding to an emergency incident and, if necessary, ordering an evacuation. If an incident overwhelms local capability, mutual-aid agreements with neighboring jurisdictions can be invoked, and in a major event or when special equipment is needed (e.g., U.S. Coast Guard vessels, helicopters), state and federal assistance may be requested. Federal law requires that local emergency planning officials develop emergency plans that include provisions for evacuation and mass departure routes and, since 2006, for assisting populations with special needs, primarily persons with disabilities. Following the confusion that marked the response to Hurricane Katrina, the U.S. Department of Homeland Security (DHS) designated FEMA as having primary responsibility for providing guidance and technical assistance to state, local, and tribal governments on the development of catastrophic mass evacuation plans, and DHS grant funds may now be used for this purpose. WHAT FACTORS AFFECT TRANSIT’S ROLE IN EMERGENCY EVACUATIONS? Emergency response and evacuation plans generally comprise four major elements—mitigation, preparedness, response, and recovery—and transit has a role to play in each of these areas (see Box S-1). Typically, transportation and transit agencies play a supporting role in an emergency incident. Local emergency managers have the primary responsibility for managing and coordinating the response to an incident. Police, fire, and emergency medical services—the first responders—generally take the lead in any necessary evacuation.
The extent to which transit can be a successful partner in an evacuation depends first on whether a good local emergency response and evacuation plan is in place. As shown in Figure S-2, the major factors affecting a local area’s ability to plan for and respond to an emergency include the type of incident (advance-notice or no-notice); the characteristics of the urban area (e.g., population size and density, socioeconomic characteristics); geographic considerations, in particular any constraints, such as limited access to a mainland location; institutional and political characteristics (e.g., the number of jurisdictions that must coordinate in an emergency); behavioral characteristics (e.g., the willingness of citizens to heed evacuation orders); and available resources. The participation of transit in an emergency evacuation depends on whether transit agencies are well incorporated into local emergency operational plans, have good working relationships with key local emergency responders and other governmental units, and are well coordinated among themselves and with neighboring transit service providers. The extent of transit involvement also depends on the size and scale of area transit services; the potential demand for those services; and the available supply of transit equipment and personnel at the time of the incident, which could involve the coordinated response of several transit agencies (Figure S-2).
HOW WELL IS TRANSIT INCORPORATED INTO LOCAL EMERGENCY EVACUATION PLANS? To address the question of the extent to which transit is incorporated into local emergency evacuation plans, as well as the other parts of its charge, the committee conducted a literature

4 Special Report 294: The Role of Transit in Emergency Evacuation
review; performed a summary assessment of publicly available, on-line emergency response and evacuation plans for the largest urbanized areas; and carried out five in-depth case studies.3
Finding: The majority of the emergency operations plans for large urbanized areas are only partially sufficient in describing in specific and measurable terms how a major evacuation could be conducted successfully, and few focus on the role of transit.
Following Hurricanes Katrina and Rita, DHS and the U.S. Department of Transportation (USDOT) conducted two comprehensive, peer-reviewed national assessments of emergency preparedness. DHS found that the majority (85 percent) of the emergency operations plans of the 75 largest urbanized areas it reviewed were only partially sufficient to manage a catastrophic
BOX S-1
Major Elements of Emergency Response and Evacuation Plans and Potential Roles of Transit
Emergency plans comprise four major elements:
• Mitigation: development of measures to reduce the likelihood of damage in the event of a hazard or to lessen its impacts.
• Preparedness: development of emergency plans and detailed operations plans that provide for a decision-making structure, key agency representation with well-specified roles, communications systems, training and frequent emergency drills, and plan maintenance and revisions.
• Response: mobilization of first responders, provision of emergency support services at the disaster site, and ordering and carrying out of an evacuation if necessary.
• Recovery: reestablishment of normal operations and return of evacuees to affected areas.
Transit agencies should be part of all four planning elements. Transit has a role to play in mitigation by protecting its own assets (e.g., moving vehicles to higher ground during severe flooding incidents) and establishing redundant communications systems to help ensure continuity of service. Transit agencies should be part of preparedness plans and represented in the emergency command structure. They can also play a vital role during the response phase, in both helping to evacuate those without access to a private vehicle and bringing emergency responders and equipment to the incident site. Finally, they can be involved in the recovery phase, reestablishing normal transit operations and bringing evacuees back to the area, if needed.
3 Site visits were conducted in the Chicago, Houston, Los Angeles–Long Beach–Santa Ana, New York–Newark, and Tampa–St. Petersburg urbanized areas. These sites were selected to represent locations with a high percentage of vulnerable, potentially transit-dependent populations; different regions of the country and types of transit systems; and different local hazards and jurisdictional issues.

Summary 5
FIGURE S-2 Factors affecting local emergency response capacity. event. The report noted significant weaknesses in evacuation planning. Only a fraction of plans estimated the time required to evacuate those located in different risk zones or incorporated all available modes of transportation; just 8 and 7 percent of plans, respectively, were rated “sufficient” on these two measures. The USDOT study, focused specifically on evacuation plans in the Gulf Coast region, painted a more optimistic picture, perhaps reflecting the recurring hazard—tropical storms—facing that region and recent evacuation experience. USDOT rated state and local emergency plans in the Gulf Coast region “effective” for highway evacuations, and most urban area plans included transit and designated pickup points for carless evacuees. The plan assessment conducted for this study, which was focused specifically on the role of transit in emergency evacuation, found that 11 of the 16 urbanized areas for which emergency evacuation plans were available on line mentioned transit, but few provided details about its role. Therefore, the committee was unable to assess reliably from this review the extent to which transit is included in the emergency evacuation plans of the 38 urbanized areas that are the subject of this study.
Response
Preparedness/ emergency response and evacuation plans
Recovery
Available supply of personnel and
equipment
iMayor and governors iEmergency management
agencies iLaw enforcement officials iDepartments of transportation iSchool districts iOther local governments iPrivate sector
Mitigation
Factors affecting response: iType of incident
(advance- or no-notice) iCharacteristics of urban area iGeographic considerations iInstitutional and political characteristics iBehavioral characteristics iAvailable resources
Demand for service/demographic characteristics of the
population
Transit agencies
6 Special Report 294: The Role of Transit in Emergency Evacuation
Recommendation 1: Local emergency managers should focus greater attention on evacuation planning as an important element of overall emergency planning, and should both determine and incorporate a role for transit and other public transportation providers in meeting evacuation needs.
Ensuring that transit is included in evacuation plans is the mutual responsibility of
emergency managers and transportation and transit agencies. Finding: Even among localities with evacuation plans, few have provided for a
major disaster that could involve multiple jurisdictions or multiple states in a region and necessitate the evacuation of a large fraction of the population.
Even in urban areas with comprehensive local emergency response plans, regional
evacuation plans are works in progress at best, reflecting the complexity of planning for large-scale emergencies that cross many jurisdictional and agency boundaries, as well as the questionable feasibility of evacuating major portions of large, highly developed, congested urban areas. The latter point was amply demonstrated during Hurricane Rita, when between 1.5 and 2.5 million Houstonians took to the road in an attempt to evacuate Harris County with predictable results—massive traffic jams and vehicles that ran out of fuel or broke down for a period of 24 hours or more. Indeed, in many urban areas, severe congestion at peak periods lasts for several hours each morning and evening, straining the system even under normal conditions.
Emergency managers recognize that a piecemeal approach of highly localized plans for different emergencies is unlikely to provide for a scalable response should a major disaster occur. Leadership is lacking at the regional level to conduct the requisite planning, however, because no one “owns” the problem. Many transit agencies are regional authorities providing service across jurisdictions, and thus have a regional perspective, but their primary mission is not emergency planning or evacuation. Local governments are attempting to fill the gap, but a clear decision-making framework for doing so is lacking, guidance on how to proceed is limited, and funds to defray the costs are insufficient. Thus even when regional initiatives exist, they often lack structure, plans are incomplete, and progress is slow.
Recommendation 2a: The Department of Homeland Security and the Federal Emergency Management Agency, in conjunction with the U.S. Department of Transportation, should provide guidance to state and local governments on regional evacuation planning, including the role of transit and other public transportation providers. States should take the lead in ensuring the development of such plans, coordinating with appropriate regional entities.
In January 2008, DHS finalized new guidance, including a special mass evacuation
annex, as part of the National Response Framework, an update of its guide for all levels of government and the private sector on the conduct of all-hazards incident response. In addition, FEMA released an updated Comprehensive Preparedness Guide (CPG 101) for public comment that provides guidance to state, local, and tribal governments on the preparation of emergency operations plans. Both documents fall short, however, in providing sufficient detail on the

Summary 7
development of mass evacuation plans, such as failing to include a template for a regional plan and the key agencies that should be involved. Greater clarity on the roles and responsibilities of those within DHS who work with state and local governments is also needed. State governments are in the best position to ensure the development of regional plans, working through appropriate regional entities such as metropolitan planning organizations (MPOs) and FEMA regional offices. In Florida, for example, the state is working with MPOs to develop an all-hazards, statewide emergency evacuation plan that would link individual county plans. States should also coordinate emergency evacuation plans with neighboring states through state-to-state mutual-aid emergency management assistance compacts (EMACs) that have been in place since 1993, following Hurricane Andrew.
Recommendation 2b: Federal funding should be provided for the development of regional evacuation plans that include transit and other public transportation providers. Grant recipients should be required to report on their progress and meet milestones and timetables.
DHS has created a new Regional Catastrophic Preparedness Grant Program, funded at
$69 million over two years, to support regional all-hazards planning for catastrophic events. Grant recipients must contribute 25 percent of the cost, either in cash or in kind, and set milestones, including starting and completion dates for projects. Some of the nation’s largest urban areas are eligible for funding. Such funding should continue to be made available, expanded to include all urbanized areas with populations of more than 1 million, and directed toward regional evacuation planning.4 DHS should track the performance of the first round of grant recipients, report on their progress in meeting milestones and timetables, and develop a compendium of promising regional evacuation strategies that can be shared with other urbanized areas. HOW CAN TRANSIT BE BETTER INCORPORATED INTO EMERGENCY EVACUATION PLANS?
Finding: In those areas where transit is a full partner in local emergency evacuation plans, transit agencies have been involved in the development of such plans and are part of the designated emergency command structure.
The case studies conducted by the committee revealed that those transit agencies most
involved in emergency evacuation are an integral part of local emergency evacuation plans and the decision-making structure in an emergency. For example, the Chicago Transit Authority, Metra (commuter rail), and Amtrak are identified as key support agencies in the central business district (CBD) evacuation plan for the City of Chicago. Each agency has its own detailed emergency evacuation plan, but those plans are consistent with the graduated emergency activation levels of the broader CBD plan—ranging from a minor incident that can be handled locally, to a major evacuation that requires extensive support and resources from outside
4 Other DHS grants (e.g., Urban Area Security Initiative grants) can be used for regional evacuation planning, but they have tended to be focused on other priorities (e.g., counterterrorism) and used for other purposes (e.g., equipment purchases).

8 Special Report 294: The Role of Transit in Emergency Evacuation
agencies. Transit agencies also coordinate closely with the Chicago Office of Emergency Management and Communications. In New York, with its heavy reliance on transit, New York City Transit (NYCT) is well integrated into the areawide evacuation plan developed by the NYC Office of Emergency Management. For example, hurricanes represent one of the major threats to the New York metropolitan area. NYCT has developed detailed operating plans for the evacuation of residents in vulnerable storm surge areas for hurricanes of different intensities on the basis of geographically based population estimates provided by the NYC Office of Emergency Management.
Another requirement for the successful integration of transit into emergency evacuation plans is providing for transit agencies to be part of the command structure at emergency operations centers (EOCs) when the latter are activated in an emergency incident. All of the sites visited by the committee meet this requirement. Finally, in those locations where transit has the most active role in evacuation planning, transit agencies typically have a long history of close working relationships with key local emergency responders.
Recommendation 3: Transit agencies should participate with emergency management agencies and departments of transportation when evacuation plans are developed, and should be full partners in the command structure established to handle emergency response and evacuation.
Box S-2 details the planning requirements for fully incorporating transit into emergency
evacuation plans; none of the sites visited by the committee meet all these requirements. To the extent that transit agencies are recognized as full partners in emergency evacuation plans, they will have to shoulder new responsibilities and costs (e.g., training of personnel in emergency response, development of interoperable communications systems), and should therefore be eligible for cost reimbursement along with other first responders. Transit agency personnel should be considered essential personnel, along with representatives of police, fire, and emergency medical services, when asked to assume a major role in an emergency evacuation. WHAT ROLES CAN TRANSIT PLAY IN AN EMERGENCY EVACUATION?
Finding: Transit can play multiple roles in an emergency evacuation, but these roles depend on the nature of the incident and its location in a region; the availability of transit operators and equipment at the time of the incident; and the extent of damage, if any, to transit equipment and facilities.
The case studies conducted by the committee illustrate the breadth of roles that transit can play in an emergency evacuation—the primary focus of this study. For example, transit can play a critical role in evacuating those who lack access to a private vehicle, transporting them either to area shelters or to other destinations outside the affected area. Indeed, transit is often the only means of evacuation for vulnerable, carless populations, many of whom may need assistance (see the discussion of this issue below). Transit operators can also transport emergency personnel and equipment to an incident site. After the emergency has passed, transit providers can return carless evacuees to their original destinations, help supply real-time information on

Summary 9
BOX S-2
Planning Requirements for Enhancing the Role of Transit in Emergency Evacuation
Mitigation
• Provide for the protection of vulnerable transit equipment and assets in the event of an emergency incident.
• Provide for redundant transit communications systems. • Provide for continuity of transit operations.
Preparedness
• Develop transit emergency evacuation plans consistent with areawide plans. • Identify populations likely to depend on transit in an emergency evacuation, and
work with area planners to model and estimate the maximum number that could be served. • Inventory available transit equipment to determine its capacity for meeting the
surge demands of an emergency evacuation. • Enter into reciprocal mutual-aid agreements with neighboring transit agencies to
help meet capacity shortfalls, including indemnification and funding agreements. • Consider the potential for school buses and drivers to meet evacuation transport
requirements. • Develop a plan for evacuating special-needs populations (see the text for details). • Designate assembly points where those special-needs populations who are
ambulatory can access transit. Make maps or other information available well in advance of an incident.
• Consider the destinations of those who will be transported by transit, whether to public shelters or to assembly points outside the affected area for further pickup and transport to final destinations.
• Consider standby emergency service contracts (including those with the private sector) to fill remaining transit service gaps and help provide for refueling of vehicles operating away from transit agency facilities.
• Include transit agencies and school districts and private school bus transportation providers in area tabletop exercises and drills for emergency evacuation plans. Response
• Ensure that transit agencies are represented in the chain of command at emergency operations centers when the latter are activated.
• Ensure that school districts are represented in the chain of command at emergency operations centers when the latter are activated.
(continued)
10 Special Report 294: The Role of Transit in Emergency Evacuation
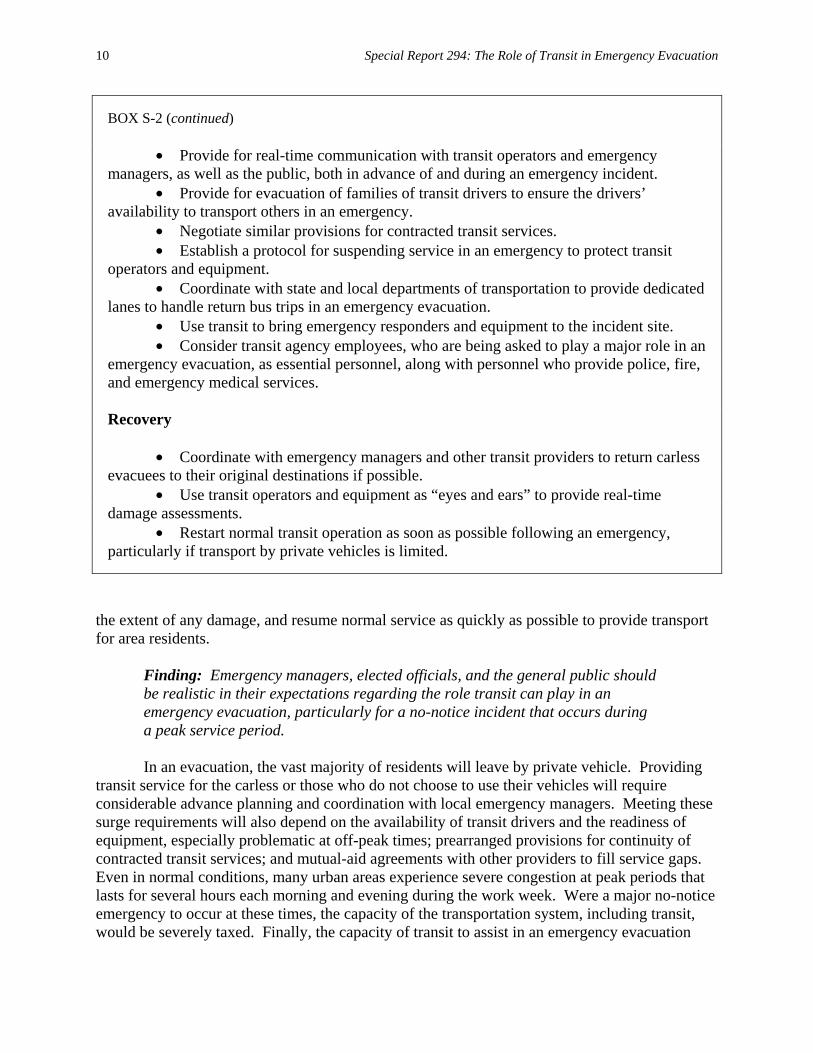
BOX S-2 (continued)
• Provide for real-time communication with transit operators and emergency managers, as well as the public, both in advance of and during an emergency incident.
• Provide for evacuation of families of transit drivers to ensure the drivers’ availability to transport others in an emergency.
• Negotiate similar provisions for contracted transit services. • Establish a protocol for suspending service in an emergency to protect transit
operators and equipment. • Coordinate with state and local departments of transportation to provide dedicated
lanes to handle return bus trips in an emergency evacuation. • Use transit to bring emergency responders and equipment to the incident site. • Consider transit agency employees, who are being asked to play a major role in an
emergency evacuation, as essential personnel, along with personnel who provide police, fire, and emergency medical services. Recovery
• Coordinate with emergency managers and other transit providers to return carless evacuees to their original destinations if possible.
• Use transit operators and equipment as “eyes and ears” to provide real-time damage assessments.
• Restart normal transit operation as soon as possible following an emergency, particularly if transport by private vehicles is limited.
the extent of any damage, and resume normal service as quickly as possible to provide transport for area residents.
Finding: Emergency managers, elected officials, and the general public should be realistic in their expectations regarding the role transit can play in an emergency evacuation, particularly for a no-notice incident that occurs during a peak service period.
In an evacuation, the vast majority of residents will leave by private vehicle. Providing
transit service for the carless or those who do not choose to use their vehicles will require considerable advance planning and coordination with local emergency managers. Meeting these surge requirements will also depend on the availability of transit drivers and the readiness of equipment, especially problematic at off-peak times; prearranged provisions for continuity of contracted transit services; and mutual-aid agreements with other providers to fill service gaps. Even in normal conditions, many urban areas experience severe congestion at peak periods that lasts for several hours each morning and evening during the work week. Were a major no-notice emergency to occur at these times, the capacity of the transportation system, including transit, would be severely taxed. Finally, the capacity of transit to assist in an emergency evacuation

Summary 11
depends on the integrity of the system itself during an incident and the safety of employees and equipment, any of which, if compromised, may necessitate curtailing service. Good planning can eliminate some, but not all, of these limitations.
Recommendation 4: To ensure that transit is used to its maximum potential in an emergency evacuation, the emergency operations centers of transit agencies should be linked with those of emergency management agencies. Transit should have the capability for real-time interoperable communications (both voice and data), be part of the decision-making team for emergency operations, develop effective ways of communicating with transit passengers both in advance of and during an emergency, and participate in annual exercises and drills that involve multiple agencies and jurisdictions.
Some urban areas have transportation management centers (e.g., Transtar in Houston, TRANSCOM in New York) that play an important role in managing daily traffic and incidents. These centers are a valuable resource in an emergency and should be linked with EOCs if they are not already. Finding: Transit has a unique role to play in evacuating the carless and people with
special needs (e.g., the disabled, the elderly, special-needs populations with pets) during an emergency. However, these groups are inadequately addressed in most local emergency evacuation plans.
Both the DHS and USDOT studies previously discussed identified a lack of adequate
planning for the evacuation of special-needs populations as a critical shortcoming of emergency operations plans—a finding echoed in numerous other reports, as well as the plan assessment conducted for this study. The definition of special needs itself is problematic, reflecting the diversity of different population groups. Some locations, such as Florida, define special-needs populations as those requiring medical assistance; others use the term more broadly to refer to all those who lack access to a private vehicle. Special-needs populations may also differ in the types of transit service they require in an emergency evacuation. Ambulatory but carless low-income populations can use fixed-route transit service, whereas the elderly, disabled, or medically homebound are likely to require the use of sparsely available paratransit service with accessible equipment and trained operators. Finally, many of these groups may be widely disbursed across an urbanized area, further straining limited transit resources. Among the main problems involved in assisting special-needs populations are (a) identification of their geographic locations and transit needs, and the currency of that information; (b) perceived privacy issues associated with obtaining the information; (c) the availability of adequate equipment to meet special transportation needs at the time of an incident; and (d) the potential for conflicts and shortfalls in service because institutions serving special-needs populations (e.g., nursing homes) frequently contract with the same providers responsible for handling the homebound in an emergency evacuation.

12 Special Report 294: The Role of Transit in Emergency Evacuation
Recommendation 5: Evacuation of the carless and those with special needs must be an integral part of evacuation planning, operations, and funding. A public information campaign and sheltering strategy specifically targeting these populations should be developed.
The Tampa urbanized area, one of the committee’s case study sites, is notable for its use
of transit in the evacuation of special-needs populations and could serve as a model for other areas. Transit service providers, as well as school bus operators, have focused their resources primarily on transporting special-needs populations in an evacuation. The State of Florida requires that county emergency managers establish voluntary special registries to help identify the medically impaired who need evacuation assistance, and that they provide special-needs shelters. Shelter staffing and medical management are the responsibility of county health departments, whose services are reimbursed by the state health department. There have been extensive outreach efforts to inform special-needs populations, as well as the homeless and the disadvantaged, about transportation and shelter resources in an emergency evacuation (e.g., annual multilingual hurricane guides, utility bill flyers, door-to-door contact).
Larger urbanized areas, where it is difficult to identify and maintain current information on special-needs populations, have adopted different approaches. In New York, for example, emergency managers encourage special-needs populations to arrange for their own transport in an emergency or to call the citywide 311 number in the event of a major incident, when a last-resort homebound evacuation plan will go into effect. The City of Los Angeles is attempting to create a database using information from social service agencies that serve special-needs populations, but the project is moving slowly because there is no funding to support dedicated, full-time staff to carry it out. Recognizing the limits of paratransit services, emergency managers in Chicago have encouraged complementary self-help measures, including an innovative program involving building managers in the CBD to identify disabled workers and plan for how they would be evacuated in an emergency. HOW CAN THE POTENTIAL ROLE OF TRANSIT IN EMERGENCY EVACUATION BE ENHANCED? Finding: The capacity and resilience of transit and highway systems as they affect
evacuation capability in an emergency incident are poorly addressed in current funding programs.
Both the capacity and the resilience of transit and highway infrastructure affect how
successfully transit can be used in an emergency evacuation. For example, commuter rail transit can provide rapid transport for large numbers of transit-dependent evacuees; in many urban areas, however, it shares the track with freight and passenger railroads (e.g., Amtrak), which may limit evacuation capacity. NYCT was recently forced to suspend rail operations when drainage systems were flooded after an intense rainstorm. Although no evacuation was planned, this incident illustrates the vulnerability of an older transit system. At the same time, the redundancy provided by New York’s extensive transit network enabled it to play an important role in the evacuation of Lower Manhattan following the attacks of September 11, 2001. Even in newer areas, such as Houston, with a large bus transit system, capacity constraints can hamper

Summary 13
evacuation. This is a particular problem when an evacuation extends to involve suburban and exurban areas, as it did during Hurricane Rita; where highway networks are less well developed; and where intelligent transportation systems (ITS) technologies for managing traffic flows are lacking.
Recommendation 6: In the reauthorization of the Safe, Accountable, Flexible, Efficient Transportation Equity Act: A Legacy for Users (SAFETEA-LU), Congress should authorize the Federal Transit Administration and the Federal Highway Administration to make eligible and to fund evacuation-related capacity-enhancement projects aimed at adding redundancy to critical transit and highway infrastructure, respectively, and increase funding for intelligent transportation systems (ITS) technologies that can enhance network resilience in an emergency. State funds should also be directed to these purposes.
“Bricks and mortar” capacity enhancements might include not only adding redundancy to
both transit and highway systems, but also removing critical traffic bottlenecks on major evacuation routes. Such projects are sometimes controversial, and must compete with other budgetary priorities for funding. They stand a greater chance of being funded when they meet multiple objectives (e.g., improve safety and reduce congestion, as well as serve evacuation needs). Operational measures, such as investments in ITS (e.g., cameras, interactive signs), traffic control measures (e.g., contraflow to expedite traffic in an evacuation), and interoperable communications systems to improve situational awareness, can help increase the efficiency and enhance the resilience of existing transit and highway networks in an emergency and should also be funded. Finally, a great deal can be accomplished through mutual-aid agreements designed to maximize existing resources. For example, emergency managers in Chicago, a major rail hub, are working with a freight rail carrier group organized to alleviate rail congestion. In the event of an emergency, this group could help clear the tracks for commuter rail through use of the alert system now used to communicate with freight carriers when congestion is heavy. Other examples include mutual-aid agreements among transit providers, particularly in neighboring jurisdictions. These agreements are illustrated by Houston’s arrangement to assist in the evacuation of the residents of nearby Galveston and by Tampa’s coordination with local school districts to evacuate the carless and special-needs populations. Both of these arrangements can help stretch existing resources during periods of surge demand in an emergency evacuation. RESEARCH NEEDS Research is needed to support many of the committee’s recommendations. Network simulation models have been developed and are used by MPOs in some urban areas to model evacuation times and road capacity. Such models should be extended to include transit buses in traffic projections and developed for use in more urban areas. Research is also needed to enhance understanding of the spatial dimensions of the demand for and supply of transit services in an evacuation. Projects could include effective ways to identify general and special-needs populations who are likely to use transit in an emergency evacuation, optimum methods for communicating with these groups both before and during an event, methods for assessing the

14 Special Report 294: The Role of Transit in Emergency Evacuation
availability and inventorying the allocation of transit equipment and drivers, and ways to tap the private sector (e.g., rental car and private bus fleets) to assist in evacuation efforts. The conduct of this research, together with implementation of the committee’s recommendations, should go a long way toward ensuring that transit can play a more central role in an emergency evacuation.

15
1
Introduction
mergency response and evacuation planning took on new urgency following the terrorist attacks of September 11, 2001, and, more recently, Hurricanes Katrina and Rita. This study
had its origins in the critical role played by transit1 in helping to evacuate some 1.2 million workers and residents of Lower Manhattan following the September 11 attack on the World Trade Center during the morning rush hour. The New York Metropolitan Transportation Authority and New Jersey Transit began shuttling passengers out of the affected area and also rushed employees, buses, and equipment to the World Trade Center site to support emergency responders. In Washington, D.C., shutdown of the federal government following the strike on the Pentagon clogged the road network. Metrorail became the mode of choice for transport from the area, evacuating several hundred thousand people from Washington and Northern Virginia within a few hours. Even so, immediately after the Pentagon strike, police and senior local and federal public officials gave Metro conflicting orders. One senior official demanded that the system be shut down out of fear of further terrorism, while others wanted to requisition transit cars to move emergency equipment.
New Orleans had an emergency plan to rely on transit for the 100,000 to 200,000 New Orleans residents estimated to be without means of private transportation, but the plan failed utterly during Hurricane Katrina because few drivers reported to work; equipment was inadequate; and, perhaps most important, communications and incident command were nonexistent. In Houston, METRO played an important role in helping to evacuate the transit-dependent and assisting motorists in advance of Hurricane Rita, but the arrangements were ad hoc, and the overall evacuation left thousands of motorists stranded on the highways. STUDY CHARGE, SCOPE, AND AUDIENCE The purpose of this study is to examine how the potentially critical role of transit can best be fulfilled in an emergency evacuation. The study request originated with Congressman William Pascrell, Jr., who represents northern New Jersey, and was included in the most recent reauthorization of surface transportation legislation—the 2005 Safe, Accountable, Flexible, Efficient Transportation Equity Act: A Legacy for Users (see Appendix A).2 Having witnessed the critical role of transit in the events of September 11, Congressman Pascrell noted that redundancy among transportation modes is important in an emergency, but that transit is frequently overlooked in emergency planning. Hence, the charge to the committee that conducted this study was to:
1 Transit, public transit, mass transit, and public transportation are frequently used interchangeably. This study uses the term “transit,” which is broadly defined as indicated in the text. 2 Initially, Congressman Pascrell sought to have security added to the Federal Transit Administration’s New Starts’ program as a selection criterion. This program helps pay for designing and constructing rail, bus, and trolley projects through federal grants that cannot exceed 80 percent of the estimated net cost of a project. Congressman Pascrell’s proposal failed to garner sufficient votes—thus his decision to recommend a study.
E

16 Special Report 294: The Role of Transit in Emergency Evacuation
...evaluate the role that the public transportation systems serving the 38 largest urbanized areas in the United States could play in the nation’s security, and...assess the ability of such systems to accommodate the evacuation, egress, and ingress of people to or from critical locations in times of emergency.
For the purposes of this study, transit is defined broadly to include bus and rail systems,
paratransit and demand-responsive transit, commuter rail, and ferries, whether publicly operated or privately contracted.3 Highways and their capacity are also considered because many transit systems provide only bus service and must share the highways with private vehicles during an emergency evacuation. Given the resources made available for the study, it is limited to those transit properties serving the 38 largest urbanized areas (UAs)4 in the United States―a proxy for those systems serving populations larger than 1 million. The rationale is that many of these areas are vulnerable to major emergencies that could require an evacuation, so they are more likely than smaller UAs to have emergency response and evacuation plans in place. Moreover, many of these areas have sizable transit systems, or even multiple systems, and hence the capacity for transit to play a major role in the event of an emergency evacuation. Therefore, the largest UAs are likely to yield good examples of best practice for other areas. In light of its charge, the committee focused this study primarily on the role of transit in evacuation, in the transport of emergency personnel and equipment to an emergency site, and in recovery. Several other issues are important to successful emergency response and evacuation, such as sheltering issues (where to take evacuees who use transit) and interfaces with local enforcement officials (to provide security at assembly points and drop-off locations). These issues are noted in the report, but they are not studied in any depth because the committee believes they are tangential to its primary charge.
The study is also focused on major incidents that could necessitate a significant evacuation from the central business district or other location in a UA, and in which meeting the associated surge demands and coordination requirements is likely to strain the capacity of a single jurisdiction or transit agency (see Figure 1-1). Emergency responders and the general public are familiar with localized incidents, which are relatively contained, can be handled in a matter of hours, and typically do not involve an evacuation. An examination of larger incidents is more likely to illuminate the command structure, communications systems, and coordination capabilities necessary for transit and other agencies to operate as successful partners in an emergency evacuation.
The primary audiences for this report are congressional staff and the Federal Transit Administration sponsors, as well as transit operators, emergency managers, and state and local departments of transportation. The report identifies critical success factors and necessary steps for achieving an expanded role for transit in emergency evacuation. It also suggests the limits to using transit, particularly if the transit system itself is compromised in an emergency.
3 Transit here does not include services provided by private operators, such as intercity bus, taxi, and shuttle services, although the committee recognizes that they may also play an important role in emergency evacuation. 4 For Census 2000, the U.S. Census Bureau classified as "urban" all territory, population, and housing units located within an urbanized area (UA) or an urban cluster (UC). According to the Census Bureau, UA and UC boundaries encompass densely settled territory, which consists of (a) core census block groups or blocks that have a population density of at least 1,000 people per square mile and (b) surrounding census blocks that have an overall density of at least 500 people per square mile.
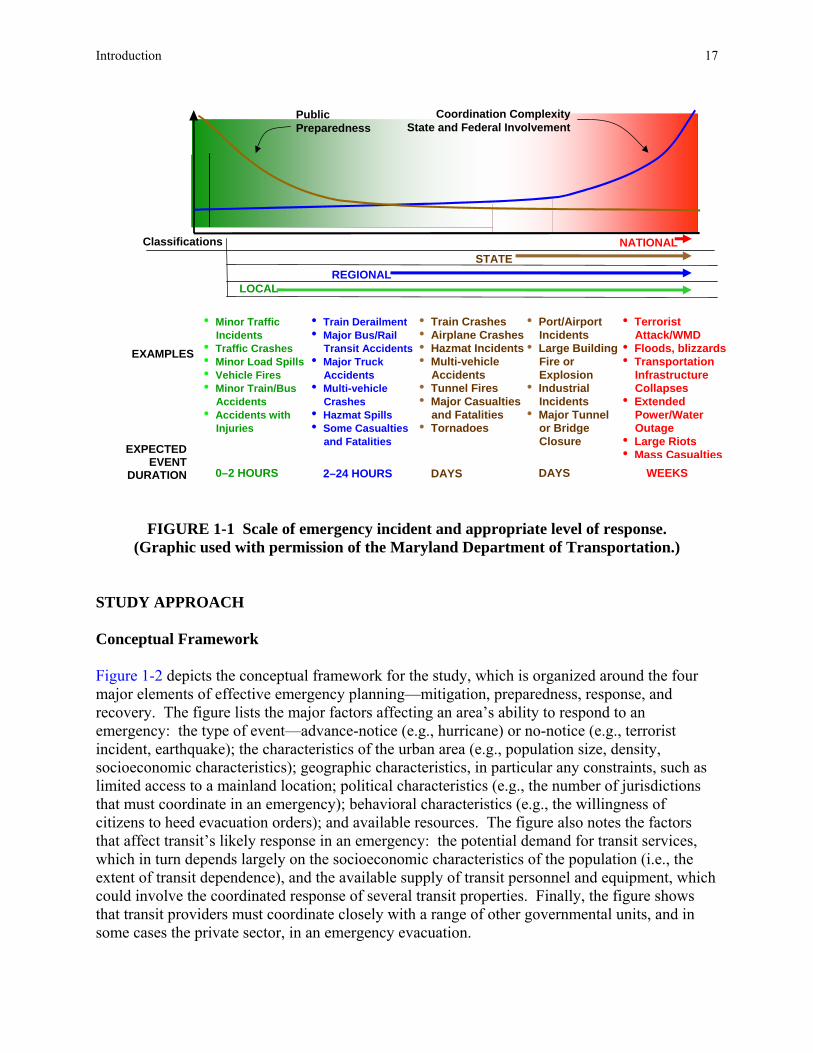
Introduction 17
FIGURE 1-1 Scale of emergency incident and appropriate level of response. (Graphic used with permission of the Maryland Department of Transportation.)
STUDY APPROACH Conceptual Framework Figure 1-2 depicts the conceptual framework for the study, which is organized around the four major elements of effective emergency planning—mitigation, preparedness, response, and recovery. The figure lists the major factors affecting an area’s ability to respond to an emergency: the type of event—advance-notice (e.g., hurricane) or no-notice (e.g., terrorist incident, earthquake); the characteristics of the urban area (e.g., population size, density, socioeconomic characteristics); geographic characteristics, in particular any constraints, such as limited access to a mainland location; political characteristics (e.g., the number of jurisdictions that must coordinate in an emergency); behavioral characteristics (e.g., the willingness of citizens to heed evacuation orders); and available resources. The figure also notes the factors that affect transit’s likely response in an emergency: the potential demand for transit services, which in turn depends largely on the socioeconomic characteristics of the population (i.e., the extent of transit dependence), and the available supply of transit personnel and equipment, which could involve the coordinated response of several transit properties. Finally, the figure shows that transit providers must coordinate closely with a range of other governmental units, and in some cases the private sector, in an emergency evacuation.
LOCAL REGIONALSTATE
NATIONALClassifications
EXAMPLES
EXPECTED EVENT
DURATION
Coordination ComplexityState and Federal Involvement
PublicPreparedness
0–2 HOURS 2–24 HOURS WEEKSDAYSDAYS
• Minor Traffic Incidents
• Traffic Crashes • Minor Load Spills • Vehicle Fires • Minor Train/Bus
Accidents • Accidents with
Injuries
• Train Derailment • Major Bus/Rail
Transit Accidents • Major Truck
Accidents • Multi-vehicle
Crashes • Hazmat Spills • Some Casualties
and Fatalities
• Train Crashes • Airplane Crashes• Hazmat Incidents• Multi-vehicle
Accidents • Tunnel Fires • Major Casualties
and Fatalities • Tornadoes
• Port/Airport Incidents
• Large Building Fire or Explosion
• Industrial Incidents
• Major Tunnel or Bridge Closure
• Terrorist Attack/WMD
• Floods, blizzards • Transportation
Infrastructure Collapses
• Extended Power/Water Outage
• Large Riots • Mass Casualties

18 Special Report 294: The Role of Transit in Emergency Evacuation
FIGURE 1-2 Factors affecting local emergency response capacity. Study Tasks The above conceptual framework helped shape the committee’s approach to the three tasks included in its charge: a) review of the existing literature, b) analysis of the state and regional emergency response and evacuation plans of the 38 largest UAs, and c) the conduct of case studies. Each task is discussed in turn below. The study began with a literature review to determine what could be learned from previous studies about the role of transit in emergency evacuation. The committee sought evidence from a broad range of situations—from such advance-notice incidents as hurricane evacuations and transport of crowds for major planned tourist events (e.g., use of transit in Fourth of July celebrations) to such no-notice emergencies as the terrorist attacks of September 11, 2001. The review included the perspectives of both the populations served by transit (e.g., commuters, the carless) and the capacity of the transit and highway systems to handle an emergency evacuation. While casting a broad net, however, the committee could find few
Response
Preparedness/ emergency response and evacuation plans
Recovery
Available supply of personnel and
equipment
iMayor and governors iEmergency management
agencies iLaw enforcement officials iDepartments of transportation iSchool districts iOther local governments iPrivate sector
Mitigation
Factors affecting response: iType of incident
(advance- or no-notice) iCharacteristics of urban area iGeographic considerations iInstitutional and political characteristics iBehavioral characteristics iAvailable resources
Demand for service/demographic characteristics of the
population
Transit agencies
Introduction 19
studies focused specifically on the role of transit in emergency evacuation. This report summarizes the available evidence, which is used to identify key factors that appear to be critical to the successful use of transit in an emergency evacuation. The second study task was to identify and assess the existing emergency response and evacuation plans of the UAs that are the primary focus of this study. Initially, the committee had hoped to draw on the congressionally mandated emergency plan reviews of the 75 largest UAs and all states (DHS 2006) conducted by the U.S. Department of Homeland Security (DHS), but confidentiality issues prevented DHS from sharing that information in other than summary form. The committee drew on other relevant work, but there were many gaps to fill.5 To that end, the committee initiated its own plan assessment by developing a profile for each of the UAs, with indicators of many of the factors outlined in Figure 1-2 that affect response capability. Available plans were then accessed for each of the non–case study UAs and their respective states, and a summary spreadsheet of responses to key questions about the role of transit (or lack thereof) in emergency evacuation plans was prepared. For budgetary reasons, this review was limited to documents in the public domain that are generally available online. The committee made a limited number of follow-up calls to those UAs for which plans could not readily be located, but security-sensitive plans and those in the process of being updated were not included. Hence, the committee’s assessment provides only a partial picture of the evacuation readiness of these UAs and their inclusion of transit in emergency evacuation plans.
The committee’s final task was to conduct five in-depth case studies as a complement to its more summary plan assessment. The committee drew on the conceptual framework depicted in Figure 1-2 in selecting the case study sites. At a minimum, the committee was interested in selecting areas that have different types of transit systems (e.g., rail, bus), face different types of emergencies (e.g., hurricanes, terrorist events, earthquakes), are located in different regions of the country, have a high percentage of special-needs populations (e.g., the carless, the disabled, others needing special assistance in an evacuation), and would experience different jurisdictional issues in an evacuation (e.g., coordination of multiple transit providers, multiple jurisdictions, multiple states). In addition, while focusing on the largest UAs, the committee was interested in selecting at least one smaller, less-studied area among the 38. The purpose of the case studies was to provide a more in-depth understanding of the current or potential role of transit in different emergency evacuation circumstances. More specifically, the committee hoped the case studies would help illuminate a) how emergency managers can include transit in emergency plans more effectively, and b) how transit operators themselves can organize more effectively to be ready to assist in an emergency evacuation. Key Issues In undertaking its work, the committee noted several key issues that, in its judgment, have a significant effect on the role of transit in emergency evacuation.
First, the scale of the incident matters. The larger and more catastrophic the incident, the greater are the surge capacity requirements not only of the transit system, but also of the
5 The Federal Transit Administration shared the results and selected source documents of a study completed by Milligan & Company, LLC (Bailey et al. 2007) on emergency preparedness plans for minority, low-income, and limited-English-proficient persons without vehicles in 20 metropolitan regions. John Renne, Associate Director of the University of New Orleans Transportation Center, also shared research in progress on disaster plans for the carless for many urban areas.

20 Special Report 294: The Role of Transit in Emergency Evacuation
transportation system in general in an emergency evacuation. In the event of a catastrophic emergency, is evacuation of a large portion of a major metropolitan area a realistic goal? What role can transit reasonably play in such a situation?
Second, the type of incident is important. Events that occur with some regularity, such as hurricanes―even though there is uncertainty about their trajectory and intensity―are easier to plan for than unexpected events, such as the terrorist attacks of September 11, 2001. In the case of the former events, affected areas typically have evacuation plans in place, including predesignated evacuation routes and destinations, as well as considerable experience with handling incidents that has resulted in plan modifications. In areas that face a multitude of different threats, emergency managers are focused on procedures and flexible plans that can be modified once the type of incident and its extent become clear. This capability requires sophisticated coordination and communications in which transit agencies must be a partner.
Third, the role transit can play in an emergency evacuation depends on its size relative to the UA, the mutual-aid agreements it has forged with other providers, and the representation of its key staff in the incident command structure. In addition, transit’s response depends on the time of an incident (e.g., during or after rush hour); the day of the week; the duration of the event; and, of course, on whether the system itself is compromised. For example, surge capacity needs are probably greatest if the incident occurs during the morning or afternoon rush. However, personnel and equipment are at their maximum capacity during these times. During off-peak hours, such as midday, it takes time to recall people and equipment in the event of an emergency requiring evacuation. Similarly, an event that simply requires shifting service away from a particular area or even conducting a partial evacuation places far less demand on the system than one that requires a large-scale evacuation, multiple trips to take customers and the carless out of the area, and potential diversion of some equipment to help support emergency responders.
Finally, transit can play a unique role in the evacuation of special-needs populations, ranging from those who simply lack access to a private vehicle to those who may need special assistance (e.g., the disabled, the elderly). The difficulty lies in identifying these populations and their specific transportation needs, matching these needs to appropriate transit service providers, and ensuring that the providers are available during an emergency. Moreover, keeping this information up to date is both costly and challenging, particularly in large UAs.
In conducting this study, the committee was mindful of each of the above issues and the complexities that result. ORGANIZATION OF THE REPORT The results of the three main study tasks are described in the chapters that follow. Chapter 2 provides a brief overview of emergency planning in general and evacuation planning in particular to set the stage for the subsequent chapters. Chapter 3 elaborates on the factors that affect the role of transit in an emergency evacuation and reports on the findings of the committee’s literature review to augment and illustrate these characteristics. Chapter 4 is focused on the 38 UAs, including the results of the committee’s plan assessment and case studies; findings are drawn from both. The fifth and final chapter summarizes the committee’s judgment regarding the factors critical to enhancing transit’s role in emergency evacuation, as well as the limits on the use of transit and complementary measures necessary to increase the
Introduction 21
capacity and resilience of the transportation system within which transit operates. This chapter presents the committee’s recommendations and suggestions for supporting research, along with action steps needed at the federal, state, and local level. REFERENCES Abbreviation DHS U.S. Department of Homeland Security Bailey, D., S. Swiacki, A. Byrnes, Buckley, J., King, D., Piper, V., Marino, M., Mundle, S., Pierlott, G.,
and Lynd, A. 2007. Transportation Equity and Emergency Preparedness: A Review of the Practices of State Departments of Transportation, Metropolitan Planning Organizations, and Transit Agencies in 20 Metropolitan Areas. Final Report. FTA-PA-26-8001-2007. Milligan & Company, LLC and Mundle & Associates, Philadelphia, PA, May.
DHS. 2006. Nationwide Plan Review, Phase 2 Report, Washington, D.C., June 16, http://www.dhs.gov/xlibrary/assets/Prep_NationwidePlanReview.pdf.

23
2
Emergency and Evacuation Planning and Response
his chapter provides an overview of emergency planning and response in general and evacuation planning in particular to provide a context for discussion of the potential role of
transit in these plans. The chapter begins with an analysis of the types of disasters that may require emergency evacuation. It then shifts to a description of emergency planning and response, including both general principles and a brief history of emergency planning since the 1950s. A discussion of evacuation planning and response and of the potential contribution of transportation planning agencies follows. The final section reviews of sources of funding for evacuation planning and operations. A TYPOLOGY OF MAJOR DISASTERS This study is focused on major emergency incidents that involve an evacuation and exceed local response capacity. The committee sought a database of such incidents to understand more fully their types, frequency, and locations. The only salient longitudinal database is maintained by the Federal Emergency Management Agency (FEMA). FEMA reports on the number of presidentially declared disasters—between 45 and 75 annually in recent years—both natural and human caused, that exceed local capacity, require state and federal assistance, and may involve an evacuation.1
Figure 2-1 displays historical data from the FEMA database by type for the years 1953 through 2007. Severe storms account for two-thirds (66 percent) of the total, followed by floods (10 percent) as a distant second, and hurricanes (8 percent) and tornados (5 percent) in third and fourth place, respectively.
Major disasters are concentrated geographically. Nearly one-third of all presidentially declared disasters since 1953 have occurred in only 10 states (see Figure 2-2). However, different regions of the country are subject to different types of disasters (see Table 2-1).
Another useful distinction is between hazards, such as tropical storms, that provide advance notice and recur with some regularity, and those, such as earthquakes and terrorist events, that strike without warning (no notice). Communities can plan for the former—the Gulf Coast states are a good example, with their designated evacuation routes and hurricane shelter systems—but planning for the latter is difficult.
The disasters that have had the greatest impact on emergency management and policy in recent years—the terrorist attacks of September 11, Hurricanes Katrina and Rita in 2005, and Hurricane Andrew in 1992—are low-probability but high-impact events as regards their devastation. The importance attached to preparing for such disasters is due to their potential to have catastrophic impacts.
1 The committee was also interested in non–presidentially declared incidents that involve multiple jurisdictions in a region but do not necessarily require federal or even state assistance; however, no database of such incidents could be found.
T
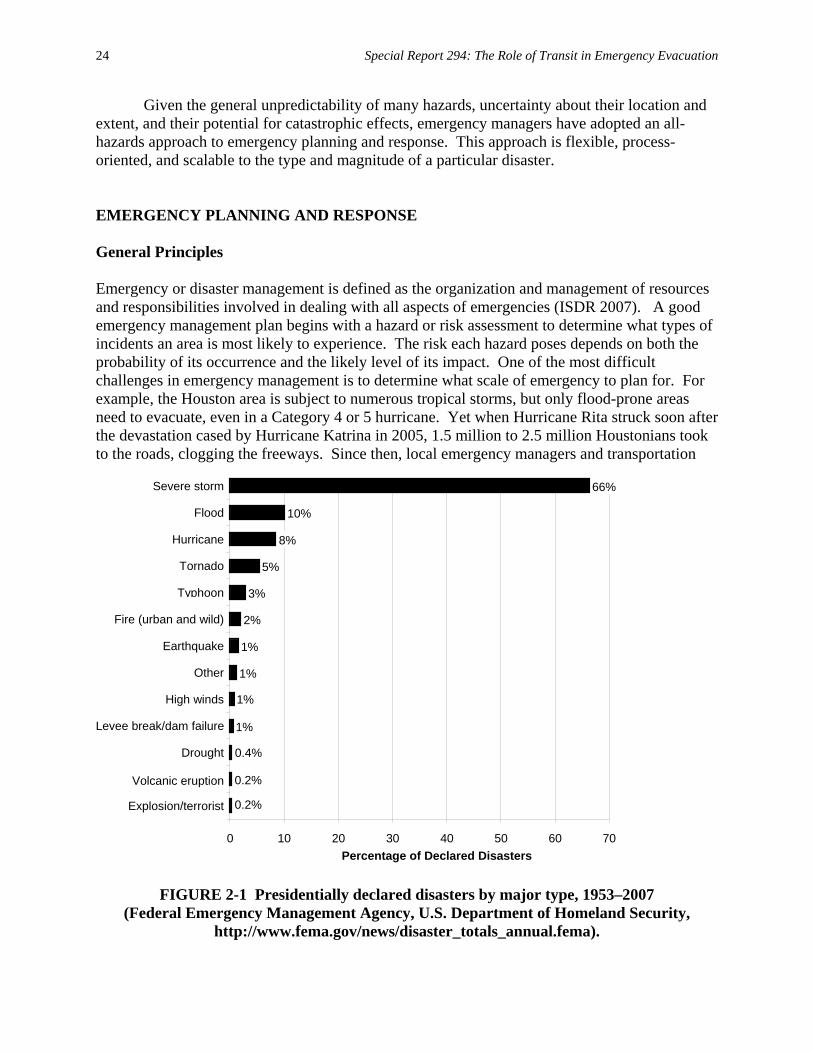
24 Special Report 294: The Role of Transit in Emergency Evacuation
Given the general unpredictability of many hazards, uncertainty about their location and extent, and their potential for catastrophic effects, emergency managers have adopted an all-hazards approach to emergency planning and response. This approach is flexible, process-oriented, and scalable to the type and magnitude of a particular disaster. EMERGENCY PLANNING AND RESPONSE General Principles Emergency or disaster management is defined as the organization and management of resources and responsibilities involved in dealing with all aspects of emergencies (ISDR 2007). A good emergency management plan begins with a hazard or risk assessment to determine what types of incidents an area is most likely to experience. The risk each hazard poses depends on both the probability of its occurrence and the likely level of its impact. One of the most difficult challenges in emergency management is to determine what scale of emergency to plan for. For example, the Houston area is subject to numerous tropical storms, but only flood-prone areas need to evacuate, even in a Category 4 or 5 hurricane. Yet when Hurricane Rita struck soon after the devastation cased by Hurricane Katrina in 2005, 1.5 million to 2.5 million Houstonians took to the roads, clogging the freeways. Since then, local emergency managers and transportation
FIGURE 2-1 Presidentially declared disasters by major type, 1953–2007 (Federal Emergency Management Agency, U.S. Department of Homeland Security,
http://www.fema.gov/news/disaster_totals_annual.fema).
1%
1%
2%
3%
5%
8%
10%
66%
1%
1%
0.4%
0.2%
0.2%
0 10 20 30 40 50 60 70 Explosion/terrorist
Volcanic eruption
Drought
Levee break/dam failure High winds
Other
Earthquake
Fire (urban and wild)
Typhoon
Tornado
Hurricane
Flood
Severe storm
Percentage of Declared Disasters

Emergency and Evacuation Planning and Response 25
78
71
5753 52
47 45 44 42 42
0
10
20
30
40
50
60
70
80
90
Texas Californ ia Florida New York Lou isiana Oklahoma Alabama Kentucky Ohio Mississippi
Num
ber o
f Pr
esid
entia
lly D
ecla
red
Dis
aste
rs
State
78
71
5753 52
47 45 44 42 42
0
10
20
30
40
50
60
70
80
90
Texas Californ ia Florida New York Lou isiana Oklahoma Alabama Kentucky Ohio Mississippi
Num
ber o
f Pr
esid
entia
lly D
ecla
red
Dis
aste
rs
State FIGURE 2-2 Presidentially declared disasters, top 10 states, 1953–2007
(Federal Emergency Management Agency, U.S. Department of Homeland Security, http://www.fema.gov/news/disaster_totals_annual.fema).
Note: Declared disasters in these 10 states represent 32 percent of all disasters.
TABLE 2-1 Major Disaster Types and Locations Type of Disaster Major Geographic Location Winter storms Northeast/Midwest Tropical storms Gulf Coast Tornadoes Plains states Earthquakes Western states Terrorism Large urban areas
Note: Locations shown are the major ones where each disaster occurs. Each can also occur in other locations across the country. Source: Synthesized from the Federal Emergency Management Agency database of presidentially declared disasters by year, 1953–2007.

26 Special Report 294: The Role of Transit in Emergency Evacuation
providers, in conjunction with state officials, have developed more robust plans for a mass evacuation and are encouraging sheltering in place where doing so is safe. Nevertheless, it remains an open question whether evacuating a large portion of a major metropolitan area is feasible and whether planning for such an eventuality makes sense. A basic tenet of American emergency management is that incidents should be handled as locally as possible; if an incident overwhelms local capability, mutual-aid agreements with neighboring jurisdictions can and should be invoked or help from higher levels of government secured. Emergency response plans typically comprise four elements:
• Mitigation • Preparedness • Response, and • Recovery.
Mitigation involves efforts to prevent hazards from developing into disasters in the first
place (e.g., through flood levees or land use controls). In the event of a disaster, mitigation also refers to steps that can be taken both in advance of and during response to lessen the likelihood of damage and reduce the impacts. Preparedness involves the development of comprehensive emergency management plans and detailed emergency operational plans. These plans define a decision-making structure (i.e., chain of command), identify which agencies should be represented in the decision-making structure and in what capacity (e.g., primary or supporting role), and establish a communications system. Other key elements of preparedness include training, emergency drills, and plan maintenance and revisions. Many large urbanized areas have established emergency operations centers—sometimes in conjunction with area transportation management centers—where critical decision makers can operate during an emergency. Response involves mobilizing first responders (e.g., police, fire, emergency medical services) and providing emergency support services at the disaster site. Depending on the nature of the incident, the response phase may also involve evacuation from the affected area. Finally, recovery involves reestablishing normal operations and can include returning evacuees to the affected area. Transit agencies can be important participants in all four activities. Transit has a role to play in mitigation by protecting its own assets (e.g., moving vehicles to higher ground during severe flooding) and establishing redundant communications systems to help ensure continuity of service. Transit agencies should also be part of preparedness plans and represented in the emergency command structure. They can play a vital role as well during the response phase, both in helping evacuate those without access to a private vehicle and in bringing emergency responders and equipment to the incident site. Finally, transit agencies can be involved in recovery, reestablishing normal transit operations and bringing evacuees back to the area if necessary.

Emergency and Evacuation Planning and Response 27
History The structure of emergency planning and response has evolved over the past 50 years or more, often in response to major disasters.2 For purposes of this brief overview, it is useful to divide this history into three periods. Civil Defense Era and Creation of FEMA Disaster response, particularly the role of the federal government, was formalized in 1950 by two important pieces of legislation. The outbreak of the Korean War and concern about a nuclear attack resulted in the Civil Defense Act of 1950, which expanded the concept of disaster to include intentional human-caused events and recognized the need for a coordinating federal role in disaster response (Ward and Wamsley 2007). The Federal Civil Defense Administration, which reported directly to the President, was created to coordinate civil defense efforts by all levels of government. The Federal Disaster Assistance Act of 1950 formalized a federal role in disaster assistance. It authorized the President to determine when such assistance would be provided (through a presidential declaration) and which federal agencies would be involved. However, the legislation also maintained the primacy of state and local governments in emergency planning and response.
During the 1950s and 1960s, the Cold War and the nuclear arms race made the civil defense component of emergency management a priority, relegating federal response to natural disasters to a loosely coordinated response system (Ward and Wamsley 2007). However, a series of natural disasters—the Alaska earthquake of 1964 and hurricanes on the Gulf Coast (e.g., Hurricane Agnes in 1972)—and finally, the human-caused accident at the Three Mile Island nuclear power plant in Pennsylvania in 1979 provided the impetus for an overhaul of the nation’s disaster response system and priorities. The states, through the National Governors Association (NGA), requested President Carter to centralize federal emergency assistance functions and streamline the number of agencies with which state and local governments were required to work.3 At the time of the NGA request, federal disaster response was scattered among more than 100 federal agencies. In response to the request, the President signed Executive Order 12148 in 1979, creating FEMA. The new agency began developing a comprehensive emergency management system based on an all-hazards approach to replace the diverse emergency response plans of the agencies it had absorbed.
In 1988, Congress passed the Robert T. Stafford Disaster Relief and Emergency Assistance Act, which established a system for initiating federal assistance to state and local governments.4 The act authorized the director of FEMA to prepare a Federal Response Plan (FRP) and required all states to prepare their own Emergency Operations Plans. The FRP was designed to work in tandem with the emerging state plans.
2 Much of the material in this section was drawn from Ward and Wamsley (2007) and Sylves (2007). See also Disaster Timeline in TR News (Rubin et al. 2007). 3 FEMA absorbed the Federal Insurance Administration, the National Fire Prevention and Control Administration, the National Weather Service Preparedness Program, the Federal Preparedness Agency of the General Services Administration, and the Federal Disaster Assistance Administration within the Department of Housing and Urban Development. Civil defense responsibilities were also transferred from the Defense Civil Preparedness Agency of the Defense Department (FEMA History, accessed on line at http://www.fema.gov/about/history.shtm on July 30, 2007). 4 The Robert T. Stafford Disaster Relief and Emergency Relief Act, as amended, 42 U.S.C. 5121, et. seq.
28 Special Report 294: The Role of Transit in Emergency Evacuation
Hurricane Andrew and the Reinvention of FEMA The FEMA created in 1979 did not fulfill its promise. During the Reagan Administration, the combination of a refocusing of disaster response on civilian defense and relatively few major natural disasters led to a weakened system for response to the latter events. Then a series of natural disasters occurred—the 1989 Loma Prieta earthquake in northern California; Hurricane Hugo, also in 1989; and Hurricane Andrew in 1992—and FEMA was widely criticized for its ineffective response. One of only three Category 5 hurricanes to strike the United Sates in the twentieth century and one of the nation’s costliest hurricanes (Sylves 2007), Andrew struck just before the 1992 presidential election. Newly elected President Clinton responded to the criticism of FEMA by appointing James Lee Witt as its head—the first agency director with experience as a state emergency manager. He helped streamline disaster relief and recovery operations, required an agency focus on emergency preparedness and mitigation, and issued guidance (in 1996) to states and local governments for the development of their own emergency operations plans—State and Local Guide (SLG) 101—which remains a staple among state and local emergency planners.5 By the time Witt left the agency in 2001, FEMA had been elevated to the cabinet level.
Hurricane Andrew also resulted in a revamping of state mutual-aid agreements, which became a common tool for coordinating disaster response at the state and local levels.6 A major advance in such agreements occurred in the 1990s. The devastation resulting from Hurricane Andrew in Florida in 1992 made it clear that even with federal support, states would need to call upon each other in times of emergency. Initiated by the Southern Governors Association and the Virginia Department of Emergency Services, the Southern Regional EMAC—a state-to-state mutual-aid agreement—was formed in 1993. In 1995, its membership was opened to any state or territory that wished to participate, and the National Emergency Management Association was chosen as its administrator. Congress ratified EMAC in the following year (Public Law 104-321). Post–September 11 The terrorist attacks of September 11 resulted in a dramatic reorganization of emergency planning and response to enhance the nation’s emergency preparedness, particularly at the federal level. In 2001, President Bush established the Homeland Security Council within the White House. In the following year, Congress passed the Homeland Security Act of 2002, creating a new U.S. Department of Homeland Security (DHS)—a major reorganization that consolidated FEMA and 22 other federal agencies, programs, and offices into a single cabinet-
5 The guide (FEMA 1996) provides a toolbox of ideas and advice for those responsible for developing emergency operations plans in state and local emergency management agencies, based on FEMA’s risk-based, all-hazards approach. 6 Some of the first mutual-aid agreements, which evolved into the Incident Command System (ICS), were developed in the 1970s following a series of major wildfires in California. Firefighters drawn from dozens of jurisdictions found that their management structures were incompatible, and that they were unable to coordinate their resources to provide an effective response (USDOT 2006). Subsequently, an interagency task force of local, state, and federal agency representatives worked collaboratively to develop the ICS—a consistent, integrated framework for the management of emergencies requiring a multiagency response, which can be scaled appropriately to the size of the incident.
Emergency and Evacuation Planning and Response 29
level agency.7 DHS officially began operations on January 24, 2003, with the mission of providing a coordinated approach to national security for emergencies and disasters, both natural and man made. President Bush issued a series of national policy directives to build on existing federal, state, and local emergency response initiatives to enhance the capability of all levels of government to respond to major disasters. Homeland Security Presidential Directive (HSPD)-5, Domestic Incident Management, issued in 2003, mandated that DHS create two plans—the National Incident Management System (NIMS) (also a mandate of the 2002 Homeland Security Act) and the National Response Plan (NRP). NIMS provides a consistent nationwide approach by which federal, state, local, and tribal governments; the private sector; and nongovernmental organizations can work together to prepare for, respond to, and recover from domestic disasters, regardless of their cause, size, or complexity (DHS 2004). NIMS built on and incorporated existing best practices, such as the Incident Command System (ICS) structure, to form six major components of an integrated systems approach.8 HSPD-5 required that all federal departments and agencies adopt NIMS, and made its adoption a prerequisite for state and local jurisdictions to receive federal emergency preparedness assistance beginning in fiscal year (FY) 2005. HSPD-5 also required that DHS develop an operational incident management plan to complement NIMS, integrating federal domestic prevention, preparedness, response, and recovery plans into a single all-discipline, all-hazards approach (DHS 2004). Issued in final form in 2005, the resulting NRP defines the roles of both government agencies at various levels and nongovernmental organizations. The plan assigns these entities responsibilities and functional roles as emergency support functions (ESFs) (see Table 2-2), which serve as the primary operational-level mechanism through which federal agencies provide assistance to state, local, and tribal governments (DHS 2004). Many state and local governments have adopted the NIMS and NRP structures in organizing their emergency operations plans. HSPD-8, National Preparedness, issued along with HSPD-5 in 2003, directed DHS to develop specific goals and targets for achieving national preparedness, establish a system for assessing the overall level of that preparedness, and provide financial assistance in the form of grants to support state and local governments in achieving the specified goals. DHS responded in 2005 by issuing National Preparedness Guidance that identifies the tasks and capabilities needed by local, state, and federal agencies to respond to a range of threats, from hurricanes and earthquakes, to biological, chemical, and radiological events (USDOT 2006). Also in 2005, in coordination with other federal departments and agencies, DHS issued an Interim National Preparedness Goal that established a process for prioritizing federal preparedness assistance on the basis of risk and the need to enhance capabilities to further national priorities. Hurricane Katrina vividly demonstrated flaws in the NRP. To determine what had gone wrong, Congress mandated two complementary assessments—by DHS (DHS 2006) and the U.S. Department of Transportation (USDOT) (USDOT 2006). The findings from both reports are summarized in the next chapter and reviewed in greater detail in Appendix B. In response to these assessments, DHS released a successor to the NRP—the National Response Framework—in January 2008. The intent was to provide a streamlined document that would be more accessible and user-friendly for senior elected and appointed officials. Among other items, the
7 Public Law No. 107-296, 116 Stat. 2135, dated November 25, 2002. 8 The six components are command and management, preparedness, resource management, communications and information management, supporting technologies, and ongoing management and maintenance.
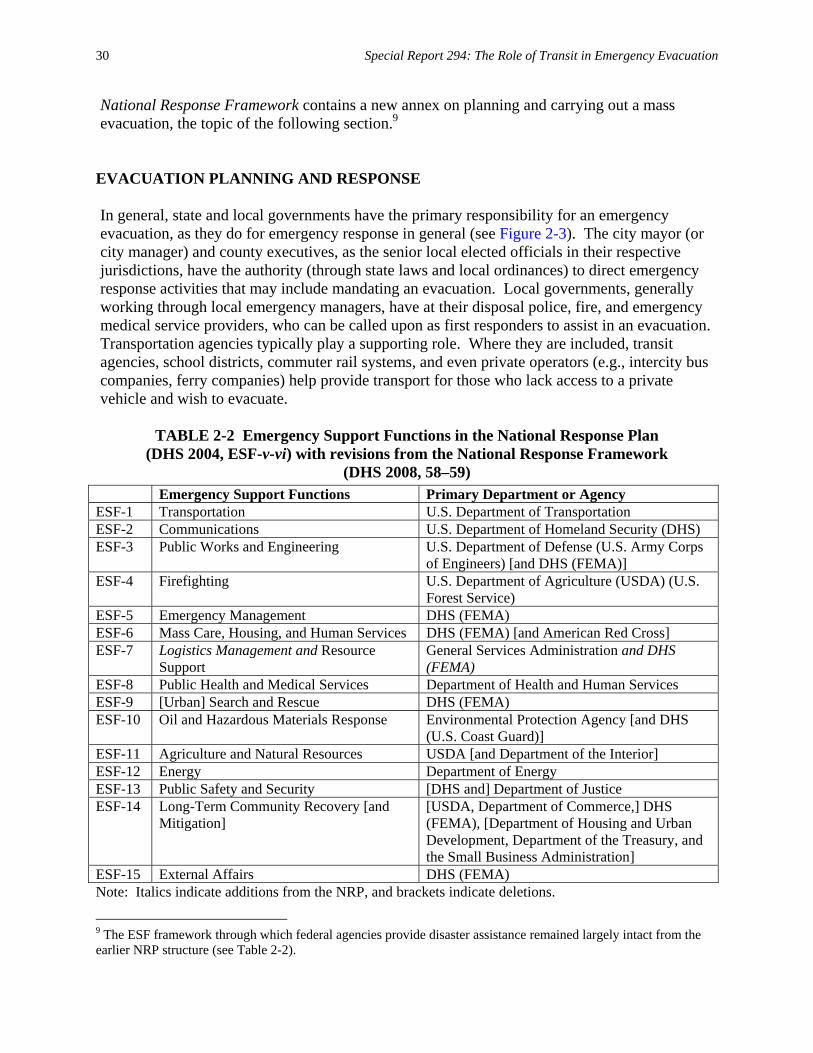
30 Special Report 294: The Role of Transit in Emergency Evacuation
National Response Framework contains a new annex on planning and carrying out a mass evacuation, the topic of the following section.9
EVACUATION PLANNING AND RESPONSE In general, state and local governments have the primary responsibility for an emergency evacuation, as they do for emergency response in general (see Figure 2-3). The city mayor (or city manager) and county executives, as the senior local elected officials in their respective jurisdictions, have the authority (through state laws and local ordinances) to direct emergency response activities that may include mandating an evacuation. Local governments, generally working through local emergency managers, have at their disposal police, fire, and emergency medical service providers, who can be called upon as first responders to assist in an evacuation. Transportation agencies typically play a supporting role. Where they are included, transit agencies, school districts, commuter rail systems, and even private operators (e.g., intercity bus companies, ferry companies) help provide transport for those who lack access to a private vehicle and wish to evacuate.
TABLE 2-2 Emergency Support Functions in the National Response Plan
(DHS 2004, ESF-v-vi) with revisions from the National Response Framework (DHS 2008, 58–59)
Emergency Support Functions Primary Department or Agency ESF-1 Transportation U.S. Department of Transportation ESF-2 Communications U.S. Department of Homeland Security (DHS) ESF-3 Public Works and Engineering U.S. Department of Defense (U.S. Army Corps
of Engineers) [and DHS (FEMA)] ESF-4 Firefighting U.S. Department of Agriculture (USDA) (U.S.
Forest Service) ESF-5 Emergency Management DHS (FEMA) ESF-6 Mass Care, Housing, and Human Services DHS (FEMA) [and American Red Cross] ESF-7 Logistics Management and Resource
Support General Services Administration and DHS (FEMA)
ESF-8 Public Health and Medical Services Department of Health and Human Services ESF-9 [Urban] Search and Rescue DHS (FEMA) ESF-10 Oil and Hazardous Materials Response Environmental Protection Agency [and DHS
(U.S. Coast Guard)] ESF-11 Agriculture and Natural Resources USDA [and Department of the Interior] ESF-12 Energy Department of Energy ESF-13 Public Safety and Security [DHS and] Department of Justice ESF-14 Long-Term Community Recovery [and
Mitigation] [USDA, Department of Commerce,] DHS (FEMA), [Department of Housing and Urban Development, Department of the Treasury, and the Small Business Administration]
ESF-15 External Affairs DHS (FEMA) Note: Italics indicate additions from the NRP, and brackets indicate deletions.
9 The ESF framework through which federal agencies provide disaster assistance remained largely intact from the earlier NRP structure (see Table 2-2).

Emergency and Evacuation Planning and Response 31
Local governments may enter into mutual-aid agreements, either formal or informal, with other jurisdictions to augment their resources. If local resources are likely to be exhausted in a major emergency, local officials will call for assistance from neighboring jurisdictions, invoking such agreements. If an emergency involves an entire region, local officials can request state assistance (see Figure 2-3). As the chief executive, the governor, typically operating in coordination with the state emergency management agency, will declare a state of emergency and direct the appropriate resources to assist the local jurisdiction. These resources include law enforcement, the state department of transportation (DOT), and possibly the National Guard if an evacuation is required. State DOTs typically manage contraflow operations, which enable both sides of a limited- or controlled-access state highway to carry evacuees in one direction, thereby increasing the highway’s capacity for those evacuating by private vehicle or bus. State agencies also may enter into mutual-aid agreements with other states in those locations where an emergency evacuation could involve multiple states, as occurred in Hurricane Katrina.
Federal assistance is invoked only if state and local resources are overwhelmed in a catastrophic incident or when special equipment is needed (e.g., U.S. Coast Guard vessels, helicopters) (see Figure 2-3). Amendments to the Stafford Act in 2006 following Hurricane Katrina reaffirmed the primacy of state and local governments specifically with respect to evacuations. If federal assistance is required, DHS has clarified that FEMA is responsible for leading and coordinating that assistance, and the mass evacuation annex of the National Response Framework describes federal agency responsibilities in such cases (DHS 2007a).
Federal law requires that local emergency planning officials develop emergency plans that encompass evacuation.10 Since 2006, plans have also been required to include provisions for populations with special needs, including persons with disabilities (GAO 2006).11 FEMA’s SLG-101 provides a separate evacuation annex (as Attachment E) that many local governments have used as a template in designing such emergency evacuation plans. The annex begins with several operating assumptions for planning purposes regarding the likely number of evacuees. Then the document describes several operational concepts for carrying out a complete or partial evacuation, including definition of the areas likely to be evacuated; specification of the travel routes and destinations of evacuees; means of transport for evacuees including provisions for evacuating special-needs populations and identification of assembly areas for picking up those who lack their own transportation; measures for controlling the flow of evacuees from the emergency site; and arrangements for returning evacuees to their homes. The remainder of the document covers the possible organizations and responsibilities of those tasked with carrying out an evacuation. They include the chief executive, an evacuation coordinator, an emergency manager, law enforcement, public works, a public information officer, a mass care coordinator, a health and medical coordinator, the education department and school superintendent, and the animal care and control agency. The document ends with a discussion of administration and
10 Title 42 U.S.C. § 11003(c)(7). This requirement is part of the Emergency Planning and Community Right-to-Know Act of 1986, also known as the Superfund Amendments and Reauthorization Act, Title III. The act requires that community emergency response plans for chemical accidents include provisions for a precautionary evacuation and alternative traffic routes. 11 Presidential Executive Order 13347 requires that federal agencies consider the unique needs of employees with disabilities, as well as those the agencies serve (see the summary of the committee’s literature review in Chapter 3 and the detailed discussion of that review in Appendix B). The Americans with Disabilities Act requires state and urban areas to include accessibility for persons with disabilities in their emergency preparedness process (GAO 2006).
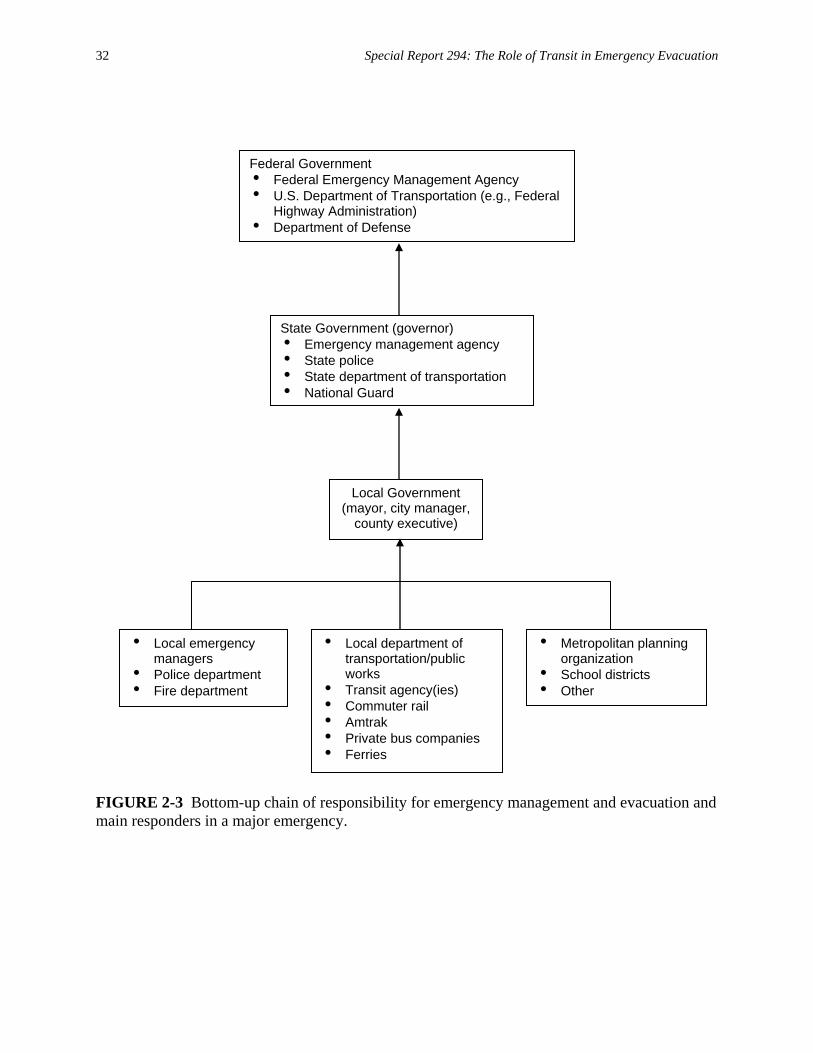
32 Special Report 294: The Role of Transit in Emergency Evacuation
FIGURE 2-3 Bottom-up chain of responsibility for emergency management and evacuation and main responders in a major emergency.
Federal Government i Federal Emergency Management Agency i U.S. Department of Transportation (e.g., Federal
Highway Administration) i Department of Defense
State Government (governor) i Emergency management agency i State police i State department of transportation i National Guard
Local Government (mayor, city manager,
county executive)
i Local emergency managers
i Police department i Fire department
i Local department of transportation/public works
i Transit agency(ies) i Commuter rail i Amtrak i Private bus companies i Ferries
i Metropolitan planning organization
i School districts i Other

Emergency and Evacuation Planning and Response 33
logistics and plan development and maintenance. Although the guidance was developed in 1996, it is notable for its inclusion of special-needs populations and its focus on pets and animal care in an emergency evacuation. Also notable, however, is the absence of any mention of transit agencies and their potential role in an emergency evacuation.
The mass evacuation index of the National Response Framework provides an overview of evacuation functions, outlines agency roles and responsibilities, and offers guidelines for a mass evacuation during an incident requiring a coordinated federal response (DHS 2007a). Federal support for state and local government evacuation efforts requires cooperation among many different ESFs, including transportation (transportation support and coordination for evacuation operations), public works and engineering (debris removal and clearance of evacuation routes), mass care (housing and human services), and public safety and security (crowd control, traffic direction, control of contraflow lanes), among others (DHS 2007a and Table 2-2). The role of transportation is specified—to ensure the evacuation of all affected populations, providing resources to those individuals who cannot self-evacuate and ensuring that sufficient transportation assets are available (DHS 2007a). Planning for the evacuation of special-needs populations is highlighted as a key consideration, as is the evacuation of service and companion animals. Transit and school buses are mentioned as a means of transporting evacuees without access to personal vehicles. The annex, however, is very general. For example, it offers no detailed guidance, particularly for state and local governments, about how to estimate the numbers of special needs groups who may need assistance, or to identify and plan for the deployment of accessible equipment in an evacuation.
In early 2008, FEMA released for public comment its Comprehensive Preparedness Guide (CPG 101) (FEMA 2008), which provides updated guidance for state, local, and tribal governments on the planning requirements for preparation of emergency operations plans. The draft document falls short of providing sufficient detail concerning the development of mass evacuation plans, including a template for a regional plan and the key agencies that should be involved.
One issue that warrants more attention in emergency evacuation planning is the scale of evacuation. The DHS assessment of state and local emergency plans (DHS 2006) and the new mass evacuation annex to the National Response Framework are predicated on planning for a catastrophic emergency that would involve multiple agencies and also would require evacuation of major portions of an urban area. Yet some local officials interviewed during the site visits conducted for this study questioned the feasibility of evacuating large segments of a metropolitan area. The evacuations resulting from Hurricanes Katrina and Rita are good illustrations of the problem. Although state and local governments have since been working to bolster plans for evacuation, the experience with Hurricane Rita in particular demonstrates the extraordinary challenge of trying to evacuate a large metropolitan area on short notice. Moreover, developing emergency evacuation plans that are regional in scope—involving multiple jurisdictions, agencies, and states—is a major undertaking.
THE POTENTIAL CONTRIBUTION OF TRANSPORTATION PLANNING AGENCIES Metropolitan planning organizations (MPOs), working in coordination with local governments, have the lead responsibility for regional transportation planning in large urbanized areas. The Highway Act of 1973 required the establishment of MPOs in urbanized areas with a population

34 Special Report 294: The Role of Transit in Emergency Evacuation
of more than 50,000 and dedicated a small portion of each state’s funding from the Highway Trust Fund for this purpose. MPOs are composed primarily of local elected officials whose purpose is to facilitate decision making on regional transportation issues, including major capital investment projects and priorities.
MPOs produce two primary products in the transportation planning process: a long-range transportation plan and a short-term transportation improvement program. The long-range plan typically looks ahead 20 to 30 years, incorporating forecasts of population, economic growth, and land use patterns, to help determine the locus and extent of demand for passenger and freight travel and supporting transportation infrastructure needs in the urbanized area. The transportation improvement program provides a list of short-term capital improvement projects that reflects available funding, and is updated on a 4-year cycle. MPOs vary in their capacity and their role in individual urbanized areas, but their regional perspective could be useful in the development of regional emergency evacuation plans and supporting transportation capital improvement projects. For example, MPOs could become more involved in traffic modeling to simulate various evacuation scenarios and clearance times; the committee found several examples of this type of assistance during the site visits conducted for this study. MPOs could also help identify and program capital improvement projects in their regions to remove bottlenecks and add system capacity to enable a major evacuation, as well as to further other regional transportation objectives (e.g., safety, congestion relief). Finally, MPOs could play a role in facilitating the development of regional emergency plans, or at least helping to coordinate the transportation input to these efforts. The Metropolitan Washington Council of Governments, for example, which represents many local governments in the District of Columbia, suburban Maryland, and northern Virginia, helped with the development of a regional emergency coordination plan for the National Capital Region. SOURCES OF FUNDING FOR EMERGENCY EVACUATION PLANNING AND OPERATIONS Federal Government The federal government is the primary source of funds to state and local governments for the improvement of emergency preparedness, including evacuation planning. DHS is the largest funder. In FY 2007, the Homeland Security Grant Program (HSGP) provided about $1.6 billion in grant awards through five separate programs12 to enhance the ability of states, territories, and urban areas to prepare for, prevent, and respond to terrorist attacks and other major disasters. HSGP funds can be used to support a wide range of activities, including preparedness planning, equipment acquisition, training, exercises, management, and administration.
12 The five programs are (a) the State Homeland Security Program, which supports state homeland security strategies; (b) the Urban Areas Security Initiative, which funds the planning, equipment, training, and exercise needs of high-threat, high-density urban areas, in particular to build capacity to handle terrorist acts; (c) the Law Enforcement Terrorism Prevention Program, directed at the law enforcement and public safety communities for the building of interoperable communications systems, enhancement of collaboration with non–law enforcement partners, and the like; (d) the Metropolitan Medical Response System, which is focused on developing a mass casualty incident preparedness program; and e) the Citizen Corps Program, which provides funds for involving all citizens in emergency preparedness through personal preparedness, training, exercises, and volunteer service (DHS 2007b).
Emergency and Evacuation Planning and Response 35
Until 2006, the primary emphasis of HSGP was on preparedness for terrorist incidents rather than other disasters and on procurement of equipment rather than planning (GAO 2006). Hurricane Katrina focused attention on the importance of emergency operations planning for catastrophic disasters due to natural as well as human causes, which was added as a national priority and an area of eligibility in the program. The Post-Katrina Emergency Management Reform Act of 2006 authorizes the use of Urban Area Security Initiative or other HSGP funds for states to develop catastrophic mass evacuation plans (DHS 2007a). The FY 2007 program guidance for HSGP, for example, includes as one of seven focus areas enhancing catastrophic planning to address the results of the 2006 Nationwide Plan Review. More specifically, grant funds are available for evacuation planning, citizen preparedness and planning requirements for special-needs populations, logistics and resource management, continuity of operations and government, and recovery planning (DHS 2007b). Grantees are also urged to consider what role transit systems, intercity bus service providers, port infrastructure, and passenger rail can play in these plans. Until DHS completes its grant tracking system, however, there is no way of knowing what share of funding has been directed to these activities (GAO 2006).
DHS has created a new Regional Catastrophic Preparedness Grant Program, funded at $69 million over 2 years (FY 2007 and 2008), to support regional all-hazards planning for catastrophic events. The objectives of the program are to establish regional catastrophic planning teams, identify and assess primary areas of concern, develop enhanced regional plans to address shortcomings and enable the coordination necessary to manage a catastrophic event, and link plans to resources. Grant applicants must focus on planning for seven scenarios that, in the judgment of DHS, represent the gravest dangers facing the United States. Five of the seven are focused on terrorism, the exceptions being pandemic influenza and a natural disaster such as a catastrophic earthquake or hurricane. Initial program funding is focused on the largest urban areas.13 Grant recipients must contribute 25 percent of the cost of their projects, either in cash or in kind, and set milestones, including starting and ending dates. Federal transportation funds are another source of federal assistance for improvements related to evacuation. Federal grant funds authorized under the Safe, Accountable, Flexible, Efficient Transportation Equity Act: A Legacy for Users (SAFETEA-LU) of 200514 may be used to fund highway capacity improvements, such as lane additions and major intersection improvements, to enhance evacuation capabilities for major urban areas. Intelligent transportation system (ITS) technologies, such as variable message signs, priority signal systems, portable cameras, traffic count detectors, and transportation management center enhancements, are also grant eligible. These technologies can help local responders guide evacuation operations in real time and receive rapid feedback on traffic conditions and problems. MPOs facilitate programming of these funds in urbanized areas. The Federal Transit Administration (FTA) is another potential source of funding and technical assistance, particularly for transit operators to enhance their role in supporting local emergency responders. The agency’s Five-Year Strategic Plan (FTA 2007) emphasizes the need 13 Tier I–eligible urban areas—New York City/Northern New Jersey, the National Capitol Region, Chicago, Houston, Los Angeles/Long Beach, and the Bay Area—will receive $4 million each in FY 2007 and $2 million each in FY 2008. In FY 2008, four Tier II urban areas—Boston, Seattle, Norfolk, and Honolulu—will each receive $2 million. Finally, $5 million will be made available on a competitive basis in FY 2007 to Tier I urban areas, and $6 million and $5 million in FY 2008 to Tier 1 urban areas and selected Tier II urban areas, respectively. 14 SAFETEA-LU and the 2006 Appropriations Act requested that USDOT conduct a companion assessment to the DHS Nationwide Plan Review to evaluate the evacuation plans of state and local governments in the Gulf Coast region (USDOT 2006).

36 Special Report 294: The Role of Transit in Emergency Evacuation
for an all-hazards, integrated approach to safety, security, and emergency management. A technical assistance initiative, Connecting Communities, is FTA’s latest effort to connect the “community” of transit systems with local, county, state, and federal emergency response agencies and resources.15 Structured as a series of invitation-only workshops conducted under the auspices of the National Transit Institute, Connecting Communities is focused on the role of transit and transportation systems more broadly as resources during an emergency incident, as well as on the safety and protection of transit assets from attack. Although not directly targeting security or emergency management, FTA’s main funding programs can be used for capital improvements (e.g., rail projects) and bus purchases that can provide transit providers in urbanized areas with additional capacity and equipment to assist in an emergency evacuation. Providing such support is a standard, nonwaivable condition of FTA vehicle grants. State and Local Funding and Nongovernmental Initiatives State and local governments may use funding for highways and ITS improvements to pay for projects that enhance local evacuation capability, as discussed above. To the extent these projects serve other purposes, such as safety and congestion relief, they are likely to be more successful in competing with other local project priorities for funding. States also may have specially earmarked funds for enhancing emergency preparedness and evacuation capabilities, although the extent of this practice is unknown. For example, Florida—one of the states visited for this study—collects $2 from homeowners’ insurance policies and $4 from business insurance policies annually, which is placed in an Emergency Management and Preparedness Assistance Trust Fund. These funds are competitively awarded to counties each year in the form of grants for emergency management. Texas—another one of the states visited for this study, has created a $15 million contingency fund that is earmarked for a state-declared disaster that does not involve the federal government. The state has financed the operational expenses of standby contracts with bus operators and towing companies during the hurricane season in recent years, and longer-term state highway construction projects designed to enhance the capacity of evacuation routes have been programmed. In the wake of Hurricane Katrina, the American Public Transportation Association (APTA)—a nonprofit organization for the transit industry that advocates for the advancement of public transportation programs and initiatives in the United States—established a task force to determine how the transit industry could be better prepared and more responsive in future emergency evacuations. The resulting Emergency Response and Preparedness Program (ERPP), supported in partnership with FTA, is structured as a voluntary mutual-aid initiative.16 In joining ERPP, transit agencies must designate a point of contact within the agency and provide an inventory of available resources (personnel and equipment by type), which are entered into a national database that is now accessible to members on the web. In the event of an emergency, a transit provider can access the database to determine the nearest available resources and the associated contact. APTA will keep the inventory current. The requesting transit provider is responsible for negotiating the costs of services, insurance coverage, and reimbursement arrangements. To date, more than 200 APTA members have joined the program. ERPP has initiated the development of a visual mapping system to display member locations. Its website
15 Connecting Communities, accessed at http://www.connectingcommunitites.net/index.html on July 31, 2007. 16 APTA, Emergency Response and Preparedness Program (ERPP), accessed on line at http://www.apta.com/services/emergency/security_preparedness.cfm on August 6, 2007.

Emergency and Evacuation Planning and Response 37
also provides links to related emergency preparedness sites, and in the future may expand its links to include emergency preparedness programs and databases of other agencies, such as state DOTs. CONCLUSION The terrorist attacks of September 11 and, more recently, Hurricanes Katrina and Rita have focused attention on disasters that may involve an evacuation. Federal law has long required local emergency planning officials to develop emergency plans that include an evacuation plan. However, detailed operational plans for the evacuation of major urban areas were not a priority, except perhaps in some hurricane-prone areas. Moreover, the role that transit could play, particularly in evacuating those without access to private vehicles and those who need assistance, has only recently been acknowledged. The next chapter summarizes what is known about the potential role of transit and the determinants of transit use in an emergency evacuation. REFERENCES Abbreviations
DHS U.S. Department of Homeland Security FEMA Federal Emergency Management Agency FTA Federal Transit Administration GAO U.S. Government Accountability Office ISDR International Strategy for Disaster Reduction USDOT U.S. Department of Transportation
DHS. 2004. National Incident Management System. http://www.dhs.gov/xlibrary/assets/NIMS-90-
web.pdf. DHS. 2006. Nationwide Plan Review, Phase 2 Report, Washington, D.C., June 16,
http://www.dhs.gov/xlibrary/assets/Prep_NationwidePlanReview.pdf. DHS. 2007a. National Response Framework, Mass Evacuation Incident Annex, Washington, D.C., July. DHS. 2007b. FY 2007 Homeland Security Grant Program, Program Guidance and Application Kit.
Office of Grants and Training. http://www.ojp.usdoj.gov/odp/grants_hsgp.htm. Accessed July 31, 2007.
DHS. 2008. National Response Framework. Washington, D.C., Jan. 22, http://www.fema.gov/pdf/emergency/nrf/nrf-core.pdf.
FEMA. 1996. State and Local Guide (SLG) 101: Guide for All-Hazard Emergency Operations Planning. http://www.fema.gov/pdf/plan/0-prelim.pdf.
FEMA. 2008. Producing Emergency Plans: Comprehensive Preparedness Guide (CPG) 101: A Guide for All-Hazard Emergency Operations Planning for State, Territorial, Local, and Tribal Governments, Washington, D.C.
FTA. 2007. Five-Year Strategic Plan. Office of Safety and Security, U.S. Department of Transportation, Washington, D.C.
GAO. 2006. Transportation-Disadvantaged Populations: Actions Needed to Clarify Responsibilities and Increase Preparedness for Evacuations. GAO-07-44. Washington, D.C., Dec., http://www.gao.gov/new.items/d0744.pdf.

38 Special Report 294: The Role of Transit in Emergency Evacuation
ISDR. 2007. Terminology: Basic Terms of Disaster Risk Reduction. http://www.unisdr.org/eng/library/lib-terminology-eng%20home.htm. Accessed Aug 12, 2007.
Rubin, C. B., I. Renda-Tanali, and W. R. Cumming. 2007. Disaster Time Line: Major Focusing Events and U.S. Outcomes (1978–2006). TR News, No. 250, May–June.
Sylves, R. T. 2007. Federal Emergency Management Comes of Age: 1979–2001. In Emergency Management: The American Experience 1900-2005, C.B. Rubin (ed.), Public Entity Risk Institute, Fairfax, VA, Chapter 5, pp. 111–159.
USDOT. 2006. Report to Congress on Catastrophic Hurricane Evacuation Plan Evaluation, in cooperation with the U.S. Department of Homeland Security. Washington, D.C., June 1, http://www.fhwa.dot.gov/reports/hurricanevacuation/.
Ward, R., and G. Wamsley. 2007. From a Painful Past to an Uncertain Future. In Emergency Management: The American Experience 1900–2005, C. B. Rubin (ed.), Public Entity Risk Institute, Fairfax, VA, Chapter 8, pp. 207–241.

39
3
The Role of Transit in Emergency Evacuation
s noted in Chapter 2, transit agencies have the potential to play a role in each phase of emergency planning—mitigation, preparedness, response, and recovery. The extent to
which this role can be fulfilled, particularly in an evacuation, depends on many factors, including the characteristics of the urban area in which a transit system operates, the characteristics of an emergency incident, the predisposition of the public, available resources, and the characteristics of the transit system itself. These factors are explored in this chapter. The results of a literature review conducted for this study are also discussed for the light they shed on the role of transit in emergency evacuation. The following chapter considers the role of transit in the 38 largest urbanized areas that are the primary focus of this study. FACTORS AFFECTING THE ROLE OF TRANSIT IN AN EMERGENCY The potential role of transit in an emergency evacuation is affected by both external and internal factors (see Box 3-1). These factors are discussed in detail below. Characteristics of the Urban Area Transit’s capacity to respond to an emergency is heavily shaped by the physical, socioeconomic, and political characteristics of the urban area in which it operates, many of which also affect the size and composition of transit’s ridership in general. For example, population size and density affect transit’s capacity to respond in an emergency and the speed of that response. Large and densely populated urbanized areas tend to have large regional transit systems with good service coverage that regularly move large numbers of passengers, particularly at peak periods. In a large urbanized area, however, the potential volume of passengers to be moved in a major emergency could well exceed peak-period volumes, taxing the capacity of local transit systems. High population density compounds the problem because transit agencies must manage large numbers of evacuees who congregate at transit stations, bus stops, or other preestablished assembly points for transport out of the affected area. On the other hand, in urban areas where transit service and ridership are limited, the use of transit in an emergency evacuation is also likely to be limited and focused on those populations served by the system (e.g., lower-income groups, immigrants). The spatial concentration of transit-dependent populations in an urban area is also a factor. Regular transit service may not provide adequate service for these populations in an emergency, so that more drivers and equipment must be shifted to these locations for an evacuation.
A
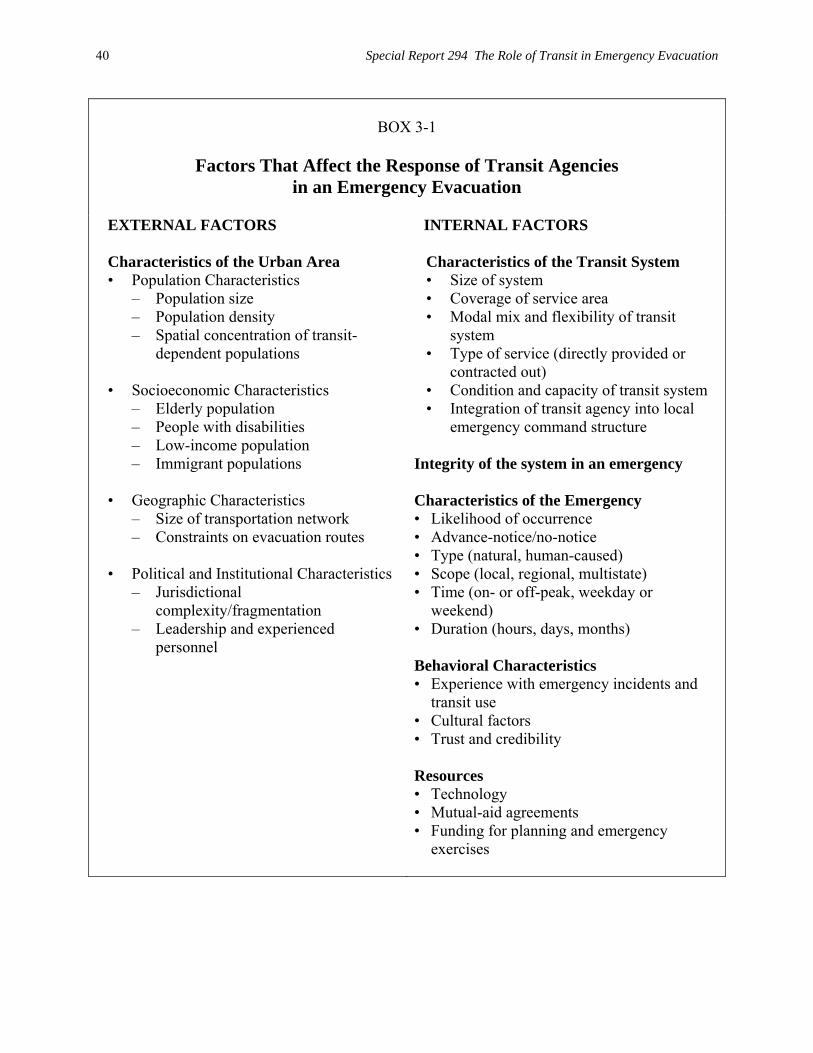
40 Special Report 294 The Role of Transit in Emergency Evacuation
BOX 3-1
Factors That Affect the Response of Transit Agencies
in an Emergency Evacuation
EXTERNAL FACTORS
Characteristics of the Urban Area • Population Characteristics
– Population size – Population density – Spatial concentration of transit- dependent populations
• Socioeconomic Characteristics
– Elderly population – People with disabilities – Low-income population – Immigrant populations
• Geographic Characteristics
– Size of transportation network – Constraints on evacuation routes
• Political and Institutional Characteristics
– Jurisdictional complexity/fragmentation
– Leadership and experienced personnel
INTERNAL FACTORS Characteristics of the Transit System • Size of system • Coverage of service area • Modal mix and flexibility of transit
system • Type of service (directly provided or
contracted out) • Condition and capacity of transit system • Integration of transit agency into local
emergency command structure Integrity of the system in an emergency Characteristics of the Emergency • Likelihood of occurrence • Advance-notice/no-notice • Type (natural, human-caused) • Scope (local, regional, multistate) • Time (on- or off-peak, weekday or
weekend) • Duration (hours, days, months) Behavioral Characteristics • Experience with emergency incidents and
transit use • Cultural factors • Trust and credibility Resources • Technology • Mutual-aid agreements • Funding for planning and emergency
exercises

The Role of Transit in Emergency Evacuation 41
Transit has a unique role to play in the evacuation of transit-dependent and vulnerable populations—frequently termed special-needs populations—who may lack access to a private vehicle and may also need assistance in evacuating. Vulnerable populations include those with disabilities, the elderly, the medically homebound, and poor or immigrant populations who are dependent on transit for transport. The way special-needs populations are defined varies among urban areas: some definitions are limited to those who need medical attention (but not hospitalization) in an emergency, while others include anyone who may lack access to a private vehicle (e.g., transit commuters, tourists) or who chooses not to use such a vehicle during an emergency. These differences in how urban areas characterize special-needs populations can either limit or expand the potential role of transit in meeting the needs of these populations in an emergency evacuation. Moreover, matching transit services with those needs is a major challenge because the different populations to be served vary greatly in both the type of transport and the assistance they require in an emergency evacuation (e.g., those who are ambulatory and can access fixed-route transit versus many elderly people and those with disabilities who require specially trained operators and accessible equipment). Transit agencies are likely to be hard pressed to accommodate those who need special assistance because these services are often contracted out to smaller paratransit operators or demand-responsive service providers. In an emergency evacuation, these specialized providers often face competing demands for their services1 and have limited drivers and equipment that may not be available to provide the necessary emergency service. In addition, many special-needs groups (e.g., the elderly, those with disabilities) are spatially disbursed and thus difficult to reach quickly and efficiently in an emergency evacuation. The geography of an urban area affects the configuration of the transportation network (e.g., highway and transit rail systems) and the capacity to evacuate both by private vehicle and by transit. Large urban areas with high-capacity transportation systems and lower population densities (e.g., Houston) generally have the best prospects for successful evacuation. Even in these areas, however, capacity bottlenecks (e.g., at critical interchanges) and more limited highway and transit capacity in suburban and exurban areas—important considerations in a regional evacuation—can reduce evacuation capacity, as was demonstrated by the evacuation prior to Hurricane Rita.
Geographical barriers pose another challenge. Urban areas bounded by water, for example, may have limited egress routes that can become heavily congested in an evacuation unless provision has been made for managing traffic and for expediting bus travel, particularly if round trips are planned for buses. During the regional evacuation experienced in advance of Hurricane Rita, evacuees from low-lying coastal areas in Galveston and Houston that are vulnerable to flooding and storm surge were ordered to evacuate first, but many had to travel through the heavily populated Houston urban area, which was also starting to evacuate; the result was massive congestion on area freeways. A similar situation exists in many coastal counties in Florida that must evacuate through neighboring inland counties. To reduce demand in these areas, emergency managers are encouraging sheltering in place when it is safe to do so. Finally, political and institutional factors influence the potential role of transit in an emergency evacuation, particularly one that is large-scale. The jurisdictional complexity of many urban areas—the large numbers of counties and municipalities (e.g., in Los Angeles) and even multiple states (e.g., in the New York urban area) that must be involved in a regional plan 1 In some urban areas, these specialized providers also serve and may be involved in the evacuation of assisted living facilities and nursing homes.
42 Special Report 294 The Role of Transit in Emergency Evacuation
and response to a major emergency—can make evacuation planning cumbersome and emergency decision making and operations complex. Moreover, leadership is often lacking at the regional level because there is no obvious champion for a multijurisdictional or multistate plan. Having seasoned leaders with institutional memory of prior emergencies and response strategies is also critical, but retirements often result in a short supply of such leadership. In this environment, it is understandable that transit is not a full partner in emergency evacuation planning, particularly if numerous transit agencies must be coordinated.2 Characteristics of the Emergency The nature of an emergency affects the response of transit. An important factor is whether there is no notice or some advance notice of the incident. Emergency incidents that occur infrequently and without notice, such as the September 11 attacks, often require on-the-spot decisions and the flexibility to shift personnel and equipment. They also require real-time communications capability and redundant systems. In New York, for example, transit operators were able to move trains and passengers at the incident site quickly out of harm’s way, but parts of the system were then closed until security could be ensured. When a major emergency control center was lost in the collapse of the World Trade Center towers, transit operators were still able to communicate from mobile units.
Transit operators have more time to mobilize and have had more experience with providing service in advance-notice emergencies, such as hurricanes, that recur with some frequency. Even for this type of emergency, however, large uncertainties remain. Evacuation decisions must often be made well before it is known exactly when a hurricane will make landfall and what its path will be, and the numbers of evacuees may vary dramatically depending on the potential size and severity of the storm.
The specific type of emergency also affects transit’s response. Transit operators would likely have a far more difficult time handling a nuclear or even a major biological or chemical incident than a storm, for example. In the former incidents, bus drivers might be more reluctant to work. If buses were needed to help evacuate the affected area, identifying and handling those who had been exposed to nuclear fallout or a biological or chemical agent would require special coordination with experts in hazardous materials, as well as training and expertise that few transit operating personnel are likely to possess. In the case of storms and flooding, such concerns do not arise, but equipment can be an issue; for example, flooding can disable buses and make routes impassable.
The magnitude, time, and duration of an incident are also critical factors affecting transit’s response. Localized emergencies, such as a hazardous materials incident that affects a portion of the central business district, require less shifting of personnel and equipment to continue transit service compared with an incident that affects a larger area, which requires more service alterations and perhaps coordination among several transit operators to provide adequate service and assist in any needed evacuation.3 The time and duration of the incident matter as well. Many transit agencies interviewed for the committee’s case studies noted that responding to an incident is more difficult at off-peak periods or on weekend days when drivers and
2 New York is an obvious exception because it has the nation’s largest transit network and largest ridership, and thus transit is a major mode of transportation in any evacuation. 3 The September 11 attacks in lower Manhattan are an obvious exception, as are earthquakes and any other incident that could compromise part or all of the transit system itself.
The Role of Transit in Emergency Evacuation 43
equipment are less available, creating a lag in response time until they can be mobilized to assist in an evacuation. Nevertheless, many urban areas experience heavy congestion for several hours during the work-week morning and evening peak periods under normal conditions. In the event of a disaster, particularly one with no notice, these areas would be hard pressed to handle the surge demands of an evacuation quickly and efficiently. The duration of the event is important because shift arrangements, work restrictions, and part-time operators can affect the availability of drivers, and refueling and maintenance of transit vehicles can become issues in a incident requiring a lengthy evacuation. Behavioral Characteristics Predispositions of the public as well as their prior experience with emergencies can affect both their willingness to evacuate and their use of transit for the purpose. In hurricane-prone areas, residents in areas vulnerable to storm surge have had considerable experience with evacuation, in some cases by transit, which should make it easier to manage future incidents. Nevertheless, emergency managers interviewed during the committee’s Tampa site visit (see the next chapter) indicated that, despite numerous communication initiatives, only about half of area residents knew their evacuation zone. The greatest concern was apathy among vulnerable residents and the likelihood of a surge in demand for transport by transit at the last moment in the event of an emergency evacuation. In many large urban areas, such as Manhattan in New York City and Chicago, where transit is a major mode of daily transport, transit riders are likely to be knowledgeable about how to access the system in the event of an emergency and how to negotiate the crowds that are part of daily congestion. Cultural factors are also likely to play a role in the use of transit in an evacuation. As noted earlier, many immigrant communities in large urban areas are heavy users of transit, particularly when they first come to the United States (see Appendix B), so they would be likely transit users in an emergency evacuation. However, emergency managers and transit operators need to provide information about the evacuation process in appropriate languages if they are to reach these populations successfully. Finally, trust and credibility are critical in convincing people to evacuate, whether by transit or other means, as was vividly demonstrated by the unwillingness of many vulnerable residents of New Orleans to evacuate before and in the aftermath of Hurricane Katrina and the levee failure. Appropriate communication strategies, using local churches and social service agencies that are known and trusted by these groups, are essential. Resources The extent of available resources, both in advance of and during an emergency evacuation, can affect the successful use of transit. Resources are broadly defined here to include technology and organizational arrangements, as well as funding. For example, technology can be helpful n managing an emergency evacuation. Many urban areas have transportation management centers that monitor traffic and crashes on area roads. These centers could be linked to emergency operations centers during an evacuation to help provide real-time information on the movements of both passenger vehicles and buses and identify chokepoints. Many of these systems, however, have a limited reach and do not extend into the far suburbs or exurban areas that could be involved in a regional evacuation.
44 Special Report 294 The Role of Transit in Emergency Evacuation
Some transit agencies have attempted to stretch limited resources by establishing mutual-aid agreements with transit providers in neighboring jurisdictions, who would help meet surge demands in an emergency evacuation. METRO, Houston’s transit agency, has such an agreement with neighboring Galveston. In the event of a hurricane, METRO will help evacuate transit-dependent residents of Galveston who are located in vulnerable storm surge zones. However, issues such as indemnification and cost reimbursement need to be resolved in advance if these agreements are to be workable during an emergency. Also critical for developing workable plans and protocols for emergency evacuations are resources for emergency planning, particularly to bring together groups that normally do not work together, as is the case for many transit agencies and emergency planners. Funding of and participation in frequent exercises and drills by transit and other agencies should also help identify planning shortfalls. Characteristics of the Transit System The characteristics of a transit system affect its capacity to respond to an emergency and participate in an evacuation.4 In urban areas with large transit systems and service areas, transit is likely to play an important transport role in an evacuation. However, responding appropriately to an emergency incident and meeting surge requirements requires more than size. The modal mix and flexibility of a transit system will also affect how quickly and effectively it can respond in an emergency evacuation. For example, those urban areas that have extensive and redundant rail networks with good system connectivity have an important asset in an emergency evacuation because large numbers of riders can be moved quickly away from an emergency site. Buses also have an important role in moving rail riders directly from transit stations to emergency shelters or other final destinations. Moreover, buses can provide a more flexible way of accessing transit riders who may not live near a rail station or may need assistance in an evacuation.
The type of transit service—whether publicly owned and operated or contracted out—can also affect the extent to which transit drivers and equipment will be available in an emergency. In many urban areas, for example, paratransit service is contracted out, and control over drivers and equipment can be an issue during an emergency. Special arrangements must be made in advance in contract agreements to help ensure continuity of service during an emergency evacuation.
The condition and capacity of transit systems are important factors as well. If transit equipment is frequently out of service or there are numerous service outages, it is questionable whether transit will be able to provide rapid response and reliable service during an emergency evacuation, particularly in a no-notice incident. Redundancy of infrastructure and measures to supplement capacity with other public and private transportation modes (e.g., school buses, ferries, taxies, shuttle and van fleets) can also help transit providers meet surge requirements. For example, redundant subway tunnels between Manhattan and Brooklyn enabled New York City Transit to restore service quickly as trains were rerouted from the World Trade Center after the collapse of the towers.
Transit agencies must also be well integrated into the local emergency command structure so they can provide critical support in concert with other first responders and
4 Portions of the discussion in this section were drawn from a presentation by Michael Setzer (Setzer 2007) at the National Conference on Disaster Planning for the Carless Society on February 8–9, 2007, at the University of New Orleans.

The Role of Transit in Emergency Evacuation 45
transportation officials. Transit representatives at emergency operations centers should have full authority to make decisions on behalf of the transit agency. Previous experience in dealing with emergencies, including evacuation, is an advantage.
Finally, the capacity of transit to assist in an emergency evacuation depends on the integrity of the system itself during the incident, as well as the safety of employees and equipment. Problems in any of these areas may require curtailing service. Summary This section has described a number of factors that can affect the role of transit in an emergency evacuation. The relative importance of these factors depends on the local context, as well as on their interaction at the time of an incident, which is difficult to predict because emergencies are dynamic events. Nevertheless, some of these factors can be anticipated and addressed in emergency response and operations plans, and there is ample opportunity to build on past experience. RESULTS OF THE COMMITTEE’S LITERATURE REVIEW The above discussion raises many hypothetical issues that can determine transit’s response and performance in an emergency evacuation. As discussed in Chapter 1, one of the committee’s three main tasks for this study was to conduct a literature review to learn what is known about transit’s actual role in emergency evacuations. Although the committee cast a wide net in this review—examining emergencies ranging from advance-notice events such as hurricanes, to planned special events such as the Olympics or large Fourth of July celebrations, to no-notice events such as earthquakes and terrorist strikes—the number of studies specifically focused on the role of transit in emergency evacuation was limited. Table 3-1 lists the major studies that were reviewed.5 Appendix B provides a detailed discussion of the results of the literature review, which are briefly summarized here. Status of Evacuation Planning As noted earlier, two major national studies (DHS 2006; USDOT 2006) were conducted following Hurricane Katrina to examine the status of emergency response and evacuation plans in the face of a catastrophic event. These reports help set the stage for examining the more specific role of transit in emergency evacuation. The U.S. Department of Homeland Security (DHS), which conducted an in-depth assessment of the emergency evacuation plans of 56 states and territories and the 75 largest urban areas, found that the majority (85 percent) of emergency operations plans were not “fully adequate, feasible, or acceptable to manage catastrophic events” (DHS 2006, ix). Significant weaknesses in mass evacuation planning were specifically noted as an “area of profound concern” (DHS 2006, ix), with only a small fraction of plans (12 percent of state and 8 percent of urban area plans) estimating the time required to evacuate people located
5 Numerous smaller studies and articles were also reviewed.
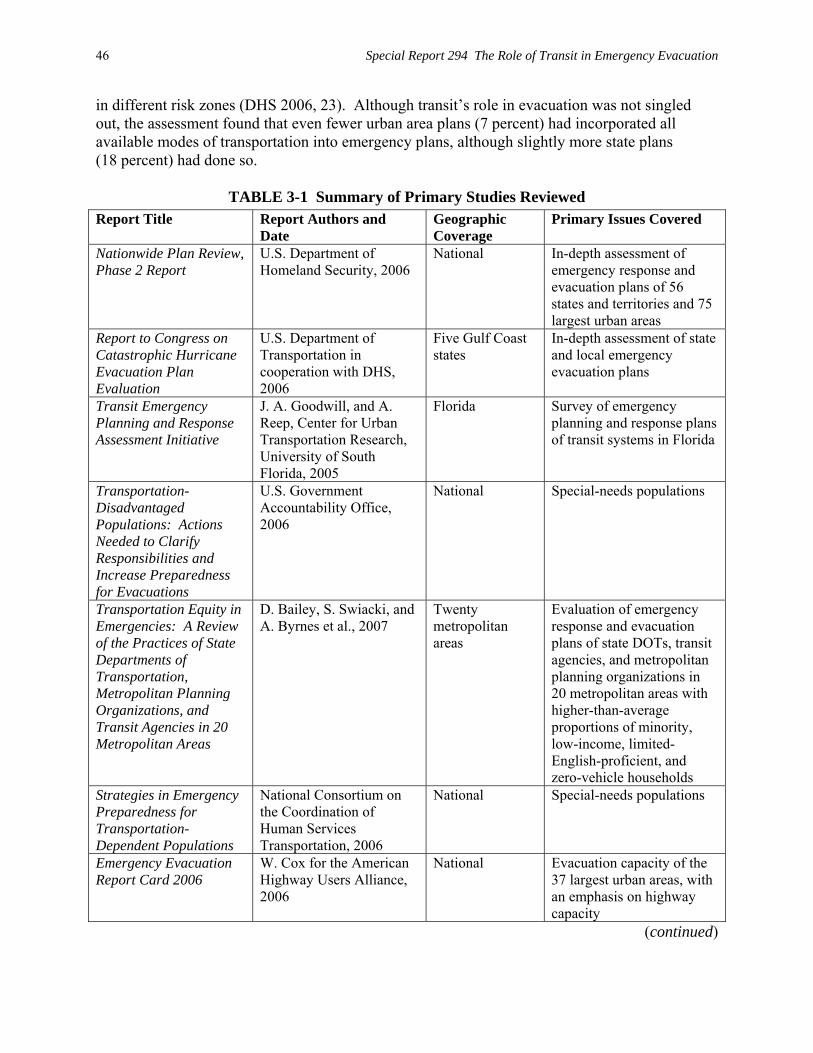
46 Special Report 294 The Role of Transit in Emergency Evacuation
in different risk zones (DHS 2006, 23). Although transit’s role in evacuation was not singled out, the assessment found that even fewer urban area plans (7 percent) had incorporated all available modes of transportation into emergency plans, although slightly more state plans (18 percent) had done so.
TABLE 3-1 Summary of Primary Studies Reviewed Report Title
Report Authors and Date
Geographic Coverage
Primary Issues Covered
Nationwide Plan Review, Phase 2 Report
U.S. Department of Homeland Security, 2006
National In-depth assessment of emergency response and evacuation plans of 56 states and territories and 75 largest urban areas
Report to Congress on Catastrophic Hurricane Evacuation Plan Evaluation
U.S. Department of Transportation in cooperation with DHS, 2006
Five Gulf Coast states
In-depth assessment of state and local emergency evacuation plans
Transit Emergency Planning and Response Assessment Initiative
J. A. Goodwill, and A. Reep, Center for Urban Transportation Research, University of South Florida, 2005
Florida Survey of emergency planning and response plans of transit systems in Florida
Transportation-Disadvantaged Populations: Actions Needed to Clarify Responsibilities and Increase Preparedness for Evacuations
U.S. Government Accountability Office, 2006
National Special-needs populations
Transportation Equity in Emergencies: A Review of the Practices of State Departments of Transportation, Metropolitan Planning Organizations, and Transit Agencies in 20 Metropolitan Areas
D. Bailey, S. Swiacki, and A. Byrnes et al., 2007
Twenty metropolitan areas
Evaluation of emergency response and evacuation plans of state DOTs, transit agencies, and metropolitan planning organizations in 20 metropolitan areas with higher-than-average proportions of minority, low-income, limited-English-proficient, and zero-vehicle households
Strategies in Emergency Preparedness for Transportation-Dependent Populations
National Consortium on the Coordination of Human Services Transportation, 2006
National Special-needs populations
Emergency Evacuation Report Card 2006
W. Cox for the American Highway Users Alliance, 2006
National Evacuation capacity of the 37 largest urban areas, with an emphasis on highway capacity
(continued)
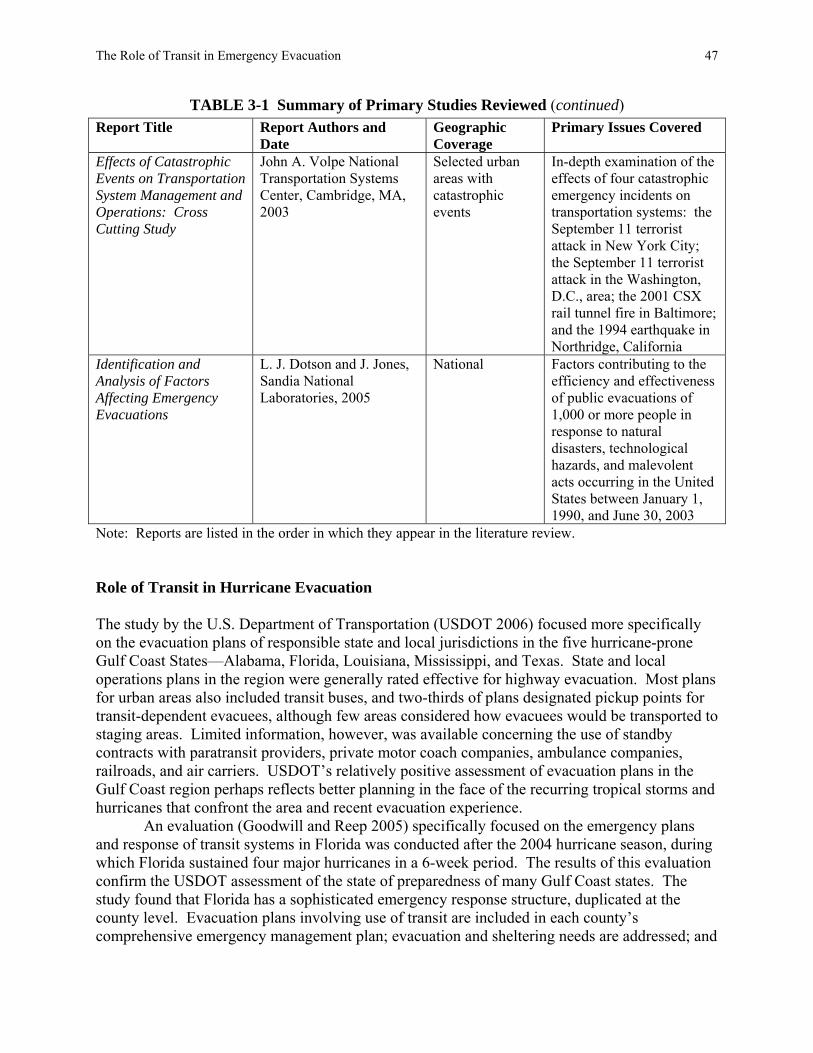
The Role of Transit in Emergency Evacuation 47
TABLE 3-1 Summary of Primary Studies Reviewed (continued) Report Title
Report Authors and Date
Geographic Coverage
Primary Issues Covered
Effects of Catastrophic Events on Transportation System Management and Operations: Cross Cutting Study
John A. Volpe National Transportation Systems Center, Cambridge, MA, 2003
Selected urban areas with catastrophic events
In-depth examination of the effects of four catastrophic emergency incidents on transportation systems: the September 11 terrorist attack in New York City; the September 11 terrorist attack in the Washington, D.C., area; the 2001 CSX rail tunnel fire in Baltimore; and the 1994 earthquake in Northridge, California
Identification and Analysis of Factors Affecting Emergency Evacuations
L. J. Dotson and J. Jones, Sandia National Laboratories, 2005
National Factors contributing to the efficiency and effectiveness of public evacuations of 1,000 or more people in response to natural disasters, technological hazards, and malevolent acts occurring in the United States between January 1, 1990, and June 30, 2003
Note: Reports are listed in the order in which they appear in the literature review. Role of Transit in Hurricane Evacuation The study by the U.S. Department of Transportation (USDOT 2006) focused more specifically on the evacuation plans of responsible state and local jurisdictions in the five hurricane-prone Gulf Coast States—Alabama, Florida, Louisiana, Mississippi, and Texas. State and local operations plans in the region were generally rated effective for highway evacuation. Most plans for urban areas also included transit buses, and two-thirds of plans designated pickup points for transit-dependent evacuees, although few areas considered how evacuees would be transported to staging areas. Limited information, however, was available concerning the use of standby contracts with paratransit providers, private motor coach companies, ambulance companies, railroads, and air carriers. USDOT’s relatively positive assessment of evacuation plans in the Gulf Coast region perhaps reflects better planning in the face of the recurring tropical storms and hurricanes that confront the area and recent evacuation experience. An evaluation (Goodwill and Reep 2005) specifically focused on the emergency plans and response of transit systems in Florida was conducted after the 2004 hurricane season, during which Florida sustained four major hurricanes in a 6-week period. The results of this evaluation confirm the USDOT assessment of the state of preparedness of many Gulf Coast states. The study found that Florida has a sophisticated emergency response structure, duplicated at the county level. Evacuation plans involving use of transit are included in each county’s comprehensive emergency management plan; evacuation and sheltering needs are addressed; and

48 Special Report 294 The Role of Transit in Emergency Evacuation
public bus systems and school bus fleets are well coordinated for the provision of transportation assistance because most school buses are operated by county school boards. Nevertheless, several areas for improvement were recommended:
• communicating expectations for staff and specifying their responsibilities during an emergency, providing staff training, and conducting mock drills;
• protecting bus fleets, fueling in advance, and stocking emergency electrical generators and backup communications devices;
• establishing and publicizing evacuation routes and bus assignments; • preplanning for the transport of those with special needs, building on paratransit
system expertise; and • developing procedures for evacuating homeless and transient populations and
coordinating with evacuation shelters. Role of Transit in No-Notice Emergencies The role of transit in no-notice emergencies is more varied than is the case in advance-notice incidents such as hurricanes, for which evacuation routes and destination points are often predesignated. With no advance notice of where or when an incident may occur, transit agencies must rely on advance planning, a well-established chain of command, and real-time communications capability because they often must begin to implement evacuation plans and institute recovery procedures almost immediately after the event. Even if plans are not fully formulated, most transit agencies have experience with service outages and rerouting of equipment as part of daily operations. Moreover, many no-notice events necessitate innovative and ad hoc responses to meet emergency needs. USDOT’s John A. Volpe National Transportation Systems Center (NTSC 2003) illustrated many of these points in its case studies of the events of September 11 in New York City and Washington, D.C., and of the CSX derailment and fire in a Baltimore tunnel in the heart of the city’s business and tourist districts. As discussed earlier, transit played an immediate and important role following the September 11 terrorist attacks, evacuating passengers in the affected areas, assisting in the larger evacuation, and bringing emergency responders to the incident site. For example, New York City Transit (NYCT) and the Port Authority of New York and New Jersey–run PATH trains began emergency procedures within minutes of the first strike on the World Trade Center to evacuate those in affected subway stations, and PATH ran express trains from Manhattan back to New Jersey. New Jersey Transit provided for evacuation on its trains from New York City’s Pennsylvania Station and on buses staged in New Jersey. It also supported emergency response units with employees, buses, and equipment on stripped-down railcars, which were rushed to the World Trade Center site. Likewise, NYCT made available a fleet of buses and personnel to help shuttle emergency responders to and from the site (American Public Transportation Association 2001). Finally, an ad hoc flotilla of water ferries and private boats, loosely organized by the Coast Guard, helped evacuate approximately 300,000 persons from lower Manhattan to New Jersey (Kendra et al. 2003). Transit, however, was not available

The Role of Transit in Emergency Evacuation 49
to handle the surge of commuters who were released from work several hours after the attack; both subway and commuter rail systems had shut down.6
In Washington, the regional transit system, the Washington Metropolitan Area Transit Authority (WMATA), continued operations (although there were some closures near the Pentagon, which had been hit in the terrorist strike), helping to evacuate many commuters from the city. WMATA also provided buses to help transport the injured and assist the D.C. Metropolitan Police in moving personnel to various locations around the District. During the Baltimore CSX rail tunnel fire, which occurred just before the evening rush hour and a baseball doubleheader at the nearby Camden Yards Stadium, the Maryland Transit Administration set up a “bus bridge” to supplement service, bringing commuter rail passengers into the city and to the game. Despite the disruption, the city was cleared of traffic within 2 hours of the end of the normal rush hour (NTSC 2003). During this event, the primary role of transit was to help alleviate service disruptions. Transit can also play a role in the response to earthquakes, but the extent of that role depends on the severity of the quake, its location, and whether the transit system itself is compromised. For example, during the 1989 Loma Prieta earthquake, which struck the San Francisco Bay Area at 5:04 PM local time, the Bay Area Rapid Transit (BART) system did not play a major role in moving passengers immediately after the event. Although inspection of BART’s underwater trans-bay tube showed no damage, many commuters were reluctant to use the system to cross the bay because of concern about being trapped in the tunnel during an aftershock. Emergency ferry service provided by Crowly Maritime, a private provider, less than 3 hours after the earthquake evacuated those stranded on the wrong side of the bay (Hansen and Weinstein 1991). BART did become the primary passenger transportation link between San Francisco and East Bay communities the Monday following the earthquake, when commuters were expected to return to work (Dames and Moore Engineering Earthquake Group 1999). Transit ridership grew by approximately 40 percent during the first full business week after the event.
Emergency evacuation plans are perhaps most advanced in communities with nuclear power facilities. Following the nuclear accident at Three Mile Island in 1979, the Nuclear Regulatory Commission and the Federal Emergency Management Agency (FEMA) required jurisdictions with nuclear power facilities, as well as neighboring jurisdictions, to establish and practice procedures for evacuation and sheltering in place and identify vulnerable populations, including persons with disabilities. Many areas have also conducted evacuation time studies. It is not surprising, then, that the majority of areas that received high marks for evacuation in the 2006 DHS review were jurisdictions with fixed nuclear facilities. Nevertheless, the role of transit should an evacuation be necessary is not ensured. The availability of buses and, more important, drivers, to transport those without access to a private vehicle in the event of a radiological release continues to be a concern. Role of Transit in Evacuating Special-Needs Populations The committee found several studies that focused on emergency preparedness and evacuation plans for special-needs populations (Bailey et al. 2007; GAO 2006; National Consortium on the
6 Approximately 4 hours after the attack, partial NYCT subway service was resumed; redundant subway tunnels helped restore service between Manhattan and Brooklyn later in the day as trains were rerouted from the World Trade Center area.

50 Special Report 294 The Role of Transit in Emergency Evacuation
Coordination of Human Services Transportation 2006)—characterized by the DHS 2006 study as “the most persistent shortcoming across all the operational parts of state and urban area plans” (DHS 2006, 15). Because many of these populations are potential users of transit in an emergency evacuation, the findings of these studies are of particular interest. The U.S. Government Accountability Office (GAO) conducted a national study devoted entirely to the issue of preparedness for the evacuation of special-needs populations, which it termed “transportation-disadvantaged populations” (GAO 2006). The definition of the term was broad, including not only vulnerable populations without access to private vehicles but also tourists and commuters who might be without a vehicle at the time of an emergency incident. Similar to the DHS and USDOT studies, the GAO study found that state and local governments are generally not well prepared with respect to planning, training, and conducting exercises for the evacuation of transportation-disadvantaged populations.
Another study, conducted for the Federal Transit Administration (FTA) (Office of Civil Rights), examined the emergency response and evacuation plans of state department of transportations (DOTs), transit agencies, and metropolitan planning organizations in 20 metropolitan areas with higher-than-average proportions of minority, low-income, limited-English-proficient, and zero-vehicle households (Bailey et al. 2007). Although most of the neighborhoods inhabited by these populations are well served by transit, few of the agencies surveyed in the study had taken steps to include transportation-disadvantaged populations in emergency plans. None had identified the mobility needs of these populations or had plans in place for coordinating with other agencies for their transport both before and during an emergency. Few had developed evacuation plans and communication strategies targeting the transportation-disadvantaged.
The transportation needs of those with disabilities pose a special challenge in an emergency evacuation. The 2006 DHS study found that most state and urban area plans failed to address those needs. Some jurisdictions were developing voluntary special registries so that individuals could preidentify themselves as needing evacuation assistance, but keeping these registries up to date is costly and difficult, particularly in large urban areas. The timely availability of lift-equipped vehicles to evacuate those with disabilities was found to be another critical but frequently overlooked issue. The 2006 USDOT study reinforced the finding of the DHS study that plans for evacuating disabled persons who are living independently are not well developed. Identifying the location of these individuals, handling the logistics of their evacuation, and addressing their special sheltering needs were all noted as major challenges.
In 2004, Executive Order 13347, Individuals with Disabilities in Emergency Preparedness, was signed by the President to help ensure that the federal government would support and strengthen measures in emergency preparedness plans designed to enhance the safety and security of those with disabilities. The executive order created the Interagency Coordinating Council on Emergency Preparedness and Individuals with Disabilities, chaired by DHS through its Office of Civil Rights and Civil Liberties, to help with the order’s implementation. Federal law7 now requires state and local governments with mass evacuation plans to incorporate all special-needs populations into those plans, and FEMA must provide guidance for including persons with disabilities and other special-needs populations in all aspects of emergency management activities, including evacuation, housing, sheltering, transportation, and communications.
7 Public Law 109-295, the Department of Homeland Security Appropriations Act of 2007.

The Role of Transit in Emergency Evacuation 51
Considerable challenges remain, however, particularly at the local level, for jurisdictions seeking to make these requirements operational. The studies examined for the committee’s literature review proposed numerous measures to help serve special-needs populations in an emergency evacuation, which are well summarized in a 2006 strategy paper issued by the National Consortium on the Coordination of Human Services Transportation.8 These measures can be grouped under several broad categories:
• Identification and location of special-needs populations―development of
demographic profiles using computerized mapping and census data; development of voluntary registries of those requiring transportation assistance in an emergency; engagement of community- and faith-based groups, as well as health and human service agencies that serve special-needs populations, to help identify assistance needs.
• Advance planning―involvement of organizations knowledgeable about special-needs populations in the development of emergency plans and evacuation strategies; development of checklists for human service agencies and community groups to follow in an emergency that feed into area emergency evacuation plans; preestablishment of emergency transit evacuation routes; provision of information about assembly points and emergency transit stop locations along evacuation routes, and of shelters that can accommodate special-needs populations (e.g., those needing medical assistance, the homeless).
• Communication―development of strategies for communicating emergency evacuation plans to special-needs populations in accessible formats, both directly and through outreach to community-based organizations; provision for communications with special-needs populations during an emergency and among human service agencies and community groups that can provide assistance. Another review (Phillips and Morrow 2007) suggests that research on warning messages targeting vulnerable special-needs populations is inadequate to provide reliable guidance on how to reach these high-risk groups, and hence warrants special attention.
• Transportation assistance―matching of the potential evacuation needs of these populations with available transit resources; provision for family assistance programs, signups for emergency duty to ensure adequate numbers of drivers, driver training, additional professionals to provide medical assistance, and measures for handling service animals and pets; provision for adequate numbers of accessible vehicles, appropriate lift equipment, fuel availability, liability coverage and reimbursement for services, including mutual-aid agreements with other jurisdictions and standby contracts with private providers (e.g., charter bus companies) to help meet surge requirements.
8 This publication is focused on the role that public and community transportation services can play in transporting individuals who may require assistance during an emergency—a narrower focus than the GAO or FTA study. However, the study’s suggestions for improvement, which reflect a day-long panel discussion among public and private transportation providers, community organizations, government agencies, and national organizations on transportation and emergency preparedness, are applicable for most special-needs groups that require transportation in an evacuation.
52 Special Report 294 The Role of Transit in Emergency Evacuation
Other Issues Affecting the Role of Transit in Emergency Evacuation Highway Capacity The capacity of urban area transportation systems is a critical issue in emergency evacuation, and also affects transit agencies because buses share the roads with private vehicles. A 2006 study conducted for the American Highway Users Alliance (Cox 2006) attempted to assess the evacuation capacity of the 37 largest urban areas, essentially the same group of urban areas that are the focus of this study. Assuming that an entire urban area would be evacuated and that highways and private vehicles would be the principal means of evacuation, the researchers developed an Evacuation Capacity Index and a letter grade from A to F to rank urban areas. Only four urban areas received a grade of A or B.9 The majority received the lowest grade, leading to the conclusion that there is considerable room for improving the evacuation capacity of the nation’s largest urban areas.
Although the study was focused on highways and evacuation by private vehicle, the issue of evacuation by transit was addressed and acknowledged to be far more complex. Buses were deemed to be most useful for evacuating those without cars, primarily because of their flexibility: they can bring passengers directly to evacuation centers and return to make additional trips, or can operate in a feeder capacity to bring rail passengers from stations to reception centers or shelters (Cox 2006). If buses are to be used successfully in an emergency evacuation, however, numerous improvements are needed. First and foremost, exclusive bus routes must be established so that buses can avoid the worst traffic congestion and make return trips. The researchers suggested that making lower-capacity exit routes, such as two-lane arterials where available, into exclusive bus routes would be preferable to enforcing exclusive bus lanes on overcrowded major highways being used by cars. Other recommended improvements included standby or expedited contracts among transit providers in advance of an emergency so that operators would know what was required of them and drivers would be available and assured of payment, and communications systems that would be operative so that drivers and equipment could be deployed effectively during an evacuation. Transit Agency Participation in Special Events and Emergency Evacuation Exercises Many large urban areas hold special events—major sports events, New Years Eve and Fourth of July celebrations, and the like—that can provide a good indication of the surge capacity of transit systems and highway capacity under nonemergency conditions. In addition, effective delivery of transportation services to accommodate ingress to and egress from the location of an event often requires cooperation among agencies that usually do not work together and innovative operating practices, both of which can be useful in an emergency evacuation. In recent years, for example, the District of Columbia has used the annual Fourth of July celebration to conduct a real-time test of different aspects of its emergency evacuation plan. During that event, it hosts approximately 400,000 residents and tourists who come to view the fireworks on the National Mall. WMATA adds rail equipment, shortens headways, extends normal hours of service, manages stations to avoid overcrowding, and controls fareboxes and turnstiles to lessen
9 Higher scores were associated with lower population densities, higher-capacity road systems, and the lack of significant geographic barriers blocking exit directions (Cox 2006). See Appendix B for more detail on the Evacuation Capacity Index.
The Role of Transit in Emergency Evacuation 53
passenger bottlenecks and accommodate those who wish to use transit. In 2005, the District DOT tested changes in signal timing on certain routes and police control at intersections critical for traffic flow and prepared an after-action report (DDOT 2005); WMATA also participated.
In 2006 the Office of Emergency Management and Communications of the City of Chicago conducted a first-of-its-kind emergency exercise involving evacuation of four commercial high-rise buildings in the commercial business district at the peak of rush hour traffic in which more than 4,000 individuals participated, and prepared an after-action report (Office of Emergency Management and Communications of the City of Chicago 2007). The purpose was to test emergency notification and communication systems; evacuate building occupants to assembly and transportation centers; test these centers’ intake, registration, and triage operations; and increase public awareness of and education about emergency preparedness. The Chicago Transit Authority, the second-largest transit system in the United States, was part of the exercise and staged buses at the centers, although no one was actually evacuated.
Many other urban areas conduct tabletop exercises and drills each year that test one or more aspects of emergency response and evacuation plans. Transit is involved in some of these activities (e.g., annual hurricane exercises in many Gulf Coast states, bistate exercises to test the evacuation of New Jersey commuters across the Hudson River in the event of an emergency in Manhattan). SUMMARY AND FINDINGS This chapter has provided a broad overview of the factors likely to affect the role of transit in an emergency evacuation. Transit can play a critical role in emergency evacuation, particularly in evacuating those who lack access to a private vehicle and special-needs populations. The extent of transit’s role, however, depends on numerous factors, including the characteristics of the urban area, the type of emergency (e.g., advance-notice, no-notice), the predisposition of the public to both follow evacuation orders and use transit, available resources, and the characteristics of the transit system itself.
Comprehensive reviews of state and urban area emergency operations plans examined by the committee found that most plans were inadequate to manage catastrophic events. Significant weaknesses in evacuation plans were flagged as a major concern, with the exception of plans in the hurricane-prone Gulf Coast states and communities with nuclear facilities that are required to prepare and exercise evacuation plans. In particular, the reviews found very little indication that all available modes of transportation, including transit, had been incorporated in evacuation plans. Most important, despite the unique role of transit in evacuating special-needs populations, all plans were found to be lacking in accommodating the evacuation of those who are transit-dependent and may require special assistance (e.g., the elderly, those with disabilities). Finally, capacity issues, particularly congestion on urban area highways where buses also travel, are likely to limit evacuation capability in many urban areas. Despite this rather negative overall picture, several studies reviewed by the committee offered examples of transit’s having played a key role in emergency evacuation, such as in the terrorist attacks of September 11. In addition, most studies offered constructive suggestions for strengthening the role of transit in emergency evacuation by:

54 Special Report 294 The Role of Transit in Emergency Evacuation
• Including transit providers, as well as social service agencies, in the development of emergency plans.
• Identifying transit-dependent populations and those requiring special assistance in an evacuation through registries and computer mapping, and providing this information to emergency responders, including information on where these individuals should be taken, well in advance of an event.
• Specifying responsibilities of transit staff in an emergency (essential personnel), providing for the evacuation needs of the staff’s families, and securing transit equipment to the extent possible.
• Establishing means of communication, including contingency communications plans, among transit agency personnel and with other emergency responders.
• Developing memoranda of understanding with neighboring jurisdictions, sometimes across state lines, and standby contracts with private providers to help ensure that transit vehicles, including accessible equipment and trained drivers, will be available to meet surge requirements in an emergency and that transport destinations will be clear.
• Establishing protocols with a clear chain of command and checklists for critical transit personnel and emergency responders.
• Providing emergency evacuation information in accessible formats to the public, particularly to vulnerable populations, regarding how they can access transit (e.g., bus staging areas) and obtain assistance, if necessary, in an emergency evacuation.
• Undertaking frequent drills and exercises, including transit agencies, under a wide range of emergency scenarios to see how well evacuation plans work in practice, and planning revisions on the basis of this experience.
The committee considered many of these points in structuring its own assessment of the emergency response and evacuation plans of the 38 urbanized areas, particularly in preparing the interview questions for its in-depth case studies—the subject of the next chapter. REFERENCES Abbreviations
DDOT District Department of Transportation DHS U.S. Department of Homeland Security GAO U.S. Government Accountability Office NTSC John A. Volpe National Transportation Systems Center USDOT U.S. Department of Transportation
American Public Transportation Association. 2001. America Under Threat: Transit Responds to Terrorism. Special Report, September 11, 2001. Supplement to Passenger Transport. Washington, D.C.
Bailey, D., S. Swiacki, A. Byrnes, Buckley, J., King, D., Piper, V., Marino, M., Mundle, S., Pierlott, G., and Lynd, A. 2007. Transportation Equity and Emergency Preparedness: A Review of the Practices of State Departments of Transportation, Metropolitan Planning Organizations, and Transit Agencies in 20 Metropolitan Areas. Final Report. FTA-PA-26-8001-2007. Milligan & Company, LLC and Mundle & Associates, Philadelphia, PA, May.

The Role of Transit in Emergency Evacuation 55
Cox, W. 2006. Emergency Evacuation Report Card 2006. American Highway Users Alliance, Washington, D.C., Oct. 13, http://www.highways.org/pdfs/evacuation_report_card2006.pdf.
Dames and Moore Earthquake Engineering Group. 1999. The Loma Prieta Earthquake: Impact on Lifeline Systems. Disaster Recovery Journal Online, undated.
DDOT. 2005. July 4th, 2005 Emergency/Evacuation Route Test After-Action Report, Washington, D.C. DHS. 2006. Nationwide Plan Review, Phase 2 Report, June 16,
http://www.dhs.gov/xlibrary/assets/Prep_NationwidePlanReview.pdf. GAO. 2006. Transportation-Disadvantaged Populations: Actions Needed to Clarify Responsibilities
and Increase Preparedness for Evacuations. GAO-07-44. Washington, D.C., Dec., http://www.gao.gov/new.items/d0744.pdf.
Goodwill, J. A., and A. Reep. 2005. Transit Emergency Planning and Response Assessment Initiative. Center for Urban Transportation Research, University of South Florida, Sept.
Hansen, M., and S. Weinstein. 1991. East Bay Ferry Service and the Loma Prieta Earthquake. UCTC No. 162. Institute of Transportation Studies, University of California at Berkeley, Berkeley, CA, Dec.
Kendra, J., T. Wachtendorf, and E. Quarantelli. 2003. The Evacuation of Lower Manhattan by Water Transport on September 11: An Unplanned “Success,” Forum. Joint Commission Journal on Quality and Safety, Vol. 29, No. 6, pp. 316–318.
National Consortium on the Coordination of Human Services Transportation. 2006. Strategies in Emergency Preparedness for Transportation-Dependent Populations. Washington, D.C., Sept., http://www.dotcr.ost.dot.gov/Documents/Emergency/Emergency%20Preparedness%20Strategy%20Paper.doc.
NTSC. 2003. Effects of Catastrophic Events on Transportation System Management and Operations. Cross Cutting Study, Cambridge, MA, Jan.
Office of Emergency Management and Communications of the City of Chicago. 2007. September 7, 2006 Central Business District Evacuation Exercise After Action Report, Chicago, IL, Apr. 3.
Phillips, B. D., and B. H. Morrow. 2007. Social Science Research Needs: Focus on Vulnerable Populations, Forecasting, and Warnings. Natural Hazards Review, Vol. 8, No. 3, pp. 61–68.
Setzer, M. H. 2007. What To Expect From Your Local Transit System. Power Point presentation at the National Conference on Disaster Planning for the Carless Society, The University of New Orleans, New Orleans, LA, Feb. 8.
USDOT. 2006. Report to Congress on Catastrophic Hurricane Evacuation Plan Evaluation, in cooperation with the U.S. Department of Homeland Security. Washington, D.C., June 1, http://www.fhwa.dot.gov/reports/hurricanevacuation/.


57
4
Evidence from the 38 Largest Urbanized Areas
his chapter examines the role of transit in emergency evacuation in the 38 largest urbanized areas (UAs)—the primary focus of the committee’s charge. It begins with a profile of the 38
areas and a summary of the committee’s assessment of the role of transit in the publicly available emergency response and evacuation plans of the major jurisdictions within these UAs and their respective states. The chapter then turns to a discussion of the results of the case studies conducted by the committee, which provide an in-depth look at the multiple roles transit can play in emergency evacuation, as well as some of the factors limiting that role. The chapter ends with a series of findings. PROFILE OF THE 38 URBANIZED AREAS The committee prepared a statistical profile of the 38 UAs to provide an overview of many of the factors discussed in the previous chapter that may affect the role of transit in an emergency evacuation and to help select the case study sites. The profile is limited to those factors that could be quantified. Indicators were developed on six topics: UA size, potential demand for transit service, supply of transit and other public transportation equipment (i.e., school buses), number of transit agencies (an indicator of coordination complexity), roadway congestion, and predominant types of recent disasters (see Box 4-1). The primary data sources are U.S. census data for information on population, land area, demographic statistics, and car ownership; the National Transit Database for data on transit agency size, service area, and equipment by type; the annual bus fleet survey of the top 100 school districts for school bus numbers; the Urban Mobility Report of the Texas Transportation Institute for the congestion indicator; and the annual Federal Emergency Management Agency database on presidentially-declared disasters for data on the most common disasters by state. The UA designation, which originated in the study request, proved to be a constraint. Census data are available by UA, but transit and school bus data are not; the boundaries of transit service areas and school bus districts are not coterminus with census-defined borders of the UAs. Even so, every effort was made to include the major transit properties and school districts in a UA. The focus on UAs, however, was useful from another perspective. UAs represent the most densely populated part of a region, where transit service is likely to be most extensive, and thus where the need for transit could be significant in an emergency evacuation.
T

58 Special Report 294: The Role of Transit in Emergency Evacuation
BOX 4-1
Indicators by Category of Interest for Statistical Profile of 38 Urbanized Areas
Size of Urbanized Area
• Population • Land area (in square miles) • Transit service area of largest provider (in square miles) • Transit population served of largest provider
Potential Demand for Transit Service
• Carless households – Housing units without cars – Percent of housing units without cars
• Seniors – Householders living alone and >65 years of age – Percent of householders living alone and >65 years of age
• Recent immigrants – Number of foreign born, entry >2000 – Population >5 years of age who speak English less than “very well” – Percent of population >5 years of age who speak English less than “very well”
• Poor (below the poverty line) – Population living below the poverty line – Percent of population living below the poverty line – Persons with disabilities – Population >5 years of age with a disability – Percent of population >5 years of age with a disability
• Commuters – Number of workers >16 years of age using transit (excluding taxi)
Supply
• Density of urbanized area (population per square mile) • Number of cars • Number of buses (for transit agencies with >100 vehicles operated in maximum
service [VOMS]) • Number of railcars (for transit agencies with >100 VOMS) • Number of demand response vehicles (for transit agencies with >100 VOMS) • Number of school buses
Coordination
• Number of transit agencies (with >100 VOMS)
(continued)

Evidence from the 38 Largest Urbanized Areas 59
BOX 4-1 (continued) Congestion
• Travel time index Disasters
• Predominant type
The results of the statistical profile are summarized in Table 4-1 and shown in detail in
Annex 4-1.1 The profile, particularly the detailed statistics, reveals the variety of conditions even among the largest UAs—the 38 selected for this study. For example, population ranges in size from just over 1 million for New Orleans (pre-Katrina) to 17.8 million for the New York−Newark UA.2 Even more relevant from the perspective of transit service provision, population density (population per square mile)—a good proxy for the levels of transit supply to be found in an area—ranges from a low of 1,783 in Atlanta to a high of 7,068 in Los Angeles. In low-density Atlanta, the largest transit system, the Metropolitan Atlanta Rapid Transit Authority, covers only one-quarter of the land area and provides service to about 40 percent of the population of the Atlanta UA. By contrast, in high-density Los Angeles, the Los Angeles County Metropolitan Transportation Authority bus system covers nearly three-quarters (73 percent) of the land area and provides service to a roughly equivalent percentage of the population in the Los Angeles UA.
The 38 UAs also differ in more direct measures of transit system availability. Nearly half—17 of 38—generally those in the bottom triad with respect to population size3—are served by only one transit agency (see Table 4-1).4 The inventory of available transit equipment (e.g., buses, railcars, demand response vehicles) is also low for this group of UAs (i.e., <1 transit vehicle per 1000 persons), even though the data represent the maximum levels of equipment likely to be operational in the event of an emergency.5 At the other end of the spectrum, with the exception of Boston and Houston, the largest UAs—those in the top triad with respect to population size—are served by two or more transit agencies; the very largest UAs—New York and Los Angeles—have 17 and 9 transit providers, respectively. Not surprisingly, the supply of transit equipment is also larger in these areas; New York, Chicago, and Los Angeles lead the group, with 18.5, 6.6, and 5.3 transit vehicles per 1000 persons, respectively. In sum, the
1 Sylvia He, Ph.D. candidate in the School of Policy, Planning and Development at the University of Southern California, collected the data, working with committee member Evelyn Blumenberg under the general supervision of the committee. 2 In the interest of brevity, once an individual UA has been mentioned, its name is shortened when used again. 3 The exceptions in terms of population size are Boston and Houston, which are defined here as large UAs (i.e., in the top triad of the 38 UAs). 4 For the purposes of this profile, only transit agencies with >100 vehicles operated in maximum service (VOMS) were included. 5 The Federal Transit Administration defines VOMS as the number of revenue vehicles operated to meet annual maximum service requirements. This is the revenue vehicle count during the peak season during the week and day that maximum service is provided. VOMS exclude atypical days or one-time special events.

60 Special Report 294: The Role of Transit in Emergency Evacuation
TABLE 4-1 Summary Profile of 38 Largest Urbanized Areas
Sizea Carless
Householdsb Car
Availabilityc Transit
Availabilityd
Urbanized Area
Large, Medium,
Small UAs
Number of Housing Units without Cars
Cars/1000 Persons
Transit/1000 Persons
Atlanta L 99,835 646 0.86 Baltimore M 132,965 578 1.24 Boston L 219,213 579 2.14 Chicago L 436,049 548 6.59 Cincinnati S 64,934 658 0.37 Cleveland M 83,920 637 0.75 Columbus S 37,761 672 0.28 Dallas–Fort Worth–Arlington L 99,384 621 1.28 Denver–Aurora M 59,522 692 1.43 Detroit L 147,695 635 0.81 Houston L 108,281 580 1.94 Indianapolis S 37,801 671 0.20 Kansas City S 43,034 679 0.34 Las Vegas S 47,282 585 0.44 Los Angeles–Long Beach– Santa Ana L 437,913 541 5.30 Miami L 207,476 576 2.22 Milwaukee S 67,646 608 0.68 Minneapolis–St. Paul M 84,472 659 1.50 New Orleans S 70,328 523 0.48 New York–Newark L 2,102,874 425 18.54 Orlando S 29,700 640 0.38 Philadelphia L 319,899 556 2.57 Phoenix–Mesa M 76,756 614 0.97 Pittsburgh M 106,557 610 1.47 Portland M 55,749 667 0.98 Providence S 54,658 613 0.33 Riverside–San Bernardino S 39,397 540 0.45 Sacramento S 43,859 631 0.38 St. Louis M 81,489 646 0.67 San Antonio S 45,888 569 0.54 San Diego M 78,393 613 1.16 San Francisco–Oakland L 174,176 584 4.26 San Jose S 29,147 663 0.59 Seattle M 91,536 696 3.73 Tampa–St. Petersburg M 74,404 645 0.45 Virginia Beach S 45,688 632 0.39 Washington L 181,846 607 2.95 San Juan M 205,563 388 3.34
(continued)
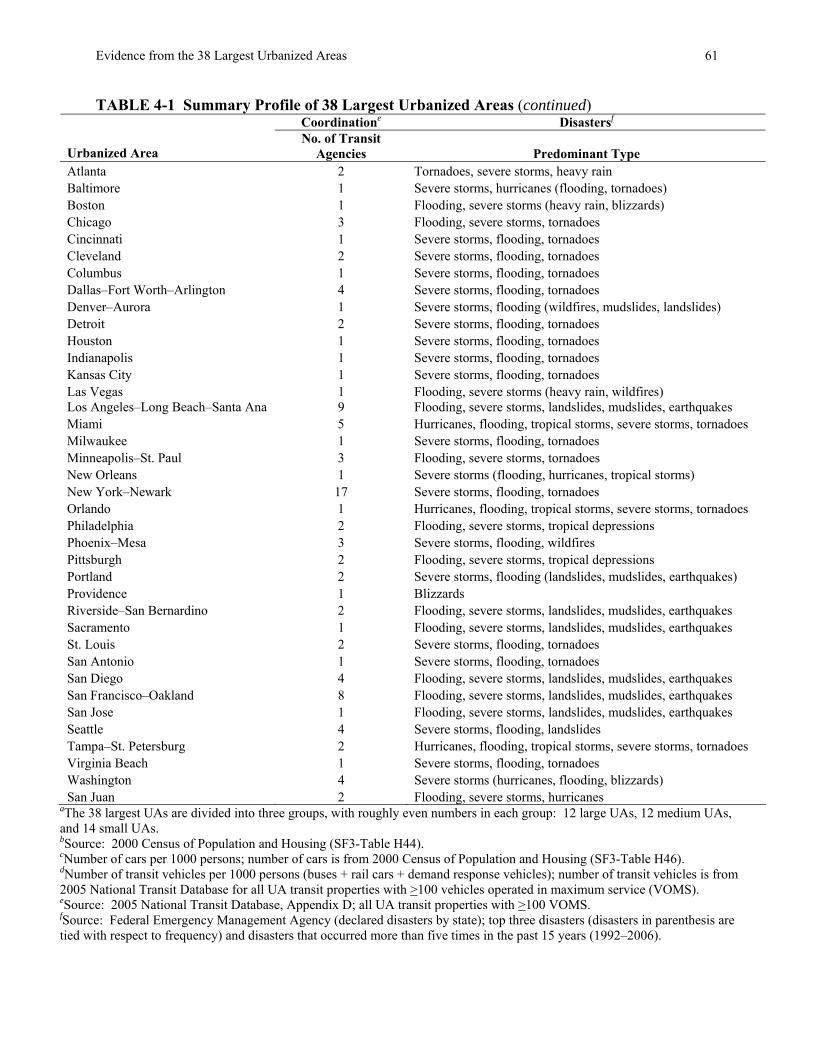
Evidence from the 38 Largest Urbanized Areas 61
TABLE 4-1 Summary Profile of 38 Largest Urbanized Areas (continued) Coordinatione Disastersf
Urbanized Area
No. of Transit Agencies Predominant Type
Atlanta 2 Tornadoes, severe storms, heavy rain Baltimore 1 Severe storms, hurricanes (flooding, tornadoes) Boston 1 Flooding, severe storms (heavy rain, blizzards) Chicago 3 Flooding, severe storms, tornadoes Cincinnati 1 Severe storms, flooding, tornadoes Cleveland 2 Severe storms, flooding, tornadoes Columbus 1 Severe storms, flooding, tornadoes Dallas–Fort Worth–Arlington 4 Severe storms, flooding, tornadoes Denver–Aurora 1 Severe storms, flooding (wildfires, mudslides, landslides) Detroit 2 Severe storms, flooding, tornadoes Houston 1 Severe storms, flooding, tornadoes Indianapolis 1 Severe storms, flooding, tornadoes Kansas City 1 Severe storms, flooding, tornadoes Las Vegas 1 Flooding, severe storms (heavy rain, wildfires) Los Angeles–Long Beach–Santa Ana 9 Flooding, severe storms, landslides, mudslides, earthquakes Miami 5 Hurricanes, flooding, tropical storms, severe storms, tornadoes Milwaukee 1 Severe storms, flooding, tornadoes Minneapolis–St. Paul 3 Flooding, severe storms, tornadoes New Orleans 1 Severe storms (flooding, hurricanes, tropical storms) New York–Newark 17 Severe storms, flooding, tornadoes Orlando 1 Hurricanes, flooding, tropical storms, severe storms, tornadoes Philadelphia 2 Flooding, severe storms, tropical depressions Phoenix–Mesa 3 Severe storms, flooding, wildfires Pittsburgh 2 Flooding, severe storms, tropical depressions Portland 2 Severe storms, flooding (landslides, mudslides, earthquakes) Providence 1 Blizzards Riverside–San Bernardino 2 Flooding, severe storms, landslides, mudslides, earthquakes Sacramento 1 Flooding, severe storms, landslides, mudslides, earthquakes St. Louis 2 Severe storms, flooding, tornadoes San Antonio 1 Severe storms, flooding, tornadoes San Diego 4 Flooding, severe storms, landslides, mudslides, earthquakes San Francisco–Oakland 8 Flooding, severe storms, landslides, mudslides, earthquakes San Jose 1 Flooding, severe storms, landslides, mudslides, earthquakes Seattle 4 Severe storms, flooding, landslides Tampa–St. Petersburg 2 Hurricanes, flooding, tropical storms, severe storms, tornadoes Virginia Beach 1 Severe storms, flooding, tornadoes Washington 4 Severe storms (hurricanes, flooding, blizzards) San Juan 2 Flooding, severe storms, hurricanes
aThe 38 largest UAs are divided into three groups, with roughly even numbers in each group: 12 large UAs, 12 medium UAs, and 14 small UAs. bSource: 2000 Census of Population and Housing (SF3-Table H44). cNumber of cars per 1000 persons; number of cars is from 2000 Census of Population and Housing (SF3-Table H46). dNumber of transit vehicles per 1000 persons (buses + rail cars + demand response vehicles); number of transit vehicles is from 2005 National Transit Database for all UA transit properties with >100 vehicles operated in maximum service (VOMS). eSource: 2005 National Transit Database, Appendix D; all UA transit properties with >100 VOMS. fSource: Federal Emergency Management Agency (declared disasters by state); top three disasters (disasters in parenthesis are tied with respect to frequency) and disasters that occurred more than five times in the past 15 years (1992–2006).
62 Special Report 294: The Role of Transit in Emergency Evacuation
differences among UAs, particularly with respect to the number and size of transit agencies and the density of the population served, suggest that there is no single set of circumstances, or planning template, regarding the provision of transit service, even among this pool of the 38 largest UAs.
What the UAs do appear to have in common is relatively large numbers of special-needs populations—carless households, older residents living alone, people living below the poverty line, and people with a disability (see Annex 4-1). All these special-needs groups are potential users of transit in an emergency evacuation. However, the transit fleet inventory suggests that, with the exception of a few UAs, the numbers of paratransit and other demand response vehicles available to serve many of the groups who might need assistance in an evacuation are small. [It is difficult to get a sense of the total shortfall from the inventory numbers. Many buses are Americans with Disabilities Act (ADA)-equipped and could serve those who are carless but ambulatory in an evacuation. Similarly, ADA-accessible school buses could be used to supplement transit service for this same group. This type of detail was not available in the summary statistics.] Moreover, the spatial distribution of special-needs populations, together with the availability of transit and school bus drivers and equipment to serve them at the time of an emergency, determines the extent to which transit and other public transportation providers can play a significant role in an evacuation. The indicators—with their summary averages and percentages—fall short of providing this vital information. With the exception of San Juan and New York, the UAs show similar and significant levels of car ownership relative to transit availability per 1000 persons (see Table 4-1). Even taking into account the greater carrying capacity of transit vehicles, the numbers serve as a reminder that cars will be the primary mode of transportation in an emergency evacuation. RESULTS OF THE COMMITTEE’S PLAN ASSESSMENT Using the contextual data provided by the statistical profile of the 38 UAs, the committee undertook an assessment of the emergency response and evacuation plans of each UA and its respective state to ascertain the extent to which transit is included in these plans. At the outset of the study, the intent was to draw on the in-depth reviews prepared by the U.S. Department of Homeland Security (DHS) in its Nationwide Plan Review of 56 states and territories and the 75 largest UAs (DHS 2006). Unfortunately, confidentiality issues precluded the committee from accessing all but the summary data from that review, which are discussed in Chapter 2 and the literature review (in Appendix B). Therefore, the committee commissioned a small project to access information that could be gleaned from online documents.6 The primary purpose was to evaluate each of the UAs to determine whether it had an emergency response and evacuation plan, whether the plan considered the use of transit resources in an emergency evacuation, and to what extent.7
Internet searches were used to locate relevant publicly available emergency planning documents for each UA area and its respective state. When no documents could be found, a
6 Both budgetary considerations and the already significant survey demands on relevant respondents prevented the committee from conducting an in-depth survey of its own. 7 The work was performed by Joseph M. Maltby and Aaron D. Green, JD candidates at the George Mason University School of Law, both of whom had prior experience as legal interns for DHS’s Critical Infrastructure Protection Program.
Evidence from the 38 Largest Urbanized Areas 63
follow-up call was made to determine whether they could be located. In some cases, plans were not available to the public for security reasons; in other cases, technical problems precluded accessing the documents. Of the 33 UAs reviewed, 8 16 had made publicly available at least portions of an emergency response or evacuation plan, while 17 either did not have publicly available plans or were in the process of drafting or revising them.
The documents of the 16 UAs with publicly available plans were reviewed to answer 14 questions; both the questions and a summary matrix of the results can be found in Appendix C.9 In 11 of the 16 UAs, transit is included in emergency evacuation plans. However, only 7 plans clearly indicated transit’s role in the chain of command in the event of an emergency and an equivalent numbers identified available transit equipment. Only 6 plans described transit’s role in evacuating special-needs populations, and details were scant regarding methods for identifying these populations, communicating with them about what to do in an emergency, identifying pickup locations for those who are ambulatory, and specifying where transit passengers would be taken (see Appendix C for more details). In summary, only 7 plans contained sufficient detail to lend credibility to the role of transit in emergency evacuation.
The committee concluded that the data gathered through its plan review were inadequate to analyze in any depth or to assess reliably the role of transit in the emergency response and evacuation plans of the 33 UAs. Although it was not focused on transit, a recent online review of the content of the websites of all 50 state emergency management agencies (Liu 2008) found similar limitations. Slightly more than half (56 percent) of the websites included crisis communications or emergency management plans. In the researcher’s opinion, the reluctance to post plans reflects the security concerns of the post–September 11 environment. Websites that provided information on disasters were focused on terrorism, rather than on those disasters likely to occur in the respective states. Moreover, the websites did a poor job of targeting special-needs populations. For example, only one-third had foreign language access; 38 percent included information for the disabled; and only 16 percent had information targeting the elderly.
These findings raise a more general issue about the appropriate level of emergency information that should be made publicly available. The committee believes that the public should be informed about area emergency evacuation plans and how transit will be deployed in an emergency. An informed public, particularly special-needs populations, is critical to preparedness in an emergency incident. However, sensitive operational details should be excluded from emergency planning documents and only “sanitized” versions made publicly available. FEMA could provide a template for suitable presentation formats as part of its guidance to state, local, and tribal governments. RESULTS OF THE COMMITTEE’S CASE STUDIES In response to its charge, the committee conducted five in-depth case studies to enhance its understanding of the various roles transit can play in an emergency evacuation. The case study results are summarized here and presented in greater detail in Appendix D.
8 Five of the 38 UAs were handled as case studies, which included detailed assessments of the role of transit (see Appendix D). 9 For cost reasons, the detailed data for each UA will be made available in electronic form only as part of the final report.

64 Special Report 294: The Role of Transit in Emergency Evacuation
Selection of Case Study Sites The committee used the statistical profile summarized above to help guide its selection of case study sites. The final selection was made on the basis of five criteria:
• size of UA, • mix of transit system types (e.g., bus, rail), • large special-needs populations, • different types of disaster threats and experience with disasters, and • jurisdictional complexity.
Regarding size, the larger UAs were of particular interest because they typically have
large transit systems with the potential to play a major role in an emergency evacuation. That said, as noted in Chapter 1, the committee was interested in selecting one medium-sized UA to examine the extent to which scale issues make a significant difference in response capacity. Having sites with a mix of different transit systems was also important, including UAs with large heavy-rail systems; UAs with large bus systems; and UAs that draw on other types of public transport, such as ferries or intercity passenger rail (e.g., Amtrak). The presence of large special-needs populations was a key criterion, which most of the UAs met. Variation in the types of disasters faced was another selection criterion; recent experience with a disaster was also desirable. Finally, UAs that posed challenges from the perspective of jurisdictional complexity were of interest. Also factored into the selection process was the ability to identify a lead committee member who could help organize and conduct each site visit. The application of these criteria resulted in the selection of five case study sites—Chicago, Houston, Los Angeles−Long Beach−Santa Ana, New York−Newark, and Tampa−St. Petersburg UAs (see Table 4-2). At each of the case study sites, representatives of city and county emergency management agencies, transit agencies, state and local departments of transportation (DOTs), and other relevant agencies [e.g., school districts, metropolitan planning organizations (MPOs)], were interviewed. The questionnaires that guided the interviews can be found in Appendix D. Roles of Transit in an Emergency The case studies provide good examples of the breadth of roles transit can play in an emergency evacuation. The committee also supplemented its site visits with information about individual UAs from briefings at its meetings and from other case studies that were brought to its attention.10 Although it is not possible to generalize from the case studies to all 38 UAs, common themes did emerge that have broader implications for the use of transit in emergency evacuation.
10 For example, the committee was briefed by the Department of Transportation of the District of Columbia about its evacuation plan and by the Metropolitan Washington Council of Governments on commencement of a regional evacuation planning initiative for the Washington metropolitan area. The Federal Transit Administration briefed the committee on the results of a study by Milligan & Co., Ltd., on emergency preparedness plans for special-needs populations in 20 major metropolitan areas (see Appendix B). Finally, the John F. Kennedy School of Government shared results of a case study it had conducted on the San Francisco−Oakland UA, which included information on the potential use of ferries in emergency evacuation.

Evidence from the 38 Largest Urbanized Areas 65
TABLE 4-2 Criteria for Selection of Case Study Sites and Rating of Five Selected Sites Urbanized Area
Population Sizea
Type of Transit System
Special-Needs Populationsb
Predominant Type of Disaster
Jurisdictional Complexityc
Chicago Large Rail and bus 15 percent carless households; 14 percent speak English less than “very well”
Flooding, severe storms, tornadoes; terrorism threat
Medium
Houston Large Predominantly bus 14 percent of population living below the poverty line; 20 percent speak English less than “very well”
Severe storms, flooding, tornadoes; experience with Hurricane Rita
Low
Los Angeles−Long Beach-Santa Ana
Large Predominantly bus 17 percent of population living below the poverty line; 28 percent speak English less than “very well”
Flooding, Severe storms, landslides, mudslides, earthquakes; terrorism threat
High
New York−Newark
Large Rail, bus, and ferry 32 percent carless households; 14 percent of population living below the poverty line; 17 percent speak English less than “very well”
Severe storms storms, flooding, tornadoes; terrorism (September 11, 2001)
High
Tampa−St. Petersburg
Medium Bus 17 percent of population with a disability;11 percent of households living alone and >65
Hurricane, flooding, tropical and severe storms, tornadoes; recent hurricane experience
Low
aSee Table 4-1 for explanation of ranking. bSee Annex 4-1 for indicators. cLow = 1−2 transit agencies; Medium = 3−4 transit agencies; High = >5 transit agencies.
General Evacuation The case study of the Houston UA provides a good illustration of the range of roles transit can play in an emergency evacuation because of the important and varied role performed by METRO—Houston’s primary transit service provider—in advance of and during Hurricane Rita. METRO was involved directly in the evacuation of those individuals from Galveston and Houston who chose to use bus transport or did not have access to a vehicle, arranged for supplementary rail service using Amtrak and Trinity Railroad, provided support to stranded motorists on freeways; and offered shelter and necessities to its critical employees and their families when needed (see Box 4-2 for more detail). The case studies of the New York and Chicago UAs also reveal the important roles transit is expected to play in these areas in the event of an emergency evacuation. Both have extensive transit systems and ridership. The MTA in New York operates North America’s largest transit network, while the Chicago Transit Authority (CTA) is the second-largest transit system in the United States. The role of transit in helping to evacuate Lower Manhattan following the events of September 11, 2001, was discussed in Chapter 3. The New York site visit revealed that the most detailed plans for transit, however, are focused on assisting in the
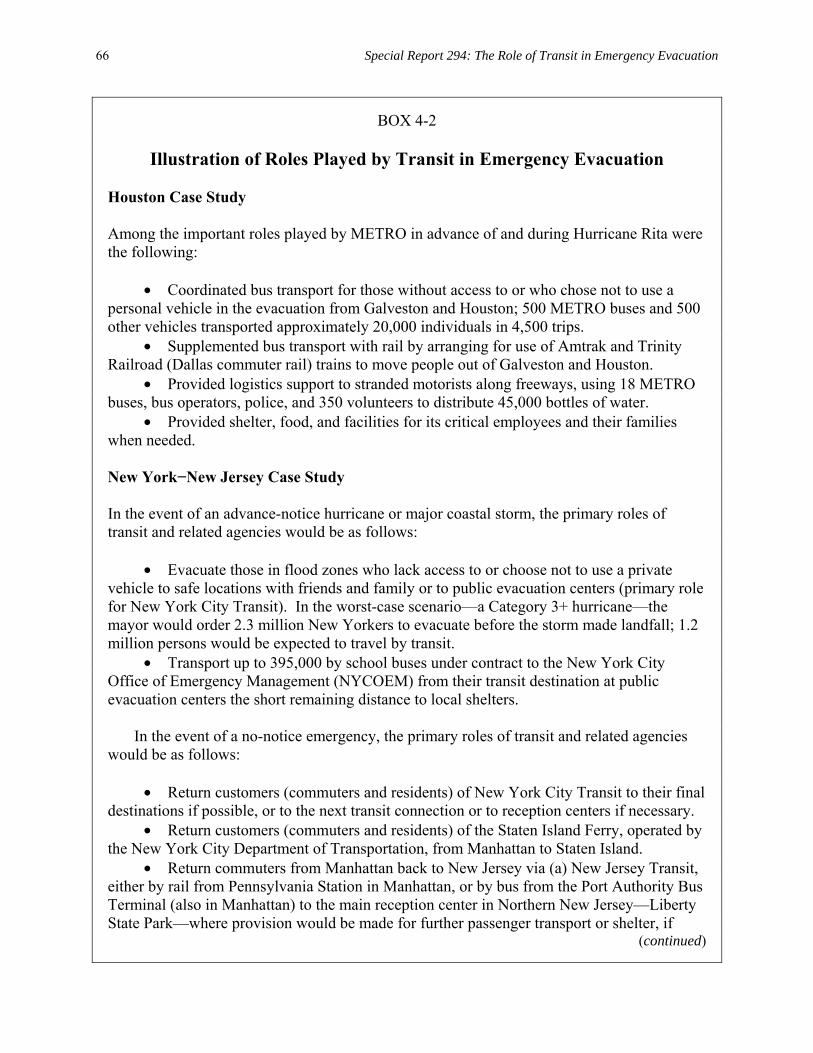
66 Special Report 294: The Role of Transit in Emergency Evacuation
BOX 4-2
Illustration of Roles Played by Transit in Emergency Evacuation
Houston Case Study Among the important roles played by METRO in advance of and during Hurricane Rita were the following:
• Coordinated bus transport for those without access to or who chose not to use a personal vehicle in the evacuation from Galveston and Houston; 500 METRO buses and 500 other vehicles transported approximately 20,000 individuals in 4,500 trips.
• Supplemented bus transport with rail by arranging for use of Amtrak and Trinity Railroad (Dallas commuter rail) trains to move people out of Galveston and Houston.
• Provided logistics support to stranded motorists along freeways, using 18 METRO buses, bus operators, police, and 350 volunteers to distribute 45,000 bottles of water.
• Provided shelter, food, and facilities for its critical employees and their families when needed. New York−New Jersey Case Study In the event of an advance-notice hurricane or major coastal storm, the primary roles of transit and related agencies would be as follows:
• Evacuate those in flood zones who lack access to or choose not to use a private vehicle to safe locations with friends and family or to public evacuation centers (primary role for New York City Transit). In the worst-case scenario—a Category 3+ hurricane—the mayor would order 2.3 million New Yorkers to evacuate before the storm made landfall; 1.2 million persons would be expected to travel by transit.
• Transport up to 395,000 by school buses under contract to the New York City Office of Emergency Management (NYCOEM) from their transit destination at public evacuation centers the short remaining distance to local shelters.
In the event of a no-notice emergency, the primary roles of transit and related agencies would be as follows:
• Return customers (commuters and residents) of New York City Transit to their final destinations if possible, or to the next transit connection or to reception centers if necessary.
• Return customers (commuters and residents) of the Staten Island Ferry, operated by the New York City Department of Transportation, from Manhattan to Staten Island.
• Return commuters from Manhattan back to New Jersey via (a) New Jersey Transit, either by rail from Pennsylvania Station in Manhattan, or by bus from the Port Authority Bus Terminal (also in Manhattan) to the main reception center in Northern New Jersey—Liberty State Park—where provision would be made for further passenger transport or shelter, if
(continued)

Evidence from the 38 Largest Urbanized Areas 67
BOX 4-2 (continued) necessary; (b) the Port Authority of New York and New Jersey via the PATH trains from two terminals in Manhattan and three in New Jersey; and (c) private ferries through a joint agreement in process between NYCOEM and the New Jersey Office of Emergency Management to provide transport for commuters to new docking berths at Liberty State Park.
Chicago Case Study In a no-notice major emergency, transit, commuter rail, and intercity passenger rail would play the following roles:
• Transport passengers away from the incident site by converting Chicago Transit Authority (CTA) trains to shuttles and redeploying buses to move passengers from assembly and transportation centers to preidentified staging areas, whose locations would depend on the location, severity, and designated perimeter of the incident. According to CTA, in excess of 100,000 people per hour could be evacuated by rail and about 40,000 people per hour by bus, exceeding the system’s rush hour capacity.
• Transport Metra (commuter rail) passengers in trains away from the incident site. Supplement CTA service, coordinating changes in schedule and routes with the City of Chicago Office of Emergency Management and Communication, CTA, Cook County Sheriff’s Police, and other suburban law enforcement officials.
• Provide supplemental Amtrak equipment from a major downtown maintenance facility and another near Indianapolis. Los Angeles Case Study In a no-notice major emergency, transit providers would assume the following roles:
• Coordinate with other major transportation providers (Los Angeles Metropolitan Transit Authority), but play a limited role in evacuation. The top priority is maintenance of operations in areas unaffected by an emergency incident.
• Evacuate transit-dependent residents to schools and parks on higher ground along designated evacuation routes in the event of a tsunami (Los Angeles Department of Transportation and Long Beach Transit).
• Evacuate residents in the event of an emergency incident at the San Onofre Nuclear Generating Station; plans include transportation assembly points, bus transport for those without access to private vehicles, and provision for other special-needs populations [Orange County Transportation Authority (OCTA)]. Tampa Case Study In the event of an advance notice hurricane, the primary roles of transit are to:
(continued)
68 Special Report 294: The Role of Transit in Emergency Evacuation
BOX 4-2 (continued)
• Evacuate residents without a car to regular, in-county shelters on designated premarked evacuation routes, increasing bus service on some lines, such as public housing areas, where large numbers of residents are known to need transport.
• Provide transport by school buses on evacuation routes to shelters for those without a car in unincorporated county areas without transit service, use school buses as shuttles to relieve evacuee overflow at crowded shelters, and provide special school bus transport for the homeless to several shelters that are “homeless friendly.”
• Evacuate special-needs populations, using paratransit providers and school buses, to special-needs shelters.
• Return residents from area shelters or friends and family to their point of departure.
evacuation of residents located in storm surge areas to higher ground in the event of a major hurricane or coastal storm. (Businesses and schools are assumed to be closed in advance of a storm.) In a no-notice emergency, such as another terrorist incident, the primary role of transit would be to assist commuters and residents in returning home (see Box 4-1 for detail). In both types of emergency, transit operators would attempt to continue regular service patterns (unless the transit system itself had been compromised) so as to minimize any confusion among customers or operating personnel and simplify customer information requirements. In Chicago, emergency planners have focused on no-notice emergencies. The CTA is considered a primary support agency in the event of an evacuation. In contrast with New York, however, CTA trains would be operated as shuttles in a major emergency, and buses would be redeployed to move passengers from assembly and transportation centers to preidentified staging areas whose actual locations would be determined by the location, severity, and designated perimeter of an incident (see Box 4-1). In Los Angeles, the role of transit in an emergency evacuation is more ad hoc, reflecting the no-notice nature of most hazards facing the region. The Los Angeles County Metropolitan Transportation Authority (Metro)—the primary transit provider—is responsible for coordination of other transportation agencies during a major incident. Metro views its own role largely as keeping the transit system operating; the agency has little spare capacity to respond to an emergency. In some emergencies, such as an earthquake, Metro would shut down the system until the integrity of rail lines and overpasses on which buses travel could be verified. Transit service is not extensive in the Tampa UA. Nevertheless, in the two most populous counties in the UA—Hillsborough and Pinellas Counties—local transit systems, supplemented by local school bus fleets, play an important role in emergency evacuation, particularly in the evacuation of special-needs populations, discussed in the following section. Evacuation of Special-Needs Populations Transit has a unique role to play in the evacuation of special-needs populations—the carless, the medically homebound, the disabled, the elderly, and other groups that may need special assistance. Often, the evacuation of special-needs populations will involve paratransit services that may or may not be operated by the primary transit authority and require accessible lift-

Evidence from the 38 Largest Urbanized Areas 69
equipped vehicles.11 If paratransit services are contracted out, this poses additional complexity in terms of control over equipment and drivers in an evacuation. One way to address these issues is to involve paratransit providers with other transit agencies in the development of emergency plans and as part of the response team. Emergency evacuation of special-needs populations poses a major challenge in all the case study sites. The Tampa UA, like the State of Florida generally, is notable for its attention to these vulnerable residents. Since the 1980s, county emergency managers across the state have been required by state law to establish voluntary special registries to help identify the medically impaired who are not in institutions but have special medical needs12; special-needs shelters must be made available, and their staffing and medical management is the responsibility of county health departments. In the Tampa UA, transit providers, as well as school bus operators, have targeted their resources to transporting special-needs populations in an evacuation. Their role is to transport ambulatory and wheelchair-bound special-needs populations to these shelters. When a mandatory evacuation has been declared, Hillsborough and Pinellas County transit operators also play a role in transporting the disadvantaged and the homeless, as well as those in the general population who lack access to a private vehicle, either to a shelter or to other in-county destinations along evacuation routes. Evacuation of special-needs populations by transit is more complex in the other case study sites. The larger size of these UAs and their special-needs populations and the lack of lead time to handle the evacuation of these residents in no-notice incidents—the predominant type of emergency facing many of these areas—are just two of the reasons for this greater complexity. For example, New York has not attempted to develop a voluntary special-needs registry because of the difficulty of keeping such a registry up to date. The City of Houston set up a voluntary special registry following Hurricane Rita, but only 4,500 people had registered as of the time of the committee’s site visit, a fraction of those estimated to need assistance in an evacuation. New York, Houston, Los Angeles, and Chicago are all working with various community groups and nonprofit organizations, as well as churches and paratransit providers that represent various special-needs subgroups—the disabled, the elderly (e.g., Meals on Wheels), people living with AIDS, the homeless—to identify those who might need assistance in an emergency, but progress is slow. MPOs, together with local universities, are also helping with development of databases on special-needs populations and mapping their locations in metropolitan areas using geographic information systems. Finally, some areas are encouraging self-help measures. For example, Chicago has an innovative program for high-rise buildings in the central business district. Building managers have been asked to identify disabled workers and plan for how they would be evacuated in an emergency. Other UAs have established community emergency response teams and are training neighborhood leaders to educate others about disaster response.
11 In Houston, for example, METRO operates the paratransit service. In Chicago, PACE (a public agency) provides bus and vanpool service in the Chicago suburbs, as well as paratransit service in the City of Chicago. In New York and Los Angeles, paratransit services are contracted out to private providers, another common arrangement. In Tampa, paratransit service is provided by the county in Hillsborough County, but is contracted out in Pinellas County. 12 This definition of special-needs populations is narrower than many others. In some locations, special-needs populations also include those who lack access to a private vehicle and need transport in an evacuation. One reason for the narrower definition is the close link in Florida between special-needs populations and medically equipped special-needs shelters where they are transported.

70 Special Report 294: The Role of Transit in Emergency Evacuation
Support for Emergency Responders Another important role for transit is to help support emergency responders. In Houston during the evacuation in advance of Hurricane Rita, METRO helped bring fuel to emergency response teams and directly assisted stranded motorists on freeways, distributing large quantities of bottled water. In New York, transit was used to bring emergency responders and equipment to the World Trade Center site on September 11, 2001. In future incidents, NYCOEM will notify transit agencies of resources and support needed for transporting emergency personnel to an incident site at the time, and plans have evidently been developed for this eventuality. In Chicago, CTA has plans for bringing in personnel, supplies, and equipment to an emergency site in the event of an incident. CTA regularly brings police into the City of Chicago to provide security during Fourth of July celebrations and other major events. Amtrak could also assist, making available equipment from nearby maintenance facilities. In Los Angeles, Metro rail could provide heavy equipment to help out at an emergency site and has offered bus transport in the past for law enforcement officials during area emergencies (e.g., the Los Angeles riots in 1992 and the Northridge earthquake in 1994). In a major incident, however, the Los Angeles DOT, the Los Angeles County Public Works Department, and Caltrans would need to keep the roads clear and dedicate lanes for travel by buses and emergency vehicles. In Orange County, part of the Los Angeles UA, the Orange County Transportation Authority has supplied buses on demand for firefighting, primarily to transport firefighters to the scene to provide shift relief. In Tampa, transit buses are regularly used to support incident response. For example, air-conditioned transit buses have been used to house residents of an assisted living facility temporarily in the event of a fire or to transport the residents to another facility. Recovery Transit providers also have a role to play in recovery, although this role has received less attention in most evacuation plans and will depend on the nature of the emergency. In a hurricane, resuming transit operations will depend on the extent of flooding in rail tunnels and the amount of debris on the roads affecting bus travel. The primary role of transit will be to return evacuees from shelters or from family and friends to their initial point of departure. In Tampa, for example, once it is safe for evacuees to return home, every effort is made to use the same transit vehicles to return residents to their points of departure. Following Hurricane Rita, Houston’s METRO provided transport for those without access to a private vehicle back to Houston and neighboring Galveston. In a no-notice emergency, once the immediate danger has passed, transit providers will attempt to restore normal service; reroute service around problem areas; or, if a large area remained closed, establish shuttle service between initial drop-off points outside the incident perimeter and end-of-line terminals. This is the plan in Chicago. In New York, the Metropolitan Transportation Authority (MTA) has developed a service restoration plan that would begin as soon as an incident occurs. Key MTA staff would meet at the New York Transit-Subway Rail Control Center with representatives of the police and fire departments, NYCOEM, and other agencies to begin mobilizing resources.

Evidence from the 38 Largest Urbanized Areas 71
Roles of Other Modes of Public Transport School Buses School buses play an important role in evacuation in many of the case study sites, which should not be surprising because schools serve as shelters in many of the areas visited. In Tampa, school district buses are an integral part of evacuation plans, and vehicle dispatch is coordinated with area transit providers at the county emergency operations centers, which are activated in a major incident. A sizeable fraction of the school bus fleet is Americans with Disabilities Act (ADA) accessible and thus is deployed to help transport residents with disabilities to special-needs shelters in an evacuation. In Houston and New York, school buses have a more limited role. In Houston, METRO is working with school districts to integrate them into hurricane evacuation plans. School and METRO buses will be used for local pickup and drop-off at schools and other congregating locations; state contract buses will then pick up passengers for longer-haul transport to shelters outside the Houston UA. In New York, in the event of a hurricane or another disaster requiring the opening of public shelters, school buses are under contract to NYCOEM to transport evacuees the short distance from public evacuation centers to public shelters, many of which are schools.13 Commuter and Intercity Rail Commuter and intercity (Amtrak) rail can be important partners in emergency evacuation plans. In Chicago, a major rail hub, Metra—the second-largest commuter railroad in the United States—and Amtrak, along with CTA, are identified as key support agencies in the City of Chicago’s Central Business District Evacuation Plan. Metra will supplement CTA services, and Amtrak will assist with equipment to the extent it can. Area emergency managers are working to see whether a coordination system among freight carriers could be accessed in an emergency to help clear the tracks for use by Metra and Amtrak.14 The role of commuter rail, which is under the umbrella of the MTA in New York, is an integral part of emergency evacuation plans that have already been described. Although Amtrak ceased service immediately after the World Trade Center strikes on September 11, 2001, once it had been determined to be secure, special service was resumed to transport about 1,000 firefighters, police officers, and emergency workers from Boston and Washington, D.C., to assist local emergency responders (MIPRC 2006). With the assistance of Amtrak, Trinity Railway Express service was redirected to and helped evacuate about 450 passengers from Houston in advance of Hurricane Rita (MIPRC 2006). METRO has recommended prepositioning of rolling stock and aggressive use of freight right-of-way in the event of another major evacuation because of the greater efficiency of rail
13 In Los Angeles city and county, school buses are fully committed and would not be available to assist in the evacuation of the general population. In Orange County, school buses are part of the emergency plan, and could be deployed by the logistics section chief and transportation coordinator in an emergency. The Chicago Public Schools are listed as a participating agency in the City of Chicago’s evacuation plan, but detailed plans for the use of school buses for evacuation in a major emergency have not been developed. 14 Approximately 80 percent of passenger rail operates on freight tracks in the Chicago area. Chicago’s Class I freight rail carriers have formed the Chicago Transportation Coordination Office (CTCO) to help coordinate freight and keep it moving in the Chicago area. Although CTCO has no formal role in the city’s evacuation plan, discussion is under way to see whether the alert system now used to communicate with freight carriers when congestion is heavy could also be used to direct freight traffic in an emergency.
72 Special Report 294: The Role of Transit in Emergency Evacuation
transport. Amtrak did station 24 passenger railcars outside New Orleans during the 2006 hurricane season (MIPRC 2006), providing the capacity to evacuate nearly 2,000 people,15 but further deployment of Amtrak equipment in the Gulf Coast region has not occurred. Ferries Ferries can serve as a mode of evacuation in an emergency. Although they are less ubiquitous than other modes of transport, ferries played an important role in the evacuation of Lower Manhattan following the strikes on the World Trade Center. As discussed briefly in the previous chapter, between 300,000 and 500,000 people were evacuated by ferry in the 6 to 7 hours following the terrorist attack (Kendra et al. 2003). In addition, ferries helped transport emergency personnel and supplies to the incident site. NYCOEM and the New Jersey Office of Emergency Management (OEM) are currently working on a joint agreement with five major private ferry companies to help return New Jersey commuters from Manhattan in the event of a future emergency evacuation, and new berths have been provided for docking at Liberty State Park, which will operate as the main reception center in northern New Jersey. Ferries do not play a role in the other four case study sites. However, a case study of the San Francisco Bay Area was brought to the attention of the committee, in which the role of ferries in that area’s emergency plans was discussed.16 The role of ferries following the Loma Prieta earthquake was described in the previous chapter. However, that response was an ad hoc effort. The San Francisco Bay Area Water Transit Authority (WTA) was created in 1999 by the State Assembly to develop a comprehensive water transit system for the area and help provide some structure to a highly balkanized ferry system. Working together with the Metropolitan Transportation Commission (MTC), the MPO for the San Francisco−Oakland Bay Area, and the California Department of Transportation (Caltrans)—the lead agencies for coordinating transportation response in an emergency—WTA developed a Regional Maritime Contingency Plan. The plan provided the first comprehensive inventory of vessels and terminals in the bay and an extensive list of contact information for the many ferry operators, ports, marinas, and other affected regulatory agencies.17 WTA was recently reconstituted by the state with an increased focus on emergency response. One of its key tasks is to prepare an emergency water transportation system management plan in the next 12 to 18 months. Until the plan is completed, WTA staff believe that sufficient understanding exists with MTC and Caltrans to make the contingency plan operable in the event of an emergency.
15 With funding from the Federal Railroad Administration (FRA), 24 railcars were taken out of storage and updated to meet FRA standards. The vehicles can be deployed on short notice, but the City of New Orleans is responsible for processing eligible passengers (ambulatory individuals without pets) and providing shelter at the train’s destination. 16 The case study, which is unpublished research, was conducted by the Taubman Center for State and Local Government at the John F. Kennedy School of Government, and will be integrated into a larger, forthcoming study on emergency evacuation. 17 WTA identified the number of boats available for an evacuation, details on marinas and docks and which boats are compatible with which docking facilities, and contact information for ferry operators. Challenges that remain include limited docking capacity and fuel supplies; land access to the ferries in the event of an earthquake; and most important, lack of a central authority for coordinating independent ferry operators.

Evidence from the 38 Largest Urbanized Areas 73
Factors That Enhance the Role of Transit The case studies are instructive in identifying and providing good examples of the many factors that make transit a successful partner in emergency evacuation. Full Partnership in Evacuation Planning and Maintaining Plan Currency Emergency managers have the primary responsibility for developing local emergency response and evacuation plans, but ensuring workable plans requires consultation and coordination with primary support agencies. In all the case study sites, transit agencies are full partners with emergency managers in emergency evacuation plans. Those transit agencies with the most active roles have close working relationships with local emergency managers.
The most detailed roles for transit in emergency evacuation are evident at those sites where emergency planning is focused on advance-notice incidents, such as the hurricane evacuation plans for Houston, Tampa, and New York. At those sites where no-notice incidents are more likely, emergency plans are more process oriented, providing a general framework for emergency response and evacuation. Plans are concentrated on clear organization and assignment of responsibilities, including those of transit agencies; mechanisms for coordination of agency personnel and assets; and a scalable response, depending on the magnitude of the emergency incident. Chicago, New York, and Los Angeles provide good examples of this more process-oriented approach. In New York, for example, the Areawide Evacuation Plan developed by the New York City OEM contains a separate transit agency coordination document, which lays out general notification and coordination principles, including the primary role of each transit provider and the main points of contact in an emergency. In Chicago, each transit agency has its own emergency evacuation plan, but the plans are part of the overall evacuation plan for the central business district and mirror the graduated emergency activation framework of that plan to ensure operational consistency. In all cases, transit agencies helped keep evacuation plans up-to-date by periodically reviewing equipment availability and emergency contact information. Integral Role in Emergency Operations and Communications Capabilities In general, transit agencies at the case study sites are well integrated into emergency operations plans that go into effect in the event of an emergency incident. In all the case study sites, senior-level transit staffs are part of the decision-making team and represented at the principal emergency operations center (EOC)—the command center for emergency operations, activated in the event of a major incident. Where multiple transit agencies are involved—in New York, Los Angeles, and Chicago—the largest transit agency (or agencies) serves as the primary point of contact at the EOC and has responsibility for coordinating the response of the other transit service providers.
Transit agencies at each site also have the capability to communicate with area emergency managers and with other transit providers in real time. Most transit agencies have their own EOCs to direct agency personnel during an emergency. Those transit agencies represented at the principal EOC must have means of communicating with the command centers of individual transit agencies; in turn, transit agencies must be able to communicate with one
74 Special Report 294: The Role of Transit in Emergency Evacuation
another.18 Fully interoperable communications systems are not the norm at the case study sites, the exceptions being Hillsborough County in Tampa and Orange County in Los Angeles. The more typical arrangement is for communications from the EOCs to be handled through a variety of means, including hard-line, cell, and satellite phones; radios; and text messaging systems.
Transit providers also have numerous ways of communicating with one another. In Chicago, for example, all major transit agencies, Amtrak, and commuter rail are linked through the Chicago Transit Alert Network, which provides for telephone contact and, more recently, a secure platform for real-time text messaging among networked partners. In New York, transit agencies can use TRANSCOM, an electronic communications system, to communicate with one another.19 At two of the case study sites, Houston and Chicago, EOCs are collocated with state-of-the art transportation management centers (TMCs)—Transtar in Houston and the Joint Operations Center in Chicago.20 TMCs provide valuable information about real-time traffic conditions and incidents that can be of great use to emergency managers in coordinating with transit and other transportation agencies in an emergency evacuation.21 Public outreach both in advance of and during an emergency is critical to an orderly evacuation, including evacuation by transit. Transit users needs to know how to access the system in an emergency (e.g., assembly points for bus riders) and where they will be taken (e.g., shelter locations). In all the case study sites, public outreach, particularly in advance of an emergency, was handled by the emergency management agency and, in the case of Tampa, by the MPO. The Tampa Bay Regional Planning Council (TBRPC), in partnership with area counties, prepares annual hurricane guides in English and Spanish, which include a county map showing evacuation zones, county shelters, and key contact information. Local broadcast and print media sponsors, post offices, libraries, civic organizations fire departments and other government offices distribute copies widely. The guides are also posted on TBRPC and county websites, and immediately in advance of hurricane season, information on evacuation zones is included in utility bills. Finally, an extensive hurricane information program has been developed for public housing residents, and special efforts are made to inform the homeless and the disadvantaged about transportation and shelter resources in an emergency evacuation. In New York, which does not have a culture of evacuation as does the Gulf Coast, NYCOEM sent all New York City residents who live in an evacuation zone the Ready NY Guide, a brochure that tells residents how to prepare for an emergency and whom to contact for assistance. To the extent they are deployed, 511 traveler information systems hold promise as another tool in a multi-layered strategy for emergency communications with the public.22
18 In New York, lack of communications among MTA agencies during extensive flooding on August 8, 2007, which shut down much of the rail transit system, made it difficult to assess conditions in real time and provide timely information to customers about service changes. As a result, an MTA-wide EOC is being established to coordinate activities and communications among MTA agencies. 19 TRANSCOM is used by a coalition of 16 transportation and public safety agencies in the New York–New Jersey and Connecticut region, whose primary mission is to collect and disseminate real-time regional information on traffic and transportation management to member agencies. 20 The District of Columbia has likewise opened a joint emergency management/transportation management center. It also serves as a communications hub for underground operations in the Metro system (AASHTO Journal 2006). 21 EOCs can be virtually linked to TMCs if security or other concerns (e.g., damage in an earthquake or severe storm or cost) preclude physical collocation. 22 As of February 2008, the 511 Coalition reported that there were forty two 511 services operating in 33 states and available to about 47 percent of the U.S. population (511 Coalition 2008). Issues with respect to the use of such systems include cost and manpower, scalability (capacity to handle a large volume of calls in an emergency), greater

Evidence from the 38 Largest Urbanized Areas 75
Transit agencies are more directly involved in communicating with both general transit riders and special-needs populations who may require transportation assistance at the time of an emergency, particularly if evacuation is necessary. In the event of an emergency in New York, for example, transit agencies will communicate with their customers through public address systems on station platforms, on trains, and in terminals; through announcements and postings by station agents; on websites and through text messages to subscribing customers; and through messages that NYCOEM can help disseminate. If an evacuation is required, transit supervisory and station staff will help direct passengers to the correct train or bus to access public evacuation centers, and announcements will be made on board. At stations where service will be increased, additional station agents and supervisors will be present to help control crowds and provide customer information. In Los Angeles, many transit providers will rely on the media, including Spanish and other language radio and television stations, to reach transit-dependent populations.
The dominant means of communicating with special-needs populations at the case study sites are centrally dispatching 311 systems or alerts sent by reverse 911. Direct calls to transit service providers are discouraged. In New York and Los Angeles, which have large concentrations of special-needs populations, the interviewees expressed concern that the capacity of these systems would be overwhelmed with the high volume of calls in a major emergency. The smaller Tampa UA, where the size of special-needs populations is more manageable, provides a good example of one of the most thorough communications systems for special-needs populations. When an emergency alert is called, those who have signed up on a special registry are contacted both to verify their need for transportation assistance and to tell them when equipment is on the way. Citizens’ information action centers also handle special-needs call-ins, identifying what services are needed and providing that information to the appropriate responders. Once shelters are open and evacuation has begun, citizens’ information action center staff in Hillsborough County complete the application forms of last-minute callers and fax them directly to the appropriate department of health and transportation agency staff in the EOC for action. In Pinellas County, last-minute calls are handled through 911 and dispatched to the appropriate fire department for response. Participation in Exercises and Drills Transit agencies in Houston, Tampa, and New York have all have had experience with a major emergency evacuation. In several of the case study sites, transit agencies are involved in annual emergency exercises and drills, an important means of practicing for an emergency evacuation. In the Tampa UA, for example, Hillsborough County has an aggressive program that involves about 8 to 10 exercises and drills each year, including an annual hurricane exercise. Most of the exercises involve activation of the EOC and after-action reviews, and transit agencies and the county school district generally participate. Neighboring Pinellas County holds at least two major exercises annually—one is a hurricane exercise, and the other involves a scenario that varies each year so that all major elements of the emergency plan and participating organizations, including transit, are tested within a 5-year period. Tabletop exercises and drills have also been undertaken in Los Angeles, New York City, and Chicago, with transit agencies participating in some cases. Of course, transit providers also gain considerable practice in
familiarity of the public with other media outlets (e.g., radio and TV broadcasts), and the availability of more targeted emergency notification methods (e.g., Reverse 911).

76 Special Report 294: The Role of Transit in Emergency Evacuation
moving large numbers of people for major planned events every year, such as annual Fourth of July fireworks celebrations and New Year’s Eve events. Plans for Workforce Availability, Asset Deployment, and Fuel Supplies The critical importance of having sufficient drivers in an emergency evacuation is recognized by all the transit agencies interviewed during the site visits, yet few of the sites have family assistance programs to help ensure that drivers will show up for work. In New York, the MTA is working on such a plan. In Tampa, transit agencies use an alternative approach, asking for volunteer drivers who sign up in advance of hurricane season. Hillsborough County has instituted a countywide policy that all employees must have a disaster plan. The Know Your Role Program involves filling out a form indicating job criticality,23 primary and alternative job locations, individual employee evacuation plans, childcare needs, and skills (e.g., commercial driver’s licenses) that can be used in an emergency; these data are entered into a database to help match employee availability and skills with potential needs in an emergency. Pinellas County has a similar program for its employees.
As discussed earlier, availability of drivers can be a problem, particularly when transit service is contracted out, a common arrangement for paratransit services; the contracting agency has less direct control over both drivers and equipment. Driver responsibility in an emergency evacuation can be clarified to help ensure driver support and participation. Some of these issues can be addressed in contract negotiations. Even for those agencies with in-house staff, however, drivers are likely to live throughout a region, so there is no guarantee they can reach their work location in an emergency of any size. Backup plans are critical, such as identifying managers with commercial driver’s licenses who could fill in should there be a driver shortfall. Another approach under consideration in the San Francisco Bay Area, which has multiple transit agencies, is to pre-identify specific locations throughout the area where transit workers could check in for duty in the event of a no-notice emergency. The idea is to deploy drivers and maintenance crews to the closest transit system, even if it is not their own. Because many transit agencies have the capability to map the home locations of employees, notifications to these employees can be more specific once the location of an emergency incident is known. Because of the importance of transit worker availability in an emergency evacuation, identification and evaluation of the effectiveness of workforce family evacuation assistance programs and other workforce availability plans are suggested as research topics (see Chapter 5). Asset deployment—both getting equipment to where it is needed in an emergency and securing it well before an advance-notice event—is critical to transit response capacity in an evacuation, as well as to recovery. Transit providers in several of the case study sites indicated that the most difficult time to ensure adequate availability of drivers and equipment is off-peak hours. This is the case in Chicago, and good communication links have been established among transit agencies to try to minimize response delays. Areas that face storm surge and flooding from severe storms, such as Tampa and New York, have plans for shutting down service before the predicted onset of sustained gale-force winds so that personnel and equipment can be moved to safe locations.
23 There are four categories of job criticality: A—critical employees (e.g., fire, police, emergency managers), who will shelter at the job; B—employees who should be available immediately after a storm to help restore services; C—employees who will not be needed for several days after a storm; and D—employees who are granted an exemption from participating in response efforts (e.g., caretaker for an elderly or disabled family member).
Evidence from the 38 Largest Urbanized Areas 77
Fuel availability can also be an issue. For example, if buses are to be used for a sustained period in an emergency evacuation, those that use compressed natural gas or other alternative fuels, such as many transit buses in the Los Angeles area, could face difficulties in refueling, because these fuels are not widely available across the region. In hurricane prone areas, adequate reserves of fuel in protected locations (i.e., that will not be exposed to flooding and storm surge) and along evacuation routes is critical both to sustained use of transit and other vehicles (e.g., school buses) in an evacuation as well as in recovery. Transit agencies and school bus systems, among others, should be aware of the location of fuel reserves and prepositioned fuel depots along evacuation routes, to the extent such routes have been designated, and provision should be made in advance of an emergency for how fuel supplies will be deployed and who will have priority in the event of a shortage. Mutual-Aid Agreements Mutual-aid agreements among transit agencies can help stretch existing resources, particularly during periods of surge demand in a major evacuation, and some of the case study sites have such arrangements. Houston METRO, for example, has an agreement with neighboring Galveston to make available 30 METRO or contract buses in the event of an incident requiring mandatory evacuation of the city. The agreement spells out reimbursement details, indemnification and insurance issues, and the terms of agreement renewal or termination. Transit agencies in the Tampa area are concerned primarily with in-county evacuations. Nevertheless, if an emergency incident required evacuation beyond county lines, transit assistance from other counties and municipalities or the state could be provided through the statewide mutual-aid agreement to which most counties are signatory.24 Finally, although emergency managers are not planning for a mass evacuation in the Los Angeles area, if a major incident should occur, California has a long history of voluntary mutual-aid agreements among police and fire and, in some cases, transportation providers, which have worked well in the past to meet emergency needs if a particular community is overwhelmed. Factors That Limit the Role of Transit The ability of transit to play an effective role in an emergency evacuation depends on the integrity of the system itself, as well as on factors that fall largely outside of transit agency control. Emergencies That Compromise or Limit Transit Service The case studies provide good examples of situations that have limited or could constrain transit’s capacity to participate in an emergency evacuation because of possible damage to the system. In New York, for example, rail transit, commuter rail, and Amtrak service was suspended immediately after the terrorist attack on the World Trade Center. Although partial subway service was restored after a few hours, buses and ferries filled the initial breach in service. If another terrorist event were to occur, transit agencies would follow the same policy
24 Executed in 1994, the Statewide Mutual Aid Agreement is a voluntary arrangement between the State of Florida and counties and municipalities. More than 98 percent of counties and municipalities in the state have signed the agreement.
78 Special Report 294: The Role of Transit in Emergency Evacuation
and immediately shut down service until the integrity of the system could be verified. Transit service in areas affected by earthquakes would be similarly affected. Should an earthquake occur in Los Angeles, for example, the MTA would suspend transit service in the vicinity of the site until the integrity of the viaducts and overpasses used by the buses could be ascertained. BART was shut down immediately following the Loma Prieta earthquake because of concerns about the viability of the underwater trans-bay tube, and thus was unable to play a role in moving passengers immediately after the earthquake. Lack of a Regional Approach to Evacuation Few of the case study sites have planned for a major disaster that could involve multiple jurisdictions or states in a region and require the evacuation of a large fraction of the population, much less considered the role of transit in such an evacuation. Houston is the obvious exception. Hurricane Rita forced the Houston UA to confront the complexities of a regional evacuation, and subsequent emergency planning has focused on a more regional approach to evacuation and a stronger state role to help broker arrangements with pass-through and destination jurisdictions should a major evacuation of Houstonians prove necessary in the future. Houston Metro has a major role in such plans, reflecting in part its broader range of responsibilities relative to what is typical of many transit systems.25 In Florida, the state is working through regional planning councils to develop a statewide evacuation plan that would link and presumably help fill gaps in individual county emergency evacuation plans. Other areas, such as New York and New Jersey, are working on plans for more limited evacuations. Phase I of the Trans-Hudson Emergency Transportation Plan, for example, involves a partial evacuation from Manhattan to northern New Jersey; New Jersey Transit (NJT) and private ferry companies are part of the planning effort. The strategy is to start with a more limited scenario and build toward more significant events that would affect much larger areas and involve more jurisdictions. In all the sites visited, even Houston, emergency managers are working to reduce demand for evacuation and encourage sheltering in place, where appropriate. This approach reflects the low probability of an emergency requiring a mass evacuation and the questionable feasibility of evacuating a major city successfully. The focus is on confining an evacuation or planning for a partial evacuation of the central business district or other vulnerable parts of a UA (e.g., coastal areas vulnerable to a tsunami, areas near a port that could be impacted by a hazardous materials incident). However, even these more limited scenarios could involve multiple jurisdictions and states. Accordingly, Chicago, Los Angeles, and New York have assembled multijurisdictional and in some cases multistate teams to begin the process of developing more coordinated regional evacuation plans for use during a major disaster. Transit agencies are part of the team, but planning is in the initial phases and progress is slow. It may be hoped that the new DHS Regional Catastrophic Preparedness Grant Program, for which all of the case study sites except Tampa are eligible, will help jump start these efforts.
25 Supported by a 1-cent sales tax, METRO operates a large bus fleet, a downtown light rail system, and demand response service. The agency also operates an extensive network of high-occupancy vehicle lanes along major freeways and a motorist assistance program.

Evidence from the 38 Largest Urbanized Areas 79
Congestion and Capacity Constraints The older UAs visited—New York and Chicago—have extensive rail and bus transit systems, which are an asset in an emergency evacuation. As discussed earlier, the redundancy of the rail system in New York proved its worth in the evacuation of parts of Lower Manhattan following the terrorist strike on the World Trade Center. In both New York and Chicago (and probably many other older areas), however, rail transit shares track with intercity passenger rail (Amtrak) and freight rail. In New York, NJT-Rail operates on Amtrak-owned track, and Amtrak-owned Pennsylvania Station is its principal terminal in Manhattan. There is no memorandum of understanding on which system takes precedence in an emergency. A new tunnel is being constructed under the Hudson River that should nearly double NJT-Rail capacity and service to Manhattan and provide redundancy at a critical point in the system. In Chicago, emergency managers are working with freight carriers to devise operational solution that would give local transit agencies and Amtrak precedence in the event of an emergency evacuation.
Were the rail systems of either New York or Chicago to be compromised, movement by bus would be difficult, particularly in the highly congested central business districts. The New York City DOT has detailed plans for handling pedestrian and vehicle conflicts, which are being coordinated with the MTA, but they have not yet been tried out. Contraflow lanes in New York City are viewed as impractical. As part of the Trans-Hudson Emergency Transportation Plan, however, the New York Police Department will secure streets around the Port Authority Bus Terminal during an evacuation to facilitate NJT-Bus traffic on dedicated lanes through the Lincoln Tunnel and on the New Jersey Turnpike to Liberty State Park, the main reception center in northern New Jersey. In a Level-III (worst-case) evacuation in Chicago,, the city’s Office of Emergency Management and Communications would likely request activation of the state plan, which provides for a last-resort contraflow arrangement on Chicago freeways to evacuate the central business district. According to CTA, the reversible commuter lanes on these freeways could be used for buses to help expedite the evacuation.
Highway congestion and capacity issues are also a problem in newer areas with large bus transit systems, such as Houston, and rapidly growing areas, such as Los Angeles. Hurricane Rita demonstrated the capacity shortfalls that can hamper an evacuation if it extends into suburban and exurban areas. For example, multilane freeways narrowed to two lanes about 70 miles from downtown Houston, creating massive traffic bottlenecks. No plans had been developed for contraflow, although the state, at the urging of METRO and others, opened contraflow lanes to ease the congestion. Occupancy restrictions were also dropped on high-occupancy vehicle (HOV) lanes, but all lanes were operated in a northbound direction, with no provision for access by emergency vehicles or for buses or emergency vehicles that needed to make multiple trips. Moreover, cameras and other intelligent transportation systems (ITS) technologies that support traffic management at TranStar did not extend into rural areas.
Los Angeles has an extensive bus transit system, but as the most congested of all the 38 UAs, it would face great difficulty in using bus transport for any distance in an emergency evacuation. The Los Angeles County OEM has identified major evacuation routes, and certain freeway lanes have been dedicated for ingress by emergency vehicles, but the actual routes are to be determined at the time of an incident. Given the level of congestion and the no-notice nature of most disasters facing the Los Angeles UA, it appears that the role of transit in emergency evacuation would be limited.

80 Special Report 294: The Role of Transit in Emergency Evacuation
Traffic congestion is also a major obstacle to successful emergency evacuation in the Tampa UA. The region has a limited number of major highways, and chokepoints are likely to clog roads not only with evacuating county residents, but also with other evacuees from southwest Florida in the event of a major hurricane. Transportation officials are attempting to alleviate some of the problems through use of ITS technologies and contraflow operations (in Hillsborough County only) on area highways. Both Hillsborough and Pinellas Counties have the capability to change signal timing, if necessary, to keep traffic moving on evacuation routes. Buses and vans, however, must operate on local streets, and little can be done to control congestion. These conditions, together with the relatively small size of county transit operations, limit the use of transit to in-county evacuations. Inadequate Funding Removing many of the obstacles discussed in the previous section will require major capital improvement projects—lane additions and interchange improvements on highways, for example—that must compete with other transportation projects for federal and state funding. Even operational measures, such as greater use of ITS technologies or contraflow operations on freeways, can involve significant costs. The case studies provide some examples of states that have been proactive in addressing these needs. Following Hurricane Rita, the Texas DOT installed 80 new web-accessible cameras in rural areas, as well as electronic signs at points where highways converge that will be used to disseminate information to evacuees such as shelter locations in the event of another major evacuation. The state also has provided funding for towing contracts during hurricane season. The State of Florida is notable for the funding it provides for emergency response, which can be used for special-needs populations. The state collects $2 from homeowners insurance policies and $4 from business insurance policies annually, which is placed in an Emergency Management and Preparedness Assistance Trust Fund and distributed annually in the form of competitive grants for emergency management (no larger than $200,000 per grant) to state or regional agencies, local governments, and private nonprofit organizations.26 Funding priorities currently include public education on disaster preparedness and recovery, coordination of relief efforts of statewide private-sector organizations, and improved training and operations capabilities of agencies with lead or support responsibilities in the Florida Comprehensive Emergency Management Plan. FINDINGS In this chapter, the committee has attempted to provide a picture of the role of transit in the evacuation plans of the nation’s 38 largest UAs. The statistical profile of the UAs suggests a diversity of conditions that makes it difficult to generalize—differences in the size and density of their populations, the size and coverage of the major transit systems that serve them, the types of emergencies they face, and their jurisdictional complexities. One common element among most of the UAs is their relatively large numbers of special-needs populations, who are potential users of transit in an emergency. Moreover, with the exception of some of the largest UAs (e.g.,
26 A competitive grant program is also available to municipalities that have an emergency management program and are signatories to the Statewide Mutual Aid Agreement. Eligible grantees may apply annually for one grant, not to exceed $50,000.
Evidence from the 38 Largest Urbanized Areas 81
Chicago, Los Angeles, New York, San Francisco), the gap between the numbers of carless households and the supply of transit equipment is large. The numbers of paratransit and other demand response vehicles are particularly low relative to the size of populations with disabilities who need such vehicles for transport in an evacuation. In addition, the location of special-needs populations in a particular UA, their actual need for transit in an emergency evacuation, and the availability of drivers and equipment to serve them at the time of an incident remain largely unknown.
Similarly, the committee could not assess with any reliability the extent to which transit is included in the emergency response and evacuation plans of the 38 UAs. The plans of 11 of the 16 UAs with publicly available on-line documents mention transit, but sufficient detail is provided in only 7 to indicate a credible role for transit in evacuation plans. The committee’s five in-depth case studies proved to be a more rewarding source of information, but that information cannot be generalized to the other 33 UAs. Nevertheless, the case studies illustrate the wide range of roles transit can play in emergency evacuation and raise many issues likely to affect its role in other UAs. The primary role for transit is to evacuate those without a car, either by bus or by rail, away from an emergency site to area shelters or outside the UA during a major disaster. Transit’s role in evacuation can be augmented by other modes of public transport, such as school buses, commuter and intercity rail, and ferries, as evidenced by several of the case studies.
Transit has a special role to play in evacuating special-needs populations. Many are likely to need assistance and require trained drivers or, at minimum, accessible equipment, which is often provided by paratransit operators. The emergency evacuation of special-needs populations, however, poses a major challenge in all the case study sites with the exception of Tampa, which has targeted its transit and school bus resources to evacuating these populations. In the other case study sites, the large size of special-needs populations and the no-notice nature of many of the incidents faced increase the complexity of both identifying and planning for the evacuation of these groups.
Another role for transit is to bring emergency responders and equipment to incident sites. Finally, transit can aid in recovery, both in returning evacuees to their initial point of departure and in providing general transport following an emergency if travel by private vehicle is difficult.
The most detailed roles for transit are found in the plans of those case study sites that face advance-notice incidents, such as hurricanes. Emergency evacuation plans and transit’s role in those plans are more process oriented in those sites where no-notice incidents are more likely. Together, the case studies suggest many of the factors that can make transit a successful partner in evacuation. These include collaboration with emergency managers in evacuation planning and integration with emergency operations plans. In all the case study sites, the primary transit agencies are part of evacuation plans; transit staffs are represented on the decision-making team when activation of EOCs is required; and transit operators have the capability of communicating with emergency managers and with other transit providers in real time, although few have fully interoperable systems. Communication with potential transit users, both the general public and special-needs populations, is recognized as critical, both in advance of and particularly during an emergency, but the case study sites vary in their approaches to and the effectiveness of their communications. Transit agencies participate in exercises and drills in several of the case study sites, an important means of practicing for an emergency evacuation. Finally, plans for workforce availability, asset deployment and safety,
82 Special Report 294: The Role of Transit in Emergency Evacuation
and mutual-aid agreements to help meet surge demands in an emergency evacuation are all recognized as important to the successful use of transit, but are addressed to varying degrees by the case study sites. The case studies also suggest the limits of transit’s role in an emergency evacuation. The most obvious limit is damage to the system itself. In the event of an earthquake in Los Angeles or another terrorist event in New York City, transit operators would shut down service until the integrity of the system had been verified. Another limitation is the lack of a regional approach to evacuation and the use of transit. Few case study sites had planned for a major disaster and integrated transit agencies into an evacuation scenario that could involve multiple jurisdictions and states in a region. Emergency planners have begun to develop more coordinated regional evacuation plans, and some transit agencies are part of these efforts, but progress is slow. New DHS grant funds for regional catastrophic preparedness could help, but the funds are currently limited to the largest urban areas.
A third limitation is the fact that transit systems operate as part of a transportation network in a UA and thus may be hampered by system congestion and capacity constraints in an evacuation—issues largely outside their control. Bus systems, which operate on area highways, are particularly vulnerable to local congestion and capacity bottlenecks. The problems are especially acute in the central business districts of large UAs, such as New York and Chicago, where buses have to negotiate both pedestrian and vehicular traffic. But congestion and capacity constraints are also manifest in newer UAs such as Houston, or at the suburban or exurban fringe of UAs both new and old should an evacuation extend outside the UA, as it did during Hurricane Rita. Those UAs having extensive and redundant rail networks with good system connectivity possess an important asset in an emergency evacuation, as was amply demonstrated in New York City and Washington, D.C., in the aftermath of the terrorist attacks of September 11. Few UAs, however, have such extensive rail transit systems.
The solutions to many of these limitations, particularly those involving capacity additions and removal of bottlenecks, require long-term capital funding from both federal and state sources and must compete with other budgetary priorities. Improving the efficiency of existing operations through deployment of ITS technologies and contraflow operations on selected highways, where conditions permit, can be effective, but these solutions also require funds. The case studies provide examples of states, such as Florida and Texas, that play an important role in funding projects aimed at improving evacuation capability, largely to address the recurring hurricanes to which these areas are susceptible. Even among the case study sites, however, such support is the exception rather than the rule. In the following and final chapter, the committee’s recommendations with respect to funding as well as a range of measures that could enhance transit’s role in emergency evacuation are presented. REFERENCES Abbreviations AASHTO Association of American State Highway and Transportation Officials
DHS Department of Homeland Security MIPRC Midwest Interstate passenger Rail Commission

Evidence from the 38 Largest Urbanized Areas 83
AASHTO Journal. 2006. D.C. Opens New Emergency Call Center for Multiple Jurisdictions. Vol. 106, No. 39.
DHS. 2006. Nationwide Plan Review, Phase 2 Report, June 16, http://www.dhs.gov/xlibrary/assets/Prep_NationwidePlanReview.pdf.
511 Coalition. 2008. Resource 511. Usage Statistics. Accessed on line at http://www.deploy511.org. Liu, B. F. 2008. Online Disaster Preparation: Evaluation of State Emergency Management Web Sites.
Natural Hazards Review, Vol. 1, No. 9, pp. 43–48. Kendra, J., T. Wachtendorf, and E. Quarantelli. 2003. The Evacuation of Lower Manhattan by Water
Transport on September 11: An Unplanned “Success,” Forum. Joint Commission Journal on Quality and Safety, Vol. 29, No. 6, pp. 316–318.
MIPRC. 2006. Responding Regionally: The Role of Passenger Rail in Midwestern Emergency Planning. http://www.miprc.org/portal/uploads/lkliewer/MIPRC_rail_&_emergency_preparedness_report.pdf.

84 Special Report 294: The Role of Transit in Emergency Evacuation
ANNEX 4-1
Detailed Statistical Profile of 38 Urbanized Areas
Size Demand Carless Householdsc
Urbanized Area Population
(2000)a
Land Area
(square mile)a
Transit Service Area of Largest
Provider (square mile)b
Transit Population Served of Largest
Providerb
Housing Units
without Cars
Percent of
Housing Units
without Cars
Atlanta 3,500,000 1,963 498 1,355,000 99,835 8Baltimore 2,076,000 683 1,795 2,078,000 132,965 16Boston 4,032,000 1,736 3,244 4,510,000 219,213 14Chicago 8,308,000 2,123 356 3,709,000 436,049 15Cincinnati 1,503,000 672 262 845,000 64,934 11Cleveland 1,787,000 647 458 1,412,000 83,920 12Columbus 1,133,000 398 325 1,058,000 37,761 8Dallas–Fort Worth–Arlington 4,146,000 1,407 689 2,250,000 99,384 7Denver–Aurora 1,985,000 499 2,326 2,598,000 59,522 8Detroit 3,903,000 1,261 144 951,000 147,695 10Houston 3,823,000 1,295 1,285 2,797,000 108,281 11Indianapolis 1,219,000 563 373 792,000 37,801 8Kansas City 1,352,000 584 396 757,000 43,034 8Las Vegas 1,314,000 286 280 1,785,000 47,282 10Los Angeles–Long Beach–Santa Ana 11,789,000 1,668 1,224 8,493,000 437,913 11Miami 4,919,000 1,116 306 2,380,000 207,476 11Milwaukee 1,309,000 487 237 940,000 67,646 13Minneapolis–St. Paul 2,389,000 894 596 1,762,000 84,472 9New Orleans 1,009,000 198 75 485,000 70,328 18New York–Newark 17,800,000 3,353 321 8,008,000 2,102,874 32Orlando 1,157,000 453 2,538 1,537,000 29,700 7Philadelphia 5,149,000 1,800 836 3,331,000 319,899 16Phoenix–Mesa 2,907,000 799 515 1,439,000 76,756 7Pittsburgh 1,753,000 852 775 1,415,000 106,557 15Portland 1,583,000 474 574 1,254,000 55,749 9Providence 1,175,000 504 299 846,000 54,658 12Riverside–San Bernardino 1,507,000 439 2,725 1,498,000 39,397 9Sacramento 1,393,000 369 248 1,035,000 43,859 8St. Louis 2,078,000 829 574 1,007,000 81,489 10San Antonio 1,328,000 408 1,213 1,487,000 45,888 10San Diego 2,674,000 782 570 2,102,000 78,393 8San Francisco–Oakland 2,996,000 527 93 834,000 174,176 15San Jose 1,538,000 260 326 1,760,000 29,147 6Seattle 2,712,000 954 2,134 1,788,000 91,536 8Tampa–St. Petersburg 2,062,000 802 254 578,000 74,404 9Virginia Beach 1,384,000 527 369 1,211,000 45,688 9Washington 3,934,000 1,157 692 1,306,000 181,846 12San Juan 2,217,000 892 198 1,177,000 205,563 28

Evidence from the 38 Largest Urbanized Areas 85
Demand Seniorsd Recent Immigrantsd
Urbanized Area
Householder Living Alone and
>65
Percent of Households
Living Alone and >65
Number of Foreign Born, Entry >2000
Atlanta 68,919 5 182,576 Baltimore 76,045 9 49,914 Boston 152,326 10 171,643 Chicago 260,385 9 306,385 Cincinnati 58,458 10 20,416 Cleveland 79,579 11 21,365 Columbus 32,300 7 35,030 Dallas–Fort Worth–Arlington 86,658 5 242,703 Denver–Aurora 58,818 7 74,045 Detroit 146,170 10 91,839 Houston 78,596 5 229,066 Indianapolis 43,030 8 29,660 Kansas City 43,579 8 29,084 Las Vegas 42,834 8 70,321 Los Angeles–Long Beach–Santa Ana 288,083 7 683,329 Miami 223,250 11 393,540 Milwaukee 52,796 10 20,435 Minneapolis–St. Paul 73,789 8 72,670 New Orleans 35,367 10 7,979 New York–Newark 657,966 10 908,066 Orlando 31,915 7 50,621 Philadelphia 198,154 10 131,556 Phoenix–Mesa 95,320 8 168,031 Pittsburgh 97,264 13 15,620 Portland 50,581 8 62,927 Providence 51,435 11 30,213 Riverside–San Bernardino 30,418 6 66,254 Sacramento 45,412 8 74,672 St. Louis 76,789 9 34,783 San Antonio 35,303 7 46,073 San Diego 83,524 9 115,752 San Francisco–Oakland 107,709 9 187,222 San Jose 36,068 7 106,204 Seattle 84,942 7 124,766 Tampa–St. Petersburg 102,958 11 60,230 Virginia Beach 41,775 8 16,071 Washington 105,604 7 254,984 San Juan 66,603 9 18,048

86 Special Report 294: The Role of Transit in Emergency Evacuation
Demand Recent Immigrantsd Poor (below poverty line)e
Urbanized Area
Population >5 Years
Who Speak English Less Than "Very
Well"
Percent of Population >5
Years Who Speak English
Less Than "Very Well"
Population Living Below Poverty Line
Percent of Population
Living Below
Poverty Line
Atlanta 309,073 9 329,370 10Baltimore 75,010 4 223,637 11Boston 371,534 10 345,562 9Chicago 1,050,086 14 890,127 11Cincinnati 25,826 2 143,599 10Cleveland 60,570 4 195,668 11Columbus 46,106 4 122,682 11Dallas–Fort Worth–Arlington 670,082 17 462,881 11Denver–Aurora 189,556 10 163,522 8Detroit 186,787 5 434,974 11Houston 755,097 20 533,269 14Indianapolis 45,097 4 108,931 9Kansas City 55,819 4 124,340 9Las Vegas 203,416 15 141,432 11Los Angeles–Long Beach–Santa Ana 3,078,504 28 1,934,022 17Miami 1,101,880 23 676,102 14Milwaukee 63,524 5 149,701 12Minneapolis–St. Paul 137,853 6 171,317 7New Orleans 31,906 4 200,558 20New York–Newark 2,779,817 17 2,425,106 14Orlando 121,190 11 126,529 11Philadelphia 278,775 6 569,503 11Phoenix–Mesa 392,001 13 339,140 12Pittsburgh 26,208 2 180,555 11Portland 145,085 9 154,416 10Providence 103,217 9 137,423 12Riverside–San Bernardino 364,495 23 249,020 17Sacramento 173,921 13 181,692 13St. Louis 51,085 3 215,827 11San Antonio 190,012 15 205,654 16San Diego 401,071 16 326,304 13San Francisco–Oakland 597,956 21 306,923 10San Jose 318,718 23 114,229 8Seattle 249,789 10 235,272 9Tampa–St. Petersburg 131,549 7 226,341 11Virginia Beach 31,026 2 143,443 11Washington 472,303 13 301,542 8San Juan N.A. N.A. 954,400 44
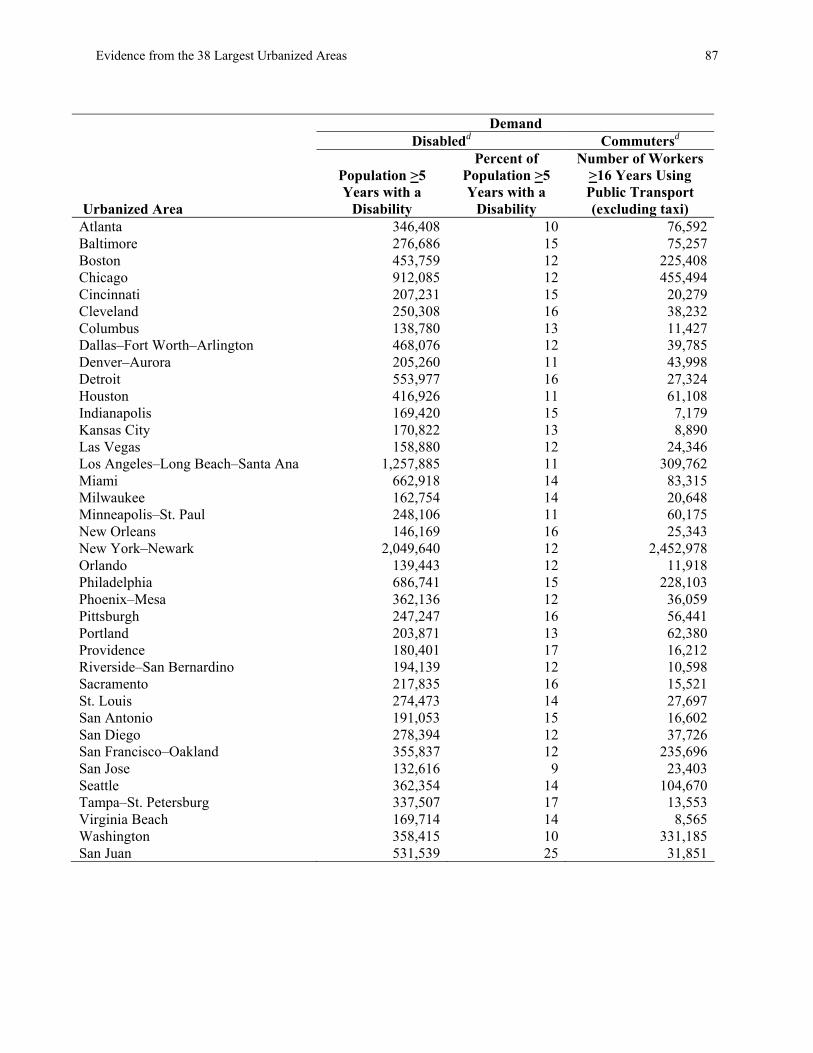
Evidence from the 38 Largest Urbanized Areas 87
Demand Disabledd Commutersd
Urbanized Area
Population >5 Years with a
Disability
Percent of Population >5 Years with a
Disability
Number of Workers >16 Years Using Public Transport (excluding taxi)
Atlanta 346,408 10 76,592Baltimore 276,686 15 75,257Boston 453,759 12 225,408Chicago 912,085 12 455,494Cincinnati 207,231 15 20,279Cleveland 250,308 16 38,232Columbus 138,780 13 11,427Dallas–Fort Worth–Arlington 468,076 12 39,785Denver–Aurora 205,260 11 43,998Detroit 553,977 16 27,324Houston 416,926 11 61,108Indianapolis 169,420 15 7,179Kansas City 170,822 13 8,890Las Vegas 158,880 12 24,346Los Angeles–Long Beach–Santa Ana 1,257,885 11 309,762Miami 662,918 14 83,315Milwaukee 162,754 14 20,648Minneapolis–St. Paul 248,106 11 60,175New Orleans 146,169 16 25,343New York–Newark 2,049,640 12 2,452,978Orlando 139,443 12 11,918Philadelphia 686,741 15 228,103Phoenix–Mesa 362,136 12 36,059Pittsburgh 247,247 16 56,441Portland 203,871 13 62,380Providence 180,401 17 16,212Riverside–San Bernardino 194,139 12 10,598Sacramento 217,835 16 15,521St. Louis 274,473 14 27,697San Antonio 191,053 15 16,602San Diego 278,394 12 37,726San Francisco–Oakland 355,837 12 235,696San Jose 132,616 9 23,403Seattle 362,354 14 104,670Tampa–St. Petersburg 337,507 17 13,553Virginia Beach 169,714 14 8,565Washington 358,415 10 331,185San Juan 531,539 25 31,851

88 Special Report 294: The Role of Transit in Emergency Evacuation
Supply
Urbanized Area
Density (population/ square mile)a
Number of Carsf
Number of
Busesg
Number of
Railcarsg
Number of Demand Response
Vehiclesg Atlanta 1,783 2,259,474 522 182 157Baltimore 3,041 1,199,359 786 222 230Boston 2,323 2,335,339 880 855 407Chicago 3,914 4,556,398 2296 2015 2274Cincinnati 2,238 988,620 325 0 43Cleveland 2,761 1,137,494 542 39 169Columbus 2,849 761,395 228 0 47Dallas–Fort Worth–Arlington 2,946 2,574,101 721 118 436Denver–Aurora 3,979 1,373,001 928 46 456Detroit 3,094 2,477,867 650 0 162Houston 2,951 2,218,830 1161 17 763Indianapolis 2,205 818,388 120 0 76Kansas City 2,330 918,514 220 0 123Las Vegas 4,597 769,220 270 0 172Los Angeles–Long Beach–Santa Ana 7,068 6,377,100 3785 337 1178Miami 4,407 2,833,715 1156 122 941Milwaukee 2,687 796,064 433 0 242
Minneapolis–St. Paul 2,671 1,574,425 970 23 400 (Minn.)/
423 (St. Paul)
New Orleans 5,102 527,750 306 66
111 New York–Newark 5,309 7,556,605 8413 8404 1727Orlando 2,554 740,354 197 0 183Philadelphia 2,861 2,861,024 1359 688 525Phoenix–Mesa 3,638 1,784,139 518 0 456Pittsburgh 2,057 1,069,874 997 55 420Portland 3,340 1,056,073 613 87 276Providence 2,332 720,713 208 0 120Riverside–San Bernardino 3,434 814,340 276 0 173Sacramento 3,776 878,390 226 56 98St. Louis 2,506 1,342,524 396 34 243San Antonio 3,257 756,094 355 0 181San Diego 3,419 1,639,155 567 28 560San Francisco–Oakland 6,130 1,749,161 1699 751 1806San Jose 5,914 1,019,342 366 34 192Seattle 2,844 1,886,777 1865 35 1829Tampa–St. Petersburg 2,571 1,330,955 303 8 142Virginia Beach 2,647 875,121 276 112Washington 3,401 2,389,134 1791 758 398San Juan 2,486 860,978 3303 0 38
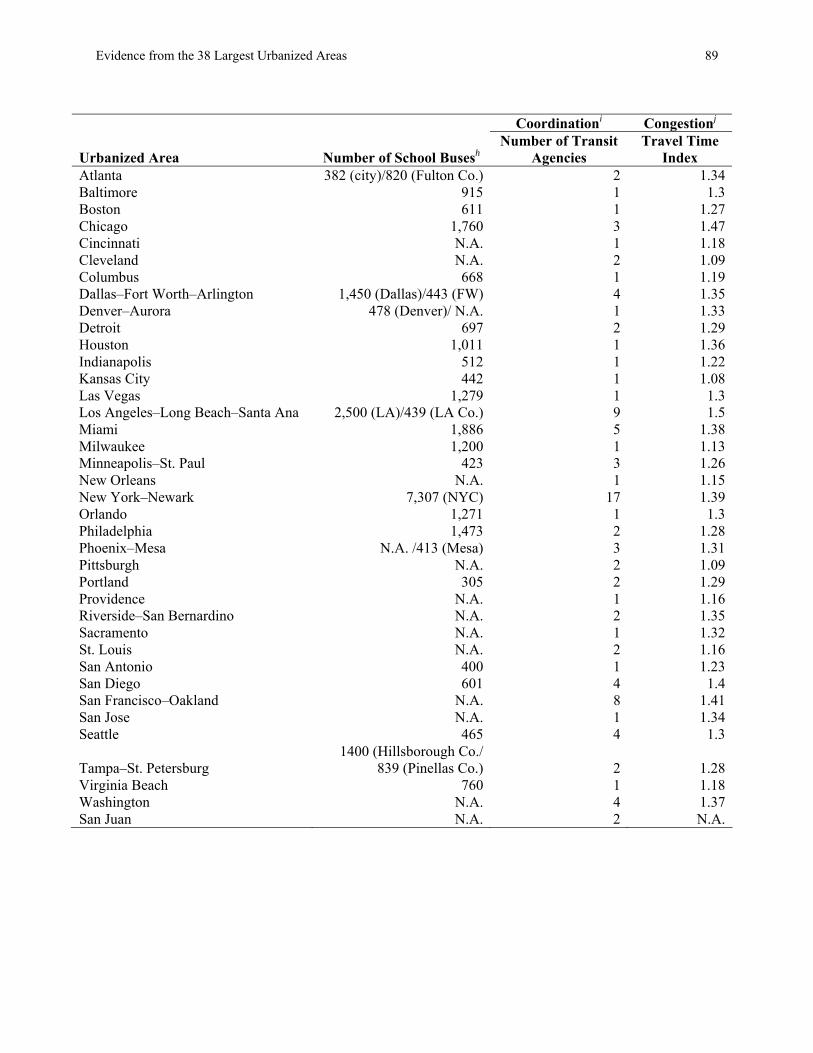
Evidence from the 38 Largest Urbanized Areas 89
Coordinationi Congestionj
Urbanized Area Number of School Busesh Number of Transit
Agencies Travel Time
Index Atlanta 382 (city)/820 (Fulton Co.) 2 1.34Baltimore 915 1 1.3Boston 611 1 1.27Chicago 1,760 3 1.47Cincinnati N.A. 1 1.18Cleveland N.A. 2 1.09Columbus 668 1 1.19Dallas–Fort Worth–Arlington 1,450 (Dallas)/443 (FW) 4 1.35Denver–Aurora 478 (Denver)/ N.A. 1 1.33Detroit 697 2 1.29Houston 1,011 1 1.36Indianapolis 512 1 1.22Kansas City 442 1 1.08Las Vegas 1,279 1 1.3Los Angeles–Long Beach–Santa Ana 2,500 (LA)/439 (LA Co.) 9 1.5Miami 1,886 5 1.38Milwaukee 1,200 1 1.13Minneapolis–St. Paul 423 3 1.26New Orleans N.A. 1 1.15New York–Newark 7,307 (NYC) 17 1.39Orlando 1,271 1 1.3Philadelphia 1,473 2 1.28Phoenix–Mesa N.A. /413 (Mesa) 3 1.31Pittsburgh N.A. 2 1.09Portland 305 2 1.29Providence N.A. 1 1.16Riverside–San Bernardino N.A. 2 1.35Sacramento N.A. 1 1.32St. Louis N.A. 2 1.16San Antonio 400 1 1.23San Diego 601 4 1.4San Francisco–Oakland N.A. 8 1.41San Jose N.A. 1 1.34Seattle 465 4 1.3
Tampa–St. Petersburg 1400 (Hillsborough Co./
839 (Pinellas Co.) 2 1.28Virginia Beach 760 1 1.18Washington N.A. 4 1.37San Juan N.A. 2 N.A.

90 Special Report 294: The Role of Transit in Emergency Evacuation
Disastersk Urbanized Area Predominant Type Atlanta Tornadoes, severe storms, heavy rain Baltimore Severe storms, hurricanes (flooding, tornadoes) Boston Flooding, severe storms (heavy rain, blizzards) Chicago Flooding, severe storms, tornadoes Cincinnati Severe storms, flooding, tornadoes Cleveland Severe storms, flooding, tornadoes Columbus Severe storms, flooding, tornadoes Dallas–Fort Worth–Arlington Severe storms, flooding, tornadoes Denver–Aurora Severe storms, flooding (wildfires, mudslides, landslides) Detroit Severe storms, flooding, tornadoes Houston Severe storms, flooding, tornadoes Indianapolis Severe storms, flooding, tornadoes Kansas City Severe storms, flooding, tornadoes Las Vegas Flooding, severe storms (heavy rain, wildfires) Los Angeles–Long Beach–Santa Ana Flooding, severe storms, landslides, mudslides, earthquakes Miami Hurricanes, flooding, tropical storms, severe storms, tornadoes Milwaukee Severe storms, flooding, tornadoes Minneapolis–St. Paul Flooding, severe storms, tornadoes New Orleans Severe storms (flooding, hurricanes, tropical storms) New York–Newark Severe storms, flooding, tornadoes Orlando Hurricanes, flooding, tropical storms, severe storms, tornadoes Philadelphia Flooding, severe storms, tropical depressions Phoenix–Mesa Severe storms, flooding, wildfires Pittsburgh Flooding, severe storms, tropical depressions Portland Severe storms, flooding (landslides, mudslides, earthquakes) Providence Blizzards Riverside–San Bernardino Flooding, severe storms, landslides, mudslides, earthquakes Sacramento Flooding, severe storms, landslides, mudslides, earthquakes St. Louis Severe storms, flooding, tornadoes San Antonio Severe storms, flooding, tornadoes San Diego Flooding, severe storms, landslides, mudslides, earthquakes San Francisco–Oakland Flooding, severe storms, landslides, mudslides, earthquakes San Jose Flooding, severe storms, landslides, mudslides, earthquakes Seattle Severe storms, flooding, landslides Tampa–St. Petersburg Hurricanes, flooding, tropical storms, severe storms, tornadoes Virginia Beach Severe storms, flooding, tornadoes Washington Severe storms (hurricanes, flooding, blizzards) San Juan Flooding, severe storms, hurricanes

Evidence from the 38 Largest Urbanized Areas 91
Note: N.A. = data not available. aSource: 2000 Census of Population and Housing as summarized in the Federal Transit Agency’s (FTA’s) 2005 National Transit Database. bSource: 2005 National Transit Database, profiles over and under 200,000 in population. cSource: 2000 Census of Population and Housing (SF3-Table H44). dSource: American Community Survey 2005. eSource: 2000 Census of Population and Housing (SF3-Table P88). fSource: 2000 Census of Population and Housing (SF3-Table H46). gIncludes all UA transit properties with >100 vehicles operated in maximum service (VOMS). Source: 2005 National Transit Database, Appendix D. Data for New Orleans are for 2004. hSource: School Bus Fleet 2005 Annual Top 100 School District Fleet Survey. iSource: 2005 National Transit Database, Appendix D. Includes all U.S. transit properties with >100 VOMS. Data for New Orleans are for 2004. jDefined as the ratio of peak-period travel time to free-flow travel time; used as a measure of congestion. A value of 1.35, for example, indicates that a 20-minute free-flow trip takes 27 minutes in the peak hour. Source: Schrank and Lomax, The 2007 Urban Mobility Report, Texas Transportation Institute. kSource: Federal Emergency Management Agency (declared disasters by state); top three disasters (disasters in parenthesis are tied with respect to frequency) and disasters that occurred more than five times in the past 15 years (1992–2006).

93
5
Enhancing Transit’s Role
he charge to this committee was to evaluate the role that transit systems could play in accommodating the evacuation, egress, and ingress of people from or to critical locations in
times of emergency. The focus of the study was on the transit systems serving the 38 largest urbanized areas (UAs) in the United States, and on major incidents that could trigger an evacuation of a major portion of a UA and require coordination of multiple jurisdictions and even multiple states.
In this final chapter, the committee presents its consensus findings and recommendations in response to its charge, along with its principal supporting arguments. The committee’s consensus position was informed by a literature review; briefings at its early meetings, an assessment of the role of transit in the publicly available on-line emergency response and evacuation plans of the 38 largest UAs, five in-depth case studies conducted for this study, and the committee’s own expertise and judgment.
The chapter starts with a summary of the status of emergency evacuation plans and transit’s role in those plans to set the context for the remainder of the discussion. The planning requirements for successfully incorporating transit as a full partner in planning for an emergency evacuation are then presented, and the range of operational roles transit can play in such an evacuation are discussed, including the unique role of transit in evacuating special-needs populations and the limits to transit’s participation. Next, complementary measures needed to enhance transit’s role are considered. The chapter ends with sections on research needs and next steps for moving forward that can be taken by the different levels of government that should be involved in enhancing transit’s role in emergency evacuation. SETTING THE CONTEXT The extent to which transit can be a successful partner in an evacuation depends first on good local emergency response plans. Emergency managers have the primary responsibility for developing such plans, and police, fire, and emergency medical services personnel have the lead role as first responders in any evacuation that results from a major incident. Transportation and transit play a supporting role, responding to requests for logistical assistance in an emergency evacuation. In practice, transit may be a more (or less) integral part of local emergency response and operations plans. At the outset of this study, the committee planned to review the extent to which transit is included in the emergency evacuation plans of the 38 UAs. However, confidentiality issues prevented the committee from accessing UA- and state-specific information in the U.S. Department of Homeland Security’s (DHS) Nationwide Plan Review (DHS 2006), and the alternative approach of accessing and reviewing publicly available on-line documents yielded incomplete results (DHS 2006). Thus, the committee was forced to draw its conclusions about the status of evacuation planning and transit’s role in those plans from summary data on the larger pool of 75 UAs in the DHS study.
T
94 Special Report 294: The Role of Transit in Emergency Evacuation
Finding: The majority of the emergency operations plans for large urbanized areas are only partially sufficient in describing in specific and measurable terms how a major evacuation could be conducted successfully, and few focus on the role of transit.
DHS found that the majority (85 percent) of the emergency operations plans of the 75
largest UAs it reviewed were only partially sufficient to manage a catastrophic event (DHS 2006). The report noted significant weaknesses in evacuation planning. Only a fraction of plans estimated the time required to evacuate those located in different risk zones or incorporated all available modes of transportation; just 8 and 7 percent of plans, respectively, were rated “sufficient” on these two measures. None of the plans were rated sufficient in either identifying or addressing the requirements of special-needs populations before, during, and immediately after a catastrophic event. The related U.S. Department of Transportation (USDOT) study (USDOT 2006), focused specifically on evacuation plans in the Gulf Coast region, painted a more optimistic picture, perhaps reflecting the recurring hazard—tropical storms—facing that region and recent evacuation experience. USDOT rated state and local emergency plans in the Gulf Coast region “effective” for highway evacuations, and most UA plans included transit and designated pickup points for carless evacuees. The plan assessment conducted for this study was focused specifically on the role of transit in emergency evacuation in the 33 non–case study UAs. The review found emergency response and evacuation plans for only 16 of the UAs; 11 of these mentioned transit (see Appendix C). However, only 7 plans provided sufficient detail to lend credibility to the role of transit in emergency evacuation (see the discussion in Chapter 4).
Recommendation 1: Local emergency managers should focus greater attention on evacuation planning as an important element of overall emergency planning, and should both determine and incorporate a role for transit and other public transportation providers in meeting evacuation needs.
While recognizing that transit plays a supporting role in emergency response, the
committee believes it is the mutual responsibility of transit agencies, as well as emergency managers, to ensure that transit is included in evacuation plans. Finding: Even among localities with evacuation plans, few have provided for a
major disaster that could involve multiple jurisdictions or multiple states in a region and necessitate the evacuation of a large fraction of the population.
DHS’s Nationwide Plan Review noted significant weaknesses in evacuation planning as
an area of profound concern (DHS 2006). Even in UAs with comprehensive local emergency response plans, regional evacuation plans are works in progress at best, reflecting the low probability of a major incident requiring a regional evacuation and the challenges of planning for large-scale emergencies that cross many jurisdictional and agency boundaries (see Box 5-1). Leadership is lacking at the regional level to conduct the requisite planning because, in the absence of a regional governance structure, no one “owns” the problem.

Enhancing Transit’s Role 95
BOX 5-1
Challenges Posed by Regional Emergency Evacuations Planning and executing a regional emergency evacuation is one of the most challenging tasks facing major urban areas. By definition, a regional evacuation involves multiple jurisdictions and agencies and could even cross state lines. It could be triggered by a major human-caused incident, such as a terrorist attack, or a natural catastrophe, such as a Category 4 or 5 hurricane. These are low-probability but high-impact events.
Planning for such incidents poses difficult problems for local emergency planners, and thus it is not surprising that little progress has been made to date. First and foremost, leadership is lacking at the regional level to conduct the requisite planning because, in the absence of a regional governance structure, no one “owns” the problem. Issues that need to be resolved include defining a command structure in the event of a major incident with regional impacts, coordinating an evacuation that seamlessly crosses jurisdictional and sometimes state boundaries, and providing for a parallel real-time regional communications capability.
Several of the local emergency managers interviewed for the case studies conducted for this report questioned the feasibility of evacuating major portions of large, highly developed, congested urban areas. The difficulty was amply demonstrated during Hurricane Rita, when between 1.5 and 2.5 million Houstonians took to the roads in an attempt to evacuate Harris County, with predictable results—massive traffic jams and vehicles that ran out of fuel or broke down for 24 hours or more. In many urban areas, severe congestion at peak periods lasts for several hours each morning and evening, straining the system under normal conditions. Thus, emergency managers are attempting to reduce demand for evacuation—for example, by confining the numbers of potential evacuees to those in high-risk areas, such as storm surge zones in a hurricane. Sheltering in place is also being encouraged and may be a safer response in some incidents (e.g., a chemical or radiological release).
Nevertheless, emergency managers also recognize that a major disaster requiring extensive evacuation could occur, and that a shadow evacuation (an overresponse or spontaneous evacuation of large numbers of individuals) in response to a major incident could be large. Thus, many emergency managers are attempting to develop scalable emergency response and evacuation plans that could be ramped up in the event of a major disaster. They are also looking to states to help resolve regional coordination issues (e.g., through mutual-aid agreements) and address transportation capacity shortfalls at regional chokepoints through infrastructure improvements (e.g., interchange upgrades) or operational measures (e.g., contraflow plans). Finally, they are looking to the Department of Homeland Security for guidance on regional evacuation planning and funding to help defray the costs.
96 Special Report 294: The Role of Transit in Emergency Evacuation
Emergency managers in some of the nation’s largest UAs are also questioning the feasibility of evacuating major segments of highly developed, congested locations, and are attempting to reduce demand for evacuation and encouraging sheltering in place for all but the highest-risk populations. Nevertheless, they recognize that a patchwork of highly localized plans for different emergencies is unlikely to produce a scalable response should a major disaster occur, and are attempting to fill the planning gap. Yet a clear decision-making framework for doing so is lacking, guidance on how to proceed is limited, and funds to defray the costs are insufficient. Thus even when regional planning initiatives exist, they often lack structure, plans are incomplete, and progress is slow.
Recommendation 2a: The Department of Homeland Security and the Federal Emergency Management Agency, in conjunction with the U.S. Department of Transportation, should provide guidance to state and local governments on regional evacuation planning, including the role of transit and other public transportation providers. States should take the lead in ensuring the development of such plans, coordinating with appropriate regional entities.
In January 2008, DHS finalized new guidance and a special mass evacuation annex as
part of the National Response Framework, an update of its guide for all levels of government and the private sector on the conduct of all-hazards incident response. In addition, the Federal Emergency Management Agency (FEMA) released an updated Comprehensive Preparedness Guide (CPG 101) for public comment that provides guidance to state, local, and tribal governments on the preparation of emergency operations plans. Both documents fall short, however, in providing sufficient detail on the development of mass evacuation plans, such as failing to include a template for a regional plan and the key agencies that should be involved. Greater clarity on the roles and responsibilities of those within DHS who work with state and local governments is also needed. State governments are in the best position to ensure the development of regional plans, working through appropriate regional entities such as metropolitan planning organizations (MPOs) and FEMA regional offices. In Florida, for example, the state is working with MPOs to develop an all-hazards, statewide emergency evacuation plan that would link individual county plans. States should also coordinate emergency evacuation plans with neighboring states through state-to-state mutual-aid emergency management assistance compacts (EMACs) that have been in place since 1993, following Hurricane Andrew.
Recommendation 2b: Federal funding should be provided for the development of regional evacuation plans that include transit and other public transportation providers. Grant recipients should be required to report on their progress and meet milestones and timetables.
DHS has created a new Regional Catastrophic Preparedness Grant Program, funded at
$69 million over 2 years [fiscal years (FY) 2007 and 2008], to support regional all-hazards planning for catastrophic events. Grant recipients must contribute 25 percent of the cost, either in cash or in kind, and set milestones, including starting and completion dates for projects. Some of the nation’s largest urban areas are eligible for funding. Such funding should continue to be made available, expanded to include all UAs with populations of more than 1 million, and
Enhancing Transit’s Role 97
directed toward regional evacuation planning.1 DHS should track the performance of the first round of grant recipients, report on their progress in meeting milestones and timetables, and develop a compendium of promising regional evacuation strategies that can be shared with other UAs. INCORPORATING TRANSIT AS A FULL PARTNER IN EMERGENCY EVACUATION Many transit agencies are regional authorities, providing service across jurisdictions, and thus have a regional perspective that could be useful in developing regional evacuation plans. However, this expertise is not always tapped. Because transit has a supporting role in emergency plans, local emergency managers may not consider the expertise of transit agencies when developing those plans. Transit agencies themselves may not view emergency response and evacuation as an important part of their mission. Nevertheless, the case studies conducted for this study provide a number of examples of locations where transit is a full partner in local emergency evacuation plans, and these examples could be instructive for other UAs.
Finding: In those areas where transit is a full partner in local emergency evacuation plans, transit agencies have been involved in the development of such plans and are part of the designated emergency command structure. The case studies conducted for this study revealed that the transit agencies most involved
in emergency evacuation were an integral part of local emergency evacuation plans and the decision-making structure in an emergency. This was perhaps most evident in Houston, where METRO is an integral partner along with other local emergency response personnel in local emergency plans. The agency had an opportunity to perform that role in advance of and during Hurricane Rita, evacuating those from Galveston and Houston who chose to use bus transport or lacked access to a vehicle, and performing numerous other functions (see Chapter 4 and Appendix D). Some of the most detailed roles for transit are found in the emergency evacuation plans of New York and Tampa for advance-notice hurricane events. At those sites where no-notice incidents are more likely—Chicago, New York, and Los Angeles—emergency plans are more process oriented, focused on clear organization and assignment of responsibilities; mechanisms for coordination of agency personnel and assets; and scalable responses, depending on the magnitude of the incident. Transit agencies have their own detailed emergency evacuation plans, but these plans are consistent with the emergency activation framework of the areawide plan (Chicago), or the areawide plan itself contains a separate transit agency coordination document (New York).
Another requirement for the successful integration of transit into emergency evacuation plans is providing for transit agencies to be part of the command structure at emergency operations centers (EOCs) when the latter are activated in an emergency incident. All of the sites visited by the committee meet this requirement. Finally, in those locations where transit has the most active role in evacuation planning, transit agencies typically have a long history of close
1 Other DHS grants (e.g., Urban Area Security Initiative grants) can be used for regional evacuation planning, but they have tended to be focused on other priorities (e.g., counterterrorism) and used for other purposes (e.g., equipment purchases).

98 Special Report 294: The Role of Transit in Emergency Evacuation
working relationships with key local emergency responders. This close collaboration is particularly evident in Houston and Tampa, areas where transit’s role in emergency evacuation has been tested and lessons have been learned.
Recommendation 3: Transit agencies should participate with emergency management agencies and departments of transportation when evacuation plans are developed, and should be full partners in the command structure established to handle emergency response and evacuation.
Box 5-2 details the planning requirements for fully incorporating transit into all phases of
emergency response and evacuation plans. Many of these ideas were derived from the case studies, although none of those locations had implemented all the requirements. Other requirements were drawn from the experience of committee members. To the extent that transit agencies become full partners in emergency evacuation plans, they will assume extensive new mission responsibilities, such as those listed in Box 5-2. New responsibilities will also involve new costs (e.g., training of personnel in emergency response, development of interoperable communications systems), which, in the committee’s judgment, should make these transit agencies eligible for cost reimbursement along with other first responders. Transit agency personnel should be considered essential personnel, along with representatives of police, fire, and emergency medical services, when asked to assume a major role in an emergency evacuation.2
Finding: Transit can play multiple roles in an emergency evacuation, but these roles depend on the nature of the incident and its location in a region; the availability of transit operators and equipment at the time of the incident; and the extent of damage, if any, to transit equipment and facilities.
The case studies illustrate the breadth of roles that transit can play in an emergency evacuation (see Chapter 4 and Appendix D). For example, transit can play a critical role in evacuating those who lack access to a private vehicle, transporting them either to area shelters or to other destinations outside the affected area. Indeed, transit is often the only means of evacuation for vulnerable, carless populations, many of whom may need assistance (see the discussion of this issue below). Transit operators can also transport emergency personnel and equipment to an incident site. After the emergency has passed, transit providers can return carless evacuees to their original destinations, help supply real-time information on the extent of any damage, and resume normal service as quickly as possible to provide transport for area residents.
Finding: Emergency managers, elected officials, and the general public should be realistic in their expectations regarding the role transit can play in an emergency evacuation, particularly for a no-notice incident that occurs during a peak service period.
2 As essential personnel, transit workers should be included in the first round of inoculations for pandemic flu or similar situations.

Enhancing Transit’s Role 99
BOX 5-2
Planning Requirements for Enhancing the Role of Transit in Emergency Evacuation
Mitigation
• Provide for the protection of vulnerable transit equipment and assets in the event of an emergency incident.
• Provide for redundant transit communications systems. • Provide for continuity of transit operations.
Preparedness
• Develop transit emergency evacuation plans consistent with areawide plans. • Identify populations likely to depend on transit in an emergency evacuation, and
work with area planners to model and estimate the maximum number that could be served. • Inventory available transit equipment to determine its capacity for meeting the
surge demands of an emergency evacuation. • Enter into reciprocal mutual-aid agreements with neighboring transit agencies to
help meet capacity shortfalls, including indemnification and funding agreements. • Consider the potential for school buses and drivers to meet evacuation transport
requirements. • Develop a plan for evacuating special-needs populations (see the text for details). • Designate assembly points where those special-needs populations who are
ambulatory can access transit. Make maps or other information available well in advance of an incident.
• Consider the destinations of those who will be transported by transit, whether to public shelters or to assembly points outside the affected area for further pickup and transport to final destinations.
• Consider standby emergency service contracts (including those with the private sector) to fill remaining transit service gaps and help provide for refueling of vehicles operating away from transit agency facilities.
• Include transit agencies and school districts and private school bus transportation providers in area tabletop exercises and drills for emergency evacuation plans. Response
• Ensure that transit agencies are represented in the chain of command at emergency operations centers when the latter are activated.
• Ensure that school districts are represented in the chain of command at emergency operations centers when the latter are activated.
• Provide for real-time communication with transit operators and emergency managers, as well as the public, both in advance of and during an emergency incident.
(continued)
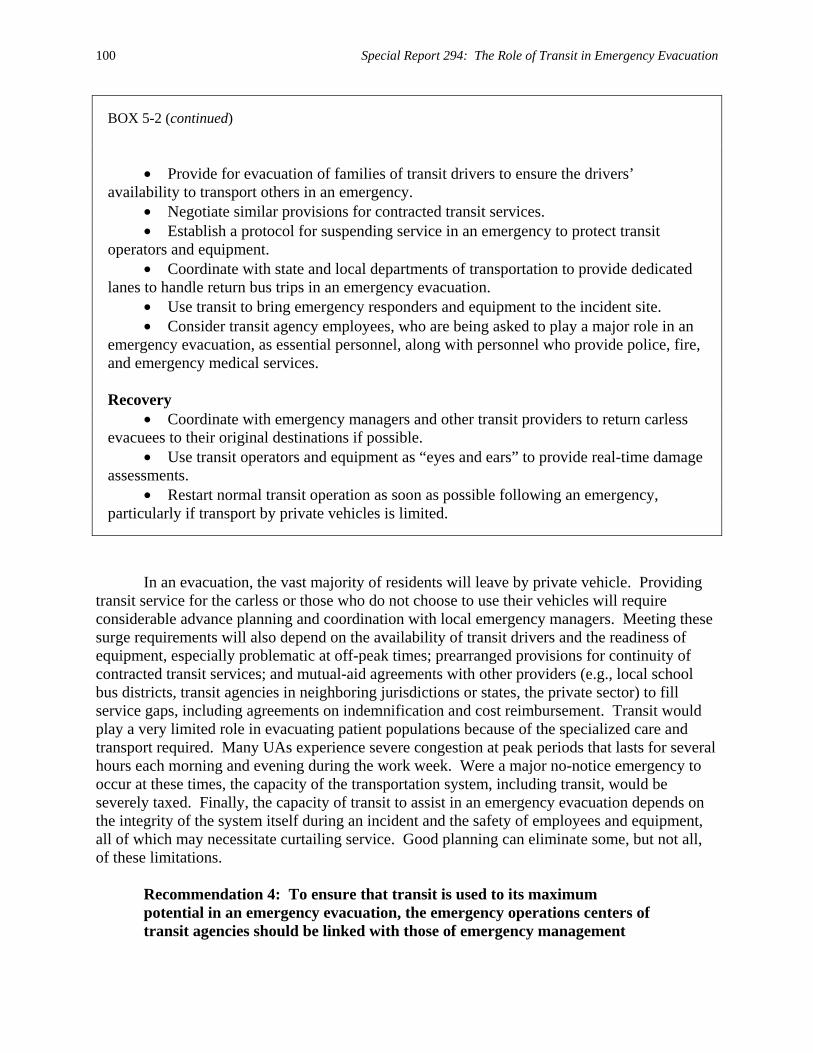
100 Special Report 294: The Role of Transit in Emergency Evacuation
BOX 5-2 (continued)
• Provide for evacuation of families of transit drivers to ensure the drivers’ availability to transport others in an emergency.
• Negotiate similar provisions for contracted transit services. • Establish a protocol for suspending service in an emergency to protect transit
operators and equipment. • Coordinate with state and local departments of transportation to provide dedicated
lanes to handle return bus trips in an emergency evacuation. • Use transit to bring emergency responders and equipment to the incident site. • Consider transit agency employees, who are being asked to play a major role in an
emergency evacuation, as essential personnel, along with personnel who provide police, fire, and emergency medical services. Recovery
• Coordinate with emergency managers and other transit providers to return carless evacuees to their original destinations if possible.
• Use transit operators and equipment as “eyes and ears” to provide real-time damage assessments.
• Restart normal transit operation as soon as possible following an emergency, particularly if transport by private vehicles is limited.
In an evacuation, the vast majority of residents will leave by private vehicle. Providing transit service for the carless or those who do not choose to use their vehicles will require considerable advance planning and coordination with local emergency managers. Meeting these surge requirements will also depend on the availability of transit drivers and the readiness of equipment, especially problematic at off-peak times; prearranged provisions for continuity of contracted transit services; and mutual-aid agreements with other providers (e.g., local school bus districts, transit agencies in neighboring jurisdictions or states, the private sector) to fill service gaps, including agreements on indemnification and cost reimbursement. Transit would play a very limited role in evacuating patient populations because of the specialized care and transport required. Many UAs experience severe congestion at peak periods that lasts for several hours each morning and evening during the work week. Were a major no-notice emergency to occur at these times, the capacity of the transportation system, including transit, would be severely taxed. Finally, the capacity of transit to assist in an emergency evacuation depends on the integrity of the system itself during an incident and the safety of employees and equipment, all of which may necessitate curtailing service. Good planning can eliminate some, but not all, of these limitations.
Recommendation 4: To ensure that transit is used to its maximum potential in an emergency evacuation, the emergency operations centers of transit agencies should be linked with those of emergency management
Enhancing Transit’s Role 101
agencies. Transit should have the capability for real-time interoperable communications (both voice and data), be part of the decision-making team for emergency operations, develop effective ways of communicating with transit passengers both in advance of and during an emergency, and participate in annual exercises and drills that involve multiple agencies and jurisdictions.
The case studies provide good examples of each of these requirements. For example,
some UAs have transportation management centers (TMCs) (e.g., Transtar in Houston, TRANSCOM in New York) that play an important role in managing daily traffic and incidents. These centers are a valuable resource in an emergency and should be linked with EOCs, either physically or virtually, if they are not already. At a minimum, the EOCs of individual transit agencies should be linked to the main EOC command center at the time of its activation.
Fully interoperable communications systems remain a goal but not a reality in most of the case study sites, where a variety of devices are used, including hard-line, cell, and satellite phones; radios; and text messaging systems. In some UAs, major transit agencies are linked through real-time communications networks (e.g., Chicago Transit Alert Network, TRANSCOM in New York).3 Communications between emergency managers and transit providers are generally handled through a transit coordinator at the EOC. Communications with the public varies across the case study sites. Transit agencies have an opportunity to educate their customers about what to expect in the event of an emergency, which can be publicized through public service advertisements, information provided on trains and buses, and more sophisticated real-time electronic text messages to subscribing customers. Some UAs, such as Tampa, recognize the particular importance of advance communication with special-needs populations served by paratransit and other transit providers to help ensure that these groups and their caregivers are prepared and know what to expect from their transit providers in an emergency evacuation. Finally, in many of the case study sites, transit agencies participate in exercises and drills and conduct after-action reviews that, along with transit’s role in transporting passengers to large planned events, test plans and readiness levels. Finding: Transit has a unique role to play in evacuating the carless and people
with special needs (e.g., the disabled, the elderly, special-needs populations with pets) during an emergency. However, these groups are inadequately addressed in most local emergency evacuation plans.
Both the DHS and USDOT studies previously discussed identified a lack of adequate
planning for the evacuation of special-needs populations as a critical shortcoming of emergency operations plans—a finding echoed in numerous other reports (e.g., Bailey et al. 2007; GAO 2006), as well as the plan assessment and many of the case studies conducted by the committee. The term “special needs” covers a range of population groups that may have differing needs in an evacuation. For example, ambulatory but carless low-income populations can use fixed-route transit service, whereas the elderly, disabled, or medically homebound are likely to require 3 The importance of testing such networks, however, was vividly demonstrated in New York during extensive flooding on August 8, 2007, which shut down much of the rail transit system. Lack of communications among Metropolitan Transportation Authority (MTA) agencies made it difficult to assess conditions in real time and provide timely information to customers about service changes. An MTA-wide EOC is being established to redress the deficiencies.
102 Special Report 294: The Role of Transit in Emergency Evacuation
sparser paratransit service with accessible equipment and trained operators. Moreover, many of these groups may be widely disbursed across a UA, further straining limited transit resources in an evacuation. Among the main problems involved in assisting special-needs populations are (a) identification of their geographic locations and transit needs, and the currency of that information; (b) perceived privacy issues associated with obtaining the information; (c) the availability of adequate equipment to meet special transportation needs at the time of an incident; and (d) the potential for conflicts and shortfalls in service because institutions serving special-needs populations (e.g., nursing homes) frequently contract with the same providers responsible for handling the homebound in an emergency evacuation.
Recommendation 5: Evacuation of the carless and those with special needs must be an integral part of evacuation planning, operations, and funding. A public information campaign and sheltering strategy specifically targeting these populations should be developed.
The case studies reveal a range of approaches for handling special-needs populations.
The Tampa UA is particularly notable for focusing the resources of transit agencies and school bus operators on evacuating special-needs populations in an emergency, typically a hurricane. The state requires that county emergency managers establish voluntary special registries to help identify the medically impaired who need evacuation assistance, and that they provide special-needs shelters. There have been extensive outreach efforts to inform special-needs populations, as well as the homeless and the disadvantaged, about transportation and shelter resources in an emergency evacuation (e.g., annual multilingual hurricane guides, utility bill flyers, door-to-door contact).
In contrast to Tampa, the larger case study sites—New York, Los Angeles, Chicago— have found keeping such special registries up to date difficult and have opted for different approaches. They are working with social service agencies, community groups, churches, and paratransit providers that represent various special-needs subgroups—those with disabilities, the elderly (e.g., Meals on Wheels), people living with AIDS, the homeless—to identify those who might need assistance in an emergency. Other options include working with MPOs and local universities to map the general locations of special-needs populations in metropolitan areas (e.g., concentrations of those who are elderly or carless) using geographic information systems and to link local databases of special-needs clients. Other measures involve establishing community emergency response teams and working through trained neighborhood leaders to help educate special-needs populations and their caregivers about disaster response and transportation assistance. Still others involve encouraging complementary self-help measures. Progress is slow, however, and efforts are often piecemeal, suggesting the need for a more integrated strategy, as well as funding to support the gathering of information about the transportation needs of these populations in an evacuation and targeted public information campaigns.

Enhancing Transit’s Role 103
COMPLEMENTARY TRANSPORTATION SYSTEM IMPROVEMENTS Transit operates as part of a the transportation system in an urban area. Its role in emergency evacuation depends in part on how well that system is functioning. The poor condition and inadequate capacity of transportation systems in both older and newer UAs were raised by all the case study sites as a critical issue affecting evacuation by private vehicle as well as by transit. Finding: The capacity and resilience of transit and highway systems as they affect
evacuation capability in an emergency incident are poorly addressed in current funding programs.
For example, commuter rail transit can provide rapid transport for large numbers of
transit-dependent evacuees; in many UAs, however, it shares the track with freight and passenger railroads (e.g., Amtrak), which may limit evacuation capacity. New York City Transit was recently forced to suspend rail operations when drainage systems were flooded after an intense rainstorm. Although no evacuation was planned, this incident illustrates the vulnerability of an older transit system. At the same time, the redundancy provided by New York’s extensive transit network enabled it to play an important role in the evacuation of Lower Manhattan following the terrorist attack of September 11, 2001. Even in newer areas, such as Houston, with a large bus transit system, capacity constraints can hamper evacuation. This is a particular problem when an evacuation extends to involve suburban and exurban areas, as it did during Hurricane Rita; where highway networks are less well developed; and where intelligent transportation systems (ITS) technologies for managing traffic flows are lacking.
Recommendation 6: In the reauthorization of the Safe, Accountable, Flexible, Efficient Transportation Equity Act: A Legacy for Users (SAFETEA-LU), Congress should authorize the Federal Transit Administration and the Federal Highway Administration to make eligible and to fund evacuation-related capacity-enhancement projects aimed at adding redundancy to critical transit and highway infrastructure, respectively, and increase funding for intelligent transportation systems (ITS) technologies that can enhance network resilience in an emergency. State funds should also be directed to these purposes.
“Bricks and mortar” capacity enhancements might include not only adding redundancy to
both transit and highway systems, but also removing critical traffic bottlenecks on major evacuation routes. Such projects are sometimes controversial, and must compete with other budgetary priorities for funding. They stand a greater chance of being funded when they meet multiple objectives (e.g., improve safety and reduce congestion, as well as serve evacuation needs). Operational measures, such as investments in ITS (e.g., cameras, interactive signs), traffic control measures (e.g., contraflow to expedite traffic in an evacuation, changes in signal timing), and interoperable communications systems to improve situational awareness, can help increase the efficiency and enhance the resilience of existing transit and highway networks in an emergency and should also be funded.
Finally, a great deal can be accomplished through mutual-aid agreements designed to maximize existing resources. For example, emergency managers in Chicago, a major rail hub,

104 Special Report 294: The Role of Transit in Emergency Evacuation
are working with a freight rail carrier group organized to alleviate rail congestion. In the event of an emergency, this group could help clear the tracks for commuter rail through use of the alert system now used to communicate with freight carriers when congestion is heavy. Other examples include mutual-aid agreements among transit providers, particularly in neighboring jurisdictions. These agreements are illustrated by Houston’s arrangement to assist in the evacuation of the residents of nearby Galveston and by Tampa’s coordination with local school districts to evacuate the carless and special-needs populations. Both of these arrangements can help stretch existing resources during periods of surge demand in an emergency evacuation. RESEARCH NEEDS Evacuation Modeling The committee noted several areas that would benefit from additional research. First, good evacuation modeling can help inform emergency operations plans, particularly the movement of traffic away from dangerous areas in an emergency incident. Such models can be particularly helpful in those areas that do not regularly experience major incidents or large planned events, which provide an opportunity to test evacuation plans in real time. Houston, Chicago, and Tampa drew on network models in developing the transportation component of their evacuation plans. Generally, the MPO handles the modeling, which simulates a large evacuation under varying assumptions about traffic demand and roadway capacity to help determine optimal evacuation routes, estimate regional evacuation times, and test various contraflow options on area highways. Most of the models, however, lack modal detail, particularly regarding the use of buses, and would benefit from this addition. For example, where buses will be used for evacuation from a disaster-affected area and are expected to make return trips, the models could simulate the use of dedicated lanes for both ingress and egress of buses and emergency vehicles to determine optimal traffic flows. Houston will be examining the use of high-occupancy vehicle (HOV) lanes for just this purpose, and this type of information would be useful to transit agencies and emergency managers alike in determining how best to deploy transit and emergency equipment during an evacuation. Spatial Dimensions of Demand for and Supply of Transit Service A second area that could benefit from research is understanding of the spatial dimensions of the demand for and supply of transit service in an evacuation. With respect to the demand side, research projects could help identify effective ways of estimating those in the general population or in special-needs groups who are likely to use transit in an emergency evacuation. Locating special-needs groups is a particularly difficult challenge in many UAs. Research could explore the pros and cons of various methods—from use of census data to help pinpoint geographic concentrations of potential transit users (e.g., low-income populations, the elderly),4 to experience with voluntary special registries, to accessing and linking the databases of client
4 A study conducted for the Federal Transit Administration on the status of emergency planning for vulnerable populations in 20 metropolitan areas (Bailey et al. 2007) mapped those living in poverty, low-English-proficiency groups, and zero-car households by census tract for each metropolitan area to help locate concentrations of those with special needs who might be potential transit users in an emergency evacuation.

Enhancing Transit’s Role 105
groups of social service agencies and paratransit providers so that EOCs could have access to these data in an emergency to arrange for transport with the appropriate transit operator.
On the supply side, research could be focused on the best methods for inventorying available transit equipment and drivers by location (e.g., maintenance yards) and time of day to determine how best to muster these resources in an emergency, match them with likely demand for transit service, and keep the information current. The Tampa and Chicago case studies provide good models of possible approaches. In Tampa, for example, emergency managers in Hillsborough County worked closely with the housing authority to determine the transit needs of public housing residents located in evacuation zones, and transit agencies have planned to expand service in these areas should a hurricane necessitate evacuation. In Chicago, where no-notice events are more common, transit agencies have examined how much transit equipment can be mustered at different operating times, particularly during off-peak hours, when it is more difficult to recall both drivers and equipment to respond expeditiously to an emergency incident. In other UAs, inventorying the location of equipment and fuel can help identify vulnerable locations (e.g., low-lying areas susceptible to flooding) and, together with information on potential transit demand, help in prepositioning equipment for advance-notice events.
Given a good inventory of the locations of local transit resources, researchers could also explore various options for meeting driver and equipment shortfalls by calling on neighboring jurisdictions and states and the private sector—a largely untapped resource. Emergency managers in Los Angeles, for example, have begun to explore how assets such as car rental fleets, airport shuttles, taxis, and other private van and bus fleets might be accessed in the event of a major emergency—an approach that could benefit from more research on the most effective methods. The American Public Transportation Association’s web-based national inventory of transit property equipment, personnel, and contact information, which can be accessed by participating transit agencies in an emergency, offers another resource (see Chapter 2 for details). Researchers could explore how that database has been used and what enhancements to it make sense. Finally, research on strategies for ensuring emergency workforce availability, particularly transit workers, through evaluation and sharing of best practices could help ensure that more transit agencies consider adopting such programs. Communications A related area for research is communications, both with the general public and with special-needs populations, who are especially likely to be transit users in an emergency evacuation. Transit agencies have a customer base and thus an opportunity to educate their customers about how transit operations will function in an emergency and what they can do to access those services. Such advance information could include public-service notices on buses and trains with contact numbers, or pamphlets with an overview of emergency operating principles and maps showing assembly points and staging areas for transit use in an emergency. Real-time information during an emergency is also critical, and technology is enabling electronic alerts and text messages to registered transit customers, providing up-to-the minute information on service and route changes. Providing similar information to many special-needs populations, who may not have access to the latest technology, could require a more concerted effort employing 311 systems, reverse 911, and citizen volunteer groups. The development of communication strategies could benefit from research on best practices that would help identify what works and for what types of emergencies and which population groups.
106 Special Report 294: The Role of Transit in Emergency Evacuation
MOVING FORWARD Enhancing transit’s role in emergency evacuation will depend on the actions of many different players. This section revisits the committee’s recommendations from the perspective of who should be involved in moving the recommendations forward. Because local governments have the primary responsibility for responding to an emergency incident and ordering an evacuation if necessary, it is appropriate to begin with the actions that can be taken by local emergency managers, transit agencies, and local departments of transportation. State and federal actions are then discussed. Through concerted local, state, and federal efforts to implement the committee’s recommendations, the full potential of the use of transit in emergency evacuation could be realized. Local Actions With the exception of recommendations 2 and 6, the committee’s recommendations require the joint action of local emergency managers and transit agencies, which share responsibility for identifying a role for transit and incorporating that role in local area evacuation plans (recommendation 1). Both can help ensure that transit agencies are involved when evacuation plans are developed and the command structure is established (recommendation 3), and that transit is an integral part of emergency operations plans (recommendation 4). Local departments of transportation and law enforcement personnel can help move bus and automobile traffic on local evacuation routes through the use of traffic cameras linked to TMCs, expedited traffic signal timing, and traffic control at major intersections (recommendation 6). Transit’s unique role in evacuating special-needs populations will require a special effort by emergency managers and transit agencies and is likely to involve other groups, such as social service and public health agencies, MPOs, nonprofit organizations (e.g., the Red Cross, local church and citizen groups), and in some cases state agencies (e.g., departments of public health) (recommendation 5). State Actions State emergency management agencies have a critical role to play, particularly in coordinating with appropriate regional entities (e.g., MPOs, FEMA regional offices) to help local governments develop and implement regional evacuation plans that should include a role for transit (recommendation 2a). In addition, state departments of transportation are generally responsible for funding and managing operational improvements on major evacuation routes, such as contraflow lanes, traffic cameras, and interactive signs, as well as large capital improvement projects (e.g., interchange improvements, lane additions) to remove bottlenecks on evacuation routes that can impede traffic flow, including bus traffic (recommendation 6). State departments of health could play a role in planning for the evacuation and sheltering of special-needs populations through both regulations and cost reimbursement (recommendation 5). Federal Actions Finally, federal agencies and Congress have a role to play. DHS and FEMA, in conjunction with USDOT, should provide more detailed guidance to state and local governments on how to develop regional evacuation plans that include the role of transit and other public transportation
Enhancing Transit’s Role 107
providers (recommendation 2a). DHS should expand funding of its Regional Catastrophic Preparedness Grant Program to include all UAs with populations of more than 1 million and develop a compendium of promising regional evacuation strategies (recommendation 2b). In the reauthorization of surface transportation legislation, Congress should authorize the Federal Transit Administration and the Federal Highway Administration to make eligible and fund evacuation-related capacity enhancement projects that would add redundancy at critical links in transit and highway systems, and increase ITS funding to support operational highway improvements that would help in managing bus and private vehicle traffic during an evacuation (recommendation 6). REFERENCES Abbreviations
DHS U.S. Department of Homeland Security GAO U.S. Government Accountability Office USDOT U.S. Department of Transportation
Bailey, D., S. Swiacki, A. Byrnes, Buckley, J., King, D., Piper, V., Marino, M., Mundle, S., Pierlott, G.,
and Lynd, A. 2007. Transportation Equity and Emergency Preparedness: A Review of the Practices of State Departments of Transportation, Metropolitan Planning Organizations, and Transit Agencies in 20 Metropolitan Areas. Final Report. FTA-PA-26-8001-2007. Milligan & Company, LLC and Mundle & Associates, Philadelphia, PA, May.
DHS. 2006. Nationwide Plan Review, Phase 2 Report, June 16, http://www.dhs.gov/xlibrary/assets/Prep_NationwidePlanReview.pdf.
GAO. 2006. Transportation-Disadvantaged Populations: Actions Needed to Clarify Responsibilities and Increase Preparedness for Evacuations. GAO-07-44. Washington, D.C., Dec., http://www.gao.gov/new.items/d0744.pdf.
USDOT. 2006. Report to Congress on Catastrophic Hurricane Evacuation Plan Evaluation, in cooperation with the U.S. Department of Homeland Security. Washington, D.C., June 1, http://www.fhwa.dot.gov/reports/hurricanevacuation/.


109
APPENDIX A
Congressional Request for the Study
SAFETEA-LU, SECTION 3046(a)(1) PUBLIC TRANSPORTATION NATIONAL SECURITY STUDY.-
(A) IN GENERAL.-Not later than 6 months after the date of enactment of this Act, the Secretary shall enter into an agreement with the National Academy of Sciences to conduct a study and evaluation of the value major public transportation systems in the United States serving the 38 urbanized areas that have a population of more than 1,000,000 individuals provide to the Nation's security and the ability of such systems to accommodate the evacuation, egress or ingress of people to or from critical locations in times of emergency. (B) ALTERNATIVE ROUTES.-For each system described in subparagraph (A) the study shall identify-
(i) potential alternative routes for evacuation using other transportation modes such as highway, air, marine, and pedestrian activities; and (ii) transit routes that, if disrupted, do not have sufficient transit alternatives available.
(C) REPORT.-Not later than 24 months after the date of entry into the agreement, the Academy shall submit to the Secretary and the Committee on Transportation and Infrastructure of the House of Representatives and the Committee on Banking, Housing and Urban Affairs of the Senate a final report on the results of the study and evaluation, together with such recommendations as the Academy considers appropriate. (D) FUNDING.-For each of fiscal years 2006 and 2007 $250,000 shall be available to carry out this paragraph.
Note that Part B of the study request was dropped because of inadequate funding.

111
APPENDIX B
Literature Review
he literature on the role of transit in emergency evacuation is not extensive. Nevertheless, interest in the topic has increased greatly in the wake of two events: the terrorist attacks of
September 11, 2001, in which transit played a major role in the evacuation of Lower Manhattan, and more recently Hurricane Katrina, in which transit failed completely in evacuating local residents without access to a private vehicle. This review summarizes what is known from available studies about the role of transit in emergency evacuation, including both areas for improvement and limitations on the role transit can play. NATIONAL ASSESSMENTS OF EMERGENCY PREPAREDNESS AND EVACUATION PLANNING Congress mandated two major studies of emergency preparedness in the wake of Hurricanes Katrina and Rita: a) the U.S. Department of Homeland Security (DHS) conducted an in-depth assessment of the emergency evacuation plans of 56 states and territories and the 75 largest urban areas (DHS 2006), and b) the U.S. Department of Transportation (USDOT) prepared a companion report that evaluated emergency evacuation plans in the Gulf Coast region (USDOT 2006) (see Table B-1 and the discussion in the following section). Although transit was not identified separately for examination in either report, many of the findings are germane to this study. In its Nationwide Plan Review, DHS concludes that the majority of current emergency operations plans and planning processes for states and urban areas are not “fully adequate, feasible, or acceptable to manage catastrophic events” (DHS 2006, ix).1,2 The report attributes this performance record to four factors:
• Poorly defined requirements for collaboration, fostering a tendency to plan internally. • Planning that emphasizes general roles and responsibilities rather than detailed
procedures for specific hazards, scenarios, or response thresholds. 1 Catastrophic events are defined as “. . . any natural or manmade incident, including terrorism, that results in extraordinary levels of mass casualties, damage, or disruption severely affecting the population, infrastructure, environment, economy, national morale, and/or government functions. A catastrophic event could result in sustained national impacts over a prolonged period of time; almost immediately exceeds resources normally available to state, local, tribal, and private-sector authorities in the impacted area; and significantly interrupts governmental operations and emergency services to such an extent that national security could be threatened” (DHS 2006, vii). 2 DHS peer review teams rated 27 percent of state emergency operations plans and only 10 percent of urban area plans “sufficient” with respect to the adequacy of the plan; the majority fell into the “partially sufficient” category (DHS 2006, 30). A plan was considered adequate when it complied with applicable guidance, contained valid planning assumptions, and provided a concept of operations that identified and addressed critical tasks effectively. The peer review teams, composed of former state and local homeland security officials, conducted site visits in all of the jurisdictions studied. They developed a scorecard for each area, establishing criteria for 34 questions that were used to rate the state and urban area plans as “sufficient,” partially sufficient,” or “not sufficient.”
T

TABLE B-1 Summary of Primary Studies Reviewed Report Title
Report Authors and Date Geographic Coverage
Primary Issues Covered
Nationwide Plan Review, Phase 2 Report
U.S. Department of Homeland Security, 2006
National In-depth assessment of emergency response and evacuation plans of 56 states and territories and 75 largest urban areas
Report to Congress on Catastrophic Hurricane Evacuation Plan Evaluation
U.S. Department of Transportation in cooperation with DHS, 2006
Five Gulf Coast states
In-depth assessment of state and local emergency evacuation plans
Transit Emergency Planning and Response Assessment Initiative
J.A. Goodwill and A. Reep, Center for Urban Transportation Research, University of South Florida, 2005
Florida Survey of emergency planning and response plans of transit systems in Florida
Transportation-Disadvantaged Populations: Actions Needed to Clarify Responsibilities and Increase Preparedness for Evacuations
U.S. Government Accountability Office, 2006
National Special-needs populations
Transportation Equity in Emergencies: A Review of the Practices of State Departments of Transportation, Metropolitan Planning Organizations, and Transit Agencies in 20 Metropolitan Areas
D. Bailey, S. Swiacki, and A. Byrnes et al. 2007
Twenty metropolitan areas
Evaluation of emergency response and evacuation plans of state DOTs, transit agencies, and metropolitan planning organizations in 20 metropolitan areas with higher-than-average proportions of minority, low-income, limited-English-proficient, and zero-vehicle households
Strategies in Emergency Preparedness for Transportation-Dependent Populations
National Consortium on the Coordination of Human Services Transportation, 2006
National Special-needs populations
Emergency Evacuation Report Card 2006
Cox, W., for the American Highway Users Alliance, 2006
National Evacuation capacity of the 37 largest urban areas, with an emphasis on highway capacity

Report Title
Report Authors and Date Geographic Coverage
Primary Issues Covered
Effects of Catastrophic Events on Transportation System Management and Operations: Cross Cutting Study
John A. Volpe National Transportation Systems Center, Cambridge, MA, 2003
Selected urban areas with catastrophic events
In-depth examination of the effects of four catastrophic emergency incidents on transportation systems: the September 11 terrorist attack in New York City; the September 11 terrorist attack in the Washington, D.C., area; the 2001 CSX rail tunnel fire in Baltimore; and the 1994 earthquake in Northridge, California
Identification and Analysis of Factors Affecting Emergency Evacuations
L.J. Dotson and J. Jones, Sandia National Laboratories, 2005
National Factors contributing to the efficiency and effectiveness of public evacuations of 1,000 or more people in response to natural disasters, technological hazards, and malevolent acts occurring in the United States between January 1, 1990 and June 30, 2003
Note: Reports are listed in the order in which they appear in this literature review.
114 Special Report 294: The Role of Transit in Emergency Evacuation
• Outmoded planning processes, rudimentary tools and guidance, and insufficient
planning expertise. • Lack of resource inventories and tracking mechanisms.
The report cites significant weaknesses in planning for a mass evacuation as an “area of
profound concern” (DHS 2006, ix). It rates only 13 percent of state plans and 7 percent of urban area plans as sufficient in describing in explicit and measurable terms how a successful mass evacuation could be conducted with current capability (DHS 2006, 8). More specifically, it rates only 12 percent of state plans and 8 percent of urban area plans as sufficient in estimating the time required to evacuate people located in different risk zones (DHS 2006, 23), and a similarly small fraction—18 percent of state plans and 7 percent of urban area plans—as sufficient in incorporating all available modes of transportation into emergency plans. The report identifies a lack of adequate planning for special-needs populations as the most persistent shortcoming across all the operational aspects of state and urban area plans.3 The term “special-needs populations” is broadly defined as including those without access to private vehicles and thus being potential users of transit in an emergency evacuation.4 None of the state or urban area plans are rated sufficient on this item. THE ROLE OF TRANSIT IN HURRICANE EVACUATION The DHS study found that the states and urban areas in the Hurricane Belt—defined broadly to include the Gulf and Atlantic Coast states—generally had emergency plans that were more likely than other plans to be rated sufficient by the peer review teams.5 The report cites the role of a recurring seasonal hazard (i.e., hurricanes), as well as high population density, as an impetus for the development and maintenance of robust emergency plans in these states.
The companion USDOT study mentioned earlier focuses more specifically on a review of the evacuation plans of responsible state and local jurisdictions in the five hurricane-prone Gulf Coast states—Alabama, Florida, Louisiana, Mississippi, and Texas. State and local operations plans in that region are generally rated effective with respect to highway evacuations (USDOT 2006).6 Two-thirds of the plans reviewed contained provisions for monitoring evacuation by motorized transport, rail, air, water, and other modes to determine the adequacy of resources, as well as contingency plans for securing additional vehicles if needed. At the same time, few plans 3 These elements of emergency plans are known as functional annexes. Their focus is on operations before, during, and after an emergency, and they define what each function is and who is responsible for carrying it out. 4 Special-needs populations are defined broadly to include the elderly, people with disabilities and other medical conditions, those with limited English proficiency, those with hearing and sight impairments, those who are in institutions, and those without access to private vehicles. Many of these groups have little in common beyond the fact that they are often left out of emergency planning (Kailes 2005) and that, because of their diversity of needs and vulnerability, planning for them is difficult. 5 There were some notable exceptions, however. The evacuation functional annexes of urban area emergency plans in the Hurricane Belt were rated not sufficient more often than those of plans in other U.S. urban areas. 6 The study adopted a somewhat different methodology and rating system from the DHS study. Sixty-three evacuation plans were examined for states, counties, parishes, and major urban areas within the 5-state region. Plan review entailed site visits to each state to discuss plans with responsible state and local officials, coordinating where possible with the DHS site visits. The scheme for rating each plan resulted in four possible scores—marginally effective, partially effective, effective, and very effective.

Literature Review 115
provided for coordination with neighboring jurisdictions, which may compete for common transportation resources. Moreover, limited information was available concerning the use of standby contracts with paratransit providers, private motor coach companies, ambulance companies, railroads, and air carriers. Most plans for urban areas included transit buses, and two-thirds designated pickup points for transit-dependent evacuees. However, few considered how evacuees would be transported to staging areas.
Like the DHS study, the USDOT study found that in general, plans for evacuating persons with various special needs were not well developed. Evacuating those who are not institutionalized presents special challenges. In particular, those living independently who use wheelchairs, rely on special medical equipment, are hearing or visually impaired, and are elderly have unique communications, transportation, and sheltering requirements that require advance planning. According to the report, most evacuation plans reviewed did not consider these special needs. The report’s recommendations call for the following:
• Joint development of regional plans for mass evacuations for events on the scale of Hurricane Katrina by state and local officials and appropriate federal agencies, providers of all modes of transportation and shelters, and representatives of various special-needs populations, among others.
• Direct involvement of transportation agencies and operators in key aspects of evacuation planning and implementation to ensure that transportation is available for various special-needs groups and that agreements have been made on evacuee destinations.
• Identification of the needs of those requiring specialized transportation or sheltering services, and communication of these requirements to emergency managers and transportation operators in advance of an evacuation (USDOT 2006).
Since the DHS and USDOT studies were conducted, the Federal Highway Administration within USDOT has developed a series of primers aimed at enhancing the role of transportation in evacuation planning. Although the focus is on highway evacuation, the primers provide some information about incorporating transit and evacuation of special-needs populations who lack vehicles into evacuation plans. As of this writing, two primers had been published—one focused on advance-notice evacuations (Houston 2006) and the other on no-notice evacuations (Zimmerman et al. 2007).7
Following the 2004 hurricane season, the Florida Department of Transportation (FDOT) conducted its own evaluation and assessment of emergency planning and response, focused specifically on the state’s transit systems (Goodwill and Reep 2005).8 In August and September of that year, Florida sustained four major hurricanes in a 6-week period—Hurricanes Charley, Frances, Ivan, and Jeanne. Florida has a sophisticated emergency response structure with a strong state emergency operations center (EOC) and duplicate EOCs in each of its 67 counties. FDOT’s Public Transit Office acts as the primary statewide coordinator for public transit
7 At least two other detailed primers are planned for the Routes to Effective Evacuation Planning Primer Series—one on integrating multiple modes into evacuation planning for events with no notice and another on evacuating populations with special mobility requirements. Also planned is a summary overview of all five primers. 8 Florida has more than 24 fixed-route systems and 67 counties with community transportation coordinators, a state-funded position intended to help coordinate transportation for the disadvantaged (Transit’s Role in Florida’s Emergency Response 2006). FDOT hired the Center for Urban Transportation Research (CUTR) at the University of South Florida to survey all transit agencies and interview selected responders (Goodwill and Reep 2005).
116 Special Report 294: The Role of Transit in Emergency Evacuation
systems and community transportation coordinators during emergencies and natural disasters (Transit’s Role in Florida’s Emergency Response 2006).9 Strong coordination also exists among public bus systems and school bus fleets because most school bus transportation is operated by county school boards (Florida’s Evacuations and Transit’s Role 2006). Evacuation plans involving use of transit are included in each county’s Comprehensive Emergency Management Plan, which addresses that county’s evacuation and sheltering needs. State and federal agencies have similar plans, with evacuation levels scaled to the expected severity of each hurricane.
Despite the many strengths of the state’s emergency management structure, the Florida study found that relatively few transit agencies maintain formal agreements with other transit agencies or local or regional governments to provide for interagency cooperation and communication before, during, and after emergency events (Goodwill and Reep 2005).10 The study report identifies 23 best practices that, if implemented more widely, could help improve transit emergency response management in the state. Some of the most important of these practices are:
• Communicating expectations for staff, including their responsibilities during an emergency, staff training, and mock drills.
• Protecting bus fleets, fueling in advance, and stocking emergency electrical generators and backup communication devices.
• Establishing and publicizing evacuation routes and bus assignments. • Preplanning for the transport of those with special needs, building on paratransit
system expertise. • Developing procedures for the evacuation of homeless and transient populations. • Coordinating with evacuation shelters (Goodwill and Reep 2005).
Many of these best practices, although tailored for Florida, are relevant for incorporating transit into emergency evacuations elsewhere. EVACUATING TRANSPORTATION-DISADVANTAGED POPULATIONS USING TRANSIT Both the DHS and USDOT studies identify a lack of adequate planning for the evacuation of special-needs populations in an emergency as a critical shortcoming of state and local area plans. Many of these populations are potential users of transit in an emergency evacuation and thus are of interest for the present study. The U.S. Government Accountability Office (GAO) conducted a study devoted entirely to the issue of preparedness for evacuation of “transportation-disadvantaged populations” (GAO 2006). The definition of transportation-disadvantaged is very broad, encompassing not only vulnerable populations without access to private vehicles, but also tourists and commuters who
9 That office must also coordinate with several other state offices, including FDOT itself, the state EOC, FDOT district offices, and the Florida Commission for Transportation Disadvantaged, as well as local transit agencies. 10 Among the 29 counties that responded to the CUTR survey, only 40 percent of the fixed-route systems had such agreements and only 22 percent of the community transportation coordinators (Goodwill and Reep 2005, 38).
Literature Review 117
are frequent users of transit.11 Like the DHS and USDOT studies, the GAO study found that state and local governments generally are not well prepared to evacuate transportation-disadvantaged populations with respect to planning, training, and conducting exercises.12 Until October 2006, federal law required that emergency plans include an evacuation plan, but there was no specific requirement that it address how to transport those who cannot self-evacuate.13 Federal law14 now requires that the mass evacuation plans of state and local governments incorporate special-needs populations. Yet despite these provisions, the GAO study identified several remaining challenges if jurisdictions are to make these requirements operational, including difficulties in:
• Identifying and locating transportation-disadvantaged populations because of their diverse composition and changing status, as well as inadequate or unavailable information about their geographic location.
• Handling widely varying evacuation needs, from basic transportation to accessible equipment and medical assistance.
• Providing for the actual transport of these populations in an evacuation, such as acquiring the appropriate vehicles and other necessary equipment and having trained professionals to provide assistance.
In addition, legal and social barriers are an issue for some populations. Examples of the
former are privacy issues in sharing medical information about those requiring transportation assistance and liability issues for private transportation providers or volunteers attempting to evacuate the disabled. Examples of social issues are concern about leaving one’s home unattended or leaving a pet behind, which can affect the willingness of some individuals to consider evacuation.
The GAO report identifies steps that state and local governments have already taken to address these challenges. For example, some jurisdictions have worked with their metropolitan planning organizations and academic institutions to identify transportation-disadvantaged populations, using computerized mapping to locate those who are transit-dependent. In other cases, state and local entities not traditionally included in emergency management and training—social service agencies, nonprofit organizations, and transportation providers for special populations (e.g., those offering paratransit for the disabled)—are involved in preparedness planning efforts. In still other cases, memoranda of understanding and mutual aid agreements 11 The study did not examine the evacuation of institutionalized populations (e.g., those residing in hospitals, nursing homes, or jails), nor did it address issues other than transportation that are key to successful evacuations, such as sheltering. These topics are covered in other GAO reports. 12 GAO based its findings on a review of the literature; federal, state, and local emergency plans; and studies conducted by the federal government, experts, national associations, and organizations representing the transportation-disadvantaged and their transport providers. The study also included interviews with federal officials and site visits to the District of Columbia and four cities—Buffalo, Los Angeles, Miami, and New Orleans. 13 This requirement is part of the Emergency Planning and Community Right-to-Know Act of 1986, U.S. Code Title 42, Chapter 116, Subchapter 1, § 11003, “Comprehensive Emergency Response Plans,” also known as the Superfund Amendments and Reauthorization Act, Title III. The act requires that community emergency response plans for chemical accidents include provisions for a precautionary evacuation and alternative traffic routes. 14 Public Law 109-295, the Department of Homeland Security Appropriations Act of 2007, requires the Federal Emergency Management Agency (FEMA) to provide guidance for incorporating persons with disabilities or other special needs into all aspects of emergency management, including evacuation, housing, sheltering, transportation, and communications.
118 Special Report 294: The Role of Transit in Emergency Evacuation
have been established with other jurisdictions to help ensure that additional vehicles, drivers, and equipment will be available in the event of an emergency that overwhelms local response capability. Such prior arrangements may also address liability concerns and financial issues (e.g., reimbursement rates for drivers and equipment).
The Federal Transit Administration (Office of Civil Rights) commissioned a study of the emergency response and evacuation plans of state DOTs, transit agencies, and metropolitan planning organizations in 20 metropolitan areas with higher-than-average proportions of minority, low-income, limited-English-proficiency, and zero-vehicle households (Bailey et al. 2007). Although most of the neighborhoods inhabited by these populations are well served by transit, which could play a role in evacuating those without other means of transportation, few of the agencies surveyed for the study had taken steps to include the transportation-disadvantaged in emergency plans. None of the plans reviewed identified the mobility needs of these populations; only a few agencies had targeted them in evacuation plans and communication strategies; and none of the agencies had measures in place for coordinating with other agencies for the transport of these populations both before and during an emergency. The study report offers four recommendations for enhancing consideration of the transportation-disadvantaged in emergency response plans:
• Develop demographic profiles of the numbers and locations of transportation-
disadvantaged populations to help in estimating the number of people who may not be able to self-evacuate, planning evacuation routes and staging areas, and conducting targeted community outreach on emergency preparedness.
• Encourage more public input in the establishment of emergency plans from those organizations knowledgeable about transportation-disadvantaged populations, including faith-based and community-based organizations.
• Develop strategies for effective communication of emergency plans on the basis of demographic information about concentrations of limited-English-proficiency and other special-needs populations, as well as outreach to community-based organizations.
• Encourage transit agencies to be clear about their role in the event of an emergency; understand command and control procedures for use of their assets; and improve communication and coordination with county and state emergency management agencies, which have lead responsibility for emergency response and evacuation.
In September 2006, the National Consortium on the Coordination of Human Services Transportation15 issued a strategy paper and checklist on emergency preparedness for transportation-dependent populations. The paper built on a day-long panel discussion of emergency preparedness transportation among public and private transportation providers, community organizations, governmental agencies, and national organizations (National Consortium on the Coordination of Human Services Transportation 2006). The focus of the discussion was on the role that public and community transportation services can play in transporting individuals who may require assistance during an emergency—a narrower focus than the GAO study. The paper notes several key elements involved in successfully meeting the 15 The consortium, which operates under the auspices of the Community Transportation Association of America, is an alliance of national nonprofit organizations and associations dedicated to promoting mobility and the delivery of coordinated human services transportation for all individuals with disabilities, those with low incomes, older adults, and youths.

Literature Review 119
transportation needs of vulnerable populations in responding to an emergency, including the following:
• Advance planning and collaboration among a variety of partners, including transportation agencies; emergency responders; and community-based groups, such as advocacy organizations, agencies that serve transportation-dependent populations, employment and training providers, health and human service agencies, and local faith-based organizations.
• Identification and tracking of the locations and needs of transportation-dependent individuals both before and during an emergency, including developing voluntary registries of those requiring transportation assistance; matching individual needs with appropriate transportation service providers; and ensuring the availability of accessible vehicles where needed, as well as the transport of personal caregivers.
• Information on how, when, and where transportation services will be provided in an emergency (e.g., route maps and transit stop locations provided well in advance of such an event), as well as methods for communicating with vulnerable populations in a variety of accessible formats during an emergency.
• Agreements on where and when vehicles might be staged and stored during an emergency and the development of contractual agreements well in advance of such an event to ensure adequate availability of accessible vehicles, appropriate lift equipment and fuel; means of accommodating service animals; liability coverage; funding arrangements; and methods for dealing with regulations involving charter bus companies or use of transit or intercity passenger rail cars on nonstandard routes or tracks.
• Development of a system of checkpoints for use by public and community transportation service providers during an emergency that feeds into the broader emergency evacuation plan, along with provisions for information sharing and communication among these providers during such an event.
EVACUATING THE DISABLED USING TRANSIT In July 2004, President Bush signed Executive Order 13347, Individuals with Disabilities in Emergency Preparedness, to help ensure that the federal government supports and strengthens measures incorporated in emergency preparedness plans to enhance the safety and security of those with disabilities. The executive order created the Interagency Coordinating Council on Emergency Preparedness and Individuals with Disabilities, chaired by DHS through its Office of Civil Rights and Civil Liberties, to help with the order’s implementation.
The Office of Civil Rights and Liberties participated in DHS’s Nationwide Plan Review.16 That review found that few state and urban area plans reflected in-depth planning and proactive thinking with respect to meeting the needs of people with disabilities before, during, and after an emergency (DHS 2006). Most plans failed to address evacuation for persons with disabilities (DHS 2006). Some jurisdictions were devising ways for such individuals to pre-identify themselves voluntarily to receive evacuation assistance, such as through special 16 A review panel of 11 disability subject-matter experts was formed to review the documents submitted by the state and urban areas participating in the Nationwide Plan Review. An assessment tool was designed specifically to capture information on the extent to which disability-related planning and readiness issues were integrated into state and urban area plans and to ensure a consistent assessment of these plans (DHS 2006).

120 Special Report 294: The Role of Transit in Emergency Evacuation
registries, but the report stresses that these plans must be updated regularly so that unrealistic expectations regarding evacuation assistance are not raised. The report notes that a critical but often overlooked component of the evacuation process is the timely availability of accessible transportation for people with disabilities, especially lift-equipped vehicles. These would presumably include paratransit vehicles, provided either by a transit agency or by a local school district. In fact, the report points to one urban area that had arranged with a local school district and its paratransit provider to use existing lift-equipped vehicles to assist with evacuation of persons with disabilities in a general emergency.
As with the DHS study, USDOT had its Office of Civil Rights participate in its study of the catastrophic evacuation plans of the Gulf Coast states.17 The study report reinforces the finding of the DHS study that plans for evacuating disabled persons who are living independently were not well developed (USDOT 2006). Identifying the location of these individuals, handling the logistics for their evacuation, and addressing their special sheltering needs are all major challenges. BEHAVIORAL ISSUES IN EVACUATION A major issue affecting an area’s ability to plan for an emergency evacuation is uncertainty about the numbers of evacuees. Many people tend to wait until the last minute before evacuating, putting themselves and others at risk. Others may evacuate when doing so is unnecessary, and it would be safer for them to shelter at home. The latter was the case in the “shadow” evacuation from Houston when Category 5 Hurricane Rita was bearing down on the region less than 1 month after Hurricane Katrina (Peacock et al. 2007). Risk perception and risk communication are critical to the decision to evacuate and the timing of that decision. A considerable literature exists on understanding risk and improving risk communication (e.g., NRC 1989, 1996), and on risk communication in emergency conditions, when the credibility of the communicator is essential, messages must be understandable, and openness about uncertainties is critical (CDC 1995). Another literature is focused on warnings and decision making (Mileti 1999).
In an emergency, communicating with vulnerable populations, many of whom are potential transit users should an evacuation prove necessary, presents special challenges. A recent review of the literature offers several examples (Phillips and Morrow 2007). Households with older members are often reluctant to evacuate, a finding that was vividly illustrated during Hurricane Katrina; current estimates suggest that close to 70 percent of Katrina fatalities were among those over age 65. Those who live in poverty, particularly female-headed households, have also reported difficulties in responding effectively to hurricane warnings (Enarson and Morrow 1997 in Phillips and Morrow 2007). Many racial and ethnic groups are less likely to accept a warning as credible without confirming it through other sources, such as family and social networks, thereby delaying evacuation (Lindell and Perry 2004 in Phillips and Morrow 2007). Finally, researchers have found that many persons with disabilities want to respond to
17 USDOT also established the Emergency Transportation Subcommittee to support the goals of Executive Order 13347 and the work of the Interagency Coordinating Council on Emergency Preparedness and Individuals with Disabilities. The subcommittee serves as a mechanism for evaluating the status of emergency preparedness with respect to persons with disabilities and transportation systems. It is currently evaluating existing transportation regulations for the disabled in the context of emergencies and will provide examples of best practices.

Literature Review 121
warnings, but lack the necessary support to assist with the evacuation and perceive that shelters cannot accommodate their needs (Willigen et al. 2002 in Phillips and Morrow 2007). The authors of the review conclude that the research on warning messages and vulnerable populations is inadequate to provide reliable guidance to forecasters and emergency managers on the best ways to target warnings to high-risk populations. HIGHWAY CAPACITY ISSUES IN EMERGENCY EVACUATION Many of the reports cited above address emergency evacuation from the perspective of those populations served by transit. Another approach is to focus on the capacity of transportation systems to handle an emergency evacuation. In late 2006, the American Highway Users Alliance (AHUA) issued a report (Cox 2006) focused on assessing the evacuation capacity of the 37 largest urban areas, essentially the same subset of urban areas examined in the present study. The analysis assumed that the entire urban area would have to be evacuated and that highways and private vehicles would be the principal means of evacuation. Why, then, is the AHUA study relevant for an investigation of the role of transit in emergency evacuation? The short answer is buses. Many of the transit systems of the 37 urban areas reviewed in the AHUA study are bus only. Moreover, many urban areas with rail systems would presumably use buses as well in an evacuation. Thus, highway capacity and coordination between bus and automobile traffic are key issues for consideration in planning for a successful evacuation.18 The method used to evaluate and rate evacuation capacity in the AHUA study was based on three factors: a) exit capacity—an estimate of the ability of roads and highways leading out of an urban area to accommodate the evacuating population, b) internal traffic flow—an estimate of the ability of roadway systems within an urban area to deliver traffic to exit routes, and c) automobile access—an estimate of the percentage of the population that will evacuate by car (Cox 2006). These three factors are weighted together to produce an evacuation capacity index and a letter grade from A (best) to F (worst). Only four urban areas received an A or B grade; the vast majority fell into the bottom grade. The primary factors associated with a high score were lower population densities, higher-capacity roadway systems, and a lack of significant geographic barriers blocking exit directions. The conclusion of the study is that there is considerable latitude for improving the evacuation capacity of the nation’s largest urban areas. One section of the report focuses on evacuating those who are transit-dependent, arguing that planning for those who cannot self-evacuate is a government responsibility and far more complex than evacuating by automobile. Nevertheless, considerable resources are available to evacuate the transit dependent, including buses—transit buses, school buses, motor coaches, and paratransit vehicles—and rail. According to the study, buses would be the most useful in evacuating those without cars because they can bring passengers directly to evacuation centers 18 Evacuation capacity by bus is considerably larger than that by car. One estimate suggests that a highway lane carrying 600 buses an hour at an average capacity of 25 passengers each would evacuate 15,000 passengers per hour (Litman 2005). (According to the Highway Capacity Manual, a bus or truck represents 1.5 to 2.5 passenger car equivalents. Buses typically carry about 50 passengers, but with evacuees carrying baggage and wheelchairs, lower passenger load assumptions are more realistic.) By comparison, a highway lane can accommodate a maximum of 2,000 vehicles per hour, but more likely only 1,000 persons per hour in the congestion and confusion of an evacuation. Assuming an average vehicle occupancy rate of 2.5 passengers, each passenger car–only highway lane would evacuate 2,500 people per hour.

122 Special Report 294: The Role of Transit in Emergency Evacuation
and return to make additional trips (Cox 2006). Subways and light rail could also be used, but in many areas rail serves primarily the central district.19 In these areas, the principal use of rail would be to feed buses that would complete the evacuation to destinations outside the urban area. In a few areas, high-capacity commuter rail and Amtrak, particularly in the Northeast Corridor, could supplement bus traffic, but provision would have to be made for transporting passengers to shelters from end-of-the-line stations. Finally, taxis and rental cars could be used, but the cost would probably be prohibitive for many transit-dependent households. The report offers several suggestions for improving evacuation by transit, including:
• Establishing expedited exclusive bus routes so that buses could avoid the worst traffic congestion and make return trips, increasing the numbers of those who could be evacuated.20
• Establishing agreements among transportation providers, including standby or expedited contracts, in advance of an emergency so that operators would know what is required of them, and drivers would be available and assured of payment.
• Ensuring that communications capabilities would be operative so that drivers and equipment could be deployed effectively during an evacuation. CONTRA-FLOW FOR EMERGENCY EVACUATION One means of increasing highway capacity is to use contra-flow techniques to increase traffic flow dramatically during an emergency evacuation. Contra-flow involves the reversal of traffic flow on one or more of the inbound lanes and shoulders of roads and highways for use in the outbound direction to increase evacuation capacity by using both sides of a roadway (Wolshon et al. 2001). Lane reversal is used in many larger urban areas to increase rush hour capacity on certain major highways, but contra-flow operations for mass evacuation require a far more substantial effort. Before an event, provision must be made for lane crossover points for outbound traffic onto inbound lanes; traffic direction, including intersection, ramp, and exit control, by law enforcement personnel; and coordination of bus and automobile traffic. In addition, adequate inbound capacity must be preserved to bring emergency vehicles and equipment to the site of the emergency. During an evacuation, provision must also be made for fueling and rest stops en route, expedited removal of vehicles that break down, and access to the roadway for emergency vehicles. Contra-flow measures underwent a critical test during Hurricane Katrina, when those with access to an automobile were evacuated successfully in advance of the storm (Wolshon 2006). In contrast, there was no effective plan for evacuating residents without access to reliable personal transportation. The city had established ten locations where city buses were to pick such individuals up and take them to emergency shelters, but many drivers were evacuating their
19 Depending on the emergency, the rail system itself could be compromised. 20 Where they are available, strategic use of lower-capacity exit routes, such as two-lane arterials, as exclusive bus routes might be preferable to attempting to enforce exclusive bus lanes on overcrowded major highways being used by cars.
Literature Review 123
own families, the equipment was inadequate even if drivers had been available, and many public buses were ruined in the flooding (Litman 2005).21 Following Hurricanes Katrina and Rita, many jurisdictions studied the feasibility of adopting contra-flow measures for emergency evacuation. The State of Florida, for example, held a major workshop on contra-flow on February 14–15, 2006, at which hurricane-impacted states shared experiences with contra-flow (Florida DOT 2006), identifying practices that have worked well and those that have not.22 The workshop also identified many issues that remain to be resolved if bus transport is to be used successfully as part of contra-flow operations. Effective bus use in an evacuation requires coordinating bus and automobile traffic and giving some priority to expedited bus travel both outbound and inbound so that buses can make multiple trips. EFFECT OF TRANSIT SYSTEM CHARACTERISTICS ON EMERGENCY TRANSIT USE A considerable body of literature exists on the factors influencing transit ridership (Taylor and Fink 2007), several of which could affect the propensity of urban area residents to use transit in an emergency evacuation. Several studies have linked high transit ridership with high residential and employment densities (Pushkarev and Zupan 1977), and others with mixed-use development and urban design (Crane 2000; Cervero 1993). High densities in particular make it easy for large numbers of residents and workers to access transit—an important consideration if transit is to play a role in emergency evacuation. Many areas with higher densities and multifamily housing also tend to be populated by lower-income households with lower levels of automobile access. Although it is difficult to sort out the respective importance of spatial and socioeconomic variables in explaining transit ridership in general (Taylor and Fink 2007), the distinction is less critical from the perspective of potential transit use for emergency evacuation; transit use is typically higher among lower-income households, who are thus apt to turn to transit for transport during such an event. Transit users can also be classified into two groups—captive and choice riders—a useful way of thinking about the use of transit in an emergency evacuation (Krizek and El-Geneidy 2006). Captive riders typically lack an alternative to transit and therefore use it as their primary means of transport; choice riders have realistic alternatives (e.g., driving), but choose to use transit for certain trips. Service availability and reliability affect ridership for both groups (Krizek and El-Geneidy 2006). In an emergency, captive riders would depend on transit for evacuation unless family or friends had access to a car. Choice riders, particularly commuters, could use transit, particularly in a no-notice emergency requiring an evacuation, if they had not brought their car to work or if the roads were clogged as was the case on September 11, 2001. Recent research in California found that immigrants fall into the captive rider group when they first come to the United States (Blumenberg and Evans 2007). They tend to settle initially in large urban centers and more densely populated “ports of entry” in the state, which are better
21 Some 500 transit and school buses were available, but even assuming each bus could carry a maximum of 50 passengers each, they could have met only about 25 percent of evacuation needs unless multiple trips in and out of the city could have been arranged (Litman 2005). 22 The workshop was hosted by the Florida Department of Transportation and co-sponsored by the American Association of State Highway and Transportation Officials, the Federal Highway Administration, and the I-95 Corridor Coalition.

124 Special Report 294: The Role of Transit in Emergency Evacuation
served by transit than are other areas. As they assimilate and their economic status rises, however, they tend to purchase and use cars. The three main factors that determine their continued transit use are year of arrival in the United States, prevalence of driving and cars in their country of origin, and legal status (i.e., whether they can legally obtain a driver’s license) (Blumenberg and Evans 2007). The large numbers of new immigrants who arrive in many large urban areas suggest that many would be transit users in an emergency evacuation. If they are to use transit successfully during such an event, emergency managers and transit service providers must provide emergency response and evacuation information in appropriate languages. ROLE OF TRANSIT IN TRANSPORT FOR SPECIAL EVENTS AND EMERGENCY EVACUATION EXERCISES Special events, such as the Olympics, major sports events, and Fourth of July celebrations on the National Mall, can provide an indication of the surge capacity of transit systems and highways in nonemergency conditions. Effective delivery of transportation services to accommodate ingress to and egress from the location of such events often requires cooperation among agencies that usually do not work together and use of innovative operating practices, both of which can be valuable in an emergency evacuation. Each Fourth of July, the District of Columbia hosts upwards of 400,000 residents and tourists who come to view the fireworks on the National Mall. Those attending the event are urged to use transit. To accommodate the crowds, the Washington Metropolitan Area Transit Authority (WMATA), the regional transit system, has altered service in numerous ways, including adding rail equipment, shortening headways, and extending normal hours of service; implementing station control to avoid overcrowding; and using farebox and turnstile control to lessen passenger bottlenecks. Highway capacity is also enhanced by means of police control at critical intersections and changes in signal timing on certain routes to enhance the movement vehicular traffic and pedestrians. In 2005, the District Department of Transportation used the Fourth of July celebration to conduct a real-time test of four roads designated as emergency evacuation routes (DDOT 2005). Coordinating agencies included the District Emergency Management Agency, the Metropolitan Police Department, the U.S. Park Police, the U.S. Capitol Police, and the Office of Congresswoman Eleanor Holmes Norton. The test was deemed a success but revealed several areas for improvement, including more reliable traffic signal timing, better coordination with the Advance Traffic Management Center, better staging and staffing of Metro buses, and collection of baseline traffic data with which to evaluate flow improvements with expedited traffic signals.
In 2006 Chicago’s Office of Emergency Management and Communications conducted a first-of-its-kind emergency exercise involving evacuation of four commercial high-rise buildings in the central business district at the peak of rush hour traffic in which more than 4,000 individuals participated. The purpose was to test emergency notification and communication systems; evacuate building occupants to assembly and transportation centers; test these centers’ intake, registration, and triage operations; and increase public awareness and education regarding emergency preparedness. The Chicago Transit Authority, the second-largest transit system in the United States, was part of the exercise and staged buses at the centers, although no one was actually evacuated. An after-action report was prepared (Office of Emergency Management and Communications of the City of Chicago 2007). Many other urban areas conduct table-top
Literature Review 125
exercises and drills each year to test one or more components of emergency response and evacuation plans that may involve transit (e.g., annual hurricane exercises in many Gulf Coast states and bistate exercises to test evacuation of New Jersey commuters across the Hudson River in the event of an emergency in Manhattan). ROLE OF TRANSIT IN NO-NOTICE EMERGENCIES Many of the studies reviewed in the preceding sections have examined emergency preparedness for and use of transit in emergencies, such as hurricanes, for which there is some advance warning or notice. This section focuses on what is known about the role of transit in evacuations during no-notice emergencies, such as September 11. Such evacuations can be necessitated by human-caused emergencies, such as a terrorist event or a chemical spill or nuclear release, or by natural disasters, such as an earthquake. Terrorist Event The terrorist attacks of September 11, 2001, were the largest in the nation’s history. Transit played an important role in the immediate evacuations that followed the events in both New York City and the Washington, D.C., metropolitan area, as well as in transporting emergency workers and equipment. The events and lessons learned are well catalogued in a 2003 study by USDOT’s John A. Volpe National Transportation Systems Center (NTSC) (NTSC 2003). New York City is the most densely populated urban area in the United States and has the highest level of transit ridership. On a typical weekday, daily volume for all transit modes totals 7.6 million riders (NTSC 2003, 13). Following Mayor Giuliani’s instruction to evacuate Lower Manhattan a little more than 2 hours after the first plane crashed into the north tower of the World Trade Center during the morning rush hour, transportation agencies were faced with the daunting task of evacuating some 1.2 million workers and residents of the area (NTSC 2003). Within minutes of the attack, subway services into Lower Manhattan had been suspended and bridge and tunnel crossings into Manhattan closed. Both New York City Transit (NYCT) and Port Authority of New York and New Jersey–run PATH trains began emergency procedures almost immediately after the first strike to evacuate those in World Trade Center stations, and PATH operated express trains from Manhattan back to New Jersey.23 New Jersey Transit provided for evacuation on its trains from New York City’s Pennsylvania Station and on buses staged in New Jersey. It also supported emergency response units with employees, buses, and equipment on stripped-down rail cars, which were rushed to the World Trade Center site. Likewise, NYCT made available a fleet of buses and personnel to help shuttle emergency responders to and from the site (American Public Transportation Association 2001). The Coast Guard helped organize a flotilla of water ferries and private boats, making a radio call to “all available boats” to help evacuate approximately 300,000 from Lower Manhattan following the collapse of the North Tower (Kendra et al. 2003).24 When the Port Authority’s main emergency
23 The 900 passengers on the last PATH train to enter the World Trade Center station were told that the train would not stop in the station; it returned safely to New Jersey before the station was destroyed in the World Trade Center towers’ collapse (American Public Transportation Association 2001). 24 Although it had legal authority to take over the evacuation, the Coast Guard perceived that the evacuation was going well and played largely a supporting role.

126 Special Report 294: The Role of Transit in Emergency Evacuation
control center was lost in the towers’ collapse, both NYCT and New Jersey Transit depended on mobile communications centers—transit buses equipped with satellite and computer technology—for communications support.
By midmorning, most New York City businesses had closed for the day, releasing some 2.6 million commuters outside of Lower Manhattan to find their way home. At that time, most transit options were limited, with both the subway and commuter rail systems being shut down. Approximately 4 hours after the attack, partial NYCT subway service was resumed; redundant subway tunnels helped restore service between Manhattan and Brooklyn later in the day as trains were rerouted from the area of the attack. Outbound travel on PATH and the Long Island Railroad also resumed later in the afternoon. The Metropolitan Transportation Authority bus system continued to operate throughout the day, running north of Lower Manhattan. In sum, transit was critical in the evacuation of many of those in harm’s way in Lower Manhattan immediately following the event; it was less of a factor in the handling the surge of commuters in other parts of Manhattan as rail service was shut down for part of the day.
Transit also played a role following the terrorist strike on the Pentagon. Like New York, Washington, D.C., has one of the highest proportions of transit use in the nation—16 percent of commuters use it to get to work (NTSC 2003).25 That day, despite some communications issues, WMATA continued operations (with some closures near the Pentagon) to assist in the evacuation of those attempting to leave the city.26 The uncoordinated release of federal workers nearly 2 hours after the event, combined with the closure of Virginia Railway Express commuter rail, Maryland Transit Administration’s MARC commuter rail, and Amtrak service, placed considerable strain on the Metrorail system. WMATA also provided buses to help transport the injured and assist the D.C. Metropolitan Police in moving personnel to various locations around the area.
The NTSC study offers several recommendations for addressing an unplanned emergency evacuation that are relevant for transit systems and for successful evacuation more generally. They include the need for:
• Advance planning and a well-established chain of command, because transportation
officials must begin to implement evacuation plans and institute recovery procedures almost immediately after an emergency.
• A well-rehearsed communications plan covering both internal and interagency communications.
• Redundant systems—multiple methods of communication in case major communications centers are destroyed as they were on September 11, backup generators,27 and redundant critical infrastructure (e.g., subway tunnels and bridges) (NTSC 2003).
25 Average weekday daily ridership tops 1 million. During the peak rush hour, Metro moves close to 100,000 customers (WMATA 2006). 26 Midmorning on September 11, the Metropolitan Police Department notified the Metro Police of a possible threat to Metro, suggesting that WMATA consider closing the system. Metrorail officials, in consultation with the FBI, decided to keep the system open (NTSC 2003). 27 In New York City, mobile generators enabled the restoration of power to some emergency control centers and prevented extensive water damage to subway tunnels and communications networks (NTSC 2003).

Literature Review 127
Earthquakes and Release of Hazardous Materials The extent to which transit can assist in emergency evacuation directly after an earthquake depends on the severity of the quake, its location, and whether the transit system itself is compromised. On Tuesday, October 17, 1989, the Lomo Prieta earthquake, registering 7.1 on the Richter scale, struck the San Francisco Bay Area at 5:04 PM local time. The epicenter was located some 70 miles from the cities of San Francisco and Oakland, but the quake significantly damaged area highways and bridges, closing the San Francisco–Oakland Bay Bridge and destroying the Cypress Street Viaduct along the Nimitz Freeway in Oakland, which feeds the Bay Bridge (Dames and Moore Engineering Earthquake Group 1999). The timing was such that the earthquake could have had a major effect on freeway commuters during the evening rush hour. Fortunately, traffic was unusually light; many people had left early to see the World Series game between the Oakland Athletics and the San Francisco Giants or were already at Candlestick Park when the earthquake struck.28 Less than 3 hours after the earthquake, emergency ferry service provided by Crowly Maritime, a private provider, evacuated those stranded on the wrong side of the bay (Hansen and Weinstein 1991). Although inspection of the Bay Area Rapid Transit (BART) system’s underwater transbay tube showed no damage, many commuters were reluctant to take BART across the bay because of concerns about being trapped in the tunnel in an aftershock. Thus, BART did not play a major role in moving passengers immediately after the earthquake. It did, however, become the primary passenger transportation link between the San Francisco and East Bay communities on the Monday following the quake when commuters were expected to return to work (Dames and Moore Engineering Earthquake Group 1999). During the first full business week after the event, ridership grew from a normal average of 218,000 passengers per day to an average of 308,000 passengers per day. The Golden Gate Ferry and Golden Gate Transit Bus System provided another option for commuters, the Golden Gate bridge being undamaged by the earthquake. Some of the 30,000–40,000 drivers diverted from the Bay Bridge used the Golden Gate Ferry and Richmond-San Rafael Bridge as alternatives, and to a lesser extent the Golden Gate Transit Bus System.29 Overall, transit played a major role as an alternative mode of travel after the earthquake (Deakin 1991), but played a lesser role as a means of evacuation. A release of hazardous materials may also trigger an evacuation. On July 18, 2001, Baltimore firefighters were notified that a CSX freight train was on fire in the Howard Street Tunnel, located in the heart of the city’s business and tourist districts. The train was carrying a variety of hazardous materials (NTSC 2003). Emergency response was further complicated by a 40-inch water main break located almost directly above the site of the derailment, which spilled water into the tunnel and onto the street. The event occurred just as the city was preparing for the evening rush hour and a baseball doubleheader at nearby Camden Yards stadium. Emergency responders were faced with a potential evacuation of the downtown area. Fortunately, they ascertained that the hazardous materials involved in the fire would not pose a serious environmental hazard, and evacuation proved unnecessary. The tunnel fire, however, had an immediate impact on transportation in Baltimore City (NTSC 2003). City streets were closed in the vicinity of the tunnel; the Maryland Transit
28 http://en.wikipedia.org/wiki/Loma_Prieta_earthquake, accessed on 2/6/07. 29 Increases in ridership on the Golden Gate Ferry averaged 40 percent over the 3 months following the quake (Golden Gate Ferry and Golden Gate Bridge Play Critical Role in Responding to Bay Area Emergencies 2006). Golden Gate Transit Bus ridership grew more modestly, by approximately 4 percent.
128 Special Report 294: The Role of Transit in Emergency Evacuation
Administration subway station closest to the fire was shut down; buses were rerouted around the closures; and light rail service in the vicinity of the water main break was disrupted, as was MARC commuter rail and Oriole game-day service. The Maryland Transit Administration set up a “bus bridge” to supplement service, bringing MARC passengers into the city and the game. Despite the disruption, the city was cleared of traffic within 2 hours of the end of the normal rush hour period (NTSC 2003). During this event, the primary role of transit was to help ease service disruptions. Nuclear Power Plant Accidents A nuclear power plant accident is likely to trigger an evacuation, with many people choosing to leave even if evacuation is not mandated. Fortunately, radiological releases are rare occurrences, although fears of a terrorist incident involving a nuclear facility have increased significantly since the attacks of September 11. The most noteworthy nuclear accident, of course, was at Three Mile Island in 1979. Richard Thornburgh, Governor of Pennsylvania at the time, recommended that some 3,400 pregnant women and preschool children within a 5-mile radius of the plant leave, and schools within that area were closed. Evacuation plans for some 650,000 people living within 20 miles of the plant were prepared, but a full-scale evacuation proved unnecessary (Pennsylvania Highways undated). Nevertheless, continuing uncertainty over the status of the plant and the beginning of the weekend prompted a spontaneous evacuation of about 200,000 people—nearly 40 percent of the population within 15 miles of the reactor (Zeigler and Johnson 1984). Numerous studies of evacuation behavior during the Three Mile Island incident suggest that the public is likely to overrespond to evacuation orders because of their fear of radiation exposure (Dotson and Jones 2005). If plans are not carefully formulated and implemented, self-evacuations of those farther from the event site could hinder the evacuation of those closer in and thus at higher risk.
After the Three Mile Island accident, the Nuclear Regulatory Commission and the Federal Emergency Management Administration instituted a requirement that jurisdictions with nuclear power facilities, as well as neighboring jurisdictions, establish and exercise evacuation and sheltering-in-place procedures and identify vulnerable populations, including persons with disabilities. Many areas have also conducted evacuation time studies. It is not surprising, then, that the majority of jurisdictions that receive high marks for evacuation in the DHS Nationwide Plan Review are those with fixed nuclear facilities (DHS 2006). Nevertheless, many issues remain, particularly with respect to evacuating those without cars. The availability of buses—and more important, drivers—to transport those without access to a private vehicle in the event of a radiological release continues to be a concern. SUMMARY AND FINDINGS Recent comprehensive reviews of emergency plans in all states and the 75 largest urban areas have found significant weaknesses in evacuation planning. Particularly relevant for the present study, only a small fraction of states and urban areas have incorporated all available modes of transportation into their evacuation plans. Plans of state and local jurisdictions in the five hurricane-prone Gulf Coast states, which face recurring seasonal hazards and have high population densities, are generally rated effective for highway evacuations. However, there is

Literature Review 129
little evidence of provisions for coordination between bus and automobile traffic or expedited use of higher-capacity buses during an evacuation. Moreover, the reviews deem all plans woefully inadequate with respect to the evacuation of those who are transit-dependent and may require special assistance (e.g., the elderly, the disabled) in reaching bus staging areas and rail stations or may need on-demand accessible vehicles. In addition, few plans provide for coordination with neighboring jurisdictions in the event of an emergency evacuation or have standby contracts with paratransit providers, private motor coach companies, ambulance companies, and railroads to ensure that equipment and drivers will be available should local capacity prove insufficient. Transit, particularly buses and rail systems with regional coverage, can play a critical role in emergency evacuation, assuming that the systems themselves are not compromised during the event. Typically, however, limited time is available when an emergency strikes; transportation officials frequently must implement evacuation plans and recovery procedures almost immediately following the event. Thus, advanced planning, a well-established chain of command, and provision for communication among key responders and with the general public are critical to a successful evacuation. Many of the studies reviewed in this survey of the literature offer suggestions for strengthening the role of transit in emergency evacuations:
• Inclusion of transit providers, as well as social service agencies, in the development of emergency plans.
• Identification of transit-dependent populations and those requiring special assistance in an evacuation through special registries and computer mapping, and provision of this information to emergency responders, including information on where these individuals should be taken, well in advance of an event.
• Specification of the responsibilities of essential transit personnel in an emergency, provision for the evacuation needs of their families, and securing of transit equipment to the extent possible.
• Establishment of means of communication, including contingency communications plans, among transit agency personnel and with other emergency responders.
• Development of memoranda of understanding with neighboring jurisdictions, sometimes across state lines, as well as standby contracts with private providers to help ensure that transit vehicles, including accessible equipment and trained drivers, will be available to meet surge requirements in an emergency and that transport destinations will be clear.
• Establishment of protocols with a clear chain of command and checklists for critical transit personnel and emergency responders.
• Provision of emergency evacuation information in accessible formats to the public, particularly vulnerable populations, regarding how they can access transit (e.g., bus staging areas) and obtain assistance, if necessary, during an emergency evacuation.
• Frequent drills and exercises, including evacuation of vulnerable populations, under a wide range of emergency scenarios to determine how well evacuation plans work in practice and plan revisions accordingly.
130 Special Report 294: The Role of Transit in Emergency Evacuation
REFERENCES Abbreviations DDOT District Department of Transportation
DHS U.S. Department of Homeland Security CDC Centers for Disease Control and Prevention
GAO U.S. Government Accountability Office NRC National Research Council NTSC John A. Volpe National Transportation Systems Center USDOT U.S. Department of Transportation WMATA Washington Metropolitan Area Transit Authority American Public Transportation Association. 2001. America Under Threat: Transit Responds to
Terrorism. Special Report, September 11, 2001. Supplement to Passenger Transport. Washington, D.C.
Bailey, D., S. Swiacki, A. Byrnes, J. Buckley, D. King, V. Piper, M. Marino, S. Mundle, G. Pierlott, and A. Lynd. 2007. Transportation Equity in Emergencies: A Review of the Practices of State Departments of Transportation, Metropolitan Planning Organizations, and Transit Agencies in 20 Metropolitan Areas. Final Report. FTA-PA-26-8001-2007. Milligan & Company, LLC and Mundle & Associates, Philadelphia, PA, May.
Blumenberg, E., and A. E. Evans. 2007. Transportation Assimilation: Immigrants, Race and Ethnicity, and Mode Choice. Prepared for the TRB 2008 Annual Meeting.
CDC. 1995. Crisis Emergency Risk Communication by Leaders for Leaders. Atlanta, GA. Cervero, R. 1993. Ridership Impacts of Transit-Focused Development in California. Chapter 2.
National Transit Access Center, University of California, Berkeley, CA. City of Chicago. 2007. September 7, 2006 Central Business District Evacuation Exercise AfterAction
Report, Chicago, IL, April 3. Cox, W. 2006. Emergency Evacuation Report Card 2006. American Highway Users Alliance,
Washington, D.C., Oct. 13, http://www.highways.org/pdfs/evacuation_report_card2006.pdf. Crane, R. 2000. The Impacts of Urban Form on Travel: An Interpretive Review. Journal of Planning
Literature, Vol. 15, pp. 2–23. Dames and Moore Earthquake Engineering Group. 1999. The LOMO Prieta Earthquake: Impact on
Lifeline Systems. Disaster Recovery Journal Online. Deakin, E. 1991. Transportation Impacts of the 1989 Lomo Prieta Earthquake: The Bay Bridge
Closure. Working Paper. UCTC No. 294. University of California Transportation Center, University of California, Berkeley, CA, Oct.
DDOT. 2005. July 4th 2005 Emergency/Evacuation Route Test After-Action Report, Washington, D.C. DHS. 2006. Nationwide Plan Review, Phase 2 Report. Washington, D.C., June 16,
http://www.dhs.gov/xlibrary/assets/Prep_NationwidePlanReview.pdf. Dotson, L. J., and J. Jones. 2005. Identification and Analysis of Factors Affecting Emergency
Evacuations. Main Report. NUREG/CR-6864, Vol. 1. Sandia National Laboratories, Albuquerque, NM, Jan.
Enarson, E., and B. H. Morrow. 1997. A Gendered Perspective: The Voices of Women. In Hurricane Andrew: Ethnicity, Gender, and the Sociology of Disasters (W. G. Peacock, B. H. Morrow, and H. Gladwin, eds.), International Hurricane Research Center, Miami, FL, pp. 116–140.
Florida DOT. 2006. Contra Flow Workshop. Orlando, FL, Feb. 14–15. Florida’s Evacuations and Transit’s Role. 2006. CUTRlines, Vol. 16, No. 2, p. 4. GAO. 2006. Transportation-Disadvantaged Populations, Actions Needed to Clarify Responsibilities and
Increase Preparedness for Evacuations. GAO-07-44. Washington, D.C., Dec., http://www.gao.gov/new.items/d0744.pdf.
Literature Review 131
Golden Gate Ferry and Golden Gate Bridge Play Critical Role in Responding to Bay Area Emergencies. 2006. Golden Gate Bridge, Highway and Transportation District, San Rafael, CA, Apr. 3.
Goodwill, J. A., and A. Reep. 2005. Transit Emergency Planning and Response Assessment Initiative. Center for Urban Transportation Research, University of South Florida, Tampa, FL, Sept.
Hansen, M., and S. Weinstein. 1991. East Bay Ferry Service and the Lomo Prieta Earthquake. UCTC No. 162. Institute of Transportation Studies, University of California at Berkeley, Berkeley, CA, Dec.
Houston, N. 2006. Using Highways during Evacuation Operations for Events with Advance Notice: Routes to Effective Evacuation Planning Primer Series. FHWA-HOP-06-109. Booz Allen Hamilton, McLean, VA, Dec.
Kailes, J. I. 2005. Disaster Services and “Special Needs”—Term of Art or Meaningless Term? Center for Disability Issues and the Health Professions, Western University of Health Sciences, Pomona, CA, Feb.
Kendra, J., T. Wachtendorf, and E. Quarantelli. 2003. The Evacuation of Lower Manhattan by Water Transport on September 11: An Unplanned “Success,” Forum. Joint Commission Journal on Quality and Safety, Vol. 29, No. 6, June, pp. 316–318.
Krizek, K. J., and A. M. El-Geneidy. 2006. Better Understanding the Potential Market of Metro Transit’s Ridership and Services. Final Report. Center for Transportation Studies, Minneapolis, MN, Oct.
Lindell, M. K., and R. W. Perry. 2004. Communicating Environmental Risk in Multiethnic Communities. Sage Publications, Thousand Oaks, CA.
Litman, T. 2005. Lessons from Katrina and Rita: What Major Disasters Can Teach Transportation Planners. Victoria Transport Policy Institute, Victoria, British Columbia, Nov. 1.
Mileti, D. 1999. Disasters by Design. Joseph Henry Press, Washington, D.C. National Consortium on the Coordination of Human Services Transportation. 2006. Strategies in
Emergency Preparedness for Transportation-Dependent Populations. Washington, D.C., Sept., http://www.dotcr.ost.dot.gov/Documents/Emergency/Emergency%20Preparedness%20Strategy%20Paper.doc.
NRC. 1989. Improving Risk Communication. National Academy Press, Washington, D.C. NRC. 1996. Understanding Risk: Informing Decisions in a Democratic Society. National Academy
Press, Washington, D.C. NTSC. 2003. Effects of Catastrophic Events on Transportation System Management and Operations.
Cross Cutting Study. Cambridge, MA, Jan. Office of Emergency Management and Communications of the City of Chicago. 2007. September 7,
2006 Central Business District Evacuation Exercise AfterAction Report, Chicago, IL, Apr. 3. Peacock, W. G., P. Maghelal, M. K. Lindell, and C. S. Prater. 2007. Hurricane Rita Behavioral Survey.
Final Report. Hazard Reduction and Recovery Center, Texas A&M University, College Station, TX. Pennsylvania Highways. Undated. Three Mile Island.
http://www.pahighways.com/features/threemileisland.html. Accessed Feb. 2, 2007. Phillips, B. D., and B. H. Morrow. 2007. Social Science Research Needs: Focus on Vulnerable
Populations, Forecasting, and Warnings. Natural Hazards Review, Vol. 8, No. 3, Aug., pp. 61–68. Pushkarev, B. S., and J. M. Zupan. 1977. Public Transportation and Land Use Policy. Indiana
University Press, Bloomington, IN. Taylor, B. D., and C. N. Y. Fink. 2007. The Factors Influencing Transit Ridership: A Review and
Analysis of the Ridership Literature. Working Paper. UCLA Institute of Transportation Studies, Los Angeles, CA.
Transit’s Role in Florida’s Emergency Response. 2006. CUTRlines, Vol. 16, No. 2, pp. 1–3. USDOT. 2006. Report to Congress on Catastrophic Hurricane Evacuation Plan Evaluation. In
cooperation with the U.S. Department of Homeland Security, Washington, D.C., June 1, http://www.fhwa.dot.gov/reports/hurricanevacuation/.

132 Special Report 294: The Role of Transit in Emergency Evacuation
Willigen, M. V., T. Edwards, B. Edwards, and S. Hessee. 2002. Riding out the Storm: Experiences of the Physically Disabled during Hurricanes Bonnie, Dennis, and Floyd. Natural Hazards Review, Vol. 3, No.3, pp. 98–106.
WMATA. 2006. Transit and Evacuation. Power Point Presentation, Virginia Emergency Management Conference, Apr. 6.
Wolshon, B. 2006. Evacuation Planning and Engineering for Hurricane Katrina. The Bridge, Vol. 36, No. 1.
Wolshon, B., E. Urbina, and M. Kevitan. 2001. National Review of Hurricane Evacuation Plans and Policies. Louisiana State University Hurricane Center, Baton Rouge, LA.
Zeigler, D. J., and J. H. Johnson, Jr. 1984. Evacuation Behavior in Response to Nuclear Power Plant Accidents. Professional Geographer, Vol. 36, No. 2.
Zimmerman, C., R. Brodesky, and J. Karp. 2007. Using Highways for No-Notice Evacuation: Routes to Effective Evacuation Planning Primer Series. FHWA-HOP-08-003. Batelle, Columbus, OH, Nov.

133
APPENDIX C
Assessment of Transit’s Role in Emergency Response and Evacuation Plans of 33 Urbanized Areas and Related States
JOSEPH M. MALTBY AND AARON D. GREEN
George Mason University School of Law
he purpose of the committee’s plan assessment was to evaluate 33 urbanized areas (UAs)1 to determine whether they had emergency response or evacuation plans, whether those plans
considered the use of transit resources, and to what extent. The project was divided into two stages—a pilot and the main component. During the pilot, each author reviewed three plans, one of which was also reviewed by the other author. The results were sent to Transportation Research Board (TRB) staff to ensure that the methodology was appropriate and that the authors were consistent in their assessments. The plans of the remaining UAs were then analyzed using the same method.
The authors divided the plans into two groups, with each author analyzing the plans of about half the UAs and related states. Internet searches were used to locate the publicly available emergency planning documents for each UA and state. The documents were then reviewed to answer 14 questions, the responses to which were summarized in a matrix. When no publicly available emergency planning documents could be found, the authors contacted the relevant emergency or planning departments by telephone to ascertain whether the documents could be located. Some of those contacted did not respond. In other cases, plans were not available to the public for security reasons or because of technical problems.
Of the 33 UAs reviewed, 16 had made publicly available at least parts of an emergency response or evacuation plan, while 17 either did not have publicly available plans or were in the process of drafting or revising them. Of the 16 UAs with available plans, 13 had plans that, for at least for one question, mentioned a relevant transit agency, while 3 did not.
A summary of the results for questions 1–12 is provided below (questions 13 and 14 asked for the location of the plan on line and the plan’s date, respectively). Full detail on the results is available on line.
1 The remaining 5 urbanized areas were handled as case studies, with detailed assessments of the role of transit. The results of these case studies are presented in Appendix D.
T

134 Special Report 294: The Role of Transit in Emergency Evacuation
Question No. Yes No. No No. Yes & Noa No. N/Ab 1. Is the area transit agency included in the Transportation Annex of the Emergency Response Plan?
10 10 6 7
2. Is transit part of the area’s emergency evacuation plan, if one exists?
11 4 4 14
3. Are sufficient details provided to make transit’s role credible?
7 6 3 17
4a. Are transit officials part of the decision-making team in the event of an emergency?
6 11 0 16
4b. Is their place in the chain of command clearly indicated?
7 6 3 17
5. Are methods described for communications among key transit personnel and between transit personnel and other key agency staff (e.g., Department of Transportation, Emergency Management Agencies) in the event of an emergency?
3 11 2 17
6. Is transit equipment (e.g., buses, rail cars, paratransit vehicles) identified that could be made available in an emergency evacuation?
7 4 5 17
7. Are provisions made for ensuring that transit staff will be available in the event of an emergency (e.g., identification of critical personnel, provision for evacuation of families of transit operating personnel)?
0 15 1 17
8. In the event of an emergency that overwhelms local transit capacity, are memoranda of understanding and stand-by contracts with neighboring providers and the private sector mentioned?
1
14 1 17
9a. Is transit’s role in evacuating special-needs populations described?
6 9 1 17

Assessment of Transit’s Role in Emergency Response and Evacuation Plans 135 Question No. Yes No. No No. Yes & Noa No. N/Ab 9b. Are methods for identifying these populations described (e.g., special registries)?
1 15 0 17
9c. Are pick-up locations for those who are ambulatory identified?
1 12 3 17
9d. Is provision made for communicating this information, along with emergency numbers and instructions of what to do in an emergency, to potential transit users?
3 9 4 17
9e. Are methods for evacuating those who need special assistance (e.g., the disabled, the elderly) by transit described?
1 13 2 17
9f. Were representatives of special-needs populations or those who work with them (e.g., social service agencies) involved in development of emergency response and evacuation plans?
3 10 3 17
10. Have destinations (e.g., shelters) been identified for those who will be evacuated by transit?
1 10 5 17
11. Does transit play a role in bringing emergency responders and equipment to the emergency site or in recovery operations (e.g., bringing transit-dependent people back to the area once the emergency has passed)?
1 11 4 17
12. Is provision made for practicing the plan (e.g., table-top exercises)?
8 5 4 16
aMixed response. More than one plan was reviewed. bNot applicable, available, or ascertainable.

137
APPENDIX D
Case Studies
CASE STUDY QUESTIONNAIRES
As discussed in Chapter 1, the committee’s information-gathering efforts included a series of five case studies. For each of these studies, questionnaires were provided in advance of the site visits and used as the basis for interviews with emergency managers and representatives of transit agencies and departments of transportation. These questionnaires are reproduced below, followed by a summary of the results of each case study. Questions for Interviews with Emergency Managers Background Questions
1. Please provide basic information on the responsibility of your agency in the region in the event of an emergency. Who has the major responsibility for emergency planning, response, and evacuation? Where do transit agencies fit?
2. Have you completed a hazard analysis for the region, and can you describe the most important hazards facing the region? Emergency Planning
1. Is there a detailed metropolitan-wide emergency plan for the evacuation of citizens in an emergency? Please provide a brief overview of the plan and its major elements. For how long has the plan been in operation?
2. Does the plan differentiate between planned (expected) versus unplanned (unexpected) incidents (e.g., hurricanes versus terrorist attacks or earthquakes)?
3. Is transit integrated into the plan? Please explain. 4. Are there formal arrangements with transit providers in other jurisdictions should
emergency evacuation needs overwhelm the local transit provider? Please describe, including agreements about financing and liability.
5. Are there formal arrangements with other transportation providers, such as commuter rail systems, Amtrak, school bus companies, and intercity bus lines to assist in an emergency evacuation, if needed? Please describe, including agreements about financing and liability.
6. Are arrangements in place to coordinate evacuation by bus with other vehicular traffic in case of an emergency evacuation? Who will manage this?
7. What arrangements are in place with the state or other jurisdictions outside the region should an emergency require evacuation of a large portion of the metropolitan area?
8. What arrangements have been made, if any, for the evacuation of the following special needs populations:
a. Carless residents? b. The elderly?

138 Special Report 294: The Role of Transit in Emergency Evacuation
c. The disabled? d. Those of the above who are non-English speaking? e. People with pets?
9. Do you have any estimate of the size of these various populations, recognizing that there may be some overlap among them?
10. For those special needs populations that require assistance, what provisions have been made for them to access transit (e.g., special needs registries? use of 311/911 systems?).
11. Is paratransit included as part of the plan for emergency evacuation, and if so, how will these vehicles be deployed?
12. Are school buses part of the plan, and, if so, how will they be deployed? 13. Does the plan consider other institutions that may need to be evacuated in an
emergency? Do you know if these institutions and those providing access to special needs populations will be using the same providers, whose staff and equipment would be stretched in an emergency?
a. Corrections b. Hospitals/health care c. Housing for the elderly d. Schools e. Police/fire/medical personnel
14. Has the plan been publicized? For example, have pick-up points been designated where riders can access transit? Have maps or other information been made available? Please provide details.
15. Do you have, or could you provide, an estimate of the maximum amount of people/hour that could be moved by transit in the event of an emergency evacuation? How long would it take to evacuate the majority of the population by transit and personal vehicle in the event of a major incident?
16. Has the emergency evacuation plan ever been tested, either in a drill or in a real emergency? What lessons were learned in this exercise?
17. What constraints (e.g., financial resources, staff, lack of authority, lack of influence over key players in the emergency response system) limit your agency’s ability to plan for evacuations?
18. Has your agency or others in the region applied for federal funds (e.g., from the U.S. Department of Homeland Security, Federal Transit Administration) for emergency evacuation? If so, how much was received, and what were the funds used for?
19. In your judgment, what are the most important factors for a successful evacuation in general, and, in particular, regarding the use of transit?
20. What do you see as the major strengths of the emergency evacuation plan? 21. What are the key weaknesses that need to be addressed?
Emergency Response
1. Please describe the chain of command for decision-making in the event of an emergency evacuation, including where transit officials fit in the process. What is the decision process to determine if an evacuation is warranted? When would those discussions start? Who would be involved? What are the key factors to be considered? What are the thresholds or triggers that drive the process? Are transit officials included in these discussions?
Case Studies 139
2. Please describe the process for communicating with transit providers and other local or state agencies involved in organizing an evacuation in the event of an emergency. Does the emergency management agency have the ability to communicate via voice (radio) and data (email, critical incident management software) with the other agencies that are crucial to a successful response (i.e., law enforcement, public works, traffic operations, transit)?
3. Is the transit agency represented at the City/County Emergency Management Agency Emergency Operations Center or Transportation Management Center during an emergency?
4. What arrangements have been made, if any, for evacuation of the families of operating personnel whom you would expect to work during an emergency evacuation?
5. Do you have designated evacuation routes, or will normal service routes be used in an evacuation?
6. Have you inspected evacuation routes for potential problems, such as a. Flooding b. Streets that the police may close down due to proximity to critical locations c. Other
7. Will people be stationed along the routes to communicate changes to routes if necessary?
8. Have shelters and reception centers been identified that will accept evacuees traveling by transit? How will the evacuees know where they are going?
9. Has any provision been made for using transit to bring equipment and personnel to the emergency site(s)? Recovery Operations
1. Does the plan look at how people will reenter the area after an evacuation, and what the role of transit might be in recovery operations?
2. What role does law enforcement play in providing security, traffic control, and coordination with transit and other relevant agencies? Questions for Interviews with Transit Agencies Background Questions
1. Please provide basic information on the size and geographic characteristics of the urbanized area (e.g., population, density, other factors that could affect evacuation capability).
2. Provide basic information on the size and responsibilities of your transit system (e.g., ridership, modes (rail, bus, etc.), hours of operation, number of employees, annual budget).
3. Provide information on the main hazards facing the region and who has the major responsibility for emergency planning and response. Where does transit fit? Emergency Planning
1. Is there a detailed plan for using the transit system to evacuate people from critical locations in the region in the event of an emergency? Please provide a brief overview of the plan and its major elements. How long has the plan been in operation?
140 Special Report 294: The Role of Transit in Emergency Evacuation
2. Is the plan part of a larger metropolitan-wide emergency evacuation plan? If so, for how long has this been the case? What agency or official is responsible for this metropolitan plan, and what input did your agency have in developing/maintaining it?
3. Does the plan differentiate between planned (expected) versus unplanned (unexpected) incidents (e.g., hurricanes versus terrorist attacks or earthquakes)?
4. Do you have formal arrangements with transit providers in other jurisdictions should emergency evacuation needs overwhelm your agency’s resources? Please describe, including agreements about financing and liability.
5. Do you have formal arrangements with other transportation providers, such as commuter rail systems, Amtrak, school bus companies, and intercity bus lines to coordinate with them in case of an emergency evacuation? Please describe, including agreements about financing and liability.
6. Do you have arrangements with the Department of Transportation to coordinate evacuation by bus with other vehicular traffic in case of an emergency evacuation?
7. What arrangements are in place with the state or other jurisdictions outside the region should an emergency require evacuation of a large portion of the metropolitan area?
8. What arrangements have been made, if any, for the evacuation of the following special needs populations:
a. Carless residents? b. The elderly? c. The disabled? d. Those of the above who are non-English speaking? e. People with pets?
9. Do you have any estimate of the size of these various populations, recognizing that there may be some overlap among them?
10. For those special needs populations that require assistance, what provisions have been made for them to access transit (e.g., special needs registries? use of 311/911 systems?).
11. Is paratransit included as part of the plan for emergency evacuation, and if so, how will these vehicles be deployed?
12. Are school buses part of the plan, and, if so, how will they be deployed? 13. Does the plan consider other institutions that may expect to use your services? Do
you know if these institutions and those providing access to special needs populations will be using the same providers, whose staff and equipment would be stretched in an emergency?
a. Corrections b. Hospitals/health care c. Housing for the elderly d. Schools e. Police/fire/medical personnel
14. Has the plan been publicized. For example, have pick-up points been designated where riders can access transit? Have maps or other information been made available? Please provide details.
15. Do you have, or could you provide, an estimate of the maximum amount of people/hour that could be moved by transit in the event of an emergency evacuation? Could this number exceed the afternoon peak rush? How long would it take to evacuate the majority of the population in the event of a major incident?

Case Studies 141
16. Has the emergency evacuation plan (just the transit agency) or that of larger metropolitan area (involving all the relevant agencies) ever been tested, either in a drill or in a real emergency? What lessons were learned in this exercise?
17. What constraints (e.g., financial resources, staff, lack of authority, lack of influence over key players in the emergency response system) limit your agency’s ability to plan for evacuations?
18. Has your agency or others in the region applied for federal funds (e.g., from the U.S. Department of Homeland Security, Federal Transit Administration) for evacuation planning? If so, how much was received, and what were the funds used for?
19. In your judgment, what are the most important factors for a successful evacuation using transit?
20. What do you see as the major strengths of the emergency evacuation plan? 21. What are the key weaknesses that need to be addressed?
Emergency Response
1. Please describe the chain of command for decision-making in the event of an emergency evacuation a) within your own agency and b) with respect to the metropolitan-wide plan. Are transit personnel trained in NIMS (National Incident Management System)/ICS (Incident Command System)?
2. Please describe the process for communicating with other transportation providers and other local or state agencies involved in organizing an evacuation in the event of an emergency. Does the transit agency have the ability to communicate via voice (radio) and data (email, critical incident management software) with the other agencies that are crucial to a successful response (i.e., law enforcement, public works, traffic operations, emergency management)?
3. Does your agency send a representative to the City/County Emergency Management Agency Emergency Operations Center or Transportation Management Center during an emergency?
4. What arrangements have been made, if any, for evacuating the families of transit operating personnel whom you would expect to work during an emergency evacuation?
5. Have you factored into your plan the amount of time necessary to move all your assets to safe ground prior to damaging conditions setting in (planned/expected incidents), and do the city planners know about this time?
6. Do you have designated evacuation routes, or will normal service routes be used in an evacuation?
7. Have you inspected evacuation routes for potential problems, such as a. Flooding b. Streets that the police may close down due to proximity to critical locations c. Other
8. Will people be stationed along the routes to communicate changes to routes if necessary?
9. Have shelters and reception centers been identified that will accept the evacuees traveling by transit? How will the evacuees know where they are going?
10. Has any provision been made for using transit to bring equipment and personnel to the emergency site(s)?
142 Special Report 294: The Role of Transit in Emergency Evacuation Recovery Operations
1. Does the plan look at how people will reenter the area after an evacuation and transit’s role in that? Questions for Interviews with Departments of Transportation Background Questions
1. Please provide basic information on the size and geographic characteristics of the urbanized area (e.g., population, density, factors about the highway system and congestion that could affect evacuation capability).
2. Provide basic information on the size and responsibilities of your department (e.g., number of employees, annual budget, major responsibilities for area road system).
3. Provide information on the main hazards facing the region and who has the major responsibility for emergency planning and response. Where does DOT fit? Emergency Planning
1. Is there a detailed plan for using the highway system to evacuate people from critical locations in the region in the event of an emergency? Please provide a brief overview of the plan and its major elements. How long has the plan been in operation?
2. Is the plan part of a larger metropolitan-wide emergency evacuation plan? If so, for how long has this been the case? What agency or official is responsible for this metropolitan plan, and what input did the DOT have in developing/maintaining it?
3. Does the plan differentiate between planned (expected) versus unplanned (unexpected) incidents (e.g., hurricanes versus terrorist attacks or earthquakes)?
4. Does the DOT have arrangements with other transportation providers (e.g., transit agencies, schools) to coordinate evacuation by bus with other vehicular traffic in case of an emergency evacuation?
5. What arrangements are in place with the state or other jurisdictions outside the region should an emergency require evacuation of a large portion of the metropolitan area?
6. What arrangements have been made, if any, for the evacuation of the following special needs populations:
a. Carless residents? b. The elderly? c. The disabled? d. Those of the above who are non-English speaking? e. People with pets?
7. Do you have, or could you provide, an estimate of the maximum amount of people/hour that could be moved in the event of an emergency evacuation? Could this number exceed the afternoon peak rush? How long would it take to evacuate the majority of the population in the event of a major incident?
8. Has the emergency evacuation plan ever been tested, either in a drill or in a real emergency? What lessons were learned in this exercise?

Case Studies 143
9. What constraints (e.g., financial resources, staff, lack of authority, lack of influence over key players in the emergency response system) limit your agency’s ability to plan for evacuations?
10. Has your agency or others in the region applied for federal funds (e.g., from the U.S. Department of Homeland Security, Federal Highway Administration) for evacuation planning? If so, how much was received, and what were the funds used for?
11. In your judgment, what are the most important factors for a successful evacuation? 12. What do you see as the major strengths of the emergency evacuation plan? 13. What are the key weaknesses that need to be addressed?
Emergency Response
1. Please describe the chain of command for decision-making in the event of an emergency evacuation a) within your own agency and b) with respect to the metropolitan-wide plan. Are DOT personnel trained in NIMS (National Incident Management System)/ICS (Incident Command System)?
2. Please describe the process for communicating with other transportation providers and other local or state agencies involved in organizing an evacuation in the event of an emergency. Does the DOT have the ability to communicate via voice (radio) and data (email, critical incident management software) with the other agencies that are crucial to a successful response (i.e., law enforcement, public works, traffic operations, emergency management)?
3. Does your agency send a representative to the City/County Emergency Management Agency Emergency Operations Center or Transportation Management Center during an emergency?
4. What arrangements have been made, if any, for evacuating the families of DOT operating personnel whom you would expect to work during an emergency evacuation?
5. Have you factored into your plan the amount of time necessary to move all your assets to safe ground prior to damaging conditions setting in (planned/expected incidents), and do the city planners know about this time?
6. Do you have designated evacuation routes, or will normal service routes be used in an evacuation?
7. Have you inspected evacuation routes for potential problems, such as a. Flooding b. Streets that the police may close down due to proximity to critical locations c. Other
8. Will people be stationed along the routes to communicate changes to routes if necessary?
9. Does the DOT have plans for using contra-flow operations, if needed, in an evacuation? If so, who will make the decision to begin contra-flow operations, and how will this be communicated to other emergency responders, transportation providers, and the public? What provisions have been made for expediting bus travel and providing access for emergency responders in a contra-flow situation?
10. Have arrangements been made to provide gas and other supplies along evacuation routes?
11. Have arrangements been made to clear evacuation routes of broken down vehicles (e.g., contracts with towing companies)?

144 Special Report 294: The Role of Transit in Emergency Evacuation
12. Have shelters and reception centers been identified that will accept evacuees traveling by transit? How will the evacuees know where they are going?
13. Has any provision been made for using transit or other transportation providers to bring equipment and personnel to the emergency site(s)? Recovery Operations
1. Does the plan look at how people will reenter the area after an evacuation? What is DOT’s role in that? HOUSTON CASE STUDY In addition to responses to the questionnaires presented above, this case study is based on information gathered during a site visit made on February 13–14, 2007. Overview Houston Demographics and Geography According to the U.S. Census, the population of the Houston urbanized area (UA) was approximately 3.8 million in 2000, making it the tenth largest of the 38 UAs with populations of greater than 1 million.1 The two primary political jurisdictions that overlap the UA are the City of Houston, with a 2000 population of 1.9 million, and Harris County, with a 2000 population of 3.6 million, the third most populous county in the United States. The Houston region is growing rapidly. The population of Harris County alone is projected to double by 2015.
The Houston UA is notable for its low density. Of the 38 largest UAs, it ranks eighth in land area (square miles) and nineteenth in population density. According to the 2000 Census, 11 percent of occupied housing units lacked access to a vehicle, a fact that, combined with the area’s low density, poses a challenge for the effective use of public transportation in an emergency evacuation.
The majority of the Houston UA is located inland from the Gulf Coast and is therefore not subject to storm surge. Nevertheless, the UA’s proximity to the Gulf and low height—50 feet on average above sea level—make it vulnerable to frequent flooding. In addition, an estimated 800,000 to 1 million residents of Galveston, other coastal counties, and a portion of Harris County are vulnerable to both flooding and storm surge. These residents typically evacuate to or through Houston, depending on the magnitude of the storm, thereby complicating any evacuation that involves the Houston UA itself (see Figure D-1).
1 Data on UA population, land area, and population density were drawn from the U.S. Bureau of the Census’s, 2000 Decennial Census of Population and Housing and the Federal Transit Administration’s 2003 National Transit Database.
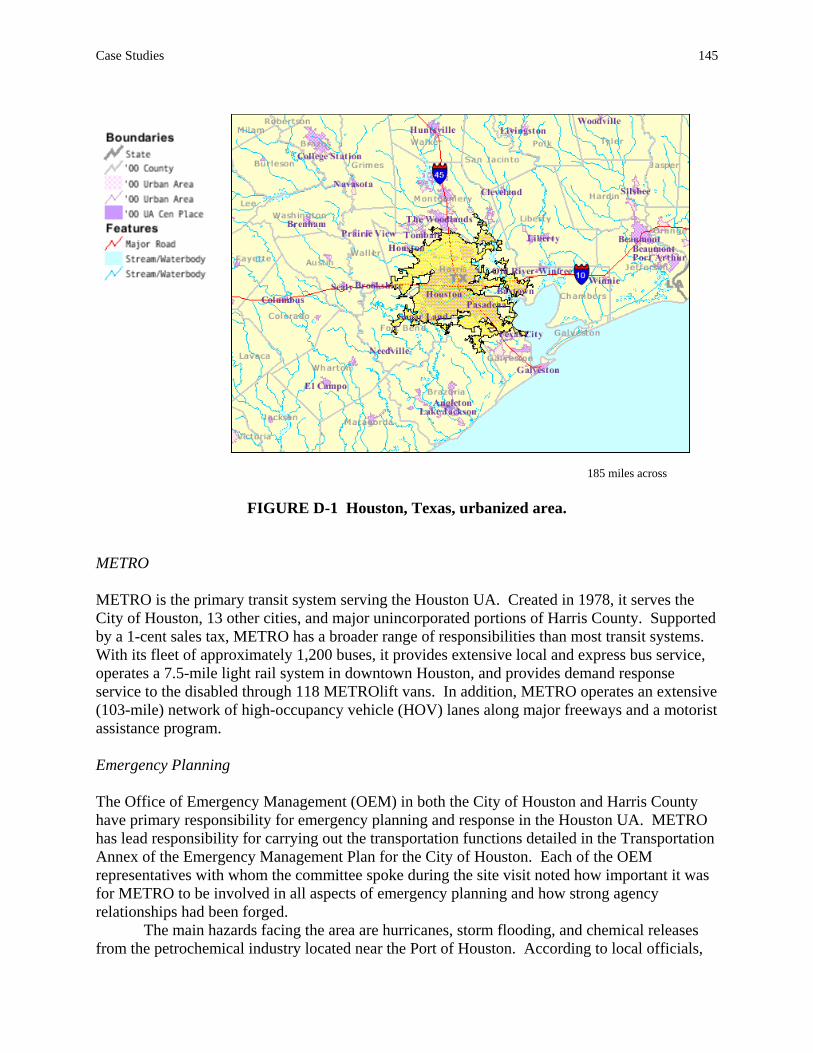
Case Studies 145
185 miles across
FIGURE D-1 Houston, Texas, urbanized area. METRO METRO is the primary transit system serving the Houston UA. Created in 1978, it serves the City of Houston, 13 other cities, and major unincorporated portions of Harris County. Supported by a 1-cent sales tax, METRO has a broader range of responsibilities than most transit systems. With its fleet of approximately 1,200 buses, it provides extensive local and express bus service, operates a 7.5-mile light rail system in downtown Houston, and provides demand response service to the disabled through 118 METROlift vans. In addition, METRO operates an extensive (103-mile) network of high-occupancy vehicle (HOV) lanes along major freeways and a motorist assistance program. Emergency Planning The Office of Emergency Management (OEM) in both the City of Houston and Harris County have primary responsibility for emergency planning and response in the Houston UA. METRO has lead responsibility for carrying out the transportation functions detailed in the Transportation Annex of the Emergency Management Plan for the City of Houston. Each of the OEM representatives with whom the committee spoke during the site visit noted how important it was for METRO to be involved in all aspects of emergency planning and how strong agency relationships had been forged.
The main hazards facing the area are hurricanes, storm flooding, and chemical releases from the petrochemical industry located near the Port of Houston. According to local officials,

146 Special Report 294: The Role of Transit in Emergency Evacuation these hazards do not require evacuation of the entire Houston regional area; Hurricane Rita was an exception, as described in the following section. If an evacuation is necessary, elected officials—the Mayor of the City of Houston and the Harris County Judge—are responsible for making the call. This authority was provided in 2005 by a legislative change. Presently, there is some discussion of vesting this authority in the Governor’s Office, but local jurisdictions such as the City of Houston and Harris County do not support this proposal. Metro’s Role in Emergency Evacuation During and After Hurricane Rita Surprisingly, hurricanes on the scale of Katrina and Rita are infrequent events for the Houston area. The last major hurricane was Category 3 Alicia in 1983, and METRO, which had been in existence only 5 years at the time, had no plans to stop normal service. In 2001, tropical storm Allison, which did not reach hurricane status, caused intense flooding, particularly in parts of downtown Houston. As a result of the storm, 30,000 were left homeless, businesses were damaged, and several hospitals were forced to evacuate patients; however, a major evacuation was not necessary. In 2005, the Houston area braced for two major hurricanes that followed in close succession. Hurricane Katrina did not threaten the area directly, but the vivid images of Katrina victims were still fresh in the minds of Houstonians when Category 5 Hurricane Rita bore down on the region less than 1 month after Hurricane Katrina made landfall.
METRO learned many valuable lessons in dealing with Hurricane Katrina that it applied in the evacuation preceding Hurricane Rita. METRO’s primary role during Katrina was to move newly arrived New Orleans evacuees from area airports into Houston, where shelter was provided at the Astrodome and nearby Reliant Park. Relief activities lasted 20 days. An incident command center was established at Reliant Park, where METRO operations and police personnel received and fielded requests for service. In addition to transporting evacuees, METRO provided trolley, bus, and rail service for some 150,000 to 200,000 Katrina victims—among them 4,000 school-aged children—from the small city that grew up at Reliant Park to neighboring medical facilities, government offices, and food and retail outlets.
Hurricane Rita was originally thought to be on a direct path to Galveston and Houston, although it subsequently declined in force and veered away from the Houston area. Evacuations were ordered for Galveston on Tuesday. All residents were expected to leave by noon on Wednesday—2 days before the hurricane’s estimated landfall—but large numbers of Houstonians also took to the roads on Wednesday and Thursday, clogging the area’s four major freeway evacuation routes. The existing evacuation plan was geared to a partial exodus of no more than 1 million people from storm surge zones and assumed vehicle occupancy rates of about 2.1 persons per car. Instead, between 1.5 and 2.5 million people attempted to evacuate Harris County, taking with them all the vehicles, boats, and trailers they owned, resulting in occupancy rates of about 1.2 persons per car.2 The result was predictable—massive traffic jams, with vehicles that ran out of fuel or broke down, for a period of 24 hours or more.
Despite the bedlam on the freeways, METRO was able to play an important role in the evacuation of residents of Galveston and Houston without access to private transportation who attempted to flee the region in advance of Hurricane Rita. In part because of its role in helping victims of Hurricane Katrina, METRO already had good working relationships with many of the
2 According to modeling estimates provided after Hurricane Rita by the Houston–Galveston Area Council, it would take 80 to 120 hours to evacuate 3 million residents from the Galveston, Houston, and other coastal areas, assuming use of contra-flow and optimum flow conditions.

Case Studies 147
area’s emergency responders. Moreover, the agency was a member of the unified command center team that operated out of Houston TranStar, the region’s state-of-the-art transportation management center. METRO is now a member of the regional unified area command structure, which was established after Hurricane Rita on the recommendation of the Governor’s Task Force on Evacuation, Transportation, and Logistics and is physically located at TranStar. METRO has a police captain assigned to TranStar and is a member of its leadership team. All of the other team members interviewed for this study—representatives of the Harris County OEM, the City of Houston OEM, TranStar management, and the Texas Department of Transportation (TxDOT)—underscored the importance of establishing good working relationships with METRO personnel and keeping them involved in all aspects of planning.
During the evacuation, METRO performed the following functions:
• Coordinated bus transport for those who lacked access to or who chose not to use a personal vehicle in the evacuation from Galveston and Houston; 500 METRO buses and 500 other vehicles transported approximately 20,000 individuals in 4,500 trips.
• Supplemented bus transport with rail by arranging for the use of Amtrak and Trinity Railroad (Dallas commuter rail) trains to move people out of Galveston and Houston.
• Handled special-needs populations through the 311 system (manned phones) and last-minute neighborhood sweeps of flood-prone areas.
• Provided logistics support to stranded motorists along freeways, using 18 METRO buses, bus operators, police, and 350 volunteers to distribute 45,000 bottles of water.
• Brought fuel to emergency response teams. • Played a lead role in convincing the state to open contra-flow lanes to ease freeway
congestion. • Provided transport back to Houston and Galveston after the storm for those who had
no access to a private vehicle. • Provided shelter, food, and facilities for its critical employees and their families,
when needed. Remaining Challenges Jurisdictional Issues One of the major issues raised during Hurricane Rita, affecting both METRO and those attempting to evacuate by car, was the capacity of jurisdictions located outside the urbanized portions of Harris County to handle the exodus from a major UA. Motorists who were attempting to pass through smaller cities and rural areas once they left Houston were unable to find fuel, provisions, or shelter. Moreover, communication with potential receiver communities was poor. The Texas Department of Public Safety (DPS) (the state police) is the state’s primary law enforcement agency in rural areas and has good communications with small communities. However, communication between the leadership team at TranStar and DPS was insufficient to prepare them for the numbers of people headed their way.
Houston officials believe that the state needs to play a larger role in emergency planning should an evacuation of similar magnitude be required in the future. A representative of the Governor’s Division of Emergency Management was part of the unified command center team at TranStar during Hurricane Rita and coordinated with METRO to provide additional buses to

148 Special Report 294: The Role of Transit in Emergency Evacuation help fill surge capacity needs during the evacuation. DPS was not represented at TranStar and should be in the future. Even with improved communications, however, only another major urban area, such as Dallas, would be able to handle the large numbers of evacuees during such an event. The state needs to broker arrangements with Dallas regarding the provision of equipment and shelter for Houstonians in the event of another major evacuation. In the longer term, TxDOT must consider major highway and interchange improvements to eliminate traffic bottlenecks outside the Houston UA.
The City of Galveston has already entered into an agreement with Austin to accept Galveston residents in a future evacuation. In 2006, an interlocal agreement for emergency transportation services was signed by METRO and the City of Galveston. Under the agreement, 30 METRO or contract buses would be made available to Galveston in the event of an incident requiring mandatory evacuation of the city. The agreement spells out reimbursement details, indemnification and insurance arrangements, and the terms of agreement renewal or termination. Traffic Management Issues The capacity limitations described above affected travel by both bus (METRO) and by private vehicle during the evacuation. For example, multilane freeways narrowed to two lanes about 70 miles from downtown Houston, creating massive traffic bottlenecks. No plans had been developed for contra-flow, although the state, at the urging of METRO and others, opened contra-flow lanes to ease the congestion. Occupancy restrictions on HOV lanes were also dropped, and all lanes were operated in a northbound direction. However, no provision was made for access by emergency vehicles or for buses or emergency vehicles that needed to make multiple trips. Moreover, cameras and other intelligent transportation systems that support traffic management at TranStar did not extend into rural areas. TxDOT has since partially remedied this situation by installing 80 new web-accessible cameras in rural areas and interactive signs at points where highways converge, which will be used to provide evacuees with shelter locations and other information in the event of another evacuation.
Breakdowns were another issue during the Rita evacuation, further clogging freeway lanes and impeding emergency vehicles from providing assistance. Many vehicles ran out of fuel while stopped in traffic, and gas stations along the freeway ran out of supplies. Recommendations for improving the situation include use of park-and-ride lots for broken-down vehicles, roving towing contractors (another area for state assistance), prestaged fuel depots, and restricted use of HOV lanes for high-capacity vehicles, buses, and emergency vehicles. The Harris County and City of Houston OEMs are also investigating the use of park-and-ride and municipal parking lots within the city and county limits where residents could leave their extra vehicles and trailers to keep them off the road. Equipment and Drivers METRO faced shortages of equipment and drivers in attempting to meet the needs of an evacuation on an unprecedented scale. It attempted to address the equipment shortfall through the use of state-provided buses, school buses, and rail. However, meeting surge capacity needs remains a challenge. METRO is working with school districts to determine how their buses and the schools themselves could best be used in an evacuation. Recognizing that the first priority of school bus drivers is to transport school children, METRO believes the best strategy is to use its
Case Studies 149
own buses and school buses for local pickups and drop-offs at schools and other congregating sites, where state contract buses would then pick passengers up for longer-haul transport to shelters outside the Houston UA.
Rail is the most efficient way of moving large numbers of people without cars. METRO has recommended prepositioning of rolling stock and aggressive use of freight right-of-way in the event of another major evacuation. Implementing this strategy would require action by the state and the Federal Railroad Administration to resolve issues concerning right-of-way use, acquisition of rolling stock, and coordination with receiving jurisdictions to provide local transport and shelter for evacuees arriving by train. Special-Needs Populations Plans for the evacuation and transport of special-needs populations were quickly overwhelmed during Hurricane Rita. (Special-needs populations are defined broadly, ranging from anyone without access to a car to those requiring medical equipment to be transported with them.) The City of Houston and METRO had to take on this responsibility, which continues to be a major challenge. By some estimates, as many as 500,000 people could need public transport in an emergency evacuation. To help identify special-needs population, particularly those who are not institutionalized, the city has set up a voluntary special registry, but thus far only about 4,500 individuals have opted into the system. Working with the Area Agency on Aging of the Houston–Galveston Area Council3—the council of governments for the Houston area—a survey was administered to identify those who could need transportation in a future emergency, and a common city/county database for handling requests during an evacuation is being developed. More outreach to special-needs populations through churches, area groups on aging, and other nonprofits would be desirable. A campaign is needed to explain who should be registered so that city and county managers understand not only how many people will have to be evacuated, but also what types of evacuation equipment will be needed. The 311 system has been modified so that all the information can be entered rapidly into a database to help identify what callers need in the way of transportation.
Another challenge is adequate equipment and trained personnel, particularly to handle the transportation of those with disabilities during an emergency evacuation. Typically, METRO uses its fleet of 118 paratransit vehicles and lift-equipped vans operated by private taxi companies to transport some 40,000 persons with disabilities daily. However, this level of service is inadequate for a major evacuation. Nursing homes, continuing care facilities, and hospitals have their own evacuation plans and transport providers, and thus do not need to draw on METRO’s equipment. Nevertheless, many of these institutions could depend on the same ambulances and private contractors that METRO might use to supplement its bus and paratransit equipment in an emergency evacuation. Identifying these providers and the adequacy of their equipment to meet multiple demands is a relevant concern. Also, efforts are being made to protect some of these groups in place. Doing so requires hardening of some facilities and a public awareness campaign to encourage individuals to prepare for taking care of themselves. The Harris County and City of Houston OEMs are working with hospitals and nursing homes to identify facility improvements necessary to enable them to shelter in place.
3 The Houston–Galveston Area Council covers a 13-county area.
150 Special Report 294: The Role of Transit in Emergency Evacuation Funding Many of the improvements suggested to enhance the evacuation capacity of METRO and others will require funding. For example, METRO was left to cover the costs of fuel used and driver overtime during the Rita evacuation, as well as the cost of 130 satellite phones purchased to ensure continuity of communications capability. METRO has set up an emergency contingency planning fund to cover such costs in the future. However, METRO officials believe they should be considered first responders and thus eligible for reimbursement of many of these expenses. Funds are also needed to reimburse METRO, contractors, and others for the expenses they incur even if an emergency subsequently proves to be minor, and little damage is done. For events with advance warning, such as hurricanes, successful evacuation of large areas requires that the evacuation begin well in advance of the storm making landfall. A mechanism must be in place for reimbursement of expenses incurred during this period.
The state also has numerous funding needs, including operational expenses of standby contracts with bus operators and possibly towing companies, costs of setting up roving state regional incident response teams, and longer-term highway construction projects to enhance the capacity of evacuation routes. At the time this case study was conducted, the state budget included a request for a $50 million disaster contingency fund to provide for many of these needs.4 Reducing Demand for Evacuation One way to reduce the demands placed on METRO and other emergency responders is to limit the extent of future evacuations. Local officials believe the “Katrina effect” was responsible for the mass evacuation in the face of Hurricane Rita and that evacuation of the entire Houston UA is an unlikely scenario. A public education effort—“Run from the Water, Hide from the Wind”—will be launched to provide information about likely wind speeds in the event of a hurricane for those who do not live in storm surge zones. The idea is to encourage residents to shelter in place. Retrofitting of shelters in the Houston UA to withstand winds of 150 mph or more is also being pursued as a strategy for reducing transport distances for the elderly, and special wind-proofed and staffed medical shelters are also being considered for hospitals in storm surge zones that may be forced to evacuate. Summary METRO is a critical partner on the emergency team that manages evacuations in the Houston UA. Its prominent role stems in part from its substantial transportation responsibilities in the region and its steady funding base. The role played by METRO first in handling Katrina evacuees and then in helping manage the Rita evacuation demonstrated its capabilities. In the future, METRO would like to play an even greater role in regional emergency planning and evacuation, expanding beyond its service area to include the entire Houston–Galveston Area Council region and clarifying its responsibilities in coordinating transit buses, contract buses, taxis, and school buses in the city’s emergency plan.
4 The actual funding provided was $15 million, to be used when the state declares a disaster but the federal government does not.
Case Studies 151
Several challenges remain, including scaling up to meet the surge capacity demands of an evacuation on the order of Rita while also trying to reduce the demand for evacuation through public education. Also needed are better coordination with the state and statewide action on fuel and shelter provision, stand-by contracts with equipment providers (e.g., towing companies, backup buses), and provision of strategic rail equipment; development of contra-flow plans that include dedicated use of HOV lanes for high-occupancy vehicles, buses, and emergency vehicles; and better ways of identifying and handling the transport of special-needs populations.
This case study also raises several more general policy issues that may be relevant for other large UAs. The capacity of a highway and public transportation network to accomplish timely evacuation of an entire major metropolitan area is questionable. Only a fraction of the Houston area population was able to evacuate in the 2 days before Hurricane Rita made landfall, and this was an advance-notice emergency event. Capacity improvements could improve this record, but the expectations of the public and policy makers regarding the ability of a major region to evacuate are likely to exceed system capacity.
Coordination is another key policy issue. Although local governments have the primary responsibility for mandating an evacuation and planning for its execution, a successful evacuation depends heavily on others, as the experience with Rita showed. For example, the state is responsible for contra-flow operations. Small jurisdictions outside the UA can quickly be overwhelmed by evacuees, and even other neighboring major metropolitan areas, such as Dallas in the case of Houston, may not be able or willing to muster equipment and shelter as quickly as necessary to assist in an evacuation. The state must be significantly involved in regional evacuation planning that potentially affects other areas of the state before an emergency strikes, both in brokering arrangements among jurisdictions and in ensuring timely state action, equipment, and resources. Coordination is also critical at the local level, especially for special-needs populations, whose evacuation is likely to place multiple demands on limited equipment and drivers. Difficult issues include establishing who gets “first call”—a nursing home, homecare patients, the disabled—and honestly informing such groups of the level of service they can expect in an evacuation.
Funding is another issue. During the Rita evacuation, METRO operated as a first responder, yet the agency does not have this status as regards eligibility for reimbursement. If other transit providers are to be encouraged to play similar roles, who will pay for their services and how? State funding is an issue as well. Just as the state must be a partner in helping to plan for and execute a successful regional evacuation, it must find the wherewithal to pay for standby bus and towing contracts, fuel, and perhaps well-staged surplus rail equipment. In the longer term, the state must finance highway capacity improvement projects that enhance traffic flow during an emergency but must compete with other highway and public transportation capital investments in the state budgeting process. Committee Members and Staff in Attendance Thomas Lambert (lead) Arnold Howitt Kenneth Brown Nancy Humphrey

152 Special Report 294: The Role of Transit in Emergency Evacuation Briefings Tim Kelly, Captain, Department of Policy and Traffic Management, METRO John P. Walsh, Senior Director Bus Maintenance, and Katrina Miesch, Operations Planning,
METRO Stuart Corder, Director of Transportation Operations, Texas Department of Transportation Christy (Durham) Willhite, Chief Transportation Planner, Houston-Galveston Area Council Sharon A. Nalls, Emergency Management Coordinator, Office of Emergency Management, City
of Houston Mike Montgomery, Director/Fire Marshal, Fire Marshal’s Office, Harris County Documents Consulted 1. Governor’s Task Force on Evacuation, Transportation, and Logistics, February 14, 2006. 2. Lambert, T. 2007. Hurricane Evacuation Texas Style. METRO Police Department,
PowerPoint Presentation, February 7. 3. Hurricane Rita Observations. 2005. METRO Police Department, October 14. 4. METRO Observations—Hurricane Rita Evacuation, February 6, 2007. 5. Feeley, D. F. 2006. Hurricanes Katrina & Rita Regional Coordination. METRO
Emergency Operations. METRO, Presentation to the Transportation Research Board Annual Meeting, January 24.
6. Walsh, J. P. undated. Transit Vehicle Technology Applications for Houston METRO, METRO’s Lessons Learned Responding to Regional Evacuations. METRO.
7. Annex S: Transportation, City of Houston, September 5, 2001. 8. Houston–Galveston Area Evacuation and Response Task Force, Recommendations Report,
April 2006. 9. Durham, C. 2006 (August). Hurricane Evacuation. Presented at the Transportation
Research Board Annual Meeting, January 24, 2007. 10. Interlocal Agreement, Emergency Transportation Services, City of Galveston and METRO,
April 13, 2006. CHICAGO CASE STUDY In addition to responses to the questionnaires presented above, this case study is based on information gathered during a site visit made on June 12, 2007. Overview Chicago Demographics and Geography According to the U.S. Census, the population of the Chicago UA was approximately 8.3 million in 2000, making it the third largest of the 38 UAs with populations greater than 1 million.5 The Chicago UA is the second largest after New York in land area (square miles) and ninth in 5 Data on UA population, land area, and population density were drawn from the U.S. Census Bureau, 2000 Decennial Census of Population and Housing and the Federal Transit Administration’s 2005 National Transit Database.
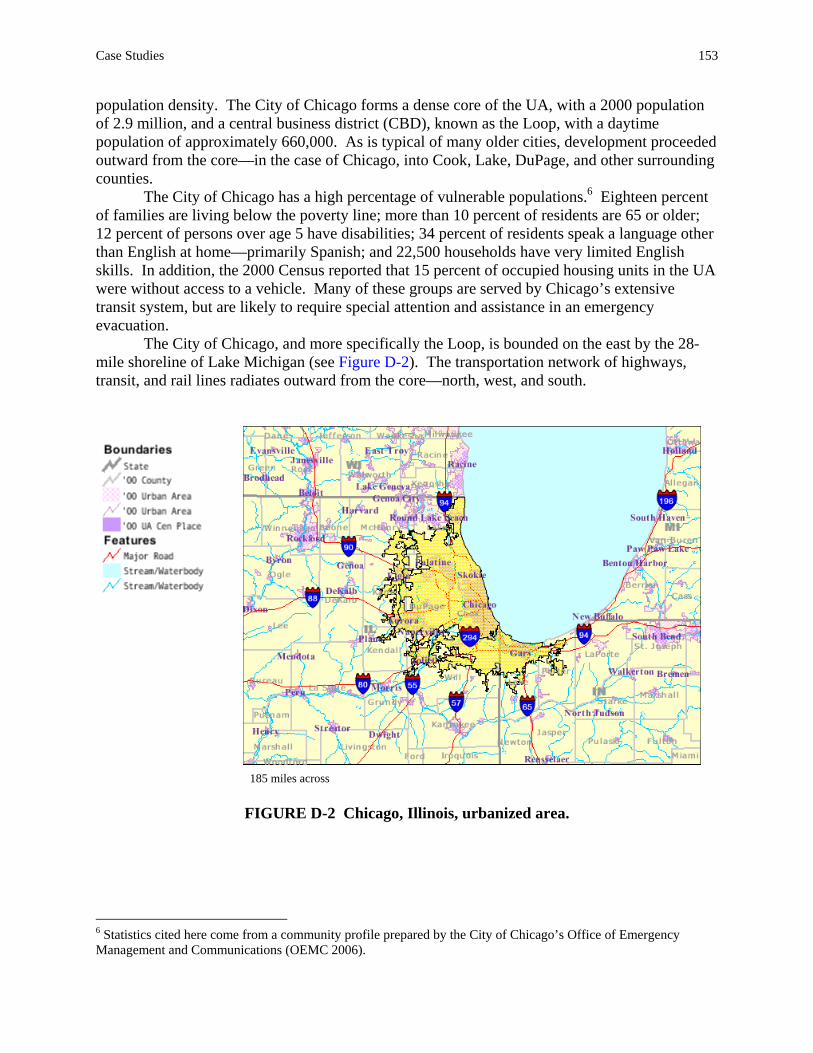
Case Studies 153
population density. The City of Chicago forms a dense core of the UA, with a 2000 population of 2.9 million, and a central business district (CBD), known as the Loop, with a daytime population of approximately 660,000. As is typical of many older cities, development proceeded outward from the core—in the case of Chicago, into Cook, Lake, DuPage, and other surrounding counties.
The City of Chicago has a high percentage of vulnerable populations.6 Eighteen percent of families are living below the poverty line; more than 10 percent of residents are 65 or older; 12 percent of persons over age 5 have disabilities; 34 percent of residents speak a language other than English at home—primarily Spanish; and 22,500 households have very limited English skills. In addition, the 2000 Census reported that 15 percent of occupied housing units in the UA were without access to a vehicle. Many of these groups are served by Chicago’s extensive transit system, but are likely to require special attention and assistance in an emergency evacuation.
The City of Chicago, and more specifically the Loop, is bounded on the east by the 28-mile shoreline of Lake Michigan (see Figure D-2). The transportation network of highways, transit, and rail lines radiates outward from the core—north, west, and south.
185 miles across
FIGURE D-2 Chicago, Illinois, urbanized area.
6 Statistics cited here come from a community profile prepared by the City of Chicago’s Office of Emergency Management and Communications (OEMC 2006).
154 Special Report 294: The Role of Transit in Emergency Evacuation Transit Chicago’s transportation network is well developed, including an extensive transit and highway system and freight rail network. The Chicago Transit Authority (CTA), with 1,900 buses and 1,150 heavy railcars, is the second-largest transit system in the United States. It provides 1.4 million rides on an average weekday and serves the City of Chicago and 40 adjoining suburban communities—a service area of about 220 square miles and 3.8 million people. Metra, the second-largest commuter railroad in the United States, provides commuter rail service to approximately 310,000 riders per day through a hub-and-spoke network of 11 rail lines, radiating from the City of Chicago to six counties in Northeastern Illinois. The sixth-largest carrier in the United States, PACE provides bus and vanpool service in the Chicago suburbs, as well as paratransit service in the City of Chicago, through its fleet of 700 large buses, 500 minivans, 450 paratransit vehicles, and 600 vanpools.7,8 In addition, Chicago is served by Amtrak through its hub at Union Station and by the Northern Indiana Commuter Transportation District (NICTD), which provides commuter rail service from South Bend, Indiana, to downtown Chicago. Chicago also has an extensive system of limited-access highways, including 64 miles of expressways, which radiate outward from the downtown area. Finally, Chicago is an important rail hub, with three major transfer facilities where cross-country freight is transferred to other cities and rail lines.9 Emergency Planning The Office of Emergency Management and Communications (OEMC) has primary responsibility for the development of emergency and evacuation plans, training and drills, and plan maintenance for the City of Chicago. The Chicago Emergency Operations Plan includes a separate emergency support function for evacuation, as well as for transportation. The Chicago Police Department has the primary responsibility for evacuation, and OEMC is the lead coordinating agency. The Chicago Department of Transportation has the primary responsibility for coordination of repair and clearance of transportation infrastructure in an emergency to support response operations and restore safe transport of people and goods.
Multiple types of emergencies may require a partial or full evacuation of the Chicago CBD or other locations within the city. Various hazard assessments for the City of Chicago have identified few if any hazards, however, that would require evacuation of the entire city; thus, the focus is on the CBD. Potential hazards include natural events—tornadoes, earthquakes, floods, or severe weather—and human-caused events—transportation accidents; hazardous materials releases; power outages; and terrorist events involving biological, radiological, incendiary, chemical, or explosive elements. Because of the wide range of unplanned emergencies for which the Chicago area must be prepared, emergency evacuation plans are focused on clear organization and assignment of responsibilities, well-established mechanisms for coordination of agency personnel and assets, and an orderly system for real-time communication among critical agencies.
7 PACE took over paratransit services within the City of Chicago less than 1 year ago. 8 The Regional Transportation Authority provides financial review, oversight, and planning for the CTA, Metra, and PACE. Created in 1974 as a special-purpose unit of local government, the RTA’s mission is to ensure financially sound, comprehensive, and coordinated public transportation for northeastern Illinois. 9 Roughly two-thirds of the nation’s freight traffic originates in, terminates in, or travels through Chicago.

Case Studies 155
The City of Chicago’s CBD evacuation plan is scalable. It includes provisions for determining the level and extent of evacuation required, identifying evacuation routes, defining roles and responsibilities, activating the Joint Operations Center (JOC) if necessary, and establishing assembly and transportation centers (ATCs) if needed. Three levels of evacuation have been designated. A Level I evacuation is similar to rush hour. There is no immediate danger, and, with the exception of an increase in CTA and Metra services, external resources are not required. A Level II or III evacuation requires extensive support from outside agencies and resources; triggers activation of the JOC—the state-of-the art traffic management and emergency control center where all the major agencies, including transit, are represented; and likely requires activation of the ATCs. The mayor, in consultation with public safety officials and OEMC, is responsible for initiating a Level I evacuation. In the event a Level II or III evacuation is required, OEMC (with the consent of the mayor’s office) requests activation of the state plan. The governor is responsible for making an emergency declaration, and the Illinois Emergency Management Agency coordinates with the Illinois State Police and the Illinois Department of Transportation (IDOT) to support the evacuation. Transit’s Role in Emergency Evacuation Chicago area transit agencies each have their own evacuation plans. However, CTA, Metra, and Amtrak are all identified as key support agencies in the City of Chicago CBD Evacuation Plan. Their plans are part of the overall CBD evacuation plan—mirroring the same plan activation levels (I, II, and III) for operational consistency—and there is close coordination with OEMC.10 The roles of the major transit providers are described as follows. Evacuation CTA considers itself a first responder in an emergency and is listed as a primary support agency in the event of an evacuation. A Level I evacuation would require normal CTA and Metra services, but at increased frequencies. In the event of a Level II or Level III emergency, CTA trains would be operated as shuttles, and buses would be redeployed as appropriate to move people out of the CBD as expeditiously as possible from ATCs to preidentified staging areas, whose locations would depend on the severity of the incident and the designated perimeter. A CTA site coordinator would be dispatched to each drop-off site to assist with customer disbursement. CTA estimates that it could evacuate more than 100,000 people per hour by rail and about 40,000 people per hour by bus—numbers in excess of the system’s rush hour capacity. Of course these estimates depend on the type, location, and severity of the incident and assume that CTA assets are not damaged. CTA believes it has sufficient equipment and great flexibility to move personnel and equipment among lines to handle the vast majority of emergencies.
Metra and other rail providers also have key roles to play in an evacuation, particularly in a Level II or III emergency. Metra’s first priority would be to evacuate its own trains from the CBD. It would also coordinate changes in schedule and routes with OEMC, CTA, Cook County Sheriff’s Police, and other suburban law enforcement officials to supplement CTA services. If the incident occurred off-peak when equipment and personnel were not as readily available, Metra estimates that personnel would be prepared to move trains from coach yards to all major 10 PACE and NICTD are not directly identified in the plan, but both agencies have agreements with CTA and Metra to take care of their suburban bus and commuter rail passengers, respectively, in the event of an emergency.

156 Special Report 294: The Role of Transit in Emergency Evacuation downtown terminals within 30 minutes of notification.11 If OEMC directed passengers to the right train, Metra believes it could handle surge capacity in an emergency. Following the terrorist attack of September 11, 2001, in New York City—although the availability of crews and equipment was optimal—it took just 1½ hours to evacuate everyone who wanted to leave the CBD. Metra does not have buses or a sufficient police force to move passengers once they reach suburban rail stations, and would have to count on others to provide such transport, as well as security.
PACE could help provide suburban bus transport in an emergency evacuation. It is also the Chicago area’s primary paratransit and vanpool provider for special-needs populations, whom it serves largely through private contractors. PACE does not consider itself a primary responder, although it has its own evacuation plan. In an emergency, it would follow the lead of local emergency managers and send supervisors along with equipment to assist special-needs customers. Although PACE has provided OEMC with a list of equipment and has coordinated with CTA and Metra regarding equipment deployment in an emergency, it is not formally part of the CBD evacuation plan. Nevertheless, the agency is working closely with the mayor’s office to help develop a voluntary special-needs registry. It is also developing a computerized database of its customers, has made arrangements for reimbursement of its private contractors for equipment use in an emergency, and has trained local police and fire personnel on its equipment.
Amtrak is also listed as a key support agency in the City of Chicago’s CBD evacuation plan, although it is a much smaller player than Metra. In an emergency, Amtrak could help with an evacuation. Its trains come in and out of Union Station in downtown Chicago, and it also has a major maintenance facility located 1 mile from Union Station and another major facility near Indianapolis from which more equipment could be deployed. The biggest challenge would be to provide equipment in real time, particularly in off-peak times.
Chicago’s Class I freight rail carriers have formed the Chicago Transportation Coordination Office (CTCO) to help coordinate freight and keep it moving in the Chicago area. CTCO has no formal role in the evacuation plan, but in the event of an emergency, it could help clear tracks for use by Metra and Amtrak through the alert system now used to communicate with carriers when congestion is heavy. Approximately 80 percent of passenger rail operates on freight tracks in the Chicago area. Evacuation Routes Unlike cities that experience frequent evacuations, such as Miami, Florida, the City of Chicago does not have permanently established, predetermined evacuation routes. Nevertheless, there are several major expressways and arterial streets that would be used for evacuee egress and emergency vehicle ingress in the event of an emergency. In a Level II or III emergency, OEMC would likely request activation of the state plan, which contains provisions for using Chicago freeways in a last-resort, contraflow arrangement to evacuate the CBD expeditiously. The State of Illinois—IDOT and the Illinois State Police—would support the Chicago DOT and the Chicago Police Department in executing the plan. According to CTA, the reversible commuter lanes on these freeways could be used for buses to help expedite the evacuation. The Chicago Area Transportation Study (CATS), the metropolitan planning organization for the Chicago area,
11 At a minimum, Metra would be able to provide one train per line within the 30-minute notification period, a second train per line within 40 minutes, and a third train within 60 minutes.
Case Studies 157
estimates that it would take approximately 1½ to 2 hours to evacuate the CBD using 23 existing outbound expressway lanes plus an additional 11 inbound lanes in a contraflow arrangement.12 Command and Control Transit providers are well represented in the emergency decision-making structure. CTA, Metra, and Amtrak are all listed as key support agencies in the City of Chicago’s CBD evacuation plan, and they would all be represented at the JOC should it be activated in the event of a Level II or III evacuation. Communications In the event of activation of the CBD evacuation plan, OEMC is responsible for notifying all participating city, county, state, and federal departments; sister and external agencies; and the private sector. In general, communications are handled through a variety of mechanisms, including contact lists and telephone trees, e-mails to building managers, and reverse 911 calls. CTA has lists of other transit providers to contact in an emergency. Although there is no single communications system among transit providers, all major providers, including Amtrak and NICTD, are part of the Chicago Transit Alert Network (CTAN).13 CTAN provides a mechanism for information exchange among key regional transit providers, who drill every week on use of the system. Initially, notifications were accomplished via phone contacts only. More recently, Emergency Management Network (EMnet) terminals were installed in the operations or security centers of all transit providers, freight rail carriers (e.g., Union Pacific Railroad, Burlington Northern Sante Fe Railway, NICTD), and area police and fire departments. An Internet/satellite-based software program, EMnet offers a secure platform for real-time messaging among networked partners, providing another means of communication along with the telephone notification system and moving the area closer to a fully interoperable communications system.14 Technology The Chicago area has implemented an extensive surveillance network for security, for example for monitoring critical infrastructure, which also may be used during times of emergency when the potential exists for a major evacuation. The City of Chicago has placed cameras on virtually every corner of the CBD and has integrated the camera networks of the private sector and IDOT. The cameras can be used to monitor traffic egress from the city and can thus provide decision makers with greater situational awareness during an emergency.
12 The estimate assumes evacuation during the midday period (from 10 AM to 2 PM). 13 CTAN was created as a regional means of information and intelligence sharing. All area transit providers are part of the Regional Transit Security Working Group. To receive federal funding, they are required to develop a regional transit security strategy. CTAN is part of this initiative. 14 The system, which was developed by COMLABS, provides a platform for broadcasting of Emergency Alert System messages; for two-way messaging among emergency response and critical agency personnel; and for forwarding of emergency messages automatically to pagers, cell phones, and email addresses. The deployment of EMnet to all police and fire departments in Illinois was facilitated through the Illinois Terrorism Task Force and Mutual Aid organizations, such as the Mutual Aid Box Alarm System and the Illinois Law Enforcement Alarm System, to help ensure communications interoperability and immediate notification of emergency circumstances.

158 Special Report 294: The Role of Transit in Emergency Evacuation Support for Incident Response The personnel and equipment of many transit providers could also be used to help transport emergency responders and bring equipment to the site of an incident. CTA indicated that it has made provisions for bringing personnel, supplies, and equipment to an emergency site. The agency has experience with bringing police into the City of Chicago to provide security at Fourth of July celebrations and other major events. If contraflow plans were invoked in a Level II or III evacuation, CTA buses could use two reversible expressway lanes dedicated to exclusive use of emergency and incident management vehicles.
Amtrak could also assist in transporting personnel and equipment to the emergency site. As indicated previously, Amtrak has equipment at nearby facilities that could be made available. There is no formal memorandum of understanding in place, but Amtrak does not believe this to be necessary; it is part of the City of Chicago’s CBD evacuation plan, and the necessary processes are already in place. Recovery Transit providers also have a role to play in recovery, although this role has received less attention than others in some evacuation plans. For example, once the immediate danger had passed, CTA would either restore normal service, enabling evacuees to return to the CBD or continue to outlying areas; reroute service around problem areas; or, if the CBD remained closed, establish shuttle service between drop-off points and end-of-line terminals. Exercises and Drills Transit providers have all taken part in area emergency exercises and drills. On September 7, 2006, the City of Chicago OEMC conducted a first-of-its-kind emergency exercise involving evacuation of four commercial high-rise buildings in the CBD at the peak of rush hour traffic. More than 4,000 individuals participated. The purpose was to test emergency notification and communication systems; evacuate building occupants to ATCs; test ATC intake, registration, and triage operations; and increase public awareness and education about emergency preparedness. CTA was part of the exercise and staged buses at the ATCs, although no one was actually evacuated by bus. On September 11, 2001, CTA evacuated passengers who wished to leave the CBD, and it moved more than 1,000 passengers out of the CBD during a major power outage in September 2006. Metra has participated in tabletop exercises with other transit providers, and it had experience in evacuating passengers as long ago as the Mississippi River floods of 1993 and more recently on September 11. Both Metra and CTA implement significant schedule enhancements to accommodate the ingress and egress of spectators to major events taking place in Chicago, such as the fireworks on July 3 (nearly 1 million spectators), Annual Venetian Night, and the Air and Water Show. Amtrak has also been part of numerous drills, some involving CTA, Metra, and PACE. Chicago’s experience in hosting more than 7,000 persons displaced by Hurricane Katrina helped in identifying facilities to care for the elderly and the mentally ill, which could be used in subsequent evacuations. Finally, CTCO participated in a Department of Homeland Security (DHS) tabletop exercise, although it has not been as closely involved in city evacuation drills.

Case Studies 159
Remaining Challenges Special-Needs Populations Identifying and evacuating special-needs populations, particularly those who would need assistance in an emergency, remains a major challenge. The emphasis has been on self-help; high-rise buildings in the Loop, for example, have been asked to identify workers with disabilities and plan for how they would be evacuated in an emergency. In addition, CATS has provided estimates of the numbers of disabled workers in the CBD, their ability to self-evacuate (i.e., drive), and their location. Similar maps have not been developed for other vulnerable populations, such as the elderly. Perhaps part of the reason lies in the assumption by area emergency planners that evacuation of the entire CBD or an even larger area is an unlikely event, so that special-needs populations would not require evacuation but could shelter in place. Nevertheless, if an evacuation of the CBD or a partial evacuation were necessary, most evacuation plans require that individuals walk to staging areas for transport by bus or train (e.g., Amtrak); this could be a problem for those with disabilities. PACE, which provides paratransit service in the City of Chicago, is close to having a computerized inventory of its customers to assist in scheduling, which could also be used in an emergency. Should an evacuation be necessary, the agency has made provision for sending supervisors along with equipment to assist passengers at drop-off locations. PACE is also working closely with the mayor’s Office for People with Disabilities to establish a special voluntary registry of individuals who need assistance, but this effort is still in the initial stages.15 PACE officials acknowledge the importance of evacuating those who need assistance, but also perceive that transit is viewed as a “catch all” for transporting special-needs populations and is limited in the assistance it can realistically provide. Development of a Regional Evacuation Plan Chicago’s evacuation plans are currently focused primarily on evacuation of the CBD. Each of the surrounding counties—Cook, Lake, and DuPage for example—has its own evacuation plan, as does each of the major area transit providers. OEMC recognizes the need for more coordinated evacuation planning among the jurisdictions throughout the region to prepare for a major evacuation from the Chicago area. Accordingly, the Chicago Region Evacuation Planning Group was formed to develop a plan, identify and coordinate evacuation routes, and establish a mass care comprehensive plan for a mandatory evacuation of 1 million people, encompassing an area within a 200-mile radius of downtown Chicago. The group held its first meeting in December 2006. The Executive Steering Committee is cochaired by OEMC, the State of Illinois, and Region V of the Federal Emergency Management Agency (FEMA). No timetable has been set for development of a written regional evacuation plan. There has also been some discussion of developing a regional rail plan, which would involve all the major transit providers, as well as Amtrak and the freight railroads, but funding for this activity is an issue.
15 The Federal Emergency Management Agency’s Chicago Region Evacuation Planning Group (see the next subsection), of which OEMC is a cochair, is establishing committees that will address such issues as mass care and sheltering, special needs, transportation, and logistics as part of the development of a regional evacuation plan. The mayor’s Office for People with Disabilities, the Chicago Department on Aging, the Chicago Department of Human Services, the American Red Cross, and the Salvation Army will all be part of this effort.

160 Special Report 294: The Role of Transit in Emergency Evacuation Jurisdictional Issues IDOT, in coordination with the Chicago DOT and state and local law enforcement officials, is responsible for implementing contraflow plans for a major evacuation of the Chicago CBD. Sites have been identified in collar counties and beyond where evacuees could be sheltered, particularly in the winter, and the Red Cross is developing a national shelter database and identifying information (e.g., whether the shelters are able to handle evacuees with disabilities) that will support the effort. Nevertheless, Metra officials noted that suburban jurisdictions are concerned about handling a major influx of evacuees in a major incident.16 Metra itself has limited capacity to police or move passengers once they arrive at drop-off locations. These are major topics for consideration in the regional plan development effort, which will involve other states (i.e., Indiana, Michigan, and Wisconsin) in addition to OEMC, the American Red Cross, and the Chicago Metro County Coordinators Council.17 Broadening of Participation in Evacuation Planning Numerous agencies are already participating in the City of Chicago’s evacuation planning and would be represented at the JOC should it be activated. Nevertheless, some other key groups should be part of this effort. OEMC, for example, agreed that CTCO, which represents the major freight and passenger rail (e.g., Amtrak) carriers in the region, should participate in evacuation planning and should probably be part of the JOC. OEMC also needs to coordinate more closely with hazmat carriers.18 Finally, although the Chicago Public Schools are listed as a participating agency in the City of Chicago’s evacuation plan, OEMC has not fully explored the use of school buses for evacuation in a major emergency. Funding Federal funding is essential for evacuation planning and drills. The Chicago area has received DHS grants for emergency planning but not for evacuation planning specifically. Most area transit providers, as well as Amtrak and, to a lesser extent, the freight railroads (through CTCO), have participated in tabletop exercises from time to time. Additional funding for more drills and exercises would be beneficial, according to interviewees.
16 Metra staff recently met with police and fire chiefs from Cook County and the surrounding collar counties to explain Metra’s evacuation procedures in the event of a regional evacuation and share information. According to participants, the meeting helped allay concerns and increase understanding of possible impacts on outlying areas from a Chicago-centric evacuation. 17 The Metro County Coordinators Council comprises emergency management staff from the City of Chicago; Cook, Lake, McHenry, DuPage, Kane, and Will Counties; the Salvation Army; the Red Cross; the Illinois Emergency Management Agency; FEMA; DHS; and any other organizations that need to be represented. The council meets to discuss issues and develop strategies related to homeland security and emergency management from a regional perspective. 18 OEMC staff is meeting shortly with a group from the Transportation Security Administration to discuss a recent assessment of freight railroads in the Chicago metropolitan area, focused on the issue of transportation of hazardous materials.
Case Studies 161
Summary As an older metropolitan area, Chicago has a well-developed transportation system, including an extensive transit and highway network with considerable redundancy and multiple ways of moving people. Area transit providers believe they have adequate personnel and equipment to handle all but a very major emergency incident, such as the terrorist attacks of September 11 or detection of chemical, biological, or radiological agents in the CBD, which could trigger a major evacuation requiring extensive support from outside agencies and resources.
Chicago area transit providers have been directly involved in evacuation planning for the CBD. They are part of the emergency decision-making structure and would be represented with other key local agencies at the JOC should it be activated in an emergency. There is good coordination among all the key agencies, and in the event of an emergency, transit providers would have established methods for communicating both within their own agencies and with other transit agencies, as well as with local emergency managers and law enforcement personnel. Finally, most have participated together in local emergency exercises and drills.
Nevertheless, several challenges remain. Key among these is planning for evacuation of special-needs populations—identifying these people, providing assistance for those who cannot help themselves in an emergency evacuation, ensuring that shelters (if needed) are adequately equipped to handle the elderly and those with disabilities, and communicating plans and contact information to special-needs groups. Another challenge is development of a regional evacuation plan to ensure that all the major players are coordinated in the event of a major emergency. Coordination is also necessary with the collar suburbs, exurban areas, and nearby states to help ensure adequate shelters, police protection, fuel, and supplies so that outlying communities will not be overwhelmed in the event of a major evacuation of the City of Chicago. Progress has been made in several of these areas, but substantial issues still remain to be resolved.
This case study also raises several more general policy issues that may be relevant for other large UAs. A key issue is whether it is realistic to consider evacuation of a major city. Hazard analyses of Chicago have identified few if any hazards that would require evacuation of the entire city; the worst-case, Level-III scenario assumes evacuation of the CBD—a much smaller area. The issue has been raised in other jurisdictions and is critical, because planning for a more extensive emergency evacuation may focus priorities and limited funding on a low-probability event.
Planning for a no-notice emergency is another key policy issue. Unlike cities that face weather-related emergencies, such as hurricanes that strike the area with regularity during hurricane season, Chicago and many other UAs are likely to face emergencies that provide no warning. All the transit providers interviewed noted that the timing of an incident is critical in terms of having personnel and equipment available. Incidents that occur during the midday period, from about 10 AM to 2 PM, are particularly difficult because fewer transit personnel and equipment are available during this nonpeak period. Thus, mechanisms need to be in place for communicating rapidly with critical personnel in the event of an incident and ensuring that both drivers and equipment can be secured within a reasonable period.
The limits on the use of transit to evacuate special-needs populations is another key issue. Planning for evacuation of these populations needs to receive more attention in many UAs, and Chicago is no exception. As PACE management noted, however, transit is often a catch-all means of transport for a diverse group of individuals. Thus, it is important to be clear about what services transit can realistically provide and for whom, as well as to encourage self-help efforts,

162 Special Report 294: The Role of Transit in Emergency Evacuation such as Chicago’s initiative to get each high-rise building in the CBD to develop its own plan and identify workers with disabilities who would need assistance in an evacuation.
Finally, funding is an important issue. As the City of Chicago’s CBD evacuation plan notes, the city would require extensive support from regional, state, and federal agencies in a major emergency. Federal funding from DHS has been forthcoming, but area officials believe that more targeted funding for evacuation planning would be productive. Committee Members and Staff in Attendance Andrew Velásquez III (lead) Ali Haghani Nancy Humphrey (by teleconference) Briefings Earl W. Zuelke Jr., Deputy Director, Office of Emergency Management and Communications,
City of Chicago James G. Argiropoulos, Managing Deputy Director, Office of Emergency Management and
Communications, City of Chicago Patrick J. Daley, Vice President, Security, Safety, and Control Center, Chicago Transit Authority Earl Wacker and Robert Holstrum, Chicago Transportation Coordination Office Jocelyn R. Harper, Manager of Emergency Preparedness, and Robert Saver, Amtrak Sharon A. Austin, Senior Director, Customer Service and System Security, and Chief James
Sanford, Chief of Police, Metra Melinda J. Metzger, Deputy Executive Director, PACE Documents Consulted 1. City of Chicago Central Business District Evacuation Plan, Executive Summary and
Complete Plan, June 7, 2007. 2. City of Chicago, Emergency Support Function #16: Evacuation, June 2007. 3. Office of Emergency Management and Communications of the City of Chicago, City Wide
All-Hazard Mitigation Plan, Community Profile, Chapter 2, March 2006. 4. Office of Emergency Management and Communications of the City of Chicago, September
7, 2006 Central Business District Evacuation Exercise After Action Report, Chicago, IL, April 3, 2007.
5. Chicago Region Evacuation Planning Committee, undated. 6. Illinois Department of Transportation—Highways, Evacuation Plan for Chicago Central
Business District & Chicago Expressway System, Informational Copy, January 2004. 7. Sternberg, K. 2006. Taking Care of Business. Homeland Protection Professional, Oct, pp.
26–29.

Case Studies 163
NEW YORK–NEW JERSEY CASE STUDY In addition to responses to the questionnaires presented above, this case study is based on information gathered during a site visit made on July 11–12, 2007. Overview Demographics and Geography According to the U.S. Census, the population of the New York–Newark UA19 was approximately 17.8 million in 2000—the largest of the 38 UAs with populations greater than 1 million.20 Approximately 8 million live in the five boroughs that make up New York City (NYC). The remainder are divided among neighboring counties in New Jersey, Long Island, Westchester, and Connecticut (see Figure D-3). The New York UA is also the largest of the 38 UAs in land area—nearly 60 percent larger than the Chicago UA, the second largest—and highest in population density.
FIGURE D-3 New York–Newark urbanized area.
19 For brevity’s sake, the New York–Newark UA is referred to in this appendix as the New York UA. 20 Data on urbanized area population, land area, and population density were drawn from the U.S. Census Bureau, 2000 Decennial Census of Population and Housing and the Federal Transit Administration’s 2005 National Transit Database.

164 Special Report 294: The Role of Transit in Emergency Evacuation
The New York UA has the highest number and percentage of carless households of the 38 UAs. In the 2000 census, some 2.1 million householders, representing 18 percent of all householders, reported not having a car. The numbers are even higher in NYC, where 56 percent of households reported not having a car, ranging from 77 percent in Manhattan to 8 percent in Staten Island. The large numbers of carless, particularly in Manhattan, reflect the existence of an extensive transit network; limited on-street and expensive off-street parking; and a high level of congestion on area highways, which makes travel by private vehicle difficult.
NYC also has large numbers of vulnerable people. Some 14 percent have disabilities; 11 percent of families are living below the poverty line; 10 percent of residents are aged 65 or older; and emergency preparedness information is provided in 11 different languages, reflecting the diversity of the population. Many of these people are served by transit—New York City boasts the highest transit use in the United States—but many are likely to require special attention and assistance in an emergency evacuation.
Many areas of the New York UA are surrounded, and portions are separated (e.g., Manhattan from northern New Jersey), by water. The area is served by an extensive network of highways, transit (rail and bus), commuter and passenger rail, and ferry service. The infrastructure is old, however, and capacity and congestion present a challenge to effective service provision. Transit The Metropolitan Transportation Authority (MTA)21 operates North America’s largest transit network. Service is most dense in NYC. The MTA NYC Transit (NYCT)-Subway system has an average weekday ridership of 4.9 million, and the MTA NYC Transit-Bus system provides service to 2.4 million riders daily for a total average weekday ridership of 7.3 million. NYCT also contracts with 14 carriers to provide paratransit services.22 In addition, the MTA system includes the Long Island Railroad, the largest commuter railroad in the United States; Long Island Bus, which serves Nassau, Western Suffolk, and Eastern Queens Counties; the Metro-North Railroad, running north out of Manhattan and serving Westchester County and other suburban New York and Connecticut counties; and a new MTA Bus Company, created in 2004 to assume the operations of 7 private bus companies, which provides local services in the Bronx, Brooklyn, and Queens, as well as express service from Manhattan to these boroughs. According to the 2000 census, approximately 98 percent of NYC residents live within one-quarter mile of an MTA NYCT subway station, a Staten Island Railroad station,23 or a local bus route.
In addition to the transit services provided under the MTA umbrella, the Port Authority of New York and New Jersey (Port Authority) provides rail service between Manhattan and New Jersey on Port Authority Trans-Hudson (PATH). The Staten Island Ferry, which is under the NYC Department of Transportation (NYC DOT) offers service between Lower Manhattan and Staten Island. New Jersey Transit (NJT) provides rail, light rail (Hudson-Bergen light rail line), 21 The MTA was chartered as a public-benefit corporation by the New York State Legislature in 1965. It is responsible for managing, financing, and operating transit service in the New York area through its operating subsidiaries. 22 NYCT leases 1,694 vehicles to the carriers, who employ nearly 2,500 drivers. The drivers are not NYCT employees, but NYCT owns and assigns the work for the vehicles. 23 The Staten Island Railroad—a commuter rail line on Staten Island—is a division of the NYC Transit-Subway system. Its main function is to bring passengers from the south end of Staten Island to the St. George Terminal on the north side and the Staten Island Ferry, which operates out of the terminal.

Case Studies 165
and bus service between Manhattan and New Jersey. The New York UA is also served by Amtrak (mainly intercity passenger travel). Ferries provide yet another means of transport. In addition to the Staten Island Ferry, numerous private ferry companies transport commuters between northern New Jersey and Manhattan. Emergency Planning The New York City Office of Emergency Management (NYCOEM)—organizationally part of the Office of the Mayor—has primary responsibility for planning and coordinating emergency management activities for NYC and for activating the emergency operations center—a new state-of-the art-facility located in Brooklyn—in the event of an emergency.24 NYCOEM coordinates with all the key agencies in the region regarding emergency planning, including the New York Police Department (NYPD); the Fire Department, City of New York (FDNY); the MTA; the Port Authority; the New York State Emergency Management Office (SEMO), Region 1 (NYC) and Region 8 (Nassau and Suffolk Counties); NYC DOT; and the OEM for the State of New Jersey. NYCOEM has also developed a scalable system of 65 evacuation centers, each of which operates as the hub of a “solar system” network of 5 to 10 shelters, some 500 shelters in all, throughout the city. The agency is responsible for public outreach as well. NYCOEM gets its message out through its Ready New York guide and hurricane brochures, as well as its website and evacuation zone finder and the 311 system.
According to emergency management officials, New York encompasses too vast an area and too large a population to consider fully evacuating the city in the event of an emergency. Nevertheless, there are many types of emergencies that could require a partial evacuation. NYCOEM has taken an all-hazards approach to emergency planning and evacuation. Among the emergencies it has considered are advance-notice events, such as hurricanes, and no-notice events, such as terrorist attacks, power outages, and earthquakes. NYCOEM has prepared detailed plans for a hurricane scenario and for an unspecified areawide emergency. Both plans have separate transit components. Of course, NYC has had recent experience with severe emergencies, some of which have required evacuation. Much of Lower Manhattan was evacuated during the terrorist attack of September 11, and transit and ferries played a major role in the evacuation. The 2003 Northeast blackout involved considerable movement of people, mainly getting commuters back home, but in that case the transit system itself was affected.
In New York—a home-rule state—responsibility for mandating an evacuation rests with local government. In NYC, the Mayor has responsibility for ordering an evacuation. NYPD is the lead operating agency in any evacuation, and NYCOEM plays the lead coordinating role. NYCOEM coordinates with SEMO and the OEMs of the surrounding jurisdictions and makes a recommendation to the mayor regarding the need for an evacuation. If an evacuation is recommended, the mayor, in coordination with SEMO and the local OEM, issues the evacuation order. In a major emergency, the governor can declare a state of emergency and request federal assistance. State assistance is coordinated through the headquarters of SEMO. A similar process is involved in New Jersey, where the authority to declare an emergency and order an evacuation rests with local government, and higher levels government (e.g., counties or the state) are
24 NYCOEM was established in 1996 as a mayoral office and was granted department status in the New York City Charter in November 2001. OEM works to mitigate, plan, and prepare for emergencies; educate the public about preparedness; coordinate emergency response and recovery efforts; collect and disseminate critical information; and seek funding opportunities to support the overall preparedness of the City of New York.

166 Special Report 294: The Role of Transit in Emergency Evacuation involved depending on the scale of the incident. If state assistance is required, the governor declares an emergency; the New Jersey State Police plays the lead operational role in any evacuation; and the state OEM, operating through regional offices, has the primary coordinating function. Transit’s Role in Emergency Evacuation Because of the reliance of New Yorkers on transit services, particularly in NYC, the New York UA’s extensive network of transit providers is an integral part of the emergency plans for NYC and surrounding counties. NYCOEM’s Areawide Evacuation Plan contains a separate transit agency coordination document that lays out the general notification and coordination principles to be applied by NYCOEM and the region’s transit agencies in the event of an evacuation of a portion of NYC. The primary role of each transit provider is noted, primary points of contact are identified, and all agencies are represented at the NYC EOC should it be activated. Detailed service plans are to be developed once NYCOEM determines the nature and extent of the incident and thus the magnitude of the evacuation required.
NYCT has also developed a scalable and detailed Hurricane Evacuation Service Plan for use in the event that a hurricane or major coastal storm requires an evacuation of storm surge zones. NYCOEM provided NYCT with estimated numbers of potential evacuees from which the detailed service plans were developed for three scenarios, reflecting hurricanes of different levels of intensity (Category 1, 2, or 3+).25 The advance warning provided in the event of a hurricane and the ability to identify those at risk by geographic location and hurricane intensity have enabled such detailed advance service plans to be prepared.
Both documents lay out principles for determining how transit operates in the event of an advance-notice or no-notice emergency and evacuation. Among the most important is that transit operators will provide service that resembles “regular” service as closely as possible (unless, of course, the transit system itself has been compromised), so as to minimize any confusion among customers or operating personnel and simplify customer information requirements.
In addition to these NYC initiatives, the New Jersey OEM (Northern Region) recently revised the Trans-Hudson Emergency Transportation Plan26 to improve the capability to get some 300,000 to 400,000 New Jersey commuters back home in the event of an emergency in NYC. The plan involves not only NJT—mainly bus transport—but also private ferry companies. In an emergency, the colonel of the New Jersey State Police, who is also the State Director of the New Jersey OEM, would activate the plan after consultation with other key agencies, as well as the EOC at the Port Authority Tech Center in Jersey City, right outside the Holland Tunnel. The
25 The U.S. Army Corps of Engineers, working with PB Consult, provided NYCOEM with the estimates of the potential numbers of evacuees. 26 The Trans-Hudson Emergency Transportation Plan is the first phase of a four-phase effort to improve evacuation planning. New Jersey is working on a phase II plan for an event similar to the terrorist attack of September 11, which would involve sheltering and possible decontamination. The OEMs of New Jersey, New York, Connecticut, Pennsylvania, and Delaware are all working on this effort. Phases III and IV, which are in the preliminary planning stage, involve plans for a partial regional evacuation or a major regional evacuation due to a catastrophic event that would include multiple states and introduce long-term sheltering issues. The idea is to proceed from plans for a smaller evacuation and build toward more significant events that would affect much larger areas and involve more jurisdictions.

Case Studies 167
major agencies involved—New Jersey State Police, NYPD, NYCOEM, the Port Authority, NJT, and the Pennsylvania OEM—would also activate their individual EOCs.
A truly regional, multistate plan for emergency evacuation has not been developed. Initial steps have been taken with the creation of a Regional Evacuation Liaison Team. Member agencies currently include NYC; Westchester, Suffolk, and Nassau Counties; the Port Authority; the MTA; the New York State Police, the New York State Thruway Authority; and New York State DOT regions 8, 10, and 11.27 Funding for such an ambitious effort, however, is an issue. The roles of the major transit providers as detailed in existing evacuation plans are described below. Evacuation The most detailed role for transit is provided in the MTA NYCT Hurricane Evacuation Service Plan.28 The primary role of NYCT is to move those in flood zones out of harm’s way to safe locations with friends and family or to public evacuation centers. In the worst-case scenario—a Category 3+ hurricane—the mayor would order 2.3 million New Yorkers to evacuate before the storm made landfall; 1.2 million are expected to travel by transit. Over a several-hour period, some 973,000 would travel to private shelter, while an estimated 395,000 from flood zones would travel to public evacuation centers.29 Once at these centers, evacuees would be transported the short remaining distance to local shelters by school buses under contract to NYCOEM.
Given the large numbers of potential evacuees, NYCT used its travel forecast modeling capability to determine which bus and subway routes evacuees would be most likely to use to reach public evacuation centers.30 The analysis showed that subway service should be increased on 11 routes to meet surge capacity and to provide a sustainable level of service. An additional 879 NYCT and MTA buses would be required to meet surge requirements on existing bus routes and for operation on more efficient (requiring few transfers) storm routes in some areas. NYCT believes there is sufficient capacity to meet these surge requirements. During a normal morning peak hour, NYCT subway and bus services transport approximately 500,000 and 240,000 passengers, respectively. In a hurricane evacuation scenario, many commuters and school-bound riders would not be using the system; presumably, most business and schools would be closed in advance of a hurricane. This capacity would then be available for evacuees. Thus, for example, even assuming 100 percent evacuation, the rail system could provide service at an even level for approximately 12 hours and handle roughly one-quarter of the total number of expected evacuees in any 1-hour period, according to NYCT estimates. The plan calls for the curtailment of subway service 8 hours (6 hours for bus service) before the predicted onset of sustained gale-force winds, so that personnel and equipment could be moved to safe locations.
27 Region 8 covers Westchester, Ulster, Rockland, Putnam, Orange, and Duchess Counties. 28 Following the committee’s site visit, NYCT staff indicated that a new NYC OEM Coastal Storm Plan assumed larger numbers of evacuees using transit in a Category 3+ hurricane—1.8 million would travel by transit, and 526,000 would travel to public evacuation centers. New transit service estimates are not yet available on the basis of the new numbers. 29 Provision was also made for an additional 81,000 evacuating from areas outside flood zones to public evacuation centers. NYCOEM estimates the capacity of its 500 hurricane shelters as approximately 650,000, well in excess of shelter demand. 30 No information was available about where people sheltering with friends and family would be traveling, so it was assumed they would be moving in the direction of the central business district, away from the flood zone.

168 Special Report 294: The Role of Transit in Emergency Evacuation
In the event of a no-notice emergency, the primary role of NYCT would be to transport customers to their final destinations if possible, or to the next transit connection or to reception centers if necessary. (The current plan calls for suspension of service in the event of a terrorist attack.) Because of its greater capacity, rail is envisioned as the primary mode for evacuating passengers. Buses would be used as a distributor or supplement to rail transit or for the transport of passengers with special transportation needs (see the discussion below). In the case of a no-notice emergency, capacity could be an issue, particularly if parts of the transit system itself were damaged. The time of day of an incident also affects capacity: capacity is more limited at off-peak times in terms of availability of personnel and equipment. Alternative service plans would have to be formulated at the time of the incident. However, NYCT has considerable experience with implementing alternative service arrangements in its day-to-day operations, responding to various kinds of service outages or diversions, so it has a ready set of scenarios to draw upon. Meeting capacity requirements also depends on all employees showing up for work. NYCT staff pointed to the dedication of staff on September 11, but also acknowledged that circumstances could be different depending on the type of emergency. The MTA is beginning to work on an employee family assistance plan.
NJT and the Port Authority would also play important roles in any evacuation scenario. NJT is a statewide agency, but 90 percent of its operations serve the NYC area. Pennsylvania Station is NJT-Rail’s main terminal in Manhattan, and under normal circumstances moves about 80,000 passengers during the combined morning and afternoon peak periods. Surge capacity could be increased under load-and-go operations, but this capability would depend on whether the terminal and equipment were undamaged. Amtrak owns the tracks on which NJT-Rail operates, and there is currently no memorandum of understanding regarding who has precedence in an emergency.31 NJT-Bus operates from the Port Authority bus terminal in Manhattan through the Lincoln Tunnel to New Jersey, and under normal operations moves about 120,000 passengers during the combined morning and afternoon peak periods. The Trans-Hudson Emergency Transportation Plan provides for alternative bus loading from the street should the Port Authority bus terminal be compromised in any way. Buses would then travel on dedicated lanes through the Lincoln Tunnel and on the New Jersey Turnpike to the main reception center in northern New Jersey—Liberty State Park—where provision would be made for further passenger transport or shelter if necessary.
The Port Authority’s PATH trains would also carry commuters back to New Jersey in an evacuation. PATH operates out of five terminal stations—two located in Manhattan (33rd Street and the World Trade Center) and three in New Jersey (Hoboken, Journal Square, and Newark). Under normal circumstances, PATH moves 200,000 passengers each weekday in both directions. In the event PATH service itself was interrupted, New Jersey commuters could also use private ferries to return home. NYCOEM and the New Jersey OEM are working on a joint agreement with five major private ferry companies to provide such service in an emergency, and new berths have been provided for docking at Liberty Park. As part of this effort, geographic information systems (GIS) are being used to prepare an inventory of all ferry vessels, as well as locations where they could dock in New Jersey. The plan is to identify a limited number of docking locations in advance so that the Coast Guard, which has command over the ferry routes, could 31 In fact, should there be an attack on any part of the network, Amtrak would go into “Code Black,” shutting down the system, and in the process, New Jersey Transit Rail and its Pennsylvania Station terminal. A new tunnel being constructed under the Hudson River should be available no later than 2016, and will double the capacity of New Jersey Transit rail service to New York and provide redundancy in the system.
Case Studies 169
quickly determine the best routes for ferry trips and communicate these to the ferry operators at the time of an emergency event. Of course, the NYPD Harbor Patrol and the New Jersey State Police Marine Services would assist in any evacuation. Command and Control Transit providers are well represented in the emergency decision-making structure. In the event of an emergency, each transit agency would send a representative to the NYC EOC. In the case of the MTA, one representative might serve as the point of contact for multiple MTA agencies. This would be determined on a case-by-case basis, depending on the nature and the scope of the incident. Most of the transit agencies (e.g., MTA NYCT- Subway, MTA NYCT-Bus) and other key agencies (e.g., NYPD) also have their own EOCs at which the detailed direction of their own people is handled during an emergency.32 The areawide evacuation plan identifies the principal points of contact in an emergency. Representatives at the NYC EOC would be responsible for communicating with their respective agencies’ command centers. Communications In an emergency, NYCOEM is responsible for notifying all transit agencies (including NJT), among others, regarding the nature and location of the hazard; the number of residents to be evacuated, if necessary; decontamination needs and procedures, if appropriate; evacuation center locations that have been activated, if any; diversions between modes already under way; activation of procedures to authorize transit vehicles to access restricted areas; and resources needed, such as for transport of emergency personnel or evacuees with special needs. Telephone numbers for primary and backup contacts have been identified. In general, communications are handled through a variety of mechanisms, including hard line, cell, and satellite phones, as well as radios. The region has not developed an interoperable communications system, although New Jersey has received some funding from the Department of Homeland Security (DHS) to develop such a system in that state.33
Transit providers can also use TRANSCOM, an electronic communications system, to communicate with each other. Created in 1986, TRANSCOM is available to a coalition of 16 transportation and public safety agencies in the New York–New Jersey and Connecticut region to collect real-time regional information on traffic and transportation management and disseminate it to member agencies.34
In an emergency, transit providers would communicate with their customers through public address systems on station platforms, on trains, and in terminals; through announcements
32 The MTA Police is in the process of establishing an MTA-wide EOC to coordinate activities and communications among the MTA agencies. This initiative stems from a recommendation following the August 8, 2007, flooding that rendered much of the rail transit system inoperable. One of the major complaints was the lack of timely information for customers about service changes. In addition, the MTA agencies themselves were unaware of the status of their partner agencies. 33 New Jersey interviewees noted the need for a more well-developed interagency communications system. In 2006, the state set aside $4.6 million of a DHS Transit Grant for development of an interoperable communications system. 34 Member agencies include the New York State, NYC, New Jersey, and Connecticut departments of transportation; the New Jersey Turnpike Authority and the New York State Thruway Authority; the New Jersey, NYC, and New York State Police Departments; the MTA; MTA NYCT; MTA Bridges and Tunnels; the Port Authority; the New York State Bridge Authority; NJT; and the Port Authority Trans-Hudson Corporation.
170 Special Report 294: The Role of Transit in Emergency Evacuation and postings by station agents; on websites and through text messages to subscribing customers; and through messages that NYCOEM could help disseminate. (MTA agencies all have communication and notification procedures in place that are used on a day-to-day basis to report service changes and outages.) Transit providers hope to minimize any confusion by running schedules as close to normal as possible. If an evacuation were required, transit provider supervisory and station staff would help direct passengers to the correct train or bus to access evacuation centers, and announcements would be made on board. At stations where service was to be increased, additional station agents and supervisors would be present to help control crowds and provide customer information. In some locations, station supervisors and managers, with the assistance of NYPD, might need to take more drastic action, such as metering people into the station and onto the platform. Support for Incident Response and Recovery NYCOEM is responsible for notifying transit agencies of resources and support needed for transporting emergency personnel to an incident site at the time. According to NYCOEM, plans have been developed for this eventuality. Use of transit personnel and equipment for this purpose would obviously impact service capacity available for evacuees.
The role of transit in recovery is not a major planning focus at the moment. Restoration of service, of course, would depend on the nature of the emergency. In the event of a hurricane, restoration of service would depend on the extent of flooding in rail tunnels and the amount of debris on the streets, affecting bus travel. MTA staff also noted that there is a trade-off between attempting to operate service for a longer time before a hurricane and the ability to start up service quickly after the storm has subsided. The MTA itself has developed a service restoration plan that would be initiated as soon as an incident occurred. Key MTA staff would meet at the NYT-Subway Rail Control Center with representatives of the police and fire departments, NYCOEM, and other agencies to begin mobilizing resources. Exercises and Drills Conducting a full-scale evacuation drill in NYC is not possible given the size of the population. Nevertheless, tabletop exercises are held frequently in New York, New Jersey, and Long Island. New Jersey, for example, just held a such an exercise to test the Trans-Hudson Emergency Transportation Plan. NYCOEM held an exercise to test the evacuation center and sheltering plan; it opened one evacuation center and two shelters in the exercise. The New York–New Jersey area has also had considerable experience with managing emergencies and presumably has learned much from this experience. Finally, NYC has been the site of numerous planned events—the Pope’s visit in 1999, the Republican National Convention in 2004, and annual New Year’s Eve celebrations in Times Square and Fourth of July celebrations—where extensive experience has been gained regarding transit use and crowd control.
Case Studies 171
Remaining Challenges Special-Needs Populations Successful evacuation of special-needs populations, even for an advance-notice event such as a hurricane, will be a challenge. NYCOEM has responsibility for planning the evacuation of these populations, which the agency defines as those who are homebound with a medical condition. In a worst-case hurricane scenario, NYCOEM estimates that approximately 300,000 such individuals would need to be evacuated. Although the agency has mapped some census data on special-needs populations using GIS technology, it does not have a complete picture of the numbers, types, and locations of these individuals or of the resources available (e.g., accessible vehicles, licensed drivers, skilled personnel) to assist them. NYCOEM has not tried to create a voluntary special registry for special-needs evacuees, primarily because it believes that keeping such a registry up to date would be impossible. Rather, it is working with community organizations that provide services to these groups to identify their needs in an emergency evacuation, and is working as well with community emergency response teams.35 The agency also encourages special-needs populations to arrange for their own transport in an emergency. If that is not possible, a last-resort Homebound Evacuation Operations Plan will go into effect. If a “Recommendation of Evacuation for Individuals with Special Needs” is issued, individuals needing assistance will be able to call 311. They will then be divided into three groups: (a) those who need public transport and can walk to the curbside to access it, (b) those who can sit in a vehicle but cannot walk to access it, and (c) those who need medical assistance. For those who are ambulatory, NYC paratransit vehicles and MTA-accessible buses or supplementary school buses with lifts will transport them to public shelters.36 For those who can sit but not walk, NYC firefighters will bring them to MTA paratransit vehicles or accessible MTA or school buses. For those who need medical attention, 311 operators will transfer them to emergency medical services, which will arrange for ambulances to take them to the nearest hospital outside the evacuation zones. With the exception of those who need medical assistance, people with special needs will be taken to public shelters and will be advised of this by the 311 operators.37 In addition, as part of the Homebound Evacuation Operations Plan, NYCOEM is developing an advance warning system with health care providers, which will be activated to notify members of the need to begin evacuation, also using the 311 system.
Implementing the plan in a timely way at the same time that others are evacuating is likely to create conflicts. For example, if special-needs populations are not evacuated early on, they are likely to draw on personnel (i.e., firefighters) and equipment (i.e., accessible buses) that may be needed for other purposes (e.g., evacuating those who are ambulatory and do not require assistance). These problems would be exacerbated in a no-notice emergency. Another key issue is whether drivers of the 14 carriers contracted to provide paratransit service can be relied upon
35 Currently there are 62 such teams in the city. The goal is to establish at least one for each community. 36 Paratransit customers will also be able to call the paratransit call-in line for service, although all who need assistance will be encouraged to use the 311 number. Nevertheless, paratransit providers have a list of shelters in their system and are working with NYCOEM to determine how many of the 106,000 registrants live in a flood zone. This year, in their annual survey, paratransit service providers are asking registrants whether they expect to use Access-A- Ride services in an evacuation. 37 New York City has eight special-needs shelters, which are staffed with nurses, nurse practitioners, and physicians. NYCOEM is also working with the City University of New York and the Department of Health to train staff for all public shelters that could assist special-needs populations.

172 Special Report 294: The Role of Transit in Emergency Evacuation to report to work in an emergency, and thus whether there will be an adequate number of licensed drivers. Other issues include the ability of the 311 system to handle the potential number of call-ins within a short time frame, as well as the potential for duplication with paratransit clients using the paratransit provider call-in number. Finally, a drill or at least a tabletop exercise would be useful to help determine whether the plan will work in practice. Jurisdictional Issues and Development of a Regional Evacuation Plan Emergency planning in the New York UA is enormously complex, involving multiple jurisdictions and states. Coordination between the state OEMs is good, and coordination within the MTA on evacuation issues has been thoroughly planned for. Contact with other major area transit providers regarding evacuation issues is less frequent, although NYCT is working closely with NJT, the Port Authority, and Nassau County to develop service plans.38 More broadly, however, a regional plan and multistate command structure have not yet been developed.39 A Regional Evacuation Liaison Team has been created, but funding is an issue (see below), and no timeline has been set for completion. Traffic Congestion and Management Capacity limitations of the New York UA’s aging infrastructure could limit the ability to evacuate people quickly in an emergency. NYC DOT has primary responsibility for traffic management in NYC40 and is represented in evacuation planning and at the EOC, coordinating closely with NYPD should the center be activated. Nevertheless, from a transit perspective, bus movement in an evacuation, even an advance-notice evacuation such as that for a hurricane, when evacuees are encouraged to use rail transit, is an issue because buses share the roads with vehicles and pedestrians. Specifically at issue is the ability of buses to transport passengers to evacuation centers in the event of a hurricane or a no-notice event requiring evacuation,41 as well as bus transport of emergency responders to the incident itself. Contraflow lanes in NYC are viewed as impractical, although NYPD would secure the streets around the Port Authority bus terminal to facilitate bus traffic to New Jersey.42 NYC DOT can also initiate special hurricane signal timing to facilitate traffic movement, and can use electronic signs as well as preinstalled evacuation route signs to guide traffic during an evacuation. DOT staff indicated the existence of detailed plans for handling pedestrian and vehicle conflicts in Manhattan. Pedestrian evacuation routes on city roads and bridges have been identified, including detailed information 38 Argonne National Laboratory is currently working with OEMS in Nassau and Suffolk Counties and townships, Westchester County, the Port Authority, and SEMO to review all local hurricane evacuation plans and identify any gaps. 39 Provision has been made for the OEMs of New York City, New York State, and New Jersey to be in contact via conference calls during an incident. 40 Responsibilities also include traffic signal timing, messaging signs, and the like. NYC DOT, New York DOT, and NYPD work together on a daily basis at the traffic management center in Queens. New Jersey has a new traffic management center at Woodbridge, which should help coordinate the response of New Jersey DOT, the New Jersey Turnpike Authority, and the New Jersey State Police in an emergency. 41 NYCOEM has plans for staging areas for MTA buses and Department of Education school buses to minimize driving distance, but it remains to be seen how well these plans will work in practice. 42 Contraflow lanes could be used on Rockaway Boulevard at the Queens–Nassau County border to smooth traffic flow for evacuees. The Holland Tunnel, and in New Jersey some New Jersey Turnpike lanes, would be dedicated for bus travel from the Port Authority bus terminal to Liberty Park.
Case Studies 173
about deployment of NYPD to handle traffic, and these plans are being coordinated with the MTA. Nevertheless, the sheer volume of pedestrian and vehicle traffic in an emergency could make plan execution difficult. In New Jersey, the State Police are responsible for road management. Reverse-lane strategies are in place for the movement of evacuees from shore communities inland in the event of a hurricane or major coastal storm. As part of the Trans-Hudson Emergency Transportation Plan, the State Police would also control traffic on the New Jersey Turnpike to ensure that buses coming from NYC through the Lincoln Tunnel would have direct access to Liberty State Park and the Meadowlands if the latter facility were activated once construction is complete. Behavioral Issues Questions have been raised about the willingness of New Yorkers to evacuate in an emergency, even an advance-notice event such as a hurricane. Although the area has experienced flooding in severe Nor’easters—most recently in April 2007—a major hurricane has not struck the area since the 1950s and 1960s. Thus, New York does not have a culture of evacuation as does the Gulf Coast, and shelters have a negative connotation for many area residents. Nevertheless, NYCOEM is encouraging evacuation of residents of storm surge areas in a hurricane and has provided information in mailings (brochures) and on the web for that purpose. For example, NYCOEM has sent all NYC residents who live in evacuation zones the Ready NY Guide, a brochure that tells residents how to prepare for an emergency and whom to contact for assistance. Recognizing an obstacle experienced elsewhere to getting individuals to evacuate, NYC’s evacuation plan can also accommodate pets on transit facilities as long as they are caged or leashed and muzzled. In the event that some individuals still resist evacuation, NYCOEM will have “centers of last resort,” with few or no services available other than physical sanctuary, in flood zones. Timing An important issue is the lead time necessary to call an evacuation in the event of a major hurricane or coastal storm. The MTA estimates it needs to notify its employees to be on standby about 50 hours in advance of such an event. However, it does not believe political leadership would mandate an evacuation that soon. Thus, the MTA would probably have to make its decision early, and this has considerable financial implications. Similarly, political leadership would probably have to issue the call for a mandatory evacuation of storm surge zones before the actual trajectory of the storm was known—an issue constantly faced by their Gulf Coast counterparts. Another issue is the time needed by transit operators to get both personnel and equipment to safety prior to the onset of damaging winds. For this reason, transit is scheduled to shut down 6 to 8 hours prior to the predicted onset of gale-force winds. Funding The New York UA has received considerable funding from DHS for emergency planning and response. However, federal funding has not been forthcoming for the development of regional evacuation plans, although DHS has mandated that UAs develop such plans for catastrophic
174 Special Report 294: The Role of Transit in Emergency Evacuation emergencies requiring evacuation.43 Without such external assistance, possibly tied to performance indicators, it is doubtful that the development of a regional plan will move quickly given the time and numbers of agencies that must be involved. Summary The New York UA has the largest and densest population of the 38 UAs studied. The area is served by the largest transit system in North America, with an extensive network of rail and bus, commuter and intercity passenger rail, and ferry services. The transportation infrastructure, particularly in NYC, is also one of the oldest in the nation. Roads are congested, and a large proportion of the population does not have a car, posing a considerable challenge if evacuation is required in an emergency. For these reasons, and given the sheer size of the UA, evacuating the entire metropolitan area is not viewed as a practical scenario. Rather, the focus of NYCOEM, the agency responsible for emergency planning, has been on partial evacuation—moving residents in storm surge areas to higher ground within the area in the event of a major hurricane or coastal storm, and organizing a system of public evacuation centers and shelters for those who cannot shelter with friends or relatives. In the event of a no-notice emergency, such as another terrorist incident or a major power outage, evacuation plans are focused on returning commuters and others home and on a partial evacuation of the affected area, if needed.
Transit providers are well integrated into emergency evacuation plans, and multiple modes of transport—rail, bus, commuter rail, and ferries—would be used in an emergency evacuation. The MTA has developed a detailed service plan for a hurricane evacuation on the basis of information provided by NYCOEM on the locations and numbers of potential evacuees. A transit agency coordination document establishes general operating principles and points of contact for all area transit providers should an areawide evacuation be required because of an unspecified emergency incident. Transit agencies are part of the decision-making structure in the event of an emergency, and senior staff would be represented at the EOC should it be activated. Transit providers have established methods for communicating within their own agencies. NYCOEM is responsible for communications among other area emergency management agencies, law enforcement officials, and transit providers across the UA. Many methods of communication are available, but an interoperable communications system has not been developed. In New Jersey, NJT and PATH, which serves New Jersey commuters to New York, are well integrated into emergency planning initiatives. Area transit providers in general have had considerable experience transporting large numbers of passengers during emergencies, such as the terrorist attack of September 11, as well as for major planned events. They have also participated in numerous tabletop exercises of emergency evacuation plans, although full-scale drills are not viewed as practical.
Many challenges remain, however. Interjurisdictional issues continue to be paramount in view of the multiple states (New York, New Jersey, Connecticut) and multiple agencies that must be involved in emergency evacuation planning. A Regional Evacuation Liaison Team has been established, but development of an areawide regional evacuation plan has only just begun. With the possible exception of the advance warning system with health care providers, a workable evacuation plan for special-needs populations—including ways to identify these populations and coordinate their evacuation with that of the general population in the event of an 43 Following the conduct of this case study, DHS created a new Regional Catastrophic Preparedness Grant Program to support regional all-hazards planning for catastrophic events.

Case Studies 175
emergency—remains a work in progress. Finally, convincing New Yorkers of the need to evacuate at all may be an issue, particularly in the event of a hurricane or major coastal storm, because of the infrequency of such an event.
This case study also raises several more general policy issues that may be relevant for other large UAs. A key issue is whether it is realistic to consider evacuation of a major UA. Emergency planners have unequivocally answered this question in the negative, and all emergency evacuation plans are predicated on partial evacuations and sheltering in the area, if necessary. This same issue was raised in other case studies (e.g., Chicago, Los Angeles), and is critical because planning for a more extensive emergency evacuation may be impractical and focus priorities and limited funding on a low-probability event.
Managing traffic congestion in older UAs, such as New York, is another key issue that can affect successful evacuation, particularly the use of buses. New York transportation planners do not believe that contraflow arrangements are feasible, particularly for NYC, except in a few limited cases. Changing traffic signal timing, using variable message signs, and the like can help, but sharing the road with private vehicles and, in Manhattan, with large numbers of pedestrians is likely to impede rapid egress by buses in an emergency evacuation. Providing more redundancy of facilities, such as the new Hudson River Rail Tunnel, would be desirable, but additional capacity is expensive and difficult to construct in a fully built-up, older, densely populated urban area.
The complexities of evacuating special-needs populations is yet another key issue, particularly in a UA the size of New York. Area planners have determined that establishing voluntary special registries to identify residents needing assistance in an evacuation is not feasible; keeping such a registry up to date is not practical and could provide a false sense of security. Nevertheless, the plan to use the 311 system at the time of an emergency to process those needing assistance and to coordinate their evacuation using personnel (firefighters) and equipment (MTA and school buses) that could be needed to serve the general population appears problematic. NYCOEM is encouraging self-help efforts, and has enlisted the assistance of community human service providers who are aware of the needs of many potential special-needs evacuees. The agency is also working to train staff to work with special-needs populations at shelters. Nevertheless, NYCOEM continues to believe that its biggest remaining challenge is to identify special-needs populations and their transportation requirements.
Finally, funding is an important issue. Since Hurricane Katrina, DHS has placed greater emphasis on the development of regional evacuation plans for a catastrophic emergency. New York has assembled a Regional Evacuation Planning Team, but without more external assistance, possibly tied to performance indicators, progress is not likely to be rapid. Moreover, the development of a workable regional plan assumes that agencies will work across political and jurisdictional lines to implement that plan. Committee Members and Staff in Attendance Kenneth Brown (lead) Arnold Howitt Michael Setzer David Giles44 44 Senior Research Assistant, Taubman Center for State and Local Government, John F. Kennedy School of Government, Harvard University.

176 Special Report 294: The Role of Transit in Emergency Evacuation Nancy Humphrey Briefings Shoshana Cooper, Director, Operations Analysis, New York City Transit Kevin Fowler, Assistant Bureau Chief, Emergency Preparedness Bureau, and Michael Devlin,
Assistant Unit Head, New Jersey State Police (OEM North Region) Raheel Shabih, Director of Transportation and Infrastructure, New York City Office of
Emergency Management Harold Neil, Director, Office of Transportation Security, New Jersey Department of
Transportation Gerard McCarty, General Manager, Emergency Management, Office of Emergency
Management, Port Authority of New York and New Jersey Robert Noble, Sergeant, Office of Crisis Management, New Jersey Transit Police David Zatlin, Regional Coordinator, State Emergency Management Office Region 1, State of
New York (by telephone) David Williams, Liaison Officer, Long Island Region, New York State Department of
Transportation Ian Francis, Acting Director of Interagency Programs/Projects, Region 11, New York State
Department of Transportation Fredericka Cuenca, Director of Operations Support, Metropolitan Transportation Authority John Tipaldo, Director of Traffic Management, New York City Department of Transportation;
Margaret Gordon, Executive Director, Safety and Security, Staten Island Ferry & Private Ferries, New York City Department of Transportation; and Milagros Ramirez, Emergency Planning & Preparedness Coordinator, Special Events, Emergency Response, New York City Department of Transportation
Megan E. Medina, Preparedness Specialist, NYC Office of Emergency Management (assisted with follow-up questions)
Documents Consulted 1. New York City Transit. 2007. Hurricane Evacuation Service Plan and Attachments
(revised), June 2007. 2. Cooper, S. 2007. Transit Evacuation for the Worst Case Hurricane in New York City, New
York City Transit, prepared for the National Conference on Disaster Planning for the Carless Society, New Orleans, LA, February.
3. Metropolitan Transportation Authority, Office of Civil Rights, Informational Letter to Milligan & Company, LLC, regarding FTA request for information on treatment of needs of minority and low-income persons, households without vehicles and persons with limited English proficiency in emergency preparedness plans.
4. Metropolitan Transportation Authority. The MTA Network. http://www.mta.info/mta/network.htm.
5. MTA Agency Coastal Storm Timelines (by time interval). 6. New York State Department of Transportation, Region 10 (Long Island), Emergency
Response Guidebook, version 2006–2007.
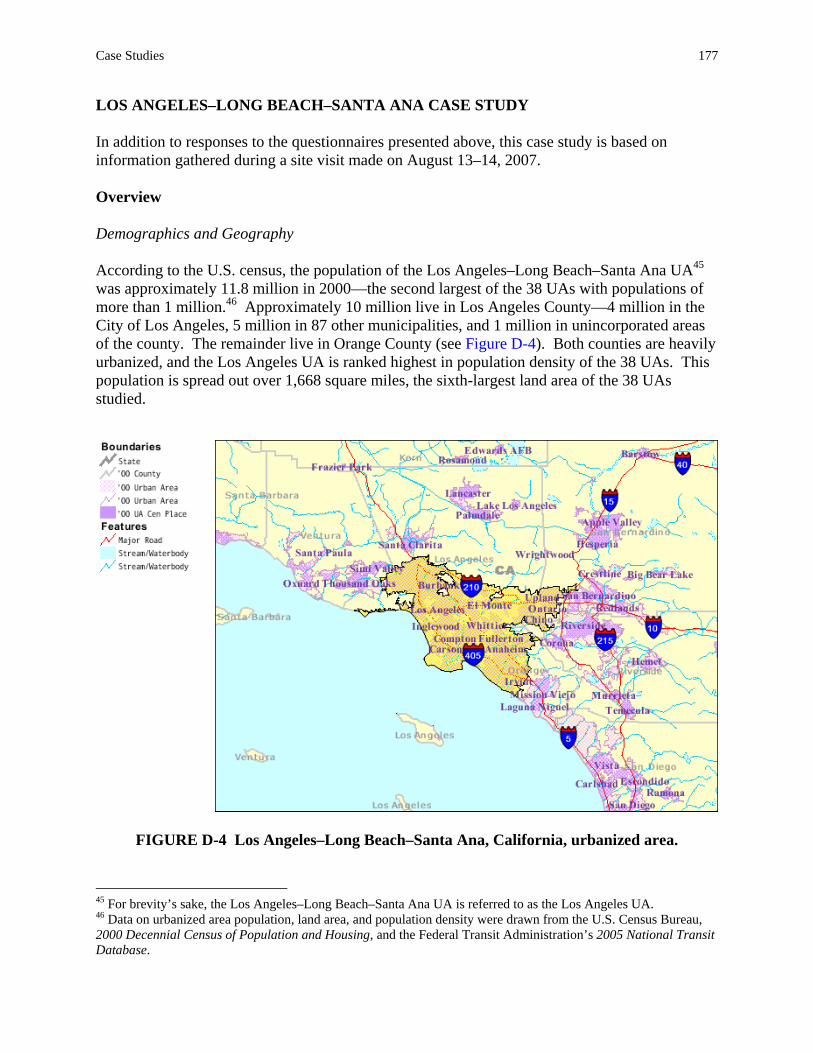
Case Studies 177
LOS ANGELES–LONG BEACH–SANTA ANA CASE STUDY In addition to responses to the questionnaires presented above, this case study is based on information gathered during a site visit made on August 13–14, 2007. Overview Demographics and Geography According to the U.S. census, the population of the Los Angeles–Long Beach–Santa Ana UA45 was approximately 11.8 million in 2000—the second largest of the 38 UAs with populations of more than 1 million.46 Approximately 10 million live in Los Angeles County—4 million in the City of Los Angeles, 5 million in 87 other municipalities, and 1 million in unincorporated areas of the county. The remainder live in Orange County (see Figure D-4). Both counties are heavily urbanized, and the Los Angeles UA is ranked highest in population density of the 38 UAs. This population is spread out over 1,668 square miles, the sixth-largest land area of the 38 UAs studied.
FIGURE D-4 Los Angeles–Long Beach–Santa Ana, California, urbanized area.
45 For brevity’s sake, the Los Angeles–Long Beach–Santa Ana UA is referred to as the Los Angeles UA. 46 Data on urbanized area population, land area, and population density were drawn from the U.S. Census Bureau, 2000 Decennial Census of Population and Housing, and the Federal Transit Administration’s 2005 National Transit Database.
178 Special Report 294: The Role of Transit in Emergency Evacuation
The Los Angeles UA has a high concentration of immigrants, whom research has shown to be heavy transit users (see Chapter 3 and Appendix B). For example, the Los Angeles UA has the second-highest number of foreign-born persons entering the United States since 2000, after the New York–Newark UA. Moreover, according to the 2005 American Community Survey, a large fraction of the population (28 percent of the UA population over age 5) speaks English “less than very well”—the highest proportion among the 38 UAs. The Los Angeles UA also has high numbers of people living in poverty. Of the 38 UAs, it is tied with the Riverside–San Bernardino UA in having the third-largest percentage of its population below the poverty level. Among the 38 UAs, the Los Angeles UA has the second-highest population (> age 5) with a disability, but ranks near the bottom of the 38 in the percentage of its population (11 percent) with a disability. Similarly, the 2000 census reported nearly 438,000 householders in the Los Angeles UA as not having a car, second only to the New York–Newark UA. However, the percentage of carless households (11 percent) is only slightly above the median of the 38 UAs.
The Los Angeles UA is bounded by the Pacific Ocean on the west. The area is served by two of the largest ports in the nation (the Ports of Los Angeles and Long Beach), one of the busiest international airports [Los Angeles International Airport (LAX)], and an extensive freeway network. The transit system is primarily a bus system, and the buses travel on a highway network that has been rated the most congested among the 38 UAs.47 Light and heavy rail serve the City of Los Angeles, LAX, and Long Beach, and commuter rail service is available to downtown Los Angeles, but the system is far less extensive than the rail systems of many older UAs, such as New York and Chicago. Transit The Los Angeles Metropolitan Transportation Authority (MTA)48 is the primary transit provider in the Los Angeles UA, serving the City of Los Angeles and the rest of Los Angeles County. The agency is supported by an allotment of the state sales tax, a portion of which it allocates to other local transit operators. The MTA functions in a transportation planning and programming capacity, as well as being a provider and funder of local transit services. It not only oversees all regional bus and rail operations, but also has responsibility for countywide transportation policy and planning; programming of federal, state, and local transportation funds; and coordination of transportation agencies operating within the county.49 Moreover, the MTA funds and develops high-occupancy vehicle lanes [in cooperation with the California Department of Transportation (Caltrans)], provides freeway service patrol, and funds bicycle paths, much along the lines of METRO in Houston.
47 Schrank and Lomax, The 2007 Urban Mobility Report, Texas Transportation Institute. 48 The MTA was created by the California State Assembly in May 1982, merging the former Los Angeles County Transportation Commission and the Southern California Rapid Transit District. 49 In contrast to other regions in California and to other metropolitan areas, responsibility for programming transportation funds in the Los Angeles region rests at the county and subcounty levels. Both Los Angeles and Orange Counties have a transportation commission or authority [MTA in the case of Los Angeles County and the Orange County Transportation Authority (OCTA) for Orange County] charged with countywide transportation planning, allocation of locally generated or locally dedicated funding, and operation of transit services. The role of the Southern California Association of Governments (SCAG), the metropolitan planning agency for the region, is to integrate the county-developed transportation improvement programs (TIPs) into a consistent regional program, brokering any disputes. SCAG is also responsible for developing the Long Range Regional Transportation Plan, with which each county’s TIP must be consistent.

Case Studies 179
In its transit capacity, the MTA operates approximately 2,500 buses over 168 bus routes, including a dedicated bus lane for rapid bus transit,50 and rolling stock of more than 150 railcars on four rail routes—three light rail lines and one heavy rail—serving approximately 1.3 million bus riders and about 300,000 rail riders. The rail system has more capacity to move large numbers of people rapidly; for example, it can transport approximately 15,000 to 20,000 passengers per hour in a major event. Nevertheless, the equipment cannot be used interchangeably even on the light rail lines, which limits the capacity to meet surge demands in a particular service area in an emergency. Although the bus fleet has less capacity to move large numbers of people quickly, the MTA considers its bus fleet to have far greater flexibility to accommodate surge demands. The MTA contracts with Access Services to provide paratransit service to those with disabilities in its service area.51
Los Angeles County is served by four other major transit providers (a total of 42 transit agencies serve the county). In addition to its responsibility for traffic management on city streets and parking enforcement within the City of Los Angeles, the Department of Transportation (DOT) of the City of Los Angeles manages three transit programs through eight competitively bid contracts—the downtown feeder and community DASH lines with 120 alternatively fueled vehicles; Commuter Express, which offers peak-period express bus service on 15 routes in the county; and the City Ride program, which provides Dial-a-Ride and other services for the elderly and those with disabilities within the City of Los Angeles with its 73-vehicle fleet. Foothill Transit provides bus service for 21 municipalities and unincorporated areas in Los Angeles County. Similar to the Los Angeles DOT, this agency competitively contracts its services, which are provided by a fleet of nearly 320 buses operating on 20 routes and managed by a private company. With a fleet of 55 bilevel railcars (and 39 locomotives), Metrolink, the third transit provider, operates commuter rail service not only in Los Angeles County, but also in Orange, Riverside, Ventura, and San Bernardino Counties.52 More than half of passenger trips (54 percent), however, end in Los Angeles, and four of the six rail lines terminate in downtown Los Angeles at Union Station. Some of Metrolink’s lines run on private freight rail track, and several stations are shared jointly with Amtrak intercity rail service. Finally, Long Beach, a large suburb of Los Angeles with 500,000 residents, is served by Long Beach Transit, as well as MTA’s Blue Line. Long Beach Transit operates 220 buses over 38 bus routes, plus a contracted Dial-a-Ride service for those with disabilities who are unable to use the regular bus system, a downtown shuttle service and circulator, and a water taxi.
Orange County has its own transit agency, the Orange County Transportation Authority (OCTA), which is supported by a dedicated county sales tax that was recently reauthorized by county voters. With a fleet of about 950 large buses that it owns and operates, OCTA provides service on 81 routes in the county. It also owns 374 vehicles that are operated and maintained by a contractor. Of these, 265 are in paratransit service, and the remaining 109 are in small bus fixed-route service.53
50 The Orange Line runs through the San Fernando Valley from North Hollywood to the Warner Center. 51 Access Services is a state-mandated, local governmental agency created by public transit operators in Los Angeles County to administer and manage the delivery of paratransit services on their behalf to Americans with Disabilities Act (ADA)-certified county residents. 52 Metrolink is in the process of purchasing 103 additional railcars and cabcars and 15 locomotives. It recently opened its fist suburban-to-suburban route. 53 In addition, OCTA has another 117 contingency vehicles—82 large buses and 35 vehicles that could be operated either in paratransit or fixed-route service. Many of these vehicles can be brought on line quickly in an emergency.

180 Special Report 294: The Role of Transit in Emergency Evacuation Emergency Response and Evacuation Planning The authority to declare a state of emergency rests with local government. In the City of Los Angeles, the mayor has this responsibility, to be exercised in conjunction with the City’s Emergency Preparedness Department (EPD). Elected officials of the other 87 municipalities in Los Angeles County reserve this authority, but the Los Angeles County Office of Emergency Management (OEM) would play a major coordinating role if an incident of any magnitude were involved. The Los Angeles County and Orange County boards of supervisors have responsibility for declaring a state of emergency in unincorporated areas of their respective counties. If a major incident occurred, the governor could declare a state of emergency and, working through the California Office of Emergency Services (OES), would deploy the resources of the California Highway Patrol, Caltrans, and other state resources.54
If an emergency warrants an evacuation, law enforcement is responsible. The Los Angeles Police Department (LAPD) issues an evacuation order in the City of Los Angeles; the police chiefs reserve this authority in the other 87 municipalities in Los Angeles County. County sheriff’s offices have this responsibility in unincorporated areas of Los Angeles and Orange Counties.55
Three primary agencies have responsibility for emergency planning in the Los Angeles UA—the EPD of the City of Los Angeles, the OEM of Los Angeles County, and the Orange County Department of Emergency Services (DES). The Los Angeles EPD is responsible for planning the city’s response to an emergency, including coordinating with other key agencies—the LAPD, the Fire Department, the Department of Public Works, the DOT, and Caltrans. If the Los Angeles EPD determines that activation of the emergency operations center (EOC) is necessary and the LAPD orders an evacuation, the MTA provides the primary transportation support, and the Los Angeles DOT provides backup.
The Los Angeles County OEM is charged with planning for and coordinating during the county’s response to an emergency, including activation of the County EOC (CEOC).56 The county is divided into eight disaster management areas (Area H is the City of Los Angeles), which are run by professional emergency managers. The county plans for three levels of CEOC activations: Level 1, a limited response in which the CEOC is staffed by one or two individuals, monitoring events and ensuring good communications between responding agencies and emergency managers; Level 2, a moderate emergency that requires coordinated response among selected departments, outside agencies, or liaisons; and Level 3, a full activation emergency that requires the response of all departments and many agencies. If an evacuation is ordered by the Los Angeles County Sheriff’s Department, the MTA provides a supporting role for transit services. Major evacuation routes have been identified in the event of an evacuation (mainly commuter routes), and some lanes have been dedicated for ingress of emergency vehicles. Evacuation centers have also been preidentified by the Red Cross, located primarily at area schools. The actual evacuation routes and shelters to be used, however, would be determined at the time of an emergency and depend on the nature and extent of the incident.
54 The Governor can declare a state of emergency without a local request. This happened during the October 2007 brush fires that affected the Los Angeles and San Diego areas. 55 Fire and health officials can also initiate an evacuation in Orange County. 56 The CEOC is activated if the EOC of the City of Los Angeles or the City of Long Beach is activated, or if the EOCs of two or more cities in the county are activated. The county can also activate the CEOC on its own if conditions warrant.
Case Studies 181
The DES is responsible for emergency planning and coordination of the appropriate response in Orange County, including activation of the county EOC. If an evacuation were ordered by the Orange County’s Sheriff’s Office, the OCTA would provide transportation for those without access to a private vehicle to assembly points or other designated locations at the direction of the Transportation Unit Coordinator at the EOC.
The Los Angeles UA has not planned for a major multijurisdictional emergency that would require a large-scale evacuation, although the U.S. Department of Homeland Security (DHS) recently approved a small grant for mass evacuation planning in the region (see details below). Area officials do not believe that a mass evacuation of Los Angeles is feasible. Moreover, they note that the hazards the area faces are largely unpredictable, and therefore it is difficult to plan for them.
The County of Los Angeles’ encyclopedic All-Hazard Mitigation Plan (dated June 2005) identifies as the area’s highest–risk hazards earthquakes, urban fires, terrorist events, utility losses, floods, droughts, biological/health incidents, contamination of water and wastewater systems, economic disruption, disruption of data and telecommunications systems, and civil unrest.57 With some exceptions, evacuation scenarios and plans have not been developed for these threats because it is difficult to know where they might occur in the region and which freeways would be affected. For other hazards (e.g., earthquakes), evacuation is not typically involved, and the transit system itself or the roads on which buses operate could be compromised. Some evacuation plans for specific emergencies or areas, however, have been developed or are under development, and some do or could involve transit. Brushfire evacuation plans have been prepared (transit does not play a role), and a tsunami plan is soon to be released that includes a small role for transit. The U.S. Coast Guard has drafted a major plan for evacuating approximately 1.5 million people in the vicinity of the Ports of Long Beach and Los Angeles in the event of a terrorist incident (detonation of a nuclear device); the MTA is involved in this plan, but the plan is confidential. In addition, a plan for the evacuation of LAX is being developed. No plan currently exists, however, for evacuating downtown Los Angeles in the event of a terrorist incident or other emergency.
One of the area’s most complete and frequently practiced evacuation scenarios is part of Orange County’s Nuclear Power Plant Emergency Plan to handle a potential radiological discharge from the San Onofre Nuclear Generating Station (SONGS), located in northern San Diego County close to the Orange County border. Following federal regulations, Orange County has developed an evacuation plan, including transportation assembly points, bus transport for those without access to private vehicles, and provision for special-needs populations.58 Although the affected communities lie outside the Los Angeles UA, development and frequent drills (every 3 years) have forged close links between Orange County emergency managers and the OCTA.
Despite the lack of areawide evacuation plans, California has a long history of mutual-aid agreements, dating back to the Civil Defense program in the 1950s. The California Emergency Services Act, passed in the 1970s, built on earlier systems of mutual aid. In the 1990s, the 57 The Hazard Mitigation Planning Advisory Committee established priorities for these risks, taking into account public input, on the basis of the probable effects of each risk, including its potential magnitude and economic impact, the frequency distribution of resulting damage, the demographics of areas potentially affected, and the degree of vulnerability. 58 After the Three-Mile Island incident, all communities within approximately 10 miles of a nuclear power plant were required to develop emergency plans, including evacuation routes and shelter locations. The State of California has defined a broader radius of 10–20 miles as a public education zone within which residents are to be informed about preparedness plans.
182 Special Report 294: The Role of Transit in Emergency Evacuation response to the Oakland fires resulted in the formalized Standardized Emergency Management System (SEMS) by which signatory agencies agree to assist one another voluntarily, including the provision of transportation services, in the event of a disaster.59 Thus, area emergency managers believe they have the capability to handle most emergencies and potential evacuation needs at the time they occur. Nevertheless, it is difficult to see how plans for specific hazards could be scaled up to handle a mass evacuation. Transit’s Role in Emergency Evacuation Evacuation In Los Angeles County, the MTA has the primary role for coordinating transportation providers in a major incident that would trigger activation of either the Los Angeles City or County EOC, where the agency would be represented and potentially requested to provide drivers and buses in an evacuation. That said, there is no regional plan for a major evacuation, and for many hazards, the MTA has a limited role. In an earthquake, for example, the MTA would shut down the system until the integrity of rail lines and overpasses on which buses travel had been verified. The MTA is not involved in the tsunami plan, nor does it have a plan to move transportation-dependent populations in an emergency. MTA staff noted that even in a partial evacuation, the agency has little spare capacity to respond to an emergency while keeping the rest of the system operating.
In the City of Los Angeles, the DOT considers itself a first responder in an emergency that does not require activation of the city EOC, and has responsibility for coordinating other transportation providers. (If the EOC were activated in response to a major incident, the MTA would serve this role, and the DOT would supply backup transportation.) The City of Los Angeles DOT has a role in the soon-to-be-released tsunami plan, which would involve evacuation of 200,000 to 300,000 residents along predetermined evacuation routes. Transportation hubs have been identified from which transit buses would take those who lack access to a private vehicle to area high schools and parks, and the City of Los Angeles DOT has assigned a dedicated safety and security liaison to help coordinate the DOT’s transit role.
Foothill Transit is not currently included in Los Angeles County emergency plans, but the new director of emergency response believes the agency could play a role in an emergency, particularly in the evacuation of area residents with limited English proficiency. He is working to build links with emergency managers of the City and County of Los Angeles and the municipalities served by Foothill Transit. The agency does have some interaction with other area transit providers—the MTA, OCTA, and Omni Trans in San Bernardino. For example, Foothill Transit participates in the Regional Transit Safety Working Group, which meets monthly, but the primary focus is on emergency response to terrorism rather than an all-hazards approach.
Metrolink is also not included in Los Angeles County emergency plans, and it has no links with the CEOC and little or no interaction with the MTA on emergency response and evacuation issues. If its riders were stranded at a station in the event of an emergency, for example, there is no plan for moving them elsewhere. Metrolink does coordinate with local fire and police departments regarding an incident that could involve its own equipment, and the 59 SEMS was integrated into the federally required National Incident Management System (NIMS) following the attacks of September 11, 2001.
Case Studies 183
agency has plans for moving its equipment in the event of a tsunami or an earthquake.60 Although Metrolink would be willing to participate in emergency planning, agency staff see the primary role of the rail system as getting its own customers home rather than assisting others to evacuate. The primary constraint on greater involvement of Metrolink in an evacuation is the fixed-route nature of the system. The location of an incident, the time of day it occurred, and minimal staffing on trains also would limit the ability of Metrolink to provide assistance in a major incident.
Long Beach Transit is involved in local emergency planning, including the tsunami plan, which could involve evacuating 20,000 to 30,000 Long Beach residents or more, and the evacuation plan for the Port of Long Beach. It would also be represented at the Long Beach EOC should it be activated. Most residents have cars, but for those who do not, collection points have been established for them to access buses in an emergency evacuation. The goal of the fire department, which manages emergency planning in Long Beach, is to develop emergency operating plans and a state-of-the-art EOC and to build closer partnerships with Long Beach Transit, the Long Beach School District, and local Red Cross chapters. A disaster committee of many of the relevant agencies meets monthly.
OCTA is part of the Orange County emergency plan to provide transportation support in the event of an emergency and would be represented at the county EOC if it were activated. OCTA has a formal role in the county-developed emergency evacuation plan for SONGS—those who lack transport would be evacuated by bus to the Orange County Fair Grounds. Transit probably would not be needed for evacuation due to a tsunami. Specific plans are not in place for other emergencies. Buses and school shelters would be provided on demand as available, and numerous mutual-aid agreements would help augment local equipment needs if OCTA resources were overwhelmed.
Many transit agencies in the Los Angeles UA have little experience with area evacuations, but a great deal of experience handling large crowds during planned events and responding to area emergencies on an ad hoc basis. For example, the MTA and the City of Los Angeles DOT play a large role bringing people to some 500 special events each year (e.g., the Academy Awards) and managing area traffic.61 DASH vehicles were used during the 2000 Democratic National Convention. After the 1994 Northridge earthquake, the MTA bus system, which was not affected, was used to transport law enforcement officials to various locations, and Foothill Transit helped transport victims of the earthquake to temporary quarters. During the 1992 riots, MTA buses were used to bring in the National Guard. Long Beach Transit recently participated in the evacuation of residents fleeing from the Santa Catalina fire to schools in Long Beach as part of a mutual-aid agreement.
Schools play a major role in an evacuation by serving as shelters in both the City and County of Los Angeles. However, use of school buses to provide transportation in an emergency, with the exception of evacuating students, is a different story. According to school district officials, the 2,000 school buses of the Los Angeles Unified School District are fully committed on weekdays, and thus would not be available to assist in the evacuation of the general population. At other times, driver availability could be an issue. Union regulations could affect the number of hours that could be worked, and more than half the workforce is contracted out. Moreover, drivers are not familiar with routes other than school bus routes. In
60 Metrolink has an arrangement with Caltech to provide advance notification of a tsunami or, if there is sufficient warning, an earthquake so its equipment can be moved out of harm’s way in a timely manner. 61 Foothill Transit also helped for a short period with Katrina victims.

184 Special Report 294: The Role of Transit in Emergency Evacuation Orange County by comparison, school buses are part of the emergency plan, and could be deployed by the Logistics Section chief and transportation coordinator in an emergency. The Orange County EOC also has a contract with two school bus companies to help evacuate up to several thousand residents of Santa Ana in an emergency.
In summary, the major transit providers (MTA, City of Los Angeles DOT, OCTA) in the Los Angeles UA are part of the emergency response and evacuation plans of their major cities and counties, but they are not coordinated across jurisdictional lines to assist in a mass evacuation in the event of a major incident. Other, smaller transit providers—Foothill Transit and Metrolink, for example—have not been integrated into county emergency plans.62 When the MTA was asked what would be the key requirements for integrating transit into a regional evacuation plan, staff noted the need for a clear chain of command whereby the agency would be a full partner in the incident command structure; designated evacuation routes with dedicated lanes for buses and emergency vehicles; designated pickup points (e.g., Union Station, the Convention Center), particularly in downtown Los Angeles; designated drop-off points, which are likely to be schools selected by the Red Cross; detailing of evacuation scenarios; and a good interagency communications system.63 According to the MTA, the main obstacles to a greater role for transit in regional evacuation are the condition of and congestion on area roads and freeways, fuel availability (90 percent of MTA buses use compressed natural gas, and DASH buses operate on alternative fuels), the potential loss of the power grid for rail operations, availability of personnel, and resources. Command and Control Major area transit providers—MTA and OCTA—are represented in the emergency decision-making structure of their respective counties. Each would send a representative to the Los Angeles CEOC and the Orange County EOC, respectively, if either of these EOCs or that of the City of Los Angeles were activated in an emergency.64 Operating under the direction of emergency managers and law enforcement, the MTA and OCTA would play a support role in their respective counties. They would be responsible for coordinating the necessary transportation resources, including other transit providers, to respond to an emergency event and potential evacuation.65 Staff of the MTA noted that it would operate primarily in a liaison capacity in the Los Angeles CEOC, receiving requests for resources from the Logistics Section, and should be a full partner in any regional emergency plan involving mass evacuation. OCTA would take direction from the Logistics Section chief at the Orange County EOC.
Because of its role in traffic management as well as the provision of transit services, the City of Los Angeles DOT is considered a first responder in an emergency event that does not require activation of the city’s EOC. The DOT has 500 traffic officers who could assist in an evacuation, as well as a 40-person strike team of engineers well trained in emergency response 62 SCAG has proposed conducting a survey of second- and third-tier transit providers in the region to determine whether they are participants in any emergency planning activities, what contacts they have with other providers, and what their situation is with respect to fuel use and availability and other logistical issues that could affect their capacity to respond in an emergency and possible evacuation. 63 MTA staff indicated the existence of a system for communication with other transit agencies, but limited communication with emergency management agencies. 64 The School Board would also be represented at the Los Angeles CEOC. 65 Although it would not have a representative at the Los Angeles CEOC, Long Beach Transit would be represented at the EOC for Long Beach if it were activated during an emergency.
Case Studies 185
who could establish a perimeter around the site of an emergency event, deploy traffic officers, close routes as appropriate, and initiate an evacuation.66 If the city’s EOC were activated, the City of Los Angeles DOT would be represented, but would play a role secondary to that of the MTA. City of Los Angeles DOT staff noted that the agency has close links with both the MTA and the Los Angeles CEOC.
Other transit providers, primarily in Los Angeles County—Foothill Transit and Metrolink—are not part of the county’s emergency decision-making structure, nor do they have close ties with the MTA regarding emergency operating plans or response. Communications In the event of an emergency in Los Angeles County, the CEOC would be responsible for coordinating transportation-related requests for assistance. The COEC has numerous methods for communicating with responders, including a special radio frequency for conversing with county fire and police; a countywide radio system for other responders; and an Emergency Management Information System (EMIS) with satellite redundancy that provides county emergency managers with the means to submit status reports, requests for information, and requests for resources to the county. EMIS would be monitored during an event, and the CEOC would respond to e-mails and status reports as necessary. EMIS sends out an automatic alert to emergency managers if a new event is entered into the system by any authorized user (e.g., county departments, cities).
In the event of an emergency in Orange County, the DES is responsible for contacting the OCTA, among other agencies. Communications systems between the DES and OCTA are fully interoperable via multiple modes, including radio, text messages, and satellite phones.
As the primary coordinator for Los Angeles County transportation providers in an emergency, the MTA has a system for communicating with other local transit providers. The MTA has numerous ways of reaching its own operators in an emergency. For example, with its Advanced Traveler Information System (ATIS), it can track bus locations from its headquarters Control Center for Bus Operations and contact drivers via radio and text messages. The MTA monitors rail operations through its secure rail operations facility via closed circuit TV and computerized train control for each line, manned by two operators per line.67 Metrolink can communicate well with its train operators through its central dispatchers in the event of an emergency. Moreover, Metrolink, Amtrak, and freight rail dispatchers are closely linked and have the capability to see each other’s lines.
The City of Los Angeles DOT has numerous ways of communicating with other agencies during an emergency through its mobile command post of 25–30 trailers, which is deployed in an emergency along with its 40-person strike team. The mobile unit is outfitted with satellite access and access to the DOT’s automated traffic center, and supports fiber optics technology through which DOT can change signal timing from a field laptop, for example. In addition, the DOT has two other mobile units at LAX and a few satellite telephones.
Transit providers vary widely in their capabilities for communicating with customers during an emergency. The City of Los Angeles DOT depends on mass communications systems such as reverse 911 and the 311 system for direct contact with customers, particularly those
66 The DOT estimated that the strike team could be in place approximately 30 minutes to 1 hour after a command post was established, and that an area evacuation could take from 1 to 2 hours. 67 In the event of an emergency, it would be necessary to operate the controls manually to detour around an incident.

186 Special Report 294: The Role of Transit in Emergency Evacuation needing special assistance (see the subsequent discussion of special-needs populations). Metrolink would go directly to the media to inform its riders about an emergency, who could also access the information on the Metrolink website.68 Maps with transportation staging areas have been sent to residents in evacuation areas associated with Orange County’s Nuclear Power Plant Emergency Plan. In Santa Ana, the Orange County seat where nearly three-fourths of the population is Spanish speaking, the fire department, which is responsible for emergency management in that municipality, would use a variety of means to contact its transit-dependent population in the event of an emergency. These include Spanish- and Vietnamese-language radio and television stations, as well as the use of reverse 911 to reach largely Spanish-speaking as well as Vietnamese populations. Support for Incident Response and Recovery Many transit agencies noted that their equipment could be used in an emergency and that they could also help transport emergency personnel to an incident site on an as-needed basis. For example, MTA rail could provide heavy equipment to help out at an emergency site and has provided bus transport in the past for law enforcement officials during area emergencies (e.g., the Los Angeles riots in 1992 and the Northridge earthquake in 1994). For the MTA to support an emergency response, however, particularly in an incident of any size, the City of Los Angeles DOT, the Los Angeles County Public Works Department, and Caltrans would need to keep the roads clear and dedicate lanes to travel by buses and emergency vehicles.69 Carpool lanes on the freeway, for example, could be used for this purpose. MTA staff, however, raised the issue of equipment capacity, particularly if buses were to be used for evacuation in one location while an attempt was being made to maintain transit service in other parts of the county.
OCTA staff noted that the agency has the capability of transporting emergency personnel on an as-required basis to an incident site. In the past, the agency has supplied buses on demand for firefighting, primarily to transport firefighters to the scene to provide shift relief. Similarly, Long Beach Transit used some of its buses to bring emergency responders to fight a major blaze during 2006 at the Paradise Gardens Apartments fire.
None of the interviewees mentioned the potential role of transit in recovery, most likely because few emergency evacuation plans are in place. Exercises and Drills Despite the lack of areawide evacuation plans, emergency managers in the Los Angeles UA conduct numerous exercises and drills. For example, Los Angeles County holds large annual exercises of its CEOC that include representatives from the MTA. MTA staff, however, did not mention participation in any areawide tabletop exercises or drills. The City of Los Angeles DOT recently held a small drill involving evacuation of 400 residences in a fire scenario. Only 8 to 10 families actually went to evacuation centers; most others evacuated outside the area. In Orange County, the SONGS emergency evacuation plan, which involves the OCTA, is tested every 3
68 Metrolink is also developing an elaborate data system that will provide real-time information about the location of its equipment. These data can be provided to customers via subscription. The process can be reversed in an emergency. 69 The Long Beach Public Works Department has agreed to take the lead in keeping the roads clear during an emergency in the City of Long Beach.

Case Studies 187
years by federal regulation. Staff from the OCTA also indicated that it participated in countywide tabletop exercises and drills. Of course, area transit providers gain considerable practice in moving large numbers of people for major planned events every year. Remaining Challenges Special-Needs Populations The Los Angeles UA has a high concentration of populations who might need assistance in an evacuation, but few plans exist for transporting the elderly or those with disabilities in an emergency, or more generally, for transporting those who simply lack access to a car. Access Services provides paratransit service to approximately 80,000 ADA-certified residents of Los Angeles County on behalf of area transit providers, including the MTA. Many economically disadvantaged residents and some persons with disabilities also ride MTA-accessible buses and presumably would continue to do so in an emergency. There is no overall plan, however, for evacuation of special-needs populations in an emergency.
Los Angeles County recently awarded a $500,000 grant to the Center for Neighborhood Knowledge, part of the University of California at Los Angeles’ School of Public Affairs, from California’s allocation of DHS Homeland Security Grant funds. The purpose of the project is to develop maps, using geographic information systems (GIS), as well as a database to identify the locations and needs of county residents with disabilities, the elderly, people living with AIDS, and other vulnerable populations who would have difficulty evacuating on their own in an emergency. The database will be populated by having county residents voluntarily enter information about their needs and requirements in the event of an emergency. In addition to identifying the locations of those with special needs, the maps will provide emergency managers with details on evacuation and community centers that can handle those with disabilities. The maps, which should be functional within a year, and the database are intended for the use of the Los Angeles COEC, the Los Angeles County Sheriff’s Department, the LAPD, and the city and county fire departments. SCAG believes it could play a role by using its GIS capability to map the locations of various special-needs populations (e.g., those living in poverty, recent immigrants).
The City of Los Angeles DOT is also working with other city agencies to develop a database of special-needs populations within the city, drawing on the lists of those served by, for example, DOT’s City Ride Program, Meals on Wheels, and the Department of Aging. However, the project is moving slowly because there are no dedicated, full-time staff assigned to it. In an emergency, the DOT plans to communicate with special-needs populations through reverse 911 and the 311 system. Staff, however, expressed concern that the system could be overwhelmed in a major emergency, and no drills have been held.
The Long Beach Fire Department has made several efforts to have its special-needs populations self-identify, but with little success. For example, staff tried to identify such populations though the Electric Power Assistance Program. The primary focus now is on having individuals help themselves; on reverse 911; and on establishment of community emergency response teams, training neighborhood leaders to educate others about disaster response.
The Orange County Sheriff’s Department has identified about 310 individuals in four impacted cities in emergency planning zones who would require a lift van or an ambulance in the event of a radiological incident at SONGS and evacuation of surrounding areas. Neither Orange
188 Special Report 294: The Role of Transit in Emergency Evacuation County nor the OCTA appears to have other plans for evacuating special-needs populations in an emergency outside this location and would await specific equipment requests from the county EOC. Jurisdictional Issues and Development of a Regional Evacuation Plan The Los Angeles UA has taken a piecemeal approach to emergency planning, with a focus on specific threats (e.g., a tsunami, urban wildfires, a terrorist incident at area ports or airports).70 This approach has resulted from the jurisdictional complexity of the Los Angeles UA, together with multiple threats facing the area, most without warning and with different implications for transportation needs; the lack of recent experience with a large-scale disaster requiring evacuation; and financial constraints. Political leadership is also an issue. The tsunami plan, for example, was championed by a California congressman from a low-lying coastal district, but there is no such champion for a multijurisdictional plan.
Although area emergency managers question the feasibility of a mass evacuation of Los Angeles given the sheer numbers of people involved, the City and County of Los Angeles recognize the need for a broader approach to emergency planning and recently received a $125,000 Urban Area Security Initiative grant from DHS to begin development of an evacuation plan for the region. Twenty-seven agencies are involved. In view of the limited amount of funds, however, the goal is to develop a conceptual plan for a downtown Los Angeles evacuation scenario. Primary evacuation routes would be identified, and the time to evacuate estimated. The main agencies to be involved would be identified, along with the transportation resources and capabilities needed to carry out such an evacuation. Air and maritime resources would not be included in this first round. The plan would be far more inclusive than any existing one, but it would build on existing decision-making structures and protocols.
The regional office of the California OES is also involved in plan development. The primary mission of this office is to assist local jurisdictions in developing and reviewing their emergency plans; in principle, therefore, this office could help advance the process of developing a regional evacuation plan. However, the OES has experienced sharp budget cuts in the last several years, which have weakened its capabilities. Continuity and adequacy of funding for more complete plan development remain an issue (see the discussion below), and no timeline or milestones have been established. Interagency Coordination According to Los Angeles City and County emergency managers, coordination is good between the city and county emergency management offices and between police and firefighters, who would have critical responsibilities in an emergency evacuation. The MTA and the City of Los Angeles DOT are also well integrated into the emergency decision-making structure, although MTA staff think they should be a partner with police and fire services in a regional evacuation plan.
70 The Los Angeles County OEM disagreed with this assessment, noting that the intent of NIMS and Standardized Emergency Management System (SEMS) is a standardized approach to responding to and recovering from disasters. By definition, then, emergency planning efforts are systemic and can be applied universally to incidents of any size or nature.

Case Studies 189
Coordination among transit agencies in the region is uneven. The MTA funds several local transit agencies, but has not worked with them closely on emergency planning or evacuation issues. Metrolink, for example, has had little interaction with the MTA. Foothills Transit is part of a Regional Transit Safety Working Group of which the MTA is a member, but the focus is primarily on terrorism. Neither Long Beach Transit nor the Long Beach Fire Department, which is responsible for emergency planning in that municipality, has had much contact with the MTA. OCTA coordinates closely with the Orange County DES. The Orange County Sheriff’s Office, which provides transit police for OCTA, also has a memorandum of understanding with the Los Angeles County Sheriff’s Office to provide assistance in an emergency if it exceeds Orange County’s law enforcement capabilities. However, there is limited contact between OCTA and MTA. The process of developing a regional evacuation plan could be the catalyst for forging closer links among area transit providers. Workforce and Fuel Availability in an Emergency Evacuation Many transit providers in the Los Angeles UA contract transit services. Typically, the buses and rolling stock are owned by the transit agency, but the labor is contracted out. For example, the City of Los Angeles DOT provides its transit services through eight different contractors. Although the MTA operates with its own labor force, it has contracted out its paratransit services. Foothill Transit operates with all contract services, although Metrolink does not. OCTA contracts out its paratransit and small bus fixed-route service.
Those systems that depend on contract labor identified control over their drivers as a key issue affecting their capability to respond to an emergency in real time. Foothill Transit believes some of these issues could be addressed in contract negotiations. Even for those agencies with in-house staff, however, drivers live all over the region, so there is no guarantee they could reach their work location in an emergency. Furthermore, no transit provider has a plan for seeing that workers’ families are provided for in an emergency to help ensure that drivers will report to work.
Several transit agencies also mentioned fueling issues in an emergency situation in which transit vehicles would assist in evacuation efforts for any sustained period. For example, 90 percent of MTA buses use CNG, and the City of Los Angeles DOT’s DASH fleet uses alternatively fueled vehicles. They could face difficulties in refueling because these fuels are not widely available in the Los Angeles area. Traffic Congestion The Los Angeles UA is ranked the most congested of all the 38 UAs. This level of congestion could pose a problem for bus transport of any distance in an evacuation. In a disaster, the condition of the roadway and the extent of any damage could also constrain bus transport. The Los Angeles County Department of Public Works has identified major evacuation routes, and certain freeway lanes have been dedicated for ingress of emergency vehicles. The need for specific routes would be determined at the time of an incident. In the event of a major disaster, however, it appears unlikely that the City of Los Angeles DOT and Caltrans, which are responsible for city roads and area freeways, respectively, could implement expeditiously an evacuation of any size on the basis of such ad hoc arrangements.

190 Special Report 294: The Role of Transit in Emergency Evacuation Funding The Los Angeles UA has received initial funding from DHS, through its grant allocation to California, to begin the process of developing a mass evacuation plan for the region. As mentioned previously, however, the level of funding is small and will support only a conceptual framework. The multiplicity of agencies that need to be involved—city and county emergency managers; city and county fire departments; city, county, and state police; the MTA and other area transit providers; local school districts; the Red Cross; and Caltrans and the California OES—necessitates a much more substantial and sustained level of effort. The MTA does have some discretionary funds to support emergency response—the CEO can use up to $250,000 without Board approval. However, these funds have not been used for planning, but for reimbursement when MTA equipment is requested by local communities in response to mutual-aid agreements. Other local transit providers, such as the City of Los Angeles DOT, mentioned limited funds as an obstacle to developing programs, such as those aimed at identifying special-needs populations or providing family emergency assistance to help ensure good employee attendance in an emergency. Summary The Los Angeles UA is one of the largest and most densely populated regions of the 38 UAs studied. It is also the most congested; area freeways are clogged for most of the day. Unlike many older UAs with extensive rail transit networks, the Los Angeles UA is served mainly by bus transit and a limited rail network, at least in comparison with New York or Chicago. Large populations of persons living in poverty and of recent immigrants, coupled with significant numbers of people with disabilities and those who lack access to a car—many of whom would be dependent on transit and need assistance in an emergency—pose a considerable challenge should evacuation be required in a disaster of any consequence. No plan currently exists for an emergency that would encompass multiple jurisdictions and require a large-scale evacuation, although the City of Los Angeles recently received a small grant to develop a concept-of-operations plan for a mass evacuation affecting the region. The sheer size and jurisdictional complexity of the UA, the multiplicity of no-notice threats faced by the area with differing consequences for transportation (e.g., earthquakes versus terrorist incidents), the lack of recent experience with a large-scale disaster involving evacuation, and financial constraints have made it difficult to conduct regional emergency planning. Fortunately, California has a long history of voluntary mutual-aid agreements involving police and fire services and, in some cases, transportation providers, which have worked well in the past to meet emergency needs when a particular community has been overwhelmed. Nevertheless, if the region were to face a major disaster involving a large-scale evacuation, the adequacy of plans focused on specific hazards and the heavy dependence on ad hoc arrangements would likely be problematic.
The major transit providers in the Los Angeles UA—the MTA, the City of Los Angeles DOT, and the OCTA—are included in the emergency plans of their respective cities and counties. They are also represented in the decision-making structure of area EOCs should the latter be activated in response to an emergency. Whereas the City of Los Angeles DOT considers itself a first responder primarily because of its responsibility for traffic management in the city, the role of the MTA and the OCTA is to provide support and coordinate the necessary transportation resources, including transit, in response to an emergency event and potential

Case Studies 191
evacuation. The MTA has a system for communicating with other area transit providers in an emergency, and communications between OCTA and the Orange County DES are fully interoperable. Both the MTA and the OCTA also participate in tabletop exercises and drills in their respective counties. Other area transportation providers—Foothill Transit, Metrolink, the Los Angeles Unified School District, and Amtrak—are not integrated into emergency plans for transport purposes and have limited contact with the major providers. Although few transit agencies in the Los Angeles UA have had recent experience in evacuating residents in an emergency, nearly all have handled large crowds during planned events, and some have played a role in providing transport for law enforcement personnel or firefighters in area emergencies (e.g., the 1992 Los Angeles riots, the 1994 Northridge earthquake, the 2006 fire at the Paradise Gardens Apartments).
Many challenges remain, however, if transit is to play a more central role in area emergency plans and assist in the evacuation of area residents in the event of a major disaster. First, transit agencies need to be involved right at the outset in the development of a multijurisdictional evacuation plan for the region, an activity that has just begun. Second, addressing the transportation requirements of special-needs populations is a major challenge. Los Angeles County has begun the process of locating these populations and setting up a voluntary special registry. The City of Los Angeles is also attempting to identify special needs populations within the city. With its GIS and statistical capabilities, SCAG could also play a role here. The difficult tasks of linking transit resources with the special-needs of these populations and communicating with them in an emergency, however, remain to be accomplished. Finally, the ability of transit providers, particularly those with contracted services and special fuel requirements, to respond in real time to an emergency of any size remains untested.
This case study also raises several more general policy issues that may be relevant for other large UAs. The multiplicity of hazards facing the Los Angeles UA, most without notice, poses a difficult challenge for emergency planners. Nevertheless, a piecemeal approach of plans for different emergencies and evacuation plans that are designed at the time of an incident is not likely to produce a scalable response in a major disaster, a conclusion that has not escaped Los Angeles emergency planners.
Developing a realistic regional evacuation plan for a major metropolitan area of the size and jurisdictional complexity of Los Angeles, probably matched only by New York and possibly Chicago, is another major challenge. A good place to start would be to work with a manageable scenario, such as a plan for evacuating downtown Los Angeles, and involve the key players, including transit agencies, in the plan development. Although the specifics of the evacuation plans in place to respond to a terrorist incident at the Ports of Los Angeles and Long Beach are not publicly available, they could be a model for area emergency planners, who are privy to their details.
The potential of transit itself to play a major role in an evacuation of any size is probably limited in a large UA such as Los Angeles in which there is no extensive rail transit network that could move riders rapidly in an emergency evacuation. Nevertheless, there is an important role for bus transit to play in transporting the large populations that are transit dependent, many of whom might need special assistance in an emergency. Mapping the locations of these populations and developing voluntary registries are a start, but serving the transit needs of these populations in an evacuation would probably require involving a broad net of human services and paratransit providers and developing plans at the community level. It would also require planning for more rapid bus movement along evacuation corridors in an emergency.
192 Special Report 294: The Role of Transit in Emergency Evacuation
Finally, funding is a critical issue. Making headway on the development of regional evacuation plans, including addressing cross-county evacuation issues, would require considerable external resources, as well as the political commitment of area officials. Fortunately, California’s long history of mutual-aid agreements provides a framework for multijurisdictional collaboration on which to build. Committee Members and Staff in Attendance Ellis Stanley, Sr. (lead) Arnold Howitt Evelyn Blumenberg Nancy Humphrey Briefings Aram Sahakian, Transportation Engineer, Special Traffic Operations Division; John Fong,
Director of Administration; Vincent Lorenzo, Safety and Security Coordinator; David Rzepinski, Director of Transit Operations, Department of Transportation, City of Los Angeles
Hector Guerro, Manager, Rail Operations Control; Stephen Rank, Assistant Operations Control Manager, Bus Operations; Roman Alacorn, Director, Bus and Rail Operations Control; Thomas Eng, Corporate Safety Manager, Los Angeles Metropolitan Transportation Authority
Beth McCormick, General Manager Bus Operations, Orange County Transit Authority, and Lieutenant James Rudy, Chief of Transit Police Services, Orange County Sheriff-Coroner Department
Robert Spears, Director of Emergency Services, and David Palmer, Deputy Branch Director Transportation Branch, Los Angeles Unified School District
Jamie Becerra, Director of Safety and Security, Foothill Transit Denise Tyrell, Public Information Officer, and Gray Crary, Assistant Executive Officer
Operating Services, Metrolink Jeanne O’Donnell, Program Specialist, Office of Emergency Management, County of Los
Angeles; and Paul Hanley, Sergeant; Ronald Marquez, Motor Sergeant; and Jenny Bethune, Lieutenant; County of Los Angeles Sheriff’s Department
Captain Steve Snyder, Emergency Management, Santa Ana Fire Department Larry Meyerhofer, Planning Division Chief, and Eric Baumgartner, Emergency Preparedness
Coordinator, Emergency Preparedness Department, City of Los Angeles Donald Pinegar, Deputy Regional Administrator, Governor’s Office of Emergency Services,
State of California Casey Chel, Officer and Emergency Services Coordinator, Long Beach Fire Department Robert Huddy, Transportation Program Manager, and Alan Thompson, Senior Planner, Southern
California Association of Governments

Case Studies 193
Documents Consulted 1. County of Los Angeles, All-Hazard Mitigation Plan, Version 1.1, June 2005. 2. Los Angeles County Sheriff’s Department and Los Angeles County Fire Department,
Evacuations, Emergency Operations Plan (EOP) 2-6, Revised May 30, 2006. 3. City of Santa Ana, Evacuation Annex, Attachment E, July 7, 2007 Draft. 4. Orange County Transportation Authority, Response and Recovery Plan, April 2004 and
July 9, 2004 revision. 5. Orange County, Operational Area Emergency Plan and Position Guidelines, January 2004. 6. Orange County, Nuclear Power Plant Emergency Plan for the San Onofre Nuclear
Generating Station (SONGS), Basic Plan and Related Annexes, revised January 2007. 7. Governor’s Office of Emergency Services, State of California Emergency Plan, September
2005. 8. Governor’s Office of Emergency Services, California Disaster and Civil Defense Master
Mutual Aid Agreement, November 15, 1950. 9. Governor’s Office of Emergency Services, Legal Guidelines for Flood Evacuation,
November 21, 1997. 10. Governor’s Office of Emergency Services, Memorandum of Understanding for Animal Care
During Disasters, November 21, 1997. TAMPA–ST. PETERSBURG CASE STUDY In addition to responses to the questionnaires presented above, this case study is based on information gathered during a site visit made on October 25–26, 2007. Overview Demographics and Geography According to the U.S. Census, the population of the Tampa–St. Petersburg UA71 was slightly more than 2 million in 2000, making it the twentieth largest of the 38 UAs with populations of more than 1 million72 and the smallest of the five case study sites. The UA covers portions of three counties—Hillsborough, Pinellas, and Pasco (see Figure D-5).73 Hillsborough and Pinellas are the two most populous counties. They include the two main urban centers—the City of Tampa in Hillsborough County and the City of St. Petersburg in Pinellas County—and were the focus of this case study. The Tampa UA ranks in the lower quartile in population density of the 38 UAs. This population is spread out over 802 square miles, the seventeeth-largest land area of the 38 UAs studied. Population density is high, however, in vulnerable coastal areas, particularly in Pinellas County, where many homes and hotels are located on a barrier island along the Gulf
71 For brevity’s sake, the Tampa–St. Petersburg UA is referred to as the Tampa UA. 72 Data on UA population, land area, and population density were drawn from the U.S. Census Bureau, 2000 Decennial Census of Population and Housing, and the Federal Transit Administration’s 2005 National Transit Database. 73 The population of both counties swells during tourist season, but fortunately the peak tourist season is in the winter and does not overlap the hurricane season, when the risk of needing an evacuation is greatest.

194 Special Report 294: The Role of Transit in Emergency Evacuation Coast. New high-rise hotels are replacing mom-and-pop hotels and motels along the barrier island.
The Tampa UA is home to many vulnerable populations who would need transport in an emergency evacuation. According to the 2005 American Community Survey, 102,958 or 11 percent of householders reported being age 65 or older and living alone. The survey also found a high fraction (17 percent) of the population with a disability; some 337,507 of those > age 5 fell into this category. There were 226,341 persons or 11 percent of the population living below the poverty line. A sizable fraction of the population is also vulnerable from the perspective of the area’s greatest hazard—hurricanes, wind, and storm surge, which could reach 28 feet in a major hurricane. Approximately 179,000 Hillsborough and Pinellas County residents live in mobile homes, which are vulnerable to high winds, and another several hundred thousand live in low-lying areas, exposed to either storm surge or flooding or both in the event of a hurricane.
Pinellas County is a peninsula, bounded by the Gulf Coast on the west and Tampa Bay on the east. Hillsborough County, to the east, is located at the head of Tampa Bay, which funnels storm surge into exposed areas during a hurricane. If Pinellas County residents have to evacuate, they must use the three major bridges heading east to Hillsborough County. County policy in a hurricane is for residents to evacuate within county. The Tampa UA is served by a highway
185 miles across FIGURE D-5 Tampa–St. Petersburg, Florida, urbanized area.
Case Studies 195
network that can become severely congested during an evacuation because the limited road system must be shared with others driving north and east from both within and outside the UA. Transit buses must travel congested local roads to reach area shelters.74 Transit Transit service in Hillsborough County is provided by the county through the Hillsborough County Regional Transit Authority (Hartline) and the Sunshine Lines. Hartline has a fleet of 200 buses [all Americans with Disabilities Act (ADA) accessible] serving about 41,000 passengers a day, plus 39 paratransit vehicles serving about 450 clients a day and 11 streetcars serving about 1,240 a day. Sunshine Lines provides service to those with disabilities with a fleet of 60 lift-equipped vans. The Hillsborough County School District—the seventh largest in the country—operates a fleet of 1,400 school district–owned buses, which, along with county transit providers, play an important role in emergency evacuations.
Transit service in Pinellas County is provided by an independent authority, the Pinellas Suncoast Transit Authority (PSTA), with a fleet of 180 buses, serving approximately 40,000 customers a day, and 16 trolleys. PSTA also provides paratransit service, which it contracts out to a private provider, Transportation Services Contact, Inc. The latter operates 80 vans running about 800 trips a day; its service is supplemented with about 80–100 taxis. Wheelchair Transport, a private company, also provides service through its fleet of 80 vans, primarily for residents of assisted living facilities and skilled nursing homes in Pinellas County. The Pinellas County School District operates a fleet of 810 school buses, 110 of which are wheel chair lift capable, that also play an important role in emergency evacuations. Emergency Planning Two agencies—the Departments of Emergency Management (DEMs) of Hillsborough and Pinellas Counties—have responsibility for emergency planning in the Tampa UA. In Hillsborough County, the Board of County Commissioners delegates its authority to declare a state of local emergency to an Emergency Policy Group, headed by the Chairman of the Board of County Commissioners and including the Vice Chair of the Board of County Commissioners; the County Commissioner; the Mayors of the Cities of Tampa, Temple Terrace, and Plant City; and the Sheriff of Hillsborough County. If a state of emergency is declared, the Emergency Policy Group also has the authority to order an evacuation and activate the emergency operations center (EOC). In Pinellas County, the Board of County Commissioners, advised by a Disaster Advisory Committee, has the authority to declare a state of local emergency. The Advisory Committee comprises the Director of Emergency Management, the Sheriff, the Director of the Health Department, and a member from each of 24 municipalities and 4 independent Special Fire Control Districts.
Both counties have a system of graduated response according to disaster severity, ranging from a minor disaster that can be handled by local government to a major or catastrophic disaster that exceeds local capabilities and requires state or federal assistance. Hillsborough and Pinellas
74 According to The 2007 Urban Mobility Report by the Texas Transportation Institute, the Tampa UA ranked relatively low—twenty-second among the 37 UAs ranked—on the travel time index, a congestion measure developed by authors Schrank and Lomax. The index, however, measures average daily traffic conditions, and is not a good indicator of highway congestion in emergency conditions.

196 Special Report 294: The Role of Transit in Emergency Evacuation Counties and their respective municipalities are all signatories to the statewide mutual-aid agreement, which ensures that assistance will be provided by the state or other local jurisdictions should county resources prove inadequate.75 If an evacuation is required, the Emergency Policy Group is the lead operational agency in Hillsborough County, while the Disaster Advisory Group plays that role in Pinellas County. In accordance with Florida law, all evacuation orders are mandatory.76 In Hillsborough County, major evacuation routes have been identified, and signs have been posted on these routes. Similarly, Pinellas County has identified and posted signs on evacuation routes, but there are only a few major roads out of the county. Evacuation centers have been preidentified by the DEMs and are located at area schools. The specific evacuation routes and shelters to be used, however, are determined at the time of an emergency and depend on the nature and extent of the incident.
Both Hillsborough and Pinellas Counties have conducted all-hazards analyses and prepared comprehensive emergency management plans, which are updated every 5 years. Hurricanes are the greatest hazard facing the Tampa UA, with their accompanying high winds, rainfall, and storm surge. Nevertheless, the last major hurricane to make landfall near Tampa was a Category 3 hurricane in 1921. In 2004, Hurricane Charley posed a direct threat to the county, causing a mandatory evacuation of coastal areas and mobile homes, but it struck south of Tampa.77
The other major threat to the area is from a hazardous materials spill at or near the Port of Tampa, where half of all of Florida’s hazardous materials enter the state. The port stores and handles large quantities of hazardous materials and is located directly across from downtown Tampa. The materials are transported through the area by rail and Interstate highway. A plume analysis of a hypothetical chlorine release found that evacuation of half of Hillsborough County could prove necessary in the event of a consequential release. Because the plume could extend over many evacuation routes, however, sheltering in place could be the best option for many area residents. A terrorist incident is also a possibility given the presence of an air force base in Hillsborough County and other targets of opportunity in the Tampa UA.
Because hurricanes are a recurring hazard, likely to involve at least a partial evacuation of area residents, both Hillsborough and Pinellas Counties have prepared detailed hurricane evacuation plans. The counties are divided into five evacuation zones for purposes of determining which area residents will be ordered to evacuate. The zones are designated A through E, or most to least vulnerable, corresponding to Category 1–5 hurricanes, respectively; the zones also reflect wind velocities and potential tide heights. Anyone living in a mobile home is considered to be in an A area.
The Tampa Bay Regional Planning Council periodically prepares estimates of the population numbers and time to evacuate for hurricanes ranging in intensity from Category 1 to 5 for the four counties in its region—Hillsborough, Pinellas, Pasco, and Manatee. The 2006 estimates for Hillsborough and Pinellas Counties indicated that a maximum of between nearly 520,000 (in a Category 1 hurricane) and 1.28 million residents (in a Category 5) could attempt to
75 Executed in 1994, the mutual-aid agreement is a voluntary arrangement between the state and counties and municipalities. It has been signed by more than 98 percent of counties and municipalities in the state. 76 Voluntary evacuation orders, however, can be issued in the event of a tropical storm or other situation that is not expected to have a major impact. 77 Mandatory and volunteer evacuations for Evacuation Level A or low-lying, storm surge–prone areas and mobile home residents were initiated during Hurricanes Frances and Jeanne in August 2004, but area residents experienced only minor flooding and, with a few exceptions, tropical storm force winds.
Case Studies 197
evacuate, and it would take from 23 to 103 hours to move all evacuees out of harm’s way.78 With the use of contraflow on two major Interstates in Hillsborough County, the evacuation time for the most serious, Category 5 hurricane could be reduced from 103 to 35 hours. Given the long lead times needed for an evacuation, which exceed weather forecasters’ ability to predict hurricane landfall, local governments are working to encourage those area residents not directly at risk to shelter in place. Transit’s Role in Emergency Evacuation Evacuation Transit systems and local school districts in both Hillsborough and Pinellas Counties play an important role in emergency evacuation, particularly for special-needs populations (discussed separately below). In Hillsborough County, Hartline has earmarked 110 transit buses, or about half its fleet, for the evacuation of residents lacking access to a car to a regular shelter.79 Once an evacuation order had been given and shelters were open, regular bus service would be suspended, and Hartline would begin service on designated, premarked evacuation routes. The buses would operate mainly over their regular fixed routes, which have been posted with signs indicating that they are evacuation routes, so that riders would know where to congregate; passengers could also flag buses down. Bus service on some lines would be expanded where large numbers of residents were known to need transport, such as public housing areas.80 Sunshine Lines has committed 40 of its 60 vehicles to the evacuation of those clients who need transport to special-needs shelters. The Hillsborough County School district has signed up approximately 220 drivers to serve as a volunteer hurricane force.81 School buses are tasked with operating evacuation bus routes in south Hillsborough County—in areas not covered by Hartline routes—at the direction of the EOC on a flag-down basis on nonfixed routes. They could also provide shuttle service to relieve evacuee overflow at crowded shelters. Because about one-fifth of the school bus fleet is wheelchair accessible, school buses would also be used to transport residents to special-needs shelters. In an emergency, all transit services, which are county operations, are controlled by the Hillsborough County DEM, with vehicle dispatch handled from the EOC. On the basis of previous evacuations, DEM estimates that 50,000 to 60,000 county residents out of some 200,000 to 300,000 potential evacuees would need transport, and that the number of buses available would be adequate because evacuees would be traveling short distances, either to in-county friends or family or to area shelters.
In Pinellas County, the lead agencies for transportation in an emergency evacuation are the school board and PSTA. PSTA would continue to operate its regular service during an emergency evacuation and also transport individuals to shelters located along its routes; signs have not yet been posted for pickup points, however. Transportation Services Contact, Inc. also
78 The analysis was based on many key behavioral assumptions concerning evacuation participation rates, evacuee destinations (e.g., in-county to private homes or public shelters, out of county), and vehicle utilization rates. The assumptions are based on past experience and tend to err on the side of being conservative. 79 This number is predicated on the number of drivers Hartline believes would be available. However, managers might also be able to drive so that more vehicles could be made available. 80 About 25 percent of public housing units are located in evacuation zones, and about 60 percent of the residents lack access to a vehicle. In an evacuation, Hartline would run special routes between public housing units and area shelters. 81 The schools have summer programs, so many of the drivers are available during hurricane season.

198 Special Report 294: The Role of Transit in Emergency Evacuation has a role, but not all of its clients would need to be evacuated. In a major hurricane, Wheelchair Transport could assist, but its vans are already committed to the evacuation of assisted living facilities and nursing homes. The Pinellas County DEM is also considering contracting with Neighborly Services, which provides transport for the elderly, to access some of its 30 vans in an emergency evacuation. Finally, local school buses would be dispatched to municipalities to support evacuation of special-needs and disadvantaged populations. In addition, some school buses would be assigned to assist health care facilities in an evacuation. Both PSTA and school buses would be coordinated and dispatched through the EOC. Similar to the Hillsborough County DEM, the Pinellas County DEM believes that the number of buses is adequate to handle demand in an emergency evacuation. In both counties, transit providers are prepared to handle domestic pets in an emergency evacuation as long as they are properly caged and muzzled. Only service animals would be allowed on school buses, however.
Neither Hartline nor PSTA has a formal mutual-aid agreement, reflecting the reality that the most likely hazard—a hurricane—would affect the entire region and that both transit providers would be fully occupied in evacuating their respective county residents who need transportation assistance. In a no-notice emergency incident that involved only one county, however, transit assistance could be provided through the statewide mutual-aid agreement to which both counties are signatory. Special-Needs Populations The State of Florida in general and the Tampa UA in particular are well organized to handle the evacuation of special-needs populations in an emergency. Special-needs populations are defined as those with a medical impairment who exceed the capability of a general population shelter but do not require the level of care provided at a skilled medical facility.82 State regulations mandate that each county have available special-needs shelters to accommodate these populations; they also provide guidelines regarding shelter staffing levels and equipment, as well as eligibility requirements. County health departments are responsible for the staffing and medical management of special-needs shelters. Since the 1980s, state law has required the establishment of local voluntary special needs registries by county DEMs to help identify special-needs populations. The regulations define the type of information to be collected, including any transportation needs, and require that the information be provided at least annually to the county health department and other agencies responsible for the management of care in special-needs shelters for review of applicant eligibility and care requirements.
Hillsborough County representatives reported that 5,000 individuals had signed up on its special-needs registry and that about 3,500 would need transport in an evacuation. However, they believe that the total size of special-needs populations is considerably larger, perhaps as high as 30,000 individuals. Pinellas County reported having 3,000 individuals on its special-needs registry, but likewise believes the actual number to be much higher; 60 percent of the registrants indicated they would need transportation in an evacuation. About 48 hours in
82 This definition grew out of concern about Florida’s home health population, many of whom would need oxygen and electricity in an emergency. The definition is narrower than many others, which also include those who lack access to a private vehicle and would need transport in an evacuation. One reason for the narrower definition is the close link in Florida between special-needs populations and medically equipped special-needs shelters where these people are transported.

Case Studies 199
advance of a hurricane, the fire departments in Pinellas County contact all of the registrants; in the past, 10 to 15 percent indicated they had someone who could drive them in an evacuation.
The county departments of health provide updates on registration information to special-needs transportation providers quarterly and, during hurricane season, when the county is threatened by a hurricane. In Hillsborough County, the special-needs transportation coordinator—Sunshine Lines—is responsible for evacuating special-needs populations who require transport to special-needs shelters, as well as their service animals and pets. In Pinellas County, the DEM has this responsibility. Hillsborough County has four special-needs shelters, including one designed specifically for children. Pinellas County has three special-needs shelters and has arranged overflow space at several nonevacuating nursing homes. In both cases, every effort would be made to evacuate special-needs populations ahead of the remainder of the population. Hillsborough County has conducted a worst-case scenario analysis—a Category 4–5 hurricane—to determine whether transportation resources would be adequate to evacuate special-needs populations. The analyses found that sufficient vans and buses would be available to evacuate nearly 11,000 special-needs passengers who were ambulatory or required a wheelchair in a Category 4 hurricane.83 There could be a shortfall if the special-needs population were larger, but it is difficult to estimate the numbers of potential special-needs evacuees.
Each county also has a community transportation coordinator (CTC) to handle transportation of the disadvantaged—a group that may overlap the special-needs population. This position was created and funded by the State Commission for the Transportation Disadvantaged, whose purpose is to ensure that transportation is available for those persons who are unable to obtain it for themselves because of income, disability, or age.84 State funds are provided from a $1.50 annual fee on each registered passenger vehicle in the state to subsidize transportation assistance in those counties that wish to participate in the program. The director of Sunshine Lines is the CTC in Hillsborough County, and the Pinellas County metropolitan planning organization (MPO) is the CTC in Pinellas County. The MPO contracts with a private management firm to provide scheduling and call intake services and with private and nonprofit transportation providers to offer transportation to clients of its Transportation Disadvantaged Program. In an emergency evacuation, many of these clients would use regular bus service. Those who were unable to use transit but needed assistance to get to a shelter would receive information from the MPO on how to register with the DEM for transport to special-needs shelters.
Pinellas County also has a population of about 3,000 to 4,000 homeless people, many of whom would need transport and assistance in an emergency evacuation. The Pinellas County Department of Human Resources has arranged for special school bus transport for the homeless, and two to three of the shelters are “homeless friendly.” Human Resources also works with the Homeless Coalition to post information about emergency transport and shelters at area soup kitchens and hostels.
83 The analysis assumed that 66 percent of Sunshine Lines vans and 70 percent of wheelchair-capable school buses would be available on the basis of driver and maintenance requirements. It also assumed a 12-hour evacuation time frame and numbers of feasible van and bus trips, as well as van and bus occupancy rates given passenger luggage and life-support equipment. Hartline equipment was not assumed to be available because it would be used to evacuate the general public. 84 The commission was created 30 years ago to help coordinate government funding for transportation for the disadvantaged.
200 Special Report 294: The Role of Transit in Emergency Evacuation Command and Control Area transit providers, both transit agencies and school boards, are represented in the emergency decision-making structure of their respective counties and at the Hillsborough and Pinellas County EOCs, respectively, should they be activated in the event of an emergency. In Pinellas County, the school board and PSTA are the lead agencies for providing transportation support in an emergency. In an advance-notice event, such as a hurricane, the school board and PSTA would establish a joint dispatch center as soon as possible after a declaration of a state of local emergency, primarily to handle transport of special-needs populations. In its emergency transportation plan, PSTA also includes normal service for riders during an evacuation. In Hillsborough County, the DEM would take control of county-operated transit and dispatch Hartline, Sunshine Lines, and school buses and vans directly from the EOC. In summary, both local transit agencies and school boards have been represented in emergency planning and operations for many years and would play well-defined roles in an emergency evacuation. Communications Provisions have been made for communications both among emergency responders, including transportation providers, and with the general public in the event of an emergency. Regarding the former, Hillsborough County DEM staff noted that their communications capabilities are fully interoperable. Emergency managers can communicate with one another via radio, cell and satellite phones, and ham radios. Much of the equipment is at the EOC, but the county also has several mobile units. In an emergency, transit and school buses would be dispatched from the EOC, but bus drivers could also communicate among themselves by radio. Pinellas County DEM staff indicated that a combination of e-mail, telephone, radio, satellite phone, fax, paging service, and ham radio would be used to notify and activate its emergency response personnel and communicate with them during an evacuation. The DEM also subscribes to a web-based “Ready Alert” system, which sends text messages and e-mails to county responders; text messaging would continue to be available even if cell phone connections were down. The Hillsborough and Pinellas County EOCs are not yet linked by fiber optics, but should be by the end of next year once the cable has been laid over the Pinellas County bridges, a high-cost item.
Both counties engage in numerous public information initiatives to inform the general public, mobile home owners, and special-needs populations of what to do in an emergency, particularly a hurricane, which could require mandatory evacuation. The Tampa Bay Regional Planning Council, in partnership with area counties, prepares annual hurricane guides in English and Spanish whose main purpose is to provide information and planning guidance for a hurricane and possible evacuation. A county map is included, showing evacuation zones, county shelters, and key contact information. Local broadcast and print media sponsors, post offices, libraries, civic organizations, fire departments, and other government offices distribute copies widely. The guides are also posted on (TBRPC) and county websites. In advance of hurricane season, information on evacuation zones is also included in utility bills. Another alternative is for residents to access the DEM website and enter their address to find their evacuation zone, or telephone the DEM directly to obtain the information. In an emergency, the Tampa Police Department would go door to door in an effort to contact mobile home owners, and use reverse 911 to call those who had to evacuate. Finally, an extensive hurricane information program has been developed for public housing residents, and special efforts are made to inform the homeless
Case Studies 201
and the disadvantaged about transportation and shelter resources in an emergency evacuation. Despite all these initiatives, however, county officials indicated that only about half of area residents know their evacuation zone. Their greatest concern is apathy and the likelihood of a surge in demand for transport at the last moment in the event of an emergency evacuation.
Both counties have numerous ways to disseminate emergency warning information to residents, including television and radio broadcasts, National Weather Service radio alerts, CityWatch computer notification systems, commercial community notifications to cell phones of registered citizens, and reverse 911. All county communication centers have the capability to receive incoming calls from the hearing impaired, and in an emergency, citizens information action centers are opened in both counties to receive and respond to calls from the hearing impaired, as well as other citizens, in a variety of languages. Efforts are also made to communicate with special-needs populations. In Hillsborough County, for example, those who are registered are called three times to verify their need for transportation assistance and to inform them when equipment is on the way. The citizens information action centers also handle special needs groups who call in, identifying what services are needed and providing that information to the appropriate responders. In Hillsborough County, center staff complete application forms and fax them directly to the appropriate department of health and transportation agency staff in the EOC for action. In Pinellas County, last-minute calls are handled as 911 calls and dispatched to the appropriate fire department for response. Support for Incident Response and Recovery Those interviewed during the site visit provided no information about transit or school bus support for incident response. During subsequent follow-up, Pinellas County emergency management staff indicated that PSTA buses are regularly used to support incident response. For example, air-conditioned PSTA buses have been used to house residents of an assisted living facility temporarily during a fire or to transport the residents to another facility. Hospitals and nursing homes are asked annually to update their need for outside transport in the event of an evacuation. Hillsborough County emergency management staff indicated that transit equipment is sufficient to respond to incidents even during an evacuation.
Transit and school buses also have a role in recovery from a mandated evacuation. Once it is safe for residents to return home, every effort is made to use the same transit vehicles to return residents from area shelters or friends and family to their point of departure. Exercises and Drills Hillsborough County has a very aggressive program involving about 8–10 exercises and drills each year, including an annual hurricane exercise, most of which involve activating the EOC and after-action reviews. Hartline and the county school district participate in all major exercises, and all three transportation agencies participate in the annual hurricane exercises. Pinellas County conducts at least two major exercises annually—an annual hurricane exercise and another with a scenario that varies each year so that all major elements of the emergency plan and participating organizations, including transit, are tested within a 5-year period. Regional exercises are much less frequent, with the exception of those for terrorism incidents. Law enforcement agencies are involved in these exercises, but not transportation agencies. Finally,
202 Special Report 294: The Role of Transit in Emergency Evacuation the state EOC conducts a statewide exercise, with each agency deciding on its level of participation. Funding The State of Florida is notable for the funding it provides for emergency response, particularly for special-needs populations. The state collects $2.00 from homeowners insurance policies and $4.00 from business insurance policies annually, which is placed in an Emergency Management and Preparedness Assistance Trust Fund. The funds are distributed annually in the form of competitive grants for emergency management, no larger than $200,000 per grant, to state or regional agencies, local governments, and private nonprofit organizations.85 Funding priorities currently include public education on disaster preparedness and recovery, coordination of relief efforts of statewide private-sector organizations, and improved training and operations capabilities of agencies with lead or support responsibilities in the Florida Comprehensive Emergency Management Plan. In addition, as previously mentioned, a $1.50 fee for each passenger vehicle funds transportation for the disadvantaged, although not directly targeted to emergency evacuation. Services provided by health care practitioners and vendors at special-needs shelters in an emergency are reimbursed by the state department of health. Remaining Challenges Traffic Congestion County officials indicated that traffic congestion is a major obstacle to a successful emergency evacuation. The area has a limited number of major highways, and these roads could be clogged not only with evacuating county residents, but also with other evacuees from southwest Florida in the event of a major hurricane. Congestion could likewise hamper an evacuation in response to other hazards, as indicated by the analysis of a major chlorine release near the Port of Tampa.
Transportation officials are attempting to alleviate some of the problems through use of intelligent transportation system (ITS) technologies and contraflow operations (in Hillsborough County only) on area highways. Both counties have the capability of changing signal timing, if necessary, to keep traffic moving on evacuation routes, but newer, more reliable systems are being phased in. Currently, law enforcement officials are assigned to control traffic at critical intersections. Cameras and variable message signs are also being placed on major evacuation routes (see below), which should help with incident control and traffic monitoring in general. However, little can be done to control congestion on local streets, which would be used by buses and vans along with passenger vehicles during an in-county emergency evacuation. State Department of Transportation (DOT) District 7 (see below) is also purchasing generators to assist in recovery of signal operation after a storm, and solar-powered signals are being installed. The goal is to return 100 traffic signals a day to service following a storm.
District VII of the state DOT, which has responsibility for Hillsborough and Pinellas counties, has developed contraflow plans for I-4, eastward from the I-4/I275 junction in
85 A competitive grant program is also available to municipalities that have an emergency management program and are signatories to the statewide mutual-aid agreement. Eligible grantees may apply annually for one grant, not to exceed $50,000.

Case Studies 203
Hillsborough County, but those plans have not been tested yet in a real evacuation.86 I-4 is a particular chokepoint because in a hurricane, many travelers attempt to evacuate east to Orlando. The state DOT has several other programs that should help facilitate traffic flow in an evacuation. First, a 10-year ITS program will provide for the installation of cameras and variable message signs on evacuation routes. Second, the DOT has standby contracts with local companies to provide towing services during an evacuation.87 Third, the DOT has a large program to provide solar-powered backup generators for traffic signals at major intersections. Finally, capital improvement projects on evacuation routes, such as upgrading of major interchanges, are given priority, although they are funded from the same federal and state sources as other capital improvement projects. The governor has also prestaged resources in a 200,000 sq ft logistics facility outside Orlando that could be deployed rapidly in an emergency. Finally, the 2004–2005 state legislature passed legislation requiring gas stations along the Interstates to have backup power so that vehicles would not run out of fuel; thus far, only about eight stations along the I-275 corridor are in compliance.
In the event that congestion should overwhelm evacuees in a severe hurricane, shelters of last resort have been identified. They are located at major Interstate interchanges in Hillsborough County and along evacuation routes in Pinellas County. Law enforcement—the Florida Highway Patrol, the Hillsborough County Sheriff, and the Pinellas County Sheriff’s Office—would be involved in opening and policing the shelters. Reducing Demand for Evacuation Given area traffic problems and the questionable need for many residents to evacuate, at least in a hurricane, county emergency managers are working to encourage residents to shelter in place.88 The annual hurricane guide, for example, provides information for those who are not located in vulnerable storm surge areas or in mobile homes about riding out the storm at home, as well as measures they can take to protect their homes. County officials are also working with the private sector so that stores can reopen quickly to sell water and other supplies after a storm has subsided. Pinellas County, for example, is working with the Chamber of Commerce to put in place memoranda of understanding with small businesses that encourage them to acquire backup generators so they can stay open or reopen quickly after a storm has passed to supply local residents. Moreover, both counties and DOT District VII have numerous contracts for debris removal, so the roads can be cleared quickly.89
In the longer run, the best way to mitigate the risks of the area’s most recurrent emergency, hurricanes, is to control development in highly vulnerable areas, such as the barrier island along the western portion of Pinellas County. However, there is little if any contact between land use planners and emergency managers. Moreover, the economic benefits to the counties of continued growth in desirable coastal locations are difficult to resist. Private insurers put a damper on development when they recently stopped writing homeowners insurance 86 A contraflow plan also exists for SR 618 and is maintained by the Hillsborough County Expressway Authority. SR 618, which originates near the air force base, heads north from the peninsula south of the City of Tampa and then east to join I-75. 87 Companies from outside the immediate area were selected in hopes that they would not be affected by a storm. 88 The Safe Florida Homes program provides free inspections and matching funds to homeowners for hurricane proofing their homes. 89 Hillsborough County has eight contracts for debris removal. Florida DOT has four state teams of 50 persons each for debris removal in Hillsborough and four other counties.

204 Special Report 294: The Role of Transit in Emergency Evacuation policies in vulnerable coastal locations, but the state has now stepped in as the insurer of last resort for coastal homes and businesses.
In lieu of land use controls, county emergency managers are attempting to work with local tourist businesses in vulnerable areas to ensure early evacuation in the event of an advance-notice emergency, such as a hurricane. For example, when a property is purchased, the deed requires the property owner to develop an evacuation plan, which the emergency managers must review. New hotels located in vulnerable storm surge areas in Pinellas County must close down during a hurricane watch, which goes into effect 36 hours in advance of predicted hurricane landfall, and assist in relocating their guests who need transport. This requirement appears to be unique to Pinellas County. Of course, both Pinellas and Hillsborough Counties evacuate special-needs populations in evacuation zones well in advance of hurricane landfall, as soon as the shelters open. Workforce and Fuel Availability in an Emergency Evacuation Hillsborough County and some municipalities in Pinellas County have special shelters for the families of first responders, primarily fire and police personnel. Transit agencies typically do not have formal plans for sheltering the families of their employees. Instead, in advance of hurricane season, they ask for volunteer drivers, who sign up to work during a hurricane. About half the drivers for PSTA signed up for this hurricane season. Currently, 290 school bus drivers out of about 750 are signed up for emergency duty, with about 50 other school district staff available as backup. The same process applies in Hillsborough County, where about half the Hartline drivers and about 220 volunteer school bus drivers have signed up to be available during a hurricane. In addition, PSTA noted that it pays its drivers well, and Hartline drivers are paid time and a half during an emergency. Hillsborough County has instituted a countywide policy that all employees must have a disaster plan. The Know Your Role Program involves filling out a form indicating job criticality,90 primary and alternative job locations, individual employee evacuation plans, childcare needs, and skills (e.g., commercial driver’s license) that can be used in an emergency. These data are entered into a database to help match employee availability and skills with potential needs in an emergency. Pinellas County has a similar program for its employees.
Fuel availability does not appear to be a major issue for transit service providers assisting in an evacuation. PSTA has above-ground fuel storage tanks with a considerable reserve of diesel fuel.91 It also has arrangements with the school board for fueling. Sunshine Lines has a 4- to 5-day supply of diesel fuel, and Hartline has agreements with three off-site locations for fuel. A fuel problem could occur during recovery, however, and it would affect far more than transit service providers. The Tampa UA has no pipelines and depends on tanker distribution from the Port of Tampa for fuel supplies. If the port were closed with major damage or if the port channel were to silt up in a severe hurricane, the area would have only a 3- to 4-day supply. County emergency managers are working on this issue, including determining who would have priority in the event of a fuel shortage.
90 There are four categories of job criticality: A—critical employees (e.g., fire, police, emergency managers) who would shelter at the job site; B—employees who should be available immediately after a storm to help restore services; C—employees who would not be needed for several days after a storm; and D—employees who are granted an exemption from participating (e.g., caretaker for a family member who is elderly or has a disability). 91 The facility, however, is located in an area that floods and if the area flooded in a severe hurricane, there would be no access to the fuel until the water receded.

Case Studies 205
Interjurisdictional Issues and Feasibility of Regional Evacuation Both Hillsborough and Pinellas Counties and their respective municipalities are signatories to the State of Florida mutual-aid agreement, which provides the basis for mutual assistance in the event of an emergency that exceeds local capabilities. The primary focus of county emergency managers, however, has been on emergency response and evacuation in their own counties. TBRPC, which represents four area counties, has a broader perspective and a long history of involvement in hurricane evacuation planning (since 1979). The council is currently working with the state to develop an all-hazards, statewide emergency evacuation plan that would link all county emergency evacuation plans. As a first step, LIDAR mapping92 is being used to determine population data and the locations of critical facilities, with overlays for special-needs populations and facilities (e.g., nursing homes, assisted living facilities). The information will be geographic information system (GIS) based, and an effort is being made to move to a common GIS platform. Summary The Tampa UA is the smallest of the committee’s five case study sites. The area is threatened by a recurring natural hazard—hurricanes and tropical storms—and has a significant at-risk population, many of whom would need transportation assistance in an emergency evacuation. The two major counties in the Tampa UA—Hillsborough and Pinellas—are well organized to handle in-county mandatory evacuations and have had recent experience during the hurricane seasons of the last several years.
Transit in the Tampa UA is not extensive. The area is served by two bus systems and demand-responsive service for those with disabilities. Nevertheless, transit service operators have been an integral part of emergency response and evacuation plans for many years and are represented at the county EOCs when they are activated. In an emergency evacuation, transit services are augmented by school buses, and the schools serve as area shelters. Transit providers, as well as school bus operators, have targeted their resources to transporting special-needs populations in an evacuation, and Florida in general and the Tampa UA in particular are notable for their attention to these vulnerable residents. Since the 1980s, county emergency managers across the state have been required by state law to establish voluntary special registries to help identify the medically impaired who are not in institutions but have special medical needs; special-needs shelters are to be made available, and their staffing and medical management are the responsibility of county health departments.93 The role of transit and school bus operators is to transport ambulatory and wheelchair-bound special-needs populations to these shelters. When a mandatory evacuation is declared, Hillsborough and Pinellas County transit operators also play a role in transporting the disadvantaged and the homeless, as well as those in the general population who lack access to a private vehicle, either to a shelter or to other in-county destinations along evacuation routes.
92 LIDAR or light detection and radar, is a technology that involves use of an airborne scanning laser to provide high-resolution digital data for large-scale mapping applications. 93 Since Hurricane Katrina, more attention has been focused on meeting the needs of those with disabilities. In Hillsborough County, for example, the EOC and the County Americans with Disabilities Act Liaison jointly chair a Disabilities Subcommittee of the Special Needs Committee, whose purpose is to ensure that the needs of those with disabilities are being addressed.

206 Special Report 294: The Role of Transit in Emergency Evacuation
The Tampa UA and its transit service providers are well organized to handle an in-county evacuation in an advance-notice event, such as a hurricane. But the area would be hard pressed to evacuate a sizable fraction of its population in a very severe hurricane or major hazardous materials incident, and the relatively small size of area transit systems would limit their role. The major obstacle is the highway network, which is limited to a few Interstates serving the area, and the congestion that would likely occur as a result of other areas evacuating through the region, at least in the event of a severe hurricane. Strong storm surge accompanying a severe hurricane would compound the problem, flooding local roads and bridge approaches and further hindering bus and vehicular traffic. For example, Pinellas County would have only one land-based evacuation route should the four bridges out of the county be shut down because of winds or high water. The state has recognized the problem and, working with the Tampa Bay Regional Planning Council in the Tampa UA, is beginning to develop an all-hazards, statewide emergency evacuation plan that would link individual county emergency evacuation plans.
This case study raises several general policy issues that may be relevant for other UAs. It shows that an area such as Tampa, which lacks an extensive transit network, can still organize and target resources effectively to assist special-needs and other vulnerable populations in an emergency evacuation. State regulations have played an important role, but so have county emergency managers, health officials, and transit managers, who have worked together both to identify these populations and to ensure that adequate drivers and equipment will be available to transport them to appropriate shelters. Hillsborough County’s Know Your Role program is an innovative effort to help ensure that county personnel will be available and know where to go in an emergency, and to match individual skills with likely potential needs.
That being said, the relatively small size of the Tampa UA relative to the other case study sites (e.g., New York, Los Angeles) does not appear to make it any easier to evacuate a significant proportion of the population from the area, much less use transit for this purpose. A limited network of major highways makes out-of-county evacuation difficult within any reasonable time frame, a problem that would likely be compounded by evacuees from neighboring counties in the event of a severe hurricane. The role of transit in such a scenario would probably be limited to in-county evacuation, given available resources. One response to this situation has been to reduce demand for evacuation, for example, by encouraging sheltering in place for populations not at risk in an advance-notice event such as a hurricane, and to plan for the evacuation of other populations (e.g., hotel guests) before that of the general population begins. Efforts to control development to keep residents and businesses out of harm’s way in vulnerable coastal locations have been less successful. A regional, and now a statewide, approach to emergency planning and evacuation is also receiving attention, but it remains to be seen whether the problems involved can be overcome.
Finally, Florida is notable for having an Emergency Management and Preparedness Assistance Trust Fund that is not dependent on annual appropriations and enables county emergency managers, and to a lesser extent municipal emergency managers, to fund a range of activities. In addition, the state department of health reimburses for the services provided by health care practitioners and vendors at special-needs shelters, which helps ensure that special-needs and other vulnerable populations receive the care they need in an emergency evacuation.

Case Studies 207
Committee Members and Staff in Attendance Betty Hearn Morrow (lead) Ellis Stanley, Sr. Kenneth Brown Nancy Humphrey Briefings Pinellas County David MacNamee, Emergency Management Coordinator, and Gregory Lindgren, Pinellas
County Emergency Management Robert Ballou, St. Petersburg Emergency Management Office William Vola, Clearwater Emergency Management Stephen Fravel, Pinellas County EMS and Fire Administration Richard Stiff, St. Petersburg Fire and Rescue Richard Walker, Chief, Pinellas Suncoast Fire and Rescue Christopher Taylor, Pinellas County Sheriff’s Office Denise Skinner, Director of Transportation, Jeff Thompson and Walter Lenz, Pinellas Suncoast
Transit Authority Timothy McClindon, Wheelchair Transport Service Roger Eckert, Neighborly Care Network Carol Madura, Emergency Manager, and Joseph Palazzola, Pinellas County Schools Gayle Guidash and David Sobamiwa, Pinellas County Health Department David Walker, Pinellas County Planning Department Heather Sobush, Pinellas Metropolitan Planning Organization Kenneth Jacobs, Pinellas County Traffic Betti C. Johnson, Principal Planner, Tampa Bay Regional Planning Council Hillsborough County Larry Gispert, Director, Peter Dabrowski, Holley Wade, Jeffrey Copeland, Daniel Fulcher,
Steven Porter, Edward Murphy, and Paul Siddall, Hillsborough County Emergency Management
Dennis LeMonde, Public Information Officer, Emergency Operations Center, Hillsborough County Emergency Management
Eugene Hensy, Hillborough County Planning and Growth Management Department David Travis and James Olsen, Hillsborough County Fire and Rescue Dennis Jones, Fire and Rescue, City of Tampa John Bennett, Veronica Hamilton, and George Magnon,Tampa Police Department Joseph Diaz and Ralph Lavado, Hillsborough Area Regional Transit Authority (Hartline) Scott Clark, Operations Manager, Sunshine Line John Saffold (Transportation) and Steven Ayers (Administration), Hillsborough County Schools Sandra Sroka, Hillsborough County ADA Liaison Brenda Martin, LifePath Hospice

208 Special Report 294: The Role of Transit in Emergency Evacuation Joseph DiDomenico, Self Reliance Judi Knight, American Red Cross Samuel Harris, Tampa Housing Authority Ryan Pedigo, Hillsborough County Health Department Michael MeCarthy, Hillsborough County Public Works Department/Traffic State of Florida Ronald Anderson, District Emergency Coordination Officer, Florida Department of
Transportation, District VII Christie L. Brown, Registered Nurse Consultant, Florida Department of Health Karen Somerset, Assistant Director, Commission for the Transportation Disadvantaged, State of
Florida Major Documents Consulted Pinellas County 1. The Pinellas County Board of County Commissioners, Comprehensive Emergency
Management Plan, October 2006. 2. Pinellas County Emergency Management, Special Needs Assistance Program, Standard
Operating Guidelines, June 2007. 3. Tampa Bay Regional Planning Council, Tampa Bay Region Hurricane Evacuation Study,
September 2006. a. Executive Summary. b. Transportation Analysis, August 2006. c. Model Support Document, August 2006.
4. Tampa Bay Regional Planning Council (in partnership with Pinellas County), 2007 Hurricane Guide (note that similar guides are available for Hillsborough, Manatee, and Pasco counties).
Hillsborough County 1. Hillsborough County, Comprehensive Emergency Management Plan (CEMP), May 2006. 2. Hillsborough County Department of Health and Hillsborough County Emergency
Management, The Hillsborough County Special Needs Shelter and Evacuation Plan, undated.
3. Hillsborough County Emergency Management, Transportation Planning for a Category 4 or 5 Hurricane.
4. Hillsborough County, Emergency Operations Center Guide, March 2004. 5. Hillsborough County, Know Your Role, CD video presentation about the program and its
requirements.

Case Studies 209
State of Florida 1. Department of Health. 2007. Special Needs Shelter Rule. Florida Administrative Weekly,
Vol. 33, No. 39, pp. 4524–4526.

211
Study Committee Biographical Information Richard A. White, Chair, is Executive Vice President and Director of Project Development at DMJM Harris, which he joined in 2006. Before that, his 30-year career was spent primarily in managing large transit properties. Most recently, he served as General Manager and Chief Executive Officer of the Washington Metropolitan Area Transit Authority (WMATA), the fourth-largest operator of public mass transit services in the United States as measured by ridership, and was at the helm during the terrorist attacks of September 11, 2001. Before that, he served as General Manager and Chief Executive Officer of the Bay Area Rapid Transit (BART) District in the San Francisco Bay Area, where he managed a major rehabilitation and expansion program. Prior to coming to BART as Deputy General Manager, he served as Director and Manager of the New Jersey Transit Corporation, managing a wide range of activities for the statewide public transit agency, which provides commuter rail, light rail, bus, and paratransit services. Early in his career, Mr. White worked as a Program Analyst and Transportation Representative for the Urban Mass Transportation Administration, now known as the Federal Transit Administration. He has served on the Executive Committee of the American Public Transportation Association (APTA) for 9 consecutive years, served as the APTA Chair in 2004–2005, and was the first head of APTA’s Security Task Force. Mr. White served on the Transportation Panel of the National Research Council’s (NRC) Committee on Science and Technology for Countering Terrorism. He holds a bachelor’s degree in political science from the University of Massachusetts and a master’s degree in public administration and metropolitan studies from the Maxwell School of Citizenship and Public Affairs at Syracuse University. Evelyn Blumenberg is Associate Professor of Urban Planning and Vice Chair of the Department of Urban Planning at the University of California, Los Angeles (UCLA), School of Public Affairs. After completing her dissertation, she became a University of California President’s Postdoctoral Fellow in 1995, and then assumed various academic positions at UCLA. Her research has focused on travel demographics, particularly the role of transportation in meeting the mobility needs of welfare recipients, the urban poor, and low-income women. Dr. Blumenberg is a research associate at the Mineta Transportation Institute and a member of the Southern California Inter-University Consortium on Homelessness and Poverty (the Weingart Center Association), the Association of Collegiate Schools of Planning, and the Association of Academic Women. She serves on the editorial board of Economic Development Quarterly and is a member of the TRB Committee on Women’s Issues in Transportation. Dr. Blumenberg received a bachelor of arts degree in political science from the University of California, Berkeley, and a master’s degree and doctorate in urban planning from UCLA. Kenneth A. Brown is Director of Risk Assessment and Fire Safety in the Office of System Safety at New York City Transit (NYCT), where he is responsible for overseeing engineering and fire and life safety issues affecting NYCT employees and customers in the subway and surface transit systems. Mr. Brown joined NYCT in 1992, where he has held positions of increasing responsibility, from System Safety Specialist, to Manager of Fire Safety, to his current position. Before coming to NYCT, he worked as a Senior Hardware Engineer for Applied Digital Data Systems, Inc. Mr. Brown is a member of the Baldwin, New York, Fire Department

212 Special Report 294: The Role of Transit in Emergency Evacuation
and a member of the Rail Committee of the National Fire Protection Association. He holds a bachelor of business administration degree in accounting from Hofstra University and a bachelor of science degree in electrical engineering from the New York Institute of Technology. John M. Contestabile is Director of the Office of Engineering Emergency Services and former Acting Assistant Secretary for the Maryland Department of Transportation. In his 29-year career with the department, he has held a variety of positions, including Division Chief, Project Manager, and Staff Engineer at the Maryland State Highway Administration, and an 8-month assignment with the Governor’s Office as Acting Deputy Director of the Office of Homeland Security. Mr. Contestabile is a former 11-year member of the Governor’s Emergency Management Advisory Committee and also a member of the Department of Homeland Security’s “Safecom” Interoperable Communications Advisory Committee. He is Vice Chair of the American Association of State Highway and Transportation Officials’ Special Committee on Transportation Security; Chair of the State-wide Public Safety Communications Interoperability Executive Committee; and Program Chair of the All Hazards Consortium, a nonprofit organization of state governments, universities, and industry that supports homeland security and emergency management efforts in the mid-Atlantic region. He is also a member of the American Society of Civil Engineers (ASCE) and the Maryland Emergency Management Association, and a board member of the Baltimore Chapter of the Women’s Transportation Seminar. Mr. Contestabile served on an NRC Committee that studied the use of geospatial information for disaster management and is a member of two security-related project panels for the National Cooperative Highway Research Program (NCHRP). He received a bachelor of science degree in civil engineering from Worcester Polytechnic Institute and a master of business administration degree from the University of Baltimore. Ali Haghani is Professor and Chairman of the Department of Civil and Environmental Engineering at the University of Maryland at College Park. Prior to coming to the University of Maryland, he was an Assistant Professor at the University of Pittsburgh and was a Postdoctoral Fellow and Research Scientist at Northwestern University, where he received his higher education degrees. Before that, he worked in consulting and construction firms for the Ministry of Highways and Transportation in Iran. Dr. Haghani is an expert in large-scale transportation network modeling, logistics, and transit operations and chairs the TRB Committee on Transportation Network Modeling. He is a member of ASCE, the Institute of Transportation Engineers, ITS America, and the Institute for Operations Research and the Management Sciences. Dr. Haghani is also Associate Editor of the Journal of Intelligent Transportation Systems. He holds a bachelor of science degree in civil engineering from Shiraz University in Iran and a master’s degree and doctorate in civil engineering from Northwestern University. Arnold M. Howitt is Executive Director of the Taubman Center for State and Local Government and a faculty member at the John F. Kennedy School of Government at Harvard University. A specialist in state and local public management and intergovernmental relations, he has worked at Harvard since 1976. From 1998 to 2001, Dr. Howitt also served part-time as Executive Director of the Cooperative Mobility Program of the Massachusetts Institute of Technology (MIT), an international transportation research program based at MIT. In the field of emergency management, he is faculty cochair of a Kennedy School executive training program in crisis management; teaches in the National Preparedness Leadership Initiative, which

Study Committee Biographical Information 213
he cofounded; and directed the U.S. Department of Justice program on terrorism—the Executive Session on Domestic Preparedness—from 1999 to 2003. Dr. Howitt also served on the Governor’s Bioterrorism Coordinating Council in Massachusetts (2002). He is a member of the Scientific Advisory Council on Bioterrorism at the Harvard School of Public Health and a member of the Policy Committee of the New England University Transportation Center. Dr. Howitt served on the NRC Committee for the Evaluation of the Metropolitan Medical Response Systems Program. He holds a bachelor of arts degree from Columbia University and a master’s degree and doctorate in political science from Harvard University. Thomas C. Lambert is Senior Vice President and Chief of Police of the Department of Public Safety for the Metropolitan Transit Authority of Harris County (METRO), serving Houston and much of Harris County, Texas. He is responsible for directing and managing police operations, traffic management activities, high-occupancy vehicle lane operations and management, emergency preparedness and operations, intelligent transportation systems projects, and system safety. Before joining METRO in 1979, Mr. Lambert served as Senior Police Officer with the Austin, Texas, Police Department. He is immediate past Chairman of ITS America’s Board of Directors and is a member of its Executive Committee, Chairman of the Leadership Team at Houston TranStar (the region’s transportation and emergency management center), member of the Advisory Board of the University of Houston-Downtown Criminal Justice Training Center Law Enforcement Academy, member of the FBI’s Joint Terrorism Task Force Executive Board, and life member of the International Association of Chiefs of Police. Mr. Lambert is currently a member of two NCHRP project panels and one Transit Cooperative Research Program (TCRP) panel, all dealing with emergency management and public transportation security issues. He holds a bachelor of arts degree in political science from Southwest Texas State University and a master’s degree in public administration from the University of Houston. Betty Hearn Morrow is a consulting sociologist and Professor Emeritus at Florida International University, where she directed the International Hurricane Research Center’s Laboratory for Social and Behavioral Research. Her work focuses on the sociology of disasters, with emphasis on how social and economic factors affect the ability of many households to prepare for and respond to hurricanes. Dr. Morrow is a member of the Hurricane Forecast Social and Economic Working Group, Associate Editor of Natural Hazards Review, and member of the Editorial Board of Environmental Hazards. She received a bachelor of science degree from Ohio State University, a master’s degree in sociology from Florida State University, and a master of education degree in guidance and counseling and a doctorate from the University of Miami. Michael H. Setzer is a Vice President of Veolia Transportation, a global provider of public transportation operations and maintenance. Previously he served as Chief Executive Officer and General Manager for the Southwest Ohio Regional Transit Authority in Cincinnati. He has also served as General Manager of Metro Transit of Minneapolis and of Bi-State Transit (now Metro) in St. Louis, and has also held staff positions in several other U.S. transit systems. Mr. Setzer is Chair of APTA’s Emergency Preparedness Task Force and Chair Emeritus of the Bus and Paratransit CEOs Committee. He recently concluded a term as Vice Chairman of the Advisory Board of the National Transit Institute and is cofounder of Professional Transit Management, Ltd., now a division of Veolia. He holds a bachelor of science degree in economics from the

214 Special Report 294: The Role of Transit in Emergency Evacuation
University of Minnesota and a master of business administration degree management from Xavier University. Ellis M. Stanley, Sr., is Director of Western Emergency Management Services at Dewberry, LLC, where he is responsible for overseeing and growing the company’s emergency management practice in the western United States. Before coming to Dewberry in 2007, he served for 10 years as Assistant City Administrative Officer and then as General Manager of the Emergency Preparedness Department for the City of Los Angeles. Previously, he was Director of the Atlanta-Fulton County Emergency Management Agency, where, among other responsibilities, he managed the Emergency Operations Center and developed the first Metropolitan Medical Strike Team for the 1996 Centennial Games. He has also directed other emergency management programs in Durham-Durham County, North Carolina, and before that, in Brunswick County, North Carolina, where he began his more than 32-year career in emergency management. Mr. Stanley is active in the emergency management profession, having served as President of the International Association of Emergency Managers, the American Society of Professional Emergency Planners, and the Atlanta Chapter of the National Defense Transportation Association. He is a member of the Board of Directors of the National Institute of Urban Search and Recue, the Disaster Recovery Institute International, and Operation Hope, Inc. He is also a member of the NRC Board on Natural Disasters and served on the NRC Committee on Planning for Catastrophe: A Blueprint for Improving Geospatial Data, Tools, and Infrastructure for the Board on Earth Sciences and Resources. Mr. Stanley holds a bachelor’s degree in political science from the University of North Carolina at Chapel Hill. Andrew Velásquez III was appointed Director of the Illinois Emergency Management Agency (IEMA) by Governor Rod R. Blagojevich on March 16, 2007. As director, Mr. Velásquez oversees Illinois’ disaster preparedness and response, nuclear safety, and homeland security programs, as well as the agency’s approximately 250 employees and a budget of more than $470 million. Since November 2007, he also has served as Homeland Security Advisor to the governor. Prior to becoming IEMA director, Mr. Velásquez was Executive Director of Chicago’s Office of Emergency Management and Communications (OEMC). Appointed by Mayor Richard M. Daley, he was responsible for planning and executing public safety initiatives to serve the city’s 2.9 million residents. While at OEMC, Mr. Velásquez implemented innovative technology solutions, such as wireless and satellite communications, to enhance the city’s delivery of emergency services. Before coming to OEMC, he served for 10 years with the Chicago Police Department in various capacities, most recently as Director of the Criminal Identification and Records Services Division. Mr. Velásquez is on the Board of Directors for the Central United States Earthquake Consortium, a partnership of the federal government and the eight states most affected by earthquakes in the central United States. He also is a member of the Regional Advisory Council for the Federal Emergency Management Agency’s Region V and the Homeland Security Committee for the National Emergency Management Association. He holds a master of business administration degree in management from St. Xavier University and bachelor’s and master of science degrees in criminal justice from Illinois State University. As a member of the U.S. military, Mr. Velasquez served for 6 years in the U.S. Army.


TRANSPORTATION RESEARCH BOARD
500 Fifth Street, NW
Washington, DC 20001
www.TRB.org