The Ecological Footprint and Natural Wealthassets.panda.org/downloads/asialpr2005.pdfThe Ecological...
29
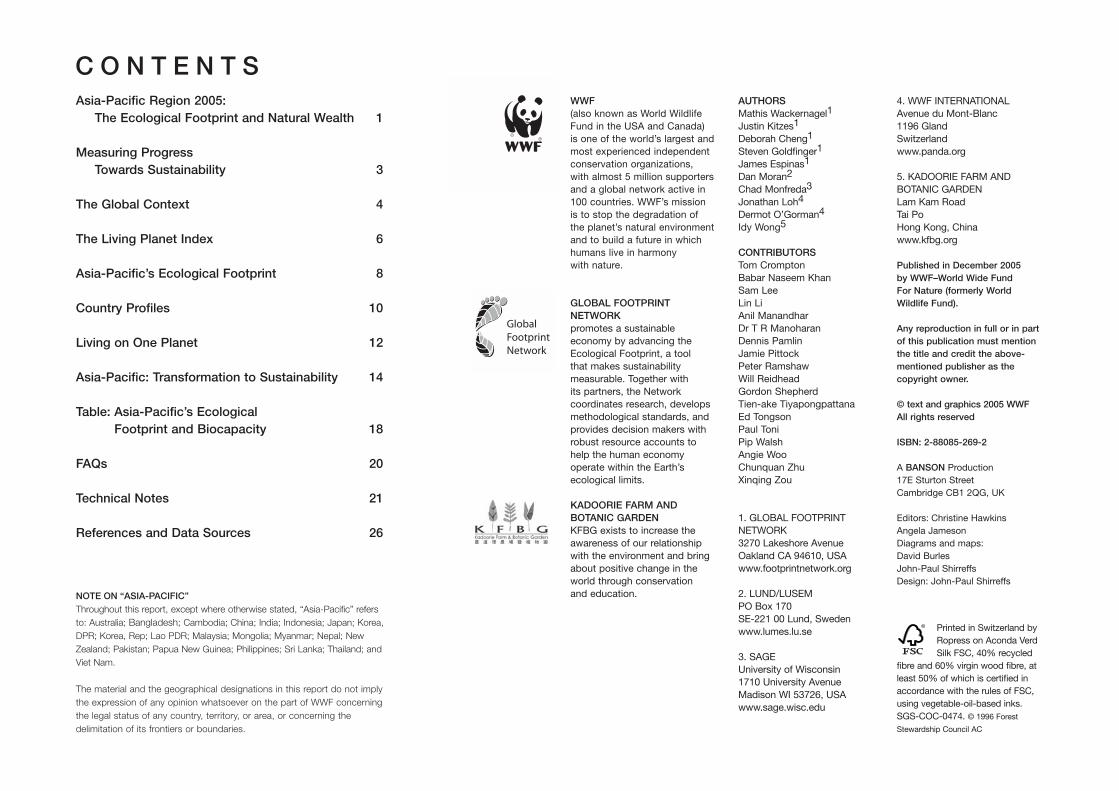
C ountries in Asia and the Pacific have made a firm commitment to sustainable development. We want a better quality of life for all, while safeguarding the Earth’s capacity to support life in all its diversity and respecting the limits of the planet’s natural resources. How can we achieve this in the face of growing populations and changing consumption patterns, both within the region and the world? As a first step to answering this question, we need to know where we are today. How does the Asia-Pacific region’s current demand for ecological resources compare to the region’s (and the planet’s) supply? How does it compare to other regions? How do countries in the region differ from one another in both demand for and supply of ecological resources? We can begin to address the sustainability challenge by exploring the implications of our current and proposed future development paths for regional and global ecosystems. The results of the Ecological Footprint analysis presented in this report are an invitation to look harder at humanity’s and the Asia-Pacific region’s critical dilemma. It is also a poignant reminder that consumptive lifestyles in North America and Europe, largely based on cheap fuel and exporting environmental costs, cannot be maintained nor extended worldwide without causing additional life-threatening damage to the global environment and increasing social inequity. This report is a call for action, not just for the policy community, but for the scientific and business com- munities as well. It echoes what the Millennium Ecosystem Assessment found: that the health of natural systems has a profound impact on our quality of life, but 60 percent of the ecosystem services that support life on Earth are being degraded or used unsustainably. This report provides a frank assessment of what is at stake for Asia and the Pacific and for the rest of the world. The Millennium Development Goals will not be achieved if we do not address sustainability in development. Many still believe that the environment is some kind of separate luxury item that can be addressed after economic development. This is the opposite of the truth. The environment is the base of all human activities, and the ultimate source of all our wealth. Poverty, environment and consumption are all linked. How much nature does it take to support us? This is a question we can no longer afford to ignore. To pose a hypothetical question: “How many planets would it take if everybody in Asia and the Pacific consumed like an average American or European?” We have only one planet, yet all people want, and have the right to, fulfilling lives. The challenge for high income countries is to radically reduce footprint while maintaining quality of life. For lasting improvements in their quality of life, lower income countries are facing the complementary challenge of finding new paths to development that can provide best living conditions without liquidating their ecological wealth. The Asia-Pacific region is in a unique position to shape the development model for the whole world in the coming decades. I support this report’s attempt to establish a quantitative link between ecosystem health and human prosperity, and I welcome forward-thinking initiatives and actions such as this one by WWF. Professor Emil Salim Former Indonesian Minister of State ASIA-PACIFIC 2005 The Ecological Footprint and Natural Wealth
Transcript of The Ecological Footprint and Natural Wealthassets.panda.org/downloads/asialpr2005.pdfThe Ecological...
Countries in Asia and the Pacific have made a firmcommitment to sustainable development. We wanta better quality of life for all, while safeguarding the
Earth’s capacity to support life in all its diversity andrespecting the limits of the planet’s natural resources. Howcan we achieve this in the face of growing populations andchanging consumption patterns, both within the regionand the world?
As a first step to answering this question, we need toknow where we are today. How does the Asia-Pacificregion’s current demand for ecological resources compareto the region’s (and the planet’s) supply? How does itcompare to other regions? How do countries in the regiondiffer from one another in both demand for and supply ofecological resources? We can begin to address thesustainability challenge by exploring the implications of ourcurrent and proposed future development paths forregional and global ecosystems.
The results of the Ecological Footprint analysispresented in this report are an invitation to look harder athumanity’s and the Asia-Pacific region’s critical dilemma. Itis also a poignant reminder that consumptive lifestyles inNorth America and Europe, largely based on cheap fueland exporting environmental costs, cannot be maintained
nor extended worldwide without causing additional life-threatening damage to the global environment and increasing social inequity.
This report is a call for action, not just for the policycommunity, but for the scientific and business com-munities as well. It echoes what the Millennium EcosystemAssessment found: that the health of natural systems hasa profound impact on our quality of life, but 60 percent ofthe ecosystem services that support life on Earth are beingdegraded or used unsustainably. This report provides afrank assessment of what is at stake for Asia and thePacific and for the rest of the world. The MillenniumDevelopment Goals will not be achieved if we do notaddress sustainability in development.
Many still believe that the environment is some kind ofseparate luxury item that can be addressed after economicdevelopment. This is the opposite of the truth. Theenvironment is the base of all human activities, and theultimate source of all our wealth. Poverty, environment andconsumption are all linked. How much nature does it taketo support us? This is a question we can no longer affordto ignore.
To pose a hypothetical question: “How many planetswould it take if everybody in Asia and the Pacific
consumed like an average American or European?” Wehave only one planet, yet all people want, and have theright to, fulfilling lives. The challenge for high incomecountries is to radically reduce footprint while maintainingquality of life. For lasting improvements in their quality oflife, lower income countries are facing the complementarychallenge of finding new paths to development that canprovide best living conditions without liquidating theirecological wealth.
The Asia-Pacific region is in a unique position to shapethe development model for the whole world in the comingdecades. I support this report’s attempt to establish aquantitative link between ecosystem health and humanprosperity, and I welcome forward-thinking initiatives andactions such as this one by WWF.
Professor Emil SalimFormer Indonesian Minister of State
AS IA -PAC IF IC 2005The Ecological Footprint and Natural Wealth
Asia-Pacific Region 2005: The Ecological Footprint and Natural Wealth 1
Measuring Progress Towards Sustainability 3
The Global Context 4
The Living Planet Index 6
Asia-Pacific’s Ecological Footprint 8
Country Profiles 10
Living on One Planet 12
Asia-Pacific: Transformation to Sustainability 14
Table: Asia-Pacific’s Ecological Footprint and Biocapacity 18
FAQs 20
Technical Notes 21
References and Data Sources 26
AUTHORSMathis Wackernagel1
Justin Kitzes1
Deborah Cheng1
Steven Goldfinger1
James Espinas1
Dan Moran2
Chad Monfreda3
Jonathan Loh4
Dermot O’Gorman4
Idy Wong5
CONTRIBUTORSTom CromptonBabar Naseem KhanSam LeeLin LiAnil ManandharDr T R ManoharanDennis PamlinJamie PittockPeter RamshawWill ReidheadGordon ShepherdTien-ake TiyapongpattanaEd TongsonPaul ToniPip WalshAngie WooChunquan ZhuXinqing Zou
1. GLOBAL FOOTPRINTNETWORK3270 Lakeshore AvenueOakland CA 94610, USAwww.footprintnetwork.org
2. LUND/LUSEMPO Box 170SE-221 00 Lund, Swedenwww.lumes.lu.se
3. SAGEUniversity of Wisconsin1710 University AvenueMadison WI 53726, USAwww.sage.wisc.edu
4. WWF INTERNATIONALAvenue du Mont-Blanc1196 GlandSwitzerlandwww.panda.org
5. KADOORIE FARM ANDBOTANIC GARDENLam Kam RoadTai PoHong Kong, Chinawww.kfbg.org
Published in December 2005 by WWF–World Wide Fund For Nature (formerly WorldWildlife Fund).
Any reproduction in full or in partof this publication must mentionthe title and credit the above-mentioned publisher as thecopyright owner.
© text and graphics 2005 WWFAll rights reserved
ISBN: 2-88085-269-2
A BANSON Production17E Sturton StreetCambridge CB1 2QG, UK
Editors: Christine HawkinsAngela JamesonDiagrams and maps: David Burles John-Paul ShirreffsDesign: John-Paul Shirreffs
Printed in Switzerland byRopress on Aconda VerdSilk FSC, 40% recycled
fibre and 60% virgin wood fibre, atleast 50% of which is certified inaccordance with the rules of FSC,using vegetable-oil-based inks.SGS-COC-0474. © 1996 Forest
Stewardship Council AC
WWF(also known as World WildlifeFund in the USA and Canada)is one of the world’s largest andmost experienced independentconservation organizations,with almost 5 million supportersand a global network active in100 countries. WWF’s missionis to stop the degradation ofthe planet’s natural environmentand to build a future in whichhumans live in harmony with nature.
GLOBAL FOOTPRINTNETWORKpromotes a sustainableeconomy by advancing theEcological Footprint, a tool that makes sustainabilitymeasurable. Together with its partners, the Networkcoordinates research, developsmethodological standards, andprovides decision makers withrobust resource accounts tohelp the human economyoperate within the Earth’secological limits.
KADOORIE FARM ANDBOTANIC GARDENKFBG exists to increase theawareness of our relationshipwith the environment and bringabout positive change in theworld through conservation and education.
C O N T E N T S
NOTE ON “ASIA-PACIFIC”Throughout this report, except where otherwise stated, “Asia-Pacific” refersto: Australia; Bangladesh; Cambodia; China; India; Indonesia; Japan; Korea,DPR; Korea, Rep; Lao PDR; Malaysia; Mongolia; Myanmar; Nepal; NewZealand; Pakistan; Papua New Guinea; Philippines; Sri Lanka; Thailand; andViet Nam.
The material and the geographical designations in this report do not implythe expression of any opinion whatsoever on the part of WWF concerningthe legal status of any country, territory, or area, or concerning thedelimitation of its frontiers or boundaries.
GlobalFootprintNetwork
3ASIA-PACIFIC 2005: THE ECOLOGICAL FOOTPRINT
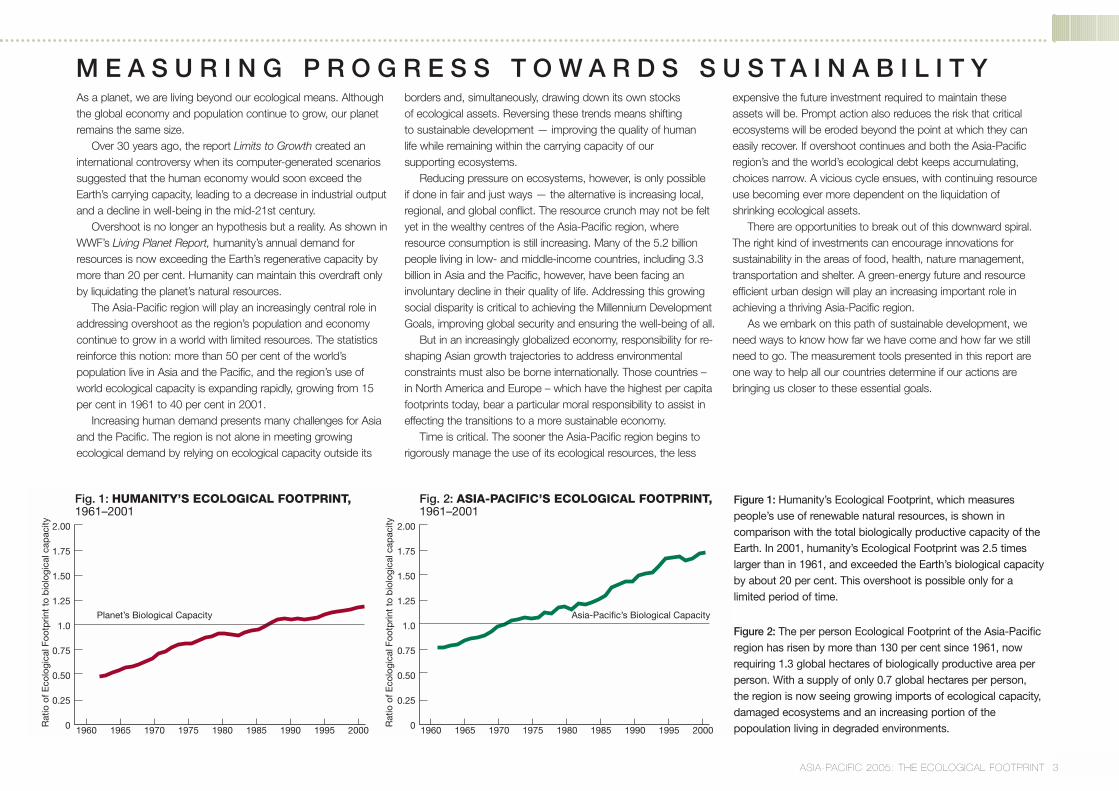
As a planet, we are living beyond our ecological means. Althoughthe global economy and population continue to grow, our planetremains the same size.
Over 30 years ago, the report Limits to Growth created aninternational controversy when its computer-generated scenariossuggested that the human economy would soon exceed theEarth’s carrying capacity, leading to a decrease in industrial outputand a decline in well-being in the mid-21st century.
Overshoot is no longer an hypothesis but a reality. As shown inWWF’s Living Planet Report, humanity’s annual demand forresources is now exceeding the Earth’s regenerative capacity bymore than 20 per cent. Humanity can maintain this overdraft onlyby liquidating the planet’s natural resources.
The Asia-Pacific region will play an increasingly central role inaddressing overshoot as the region’s population and economycontinue to grow in a world with limited resources. The statisticsreinforce this notion: more than 50 per cent of the world’spopulation live in Asia and the Pacific, and the region’s use ofworld ecological capacity is expanding rapidly, growing from 15per cent in 1961 to 40 per cent in 2001.
Increasing human demand presents many challenges for Asiaand the Pacific. The region is not alone in meeting growingecological demand by relying on ecological capacity outside its
borders and, simultaneously, drawing down its own stocks of ecological assets. Reversing these trends means shifting to sustainable development — improving the quality of human life while remaining within the carrying capacity of our supporting ecosystems.
Reducing pressure on ecosystems, however, is only possible if done in fair and just ways — the alternative is increasing local,regional, and global conflict. The resource crunch may not be feltyet in the wealthy centres of the Asia-Pacific region, whereresource consumption is still increasing. Many of the 5.2 billionpeople living in low- and middle-income countries, including 3.3billion in Asia and the Pacific, however, have been facing aninvoluntary decline in their quality of life. Addressing this growingsocial disparity is critical to achieving the Millennium DevelopmentGoals, improving global security and ensuring the well-being of all.
But in an increasingly globalized economy, responsibility for re-shaping Asian growth trajectories to address environmentalconstraints must also be borne internationally. Those countries –in North America and Europe – which have the highest per capitafootprints today, bear a particular moral responsibility to assist ineffecting the transitions to a more sustainable economy.
Time is critical. The sooner the Asia-Pacific region begins torigorously manage the use of its ecological resources, the less
expensive the future investment required to maintain these assets will be. Prompt action also reduces the risk that criticalecosystems will be eroded beyond the point at which they caneasily recover. If overshoot continues and both the Asia-Pacificregion’s and the world’s ecological debt keeps accumulating,choices narrow. A vicious cycle ensues, with continuing resourceuse becoming ever more dependent on the liquidation ofshrinking ecological assets.
There are opportunities to break out of this downward spiral.The right kind of investments can encourage innovations forsustainability in the areas of food, health, nature management,transportation and shelter. A green-energy future and resourceefficient urban design will play an increasing important role inachieving a thriving Asia-Pacific region.
As we embark on this path of sustainable development, weneed ways to know how far we have come and how far we stillneed to go. The measurement tools presented in this report areone way to help all our countries determine if our actions arebringing us closer to these essential goals.
M E A S U R I N G P R O G R E S S T O W A R D S S U S T A I N A B I L I T Y
Figure 1: Humanity’s Ecological Footprint, which measurespeople’s use of renewable natural resources, is shown incomparison with the total biologically productive capacity of theEarth. In 2001, humanity’s Ecological Footprint was 2.5 timeslarger than in 1961, and exceeded the Earth’s biological capacityby about 20 per cent. This overshoot is possible only for alimited period of time.
Figure 2: The per person Ecological Footprint of the Asia-Pacificregion has risen by more than 130 per cent since 1961, nowrequiring 1.3 global hectares of biologically productive area perperson. With a supply of only 0.7 global hectares per person,the region is now seeing growing imports of ecological capacity,damaged ecosystems and an increasing portion of thepopoulation living in degraded environments.
Fig. 2: ASIA-PACIFIC’S ECOLOGICAL FOOTPRINT, 1961–2001
Fig. 1: HUMANITY’S ECOLOGICAL FOOTPRINT, 1961–2001
Rat
io o
f Eco
logi
cal F
ootp
rint
to b
iolo
gica
l cap
acity
1970 197519651960 1980 1985 1990 1995 2000
Rat
io o
f Eco
logi
cal F
ootp
rint
to b
iolo
gica
l cap
acity
1970 197519651960 1980 1985 1990 1995 2000
2.00
1.75
1.50
1.25
1.0
0.75
0.50
0.25
0
2.00
1.75
1.50
1.25
1.0
0.75
0.50
0.25
0
Planet’s Biological Capacity Asia-Pacific’s Biological Capacity
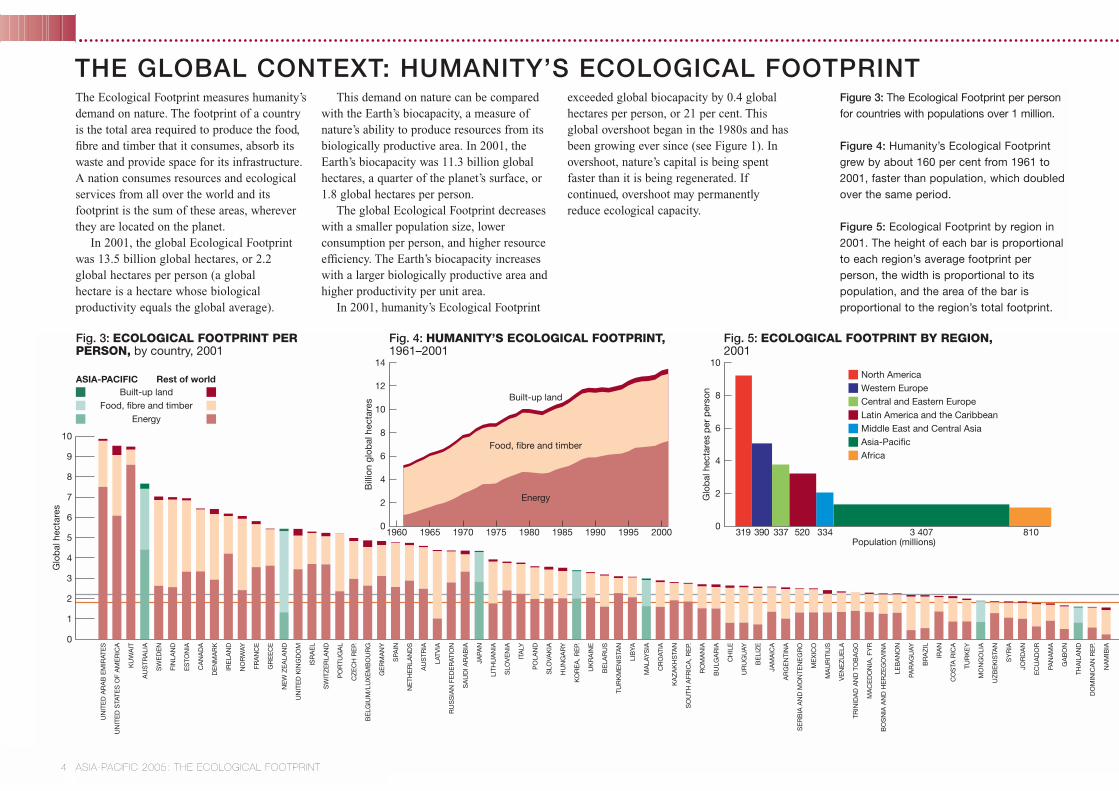
Fig. 3: ECOLOGICAL FOOTPRINT PERPERSON, by country, 2001
Built-up landFood, fibre and timber
Energy
ASIA-PACIFIC Rest of world
UN
ITE
D A
RA
B E
MIR
ATE
S
UN
ITE
D S
TATE
S O
F A
ME
RIC
A
KU
WA
IT
AU
STR
ALI
A
SW
ED
EN
FIN
LAN
D
ES
TON
IA
CA
NA
DA
DE
NM
AR
K
IRE
LAN
D
NO
RW
AY
FRA
NC
E
GR
EE
CE
NE
W Z
EA
LAN
D
UN
ITE
D K
ING
DO
M
ISR
AE
L
SW
ITZ
ER
LAN
D
PO
RTU
GA
L
CZ
EC
H R
EP.
BE
LGIU
M/L
UX
EM
BO
UR
G
GE
RM
AN
Y
SPA
IN
NE
THE
RLA
ND
S
AU
STR
IA
LATV
IA
RU
SS
IAN
FE
DE
RAT
ION
SA
UD
I AR
AB
IA
JAPA
N
LITH
UA
NIA
SLO
VE
NIA
ITA
LY
PO
LAN
D
SLO
VAK
IA
HU
NG
AR
Y
KO
RE
A, R
EP.
UK
RA
INE
BE
LAR
US
TUR
KM
EN
ISTA
N
LIB
YA
MA
LAY
SIA
CR
OAT
IA
KA
ZA
KH
STA
N
SO
UTH
AFR
ICA
, RE
P.
RO
MA
NIA
BU
LGA
RIA
CH
ILE
UR
UG
UAY
BE
LIZ
E
JAM
AIC
A
AR
GE
NTI
NA
SE
RB
IA A
ND
MO
NTE
NE
GR
O
ME
XIC
O
MA
UR
ITIU
S
VE
NE
ZU
ELA
TRIN
IDA
D A
ND
TO
BA
GO
MA
CE
DO
NIA
, FY
R
BO
SN
IA A
ND
HE
RZ
EG
OV
INA
LEB
AN
ON
PAR
AG
UAY
BR
AZ
IL
IRA
N
CO
STA
RIC
A
TUR
KE
Y
MO
NG
OLI
A
UZ
BE
KIS
TAN
SY
RIA
JOR
DA
N
EC
UA
DO
R
PAN
AM
A
GA
BO
N
THA
ILA
ND
DO
MIN
ICA
N R
EP.
NA
MIB
IA
0
4
2
8
10
9
7
5
3
1
6
Glo
bal
hec
tare
s
1960 1965 1970 1975 1980 1985 1990 20001995
Fig. 4: HUMANITY’S ECOLOGICAL FOOTPRINT,1961–2001
Bill
ion
glob
al h
ecta
res
14
0
6
12
10
8
2
4
Built-up land
Energy
Food, fibre and timber
10
0
6
4
8
2
Fig. 5: ECOLOGICAL FOOTPRINT BY REGION,2001
Glo
bal
hec
tare
s p
er p
erso
n
319 390 337 520 334 3 407Population (millions)
810
North AmericaWestern EuropeCentral and Eastern EuropeLatin America and the CaribbeanMiddle East and Central AsiaAsia-PacificAfrica
The Ecological Footprint measures humanity’sdemand on nature. The footprint of a countryis the total area required to produce the food,fibre and timber that it consumes, absorb itswaste and provide space for its infrastructure.A nation consumes resources and ecologicalservices from all over the world and itsfootprint is the sum of these areas, whereverthey are located on the planet.
In 2001, the global Ecological Footprintwas 13.5 billion global hectares, or 2.2 global hectares per person (a global hectare is a hectare whose biologicalproductivity equals the global average).
This demand on nature can be comparedwith the Earth’s biocapacity, a measure ofnature’s ability to produce resources from itsbiologically productive area. In 2001, theEarth’s biocapacity was 11.3 billion globalhectares, a quarter of the planet’s surface, or1.8 global hectares per person.
The global Ecological Footprint decreaseswith a smaller population size, lowerconsumption per person, and higher resourceefficiency. The Earth’s biocapacity increaseswith a larger biologically productive area andhigher productivity per unit area.
In 2001, humanity’s Ecological Footprint
exceeded global biocapacity by 0.4 globalhectares per person, or 21 per cent. Thisglobal overshoot began in the 1980s and hasbeen growing ever since (see Figure 1). Inovershoot, nature’s capital is being spentfaster than it is being regenerated. Ifcontinued, overshoot may permanently reduce ecological capacity.
Figure 3: The Ecological Footprint per personfor countries with populations over 1 million.
Figure 4: Humanity’s Ecological Footprintgrew by about 160 per cent from 1961 to2001, faster than population, which doubledover the same period.
Figure 5: Ecological Footprint by region in2001. The height of each bar is proportionalto each region’s average footprint perperson, the width is proportional to itspopulation, and the area of the bar isproportional to the region’s total footprint.
THE GLOBAL CONTEXT: HUMANITY’S ECOLOGICAL FOOTPRINT
4 ASIA-PACIFIC 2005: THE ECOLOGICAL FOOTPRINT
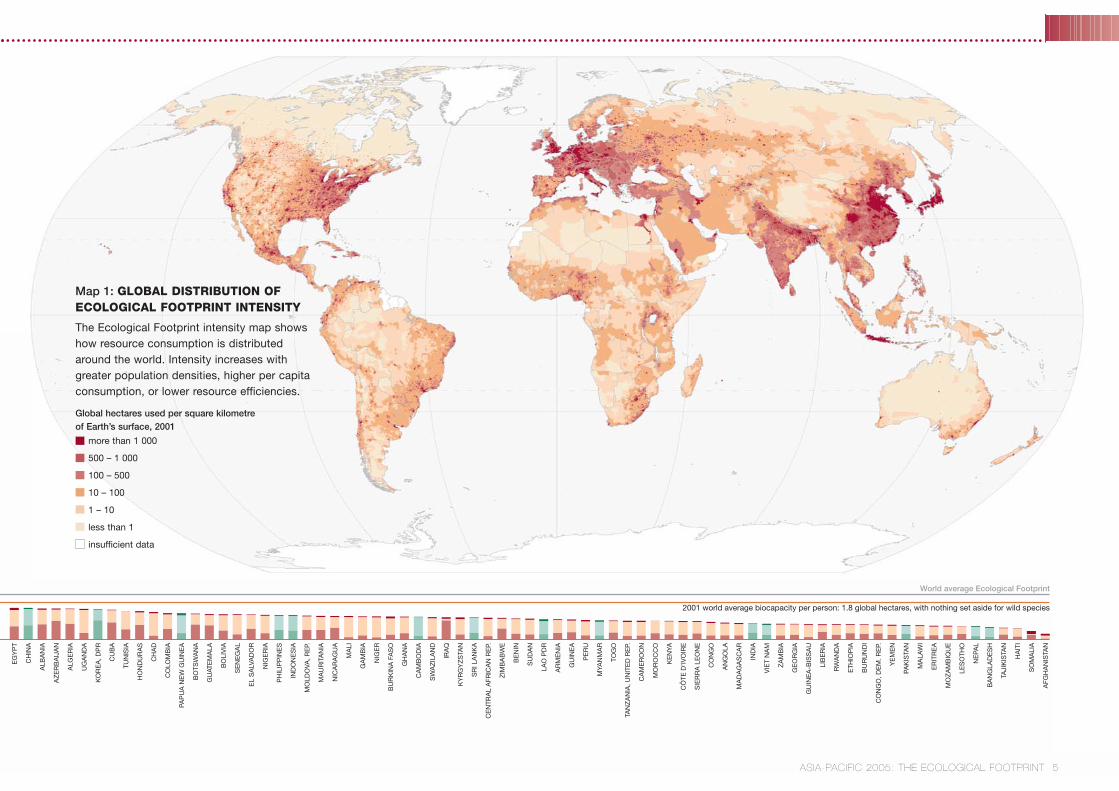
2001 world average biocapacity per person: 1.8 global hectares, with nothing set aside for wild species
World average Ecological Footprint
EG
YP
T
CH
INA
ALB
AN
IA
AZ
ER
BA
IJA
N
ALG
ER
IA
UG
AN
DA
KO
RE
A, D
PR
CU
BA
TUN
ISIA
HO
ND
UR
AS
CH
AD
CO
LOM
BIA
PAP
UA
NE
W G
UIN
EA
BO
TSW
AN
A
GU
ATE
MA
LA
BO
LIV
IA
SE
NE
GA
L
EL
SA
LVA
DO
R
NIG
ER
IA
PH
ILIP
PIN
ES
IND
ON
ES
IA
MO
LDO
VA, R
EP.
MA
UR
ITA
NIA
NIC
AR
AG
UA
MA
LI
GA
MB
IA
NIG
ER
BU
RK
INA
FA
SO
GH
AN
A
CA
MB
OD
IA
SW
AZ
ILA
ND
IRA
Q
KY
RG
YZ
STA
N
SR
I LA
NK
A
CE
NTR
AL
AFR
ICA
N R
EP.
ZIM
BA
BW
E
BE
NIN
SU
DA
N
LAO
PD
R
AR
ME
NIA
GU
INE
A
PE
RU
MYA
NM
AR
TOG
O
TAN
ZA
NIA
, UN
ITE
D R
EP.
CA
ME
RO
ON
MO
RO
CC
O
KE
NYA
CÔ
TE D
’IVO
IRE
SIE
RR
A L
EO
NE
CO
NG
O
AN
GO
LA
MA
DA
GA
SC
AR
IND
IA
VIE
T N
AM
ZA
MB
IA
GE
OR
GIA
GU
INE
A-B
ISS
AU
LIB
ER
IA
RW
AN
DA
ETH
IOP
IA
BU
RU
ND
I
CO
NG
O, D
EM
. RE
P.
YE
ME
N
PAK
ISTA
N
MA
LAW
I
ER
ITR
EA
MO
ZA
MB
IQU
E
LES
OTH
O
NE
PAL
BA
NG
LAD
ES
H
TAJI
KIS
TAN
HA
ITI
SO
MA
LIA
AFG
HA
NIS
TAN
ASIA-PACIFIC 2005: THE ECOLOGICAL FOOTPRINT 5
Map 1: GLOBAL DISTRIBUTION OFECOLOGICAL FOOTPRINT INTENSITY
The Ecological Footprint intensity map showshow resource consumption is distributedaround the world. Intensity increases withgreater population densities, higher per capitaconsumption, or lower resource efficiencies.
Global hectares used per square kilometre of Earth’s surface, 2001
more than 1 000
500 – 1 000
100 – 500
10 – 100
1 – 10
less than 1
insufficient data
T H E L I V I N G P L A N E T I N D E X
6 ASIA-PACIFIC 2005: THE ECOLOGICAL FOOTPRINT
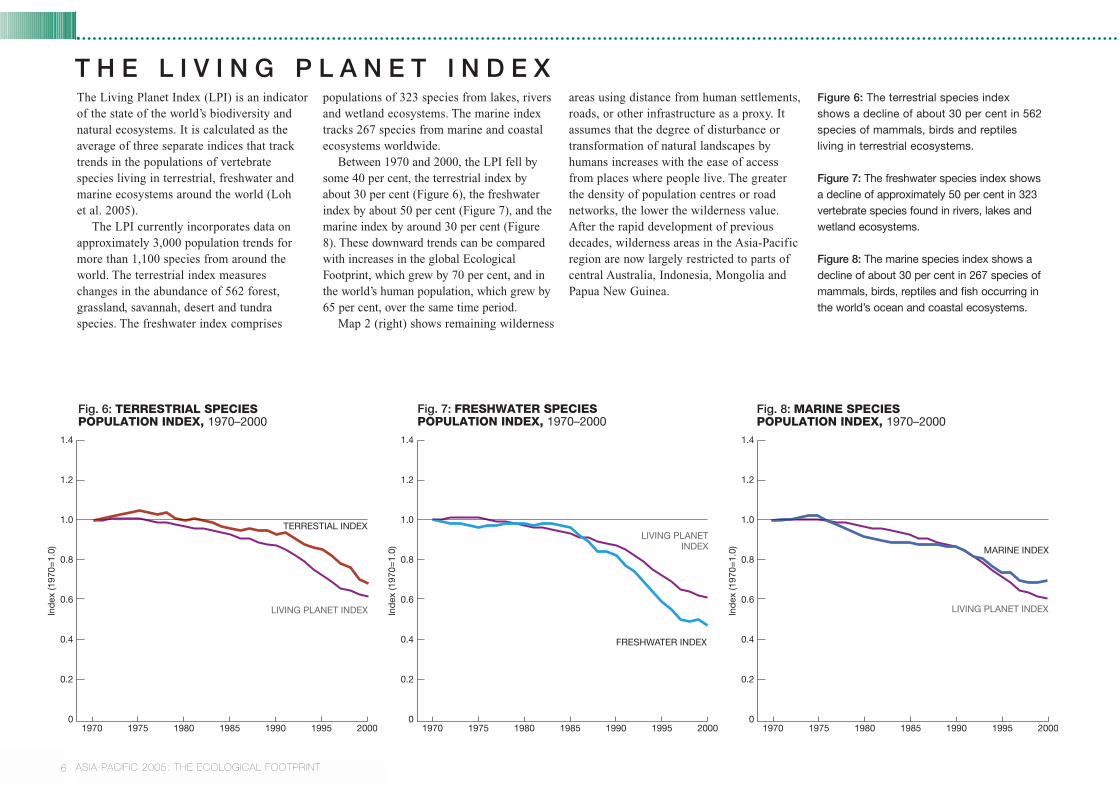
The Living Planet Index (LPI) is an indicatorof the state of the world’s biodiversity andnatural ecosystems. It is calculated as theaverage of three separate indices that tracktrends in the populations of vertebratespecies living in terrestrial, freshwater andmarine ecosystems around the world (Loh et al. 2005).
The LPI currently incorporates data onapproximately 3,000 population trends formore than 1,100 species from around theworld. The terrestrial index measureschanges in the abundance of 562 forest,grassland, savannah, desert and tundraspecies. The freshwater index comprises
populations of 323 species from lakes, riversand wetland ecosystems. The marine indextracks 267 species from marine and coastalecosystems worldwide.
Between 1970 and 2000, the LPI fell bysome 40 per cent, the terrestrial index byabout 30 per cent (Figure 6), the freshwaterindex by about 50 per cent (Figure 7), and themarine index by around 30 per cent (Figure8). These downward trends can be comparedwith increases in the global EcologicalFootprint, which grew by 70 per cent, and inthe world’s human population, which grew by65 per cent, over the same time period.
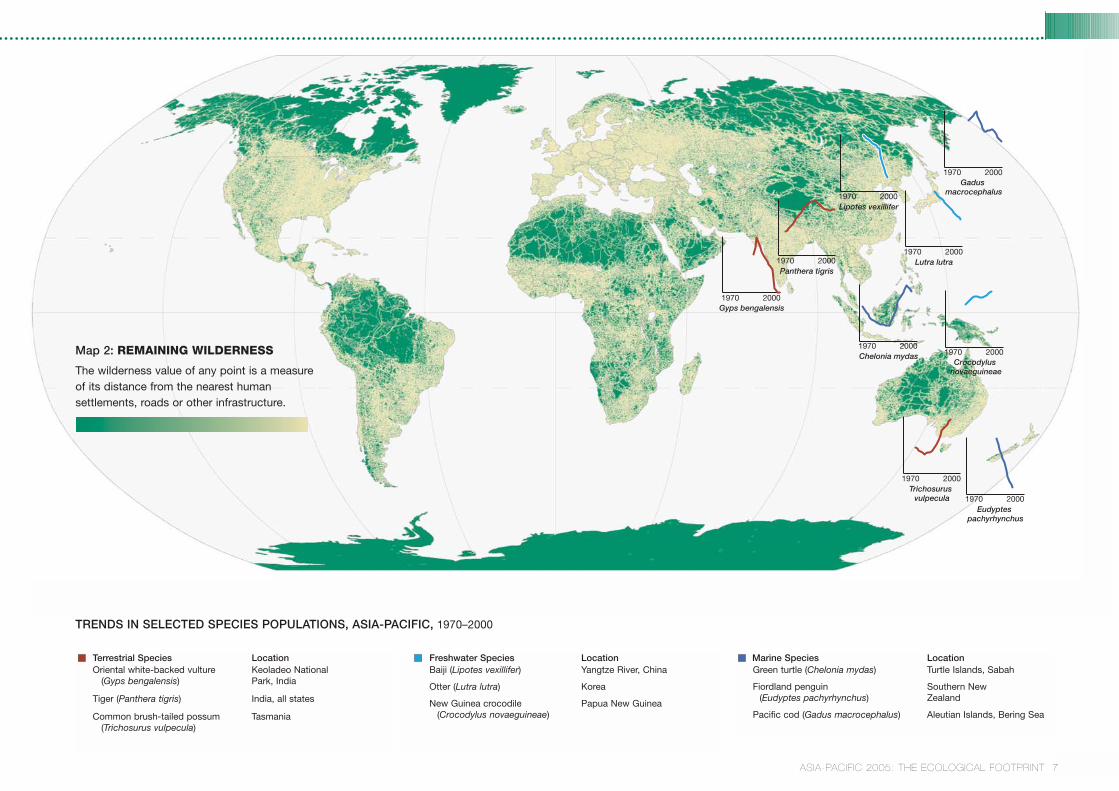
Map 2 (right) shows remaining wilderness
areas using distance from human settlements,roads, or other infrastructure as a proxy. Itassumes that the degree of disturbance ortransformation of natural landscapes byhumans increases with the ease of accessfrom places where people live. The greaterthe density of population centres or roadnetworks, the lower the wilderness value.After the rapid development of previousdecades, wilderness areas in the Asia-Pacificregion are now largely restricted to parts ofcentral Australia, Indonesia, Mongolia andPapua New Guinea.
Figure 6: The terrestrial species indexshows a decline of about 30 per cent in 562species of mammals, birds and reptilesliving in terrestrial ecosystems.
Figure 7: The freshwater species index showsa decline of approximately 50 per cent in 323vertebrate species found in rivers, lakes andwetland ecosystems.
Figure 8: The marine species index shows adecline of about 30 per cent in 267 species ofmammals, birds, reptiles and fish occurring inthe world’s ocean and coastal ecosystems.
Fig. 7: FRESHWATER SPECIESPOPULATION INDEX, 1970–2000
LIVING PLANETINDEX
FRESHWATER INDEX
1970 1975 1980 1985 1990 1995 2000
1.4
1.2
1.0
0.8
0.6
0.4
0.2
0
Fig. 8: MARINE SPECIESPOPULATION INDEX, 1970–2000
Fig. 6: TERRESTRIAL SPECIESPOPULATION INDEX, 1970–2000
Ind
ex (1
970=
1.0)
LIVING PLANET INDEX
TERRESTIAL INDEX
1970 1975 1980 1985 1990 1995 2000
1.4
1.2
1.0
0.8
0.6
0.4
0.2
0
Ind
ex (1
970=
1.0) MARINE INDEX
LIVING PLANET INDEX
1970 1975 1980 1985 1990 1995 2000
1.4
1.2
1.0
0.8
0.6
0.4
0.2
0In
dex
(197
0=1.
0)
7ASIA-PACIFIC 2005: THE ECOLOGICAL FOOTPRINT
TRENDS IN SELECTED SPECIES POPULATIONS, ASIA-PACIFIC, 1970–2000
Trichosurus vulpecula
1970 2000
Gyps bengalensis1970 2000
Lipotes vexillifer1970 2000
1970 2000Crocodylus
novaeguineae
Chelonia mydas1970 2000
D
Eudyptes pachyrhynchus
1970 2000
Map 2: REMAINING WILDERNESS
The wilderness value of any point is a measureof its distance from the nearest humansettlements, roads or other infrastructure.
Panthera tigris1970 2000 Lutra lutra
1970 2000
Gadus macrocephalus
1970 2000
Terrestrial Species Location Oriental white-backed vulture Keoladeo National
(Gyps bengalensis) Park, India
Tiger (Panthera tigris) India, all states
Common brush-tailed possum Tasmania(Trichosurus vulpecula)
Freshwater Species Location Baiji (Lipotes vexillifer) Yangtze River, China
Otter (Lutra lutra) Korea
New Guinea crocodile Papua New Guinea(Crocodylus novaeguineae)
Marine Species Location Green turtle (Chelonia mydas) Turtle Islands, Sabah
Fiordland penguin Southern New (Eudyptes pachyrhynchus) Zealand
Pacific cod (Gadus macrocephalus) Aleutian Islands, Bering Sea
8 ASIA-PACIFIC 2005: THE ECOLOGICAL FOOTPRINT
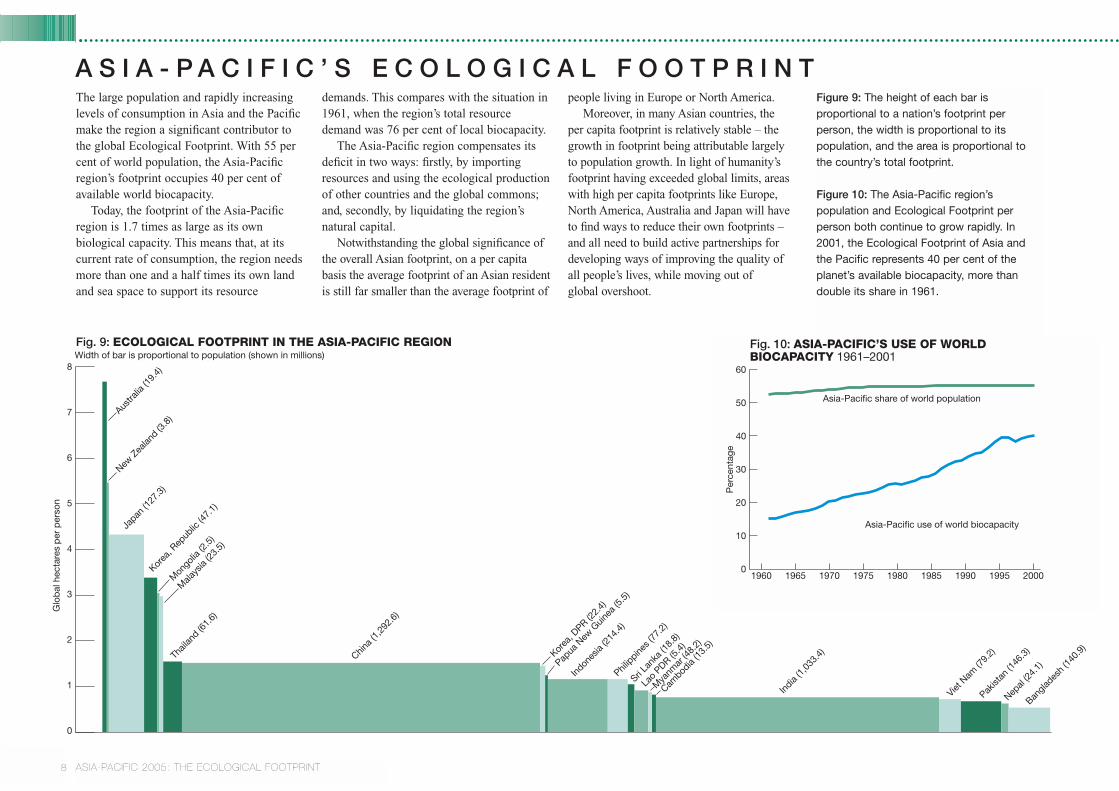
The large population and rapidly increasinglevels of consumption in Asia and the Pacificmake the region a significant contributor tothe global Ecological Footprint. With 55 percent of world population, the Asia-Pacificregion’s footprint occupies 40 per cent ofavailable world biocapacity.
Today, the footprint of the Asia-Pacificregion is 1.7 times as large as its ownbiological capacity. This means that, at itscurrent rate of consumption, the region needsmore than one and a half times its own landand sea space to support its resource
demands. This compares with the situation in1961, when the region’s total resourcedemand was 76 per cent of local biocapacity.
The Asia-Pacific region compensates itsdeficit in two ways: firstly, by importingresources and using the ecological productionof other countries and the global commons;and, secondly, by liquidating the region’snatural capital.
Notwithstanding the global significance ofthe overall Asian footprint, on a per capitabasis the average footprint of an Asian residentis still far smaller than the average footprint of
people living in Europe or North America.Moreover, in many Asian countries, the
per capita footprint is relatively stable – thegrowth in footprint being attributable largely to population growth. In light of humanity’sfootprint having exceeded global limits, areaswith high per capita footprints like Europe,North America, Australia and Japan will haveto find ways to reduce their own footprints –and all need to build active partnerships fordeveloping ways of improving the quality of all people’s lives, while moving out of global overshoot.
Figure 9: The height of each bar isproportional to a nation’s footprint perperson, the width is proportional to itspopulation, and the area is proportional tothe country’s total footprint.
Figure 10: The Asia-Pacific region’spopulation and Ecological Footprint perperson both continue to grow rapidly. In2001, the Ecological Footprint of Asia andthe Pacific represents 40 per cent of theplanet’s available biocapacity, more thandouble its share in 1961.
A S I A - P A C I F I C ’ S E C O L O G I C A L F O O T P R I N T
Fig. 9: ECOLOGICAL FOOTPRINT IN THE ASIA-PACIFIC REGION
8
7
6
5
4
3
2
1
0
Glo
bal
hec
tare
s p
er p
erso
n
Austra
lia (1
9.4)
New Z
ealan
d (3.8
)
Japan
(127
.3)
Korea
, Rep
ublic
(47.
1)
Thail
and (6
1.6)
China (
1,29
2.6)
Korea
, DPR (2
2.4)
Papua
New
Guin
ea (5
.5)
Indon
esia
(214.
4)Phil
ippines (
77.2
)
Sri La
nka (
18.8
)
Lao
PDR (5.4
)
Mya
nmar
(48.
2)
Cambod
ia (13
.5)
India
(1,03
3.4)
Viet N
am (7
9.2)
Pakist
an (1
46.3
)
Nepal
(24.1
)Ban
glades
h (14
0.9)
Width of bar is proportional to population (shown in millions)
Mala
ysia
(23.5
)
Mon
golia
(2.5
)
60
50
40
30
20
10
0
Per
cent
age
1970 197519651960 1980 1985 1990 1995 2000
Fig. 10: ASIA-PACIFIC’S USE OF WORLD BIOCAPACITY 1961–2001
Asia-Pacific use of world biocapacity
Asia-Pacific share of world population
9ASIA-PACIFIC 2005: THE ECOLOGICAL FOOTPRINT
Map 3: BIOCAPACITY, CHINA,2001 (selected countries)
1
2
3
45
67
8
9
101112
13
14
15
16
17
18
19
20
21
22
23
24
25
EXPORT OF
Map 4: EXPORT OF BIOCAPACITY, THAILAND,2001 (selected countries)
1
2
3
23
5
67
8
9
104
12
13
14
15
16
17
18
19
20
21
2211
24
25
Map 5: EXPORT OF BIOCAPACITY, JAPAN,2001 (selected countries)
1
2
3
115
67
8
9
104 12
13
14
15
16
17
18
19
20
21
22
23
24
25
EXPORT
From China Japan Thailand
To
1 Australia 2.5 2.1 1.4
2 Brazil 0.9 0.7 0.2
3 Canada 2.8 1.8 0.8
4 China – 6.5 6.5
5 Egypt 0.5 0.2 0.2
6 France 3.0 1.7 0.9
7 Germany 7.3 4.3 1.7
8 India 1.4 0.5 0.5
9 Indonesia 1.6 1.8 1.5
10 Italy 2.7 1.3 0.7
11 Japan 25.1 – 10.6
12 Korea, Rep. 7.1 6.9 1.3
13 Malaysia 2.2 3.0 2.9
EXPORT
From China Japan Thailand
To
14 Mexico 1.3 1.1 0.5
15 Netherlands 4.7 3.2 2.2
16 New Zealand 0.3 0.3 0.2
17 Nigeria 0.5 0.1 0.4
18 Russian Fed. 1.3 0.2 0.1
19 Saudi Arabia 0.8 1.0 0.4
20 Singapore 4.3 4.0 5.6
21 South Africa 0.9 0.4 0.3
22 Spain 1.7 0.8 0.6
23 Thailand 1.9 3.3 –
24 UK 6.2 3.3 2.5
25 USA 43.2 33.6 14.1
Numbers refer to map locations only.
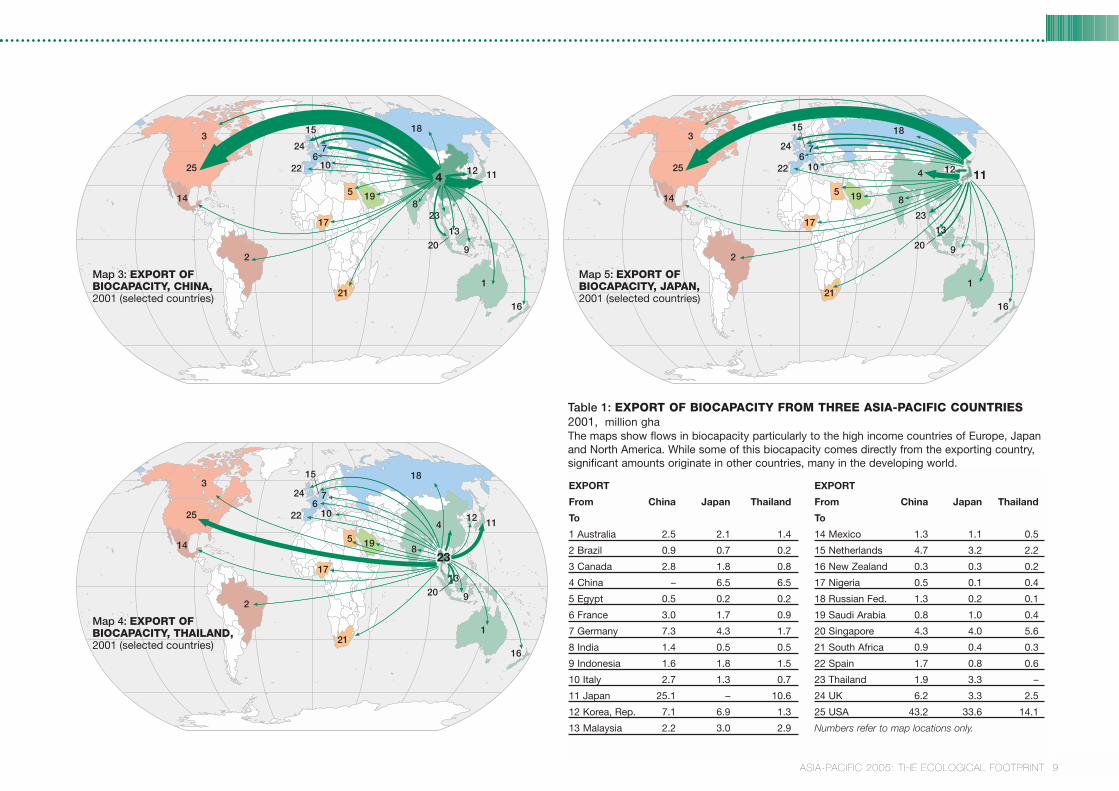
Table 1: EXPORT OF BIOCAPACITY FROM THREE ASIA-PACIFIC COUNTRIES2001, million ghaThe maps show flows in biocapacity particularly to the high income countries of Europe, Japanand North America. While some of this biocapacity comes directly from the exporting country,significant amounts originate in other countries, many in the developing world.
10
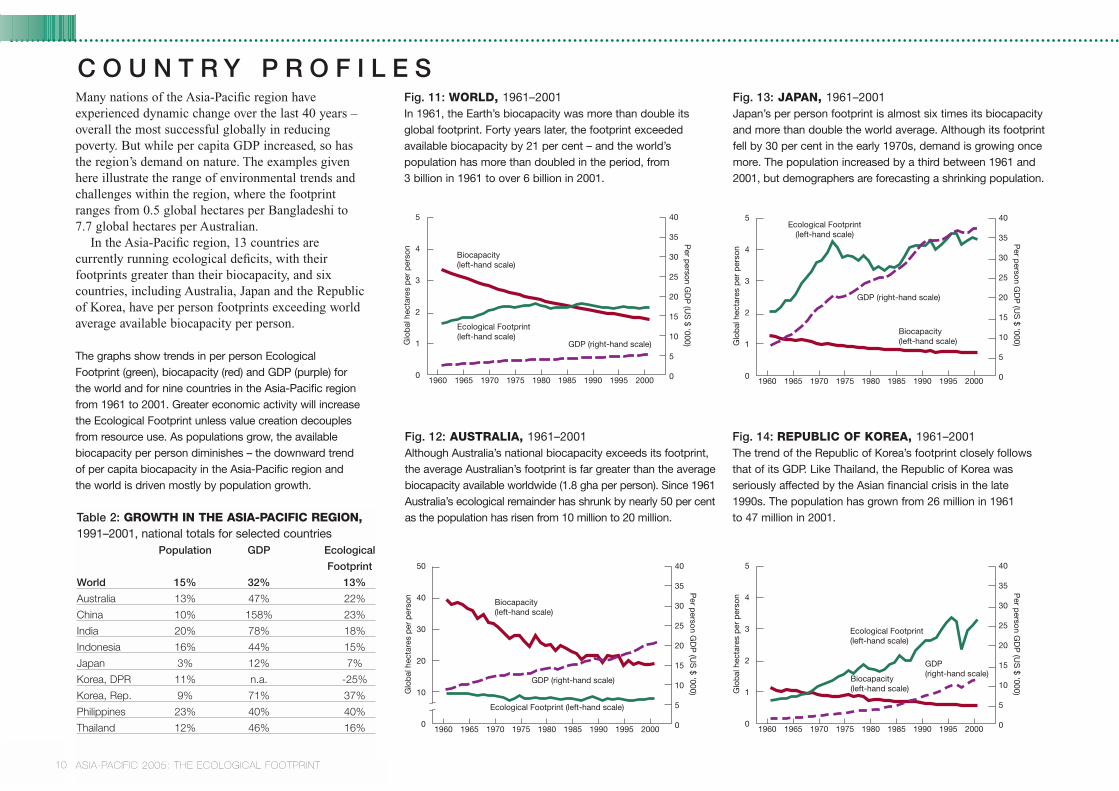
Many nations of the Asia-Pacific region haveexperienced dynamic change over the last 40 years –overall the most successful globally in reducingpoverty. But while per capita GDP increased, so hasthe region’s demand on nature. The examples givenhere illustrate the range of environmental trends andchallenges within the region, where the footprintranges from 0.5 global hectares per Bangladeshi to 7.7 global hectares per Australian.
In the Asia-Pacific region, 13 countries arecurrently running ecological deficits, with theirfootprints greater than their biocapacity, and sixcountries, including Australia, Japan and the Republicof Korea, have per person footprints exceeding worldaverage available biocapacity per person.
The graphs show trends in per person EcologicalFootprint (green), biocapacity (red) and GDP (purple) forthe world and for nine countries in the Asia-Pacific regionfrom 1961 to 2001. Greater economic activity will increasethe Ecological Footprint unless value creation decouplesfrom resource use. As populations grow, the availablebiocapacity per person diminishes – the downward trendof per capita biocapacity in the Asia-Pacific region andthe world is driven mostly by population growth.
C O U N T R Y P R O F I L E S
Table 2: GROWTH IN THE ASIA-PACIFIC REGION,1991–2001, national totals for selected countries
Population GDP Ecological
Footprint
World 15% 32% 13%
Australia 13% 47% 22%
China 10% 158% 23%
India 20% 78% 18%
Indonesia 16% 44% 15%
Japan 3% 12% 7%
Korea, DPR 11% n.a. -25%
Korea, Rep. 9% 71% 37%
Philippines 23% 40% 40%
Thailand 12% 46% 16%
Fig. 11: WORLD, 1961–2001 In 1961, the Earth’s biocapacity was more than double itsglobal footprint. Forty years later, the footprint exceededavailable biocapacity by 21 per cent – and the world’spopulation has more than doubled in the period, from 3 billion in 1961 to over 6 billion in 2001.
Fig. 14: REPUBLIC OF KOREA, 1961–2001The trend of the Republic of Korea’s footprint closely followsthat of its GDP. Like Thailand, the Republic of Korea wasseriously affected by the Asian financial crisis in the late 1990s. The population has grown from 26 million in 1961 to 47 million in 2001.
Fig. 12: AUSTRALIA, 1961–2001Although Australia’s national biocapacity exceeds its footprint,the average Australian’s footprint is far greater than the averagebiocapacity available worldwide (1.8 gha per person). Since 1961Australia’s ecological remainder has shrunk by nearly 50 per centas the population has risen from 10 million to 20 million.
1970 197519651960 1980 1985 1990 1995 2000
Glo
bal
hec
tare
s p
er p
erso
n
GDP (right-hand scale)
Biocapacity(left-hand scale)
Ecological Footprint(left-hand scale)
Per p
erson GD
P (U
S $ '000)
5
4
3
2
1
0
40
35
30
25
20
15
10
5
0
1970 197519651960 1980 1985 1990 1995 2000
Glo
bal
hec
tare
s p
er p
erso
n
GDP (right-hand scale)
Biocapacity(left-hand scale)
Ecological Footprint (left-hand scale)
Per p
erson GD
P (U
S $ '000)
50
40
30
20
10
0
40
35
30
25
20
15
10
5
0
1970 197519651960 1980 1985 1990 1995 2000
Glo
bal
hec
tare
s p
er p
erso
n
GDP (right-hand scale)
Biocapacity(left-hand scale)
Ecological Footprint(left-hand scale)
5
4
3
2
1
0
40
35
30
25
20
15
10
5
0
Per p
erson GD
P (U
S $ '000)
Fig. 13: JAPAN, 1961–2001Japan’s per person footprint is almost six times its biocapacityand more than double the world average. Although its footprintfell by 30 per cent in the early 1970s, demand is growing oncemore. The population increased by a third between 1961 and2001, but demographers are forecasting a shrinking population.
1970 197519651960 1980 1985 1990 1995 2000G
lob
al h
ecta
res
per
per
son
GDP (right-hand scale)
Biocapacity(left-hand scale)
Ecological Footprint(left-hand scale)
Per p
erson GD
P (U
S $ '000)
5
4
3
2
1
0
40
35
30
25
20
15
10
5
0
ASIA-PACIFIC 2005: THE ECOLOGICAL FOOTPRINT
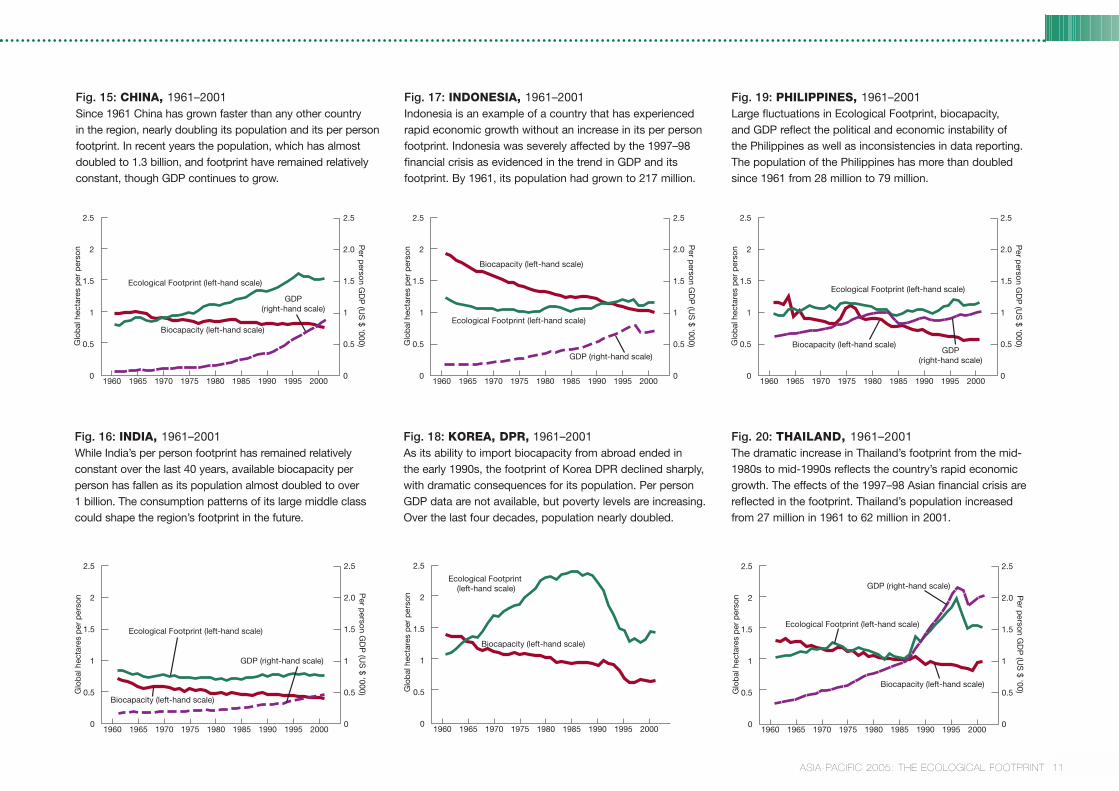
Fig. 20: THAILAND, 1961–2001The dramatic increase in Thailand’s footprint from the mid-1980s to mid-1990s reflects the country’s rapid economicgrowth. The effects of the 1997–98 Asian financial crisis arereflected in the footprint. Thailand’s population increased from 27 million in 1961 to 62 million in 2001.
Fig. 15: CHINA, 1961–2001Since 1961 China has grown faster than any other country in the region, nearly doubling its population and its per personfootprint. In recent years the population, which has almostdoubled to 1.3 billion, and footprint have remained relativelyconstant, though GDP continues to grow.
Fig. 16: INDIA, 1961–2001While India’s per person footprint has remained relativelyconstant over the last 40 years, available biocapacity perperson has fallen as its population almost doubled to over 1 billion. The consumption patterns of its large middle classcould shape the region’s footprint in the future.
Fig. 17: INDONESIA, 1961–2001Indonesia is an example of a country that has experiencedrapid economic growth without an increase in its per personfootprint. Indonesia was severely affected by the 1997–98financial crisis as evidenced in the trend in GDP and itsfootprint. By 1961, its population had grown to 217 million.
Fig. 18: KOREA, DPR, 1961–2001As its ability to import biocapacity from abroad ended in the early 1990s, the footprint of Korea DPR declined sharply,with dramatic consequences for its population. Per person GDP data are not available, but poverty levels are increasing.Over the last four decades, population nearly doubled.
Fig. 19: PHILIPPINES, 1961–2001Large fluctuations in Ecological Footprint, biocapacity, and GDP reflect the political and economic instability of the Philippines as well as inconsistencies in data reporting.The population of the Philippines has more than doubled since 1961 from 28 million to 79 million.
1970 197519651960 1980 1985 1990 1995 2000
Glo
bal
hec
tare
s p
er p
erso
n
GDP(right-hand scale)
Biocapacity (left-hand scale)
Ecological Footprint (left-hand scale)
Per p
erson GD
P (U
S $ '000)
2.5
2
1.5
1
0.5
0
2.5
2.0
1.5
1
0.5
0
1970 197519651960 1980 1985 1990 1995 2000
Glo
bal
hec
tare
s p
er p
erso
n
GDP (right-hand scale)
Biocapacity (left-hand scale)
Ecological Footprint (left-hand scale)
2.5
2
1.5
1
0.5
0
Per p
erson GD
P (U
S $ '000)
2.5
2.0
1.5
1
0.5
0
1970 197519651960 1980 1985 1990 1995 2000
Glo
bal
hec
tare
s p
er p
erso
n
GDP (right-hand scale)
Biocapacity (left-hand scale)
Ecological Footprint (left-hand scale)
2.5
2
1.5
1
0.5
0
Per p
erson GD
P (U
S $ '000)
2.5
2.0
1.5
1
0.5
0
1970 197519651960 1980 1985 1990 1995 2000
Glo
bal
hec
tare
s p
er p
erso
n
Biocapacity (left-hand scale)
Ecological Footprint (left-hand scale)
2.5
2
1.5
1
0.5
0
1970 197519651960 1980 1985 1990 1995 2000
Glo
bal
hec
tare
s p
er p
erso
n
GDP(right-hand scale)
Biocapacity (left-hand scale)
Ecological Footprint (left-hand scale)
2.5
2
1.5
1
0.5
0
Per p
erson GD
P (U
S $ '000)
2.5
2.0
1.5
1
0.5
0
1970 197519651960 1980 1985 1990 1995 2000G
lob
al h
ecta
res
per
per
son
GDP (right-hand scale)
Biocapacity (left-hand scale)
Ecological Footprint (left-hand scale)
Per p
erson GD
P (U
S $ '00)
2.5
2
1.5
1
0.5
0
2.5
2.0
1.5
1
0.5
0
11ASIA-PACIFIC 2005: THE ECOLOGICAL FOOTPRINT
12 ASIA-PACIFIC 2005: THE ECOLOGICAL FOOTPRINT
At the turn of the 21st century, the EcologicalFootprints of both the Asia-Pacific region andthe world exceeded their available biocapacity.As in other regions, Asia and the Pacific ispartially financing this overshoot by relying onbiological capacity from outside the region.
At the global level, however, there are noadditional planets from which to importbiocapacity. Being in global overshootinevitably means depleting the Earth’secological capital, resulting in an overalldeterioration of global ecosystems. The currentstate of overshoot will have to be eliminated forthe world to reach sustainability. “One PlanetLiving” is an opportunity for countries toestablish a sustainable, prosperous future for thelong term. Some of the changes needed to meet
this goal will involve increasing available globalbiocapacity. The balance must come fromreducing the total global footprint. Thesereductions will have to go hand in hand withlarge portions of humanity increasing theirfootprint to meet their basic needs. Living up to this double challenge requires courageousleadership right across the globe.
Towards One Planet Living Four factors determine the gap between thefootprint and biocapacity:
1. Biocapacity. One challenge is to increase, orat least maintain, biocapacity. This meansprotecting soil from erosion and degradation,and preserving cropland for agriculture. It
involves protecting river basins, wetlands,and watersheds to secure freshwatersupplies, and maintaining healthy forestsand fisheries. It includes taking action toprotect ecosystems from climate changeand eliminating the use of toxic chemicalsthat degrade ecosystems.
2. Resource efficiency in producing goodsand services. Over the past 40 years,technological progress has increased theamount of goods and services that can beproduced from a given amount of ecologicalresources. As a result, the averageEcological Footprint per person has stayedrelatively constant. Despite these importantefficiency gains, the total global Ecological
Footprint has still grown (Pacala andSocolow 2004).
3. Consumption of goods and services perperson. The potential for reducing per personconsumption depends in part on the person’sincome level. People living at or belowsubsistence may need to increase theirabsolute consumption levels to move out ofpoverty. Wealthy individuals, however, couldcut their consumption of goods and serviceswith large footprints without seriouslycompromising the quality of their lives.
4. Size of the population. Addressingpopulation growth will be especially criticalfor the Asia-Pacific region, which is already
L I V I N G O N O N E P L A N E T
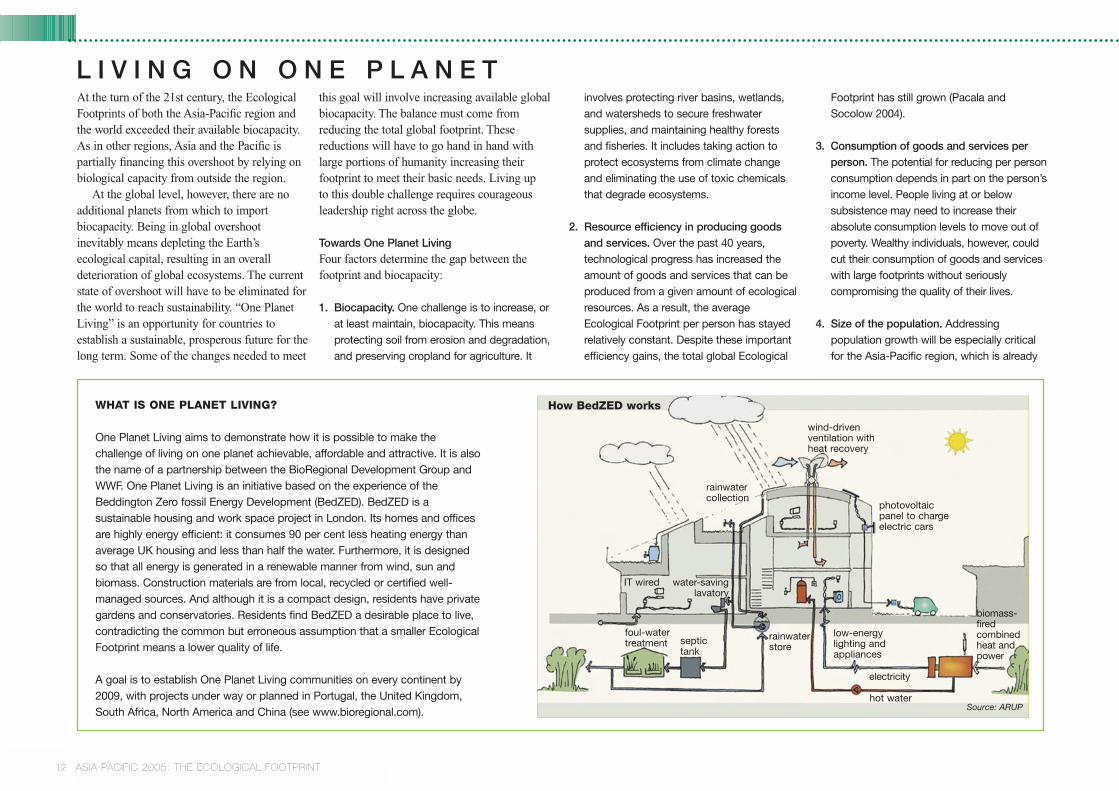
WHAT IS ONE PLANET LIVING?
One Planet Living aims to demonstrate how it is possible to make thechallenge of living on one planet achievable, affordable and attractive. It is alsothe name of a partnership between the BioRegional Development Group andWWF. One Planet Living is an initiative based on the experience of theBeddington Zero fossil Energy Development (BedZED). BedZED is asustainable housing and work space project in London. Its homes and officesare highly energy efficient: it consumes 90 per cent less heating energy thanaverage UK housing and less than half the water. Furthermore, it is designedso that all energy is generated in a renewable manner from wind, sun andbiomass. Construction materials are from local, recycled or certified well-managed sources. And although it is a compact design, residents have privategardens and conservatories. Residents find BedZED a desirable place to live,contradicting the common but erroneous assumption that a smaller EcologicalFootprint means a lower quality of life.
A goal is to establish One Planet Living communities on every continent by2009, with projects under way or planned in Portugal, the United Kingdom,South Africa, North America and China (see www.bioregional.com).
rainwater collection
wind-drivenventilation withheat recovery
photovoltaicpanel to chargeelectric cars
low-energy lighting andappliances
electricity
hot waterSource: ARUP
rainwaterstore
water-savinglavatory
IT wired
septictank
foul-watertreatment
biomass-firedcombinedheat andpower
How BedZED works
13ASIA-PACIFIC 2005: THE ECOLOGICAL FOOTPRINT
Figure 21: One Planet Living – living well,within the means of nature: the globalchallenge is how to move all countries intothe ‘sustainable development’ quadrant(Boutaud 2002).
home to half the world’s people. Populationgrowth can be reduced by supportingmeasures that lead to families choosing tohave fewer children. Offering women bettereducation, economic opportunities andhealth care are three proven approaches.
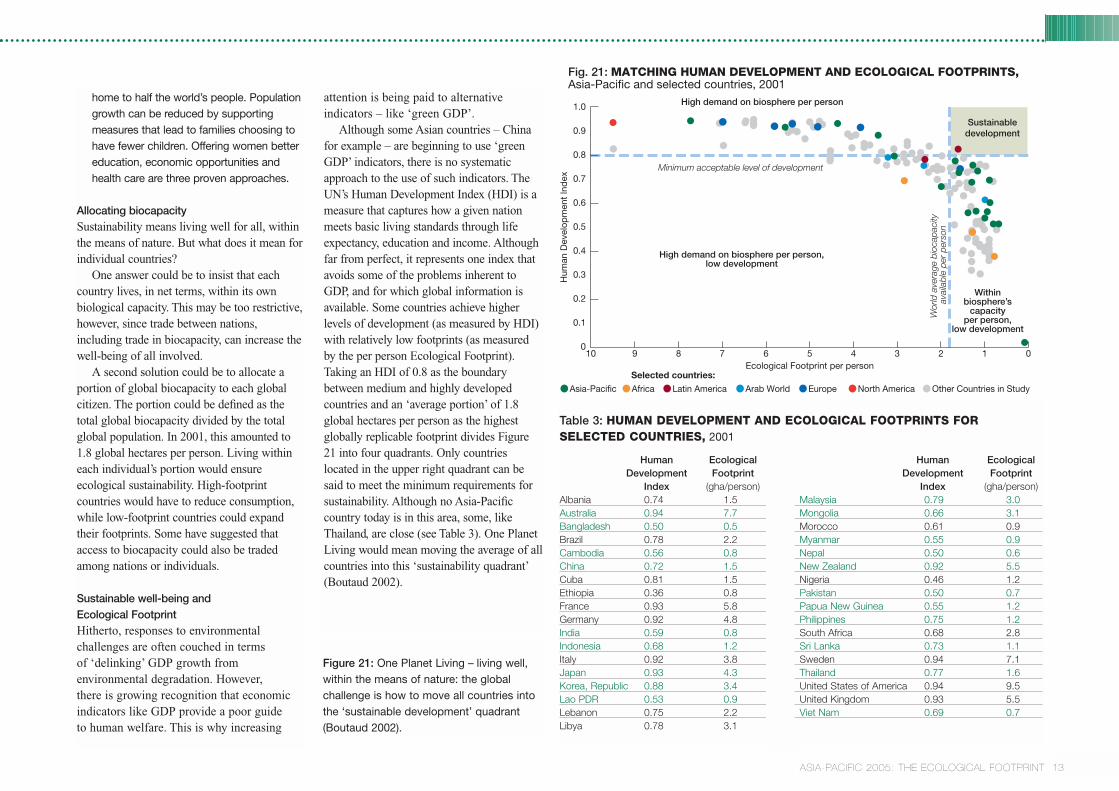
Allocating biocapacity Sustainability means living well for all, withinthe means of nature. But what does it mean forindividual countries?
One answer could be to insist that eachcountry lives, in net terms, within its ownbiological capacity. This may be too restrictive,however, since trade between nations,including trade in biocapacity, can increase thewell-being of all involved.
A second solution could be to allocate aportion of global biocapacity to each globalcitizen. The portion could be defined as thetotal global biocapacity divided by the totalglobal population. In 2001, this amounted to1.8 global hectares per person. Living withineach individual’s portion would ensureecological sustainability. High-footprintcountries would have to reduce consumption,while low-footprint countries could expandtheir footprints. Some have suggested thataccess to biocapacity could also be tradedamong nations or individuals.
Sustainable well-being and Ecological FootprintHitherto, responses to environmentalchallenges are often couched in terms of ‘delinking’ GDP growth fromenvironmental degradation. However, there is growing recognition that economicindicators like GDP provide a poor guide to human welfare. This is why increasing
attention is being paid to alternativeindicators – like ‘green GDP’.
Although some Asian countries – Chinafor example – are beginning to use ‘greenGDP’ indicators, there is no systematicapproach to the use of such indicators. TheUN’s Human Development Index (HDI) is ameasure that captures how a given nationmeets basic living standards through lifeexpectancy, education and income. Althoughfar from perfect, it represents one index thatavoids some of the problems inherent toGDP, and for which global information isavailable. Some countries achieve higherlevels of development (as measured by HDI)with relatively low footprints (as measuredby the per person Ecological Footprint).Taking an HDI of 0.8 as the boundarybetween medium and highly developedcountries and an ‘average portion’ of 1.8global hectares per person as the highestglobally replicable footprint divides Figure21 into four quadrants. Only countrieslocated in the upper right quadrant can besaid to meet the minimum requirements forsustainability. Although no Asia-Pacificcountry today is in this area, some, likeThailand, are close (see Table 3). One PlanetLiving would mean moving the average of allcountries into this ‘sustainability quadrant’(Boutaud 2002).
Table 3: HUMAN DEVELOPMENT AND ECOLOGICAL FOOTPRINTS FORSELECTED COUNTRIES, 2001
Human Ecological Human Ecological Development Footprint Development Footprint
Index (gha/person) Index (gha/person)Albania 0.74 1.5 Malaysia 0.79 3.0Australia 0.94 7.7 Mongolia 0.66 3.1Bangladesh 0.50 0.5 Morocco 0.61 0.9Brazil 0.78 2.2 Myanmar 0.55 0.9Cambodia 0.56 0.8 Nepal 0.50 0.6China 0.72 1.5 New Zealand 0.92 5.5Cuba 0.81 1.5 Nigeria 0.46 1.2Ethiopia 0.36 0.8 Pakistan 0.50 0.7France 0.93 5.8 Papua New Guinea 0.55 1.2Germany 0.92 4.8 Philippines 0.75 1.2India 0.59 0.8 South Africa 0.68 2.8Indonesia 0.68 1.2 Sri Lanka 0.73 1.1Italy 0.92 3.8 Sweden 0.94 7.1Japan 0.93 4.3 Thailand 0.77 1.6Korea, Republic 0.88 3.4 United States of America 0.94 9.5Lao PDR 0.53 0.9 United Kingdom 0.93 5.5Lebanon 0.75 2.2 Viet Nam 0.69 0.7Libya 0.78 3.1
Minimum acceptable level of development
Ecological Footprint per personSelected countries:
8 7910 6 5 4 3 2 1 0
1.0
0.9
0.8
0.7
0.6
0.5
0.4
0.3
0.2
0.1
0
Hum
an D
evel
opm
ent
Ind
ex
Fig. 21: MATCHING HUMAN DEVELOPMENT AND ECOLOGICAL FOOTPRINTS,Asia-Pacific and selected countries, 2001
Wor
ld a
vera
ge b
ioca
paci
ty
avai
labl
e pe
r pe
rson
High demand on biosphere per person,low development
High demand on biosphere per person
Sustainabledevelopment
Withinbiosphere’s
capacityper person,
low development
•Asia-Pacific •Africa •Latin America •Arab World •Europe •North America •Other Countries in Study
14 ASIA-PACIFIC 2005: THE ECOLOGICAL FOOTPRINT
A S I A - P A C I F I C : T R A N S F O R M A T I O N T O S U S T A I N A B I L I T YThe Asia-Pacific region wants both tocontinue to develop its economies and to becompetitive with the rest of the world inthe short and the long terms. Economicdevelopment at the expense of continueddepletion or degradation of naturalresources and the environment, however, is not sustainable. This list identifiespossible options that can reduce theregion’s demand on nature and improvedevelopment options for the region’s 3.4 billion people. Globally, the countriesof Europe and North America must takesubstantial action to reduce their footprints. Asia-Pacific countries arerightly focused on developing theiremerging competitive economies, but they may not succeed withoutmaintaining their ecological assets.
Regional security and global collaborationEffective management of natural resourcesand reduction of environmental degradationthat are transboundary in nature cancontribute to ‘regionalization’ and improvenational security. The progress made inlifting the region’s poor out of poverty needs to recognize the strong links betweenpoverty reduction and environmental quality.Tackling global environmental problems willrequire greater collaboration between statesand that countries in the region take on agreater global leadership role by:● Increasing efforts to reduce poverty both
within low-income countries andeconomically marginalized areas,especially among the rural poor, byensuring that the environmental base onwhich they depend is not depleted.
● Encouraging bilateral and multilateralinitiatives through which South–Southcountries, within and beyond the region,could create a ‘sustainable axis’. Under such initiatives energy efficiencysolutions from one country could go one way, with systems for renewableenergy travelling in the other, dependingon competitive advantages andsustainable strategies.
● Improving regional natural resourcemanagement, for instance throughincreased and improved regionalframeworks, such as the ASEAN Regional Action Plan on Trade in WildFauna and Flora 2005–2010. Thiscollaboration on policy development and law enforcement could be extendedthroughout the region and greatly increase the sustainable management of the region’s wildlife trade.
● Ensuring best practice in integrated riverbasin management supports the needs of people and maintains ecosystemservices, as well as biodiversity, andpromotes collaboration between countries using a ‘whole of river’ approach to water management.
● Challenging the industrial countries tosupport ‘leaders’ in sustainability within theregion through different means such as public procurement, regulation andcooperation, for example by twinningsustainable cities between North andSouth that support a two-way flow of ideas and innovations.
● Using international fora to plan strategiesthat avoid technological transfers andleapfrog strategies from industrializedcountries and multinationals that leadcountries in Asia and the Pacific intounsustainable development patterns.
Providing affordable, reliable andenvironmentally friendly energy to allEnvironmental imperatives – such as tackling climate change and acid rain –coupled with social and economic factorsincluding increasing fossil fuel prices, import-dependency risks and the provision of affordable energy services to the poor,provide a unique opportunity for a shift to sustainable energy. Factors that could contribute to making this change include:● Switching the sectoral focus from energy
supply to provision of energy services can unlock huge efficiency potential across the region. Much can be learnedfrom existing initiatives – Japan’s economyis already almost three times as energyefficient as that of the United States ofAmerica and almost eight times as efficientas China.
● Internalizing environmental costs usingeconomic instruments – such as sulphurand carbon emissions trading and newregulations such as improved and enforcedpollution controls and renewable energytargets – will drive new markets for cleantechnologies. Asia-Pacific region is alreadymoving forward: China has the world’smost ambitious national renewable energytarget, India is the fifth largest generator of
wind power in the world while thePhilippines is the world’s second largestgenerator of geothermal energy.
● Advancing innovation and know-how insustainable energy technologies within theAsia-Pacific region using public-privatepartnerships. Such innovation could drawon experience within the region in suchcountries as China, India and Japan, aswell as from the rest of the world.
● New models of participation in energysector decision making, involvingcollaboration between consumerorganizations, local government, localcommunities and the private sector, canprovide new methods of governance and new business models to support the technology shift.
● Substantial and long-term investment inenergy systems that reduce the region’sdependency on expensive fossil fuelimports. This is important both forcountries that will struggle to compete onglobal markets for higher priced fuels andfor those, such as India and China, withenormous oil requirements to meet thecurrent and future demand from industryand their growing consumer societies.
Provide accurate and relevant informationfor decision makersTrack all assets (economic, social andenvironmental) in order to better monitorconsequences of present choices. Suchoptions include:● Strengthening the ability of national
ASIA-PACIFIC 2005: THE ECOLOGICAL FOOTPRINT 15
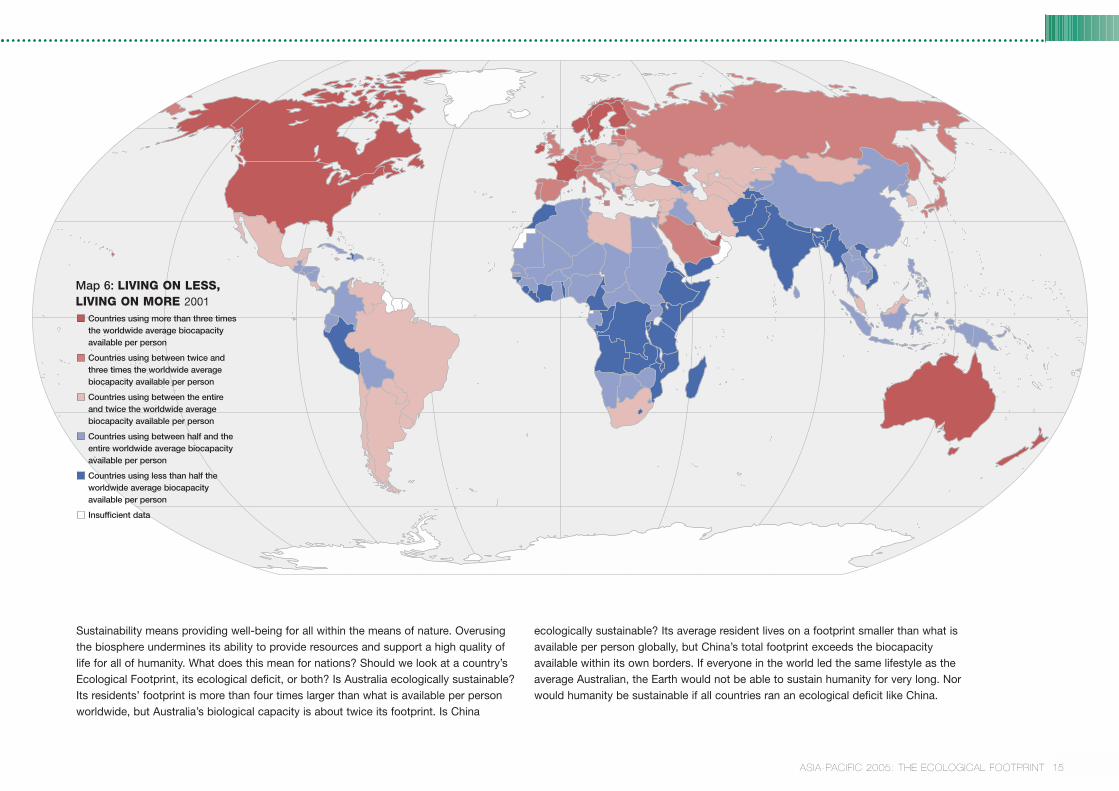
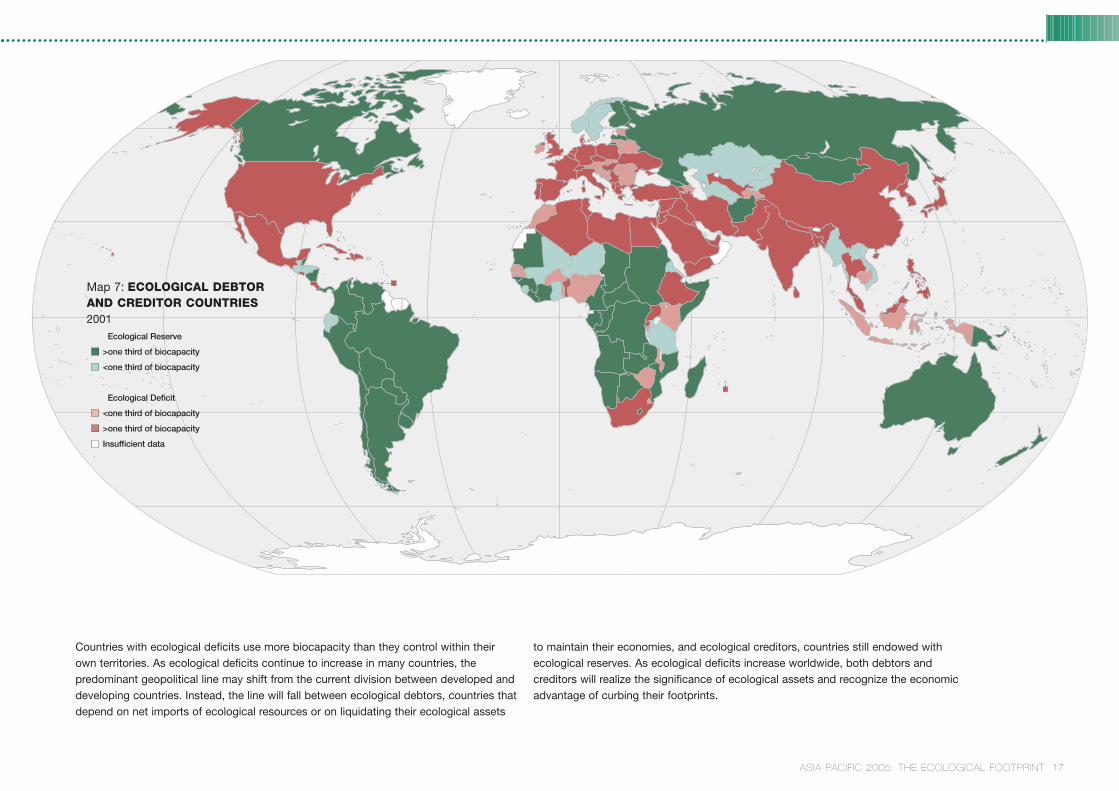
Sustainability means providing well-being for all within the means of nature. Overusingthe biosphere undermines its ability to provide resources and support a high quality oflife for all of humanity. What does this mean for nations? Should we look at a country’sEcological Footprint, its ecological deficit, or both? Is Australia ecologically sustainable?Its residents’ footprint is more than four times larger than what is available per personworldwide, but Australia’s biological capacity is about twice its footprint. Is China
ecologically sustainable? Its average resident lives on a footprint smaller than what isavailable per person globally, but China’s total footprint exceeds the biocapacityavailable within its own borders. If everyone in the world led the same lifestyle as theaverage Australian, the Earth would not be able to sustain humanity for very long. Norwould humanity be sustainable if all countries ran an ecological deficit like China.
Map 6: LIVING ON LESS, LIVING ON MORE 2001
Countries using more than three timesthe worldwide average biocapacityavailable per person
Countries using between twice andthree times the worldwide averagebiocapacity available per person
Countries using between the entire and twice the worldwide averagebiocapacity available per person
Countries using between half and theentire worldwide average biocapacityavailable per person
Countries using less than half theworldwide average biocapacityavailable per person
Insufficient data
16 ASIA-PACIFIC 2005: THE ECOLOGICAL FOOTPRINT
governments and regional institutions tokeep track of their demand on andavailability of biological capacity.
● Providing a better quality and quantity ofinformation in the media. Governmentsand companies will not receiveappropriate signals from citizens and consumers unless the public is well informed of the impact of theirchoices and purchasing decisions.
● Broadening the use of labelling andcertification standards, for example theForest Stewardship Council (FSC) and theMarine Stewardship Council (MSC), toallow customers to make choices aboutthe products they buy, reduce theirindividual footprints and support moresustainable resource use.
● Encouraging wide use of corporate socialresponsibility (CSR) with better corporateenvironmental reporting to show whichcompanies are making efforts to becomesustainable, and how.
● Measuring and reporting on morecomprehensive indicators of social,economic and ecological performance ingovernments to complement existingeconomic indicators such as GDP, tradebalance and rate of inflation. Examplesinclude green GDP in China, and grossdomestic happiness in Bhutan.
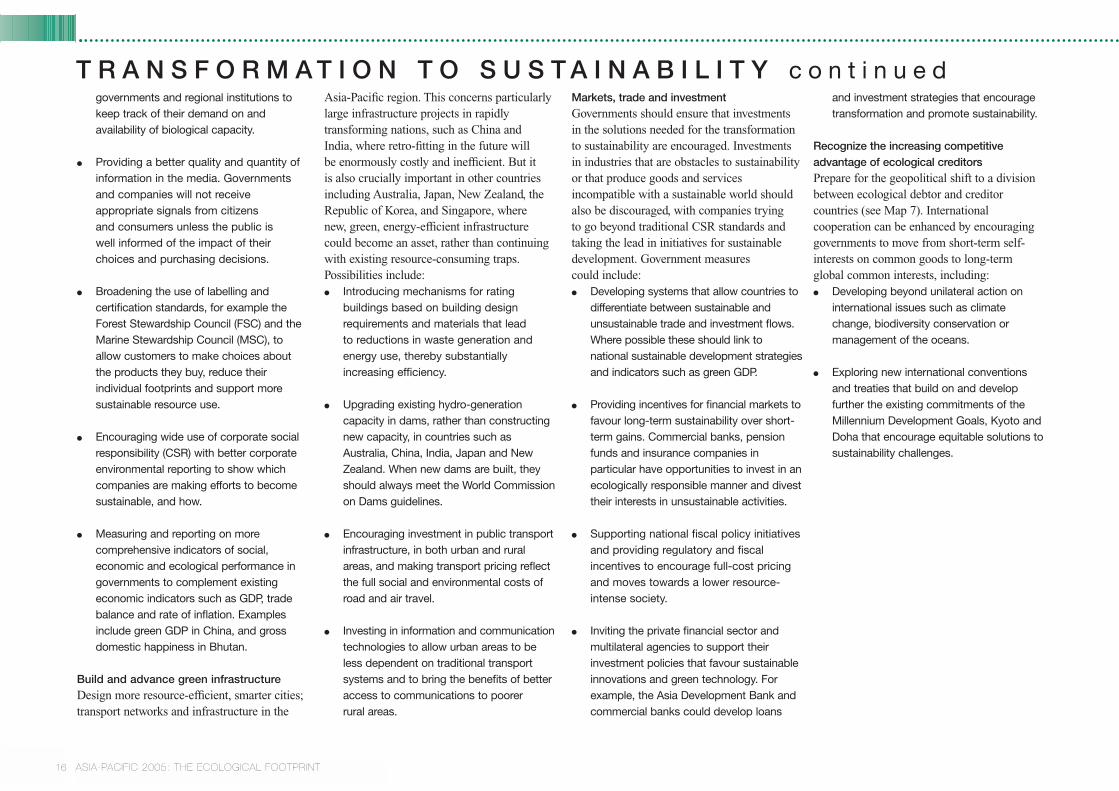
Build and advance green infrastructureDesign more resource-efficient, smarter cities;transport networks and infrastructure in the
T R A N S F O R M A T I O N T O S U S T A I N A B I L I T Y c o n t i n u e dAsia-Pacific region. This concerns particularlylarge infrastructure projects in rapidlytransforming nations, such as China and India, where retro-fitting in the future will be enormously costly and inefficient. But it is also crucially important in other countriesincluding Australia, Japan, New Zealand, theRepublic of Korea, and Singapore, where new, green, energy-efficient infrastructurecould become an asset, rather than continuingwith existing resource-consuming traps.Possibilities include:● Introducing mechanisms for rating
buildings based on building designrequirements and materials that lead to reductions in waste generation andenergy use, thereby substantiallyincreasing efficiency.
● Upgrading existing hydro-generationcapacity in dams, rather than constructingnew capacity, in countries such asAustralia, China, India, Japan and NewZealand. When new dams are built, theyshould always meet the World Commissionon Dams guidelines.
● Encouraging investment in public transportinfrastructure, in both urban and ruralareas, and making transport pricing reflectthe full social and environmental costs ofroad and air travel.
● Investing in information and communicationtechnologies to allow urban areas to beless dependent on traditional transportsystems and to bring the benefits of betteraccess to communications to poorer rural areas.
Markets, trade and investmentGovernments should ensure that investmentsin the solutions needed for the transformationto sustainability are encouraged. Investmentsin industries that are obstacles to sustainabilityor that produce goods and servicesincompatible with a sustainable world shouldalso be discouraged, with companies trying to go beyond traditional CSR standards andtaking the lead in initiatives for sustainabledevelopment. Government measures could include:● Developing systems that allow countries to
differentiate between sustainable andunsustainable trade and investment flows.Where possible these should link tonational sustainable development strategiesand indicators such as green GDP.
● Providing incentives for financial markets tofavour long-term sustainability over short-term gains. Commercial banks, pensionfunds and insurance companies inparticular have opportunities to invest in anecologically responsible manner and divesttheir interests in unsustainable activities.
● Supporting national fiscal policy initiativesand providing regulatory and fiscalincentives to encourage full-cost pricingand moves towards a lower resource-intense society.
● Inviting the private financial sector andmultilateral agencies to support theirinvestment policies that favour sustainableinnovations and green technology. Forexample, the Asia Development Bank andcommercial banks could develop loans
and investment strategies that encouragetransformation and promote sustainability.
Recognize the increasing competitiveadvantage of ecological creditorsPrepare for the geopolitical shift to a divisionbetween ecological debtor and creditorcountries (see Map 7). Internationalcooperation can be enhanced by encouraginggovernments to move from short-term self-interests on common goods to long-termglobal common interests, including:● Developing beyond unilateral action on
international issues such as climatechange, biodiversity conservation ormanagement of the oceans.
● Exploring new international conventionsand treaties that build on and developfurther the existing commitments of theMillennium Development Goals, Kyoto andDoha that encourage equitable solutions tosustainability challenges.
17ASIA-PACIFIC 2005: THE ECOLOGICAL FOOTPRINT
Countries with ecological deficits use more biocapacity than they control within theirown territories. As ecological deficits continue to increase in many countries, thepredominant geopolitical line may shift from the current division between developed anddeveloping countries. Instead, the line will fall between ecological debtors, countries thatdepend on net imports of ecological resources or on liquidating their ecological assets
to maintain their economies, and ecological creditors, countries still endowed withecological reserves. As ecological deficits increase worldwide, both debtors andcreditors will realize the significance of ecological assets and recognize the economicadvantage of curbing their footprints.
Map 7: ECOLOGICAL DEBTORAND CREDITOR COUNTRIES2001
Ecological Reserve
>one third of biocapacity
<one third of biocapacity
Ecological Deficit
<one third of biocapacity
>one third of biocapacity
Insufficient data
18 ASIA-PACIFIC 2005: THE ECOLOGICAL FOOTPRINT
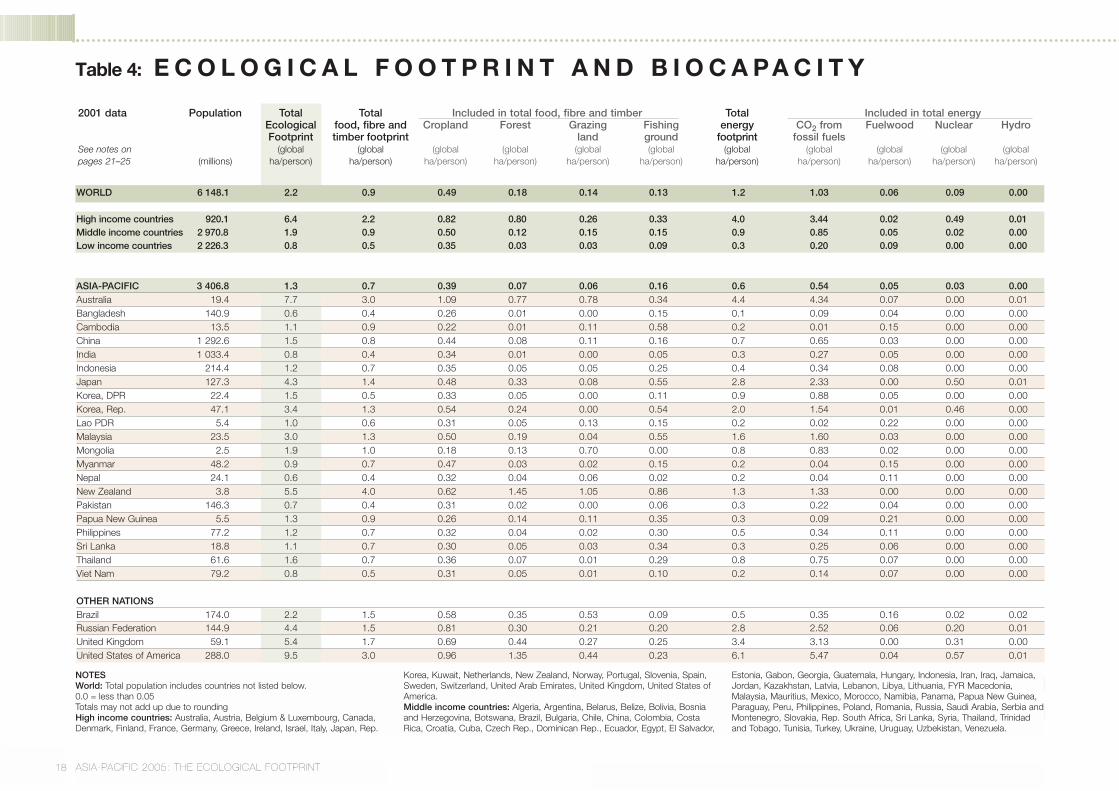
Table 4: E C O L O G I C A L F O O T P R I N T A N D B I O C A PA C I T Y
2001 data Population Total Total Included in total food, fibre and timber Total Included in total energyEcological food, fibre and Cropland Forest Grazing Fishing energy CO2 from Fuelwood Nuclear HydroFootprint timber footprint land ground footprint fossil fuels
See notes on (global (global (global (global (global (global (global (global (global (global (globalpages 21–25 (millions) ha/person) ha/person) ha/person) ha/person) ha/person) ha/person) ha/person) ha/person) ha/person) ha/person) ha/person)
NOTESWorld: Total population includes countries not listed below.0.0 = less than 0.05Totals may not add up due to roundingHigh income countries: Australia, Austria, Belgium & Luxembourg, Canada,Denmark, Finland, France, Germany, Greece, Ireland, Israel, Italy, Japan, Rep.
Korea, Kuwait, Netherlands, New Zealand, Norway, Portugal, Slovenia, Spain,Sweden, Switzerland, United Arab Emirates, United Kingdom, United States ofAmerica.Middle income countries: Algeria, Argentina, Belarus, Belize, Bolivia, Bosniaand Herzegovina, Botswana, Brazil, Bulgaria, Chile, China, Colombia, CostaRica, Croatia, Cuba, Czech Rep., Dominican Rep., Ecuador, Egypt, El Salvador,
Estonia, Gabon, Georgia, Guatemala, Hungary, Indonesia, Iran, Iraq, Jamaica,Jordan, Kazakhstan, Latvia, Lebanon, Libya, Lithuania, FYR Macedonia,Malaysia, Mauritius, Mexico, Morocco, Namibia, Panama, Papua New Guinea,Paraguay, Peru, Philippines, Poland, Romania, Russia, Saudi Arabia, Serbia andMontenegro, Slovakia, Rep. South Africa, Sri Lanka, Syria, Thailand, Trinidadand Tobago, Tunisia, Turkey, Ukraine, Uruguay, Uzbekistan, Venezuela.
WORLD 6 148.1 2.2 0.9 0.49 0.18 0.14 0.13 1.2 1.03 0.06 0.09 0.00
High income countries 920.1 6.4 2.2 0.82 0.80 0.26 0.33 4.0 3.44 0.02 0.49 0.01Middle income countries 2 970.8 1.9 0.9 0.50 0.12 0.15 0.15 0.9 0.85 0.05 0.02 0.00Low income countries 2 226.3 0.8 0.5 0.35 0.03 0.03 0.09 0.3 0.20 0.09 0.00 0.00
ASIA-PACIFIC 3 406.8 1.3 0.7 0.39 0.07 0.06 0.16 0.6 0.54 0.05 0.03 0.00Australia 19.4 7.7 3.0 1.09 0.77 0.78 0.34 4.4 4.34 0.07 0.00 0.01Bangladesh 140.9 0.6 0.4 0.26 0.01 0.00 0.15 0.1 0.09 0.04 0.00 0.00Cambodia 13.5 1.1 0.9 0.22 0.01 0.11 0.58 0.2 0.01 0.15 0.00 0.00China 1 292.6 1.5 0.8 0.44 0.08 0.11 0.16 0.7 0.65 0.03 0.00 0.00India 1 033.4 0.8 0.4 0.34 0.01 0.00 0.05 0.3 0.27 0.05 0.00 0.00Indonesia 214.4 1.2 0.7 0.35 0.05 0.05 0.25 0.4 0.34 0.08 0.00 0.00Japan 127.3 4.3 1.4 0.48 0.33 0.08 0.55 2.8 2.33 0.00 0.50 0.01Korea, DPR 22.4 1.5 0.5 0.33 0.05 0.00 0.11 0.9 0.88 0.05 0.00 0.00Korea, Rep. 47.1 3.4 1.3 0.54 0.24 0.00 0.54 2.0 1.54 0.01 0.46 0.00Lao PDR 5.4 1.0 0.6 0.31 0.05 0.13 0.15 0.2 0.02 0.22 0.00 0.00Malaysia 23.5 3.0 1.3 0.50 0.19 0.04 0.55 1.6 1.60 0.03 0.00 0.00Mongolia 2.5 1.9 1.0 0.18 0.13 0.70 0.00 0.8 0.83 0.02 0.00 0.00Myanmar 48.2 0.9 0.7 0.47 0.03 0.02 0.15 0.2 0.04 0.15 0.00 0.00Nepal 24.1 0.6 0.4 0.32 0.04 0.06 0.02 0.2 0.04 0.11 0.00 0.00New Zealand 3.8 5.5 4.0 0.62 1.45 1.05 0.86 1.3 1.33 0.00 0.00 0.00Pakistan 146.3 0.7 0.4 0.31 0.02 0.00 0.06 0.3 0.22 0.04 0.00 0.00Papua New Guinea 5.5 1.3 0.9 0.26 0.14 0.11 0.35 0.3 0.09 0.21 0.00 0.00Philippines 77.2 1.2 0.7 0.32 0.04 0.02 0.30 0.5 0.34 0.11 0.00 0.00Sri Lanka 18.8 1.1 0.7 0.30 0.05 0.03 0.34 0.3 0.25 0.06 0.00 0.00Thailand 61.6 1.6 0.7 0.36 0.07 0.01 0.29 0.8 0.75 0.07 0.00 0.00Viet Nam 79.2 0.8 0.5 0.31 0.05 0.01 0.10 0.2 0.14 0.07 0.00 0.00
OTHER NATIONSBrazil 174.0 2.2 1.5 0.58 0.35 0.53 0.09 0.5 0.35 0.16 0.02 0.02Russian Federation 144.9 4.4 1.5 0.81 0.30 0.21 0.20 2.8 2.52 0.06 0.20 0.01United Kingdom 59.1 5.4 1.7 0.69 0.44 0.27 0.25 3.4 3.13 0.00 0.31 0.00United States of America 288.0 9.5 3.0 0.96 1.35 0.44 0.23 6.1 5.47 0.04 0.57 0.01
19ASIA-PACIFIC 2005: THE ECOLOGICAL FOOTPRINT
0.07 1.8 0.53 0.27 0.81 0.13 0.4 -2% -12% 0.72 5 800 WORLD
0.23 3.3 1.12 0.33 1.57 0.31 3.1 8% -7% 0.91 - High income countries0.07 2.0 0.51 0.30 1.07 0.13 -0.1 -5% -10% 0.68 - Middle income countries0.05 0.7 0.32 0.19 0.13 0.07 0.1 -11% -16% 0.44 - Low income countries
0.06 0.7 0.34 0.11 0.16 0.09 0.6 6% -11% 0.66 2 365 ASIA-PACIFIC0.26 19.2 4.46 8.26 3.47 2.73 -11.5 16% -6% 0.94 20 886 Australia0.05 0.3 0.19 0.00 0.01 0.08 0.3 0% -11% 0.50 353 Bangladesh0.03 1.0 0.31 0.12 0.19 0.37 0.1 9% -3% 0.56 281 Cambodia0.07 0.8 0.35 0.12 0.17 0.05 0.8 14% -7% 0.72 899 China0.04 0.4 0.29 0.00 0.02 0.03 0.4 1% -15% 0.59 465 India0.05 1.0 0.34 0.07 0.27 0.28 0.2 4% -14% 0.68 725 Indonesia0.07 0.8 0.14 0.00 0.42 0.13 3.6 6% -6% 0.93 37 453 Japan0.05 0.7 0.23 0.00 0.30 0.10 0.8 -37% -33% n/a n/a Korea, DPR0.06 0.6 0.16 0.00 0.08 0.27 2.8 30% -12% 0.88 11 276 Korea, Rep.0.10 1.4 0.33 0.21 0.68 0.07 -0.4 -4% -12% 0.53 335 Lao PDR0.07 1.9 0.79 0.02 0.63 0.42 1.1 10% -48% 0.79 3 857 Malaysia0.04 11.8 0.25 11.04 0.47 0.00 -9.9 -33% -11% 0.66 378 Mongolia0.08 1.3 0.54 0.01 0.48 0.21 -0.4 10% 1% 0.55 n/a Myanmar0.05 0.5 0.27 0.06 0.08 0.01 0.2 -4% -12% 0.50 241 Nepal0.13 14.5 2.76 4.36 6.82 0.45 -9.0 16% -13% 0.92 18 696 New Zealand0.04 0.4 0.26 0.01 0.02 0.04 0.3 2% -18% 0.50 511 Pakistan0.12 2.6 0.33 0.05 1.15 0.90 -1.3 -8% -16% 0.55 638 Papua New Guinea0.04 0.6 0.28 0.02 0.12 0.12 0.6 -6% -22% 0.75 1 013 Philippines0.05 0.4 0.20 0.02 0.05 0.06 0.7 20% -12% 0.73 857 Sri Lanka0.06 1.0 0.59 0.01 0.19 0.14 0.6 20% -1% 0.77 2 037 Thailand0.08 0.8 0.36 0.01 0.14 0.17 0.0 14% 6% 0.69 421 Viet Nam
0.08 10.2 0.80 1.19 8.05 0.10 -8.0 9% -10% 0.78 3 503 Brazil0.05 6.9 1.18 0.35 4.95 0.39 -2.6 -21% 1% 0.53 1 884 Russian Federation0.34 1.5 0.49 0.15 0.19 0.36 3.9 -1% -12% 0.93 21 500 United Kingdom0.45 4.9 1.76 0.28 2.01 0.36 4.7 7% -11% 0.94 39 100 United States of Americaß
Built-up Total Included in total biocapacity Ecological Ecological Biocapacity Human Gross 2001 data land* biocapacity Cropland Grazing Forest Fishing deficit** Footprint change change per Development domestic
land ground per capita capita Index*** product(global (global (global (global (global (global (global (change (change (US $/person) See notes on
ha/person) ha/person) ha/person) ha/person) ha/person) ha/person) ha/person) 1991-2001) 1991-2001) pages 21–25
Low income countries: Afghanistan, Albania, Angola, Armenia, Azerbaijan,Bangladesh, Benin, Burkina Faso, Burundi, Cambodia, Cameroon, CentralAfrican Rep., Chad, Congo, Dem. Rep. Congo, Côte d’Ivoire, Eritrea,Ethiopia, The Gambia, Ghana, Guinea, Guinea-Bissau, Haiti, Honduras,India, Kenya, DPR Korea, Kyrgyzstan, Lao PDR, Lesotho, Liberia,Madagascar, Malawi, Mali, Mauritania, Rep. Moldova, Mongolia,
Mozambique, Myanmar, Nepal, Nicaragua, Niger, Nigeria, Pakistan, Rwanda,Senegal, Sierra Leone, Somalia, Sudan, Swaziland, Tajikistan, United Rep.Tanzania, Togo, Turkmenistan, Uganda, Viet Nam, Yemen, Zambia,Zimbabwe.
* Note that built-up land is part of both Ecological Footprint and biocapacity.** If number for ecological deficit is negative, country has an ecological reserve.*** High/medium/low income country classifications for the Human
Development Index are taken from UNDP 2003.
20 ASIA-PACIFIC 2005: THE ECOLOGICAL FOOTPRINT
F R E Q U E N T LY A S K E D Q U E S T I O N S A B O U T T H E F O O T P R I N TWhat is included in the Ecological Footprint?What is excluded?To avoid exaggerating human demand onnature, the Ecological Footprint includes onlythose aspects of resource consumption andwaste production that are potentially sustainableand for which there are data that allow thisdemand on nature to be expressed in terms ofthe area required. Specific excludedcomponents are listed in the technical appendix.
Ecological Footprint accounts providesnapshots of past resource demand andavailability. They do not predict the future.Thus, the Ecological Footprint does notestimate future losses caused by presentdegradation of ecosystems, althoughpersistent degradation will eventually bereflected in Ecological Footprint accounts of future years as a loss of biocapacity.
Footprint accounts also do not indicate theintensity with which a biologically productivearea is being used and do not pinpointspecific biodiversity pressures. Finally, the Ecological Footprint does not evaluate
the social and economic dimensions of sustainability.
How does the Ecological Footprint accountfor fossil fuels?The Ecological Footprint measures humanity’spast and present demand on nature. Althoughfossil fuels such as coal, oil and natural gas areextracted from the Earth’s crust and notregenerated in human timescales, their use stillrequires ecological services. Burning thesefuels puts pressure on the biosphere through therelease of greenhouse gases such as CO2. TheEcological Footprint includes the biocapacityneeded to sequester this CO2, less the amountabsorbed by the ocean. One global hectare canabsorb the CO2 released from consumingapproximately 1,450 litres of gasoline in a year.
The fossil fuel footprint does not suggestthat carbon sequestration is the key toresolving global warming. Rather, it pointsout the lack of ecological capacity for copingwith excess CO2 and underlines theimportance of reducing CO2 emissions. The
sequestration rate used in EcologicalFootprint calculations is based on an estimateof how much human-induced carbonemissions the world’s forests can currentlyremove from the atmosphere and retain.
Energy efficiency or new renewable energytechnologies, such as wind or solar, may bethe most cost-effective way to reduce theenergy footprint (see Figure 23). As theEcological Footprint measures the currentstate of resource demand and availability,however, these technologies are only includedin the accounts according to their usage today,not their possible growth in the future.
Are current biological yields likely to besustainable? In calculating a nation’s footprint, yields forforests and fisheries as reported by the Foodand Agriculture Organization of the UnitedNations (FAO) are used. These are estimates of the maximum amount of a single speciesstock that can be harvested without reducingthe stock’s productivity over time. If current
overuse leads to lower yields in thefuture, this will be reflected in futurebiocapacity assessments.
How is international trade taken intoaccount?The Ecological Footprint accounts calculateeach country’s net consumption by adding itsimports to its production and subtracting itsexports. This means that the resources used forproducing a car that is manufactured in Japan,but sold and used in India, will contribute tothe Indian, not the Japanese, footprint.
The resulting footprint of apparentconsumption can be distorted, since thewaste generated in making products forexport is not fully documented. This canexaggerate the footprint of countries whoseeconomies produce largely for export, and understate that of importing countries.While these misallocations may distort some national averages, they do not bias the overall global Ecological Footprint.
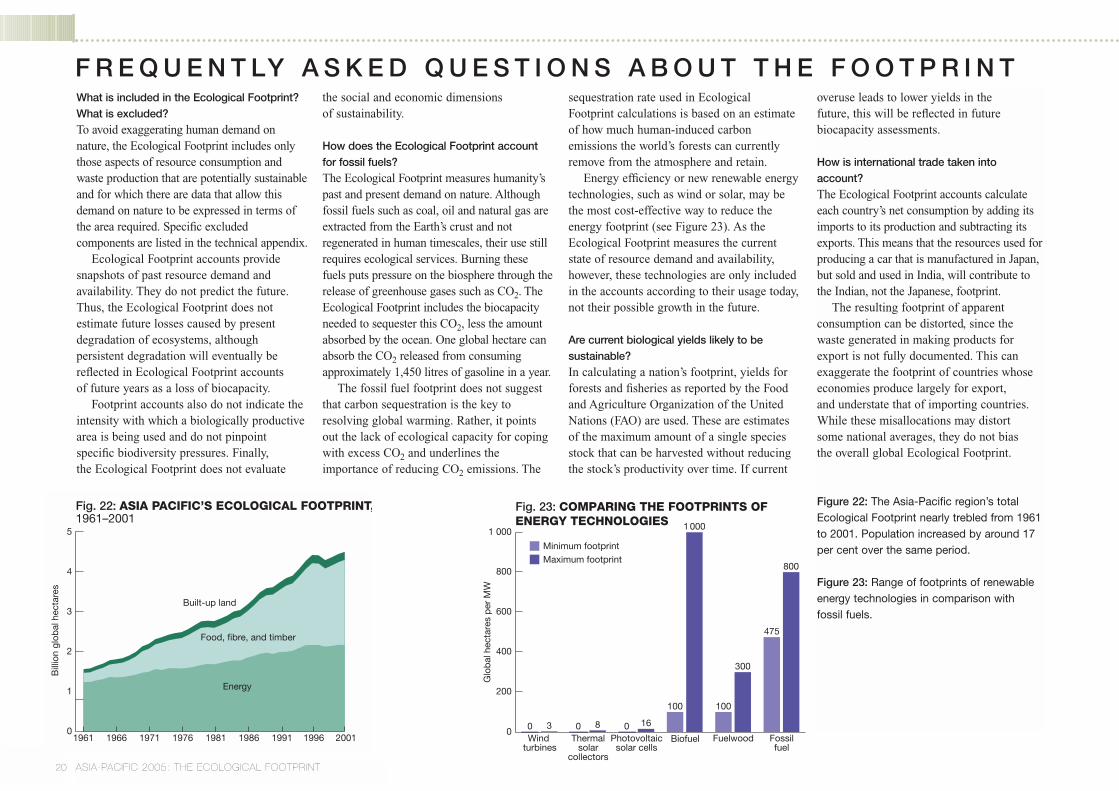
Figure 22: The Asia-Pacific region’s totalEcological Footprint nearly trebled from 1961to 2001. Population increased by around 17per cent over the same period.
Figure 23: Range of footprints of renewableenergy technologies in comparison withfossil fuels.
1961 1966 1971 1976 1981 1986 1991 20011996
Fig. 22: ASIA PACIFIC’S ECOLOGICAL FOOTPRINT,1961–2001
Bill
ion
glob
al h
ecta
res
Built-up land
Energy
Food, fibre, and timber
5
4
3
2
1
0
Fig. 23: COMPARING THE FOOTPRINTS OF ENERGY TECHNOLOGIES
600
400
800
200
1 000
0
Minimum footprintMaximum footprint
Windturbines
Fossilfuel
FuelwoodBiofuelPhotovoltaicsolar cells
Thermalsolar
collectors
1000
100100
475
300
800
16830 0 0
Glo
bal
hec
tare
s p
er M
W

21ASIA-PACIFIC 2005: THE ECOLOGICAL FOOTPRINT
T E C H N I C A L N O T E S LIVING PLANET INDEX
Data collection
The species population data used to calculate the
Living Planet Index were gathered from a variety of
sources including publications in scientific journals,
literature from non-governmental organizations, and the
internet. All data used in constructing the index are a
time series of either population size or a proxy of
population size. Direct population size trends included
total population estimates, such as counts of an entire
species; density measures, for example the number of
birds per kilometre of transect; and biomass or stock
estimates, particularly for commercial fish species.
Other proxies of population size were also used, such
as the number of nests of marine turtle species on
various nesting beaches.
All population time series have at least two data
points, and most have more. Only data collected by
methods that are comparable across years are
included – a population estimate taken at one point in
time would not be used with a second estimate from
another survey of the same population at another point
in time, unless it was clear that the second estimate
was meant to be comparable with the first. Plants and
invertebrates are excluded, as few population time
series data were available. It is assumed, therefore, that
trends in vertebrate populations are indicative of overall
trends in global biodiversity.
Calculation of the indices
For each species, the ratio between its population in
each pair of consecutive years is calculated. To
calculate the index in a given year, the geometric mean
of all the ratios of species populations in that year and
the previous year is multiplied by the index value of the
previous year. The index value is set equal to 1 in
1970. From this baseline, the index changes from year
to year in line with the geometric mean of all the
changes in population of species with population data
in both years.
In cases where data exist for more than one
population of a single species, or where more than one
time series was collected for the same population, the
geometric mean of all ratios for that species was used
in the index calculations rather than all measurements
for that species.
More species population data are available from
temperate than tropical regions of the world, and
species richness is higher in the tropics. Thus, if the
Living Planet Index were calculated simply as
described above, it would be unrepresentative of global
biodiversity. To address this issue, before carrying out
any calculations, the data were divided into biomes
(terrestrial, freshwater or marine) depending on the
principal habitat of the species. Where a species
commonly occurs in more than one biome, its
breeding habitat was used to determine its biome.
Within each biome, species were divided according
to the biogeographic realm or ocean they inhabit:
Afrotropical, Australasian, Indo-Malayan, Nearctic,
Neotropical, or Palearctic realms for terrestrial and
freshwater species, and Atlantic/Arctic, Indian, Pacific,
or Southern Oceans for marine species. For some
species, different populations occur within different
realms or oceans, in which case the populations would
be divided accordingly. The total numbers of species
contributing to each realm/ocean and biome are given
in Table 5.
Separate indices were calculated for each
biogeographic realm and ocean. The terrestrial and
freshwater species indices were then calculated as the
geometric mean of the six biogeographic realm indices
within each biome, and the marine species index was
calculated as the geometric mean of the four ocean
indices. The terrestrial species index includes 562
species of mammals, birds and reptiles found in forest,
grassland, savannah, desert or tundra ecosystems
worldwide. The freshwater species index comprises
323 species of mammals, birds, reptiles, amphibians,
and fish living in rivers, lakes or wetland ecosystems.
The marine species index includes 267 species of
mammals, birds, reptiles and fish from the world’s
oceans, seas and coastal ecosystems.
The Living Planet Index is the geometric mean of the
terrestrial, freshwater and marine species indices. The
hierarchy of indices is shown in Figure 24. Each biome
carries equal weight within the overall Living Planet
Index. Each realm or ocean carries equal weight within
each biome. Each species carries equal weight within
each realm or ocean. Each population carries equal
weight within each species.
ECOLOGICAL FOOTPRINT and BIOCAPACITY
1. The Ecological Footprint
The Ecological Footprint is a measure of how
much biologically productive land and water area
Table 5: NUMBERS OF SPECIES INCLUDED IN THE LIVING PLANET INDEX BYREALM/OCEAN AND BIOME
Realm or ocean Terrestrial Freshwater Marine
Afrotropical 72 12
Australasian 15 11
Indo-Malayan 28 19
Nearctic 269 168
Neotropical 19 12
Palearctic 159 101
Atlantic/Arctic Ocean 117
Indian Ocean/Southeast Asia 15
Pacific Ocean 105
Southern Ocean 30
World 562 323 267
Fig. 24: HIERARCHY OF INDICES WITHIN THE LIVING PLANET INDEX
Freshwater MarineTerrestrial
Realm 2 Realm 3Realm 1
Species 2 Species 3Species 1
Population 1
LIVING PLANET INDEX
Population 2 Population 3
22 ASIA-PACIFIC 2005: THE ECOLOGICAL FOOTPRINT
an individual, a city, a country, a region or humanity
uses to produce the resources it consumes and to
absorb the waste it generates, using prevailing
technology and resource management schemes.
This land and water area can be physically located
anywhere in the world.
This report documents national, per person
footprints for consumption. Footprints can be
calculated for any activity of organizations and
populations or for urban development projects,
services and products.
The Ecological Footprint is measured in global
hectares. A global hectare is 1 hectare of biologically
productive space with world average productivity. In
2001 (the most recent year for which consistent data
are available), the biosphere had 11.3 billion hectares
of biologically productive area, corresponding to
roughly one quarter of the planet’s surface. These 11.3
billion hectares include 2.3 billion hectares of water
(ocean shelves and inland water) and 9.0 billion
hectares of land. The land area is composed of 1.5
billion hectares of cropland, 3.5 billion hectares of
grazing land, 3.9 billion hectares of forest land and
0.2 billion hectares of built-up land.
In this report, the Ecological Footprint of
consumption is calculated for each country. This
includes the embodied resources contained within the
goods and services that are consumed by people living
in that country, as well as the associated waste.
Resources used for the production of goods and
services that are later exported are counted in the
footprint of the country where the goods and services
are finally consumed.
The global Ecological Footprint is the area
required to produce the material throughput of the
human economy under current management and
production practices. Typically expressed in global
hectares, the Ecological Footprint can also be
measured in number of planets, whereby one planet
represents the biological capacity of the Earth in a
given year. Results could also be expressed, for
example, in Austrian or Danish hectares (hectares with
average Austrian or Danish productivity), just as
financial accounts can express the same total value in
different currencies.
Ecological Footprint and biocapacity analyses are
based primarily on data published by the Food and
Agriculture Organization of the United Nations (FAO),
the International Energy Agency (IEA), the UN
Statistics Division (UN Commodity Trade Statistics
Database – UN Comtrade), and the Intergov-
ernmental Panel on Climate Change (IPCC). Other
data sources include studies in peer-reviewed science
journals and thematic collections.
2. Biocapacity and bioproductivity
Biocapacity (biological capacity) is the total usable
biological production capacity of a biologically
productive area in a given year. Biocapacity can also
be expressed in global hectares.
Biologically productive area is land and sea area
with significant photosynthetic activity and production
of biomass. Marginal areas with patchy vegetation and
non-productive areas are not included in biocapacity
estimates. There are 11.3 billion global hectares of
biologically productive land and sea area on the planet.
The remaining three quarters of the Earth’s surface,
including deserts, ice caps and deep oceans, support
comparatively low levels of bioproductivity, too
dispersed to be harvested.
Bioproductivity (biological productivity) is equal to
biological production per unit area per year. Biological
productivity is typically measured in terms of annual
biomass accumulation.
Biocapacity available per person is calculated by
dividing the 11.3 billion global hectares of biologically
productive area by the number of people on Earth
(6.15 billion in 2001). This ratio gives the average
amount of biocapacity that exists on the planet per
person: 1.8 global hectares.
3. Assumptions underlying the calculations
Ecological Footprint calculations are based on the
following assumptions:
• It is possible to track the majority of the resources
people consume and the wastes they generate.
• The majority of these resource and waste flows
can be measured in terms of the biologically
productive area necessary to maintain these
flows.Those resource and waste flows that cannot
be measured are excluded from the assessment.
This approach tends to underestimate the true
Ecological Footprint.
• By weighting each area in proportion to its usable
bioproductivity, different types of areas can be
converted from hectares to global hectares, land of
average productivity. ‘Usable’ refers to the portion of
biomass used by humans, reflecting the
anthropocentric assumptions of the Ecological
Footprint measurement.
• Since these different areas represent mutually
exclusive uses and each global hectare represents
the same amount of biomass production potential
for a given year, they can be added up. This is the
case for both the aggregate human demand (the
Ecological Footprint) and the aggregate supply
of biocapacity.
• Human demand expressed as the Ecological
Footprint and nature’s supply expressed in global
hectares of biocapacity can be directly compared.
• Area demanded can exceed area supplied. For
example, the footprint of forest products harvested
from a forest at twice its regeneration rate is twice the
size of the actual forest. Use that exceeds the
regeneration rate of nature is called ecological
overshoot.
4. What is NOT counted
The results presented tend to underestimate human
demand on nature and overestimate the available
biocapacity by:
• choosing more optimistic bioproductivity estimates
when in doubt (e.g. carbon absorption)
• excluding human demands on the biosphere for
which there are insufficient data (e.g. acid rain)
• excluding those activities that systematically erode
nature’s capacity to regenerate, such as:
- uses of materials for which the biosphere has
no apparent significant assimilation capacity
(e.g. plutonium, polychlorinated biphenyls (PCBs),
dioxins, chlorofluorocarbons (CFCs))
- processes that irreversibly damage the biosphere
(e.g. species extinction, fossil-aquifer depletion,
deforestation, desertification).
The national footprint and biocapacity accounts also
do not directly account for freshwater use and
availability, since withdrawal of a cubic metre of
freshwater affects biocapacity differently depending on
local conditions. Removing one cubic metre from a wet
area may make little difference to the local
environment, while in arid areas every cubic metre
removed can directly compromise ecosystem
production. Hence, water assessments require very
specific data on local circumstances, and such data
are not available for global comparison. The accounts
reflect freshwater use and availability indirectly,
however, since this affects biocapacity through
changes in crop and forest yields.
For consistency and to keep the global hectares
additive, each area is only counted once in Ecological
Footprint and biocapacity estimates, even if an area
provides two or more ecological services. Also, the
accounts include the productivity of cropland at the
level of current yields, with no deduction for possible
degradation. If degradation takes place, however,
this will be reflected as reductions in future
biocapacity assessments.
Ecological Footprint calculations avoid double
counting – counting the same area twice. Considering
bread, for example, wheat is first farmed, then milled,
T E C H N I C A L N O T E S c o n t i n u e d
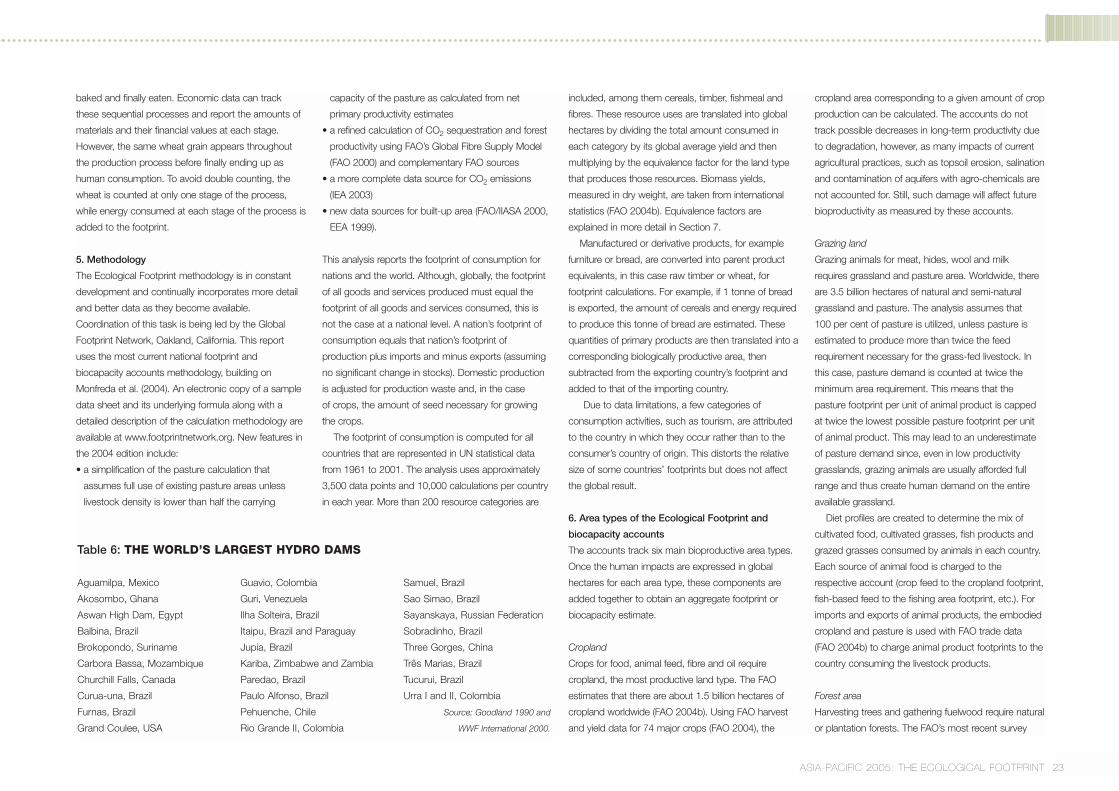
23ASIA-PACIFIC 2005: THE ECOLOGICAL FOOTPRINT
baked and finally eaten. Economic data can track
these sequential processes and report the amounts of
materials and their financial values at each stage.
However, the same wheat grain appears throughout
the production process before finally ending up as
human consumption. To avoid double counting, the
wheat is counted at only one stage of the process,
while energy consumed at each stage of the process is
added to the footprint.
5. Methodology
The Ecological Footprint methodology is in constant
development and continually incorporates more detail
and better data as they become available.
Coordination of this task is being led by the Global
Footprint Network, Oakland, California. This report
uses the most current national footprint and
biocapacity accounts methodology, building on
Monfreda et al. (2004). An electronic copy of a sample
data sheet and its underlying formula along with a
detailed description of the calculation methodology are
available at www.footprintnetwork.org. New features in
the 2004 edition include:
• a simplification of the pasture calculation that
assumes full use of existing pasture areas unless
livestock density is lower than half the carrying
capacity of the pasture as calculated from net
primary productivity estimates
• a refined calculation of CO2 sequestration and forest
productivity using FAO’s Global Fibre Supply Model
(FAO 2000) and complementary FAO sources
• a more complete data source for CO2 emissions
(IEA 2003)
• new data sources for built-up area (FAO/IIASA 2000,
EEA 1999).
This analysis reports the footprint of consumption for
nations and the world. Although, globally, the footprint
of all goods and services produced must equal the
footprint of all goods and services consumed, this is
not the case at a national level. A nation’s footprint of
consumption equals that nation’s footprint of
production plus imports and minus exports (assuming
no significant change in stocks). Domestic production
is adjusted for production waste and, in the case
of crops, the amount of seed necessary for growing
the crops.
The footprint of consumption is computed for all
countries that are represented in UN statistical data
from 1961 to 2001. The analysis uses approximately
3,500 data points and 10,000 calculations per country
in each year. More than 200 resource categories are
included, among them cereals, timber, fishmeal and
fibres. These resource uses are translated into global
hectares by dividing the total amount consumed in
each category by its global average yield and then
multiplying by the equivalence factor for the land type
that produces those resources. Biomass yields,
measured in dry weight, are taken from international
statistics (FAO 2004b). Equivalence factors are
explained in more detail in Section 7.
Manufactured or derivative products, for example
furniture or bread, are converted into parent product
equivalents, in this case raw timber or wheat, for
footprint calculations. For example, if 1 tonne of bread
is exported, the amount of cereals and energy required
to produce this tonne of bread are estimated. These
quantities of primary products are then translated into a
corresponding biologically productive area, then
subtracted from the exporting country’s footprint and
added to that of the importing country.
Due to data limitations, a few categories of
consumption activities, such as tourism, are attributed
to the country in which they occur rather than to the
consumer’s country of origin. This distorts the relative
size of some countries’ footprints but does not affect
the global result.
6. Area types of the Ecological Footprint and
biocapacity accounts
The accounts track six main bioproductive area types.
Once the human impacts are expressed in global
hectares for each area type, these components are
added together to obtain an aggregate footprint or
biocapacity estimate.
Cropland
Crops for food, animal feed, fibre and oil require
cropland, the most productive land type. The FAO
estimates that there are about 1.5 billion hectares of
cropland worldwide (FAO 2004b). Using FAO harvest
and yield data for 74 major crops (FAO 2004), the
cropland area corresponding to a given amount of crop
production can be calculated. The accounts do not
track possible decreases in long-term productivity due
to degradation, however, as many impacts of current
agricultural practices, such as topsoil erosion, salination
and contamination of aquifers with agro-chemicals are
not accounted for. Still, such damage will affect future
bioproductivity as measured by these accounts.
Grazing land
Grazing animals for meat, hides, wool and milk
requires grassland and pasture area. Worldwide, there
are 3.5 billion hectares of natural and semi-natural
grassland and pasture. The analysis assumes that
100 per cent of pasture is utilized, unless pasture is
estimated to produce more than twice the feed
requirement necessary for the grass-fed livestock. In
this case, pasture demand is counted at twice the
minimum area requirement. This means that the
pasture footprint per unit of animal product is capped
at twice the lowest possible pasture footprint per unit
of animal product. This may lead to an underestimate
of pasture demand since, even in low productivity
grasslands, grazing animals are usually afforded full
range and thus create human demand on the entire
available grassland.
Diet profiles are created to determine the mix of
cultivated food, cultivated grasses, fish products and
grazed grasses consumed by animals in each country.
Each source of animal food is charged to the
respective account (crop feed to the cropland footprint,
fish-based feed to the fishing area footprint, etc.). For
imports and exports of animal products, the embodied
cropland and pasture is used with FAO trade data
(FAO 2004b) to charge animal product footprints to the
country consuming the livestock products.
Forest area
Harvesting trees and gathering fuelwood require natural
or plantation forests. The FAO’s most recent survey
Table 6: THE WORLD’S LARGEST HYDRO DAMS
Aguamilpa, Mexico
Akosombo, Ghana
Aswan High Dam, Egypt
Balbina, Brazil
Brokopondo, Suriname
Carbora Bassa, Mozambique
Churchill Falls, Canada
Curua-una, Brazil
Furnas, Brazil
Grand Coulee, USA
Guavio, Colombia
Guri, Venezuela
Ilha Solteira, Brazil
Itaipu, Brazil and Paraguay
Jupia, Brazil
Kariba, Zimbabwe and Zambia
Paredao, Brazil
Paulo Alfonso, Brazil
Pehuenche, Chile
Rio Grande II, Colombia
Samuel, Brazil
Sao Simao, Brazil
Sayanskaya, Russian Federation
Sobradinho, Brazil
Three Gorges, China
Três Marias, Brazil
Tucurui, Brazil
Urra I and II, Colombia
Source: Goodland 1990 and
WWF International 2000.
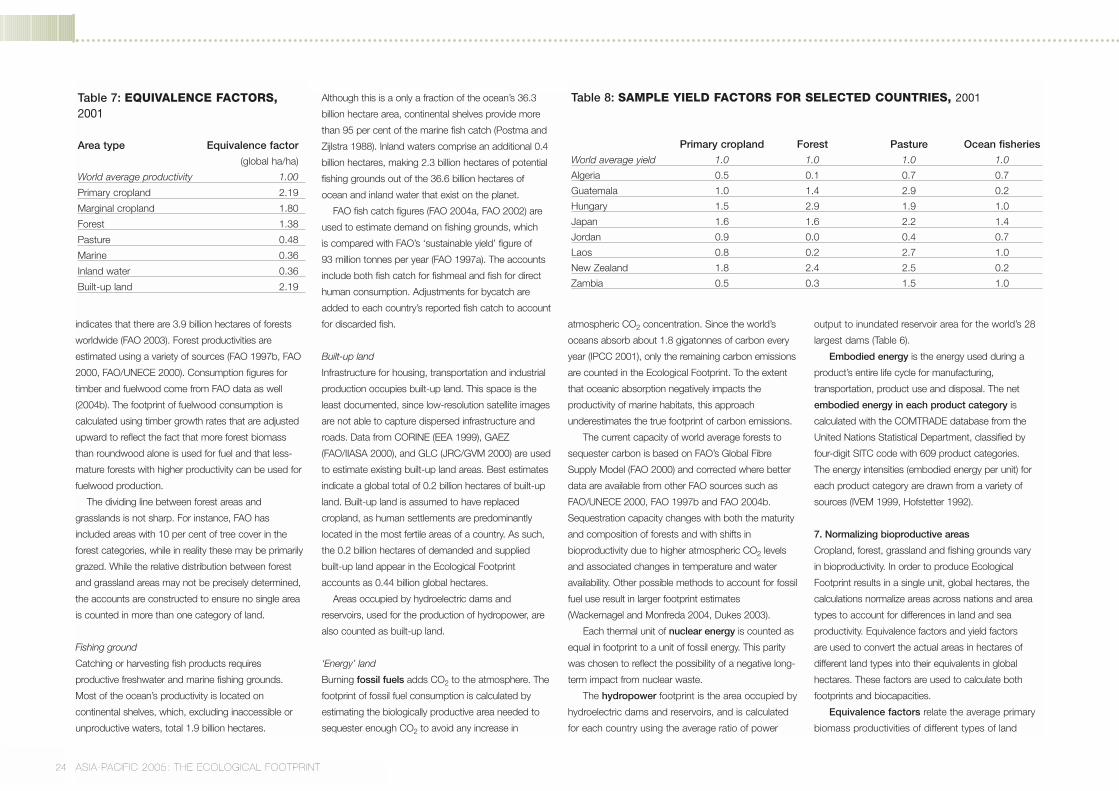
24 ASIA-PACIFIC 2005: THE ECOLOGICAL FOOTPRINT
indicates that there are 3.9 billion hectares of forests
worldwide (FAO 2003). Forest productivities are
estimated using a variety of sources (FAO 1997b, FAO
2000, FAO/UNECE 2000). Consumption figures for
timber and fuelwood come from FAO data as well
(2004b). The footprint of fuelwood consumption is
calculated using timber growth rates that are adjusted
upward to reflect the fact that more forest biomass
than roundwood alone is used for fuel and that less-
mature forests with higher productivity can be used for
fuelwood production.
The dividing line between forest areas and
grasslands is not sharp. For instance, FAO has
included areas with 10 per cent of tree cover in the
forest categories, while in reality these may be primarily
grazed. While the relative distribution between forest
and grassland areas may not be precisely determined,
the accounts are constructed to ensure no single area
is counted in more than one category of land.
Fishing ground
Catching or harvesting fish products requires
productive freshwater and marine fishing grounds.
Most of the ocean’s productivity is located on
continental shelves, which, excluding inaccessible or
unproductive waters, total 1.9 billion hectares.
Although this is a only a fraction of the ocean’s 36.3
billion hectare area, continental shelves provide more
than 95 per cent of the marine fish catch (Postma and
Zijlstra 1988). Inland waters comprise an additional 0.4
billion hectares, making 2.3 billion hectares of potential
fishing grounds out of the 36.6 billion hectares of
ocean and inland water that exist on the planet.
FAO fish catch figures (FAO 2004a, FAO 2002) are
used to estimate demand on fishing grounds, which
is compared with FAO’s ‘sustainable yield’ figure of
93 million tonnes per year (FAO 1997a). The accounts
include both fish catch for fishmeal and fish for direct
human consumption. Adjustments for bycatch are
added to each country’s reported fish catch to account
for discarded fish.
Built-up land
Infrastructure for housing, transportation and industrial
production occupies built-up land. This space is the
least documented, since low-resolution satellite images
are not able to capture dispersed infrastructure and
roads. Data from CORINE (EEA 1999), GAEZ
(FAO/IIASA 2000), and GLC (JRC/GVM 2000) are used
to estimate existing built-up land areas. Best estimates
indicate a global total of 0.2 billion hectares of built-up
land. Built-up land is assumed to have replaced
cropland, as human settlements are predominantly
located in the most fertile areas of a country. As such,
the 0.2 billion hectares of demanded and supplied
built-up land appear in the Ecological Footprint
accounts as 0.44 billion global hectares.
Areas occupied by hydroelectric dams and
reservoirs, used for the production of hydropower, are
also counted as built-up land.
‘Energy’ land
Burning fossil fuels adds CO2 to the atmosphere. The
footprint of fossil fuel consumption is calculated by
estimating the biologically productive area needed to
sequester enough CO2 to avoid any increase in
atmospheric CO2 concentration. Since the world’s
oceans absorb about 1.8 gigatonnes of carbon every
year (IPCC 2001), only the remaining carbon emissions
are counted in the Ecological Footprint. To the extent
that oceanic absorption negatively impacts the
productivity of marine habitats, this approach
underestimates the true footprint of carbon emissions.
The current capacity of world average forests to
sequester carbon is based on FAO’s Global Fibre
Supply Model (FAO 2000) and corrected where better
data are available from other FAO sources such as
FAO/UNECE 2000, FAO 1997b and FAO 2004b.
Sequestration capacity changes with both the maturity
and composition of forests and with shifts in
bioproductivity due to higher atmospheric CO2 levels
and associated changes in temperature and water
availability. Other possible methods to account for fossil
fuel use result in larger footprint estimates
(Wackernagel and Monfreda 2004, Dukes 2003).
Each thermal unit of nuclear energy is counted as
equal in footprint to a unit of fossil energy. This parity
was chosen to reflect the possibility of a negative long-
term impact from nuclear waste.
The hydropower footprint is the area occupied by
hydroelectric dams and reservoirs, and is calculated
for each country using the average ratio of power
output to inundated reservoir area for the world’s 28
largest dams (Table 6).
Embodied energy is the energy used during a
product’s entire life cycle for manufacturing,
transportation, product use and disposal. The net
embodied energy in each product category is
calculated with the COMTRADE database from the
United Nations Statistical Department, classified by
four-digit SITC code with 609 product categories.
The energy intensities (embodied energy per unit) for
each product category are drawn from a variety of
sources (IVEM 1999, Hofstetter 1992).
7. Normalizing bioproductive areas
Cropland, forest, grassland and fishing grounds vary
in bioproductivity. In order to produce Ecological
Footprint results in a single unit, global hectares, the
calculations normalize areas across nations and area
types to account for differences in land and sea
productivity. Equivalence factors and yield factors
are used to convert the actual areas in hectares of
different land types into their equivalents in global
hectares. These factors are used to calculate both
footprints and biocapacities.
Equivalence factors relate the average primary
biomass productivities of different types of land
Table 7: EQUIVALENCE FACTORS,2001
Area type Equivalence factor
(global ha/ha)
World average productivity 1.00
Primary cropland 2.19
Marginal cropland 1.80
Forest 1.38
Pasture 0.48
Marine 0.36
Inland water 0.36
Built-up land 2.19
Table 8: SAMPLE YIELD FACTORS FOR SELECTED COUNTRIES, 2001
Primary cropland Forest Pasture Ocean fisheriesWorld average yield 1.0 1.0 1.0 1.0
Algeria 0.5 0.1 0.7 0.7
Guatemala 1.0 1.4 2.9 0.2
Hungary 1.5 2.9 1.9 1.0
Japan 1.6 1.6 2.2 1.4
Jordan 0.9 0.0 0.4 0.7
Laos 0.8 0.2 2.7 1.0
New Zealand 1.8 2.4 2.5 0.2
Zambia 0.5 0.3 1.5 1.0
25ASIA-PACIFIC 2005: THE ECOLOGICAL FOOTPRINT
(i.e. cropland, pasture, forest, fishing ground) to the
global average primary biomass productivity of all
land types in a given year. In 2001, for example,
primary cropland had an equivalence factor of 2.19
(Table 7), indicating that primary cropland was more
than twice as productive as a hectare of land with
world average productivity. That same year, pasture
had an equivalence factor of 0.48, showing that
pasture was approximately half as productive as
the average bioproductive hectare on Earth.
Equivalence factors are calculated on a yearly
basis, since the relative productivity of land-use
types varies due to change in technology and
resource management schemes.
Yield factors account for the difference in
productivity of a given type of land across nations.
For example, a hectare of pasture in New Zealand
produces more meat than a hectare of pasture in
Jordan. To account for these differences, the yield
factor compares the production of a national hectare
to a world average hectare of a given land type.
Each country and each year has its own set of
yield factors. For example, Table 8 shows that New
Zealand’s pastures are 2.5 times as productive as
the world average.
To calculate the total biocapacity of a nation, each
of the different types of bioproductive area within that
nation’s borders, cropland, forest area, inland
fisheries, ocean fisheries, pasture and built-up land,
is multiplied by the equivalence factor for that land
type (the same for every country in a given year) and
the yield factor for that land type (specific for each
country in a given year).
These conversions produce a biocapacity or footprint
in terms of productivity adjusted area, biologically
productive area expressed in world average productivity.
The unit for productivity adjusted area in the accounts is
the global hectare. Worldwide, the number of
biologically productive hectares and the number of
global hectares are the same.
8. Natural accounting
Natural capital is the stock of natural assets that yield
goods and services on a continuous basis. Major
functions of natural capital include resource production
(such as fish, timber or cereals), waste assimilation (such
as CO2 absorption, sewage decomposition) and life
support services (UV protection, biodiversity, water
cleansing, climate stabilization).
An ecological deficit is the amount by which the
Ecological Footprint of a population exceeds the
biocapacity of the population’s territory. A national
ecological deficit measures the amount by which a
country’s footprint exceeds its biocapacity. A national
deficit can be covered either through trade or offset by
the loss of national ecological capital. A global ecological
deficit cannot be offset through trade, however, and
leads to depletion of natural capital – a global
ecological overshoot.
Ecological debt is the accumulated annual global
deficit. Debts are expressed in planet-years, with one
planet-year equal to the annual production of the global
biosphere.
Countries with footprints smaller than their locally
available biocapacity have an ecological reserve,
the opposite of an ecological deficit. This reserve is
not necessarily unused, however, but may be occupied
by the footprints of other countries through production
for export.
10. Contraction & Convergence and Shrink & Share
Contraction & Convergence (C&C), as proposed by
Aubrey Meyer (2001) of the Global Commons Institute,
provides a simple framework for globally allocating the
right to emit carbon in a way that is consistent with the
physical constraints of the biosphere. The approach
rests on two principles:
• contraction – reducing humanity’s emissions to a rate
that the biosphere can absorb;
• convergence – distributing total emissions in a way
that is considered fair to all.
Although C&C focuses exclusively on CO2
emissions, which are responsible for about 50 per cent
of humanity’s Ecological Footprint, the C&C framework
can be extended to other demands on the biosphere as
measured by the Ecological Footprint.
We call this concept Shrink & Share. Shrinkage
would occur when nations, organizations and individuals
reduce their footprints so that consumption, production,
investment and trade activities do not exceed the
regenerative capacity of the globe’s life-supporting
ecosystems. Sharing occurs if these reductions are
allocated in ways considered equitable by participants.
There are many ways to Shrink & Share. This
approach might imply that consumption, production,
investment and trade patterns change such that the per
person footprints in various nations deviate less and less
from each other, so that there is a more equitable
distribution of the rights to use resources. Resource
consumption rights could also be more closely tied to
the resources a region or nation has available.
Further discussion on Shrink & Share and how
this concept can support risk assessments and eco-
insurance schemes can be found in Lovink et al. (2004)
and in the Living Planet Report 2004 (WWF 2004).
26 ASIA-PACIFIC 2005: THE ECOLOGICAL FOOTPRINT
Aitken, D W. 2004. Transitioning to a
Renewable Energy Future. White Paper of the
International Solar Energy Society, Freiburg,
Germany. http://whitepaper.ises.org (accessed
August 2004).
Boutaud A. 2002. Développement durable :
quelques vérités embarrassantes. Economie et
Humanisme 363: 4–6.
British Petroleum. 2004. Statistical Review of
World Energy 2004.
www.bp.com/subsection.do?categoryId=
10104&contentId= 2015020
(accessed August 2004).
Bruinsma, J (ed) / FAO – Food and
Agriculture Organization of the United
Nations. 2003. World Agriculture: Towards
2015/2030: An FAO Perspective. Earthscan, UK.
www.fao.org/DOCREP/005/Y4252E/
Y4252E00.HTM (accessed August 2004).
Casson, A. 2003. Oil Palm, Soy Bean and
Critical Habitat Loss. Review prepared for the
WWF Forest Conversion Initiative, WWF,
Switzerland.
www.wwf.ch/images/progneut/upload/
oilpalmsoybeanscriticalhabitatloss25August03.
pdf (accessed August 2004).
CAST – Council for Agricultural Science and
Technology. 1999. Animal Agriculture and
Global Food Supply. Ames, Iowa, USA.
www.cast-science.org/cast/src/cast_top.htm
(accessed August 2004).
Dixon, R K et al. 1994. Carbon pools and flux of
global forest ecosystems. Science 263: 185–190.
Dukes, J S. 2003. Burning buried sunshine:
human consumption of ancient solar energy.
Climatic Change 61: 31–34.
EEA – European Environment Agency. 1999.
CORINE Land Cover Database. EEA,
Copenhagen, Denmark. http://dataservice.
eea.eu.int/ dataservice/metadetails.asp?id=188
(accessed August 2004).
FAO – Food and Agriculture Organization of
the United Nations. 1995. World Livestock
Production Systems: Current Status, Issues and
Trends. FAO, Rome, Italy.
FAO – Food and Agriculture Organization of
the United Nations. 1997a. State of the World’s
Fisheries and Aquaculture (SOFIA) 1996. FAO
Fisheries Department, Rome, Italy.
www.fao.org/docrep/w9900e/w9900e00.htm
(accessed August 2004).
FAO – Food and Agriculture Organization of
the United Nations. 1997b. State of the
World’s Forests 1997. FAO, Rome, Italy.
www.fao.org/forestry/foris/webview/forestry2/ind
ex.jsp?siteId=3321&sitetreeId=10107&langId=
1&geoId= (accessed August 2004).
FAO – Food and Agriculture Organization of
the United Nations. 2000. Global Fibre Supply
Model. FAO, Rome, Italy. www.fao.org/
forestry/fop/fopw/ GFSM/gfsmint-e.stm
(accessed August 2004).
FAO – Food and Agriculture Organization of
the United Nations. 2001. Forest Resources
Assessment 2000. Main Report. FAO Forestry
Paper 140. FAO, Rome, Italy.
FAO – Food and Agriculture Organization of
the United Nations. 2002. FISHSTAT Plus. FAO
Fisheries Department, Rome, Italy.
www.fao.org/fi/statist/FISOFT/FISHPLUS.asp
(accessed August 2004).
FAO – Food and Agriculture Organization of
the United Nations. 2003. State of the World’s
Forests 2003. FAO, Rome, Italy. www.fao.org/
DOCREP/005/ Y7581E/Y7581E00.HTM
(accessed August 2004).
FAO – Food and Agriculture Organization
of the United Nations. 2004a. AQUASTAT.
FAO’s Information System on Water and
Agriculture. www.fao.org/ag/agl/aglw/aquastat/
main/ index.stm (accessed August 2004).
FAO – Food and Agriculture Organization of
the United Nations. 2004b. FAOSTAT (FAO
statistical databases). FAO, Rome, Italy.
http://apps.fao.org (accessed August 2004).
FAO/IIASA – Food and Agriculture
Organization of the United Nations and
International Institute for Applied Systems
Analysis. 2000. Global Agro-Ecological Zones
(GAEZ) CD-ROM. www.fao.org/ag/agl/agll/gaez
/index.htm (accessed August 2004).
FAO/UNECE – Food and Agriculture
Organization of the United Nations and
United Nations Economic Commission for
Europe. 2000. Temperate and Boreal Forest
Resource Assessment 2000. UNECE/FAO,
Geneva, Switzerland.
FAO/USAID/World Bank – Food and
Agriculture Organization of the United
Nations, United States Agency for
International Development and World Bank.
1996. Livestock Environment Interactions:
Environmental Impact Assessment of Livestock
Production in Grassland and Mixed Farming
Systems in Temperate Zones and Grassland and
Mixed Farming Systems in Humid and Subhumid
Tropic and Sub-tropic Zones. FAO, Rome, Italy.
Foley, J. 1994. Net primary productivity in the
terrestrial biosphere: the application of a global
model. Journal of Geophysical Research 99
(D10): 20773–20783.
Goodland, R. 1990. The World Bank’s new
environmental policy on dam and reservoir
projects. International Environmental Affairs 2 (2):
109–129.
Groombridge, B and Jenkins, M D. 2002.
World Atlas of Biodiversity. Prepared by the
UNEP World Conservation Monitoring Centre.
University of California Press, Berkeley, USA.
Hoffert, M I, Caldeira, K, Benford, G, Criswell,
D R, Green, C, Herzog, H, Jain, A K, Kheshgi,
H S, Lackner, K S, Lewis, J S, Lightfoot, H D,
Manheimer, W, Mankins, J C, Mauel, M E,
Perkins, L J, Schlesinger, M E, Volk, T and
Wigley, T M L. 2002. Advanced technology
paths to global climate stability: energy for a
greenhouse planet. Science 298: 981-987.
Hofstetter, P. 1992. Persönliche Energie und
CO2 Bilanz (Personal Energy and CO2 Balance).
Second draft. Büro für Analyse und Ökologie,
Zurich, Switzerland.
R E F E R E N C E S A N D D A T A S O U R C E S
27ASIAPACIFIC 2005: THE ECOLOGICAL FOOTPRINT
House, J, Prentice, C and Le Quéré, C. 2002.
Maximum impacts of future reforestation or
deforestation on atmospheric CO2. Global
Change Biology (8): 1047–1052.
IEA – International Energy Agency. 2003. CO2
Emissions from Fuel Combustion. OECDIEA,
Paris, France. http://data.iea.org (accessed
August 2004).
IPCC – Intergovernmental Panel on Climate
Change. 1997. Revised 1996 IPCC Guidelines
for National Greenhouse Gas Inventories:
Workbook. Vol. 2. UK Meteorological Office,
IPCC, Organisation for Economic Cooperation
and Development (OECD), and International
Energy Agency (IEA). www.ipccnggip.
iges.or.jp/public/gl/invs1.htm (accessed
August 2004).
IPCC – Intergovernmental Panel on Climate
Change. 2000a. Land Use, Land-use Change,
and Forestry. Cambridge University Press,
Cambridge, UK.
IPCC – Intergovernmental Panel on Climate
Change. 2000b. Special Report on Emissions
Scenarios. Cambridge University Press,
Cambridge, UK.
IPCC – Intergovernmental Panel on Climate
Change. 2001. Climate Change 2001: The
Scientific Basis. Cambridge University Press,
Cambridge, UK.
IUCN–The World Conservation Union. 2000.
The IUCN Red List of Threatened Species.
www.redlist.org/search/searchbasic. html
(accessed August 2004).
IUCN/UNEP/WWF – IUCN–The World
Conservation Union, United Nations
Environment Programme and WWF
International. 1991. Caring for the Earth.
A Strategy for Sustainable Living. Gland,
Switzerland.
IVEM – Interfacultaire Vakgroep Energie en
Milieukunde (Center for Energy and
Environmental Studies). 1999. Groningen,
Netherlands.
JRC/GVM – EU Joint Research Centre,
Global Vegetation Monitoring Unit. 2000.
Global Land Classification Database (GLC2000).
European Commission, Brussels, Belgium.
Loh, J, Green, R, Ricketts, T, Lamoreux J,
Jenkins, M, Kapos, V and Randers, J. 2005.
The Living Planet Index: using species
population time series to track trends in
biodiversity. Philosophical Transactions of the
Royal Society 360: 289–295.
Lovink, J S, Wackernagel, M and Goldfinger,
S H. 2004. Eco-Insurance: Risk Management for
the 21st Century: Towards a Policy Framework
for a Sustainable Future. Institute for
Environmental Security, The Hague, Netherlands.
www.envirosecurity.net/conference/working/ecoi
nsurance.pdf (accessed August 2004).
Marland, G, Boden, T and Andres, R. 2000.
National Fossil Fuel CO2 Emissions 1751-2000.
Carbon Dioxide Analysis Center (US Department
of Energy), Oak Ridge, Tennessee, USA.
http://gcmd.nasa.gov/records/GCMD_CDIAC_
CO2_EMISS_MODERN.html
(accessed August 2004).
Meadows, D H, Randers, J and Meadows, D
L. 2004. Limits to Growth: The 30-Year Update.
Chelsea Green Publishing Company, White River
Junction, Vermont, USA. www.chelseagreen.
com/2004/items/limitspaper (accessed
August 2004).
Meyer, A. 2001. Contraction & Convergence:
The Global Solution to Climate Change.
Schumacher Briefings #5 and Global Commons
Institute. Green Books, UK. www.schumacher.
org.uk/schumacher_b5_ climate_change.htm
(accessed August 2004).
Monfreda, C, Wackernagel, M and Deumling,
D. 2004. Establishing national natural capital
accounts based on detailed Ecological Footprint
and biological capacity assessments. Land Use
Policy 21: 231–246.
Pacala, S and Socolow, R. 2004. Stabilization
wedges: solving the climate problem for the next
50 years with current technologies. Science 305:
968–972.
Pauly, D and Christensen, V. 1995. Primary
production required to sustain global fisheries.
Nature 374: 255–257.
Pauly, D, Christensen, V, Dalsgaard, J,
Froese, R and Torres, F Jr. 1998. Fishing down
marine food webs. Science 279: 880–883.
Postma, H and Zijlstra, J J (eds). 1988.
Continental Shelves. Ecosystems of the World.
Vol. 27. Elsevier Science Publishing Company
Inc., New York, USA.
Ramankutty, N and Monfreda, C. 2004. Net
Primary Productivity of World’s Grasslands.
SAGE – Center for Sustainability and Global
Environment, University of Wisconsin, Madison,
USA (unpublished).
Roughgarden, J and Smith, F. 1996. Why
fisheries collapse and what to do about it. Proc.
Nat. Acad. Sci. (USA) 93: 5078–5083.
RWEDPA – Regional Wood Energy
Development Program in Asia. 2000. Wood
Energy Database. FAO-RWEDP. www.rwedp.org
(accessed August 2004).
Scarnecchia, D. 1985. The animal unit and
animal unit-equivalent concepts in range
science. Journal of Range Management 38(4):
346–349.
UNDESA – United Nations Department of
Economic and Social Affairs – Population
Division. 2003. World Population in 2300 –
Highlights. UNDESA, NY. www.un.org/esa/
population/publications/ longrange2/Long_
range_report.pdf (accessed August 2004).
UNDESA. 2005. UN Comtrade – United Nations
Commodity Trade Statistics Database. UNDESA,
NY. http://unstats.un.org/unsd/comtrade/
(accessed April 2005).
UNEP/GRID-Arendal – United Nations
Environment Programme GRID-Arendal.
2004. Aral Sea. www.grida.no/aral/aralsea/
english/arsea/arsea.htm (accessed August
2004).
28 ASIA-PACIFIC 2005: THE ECOLOGICAL FOOTPRINT
USDA – United States Department of
Agriculture. 2004. Agricultural Research Service
Nutrient Database. www.nal.usda.gov/
fnic/foodcomp/search/ (accessed August 2004).
Wackernagel, M and Monfreda, C. 2004.
Ecological Footprints and energy. In Cleveland,
C J (ed) Encyclopedia of Energy, Elsevier.
Wackernagel, M, Monfreda, C, Schulz, N B,
Erb, K-H, Haberl, H and Krausmann, F. 2004.
Calculating national and global Ecological
Footprint time series: resolving conceptual
challenges. Land Use Policy 21: 271–278.
Wackernagel, M, Schulz, B, Deumling, D,
Callejas Linares, A, Jenkins, M, Kapos, V,
Monfreda, C, Loh, J, Myers, N, Norgaard, R,
and Randers, J. 2002. Tracking the ecological
overshoot of the human economy. Proc. Nat.
Acad. Sci. (USA) 99(14): 9266–9271.
Wackernagel, M, White, K S, and Moran, D.
2004. Using Ecological Footprint accounts: from
analysis to applications. Int. J. Environment and
Sustainable Development 3(3/4): 293–315.
WCED – World Commission on Environment
and Development. 1987. Our Common Future.
Oxford University Press, Oxford, UK.
WCMC – World Conservation Monitoring
Centre. 1998. Freshwater Biodiversity: A
Preliminary Global Assessment. By
Groombridge, B and Jenkins, M D. World
Conservation Press, Cambridge, UK.
WCMC – World Conservation Monitoring
Centre. 2000. Global Biodiversity: Earth’s Living
Resources in the 21st Century. By
Groombridge, B and Jenkins, M D. World
Conservation Press, Cambridge, UK.
Wilson, E O. 2002. The Future of Life. A. Knopf,
New York, USA.
WWF International. 2000. A Place for Dams in
the 21st Century? Gland, Switzerland.
WWF International. 2004. Living Planet
Report. Gland, Switzerland.
MAP SOURCES
Map 1
Global Footprint Network and SAGE, University
of Wisconsin. Distribution builds on Gridded
Population of the World (version 2) from CIESIN
at Columbia University (http://sedac.ciesin.
columbia.edu/plue/gpw/index.html?main.html&2.
1995 population distribution is scaled to each
country’s 2001 population.
Map 2
UNEP-WCMC. GIS analysis by R. Lesslie (ANU),
method developed for the Australian Heritage
Commission.
Maps 3, 4 and 5
Moran, D, Global Footprint Network and
LUMES, Lund University.
Map 6
Global Footprint Network, 2004. Living on Less,
Living on More. www.footprintnetwork.org
Map 7
Global Footprint Network, 2004. Ecological
Debtors and Creditors.
www.footprintnetwork.org
ACKNOWLEDGEMENTS
The authors would like to thank the following
people for their helpful comments: Mubariq
Ahmed, Marta Ballesteros, John Barrett,
Stuart Bond, Susan Brown, Kim Carstensen,
Stuart Chapman , Paul Chatterton, Ute Collier,
Andy Cornish, Tom Crompton, Simon Cripps,
Clifton Curtis, Mao Da, Pooran Desai, Matthias
Diemer, Anton Fernhout, Aimee Gonzales,
Chandra Gurung, Lauren Gwin, Ali Habib, Chris
Hails, Chris Howe, Marianne Kermisch, Kesaia,
Babar Naseem Khan, Birgit Kohlmaier-Schacht,
Paul King, Leonardo Lacerda, Sam Lee, Herve
Lefeuvre, Manfred Lenzen, Sue Lieberman, Lin Li,
Louis Lin, Tony Long, Isabelle Louis,
Nan MacHardy, Sally MacPhail, Anil Manandhar,
Dr T R Manoharan, Claude Martin,
Robert Mather, Liz Mclean, Deirdre Moor,
Jennifer Morgan, Paul Mosley, Richard Mott,
Dieter Müller, Kinzang Namgay, Robert Napier,
Ray Nias, Sally Nicholson, Amanda Nickson,
Cliona O’Brien, Dermot O’Gorman,
Naobi Okayasu, Sian Owen, Dennis Pamlin,
Lei Peng, Jamie Pittock, Tom le Quesne,
Peter Ramshaw, Will Reidhead, Taylor Ricketts,
Etika Rupeni, Liam Salter, Dionysius Sharma,
Gordon Shepherd, Katherine Short,
Evgeny Shvarts, Craig Simmons, Stephan Singer,
T Ravi Singh, Rob Soutter, Rod Sterne,
Tabunakawai, Lory Tan, Rod Taylor, Kristin Teien,
Tien-ake Tiyapongpattana, Ed Tongson,
Paul Toni, Walter Wagner, Pip Walsh,
Dominic White,Tommy Wiedmann, Lisette Wilson,
Angie Woo, Sejal Worah, Christoph Zockler,
Chunquan Zhu, Xinqing Zou. They also
acknowledge Jon Foley, Navin Ramankutty,
and Chad Monfreda from SAGE, University of
Wisconsin for discussions on carbon flux.
Any errors, however, remain the responsibility
of the authors.
The authors would further like to thank the
Dudley Foundation, the Flora Family Fund,
the Lawrence Foundation, the Max and Anna
Levinson Foundation, the San Francisco
Foundation, the Soup Community, Grant Abert,
Margrit and Frank Balmer, Gerald O Barney,
Urs and Barbara Burckhardt, the estate of
Lucius Burckhardt, Max and Rosemarie Burkhard,
Andre Carothers, Anthony D. Cortese,
Sharon Ede, Eric Frothingham, Margaret Haley,
Peter Kilkus, Peter and Murielle Koechlin,
Tamas Makray, Ruth and Hans-Edi Moppert,
Kaspar Müller, Charles McNeill, William G Reed,
Peter Schiess, Daniela Schlettwein, Peter Seidel,
Dieter Steiner, Dale and Dianne Thiel, Lynne and
Bill Twist, Caroline Wackernagel, Hans and
Johanna Wackernagel, Isabelle Wackernagel,
Marie-Christine Wackernagel, Oliver and Bea
Wackernagel, Yoshihiko Wada, Tom Welte,
the partner organizations of Global Footprint
Network, and Nadya Bodansky, John Crittenden,
Katherine Loo and Gary Moore from Cooley
Godward LLP for their generous support of
Ecological Footprint research.
T H E W W F N E T W O R K
AUSTRALIALevel 13235 Jones StreetUltimoNSW 2007Tel: +61 2 9281 5515
AUSTRIAOltakringer Strasse114-116 1160 ViennaTel: +431 488 170
BELGIUMBd Emile Jacqmain 901000 BrusselsTel: +32 2 340 09 99
BHUTANPost Box 210, Chubachu,ThimphuTel: +975 2 323 528
BOLIVIAAv. Beni Cale Los PitonesNo. 2070 Santa CruzTel: +591 3 31150 41
BRAZILSHIS EQ QL 6/8Conjunto E – 2° andar71620-430 BrasiliaTel: +55 61 364 7400
CANADA245 Eglinton Ave East, Suite410,Toronto, Ontario M4P 3J1Tel: +1 416 489 8800
CAUCASUSM. Magomayev Str.101/103 A2 1004Tel: +995 32 33 0154
CENTRAL AFRICABastos BP 6776, YaoundeCameroonTel: +237 221 70 83
CENTRAL AMERICAPO Box 629-2350San Jose, Costa RicaTel: +506 253 4960
CHINAWen Hua GongBeijing Working People’sCulturePalaceBeijing 100006Tel: +86 10 6522 7100
COLOMBIACarrera 35 No 4A-25San Fernando, Cali, ValleTel: +57 2 558 2577
DANUBE/CARPATHIANMariahilferstrasse 88a/3/9A-1070 Vienna, AustriaTel: +431 52 45 470
DENMARKRyesgade 3 F2200 Copenhagen NTel: +45 35 36 36 35
EASTERN AFRICA5th Floor of ACS PlazaLenana Road No 1/1203Nairobi, KenyaTel: +254 20 3877 355
EUROPEAN POLICY36 Avenue de Tervuren -B121040 Brussels, BelgiumTel: +32 2 743 88 00
FINLANDLintulahdenkatu 1000500 Helsinki 50Tel: +358 9 774 0100
FRANCE188 rue de la Roquette75011 ParisTel: +33 1 55 25 84 84
GERMANYRebstoeckerstrasse 5360326 Frankfurt/ MainTel: +49 69 79 14 40
GREECE26 Filellinon St105 58 AthensTel: +30 210 331 4893
HONG KONGNo. 1 Tramway Path CentralHong KongTel: +852 2526 1011
HUNGARYNémetvölgyi út 78/b1124 BudapestTel: +36 1 214 5554
INDIA172-B Lodi RoadNew Delhi 110 003Tel: +91 11 5150 4815
INDOCHINA40 Cat Linh StreetDong Da DistrictHanoi, Viet NamTel: +84 4 736 6375
INDONESIAKantor Taman A9Unit A-1 JLMega Kuningan Lot8.9/A9 KawasanMega Kuningan Jakarta 12950Tel: +62 21 576 1070
ITALYVia Po 25/c, 00198 RomeTel: +39 06 844 9 71
JAPANNihonseimei AkabanebashiBuilding3-1-14 Shiba, Minato-kuTokyo 105-0014Tel: +81 3 3769 1711
MACROECONOMICSFOR SUSTAINABLEDEVELOPMENT1250 24th Street NWWashington, DC 20037-1193, USATel: +1 202 778 9752
MADAGASCAR ANDWEST INDIAN OCEANBP 738, Antananarivo 101Tel: +261 20 22 348 85
MALAYSIA49 Jalan SS23/1547400 Petaling JayaSelangorTel: +60 3 7803 3772
MEDITERRANEANVia Po 25/c00198 Rome, ItalyTel: +39 06 844 97227
MEXICOAve Mexico No 51Col. Hipodromo Condesa06170 Mexico, DFTel: +525 55 5286 5631
MONGOLIAKhudaldaany Street 5Ulaanbataar 46Tel: +976 11 311 659
NEPALBaluwater Kathmandu 2Post Box 7660KathmanduTel: +977 1 4410 942
NETHERLANDSBoulevard 123707 BM ZeistTel: +31 30 6937 333
NEW ZEALANDThe Treehouse BotanicGardenGlenmore StreetWellingtonTel: +64 4 499 2930
NORWAYPostboks 6784St Olavs Plass0130 OsloTel: +47 22 03 65 00
PAKISTANFerozepur RoadLahore 54600Tel: +92 42 586 2360
PERUTrinidad Moran853 Lince Lima-14Tel: +51 1 440 5550
PHILIPPINES4th Floor JBD Plaza65 Mindanao AvenueBagongPag-asaQuezon CityTel: +63 2 929 1258
POLANDul. Wisniowa 38 m. 1Magdalena Dul02-520 WarsawTel: +48 22 849 84 69
RUSSIAFrom Europe:Account No WWF 232FLIP-PostSuite 25176 Finchley RoadLondon NW3 6BTUnited Kingdom
From the USA:Account No WWF 232208 East 51st StreetSuite 295New York, NY 10022, USATel: +7 095 727 0939
SOUTH AFRICAMillennia Park16 Stellentia AvenueDie Boord 7613,StellenboschTel: +27 21 888 2800
SOUTHERN AFRICAPO Box CY 1409Causeway, HarareZimbabweTel: +263 4 703902
SOUTH PACIFIC4 Ma’afu Street SuvaPrivate Mail Bag, GPO Suva, FijiTel: +679 331 5533
SPAINGran Via de San
Francisco 828005 MadridTel: +34 91 354 05 78
SWEDENUlriksdals Slott, 170 81 SolnaTel: +46 8 624 74 00
SWITZERLANDHohlstrasse110 8010 ZürichTel: +41 44 297 21 21
TANZANIAPO Box 63117, Dar esSalaamTel: +255 22 27 00077
THAILANDAsian Institute of Technology104 Outreach BuildingBangkok 10501Tel: +66 2 524 6168
TURKEYPK 971, Sirkeci 34436,IstanbulTel: +90 212 528 20 30
UNITED KINGDOMPanda HouseWeyside ParkGodalmingSurrey GU7 1XRTel: +44 1483 426 444
UNITED STATES1250 24th Street NWWashington, DC 20037-1193Tel: +1 202 293 4800
WESTERN AFRICA08 BP 1776Abidjan 08Côte d’IvoireTel: +225 22 47 20 86
ASSOCIATES
ARGENTINAFUNDACION VIDA SIL-VESTREDefensa 251, 6° PisoC1065 Buenos AiresTel: +54 11 4343 4086
ECUADORFUNDACION NATURACasilla 17-01-253, QuitoTel: +593 22 503 385
NIGERIANIGERIAN CONSERVATIONFOUNDATIONLekki Conservation CentreKm-19 Lagos-EpeExpressway Lekki LagosNigeriaTel: +234 1 26242 497
VENEZUELAFUDENAApartado Postal 70776Caracas 1071-ATel: +58 212 238 2930
WWF INTERNATIONALAvenue du Mont-Blanc1196 Gland, SwitzerlandTel: +41 22 364 9111Fax: +41 22 364 8836Website: www.panda.org