The 2012 Harris Poll Annual RQ® - Ranking The Brands reputations of the Most...The 2012 Harris Poll...
26
2012 RQ® | USA Summary Report | February 2012 The 2012 Harris Poll Annual RQ® Public Summary Report A Survey of the U.S. General Public Using the Reputation Quotient® 13 th Annual RQ Study 17,555 people interviewed RQ Ratings: December 2nd – December 19th, 2011 © Harris Interactive 2011. All rights reserved. Republication or redistribution of this information without permission is strictly prohibited.
-
Upload
hoangkhanh -
Category
Documents
-
view
214 -
download
1
Transcript of The 2012 Harris Poll Annual RQ® - Ranking The Brands reputations of the Most...The 2012 Harris Poll...

2012 RQ® | USA Summary Report | February 2012
The 2012 Harris Poll Annual RQ® Public Summary Report
A Survey of the U.S. General Public Using the Reputation Quotient®
13th Annual RQ Study
17,555 people interviewed
RQ Ratings: December 2nd –
December 19th, 2011
© Harris Interactive 2011. All rights reserved. Republication or redistribution of this information without permission is strictly prohibited.

2012 RQ® | USA Summary Report | February 2012
Survey of the U.S. General Public
The Reputations of the Most Visible Companies - Executive Summary
2 © Harris Interactive

2012 RQ® | USA Summary Report | February 2012
Apple supplants Google for the top spot and Berkshire Hathaway loses luster in Harris Poll Reputation Quotient® (RQ®) 2012 study
© Harris Interactive 3
Apple garners a score of 85.62, the highest for any company in the history of the RQ, and the Technology industry as a whole represents three of the top four companies. Apple’s score is the culmination of 12 straight years of improvement, up over 20 points
from 62.1 in 2000. In slipping to 2nd place behind Apple, Google falls slightly from 84.05 to 82.82 but still
maintains an excellent position, while Amazon jumps from 8th to 4th this year. Bank of America, AIG and Goldman Sachs find themselves in dangerous territory, occupying the same sub-50.0 space that defunct companies occupied in years past before expiring. Past sub-50.0 RQ performers include the now-deceased Enron, Adelphia and WorldCom.
Berkshire Hathaway, 2010 RQ winner, falls by 7 points and slides from 4th place in 2011 to 24th in 2012. The recent financial scandal appears to have done damage in all six reputation dimensions.
Guide to RQ Scores 80 & above: Excellent | 75-79: Very Good | 70-74: Good | 65-69: Fair | 55-64: Poor | 50-54: Very Poor | Below 50: Critical

2012 RQ® | USA Summary Report | February 2012
A quarter of the Most Visible Companies see significantly lower RQ scores
© Harris Interactive
Company YOY Decline in RQ Score Bank of America -9.08
Berkshire Hathaway -7.28
Wells Fargo & Co. -6.65
Goldman Sachs -6.33
JPMorgan Chase -6.31
AT&T -4.22
General Mills -3.65
Time Warner -3.51
Best Buy -3.24
Hewlett-Packard -3.02
Comcast -2.95
Procter & Gamble Co. -2.89
Johnson & Johnson -2.68
Southwest Airlines -2.28
JCPenney -2.18
Compared to these 15 companies, only 4 companies have gained in reputation (Toyota, General Motors, BP and Apple).
• This is the reverse of the trend seen in 2011, when only 2 companies worsened and 18 increased.
Financial Services companies suffered 4 of the 5 worst losses in reputation in the last year.
• Positive perceptions of the industry declined by five points after seeing a six-point bounce in 2011.
4

2012 RQ® | USA Summary Report | February 2012
Corporate America is more tarnished today than a year ago
© Harris Interactive 5
The positive momentum from 2011 has faded in 2012 Just 2 in 10 Americans say that corporate America’s reputation is positive.
Only 9% of respondents said that the reputation of corporate America improved over
the past year, while 60% said it has declined.
On an individual basis, industries have either declined or stayed flat. • The Automotive industry is a notable exception, adding another 7 points to positive
perceptions after a 15-point increase between 2010 and 2011.

2012 RQ® | USA Summary Report | February 2012
Industries positioned as part of the solution to America’s economic woes are best able to weather negative perceptions surrounding corporate America
© Harris Interactive 6
Industries that are seen to be helping America’s ailing economy tend to have higher reputations.
Technology and Retail: 53% and 39% of Americans, respectively, see them as part of the solution. Examples of specific RQ scores are:
• Apple: 85.62
• Whole Foods Market: 80.14
Industries that are perceived to be hurting the economy tend to have lower reputations.
Financial Services and Banking: 70% and 75% of Americans, respectively, see them as part of the problem. Examples of specific RQ scores are:
• AIG: 46.18
• Goldman Sachs: 47.57
• Bank of America: 49.85
• JPMorgan Chase: 54.84
Guide to RQ Scores 80 & above: Excellent | 75-79: Very Good | 70-74: Good | 65-69: Fair | 55-64: Poor | 50-54: Very Poor | Below 50: Critical

2012 RQ® | USA Summary Report | February 2012
Supporting Data
7 © Harris Interactive

2012 RQ® | USA Summary Report | February 2012
The Reputation Quotient® (RQ ®) Research Instrument 20 Attributes folded into 6 Dimensions
© Harris Interactive 8
Reputation
Emotional Appeal
Financial Performance
Workplace Environment
Products & Services
Vision & Leadership
Social Responsibility
•Feel Good About •Admire and Respect •Trust
•Market Opportunities •Excellent Leadership •Clear Vision for the Future
•Rewards Employees Fairly •Good Place to Work •Good Employees
•Outperforms Competitors •Record of Profitability •Low Risk Investment •Growth Prospects
•Supports Good Causes •Environmental Responsibility •Community Responsibility
•High Quality •Innovative •Value for Money •Stands Behind
RQ Score = [(Sum of ratings on the 20 attributes)/ (the total number of attributes answered X 7)] X 100. Maximum RQ = 100.

2012 RQ® | USA Summary Report | February 2012
Rank 1-15 RQ Rank 16-30 RQ Rank 31-45 RQ Rank 46-60 RQ
1 Apple 85.62 16 Kohl's 77.95 31 Toyota Motor Corporation 73.53 46 Chevron* 64.72
2 Google 82.82 17 PepsiCo 77.78 32 Hewlett-Packard 73.41 47 Sears* 64.26
3 The Coca-Cola Company 81.99 18 General Mills 77.39 33 Starbucks 72.97 48 Time Warner 63.38
4 amazon.com 81.92 19 Costco 76.72 34 Best Buy 72.68 49 T-Mobile* 62.82
5 Kraft Foods 81.62 20 Nike 75.95 35 General Electric 72.6 50 Chrysler 60.3
6 The Walt Disney Company 81.28 21 USAA* 75.55 36 Dell 72.59 51 ExxonMobil 60.01
7 Johnson & Johnson 80.45 22 Lowe's* 75.39 37 Walgreens* 72.1 52 Wells Fargo & Co. 59.5
8 Whole Foods Market 80.14 23 IBM 75.11 38 McDonald's 71.77 53 Comcast 59.1
9 Microsoft 79.87 24 Berkshire Hathaway 75.02 39 JCPenney 71.23 54 News Corp* 57.14
10 UPS 79.75 25 Ford Motor Company 74.83 40 Verizon Communications 71.16 55 Citigroup 55.95
11 Sony 79.22 26 Southwest Airlines 74.6 41 Walmart 69.25 56 JPMorgan Chase 54.84
12 Honda Motor Company 78.95 27 Target 74.26 42 Netflix* 68.12 57 BP 53.5
13 Samsung* 78.11 28 Boeing* 74.04 43 Sprint Nextel 65.9 58 Bank of America 49.85
14 Home Depot 78.11 29 Hyundai* 73.92 44 General Motors 65.31 59 Goldman Sachs 47.57
15 Procter & Gamble Co. 78.09 30 Macy's* 73.63 45 AT&T 65.09 60 AIG 46.18
* New to 2012 RQ Study and/or not measured in the 2011 RQ
The 2012 RQ® The Reputations of the Most Visible Companies
© Harris Interactive 9
Guide to RQ Scores 80 & above: Excellent | 75-79: Very Good | 70-74: Good | 65-69: Fair | 55-64: Poor | 50-54: Very Poor | Below 50: Critical

2012 RQ® | USA Summary Report | February 2012
Rank 1-15 RQ X
Rank 16-30 RQ X
Rank 31-45 RQ X
Rank 46-60 RQ
1 Google 84.05 16 Microsoft 80.16 31 Facebook* 74.12 46 Shell 65.96
2 Johnson & Johnson 83.13 17 Whole Foods Market 79.57 32 Nike 74.11 47 Monsanto 65.18
3 3M Company 82.56 18 Honda Motor Company 79.1 33 Pfizer 73.48 48 Sprint Nextel Corporation 64.27
4 Berkshire Hathaway 82.3 19 PepsiCo 78.21 34 JCPenney* 73.41 49 American Airlines* 62.31
5 Apple 82.05 20 Costco 78.03 35 McDonald's 72.77 50 Comcast 62.05
6 Intel Corporation 81.94 21 Kohl's* 77.55 36 Starbucks 72.05 51 Delta Airlines 61.17
7 Kraft Foods 81.67 22 Unilever* 77.19 37 Dell 71.9 52 JPMorgan Chase 61.15
8 amazon.com 81.14 23 Southwest Airlines 76.88 38 State Farm Insurance 71.73 53 ExxonMobil 61.09
9 General Mills 81.04 24 Home Depot 76.83 39 Verizon Communications 71.64 54 General Motors 60.12
10 The Walt Disney Company 81.04 25 Hewlett-Packard 76.43 40 Walmart 69.35 55 Bank of America 58.93
11 Procter & Gamble Co. 80.98 26 IBM 76.27 41 AT&T 69.31 56 Chrysler 58.37
12 SC Johnson 80.74 27 Best Buy 75.92 42 The Allstate Corporation 68.28 57 Citigroup 57.45
13 UPS 80.51 28 Target 74.91 43 Toyota Motor Corporation 68.25 58 Goldman Sachs 53.9
14 Sony 80.44 29 Ford Motor Company 74.61 44 Time Warner 66.89 59 BP* 49.82
15 The Coca-Cola Company 80.38 30 General Electric 74.22 45 Wells Fargo & Co. 66.15 60 AIG 47.77
* New to 2011 RQ Study and/or not measured in the 2010 RQ
The 2011 RQ® The Reputations of the Most Visible Companies
© Harris Interactive 10
Indicates companies that have dropped off from Most Visible List in 2012
Guide to RQ Scores 80 & above: Excellent | 75-79: Very Good | 70-74: Good | 65-69: Fair | 55-64: Poor | 50-54: Very Poor | Below 50: Critical

2012 RQ® | USA Summary Report | February 2012
85.6
82.1 79.3
77.8 77.0
74.6
70.6
68.3 70.0 68.3 68.3 67.4
62.1
73.4 76.4 76.4 75
77.2
69.1 69.4
73.2 73 73.2
79.2
75.5
81.2
2012 2011 2010 2009 2008 2007 2006 2005 2004 2003 2002 2001 2000
Hewlett-Packard
Apple
11 © Harris Interactive
RQ scores 2000-2012
Apple has shown strong, steady improvement since first being measured in 2000, leading to the highest RQ ever achieved for any company in 13 years HP, once dominant over Apple, has drifted downward in the same timeframe
Guide to RQ Scores 80 & above: Excellent | 75-79: Very Good | 70-74: Good | 65-69: Fair | 55-64: Poor | 50-54: Very Poor | Below 50: Critical

2012 RQ® | USA Summary Report | February 2012
12 © Harris Interactive
2%
5%
15%
21%
22%
16%
15%
4%
2%
5%
16%
23%
22%
14%
12%
6%
7 – Very good
6
5
4
3
2
1 – Very bad
Not sure
2012 2011
Only 2 in 10 Americans have a positive perception of corporate reputation as it stands now
Current Reputation of Corporate America
Base: General Public 2012 (n=12,961), General Public 2011 (n=30,104) Q1310 How would you rate the overall reputation of corporate America today, where “1” means it has a very bad reputation and “7” means it has a very good reputation?
2012: 22% NET positive 2011: 23% NET positive
2012: 53% NET negative 2011: 48% NET negative

2012 RQ® | USA Summary Report | February 2012
13 © Harris Interactive
There is a strong perception that corporate America’s reputation is on the wane
Base: General Public 2012 (n=12,961), General Public 2011 (n=30,104) Q1311 Which one of the following best captures your opinion of how the reputation of corporate America has changed over the past year? 1. It has improved a lot. 2. It has improved a little. 3. It has basically stayed the same. 4. It has declined a little. 5. It has declined a lot.
1%
8%
31%
31%
29%
2%
17%
38%
24%
20%
Improved a lot
Improved a little
Stayed the same
Declined a little
Declined a lot
2012 2011
Perception of Past Year Change in Corporate America’s Reputation
2012: 60% NET decline 2011: 44% NET decline
2012: 9% NET improve 2011: 19% NET improve

2012 RQ® | USA Summary Report | February 2012
Number of Companies with RQ Above 80.0 2003-2012
Number of Companies with RQ < 50.0 2003-2012
© Harris Interactive
Number of companies with score of 80.0 or higher is halved; companies under 50.0 risk remaining viable
Johnson & Johnson
Microsoft
3M
Johnson & Johnson
Harley-Davidson
Johnson & Johnson
Johnson & Johnson
Intel
General Mills
Kraft
Johnson & Johnson
Sony
Coca-Cola
Kraft
amazon.com
Berkshire Hathaway
Johnson & Johnson
3M
SC Johnson
Intel
Johnson & Johnson
3M
Berkshire Hathaway
Apple
Intel
Kraft
amazon.com
General Mills
Disney
Procter & Gamble
SC Johnson
UPS
Sony
Coca-Cola
Microsoft
Apple
Coca-Cola
amazon.com
Kraft
Disney
Johnson & Johnson
Whole Foods
2007 2003 2006 2008 2009 2010 2011 2012 2004 2005
Enron*
Global Crossing*
WorldCom*
Andersen*
Adelphia*
Enron*
MCI (formerly WorldCom)*
Adelphia*
Halliburton AIG Fannie Mae*
AIG
Freddie Mac*
BP
AIG
Bank of America
Goldman Sachs
AIG
Enron*
WorldCom*
Global Crossing*
Enron*
MCI*
* = Companies that have ceased to exist or subjected to government takeover
Guide to RQ Scores 80 & above: Excellent | 75-79: Very Good | 70-74: Good | 65-69: Fair | 55-64: Poor | 50-54: Very Poor | Below 50: Critical
14

2012 RQ® | USA Summary Report | February 2012
1. Bank of America -9.08
2. Berkshire Hathaway -7.28
3. Wells Fargo & Co. -6.65
4. Goldman Sachs -6.33
5. JPMorgan Chase -6.31
6. AT&T -4.22
7. General Mills -3.65
8. Time Warner -3.51
9. Best Buy -3.24
10. Hewlett-Packard -3.02
11. Comcast -2.95
12. Procter & Gamble Co. -2.89
13. Johnson & Johnson -2.68
14. Southwest Airlines -2.28
15. JCPenney -2.18
There are 19 notable changes in reputation among the 48 companies measured in both 2011 and 2012, but just 4 are improvements 4 of the 5 biggest declines are seen in Financial Services
© Harris Interactive 15
Significant Declines in RQ 2012 v. 2011
Significant Improvements in RQ 2012 v. 2011
1. Toyota Motor Corporation 5.28 2. General Motors 5.19 3. BP 3.68 4. Apple 3.57

2012 RQ® | USA Summary Report | February 2012
Apple dominates on Vision and Leadership; Amazon, despite lacking a clear human connection to consumers, wins Emotional Appeal
16 © Harris Interactive
Emotional Appeal
1. amazon.com 82.90
2. Kraft Foods 82.33
3. UPS 82.14
4. Apple 81.60
5. The Coca-Cola Company 81.38
Financial Performance
1. Apple 87.93
2. Google 84.56
3. The Coca-Cola Company 83.86
4. The Walt Disney Company 83.78
5. amazon.com 82.98
Products & Services
1. Apple 87.33
2. Google 84.55
3. Kraft Foods 83.73
4. Sony 83.51
5. amazon.com 83.27
Social Responsibility
1. Whole Foods Market 83.35
2. Apple 81.56
3. The Coca-Cola Company 81.22
4. Johnson & Johnson 79.42
5. The Walt Disney Company 79.39
Vision & Leadership
1. Apple 88.38
2. The Coca-Cola Company 84.17
3. amazon.com 83.85
4. Google 83.85
5. The Walt Disney Company 82.84
Workplace Environment
1. Apple 86.39
2. Google 85.32
3. The Coca-Cola Company 82.90
4. Microsoft 82.59
5. Kraft Foods 81.33
Corporate Leaders on the Six Reputation Dimensions
Guide to RQ Scores 80 & above: Excellent | 75-79: Very Good | 70-74: Good | 65-69: Fair | 55-64: Poor | 50-54: Very Poor | Below 50: Critical
2012 RQ® | USA Summary Report | February 2012
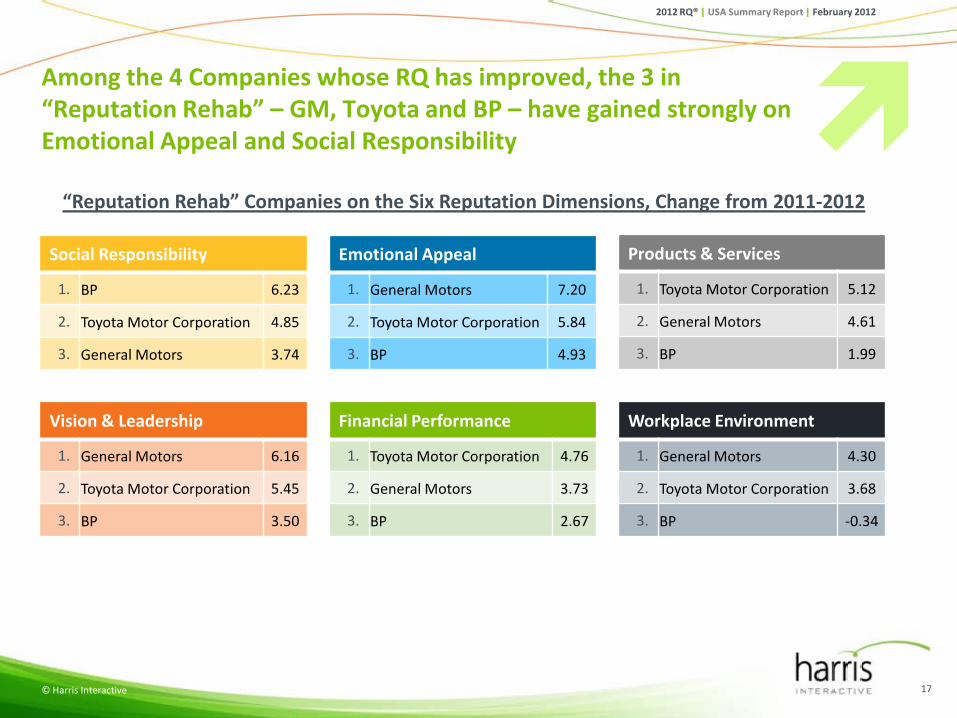
Among the 4 Companies whose RQ has improved, the 3 in “Reputation Rehab” – GM, Toyota and BP – have gained strongly on Emotional Appeal and Social Responsibility
17 © Harris Interactive
Emotional Appeal
1. General Motors 7.20
2. Toyota Motor Corporation 5.84
3. BP 4.93
Financial Performance
1. Toyota Motor Corporation 4.76
2. General Motors 3.73
3. BP 2.67
Products & Services
1. Toyota Motor Corporation 5.12
2. General Motors 4.61
3. BP 1.99
Social Responsibility
1. BP 6.23
2. Toyota Motor Corporation 4.85
3. General Motors 3.74
Vision & Leadership
1. General Motors 6.16
2. Toyota Motor Corporation 5.45
3. BP 3.50
Workplace Environment
1. General Motors 4.30
2. Toyota Motor Corporation 3.68
3. BP -0.34
“Reputation Rehab” Companies on the Six Reputation Dimensions, Change from 2011-2012

2012 RQ® | USA Summary Report | February 2012
Industry Reputation and the Economy
18 © Harris Interactive

2012 RQ® | USA Summary Report | February 2012
10%
11%
16%
17%
22%
29%
31%
35%
44%
47%
49%
53%
57%
58%
76%
12%
12%
15%
17%
22%
23%
20%
23%
26%
25%
22%
25%
24%
21%
12%
76%
71%
67%
62%
52%
44%
44%
38%
24%
24%
24%
17%
15%
14%
7%
Government
Tobacco
Banking
Financial Services
Airline
Insurance
Pharmaceutical
Energy
Manufacturing
Automotive
Telecommunications
Consumer Products
Retail
Travel and Tourism
Technology
Positive Rep Neutral Negative Rep
19 © Harris Interactive
Technology enjoys reputation dominance; Government lands in last place behind the Tobacco industry
Industry Reputation Ratings
Base: General Public (n=12,961) Q1314 For this question, we'd like you to think about industries in general. How would you rate the overall reputation of the following industries, where “1” means the industry has a ”Very Bad” reputation and “7” means the industry has a ”Very Good” reputation?
Pos Rep- Neg Rep
69
44
42
36
25
23
20
-3
-13
-15
-30
-45
-51
-60
-66

2012 RQ® | USA Summary Report | February 2012
Positive Ratings 2010 Positive Ratings 2011 Positive Ratings 2012 % % %
1. Technology 72 75 76 2. Travel and Tourism 52 55 58 3. Retail 52 57 57 4. Consumer Products 49 53 53 5. Telecom 47 51 49 6. Automotive 25 40 47 7. Manufacturing 40 43 44 8. Energy/Utilities 33 36 35 9. Pharmaceutical 29 32 31 10. Insurance 23 27 29 11. Airlines 24 25 22 12. Financial Services 16 22 17 13. Tobacco 11 11 11
The Automotive industry continues impressive improvement
Automotive industry has now nearly doubled positivity on reputation since 2010; Financial Services returns to 2010 level.
20 © Harris Interactive

2012 RQ® | USA Summary Report | February 2012
53%
41%
39%
36%
34%
30%
7%
12%
28%
31%
15%
12%
13%
11%
12%
26%
24%
36%
36%
48%
42%
49%
45%
31%
21%
28%
30%
12%
9%
5%
14%
28%
19%
21%
9%
19%
35%
36%
34%
42%
50%
52%
70%
75%
79%
Technology Manufacturing
Retail Consumer Products Travel and Tourism
Telecommunications Tobacco
Airline Automotive
Energy Pharmaceutical
Insurance Financial Services
Banking Government
Part of Solution Neither Part of Problem
21 © Harris Interactive
Technology is sole industry seen by majority as helping solve economy’s problem; Government most likely seen as part of the problem
Base: General Public (n=12,961) Q6030 Thinking about the role each of the following sectors played in the current state of the American economy, do you think each of the following sectors is a part of the problem, a part of the solution, or are you unsure?
Industry Part of Economic Solution or Economic Problem
The benefactors – helping fix the
economy
The malefactors – receiving blame
for economic woes
Neither/Nor – large pluralities view as neither
solution nor problem
2012 RQ® | USA Summary Report | February 2012
The 2012 RQ®
Methodology
22 © Harris Interactive

2012 RQ® | USA Summary Report | February 2012
Methodological Overview
© Harris Interactive 23
• Harris Interactive has used the Harris Reputation Quotient®(RQ) to measure the reputations of the most visible companies in the U.S. since 1999. The 2012 RQ study represents the 13th consecutive year of measuring corporate reputation in the U.S.
• The Annual RQ study involves process which begins with a Nominations Phase and is followed by a Ratings Phase, where we measure the reputation of the most visible companies in the U.S. and other companies representing the major industries in the U.S.
• The following summarizes the methodological details for both phases of the Annual RQ study.
Nominations Phase – Identifying the “Most Visible” Companies • The Annual RQ study begins with a Nominations Phase which is used to identify the companies with the most “visible”
reputations according to the General Public. All respondents are asked to name companies that stand out as having the best and worst reputations overall. Two open-end questions are used:
– Of all the companies that you’re familiar with or that you might have heard about, which TWO - in your opinion - stand out as having the BEST reputations overall?
– Of all the companies that you’re familiar with or that you might have heard about, which TWO - in your opinion - stand out as having the WORST reputations overall?
• Nominations from all interviews are tallied with subsidiaries and brand names collapsed within the parent company. Online nominations are summed to create a total number of nominations for each company. The final list of the 60 most visible companies in the U.S. is measured in the RQ Ratings Phase long with other companies representing the major industries in the U.S.

2012 RQ® | USA Summary Report | February 2012
Methodological Overview (continued)
© Harris Interactive 24
Who Rates the “Most Visible” Companies in the United States? • The RQ Ratings Phase takes place among the general public. As part of the Ratings Phase, respondents are randomly
assigned to rate two of the companies with which they are “very” or “somewhat” familiar. After the first company rating is completed, the respondent is given the option to rate the second company. Each interview lasts approximately 17 minutes.
• Outlined in the table below is the method of data collection for this phase, as well as the dates of interview, total number of interviews, number of companies measured, and average number of ratings per company.
Rating Interviewing Dates
Number of Rating Interviews
Method of interviewing
Number of Companies Measured
Average Number of Ratings per Company
United States December 2nd – December 19th 12,961 Online 74 300
Nomination Interviewing Dates
Number of Nomination Interviews
Method of Interviewing
Number of “Most Visible” Companies Identified
United States October 18th – October 20th
October 29th – October 31st 4,594 Online 60
Nominations Phase - Summary of Specifications
RQ Ratings Phase - Summary of Specifications

2012 RQ® | USA Summary Report | February 2012
About Harris Interactive
25 © Harris Interactive

2012 RQ® | USA Summary Report | February 2012
About Harris Interactive
• Annual revenue: $164.3 million from continuing operations, FYE June 30, 2011
• Employees: 700 full time (approximately)
• Headquarters: New York, New York, USA
• Publicly Traded - Stock symbol: HPOL
Harris Interactive is the leading global independent research organization focused on delivering proprietary custom research to its clients while also providing public opinion research on issues facing society, business, and governments. At Harris Interactive, we leverage all communication tools to get inside the minds of consumers, to decode what is really being said, and uncover what is really meant. Utilizing the most appropriate mix of media, tools, and methodologies, we turn relevant insight into actionable foresight.
Transcending traditional methods of gathering, analyzing and interpreting information — understanding one-size-fits-all solutions never fit anyone — we help people and companies move forward with agility and ease. We work outside and beyond conventional methodologies and embrace all information sources, to ensure every nugget of knowledge is unearthed, every reality is accounted for, and accommodated.
26 © Harris Interactive