
Taking action on the Social Determinants of Health...
51
Taking action on the Social Determinants of Health Michael Marmot
-
Upload
nguyennguyet -
Category
Documents
-
view
220 -
download
3
Transcript of Taking action on the Social Determinants of Health...

Taking action on the Social Determinants of Health Michael Marmot

Thanks to Ruth Bell www.instituteofhealthequity.org

The Commission on Social Determinants of Health (CSDH) – Closing the gap in a generation
Strategic Review of Health Inequalities in England:
The Marmot Review – Fair Society Healthy Lives
Review of Social
Determinants of Health and
the Health Divide in the
WHO European
Region

• Social justice • Material, psychosocial,
political empowerment • Creating the conditions
for people to have control of their lives
www.who.int/social_determinants
Key principles

Prenatal Pre-school School Training Employment Retirement
Family building
Accumulation of positive and negative effects on health and wellbeing
Life course stages

Male life expectancy at birth, local authorities 2008-10
70
72
74
76
78
80
82
84
86
0 30 60 90 120 150
Life expectancy (years)
Local authority rank - based on Index of Multiple Deprivation

Inequalities in male life expectancy within local authority areas, 208-2010
Largest inequalities Smallest inequalities Westminster 16.9 (84) Barking & Dagenham 5.2 (77) Stockton-on-Tees 15.3 (78) Newham 5.0 (76) Middlesbrough 14.8 (76) Isle of Wight 4.9 (79) Wirral 14.6 (77) Herefordshire Cty UA 4.8 (79) Darlington 14.6 (77) Wokingham 3.5 (82) Newcastle -u-Tyne 13.7 (77) Hackney 3.1 (77) Figures in parentheses show life expectancy of the area

Female life expectancy at birth, local authorities 2008-10
70
75
80
85
90
95
0 30 60 90 120 150
Life expectancy (years)
Local authority rank - based on Index of Multiple Deprivation

“Fair Society, Healthy lives” themes

Country Year Life
expectancy
Highest Israel 2009 80 Iceland 2009 80 Sweden 2010 80 Switzerland 2007 80 Lowest Ukraine 2010 65 Republic of Moldova 2010 65 Kyrgyzstan 2009 65 Belarus 2009 65 Kazakhstan 2009 64 Russian Federation 2009 63
Male life expectancy – WHO European Region
Source: WHO HFA database

Female life expectancy – WHO European Region
Source: WHO HFA database
Country Year Life
expectancy
Highest Spain 2009 85 France 2008 85 Italy 2008 85 Switzerland 2007 85 Lowest Ukraine 2010 75 Russian Federation 2009 75 Turkey 2008 74 Kazakhstan 2009 74 Republic of Moldova 2010 74 Uzbekistan 2005 73 Kyrgyzstan 2009 73

Years of life spent free of disability, women in selected European countries 2009
Source: EC health indicators

Differences between women and men in years spent free of disability, selected European countries 2009
Source: EC health indicators

Absolute inequality in males death rates by level of education
Mackenbach et al 2008

Remaining life expecancy at 30 years of age for women and men based on educational level, 1991 -2010: Sweden
Women Men Age Age
Post secondary education
Secondary education
Lower secondary
6
4.1
3,2
5

Trends in probability of survival in men by education: Russian Federation
0.4
0.45
0.5
0.55
0.6
0.65
0.7
1989
1990
1991
1992
1993
1994
1995
1996
1997
1998
1999
2000
2001
Calendar year
45 p
20
45 p20 = probability of living to 65 yrs when aged 20 yrs
University
Less than secondary
Source: Murphy et al 2006

Prenatal Early Years Working Age Older Ages
Family building
Accumulation of positive and negative effects on health and wellbeing
LIFE COURSE STAGES
MACROLEVEL CONTEXT
WIDER SOCIETY SYSTEMS
Perpetuation of inequities

Prenatal Early Years Working Age Older Ages
Family building
Accumulation of positive and negative effects on health and wellbeing
LIFE COURSE STAGES
MACROLEVEL CONTEXT
WIDER SOCIETY SYSTEMS
Perpetuation of inequities

Prenatal Early Years Working Age Older Ages
Family building
Accumulation of positive and negative effects on health and wellbeing
LIFE COURSE STAGES
MACROLEVEL CONTEXT
WIDER SOCIETY SYSTEMS
Perpetuation of inequities

Early child care and education
• Parenting and family support – Perinatal services – Care before and during pregnancy – Help for new mothers
• Pre-school education and care • Primary, secondary and tertiary education and
training

Differences in PISA scores by attending preschool for more than one year before and after accounting for socioeconomic background
OECD PISA 2009 database
0 20 40 60 80 100 120 140
Israel Belgium France
Italy Switzerland
Denmark United Kingdom
Turkey Lithuania
Serbia TFYR Montenegro
Netherlands Ireland
Slovenia
Before accounting for socioeconomic background After accounting for socioeconomic background

0 10 20 30 40 50 60
Romania Latvia
Bulgaria Lithuania
Italy Greece
Spain Poland
Portugal Luxembourg
Hungary United Kingdom
Malta Estonia
Switzerland Ireland
Slovakia France
Belgium Netherlands
Germany Austria
Czech Republic Sweden Finland Cyprus
Slovenia Denmark
Norway Iceland
Poverty rate
Before social transfers After social transfers
Child poverty rates <60% median before and after social transfers 2009
Source: EU SILC

Country ranking: equality in child wellbeing - material, education, and health
Source: UNICEF Report Card 9, ranking 24 OECD countries by their performance in each of three dimensions of inequality in child well-being
Score Country 8 Denmark, Finland, Netherlands, Switzerland 7 Iceland, Ireland, Norway, Sweden 6 Austria, France, Germany, Poland, Portugal,
Canada 5 Belgium, Czech Republic, Hungary,
Luxembourg, Slovakia, Spain, United Kingdom 3 Greece, Italy, United States

Country comparison on average rank in four dimensions of child wellbeing – material, health, education, behaviours & risks, in early 2000s and late 2000s
UNICEF 2013

Children achieving a good level of development at age five, local authorities 2011: England
40
45
50
55
60
65
70
75
80
0 30 60 90 120 150
Good level of development
at age 5 %
Local authority rank - based on Index of Multiple Deprivation
Source: LHO (2012)

Birmingham Brighter Futures • Children and young people; • Physical health, literacy and numeracy, behaviour,
emotional health, social literacy, and job skills. • Specific programmes: Family Nurse Partnership
(FNP), Incredible Years Parenting Programme, Promoting Alternative Thinking Strategies (PATHS), Triple P Parenting Programme.

Per cent 5 year olds achieving ‘good development score’,* Birmingham LA, West Midlands & England
*in personal, social and emotional development and communication, language and literacy
Source: Department for Education: preliminary data
%

Prenatal Early Years Working Age Older Ages
Family building
Accumulation of positive and negative effects on health and wellbeing
LIFE COURSE STAGES
MACROLEVEL CONTEXT
WIDER SOCIETY SYSTEMS
Perpetuation of inequities

Unemployment rates by education and country of origin in selected countries
Source: Eurostat database


Psychosocial stress and occupational class
SHARE -11 European Countries Wahrendorf, Dragano and Siegrist 2011
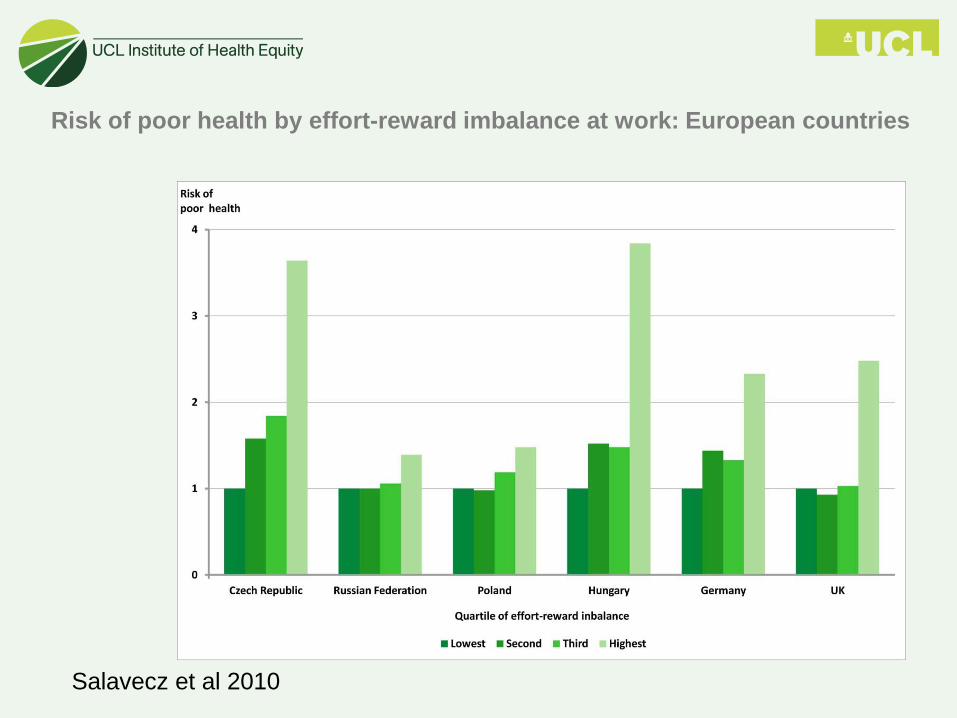
Salavecz et al 2010
Risk of poor health by effort-reward imbalance at work: European countries

Prenatal Early Years Working Age Older Ages
Family building
Accumulation of positive and negative effects on health and wellbeing
LIFE COURSE STAGES
MACROLEVEL CONTEXT
WIDER SOCIETY SYSTEMS
Perpetuation of inequities

Wider Society
• Social exclusion • Social protection across the life course • Communities

Relation between social welfare spending and all cause mortality in 18 EU countries, 2000
Stuckler D et al. BMJ 2010;340:bmj.c3311

Social Protection
Each 100 USD per capita greater social spending reduced the effect on suicides by: 0.38%, active labour market programmes 0.23%, family support 0.07%, healthcare 0.09%,unemployment benefits
Spending> 190 USD no effect of unemployment on suicide
Source: Stuckler et al 2009 Lancet

Prenatal Early Years Working Age Older Ages
Family building
Accumulation of positive and negative effects on health and wellbeing
LIFE COURSE STAGES
MACROLEVEL CONTEXT
WIDER SOCIETY SYSTEMS
Perpetuation of inequities

Macrolevel context: Economic Issues Sustainability and environment

Changes in self-reported health and access to health care in Greece between 2007 and 2009, adjusted estimates
Source: Kentikelenis et al, 2011

Prenatal Early Years Working Age Older Ages
Family building
Accumulation of positive and negative effects on health and wellbeing
LIFE COURSE STAGES
MACROLEVEL CONTEXT
WIDER SOCIETY SYSTEMS
Perpetuation of inequities

London Health Inequalities Strategy

London HI Strategy: 5 strategic objectives:
1. Empowering individuals and communities 2. Equitable access to high quality heath and
social care services 3. Income inequality and health 4. Health, work, and well-being 5. Healthy places

Strengthening Communities: Merseyside Fire & Rescue Service
•Promoting healthier, safer communities’
•Community fire safety team – follow up to home safety checks •Youth programmes •Community fire stations
•On site free gyms •Gardens & gardening projects •Community rooms

Local areas using 6 areas Fair Society Healthy Lives in local strategies:

Malmö, Sweden • Commission for a Socially Sustainable Malmo,
chaired by Sven-Olof Isaacson, March 2011 • to translate the findings of the CSDH into a form
suitable to address social determinants and health inequalities in Malmo
• Report March 2013

Malmö: Six areas for action
• Children and young people´s livings conditions
• Living environment and urban planning • Education • Income and employment • Health services’ • Changes in processes for socially
sustainable development


Income, employment, housing and health • Unemployment, low incomes and poor
housing contribute to worse health; • These problems are more likely to occur
among particular groups within the population and among those already on low incomes.


Projected relative AHC income poverty rates under current policies and without the coalition government’s tax and benefits reforms: UK
Institute for Fiscal Studies, 2011

•A Fair Society


