Supplementary Materials for -...
18
www.sciencemag.org/cgi/content/full/science.1228771/DC1 Supplementary Materials for Quantitative Phosphoproteomics Reveal mTORC1 Activates de Novo Pyrimidine Synthesis Aaron M. Robitaille, Stefan Christen, Mitsugu Shimobayashi, Marion Cornu, Luca L. Fava, Suzette Moes, Cristina Prescianotto-Baschong, Uwe Sauer, Paul Jenoe, Michael N. Hall* *To whom correspondence should be addressed. E-mail: [email protected] Published 21 February 2013 on Science Express DOI: 10.1126/science.1228771 This PDF file includes: Materials and Methods Supplementary Text Figs. S1 to S7 References Other Supplementary Material for this manuscript includes the following: available at www.sciencemag.org/cgi/content/full/science.1228771/DC1 Tables S1 to S8
-
Upload
trinhtuong -
Category
Documents
-
view
223 -
download
0
Transcript of Supplementary Materials for -...
www.sciencemag.org/cgi/content/full/science.1228771/DC1
Supplementary Materials for
Quantitative Phosphoproteomics Reveal mTORC1 Activates de Novo Pyrimidine Synthesis
Aaron M. Robitaille, Stefan Christen, Mitsugu Shimobayashi, Marion Cornu, Luca L. Fava, Suzette Moes, Cristina Prescianotto-Baschong, Uwe Sauer, Paul Jenoe, Michael N. Hall*
*To whom correspondence should be addressed. E-mail: [email protected]
Published 21 February 2013 on Science Express DOI: 10.1126/science.1228771
This PDF file includes:
Materials and Methods Supplementary Text Figs. S1 to S7 References
Other Supplementary Material for this manuscript includes the following: available at www.sciencemag.org/cgi/content/full/science.1228771/DC1
Tables S1 to S8
2
Materials and Methods Animals TSC1 lox/lox mice, with exons 17 and 18 of TSC1 flanked by loxP sites, were purchased from Jackson laboratories (#005680) (Bar Harbor, ME). Liver-specific TSC1 knockout mice were generated by crossing TSC1 lox/lox mice with transgenic mice expressing Cre recombinase under the control of the hepatocyte specific albumin promoter. The resulting TSC1 lox/+ Alb-CreTg/0 progeny were crossed with TSC1 lox/lox mice to obtain tissue specific knockout mice (TSC1 lox/lox Alb-CreTg/0), termed liver-specific TSC1 knockout (L-TSC1 KO) mice. Littermate TSC1 lox/lox mice without the Cre gene were used as controls. Mice were generated on a mixed genetic background (C57BL/6J, 129/SvJae, BALB/cJ). Antibodies CAD antibody for immunoblot/IP (#A301-374A), and for IF/ImmunoEM (#IHC-00280) from Bethyl. Anti-Akt/PKB from Santa Cruz Biotechnology. Alexa Fluor 488 anti-rabbit and Alexa Fluor 594 anti-mouse secondary antibodies from Invitrogen. HRP-coupled anti-mouse and anti-rabbit secondary antibodies from Pierce; HRP-coupled anti-IgG, light chain specific, anti-rabbit secondary antibody from Jackson Immunoresearch; Ten-nanometer gold particles coupled to goat anti-rabbit IgG from BBInternational; all other antibodies from Cell Signaling Technology. Antibody Production CAD-S1859 phospho-specific, rabbit polyclonal antibodies were raised against a KLH-coupled peptide (RIHRApSDPGLPAE), which corresponds to residues 1854–1866 of human CAD. Antibodies were generated and affinity purified by Eurogentec. Chemicals SILAC Media and D-FCS from DundeeCellProducts. Glutamine and Pen/Strep from Invitrogen. 15N-amide glutamine from Cambridge Isotope Labs. Recombinant S6K from Millipore. FuGENE from Roche. Additional cell culture reagents including DMEM, 4-OHT, insulin, rapamycin, and PF-4708671 from Sigma. Plasmids Human CAD cloned into pCMV-SPORT6 was obtained from Open Biosystems (accession# BC065510). CAD-S1859A was produced via site-directed mutagenesis and verified by DNA sequencing. Quantification Quantification of 32P-ATP signals was performed using PhosphorScreens (Molecular Dynamics), a STORM scanner (Amersham/GE), and ImageQuant v7.0 (GE Healthcare).

3
Cell Culture Cells were grow in DMEM containing 10% dialyzed fetal bovine serum (D-FCS). For starvation conditions, cells were grown for 16 hours in DMEM containing 0.1% D-FCS, and incubated for 15min without amino acids in 1xPBS. Cells were then stimulated in DMEM with 10% D-FCS and double the concentration of AAs in DMEM for 1 hour with or without 100nM rapamycin. Generation of the iRapKO and iRicKO cell lines was previously described (8, 24). For SILAC experiments, MEFs or HeLa cells were cultured for 7 passages in SILAC media (R0K0 or R6K4 or R10K8) + 10% D-FCS. Cells were then subjected to 4-OHT treatment (MEFs) or serum stimulation (HeLa). GFP, wild-type, and mutant CAD were transfected into G9c cells with FuGENE, following the manufacture’s instructions. G9c cells lack functional CAD activity, and require the addition of 30µM uridine to the media to maintain cell growth and proliferation (25). Cell proliferation was measured using Crystal Violet staining, or through soft agar colony formation assays in the absence of uridine (26). Phosphoproteomics We integrated stable isotope labeling by amino acids in cell culture (SILAC) (27), preparative SDS-PAGE fractionation (28), phosphopeptide enrichment (29), high accuracy mass spectrometry (30), and bioinformatic programs (31) to quantitatively identify mTORC1 or mTORC2 regulated phosphorylation changes in vivo. Protein extraction, SDS-PAGE protein fractionation, in-gel digestion, peptide desalting, phosphopeptide enrichment, nano-LC-MS/MS analysis, database search, and quantitation were previously described (32) with the following changes: Identification of phosphopeptides was done using a 1% false discovery rate (FDR) with MaxQuant 1.13.13 against the mouse or human Swiss-Prot/TrEMB database downloaded from Uniprot on June 30th, 2009. The databases contained forward and reverse mouse or human sequences as well as common contaminants. Briefly, using a SILAC triple label strategy (R0K0 or R6K4 or R10K8), we analyzed four biological replicate experiments, each with two technical replicates, rotating each SILAC label per biological replicate. Proteins were separated by preparative SDS-PAGE and subsequently digested with trypsin. Phosphopeptides were enriched by TiO2 and IMAC (immobilized metal affinity chromatography). The resulting phosphopeptide fractions were analyzed separately by nano-LC-MS/MS on a LTQ-Orbitrap. A total of 220 nano-LC-MS/MS runs were performed. For a phosphorylation site to be considered an mTORC1- or mTORC2-regulated target site, we used a cut-off of >1.5 standard deviations (SD) from the log2 transformed mean ratio (iRapKO/Control, iRicKO/Control, or iRicKO/iRapKO). Another criterion was that the phosphopeptide was quantified in at least two biological replicates. We analyzed a control phosphoproteome (+ vehicle) to account for phosphorylation changes due to cell line differences and/or 4-OHT treatment. Phosphorylations that were significantly changed in the control phosphoproteome (+ vehicle) were identified as false positives and excluded from subsequent analysis.

4
Bioinformatics In vivo kinase motif analysis was performed with Motif-X (33). In vitro kinase motif analysis was performed with WebLogo (34). We searched for human, fish, fly, worm, and yeast orthologs of the mouse mTOR-regulated phosphoproteins using g-profiler (35). KEGG pathway analysis was done using the Benjamini-Hochberg FDR in g-profiler. Using the previously identified TOS motifs found in PRAS40, S6K, and 4E-BP, (36) we developed a consensus TOS motif corresponding to: F-[DEV]-[MLI]-[DEV]-[LIE]. We then searched for putative TOS motifs using ScanProsite (37). Sequence alignments were done with ClustalW2 (38). Venn diagrams were created with VENNY (39). HeLa cell volume was calculated from BioNumbers (40). Peptide Array Spotting An array of 600 peptides was synthesized on cellulose paper using an intavis AG MultiPep robotic spotter following the manufacture’s instructions. 12-mer peptides (6AA-pS/T-5AA) of each pS/T site identified as mTOR-regulated in two out of three SILAC labels were spotted in duplicate. Additionally, A was substituted for each pS/T identified via MS and spotted in duplicate (6AA-A-5AA). Peptide Array in vitro Kinase Assay The printed peptide array was moistened in 95% EtOH, and blocked overnight at 24°C in peptide kinase buffer (25mM HEPES pH 7.2, 50mM NaCl, 0.01% Tween-20, 10mM MnCl2, 1mM EDTA) supplemented with 0.2 mg/mL BSA. The array was then additionally blocked with a cold-kinase assay (peptide kinase buffer + 1.0mg/mL BSA + 1mM ATP and incubated at 37°C for 30min). The mTOR kinase reaction was carried out with peptide kinase buffer + 0.1mg/mL BSA + 500uM ATP + 500uCi 32P-ATP + 100ng mTOR (Invitrogen) for 3h at 37°C. After extensive washing [3x for 10min in (50mM Tris, pH 6.8, 8M urea, 1% SDS, 0.5% B-ME), 2x ddH20, 3x for 10min in (50mM Tris, pH 6.8, 1M NaCl), 2x ddH20, 3x for 10min in (5% phosphoric acid, pH 1.5), 2x ddH20, 2min in 95% EtOH] the array was air dried and incorporation of 32P into the peptides was measured with a PhosphorScreen (Molecular Dynamics) and a STORM scanner (Amersham/GE). in vitro Kinase Assays HeLa cells were rinsed three times with ice-cold 1xPBS before lysis. Cells were then lysed in RIPA buffer (50mM Tris, pH 7.4, 150mM NaCl, 1mM EDTA, 1.0% NP-40, and 0.1% Deoxycholate with protease and phosphatase inhibitors: 1x Roche complete protease inhibitor cocktail, 1µg/ml Aprotinin, 1µg/ml Pepstatin, 10mM NaF, 10mM β-glycerophosphate, 0.5mM ortho-vanadate). Cells were harvested by scrapping and incubated on ice for 20 minutes. Cell debris was removed by centrifugation for 10 minutes at 1000g. The protein concentration was determined with a BCA assay. 5µg of CAD or rabbit IgG antibody was incubated with 1mg of cleared cell lysate and rotated for 3 hours at 4°C. Normal rabbit IgG was used for mock IPs. 40µl of a 50% slurry of protein A-agarose was added and then incubated for one additional hour. Beads were
5
collected by centrifugation, and immunoprecipitations were washed four times in lysis buffer before being resuspended in kinase reaction buffer with or without 200ng recombinant S6K and 200nM PF-4708671. Kinase reactions were carried out according to the manufacturer’s instructions (Millipore). Metabolic Measurements Prior to metabolic labeling, HeLa or G9c cells were serum starved for 16 hours in DMEM containing with 0.1% D-FCS and incubated for 15min without amino acids in 1xPBS. Cells were then stimulated in DMEM with 10% D-FCS and 2x AA (minus glutamine) + 4mM 15N-amide labeled glutamine. Cells were washed 2x with ice-cold 1xPBS, and then quenched by flash freezing the plates in liquid nitrogen. Metabolites were extracted with 75% EtOH in 10mM ammonium acetate, pH 7.5 for 5min at 80°C. Cell debris was removed via centrifugation at 3000g for 5min at 4°C. Samples were dried in a speed-vac at stored at -80°C until measurement. Metabolites were then measured using a targeted approach with uHPLC-MS/MS as previously described (41). Total cellular concentrations of metabolites were calculated by comparing the relative amount of metabolites in HeLa cells (2425 µM3 cell volume) to a 13C isotope labeled internal standard and metabolite standard curves. RT-PCR RNA was isolated using the RNeasy Mini Kit (Qiagen). cDNAs were created with Superscript III First Strand Synthesis System (Life Technologies). Quantitative PCR was performed with power SYBR green mix (Applied Biosystems), and quantified using an Applied Biosystems StepOnePlus Real Time PCR System. Samples were run in triplicate, and were normalized to TBP mRNA to determine relative expression levels. Primers are listed in table S8. Fluorescence Microscopy HeLa or MEF cells were grown on coverslips to 60% confluence. Starved or serum stimulated cells were then washed 3x 1xPBS, and fixed with 4% paraformaldehyde in 1xPBS for 15min at 24°C. After washing 2x 1xPBS, cells were quenched with 50mM ammonium chloride in 1xPBS for 10min at 24°C. Cells were washed 2x 1xPBS and permeabilized with 0.1% Trition-100 in 1xPBS for 5min. After washing 2x 1xPBS, cells were blocked in 2% BSA in 1xPBS for 1h at 24°C. Cells were washed 2x 1xPBS and incubated with primary antibody in 1xPBS + 0.3% BSA (1:200 dilution) for 2h at 24°C. After washing 3x 1xPBS, cells were incubated with secondary antibodies in 1xPBS + 0.3% BSA (1:200 dilution) and kept in the dark for 1h at 24°C. Cells were washed 3x 1xPBS, stained 3min with DAPI (1:1000 dilution) in 1xPBS, before mounting on microscope slides. Images were taken with a 40x objective on a Zeiss AxioImager Z1 microscope and an AxioCam MRm camera (150-500ms exposure time). Immunoelectron Microscopy HeLa cells or MEFs were treated as in Fig 1C, and then fixed and treated for immunoelectron microscopy as previously described (42). Ten-nanometer
6
gold particles coupled to goat anti-rabbit IgG were used to detect rabbit anti-CAD antibodies. Glycerol Gradient Ultracentrifugation HeLa cells or MEFs (1x10⁷) were suspended in 250µL of lysis buffer containing 100mM Tris-HCL pH 8.0, 100mM KCL, 25 mM MgCl2, 1 mM DTT, 7.5% (vol/vol) DMSO, and 2.5% (vol/vol) glycerol. CAD oligomers were then isolated on 10-35% glycerol gradients as previously described (19). Flow Cytometry HeLa cells were arrested in early S-phase using a double thymidine block. 40% confluent cells were subsequently grown in complete media + 2.5mM thymidine for 18h, released in complete media for 9h, and arrested in S-phase with a second 16 hour incubation in complete media + 2.5mM thymidine. Cells were then released in DMEM (starved) or DMEM + 10% D-FCS + 2x AA (stimulated) or DMEM + 10% D-FCS + 2x AA + 100nM rapamycin (rapamycin), or DMEM + 10% D-FCS + 2x AA + 10µM PF-4708671 (PF-4708671) with or without 30µM uridine. Cells were trypsinized and washed 2x in 1xPBS + 0.1% BSA. Cells were fixed in 75% ice-cold EtOH for 1h at 4°C. After washing 2x with 1xPBS, cells were permeabilized with 0.25% Trition-100 in 1x PBS for 5min at 4°C. Cells were washed, and then treated with 30ug/mL RNase A for 15min at 37°C. After washing, cells were resuspended at 1x10^6 cells/mL in PI staining buffer (1xPBS + 3.8mM NaCitrate + 50 ug/mL propidium iodide + 10ug/mL RNase A) and incubated in the dark for 2h at 4°C. The PI staining was then measured with a Beckman Coulter Cell Lab Quanta SC Flow cytometer. Supplementary Text Author Contribution: MNH proposed the project, and AMR designed the experimental setup. AMR and LLF performed the peptide spotting. SC carried out the metabolic measurements. MS created CAD-S1859A point mutation. MC generated L-TSC1 KO mice and performed qPCR. CPB performed immunoelectron microscopy. Additional experiments and data analysis by AMR. PJ and SM maintained the nano-LC-MS/MS Orbitrap. MNH, PJ, and US supervised the research.

fig. S1. Quantitative phosphoproteomics reveal 326 mTORC1 or mTORC2 regulated phosphoproteins. (A) Quantitative phosphoproteomic workflow used to identify mTORC1 or mTORC2 regulated phosphorylation sites. (B) Floxed raptor (iRapKO) or rictor (iRicKO) mouse embryonic fibroblasts contain an intergraded 4-OHT inducible Cre. Three days after 4-OHT treatment, raptor or rictor protein levels are decreased by 90%. (C) Phosphopeptide quantification was robust across technical replicates, R2=0.9884, (D) and reproducible between biological replicates, R2=0.6131. Data is represented as a superimposition of all biological replicates. (E) Global distribute of all 4584 phosphopeptides. mTORC1 or mTORC2 regulated phosphorylations had SILAC ratios that were +/- >1.5 SD of the log2 transformed ratio mean. (F) Comparison of three mTOR phosphoproteomes. Overlap is underestimated by ~15% due to differences in reported nomenclature. mTOR targets are mTOR direct substrates or substrates of Akt/PKB, SGK, and S6K previously reported in the literature. See also tables S, 1-5.
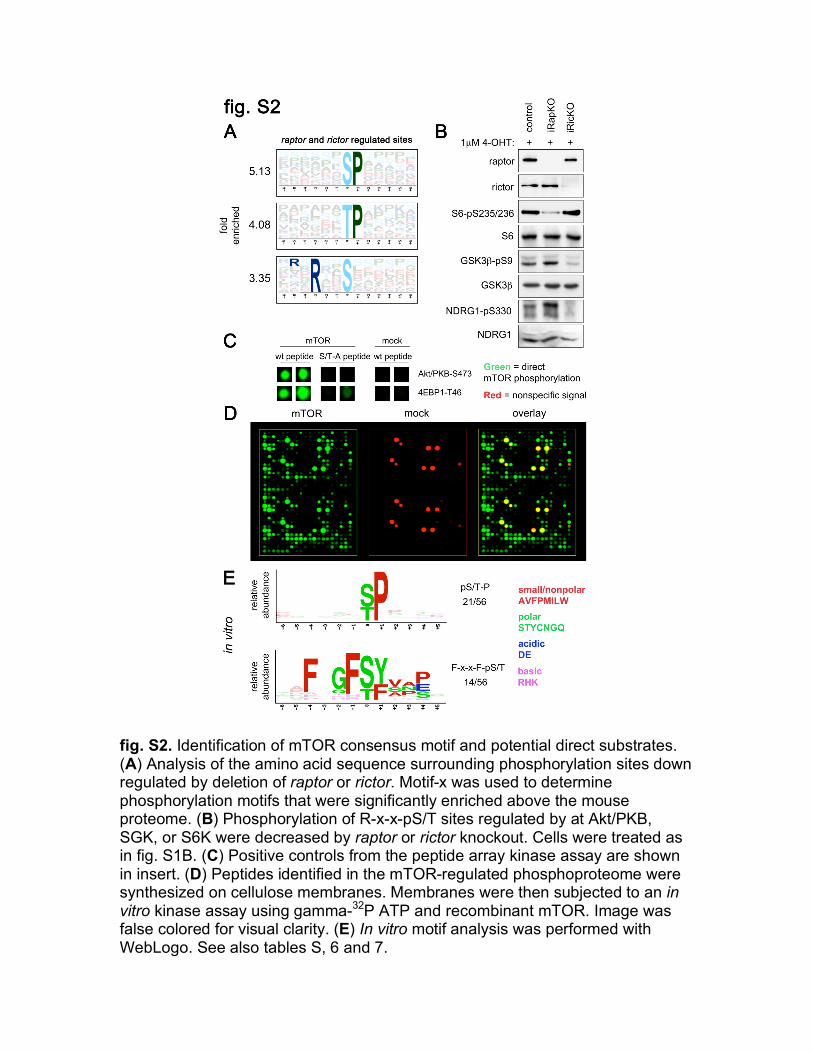
fig. S2. Identification of mTOR consensus motif and potential direct substrates. (A) Analysis of the amino acid sequence surrounding phosphorylation sites down regulated by deletion of raptor or rictor. Motif-x was used to determine phosphorylation motifs that were significantly enriched above the mouse proteome. (B) Phosphorylation of R-x-x-pS/T sites regulated by at Akt/PKB, SGK, or S6K were decreased by raptor or rictor knockout. Cells were treated as in fig. S1B. (C) Positive controls from the peptide array kinase assay are shown in insert. (D) Peptides identified in the mTOR-regulated phosphoproteome were synthesized on cellulose membranes. Membranes were then subjected to an in vitro kinase assay using gamma-32P ATP and recombinant mTOR. Image was false colored for visual clarity. (E) In vitro motif analysis was performed with WebLogo. See also tables S, 6 and 7.
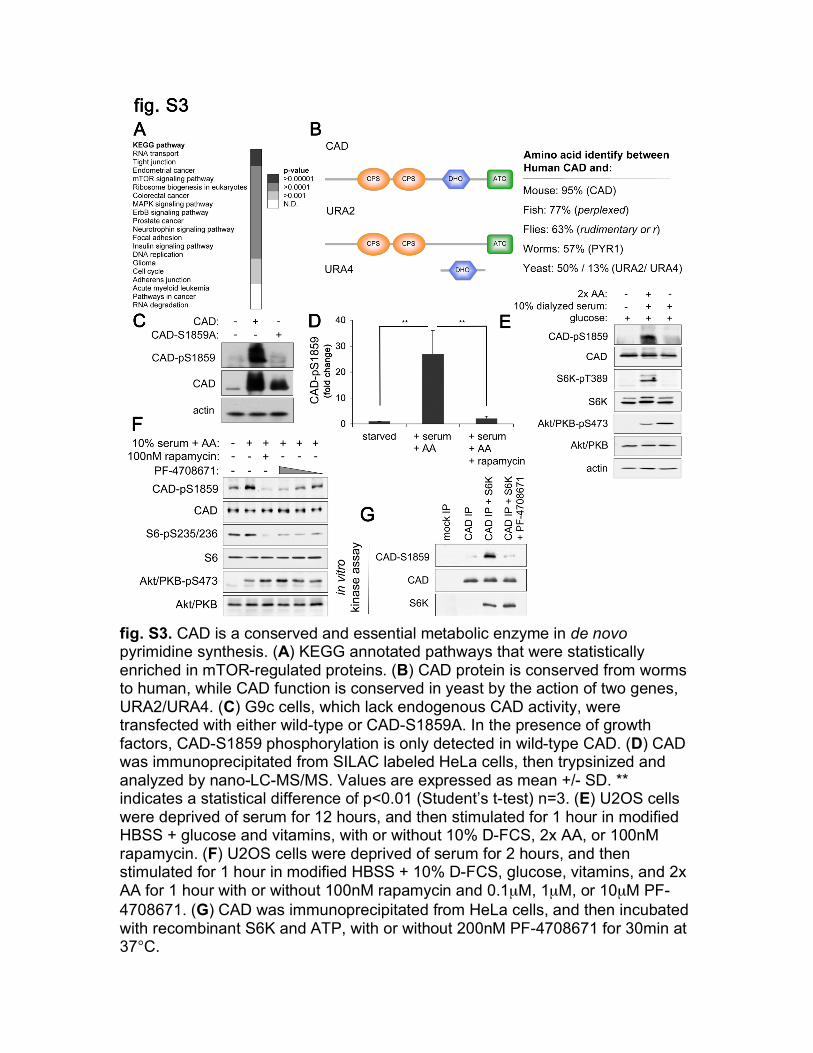
fig. S3. CAD is a conserved and essential metabolic enzyme in de novo pyrimidine synthesis. (A) KEGG annotated pathways that were statistically enriched in mTOR-regulated proteins. (B) CAD protein is conserved from worms to human, while CAD function is conserved in yeast by the action of two genes, URA2/URA4. (C) G9c cells, which lack endogenous CAD activity, were transfected with either wild-type or CAD-S1859A. In the presence of growth factors, CAD-S1859 phosphorylation is only detected in wild-type CAD. (D) CAD was immunoprecipitated from SILAC labeled HeLa cells, then trypsinized and analyzed by nano-LC-MS/MS. Values are expressed as mean +/- SD. ** indicates a statistical difference of p<0.01 (Student’s t-test) n=3. (E) U2OS cells were deprived of serum for 12 hours, and then stimulated for 1 hour in modified HBSS + glucose and vitamins, with or without 10% D-FCS, 2x AA, or 100nM rapamycin. (F) U2OS cells were deprived of serum for 2 hours, and then stimulated for 1 hour in modified HBSS + 10% D-FCS, glucose, vitamins, and 2x AA for 1 hour with or without 100nM rapamycin and 0.1µM, 1µM, or 10µM PF-4708671. (G) CAD was immunoprecipitated from HeLa cells, and then incubated with recombinant S6K and ATP, with or without 200nM PF-4708671 for 30min at 37°C.

fig. S4. mTORC1 positively regulates de novo pyrimidine synthesis. (A) Scheme to metabolically label newly synthesized pyrimidines with 15N-amide glutamine. (B) Diagram depicting pentose phosphate pathway. (C) HeLa cells were treated as in Fig. 2B. (D) 15N incorporation into UDP or UTP was not detected in G9c cells, which lack endogenous CAD activity. Cells were transfected with GFP or wild-type CAD. (E) Protein expression from (C) and Fig. 2, B-D. (F) HeLa cells were treated as in Fig. 2B with 10µM PF-4708671. (G) Protein expression from (H). (H) G9c cells were transfected with wild-type or mutant CAD, and 15N incorporation into UDP and UTP was measured as in Fig. 2B. Values are expressed as mean +/- SD. * indicates a statistical difference of *p<0.05, **p<0.01, ***p<0.001 (Student’s t-test) n=3-4.

fig. S5. mTORC1 positively regulates the pentose phosphate pathway. (A-B) 1 hour growth factor stimulation or rapamycin treatment did not alter the pentose phosphate pathway, as assayed by ribose 5-phosphate (R5P) metabolite levels (A), or mRNA expression of phosphogluconate dehydrogenase (PGD), phosphoribosyl pyrophosphate synthetase 1 (PRPS1), ribose 5-phosphate isomerase A (RPIA), and glucose-6-phosphate dehydrogenase (G6PD) (B). (C-D) Hyperactivation of mTORC1 in the mouse liver increased both CAD synthesized metabolites (C left) and activity of the pentose phosphate pathway (C right, and D). WT: (TSC1-fl/fl mice). KO: (TSC1-fl/fl; Albumin-Cre mice). Mice were treated as in Fig. 1D, and metabolites extracted from liver were measured as in Fig. 2B. Values are expressed as mean +/- SD. * indicates a statistical difference of *p<0.05, **p<0.01, ***p<0.001 (Student’s t-test) n=3.
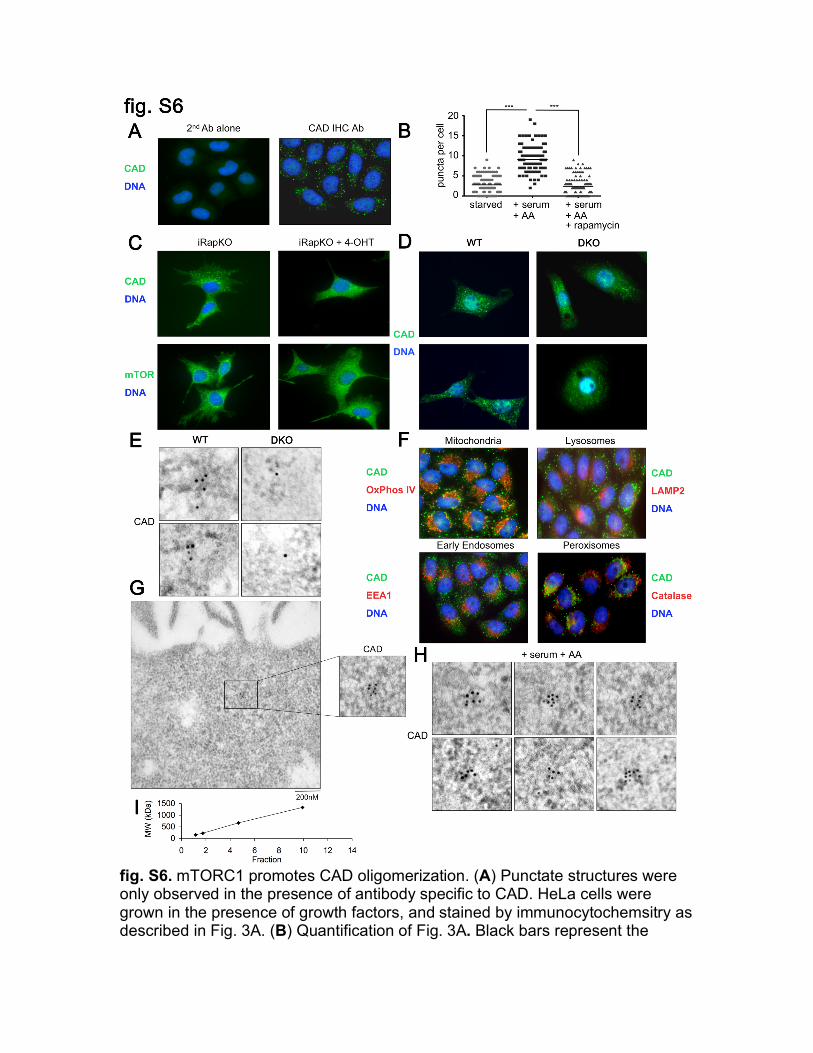
fig. S6. mTORC1 promotes CAD oligomerization. (A) Punctate structures were only observed in the presence of antibody specific to CAD. HeLa cells were grown in the presence of growth factors, and stained by immunocytochemsitry as described in Fig. 3A. (B) Quantification of Fig. 3A. Black bars represent the
mean. *** indicates a statistical difference of p<0.001 (Student’s t-test) n=116. (C-E) iRapKO cells were treated as in fig. S1B (C), WT (Ctrl) or DKO (S6K1-S6K2 DKO) MEFs were treated as in (A), and visualized by immunocytochemsitry (D) or immunoelectron microscopy (E). (F) CAD puncta did not colocalize with Complex IV subunit I (called OxPhos IV) (mitochondria), LAMP2 (lysosomes), EEA1 (early endosomes), or Catalase (peroxisomes). HeLa cells were deprived of serum for 16 hours, before 1 hour stimulation with 10% D-FCS. Endogenous CAD and the corresponding membrane marker were then visualized by immunocytochemsitry. (G-H) CAD clusters in HeLa cells stimulated with growth factors as in Fig. 1B, visualized by immunoelectron microscopy. Insert is the same as shown in (H). Six representative punctate structures are shown (H). (I) Molecular weight standards are shown in graph: Aldolase (158 kDa), Catalase (232 kDA), Thyroglobulin monomer (669 kDa), Thyroglobulin dimmer (1338 kDa). Standards were separated on 10-35% glycerol gradients.

fig. S7. mTORC1 promotes proliferation through activation of S6K and CAD. (A) HeLa cells were treated as in Fig. 4A with 10µM PF-4708671. (B) G9c cells were treated as in Fig 4B. Cells were counted in triplicate in the absence of uridine. * indicates a statistical difference between CAD and CAD-S1859A of **p<0.01, ***p<0.001 (Student’s t-test) n=3. (C) Protein expression from (B) at day nine. (D) mTORC1 promotes cell proliferation by positively regulating CAD phosphorylation and oligermization to activate de novo pyrimidine synthesis.

Additional Data tables S1-8 (separate file) table S1. All identified phosphopeptides. For raptor and rictor knockout, four biological replicates, each with two replicates, were analyzed by nano-LC-MS/MS. A control experiment (+ vehicle), with two replicates, was also analyzed. Table lists all identified phosphopeptides which had quantifiable SILAC triplets and Mascot scores > 20. Common contaminants were removed. table S2. Validated mTOR-regulated phosphorylations. Table lists previously validated mTORC1 or mTORC2 regulated phosphorylation sites that were curated from the literature and then identified in table S1. table S3. mTOR-regulated phosphorylations. Phosphopeptides that were quantified in at least two biological replicates, and had SILAC ratios >1.5 standard deviations (SD) from the log2 transformed mean ratio (iRapKO/Control, iRicKO/Control, or iRicKO/iRapKO) were considered an mTORC1 or mTORC2 regulated phosphopeptide. Phosphorylations that were significantly changed in the control phosphoproteome (+ vehicle) were identified as false positives and excluded. table S4. Validated mTOR target proteins. Table lists previously validated mTORC1 or mTORC2 regulated proteins that were curated from the literature. mTOR targets are mTOR direct substrates or substrates of Akt/PKB, SGK, and S6K previously reported in the literature. For mTORC1 substrates, F-[DEV]-[MLI]-[DEV]-[LIE] was used to search for putative TOS motifs. table S5. Comparison of three mTOR phosphoproteomes. mTOR-regulated phosphoproteins, represented by their mouse Gene ID, are listed for each study. Overlap is underestimated by ~15% due to differences in reported nomenclature. table S6. Quantification of peptide array kinase assay. Peptide array kinase assay was performed as described in fig. S2D. The incorporation of 32P into peptides was measured with a PhosphorScreen (Molecular Dynamics), a STORM scanner (Amersham/GE), and ImageQuant v7 .0 (GE Healthcare). For a target site to be considered phosphorylated by mTOR, the average 32P incorporation in the wild-type peptide (6AA-pS/T-5AA) must have be greater than the average 32P incorporation in both the mutant peptide (6AA-A-5AA), and the corresponding peptides in the mock kinase assay. table S7. Identification of 21 potential mTOR substrates. mTOR directly phosphorylated 26 peptides containing sites corresponding to 21 potential mTOR substrate proteins. Peptide array in vitro kinase assay was performed as described in fig. S2D. “-“ indicates target site lacks a consensus motif. See also fig. S2, and table S6. table S8. List of primers used for RT-PCR.

References and Notes
1. S. Wullschleger, R. Loewith, M. N. Hall, TOR signaling in growth and metabolism. Cell 124, 471 (2006). doi:10.1016/j.cell.2006.01.016 Medline
2. M. Laplante, D. M. Sabatini, mTOR signaling at a glance. J. Cell Sci. 122, 3589 (2009). doi:10.1242/jcs.051011 Medline
3. E. Dazert, M. N. Hall, mTOR signaling in disease. Curr. Opin. Cell Biol. 23, 744 (2011). doi:10.1016/j.ceb.2011.09.003 Medline
4. D. Benjamin, M. Colombi, C. Moroni, M. N. Hall, Rapamycin passes the torch: a new generation of mTOR inhibitors. Nat. Rev. Drug Discov. 10, 868 (2011). doi:10.1038/nrd3531 Medline
5. J. Kim, K. L. Guan, Amino acid signaling in TOR activation. Annu. Rev. Biochem. 80, 1001 (2011). doi:10.1146/annurev-biochem-062209-094414 Medline
6. V. Zinzalla, D. Stracka, W. Oppliger, M. N. Hall, Activation of mTORC2 by association with the ribosome. Cell 144, 757 (2011). doi:10.1016/j.cell.2011.02.014 Medline
7. W. J. Oh et al., mTORC2 can associate with ribosomes to promote cotranslational phosphorylation and stability of nascent Akt polypeptide. EMBO J. 29, 3939 (2010). doi:10.1038/emboj.2010.271
8. N. Cybulski, V. Zinzalla, M. N. Hall, Inducible raptor and rictor knockout mouse embryonic fibroblasts. Methods Mol. Biol. 821, 267 (2012). doi:10.1007/978-1-61779-430-8_16 Medline
9. P. P. Hsu et al., The mTOR-regulated phosphoproteome reveals a mechanism of mTORC1-mediated inhibition of growth factor signaling. Science 332, 1317 (2011). doi:10.1126/science.1199498 Medline
10. Y. Yu et al., Phosphoproteomic analysis identifies Grb10 as an mTORC1 substrate that negatively regulates insulin signaling. Science 332, 1322 (2011). doi:10.1126/science.1199484 Medline
11. M. L. Smith, J. M. Buchanan, Nucleotide and pentose synthesis after serum-stimulation of resting 3T6 fibroblasts. J. Cell. Physiol. 101, 293 (1979). doi:10.1002/jcp.1041010210 Medline
12. L. M. Graves et al., Regulation of carbamoyl phosphate synthetase by MAP kinase. Nature 403, 328 (2000). doi:10.1038/35002111 Medline
13. X. Gao et al., Tsc tumour suppressor proteins antagonize amino-acid-TOR signalling. Nat. Cell Biol. 4, 699 (2002). doi:10.1038/ncb847 Medline
14. K. Inoki, Y. Li, T. Zhu, J. Wu, K. L. Guan, TSC2 is phosphorylated and inhibited by Akt and suppresses mTOR signalling. Nat. Cell Biol. 4, 648 (2002). doi:10.1038/ncb839 Medline
15. E. A. Carrey, D. G. Campbell, D. G. Hardie, Phosphorylation and activation of hamster carbamyl phosphate synthetase II by cAMP-dependent protein kinase. A novel mechanism for regulation of pyrimidine nucleotide biosynthesis. EMBO J. 4, (13B), 3735 (1985). Medline

16. M. Rühl et al., Collisional fragmentation of central carbon metabolites in LC-MS/MS increases precision of ¹³C metabolic flux analysis. Biotechnol. Bioeng. 109, 763 (2012). doi:10.1002/bit.24344 Medline
17. K. Düvel et al., Activation of a metabolic gene regulatory network downstream of mTOR complex 1. Mol. Cell 39, 171 (2010). doi:10.1016/j.molcel.2010.06.022 Medline
18. P. Zhang et al., Dihydroorotase from the hyperthermophile Aquifex aeolicus is activated by stoichiometric association with aspartate transcarbamoylase and forms a one-pot reactor for pyrimidine biosynthesis. Biochemistry 48, 766 (2009). doi:10.1021/bi801831r Medline
19. L. Lee, R. E. Kelly, S. C. Pastra-Landis, D. R. Evans, Oligomeric structure of the multifunctional protein CAD that initiates pyrimidine biosynthesis in mammalian cells. Proc. Natl. Acad. Sci. U.S.A. 82, 6802 (1985). doi:10.1073/pnas.82.20.6802 Medline
20. A. D. Mitchell, N. J. Hoogenraad, De novo pyrimidine nucleotide biosynthesis in synchronized rat hepatoma (HTC) cells and mouse embryo fibroblast (3T3) cells. Exp. Cell Res. 93, 105 (1975). doi:10.1016/0014-4827(75)90428-0 Medline
21. F. Ramírez-Valle, M. L. Badura, S. Braunstein, M. Narasimhan, R. J. Schneider, Mitotic raptor promotes mTORC1 activity, G(2)/M cell cycle progression, and internal ribosome entry site-mediated mRNA translation. Mol. Cell. Biol. 30, 3151 (2010). doi:10.1128/MCB.00322-09 Medline
22. R. J. Dowling et al., mTORC1-mediated cell proliferation, but not cell growth, controlled by the 4E-BPs. Science 328, 1172 (2010). doi:10.1126/science.1187532 Medline
23. C. Espeillac et al., S6 kinase 1 is required for rapamycin-sensitive liver proliferation after mouse hepatectomy. J. Clin. Invest. 121, 2821 (2011) (Jul). doi:10.1172/JCI44203 Medline
24. I. Patursky-Polischuk et al., The TSC-mTOR pathway mediates translational activation of TOP mRNAs by insulin largely in a raptor- or rictor-independent manner. Mol. Cell. Biol. 29, 640 (2009). doi:10.1128/MCB.00980-08 Medline
25. D. Patterson, D. V. Carnright, Biochemical genetic analysis of pyrimidine biosynthesis in mammalian cells: I. Isolation of a mutant defective in the early steps of de novo pyrimidine synthesis. Somatic Cell Genet. 3, 483 (1977). doi:10.1007/BF01539120 Medline
26. W. C. Hahn et al., Creation of human tumour cells with defined genetic elements. Nature 400, 464 (1999). doi:10.1038/22780 Medline
27. S. E. Ong et al., Stable isotope labeling by amino acids in cell culture, SILAC, as a simple and accurate approach to expression proteomics. Mol. Cell. Proteomics 1, 376 (2002). doi:10.1074/mcp.M200025-MCP200 Medline
28. X. Li et al., Large-scale phosphorylation analysis of alpha-factor-arrested Saccharomyces cerevisiae. J. Proteome Res. 6, 1190 (2007). doi:10.1021/pr060559j Medline
29. B. Bodenmiller, L. N. Mueller, M. Mueller, B. Domon, R. Aebersold, Reproducible isolation of distinct, overlapping segments of the phosphoproteome. Nat. Methods 4, 231 (2007). doi:10.1038/nmeth1005 Medline
30. J. V. Olsen et al., Parts per million mass accuracy on an Orbitrap mass spectrometer via lock mass injection into a C-trap. Mol. Cell. Proteomics 4, 2010 (2005). doi:10.1074/mcp.T500030-MCP200 Medline
31. J. Cox, M. Mann, MaxQuant enables high peptide identification rates, individualized p.p.b.-range mass accuracies and proteome-wide protein quantification. Nat. Biotechnol. 26, 1367 (2008). doi:10.1038/nbt.1511 Medline
32. A. Soulard et al., The rapamycin-sensitive phosphoproteome reveals that TOR controls protein kinase A toward some but not all substrates. Mol. Biol. Cell 21, 3475 (2010). doi:10.1091/mbc.E10-03-0182 Medline
33. D. Schwartz, S. P. Gygi, An iterative statistical approach to the identification of protein phosphorylation motifs from large-scale data sets. Nat. Biotechnol. 23, 1391 (2005). doi:10.1038/nbt1146 Medline
34. G. E. Crooks, G. Hon, J. M. Chandonia, S. E. Brenner, WebLogo: a sequence logo generator. Genome Res. 14, 1188 (2004). doi:10.1101/gr.849004 Medline
35. J. Reimand, M. Kull, H. Peterson, J. Hansen, J. Vilo, g:Profiler—a web-based toolset for functional profiling of gene lists from large-scale experiments. Nucleic Acids Res. 35, W193 (2007). doi:10.1093/nar/gkm226 Medline
36. V. H. Lee, T. Healy, B. D. Fonseca, A. Hayashi, C. G. Proud, Analysis of the regulatory motifs in eukaryotic initiation factor 4E-binding protein 1. FEBS J. 275, 2185 (2008). doi:10.1111/j.1742-4658.2008.06372.x Medline
37. A. Gattiker, E. Gasteiger, A. Bairoch, ScanProsite: a reference implementation of a PROSITE scanning tool. Appl. Bioinformatics 1, 107 (2002). Medline
38. M. A. Larkin et al., Clustal W and Clustal X version 2.0. Bioinformatics 23, 2947 (2007). doi:10.1093/bioinformatics/btm404 Medline
39. J. C. Oliveros. (BioinfoGP, CNB-CSIC, 2007).
40. R. Milo, P. Jorgensen, U. Moran, G. Weber, M. Springer, BioNumbers—the database of key numbers in molecular and cell biology. Nucleic Acids Res. 38, D750 (2010). doi:10.1093/nar/gkp889 Medline
41. J. M. Buescher, S. Moco, U. Sauer, N. Zamboni, Ultrahigh performance liquid chromatography-tandem mass spectrometry method for fast and robust quantification of anionic and aromatic metabolites. Anal. Chem. 82, 4403 (2010). doi:10.1021/ac100101d Medline
42. H. Stettler et al., Determinants for chromogranin A sorting into the regulated secretory pathway are also sufficient to generate granule-like structures in non-endocrine cells. Biochem. J. 418, 81 (2009). doi:10.1042/BJ20071382 Medline