
Optimizing Instruments for Modern HPLC Columns Instruments for Modern HPLC Columns sigma-aldrich.com...
21
Optimizing Instruments for Modern HPLC Columns sigma-aldrich.com •Hillel K. Brandes, Richard A. Henry, David S. Bell, and Wayne K. Way Supelco, Div. of Sigma-Aldrich, Bellefonte, PA 16823 USA T411036
-
Upload
phungthien -
Category
Documents
-
view
227 -
download
4
Transcript of Optimizing Instruments for Modern HPLC Columns Instruments for Modern HPLC Columns sigma-aldrich.com...

Optimizing Instruments for Modern HPLC Columns
sigma-aldrich.com
•Hillel
K.
Brandes, Richard A. Henry, David S. Bell, and Wayne K. Way
Supelco, Div. of Sigma-Aldrich, Bellefonte, PA 16823 USA
T411036
2
Abstract
Higher performance HPLC columns result in higher resolution chromatograms with very narrow peak widths that cannot be achieved by all HPLC instruments in the laboratory, independent of pressure limitations. For example, porous-layer particles can deliver peak widths comparable to sub-2 µm particles with flow resistance comparable to 3 µm particles so that columns can easily be operated within the pressure range of
traditional HPLC instruments. However, UHPLC performance and narrow peak widths can only be observed with older, traditional instruments that have adequately low instrument bandwidth (i.e. dispersion). This paper will give an overview of the problem and describe some simple ways to qualify HPLC instruments, within their operating parameters, for use with modern, higher performance columns.

3
Band Broadening in Column (at two different times)
While peak width increases in proportion to the square root of the distance migrated, separation of peak centers increases in direct proportion to distance migrated; thus resolution increases as distance migrated increases. Longer columns produce higher resolution.A chromatographic peak, modeled as a statistical distribution of
molecules, has the property of standard deviation, σ. Therefore, total peak width can be closely estimated by w = 4σ, where w or σ
is measured in units of length, time, or volume.
Flow
Peak width, w
∝ L1/2
∆ L ∝ L
Resolution,
R = ∆ L/w
L2
L1
U. D.
Neue, HPLC Columns: Theory, Technology and Practice, Wiley-VCH (1997)..

4
Chromatographic Peak Variance
•σ2col
is a fixed parameter of a column (for a given k value)
•Σ2instr
is something user can affect (though specific to a given flow rate)
•IBW =
4σinstr
(or 4σ)
σ2obs
= σ2col
+ σ2instr
(σ2instr
= σ2extra-col )
σ2instr
= σ2inj
+ σ2det
+ σ2tubing
5
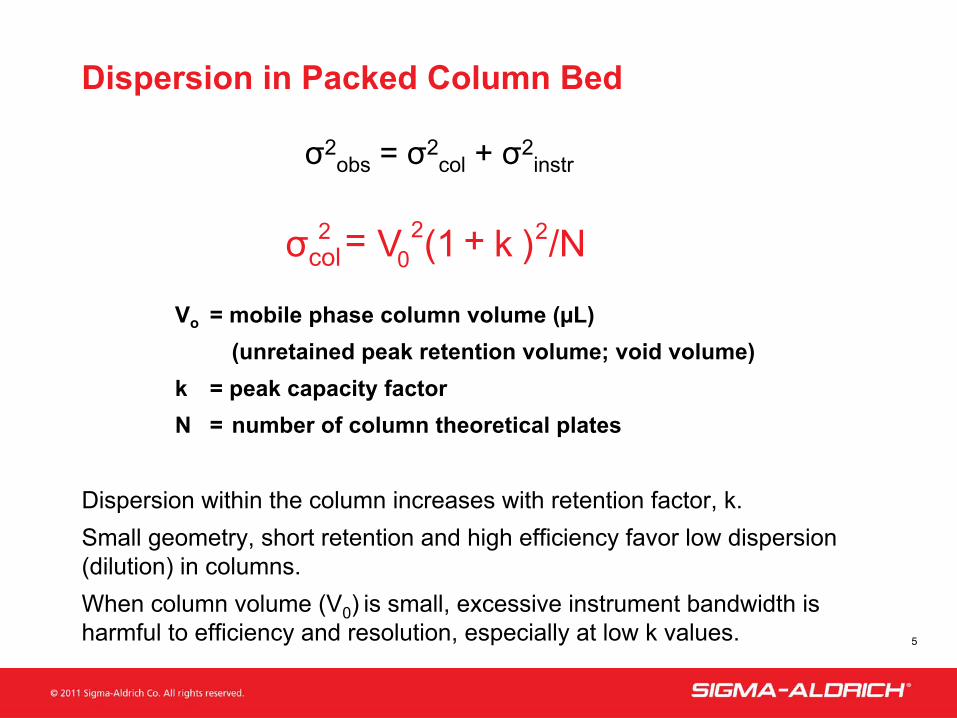
Dispersion in Packed Column Bed
Vo
= mobile phase column volume (µL)(unretained peak retention volume; void volume)
k
= peak capacity factorN
=
number of column theoretical plates
/N)k(1Vσcol22
02 +=
Dispersion within the column increases with retention factor, k.Small geometry, short retention and high efficiency favor low dispersion (dilution) in columns.When column volume (V0
)
is small, excessive instrument bandwidth is harmful to efficiency and resolution, especially at low k values.
σ2obs
= σ2col
+ σ2instr
6
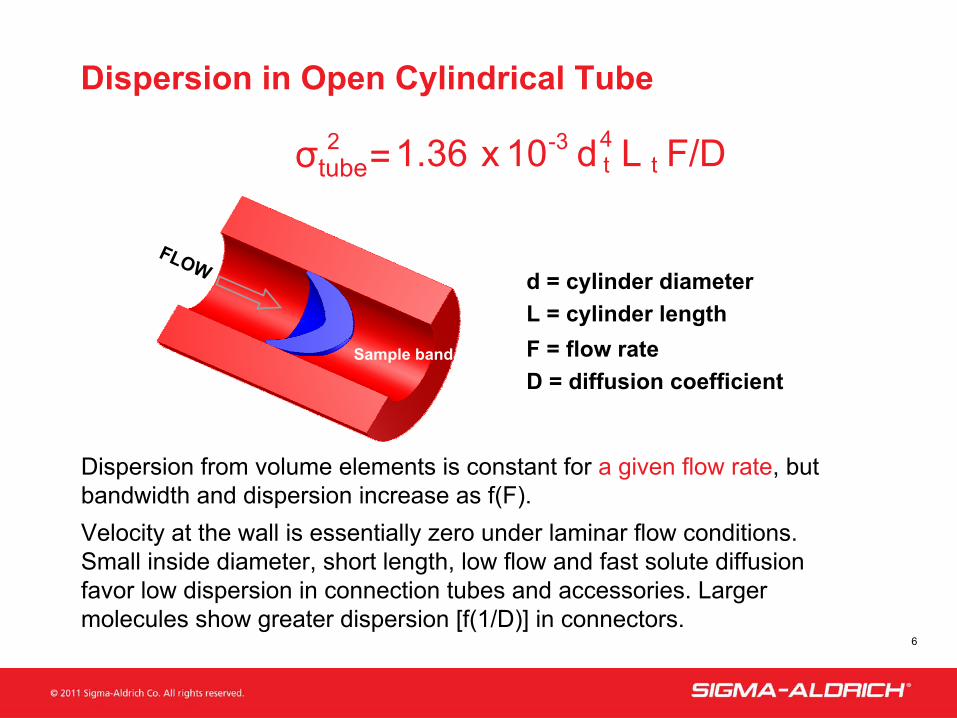
Dispersion in Open Cylindrical Tube
Dispersion from volume elements is constant for a given flow rate, but bandwidth and dispersion increase as f(F).Velocity at the wall is essentially zero under laminar flow conditions. Small inside diameter, short length, low flow and fast solute diffusion favor low dispersion in connection tubes and accessories. Larger
molecules show greater dispersion [f(1/D)] in connectors.
F/DLd 10x 1.36σtube t4t
-32 =
d = cylinder diameterL = cylinder lengthF = flow rateD = diffusion coefficient
FLOW
Sample band

7
Principle of Measuring IBW
•
If therefore, σ2col
is eliminated, the observed peak variance is due only to variance originating from IBW.
•
Two common methods for eliminating σ2col
, each requiring different experimental setups:
•
Extrapolation method–
makes use of actual chromatographic data, simple data transformations, and graphical extrapolation to V0
= 0.–
This method was not used for this study because results vary with performance
of column and relative size of IBW vs V0
.•
Direct method–
directly connect injector to detector–
make injection and record peak, retention time, N; calculate σ
(and thus 4σ)–
can also calculate 4σ
by hand from print-out of peak
Recall that for chromatographic peak,
σ2obs
= σ2col
+ σ2instr

8
Direct Method for Measuring IBW
•
Connect injector to detector•
ZDV union•
shunt
•
Inject small volume (µL or less) of chromophore•
Record peak retention time and N•
Calculate IBW:σ
= (r.t. * flow) / √
NIBW = 4σ
•
Devil is in the details•
data sampling rate•
detector response time•
flow rate•
calculation of N
These determinations of IBW are specific to the defined flow rate.
9
Details of IBW Measurement
•
Data Sampling Rate•
too low a sampling rate will result in truncated peak heights, thus yielding artificially low values of N; this leads to artificially higher calculated values of σ.
•
Detector Response Time•
too slow a detector response will result in artificially broad peaks and longer retention times.
•
Flow rate•
effects dispersion (and thus IBW) but also informs consideration
of appropriate data sampling rate and detector response time.
•
Calculation of N•
To maximize data precision and accuracy, calculate N based on peak width-at-
half-height rather than peak width-at-baseline; determination of peak width at baseline can be problematic and less certain.

10
Standard Protocol for Measuring IBW
• mobile phase: 40:60, water:methanol• test probe:
1% (v/v) acetone in mobile phase• flow rate: 0.1 mL/min.• det.: 250 nm• injection: 0.5 µL• sampling rate: ≥
10 Hz• detector response time: ≤
0.1 sec
•record peak retention time and N (N by peak width-half-height method)•calculate IBW
σ
= (tr
* flow) / √
NIBW = 4σ

11
0.4 0.6 0.8 1.0 1.2Time (min)
0.2
4σ
= 30.5 µL
7.3 cm
23.9 cm
Alternate Method for Hand-Calculating IBW
•
Identical experimental protocol to calculated method.
•
expand chromatogram region of interest.
•
make hardcopy.•
draw tangent lines and baseline with ruler.
•
measure distances.•
peak width measured where tangent lines intersect baseline.
•
time axis scaling.•
calculate peak width as shown in example.
= 30.5 µL7.3 cm 100 µL1 min.
x x23.9 cm1 min.
peak width
time-axis scaling
flow rate
may seem tedious.hand-calculated values for 4σ
can be remarkably close to calculations based on data system output –
N & tr
.
12
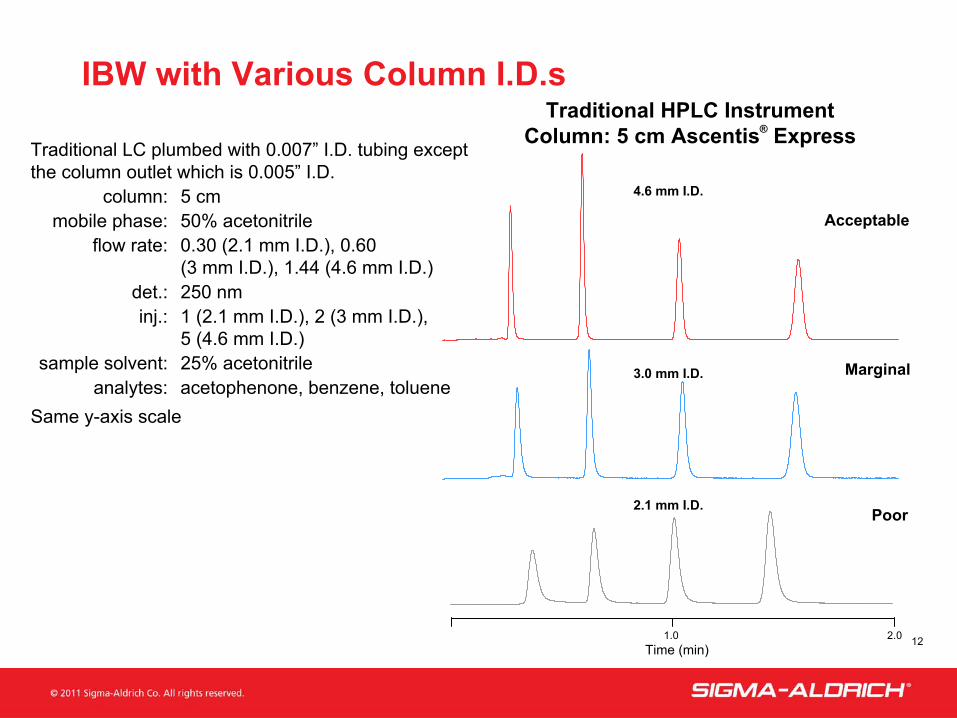
IBW with Various Column I.D.s Traditional HPLC Instrument
Column: 5 cm Ascentis®
ExpressTraditional LC plumbed with 0.007”
I.D. tubing except the column outlet which is 0.005”
I.D.column:
5 cmmobile phase: 50%
acetonitrileflow rate:
0.30 (2.1 mm I.D.), 0.60 (3 mm I.D.), 1.44 (4.6 mm I.D.)
det.: 250 nminj.: 1 (2.1 mm I.D.), 2 (3 mm I.D.),
5 (4.6 mm I.D.)sample solvent: 25% acetonitrile
analytes: acetophenone, benzene, tolueneSame y-axis scale
Time (min)1.0 2.0
4.6 mm I.D.
Acceptable
3.0 mm I.D. Marginal
2.1 mm I.D. Poor

13
IBW Effects vs Column I.D.
0
2000
4000
6000
8000
10000
12000
0.0 1.0 2.0 3.0 4.0 5.0k
N
4.6 mm I.D.3.0 mm I.D.2.1 mm I.D.
Measured Peak Efficiency vs k for 5 cm Columns with Different I.D.
All columns should have the same efficiency if IBW is small (<10%) relative to peak volume.
No instrument dispersion line (IBW = 0)
N = 12,000

14
Affecting IBW
•
IBW impacts column performance more as column internal volume becomes smaller; instrument internal volume should always be kept negligible with respect to column internal volume for high system efficiency.
•
IBW can be minimized by the following steps:–
reduce tubing I.D. (and volume)–
reduce tubing length (and volume)–
reduce detector flow cell volume
15
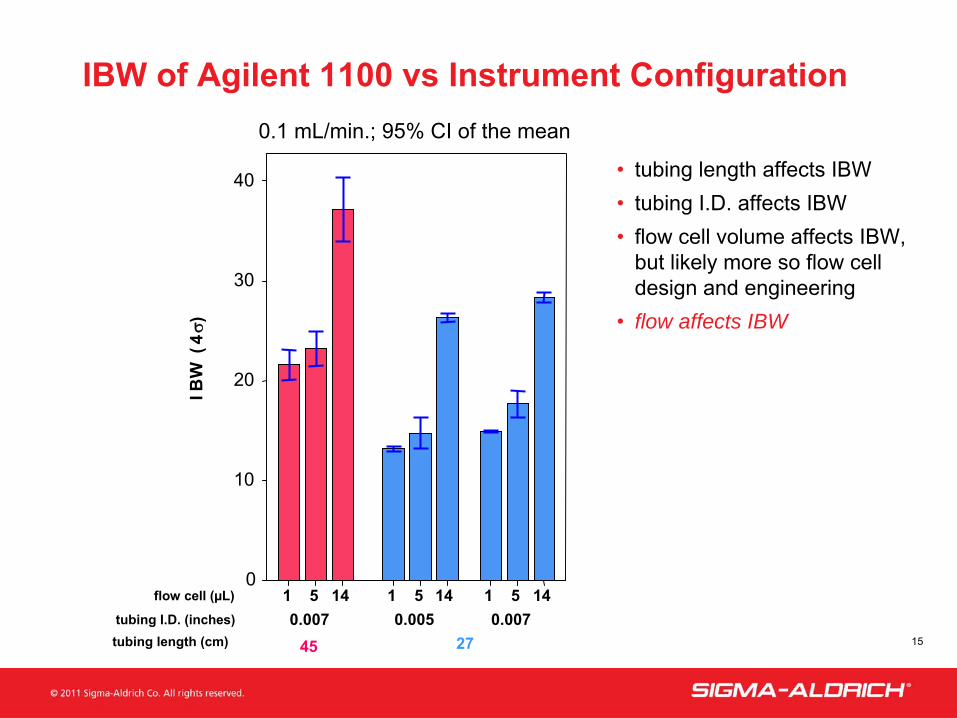
IBW of Agilent 1100 vs Instrument Configuration
• tubing length affects IBW• tubing I.D. affects IBW•
flow cell volume affects IBW, but likely more so flow cell design and engineering
• flow affects IBW
0.1 mL/min.; 95% CI of the mean
tubing length (cm)tubing I.D. (inches)
flow cell (µL)
27450.0070.0050.007
145114511451
40
30
20
10
0
IBW
( 4σ)
16
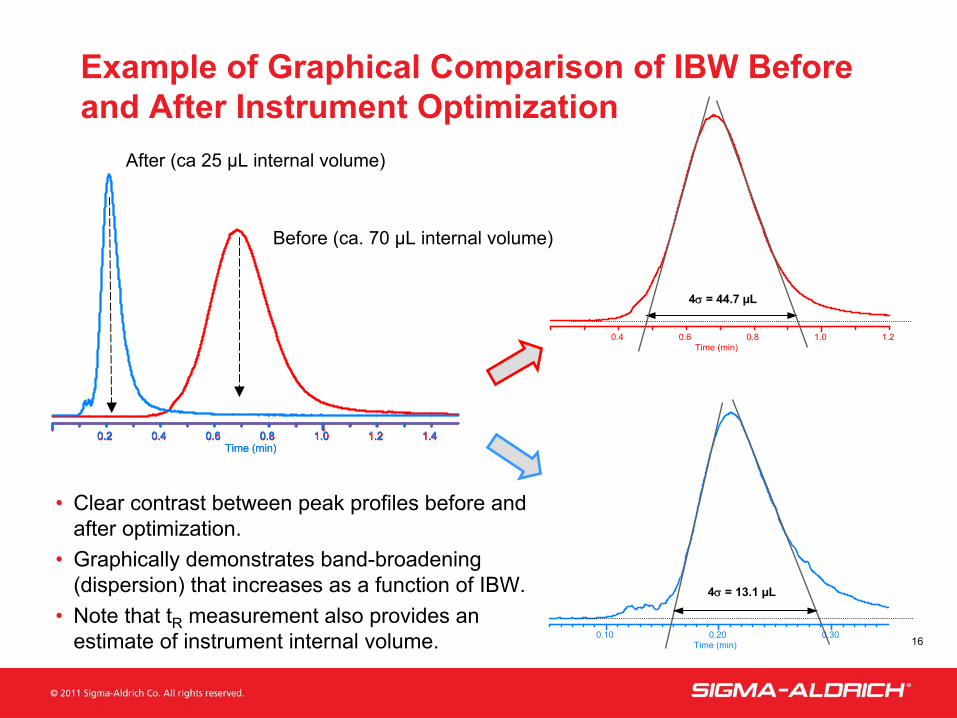
Example of Graphical Comparison of IBW Before and After Instrument Optimization
•
Clear contrast between peak profiles before and after optimization.
•
Graphically demonstrates band-broadening (dispersion) that increases as a function of IBW.
•
Note that tR
measurement also provides an estimate of instrument internal volume.
0.2 0.4 0.6 0.8 1.0 1.2 1.40.2 0.4 0.6 0.8 1.0 1.2 1.4Time (min)
After (ca 25 µL internal volume)
0.10 0.20 0.30Time (min)
4σ
= 13.1 µL
0.4 0.6 0.8 1.0 1.2Time (min)
4σ
= 44.7 µL
0.2 0.4 0.6 0.8 1.0 1.2 1.40.2 0.4 0.6 0.8 1.0 1.2 1.4Time (min)
Before (ca. 70 µL internal volume)

17
Agilent 1100 Optimized for Minimum IBW (IBW = 12.4 µL)
•
tubing I.D.•
small I.D. tubing–
0.005”
I.D. (instead of 0.007”
or 0.010”
I.D.)
•
tubing lengths•
minimized column inlet and outlet lengths•
low-volume tubing –
needle seat 10 cm (std is 10 cm as well, but 0.007”
I.D.)–
inlet 7 cm (std is 7 cm as well, but 0.007”
I.D.)–
outlet 15 cm (instead of 38 cm)
•
flow cell (VWD detector)–
1 µL, 5 mm path length (instead of 5 µL, 6 mm or 14 µL, 10 mm)

18
Column Performance Example: Before and After Optimization
3 x 100 mm Ascentis Express
0 2 4Time (min)
acet benz tolunaphurac
0 2 4Time (min)
acet benztolu
naphurac
N(acet) N(benz) N(tolu) N(naph)
standard 6410 12720 16030 17640optimized 15040 19790 20430 20470
percent improvement 135 56 27 16
Peak Efficiency
19
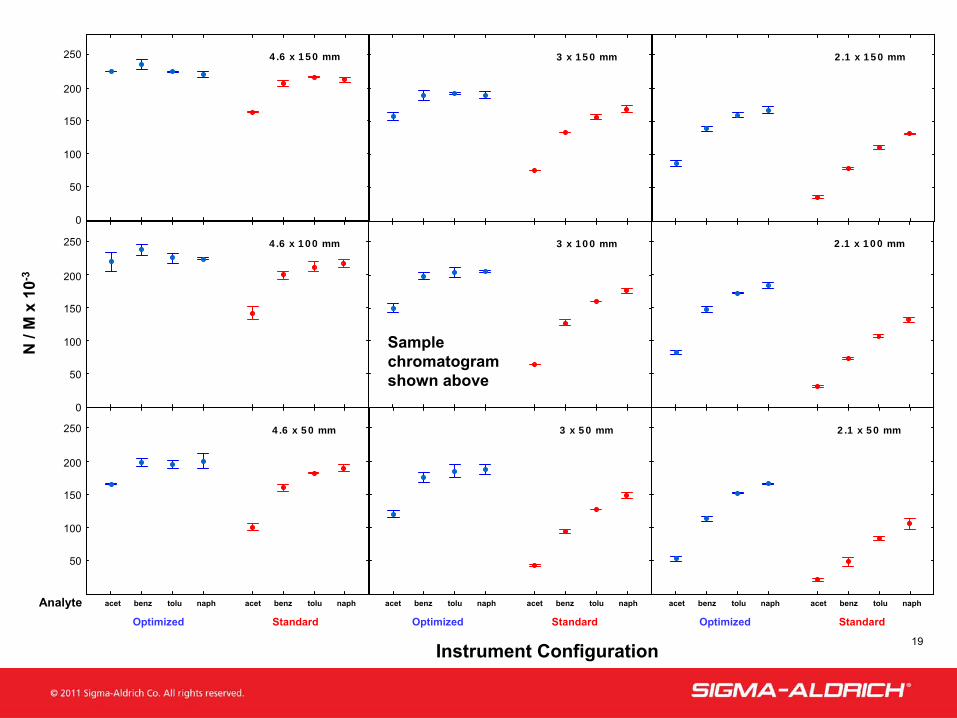
4.6 x 50 mm
3 x 150 mm4.6 x 150 mm
4.6 x 100 mm 3 x 100 mm
3 x 50 mm
2.1 x 150 mm
2.1 x 100 mm
2.1 x 50 mm
acet benz tolu naph acet benz tolu naph acet benz tolu naph acet benz tolu naphacet benz tolu naphacet benz tolu naph
50
0
100
150
200
250
50
100
150
200
250
50
0
100
150
200
250
N /
M x
10-3
Instrument Configuration
AnalyteOptimized Standard Optimized Standard Optimized Standard
Sample chromatogram shown above
20
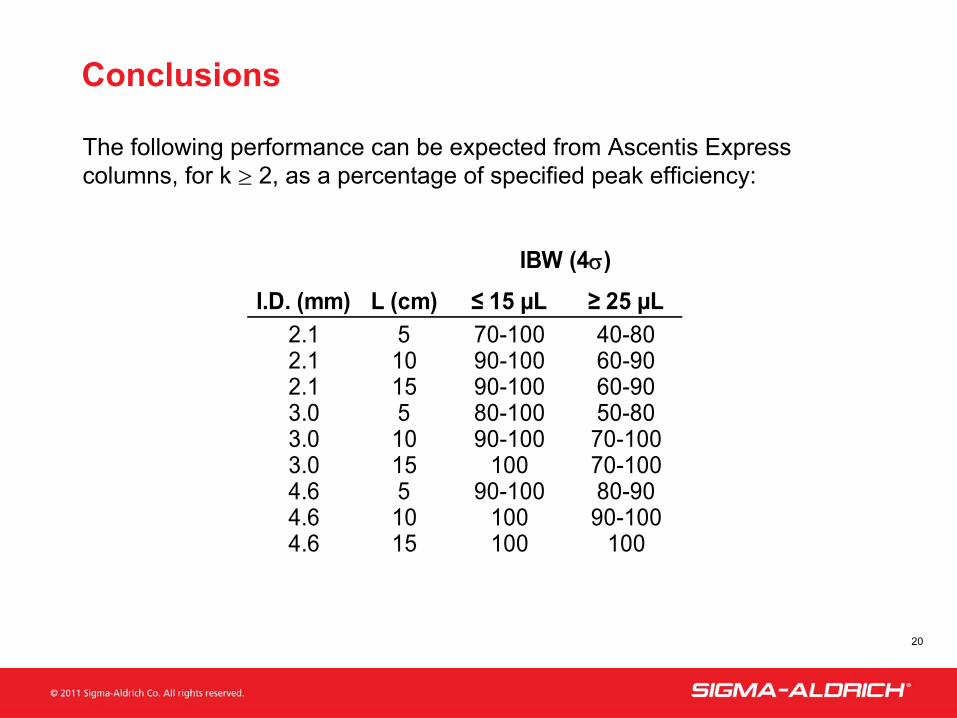
Conclusions
The following performance can be expected from Ascentis Express columns, for k ≥
2, as a percentage of specified peak efficiency:
I.D. (mm) L (cm) ≤ 15 µL ≥ 25 µL2.1 5 70-100 40-802.1 10 90-100 60-902.1 15 90-100 60-903.0 5 80-100 50-803.0 10 90-100 70-1003.0 15 100 70-1004.6 5 90-100 80-904.6 10 100 90-1004.6 15 100 100
IBW (4σ)

21
Conclusions (contd.)
IBW directly affects the performance that can be realized from high-
resolution (small particle) HPLC columns.Assessment of IBW can be made in a straightforward manner if details of the experimental protocol are followed.Due to differences in system design and engineering, all contributions to system volume must be considered in minimizing system IBW.This includes tubing I.D., tubing length, and flow cell volume.