Study of the reliability of corroded pipeline by the ASME ...

WHITE PAPER | August 2013
Natural Gas Pipeline System: Reliability and Resiliency
1

Introduction The United States electric grid system is riddled with well documented power outages. In the past five years, over 75 million customers have been affected by weather related power outages.1 In recent years, the U.S. has seen multiple wide spread power outages including but not limited to the North East Blackout in 2003, the Southern California Blackout in 2011 and the Hurricane Sandy Blackout in 2012. A search for more reliable alternatives leads to questions about the resiliency of the natural gas delivery system. In 2011, The Department of Energy reported that fewer than 100,000 natural gas customers experienced disruptions. This compares to 27.3 million customers who experienced power outages. Because the natural gas pipelines are predominantly underground and the system is not exposed to the elements, natural gas outages are rare and localized occurrences. The factors that contribute to natural gas system reliability include:
• Mechanical (as opposed to electrical) design of the natural gas system • Interruptions are quickly isolated and do not cascade to regional failures • Supply redundancy and multiple interconnecting pipeline points reinforce system integrity • Compressor units move supply even during power outages • Local distribution companies comprise micro grids for reliability • Ability to store natural gas ensures supply availability • Safety has reduced the number one cause for pipeline interruptions • Only extremely rare and violent earthquakes (those registering a 7.5 or higher on the Ritcher
Scale) would be likely to cause wide spread pipeline ruptures
2
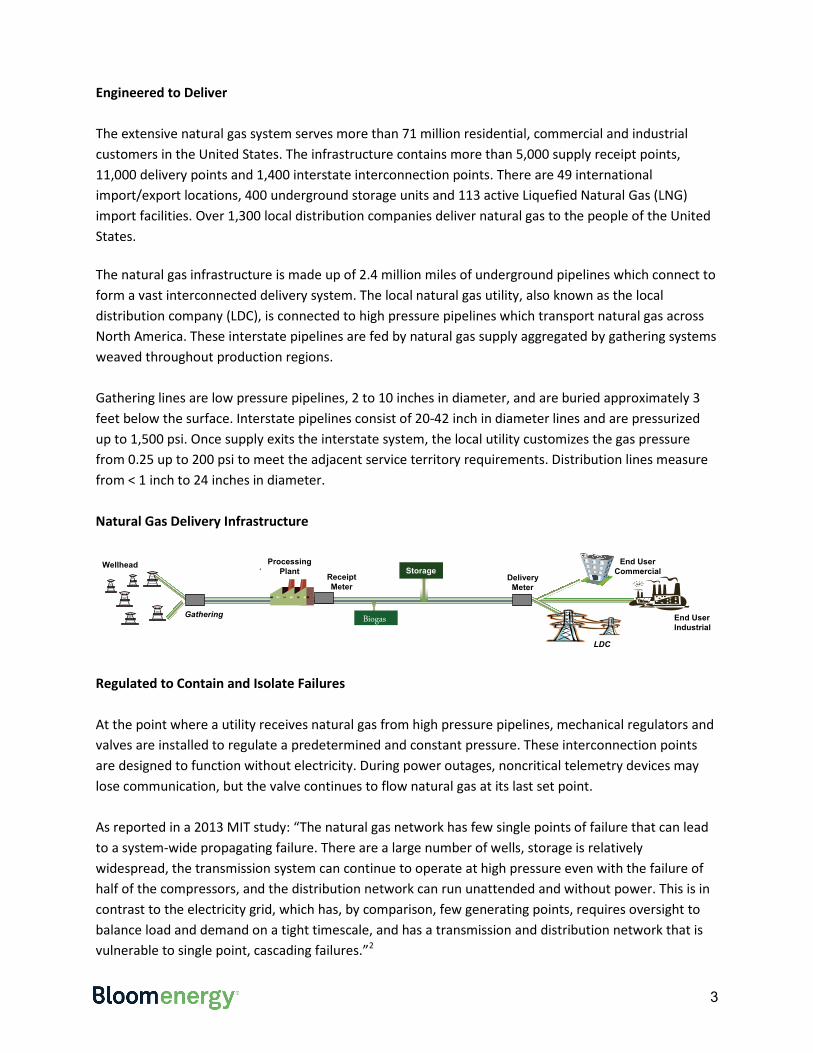
Engineered to Deliver The extensive natural gas system serves more than 71 million residential, commercial and industrial customers in the United States. The infrastructure contains more than 5,000 supply receipt points, 11,000 delivery points and 1,400 interstate interconnection points. There are 49 international import/export locations, 400 underground storage units and 113 active Liquefied Natural Gas (LNG) import facilities. Over 1,300 local distribution companies deliver natural gas to the people of the United States. The natural gas infrastructure is made up of 2.4 million miles of underground pipelines which connect to form a vast interconnected delivery system. The local natural gas utility, also known as the local distribution company (LDC), is connected to high pressure pipelines which transport natural gas across North America. These interstate pipelines are fed by natural gas supply aggregated by gathering systems weaved throughout production regions. Gathering lines are low pressure pipelines, 2 to 10 inches in diameter, and are buried approximately 3 feet below the surface. Interstate pipelines consist of 20-42 inch in diameter lines and are pressurized up to 1,500 psi. Once supply exits the interstate system, the local utility customizes the gas pressure from 0.25 up to 200 psi to meet the adjacent service territory requirements. Distribution lines measure from < 1 inch to 24 inches in diameter. Natural Gas Delivery Infrastructure
Regulated to Contain and Isolate Failures At the point where a utility receives natural gas from high pressure pipelines, mechanical regulators and valves are installed to regulate a predetermined and constant pressure. These interconnection points are designed to function without electricity. During power outages, noncritical telemetry devices may lose communication, but the valve continues to flow natural gas at its last set point. As reported in a 2013 MIT study: “The natural gas network has few single points of failure that can lead to a system-wide propagating failure. There are a large number of wells, storage is relatively widespread, the transmission system can continue to operate at high pressure even with the failure of half of the compressors, and the distribution network can run unattended and without power. This is in contrast to the electricity grid, which has, by comparison, few generating points, requires oversight to balance load and demand on a tight timescale, and has a transmission and distribution network that is vulnerable to single point, cascading failures.”2
Wellhead ProcessingPlant
DeliveryMeter
Storage
Gathering
End UserCommercial
End UserIndustrial
LDC
ReceiptMeter
Biogas
3

Redundancy for Reliability While no system is failure proof, the U.S. natural gas infrastructure has an advantageous redundancy of receipt/delivery interconnections combined with a network of compressor stations and strategically placed storage facilities. The U.S. consumes approximately 63 Billion cubic feet of natural gas per day. As illustrated in the figure below, natural gas production basins are dispersed throughout North America. Traditionally, supply has moved via interstate pipelines from the Gulf of Mexico, from the South Central States and from the Intermountain regions to communities throughout the United States. Recently shale gas in the Northeast and upper Midwest have added to supply redundancy. All of these geographical regions are intertwined with the network of interstate pipelines and utilities. The interconnectedness of the pipelines also offers a great deal of flexibility in moving gas, especially during times of localized supply curtailment.
Resiliency from Compression The United States has over 1,400 compression stations located every 50 to 100 miles along interstate pipelines “to boost the pressure that is lost through the friction of the natural gas moving through the steel pipe. Natural gas moves through the transmission system at up to 30 miles per hour.”3 “Gas compressors are built on either reciprocating or centrifugal technologies and with either combustion-powered or electric-powered-drive driver technologies. Combustion driven compression historically has used gas provided by a pipeline and thereby has offered a significant level of self-sufficiency for pipeline operations.”4 Approximately 50% of compressors on transmission lines consume natural gas from the pipeline it serves. Electric motor compressors are comingled among gas consuming compressors to ensure pipeline integrity. However, if no backup generation is available, pressure in each line will hold
4

and continue to deliver supply until electric service is restored. It is projected that, in the case of a large scale power outage, natural gas will continue to flow between two weeks and three months.2
Local Distribution Companies Gas utilities are responsible for the control of supply, equipment viability and pipeline safety within a geographical area. It is the utility which is ultimately responsible for the reliability of gas service. The distribution system is a micro-grid of the greater North American network. Lines are pressurized with smaller gas and electric compressor units. Larger pipelines are generally laid under streets with smaller lateral service lines branching off to customer locations. “Distribution mains are interconnected in multiple grid patterns with strategically located shut-off valves, so the utility can perform maintenance of its lines without ever shutting off a customer.”3 Operators can monitor and alter pressure at various points to ensure the integrity of the system. In most populated regions of the country, multiple interstate pipelines interconnect with a common LDC utility. For example, five interstate pipelines serve the utilities in New York and New Jersey: Transcontinental Gas, Tennessee Gas, Iroquois Gas, Millennium Pipeline and Columbia Gas Transmission. If a force majeure event occurs on one interstate pipeline, the utility draws supply from another interstate pipeline and gas service continues to the customers without interruption. Additionally, utilities in high demand areas have tactically located storage facilities available in the event of an emergency. Natural Gas Storage: Ensures Available Supply of Gas On-Demand Natural gas storage is critical to maintaining the continued reliability of natural gas supply throughout the United States. Underground storage resources such as depleted oil and gas fields, aquifers and salt caverns are used to stockpile emergency gas supply near the consumer. Above ground LNG facilities also
5

reinforce regional supply redundancy. Storage acts as a supply cushion which accommodates the fluctuation between supply production and market consumption, balancing operational needs and potential supply disruptions without affecting consumers. The U.S. Energy Information Agency releases the natural gas storage inventory report which constantly monitors available supply ready for market. Keith Hutton, CEO of XTO Energy, states, “When you take a look at the natural gas industry, you find an invisible link that keeps it running efficiently. This unseen link is natural gas storage facilities.” ‘Safety’ Is The Foundation For Delivery Public safety is the number one priority for all natural gas pipeline companies and operators. “The U.S. Department of Transportation's Pipeline and Hazardous Materials Safety Administration (PHMSA) Office of Pipeline Safety (OPS) is the federal safety authority for ensuring the safe, reliable, and environmentally sound operations of our nation's pipeline transportation system. An important component of OPS's mission is to promote pipeline safety communication and education.”5
In addition to PHMSA, a number of federal, state and local agencies are involved in ensuring pipeline safety. These agencies include:
• U.S. Department of Transportation (DOT): promulgate, interpret and enforce safety standards
• Federal Energy Regulatory Commission (FERC): regulates pipeline commerce • Office of Pipeline Safety (OPS): promote safe and environmental operations
NATURAL GAS STORAGE 1. 400 underground natural gas storages in U.S.
a. depleted natural gas or oil fields (326) b. aquifers (43) c. salt caverns (31)
2. 113 active LNG storages U.S. a. minus 161°C (-260 °F) b. energy density: 600 to1 times uncompressed
gas c. 55 U.S. Utilities own backup LNG facilities
3. Northeast a. 110 underground storage facilities b. 8 LNG facilities c. 20.3 Bcf per Day of withdraw
4. California a. 12 underground storage facilities b. 1 LNG terminal c. 6.8 Bcf per Day of withdraw
*EIA Sources
6

• National Transportation Safety Board (NTSB): independent federal investigation agency • U.S. Coast Guard: marine security • Federal Emergency Management Agency (FEMA): post disaster assistance and assessment • Public Utility Commission (PUC): State standards and regulations • State and Local Fire Departments: emergency prevention and post incident assistance • Other agencies: involved in specialized fields
» U.S. Environmental Protection Agency (EPA) » U.S. Department of Labor’s Occupational Safety and Health Administration (OSHA) » ASTM International (American Society for Testing and Materials) » American Petroleum Institute (API) » NACE International (National Association of Corrosion Engineers) » Federal Highway Administration (FHWA)
“Although pipelines exist in all fifty states, most of us are unaware that this vast network even exists. This is due to the strong safety record of pipelines and the fact that most of them are located underground. Installing pipelines underground protects them from damage and helps protect our communities as well.”6 Reliability Enhanced By Risk Awareness The Department of Transportation states that the leading causes for serious pipeline damage are forms of human error. Excavation near existing pipelines is the leading reason for pipeline ruptures and service outages. Topical disruptions are quickly detected, and ruptures are isolated to a small geographical area and are resolved in a timely manner. “Pipeline safety is the natural gas pipeline industry’s number one priority. Natural gas pipeline companies spend a large part of their operating budgets to ensure that pipelines run safely and reliably. Natural gas pipeline operators’ history of commitment to safety is confirmed by studies showing that natural gas pipelines historically have been by far the safest mode of transportation in the United States.”7
7
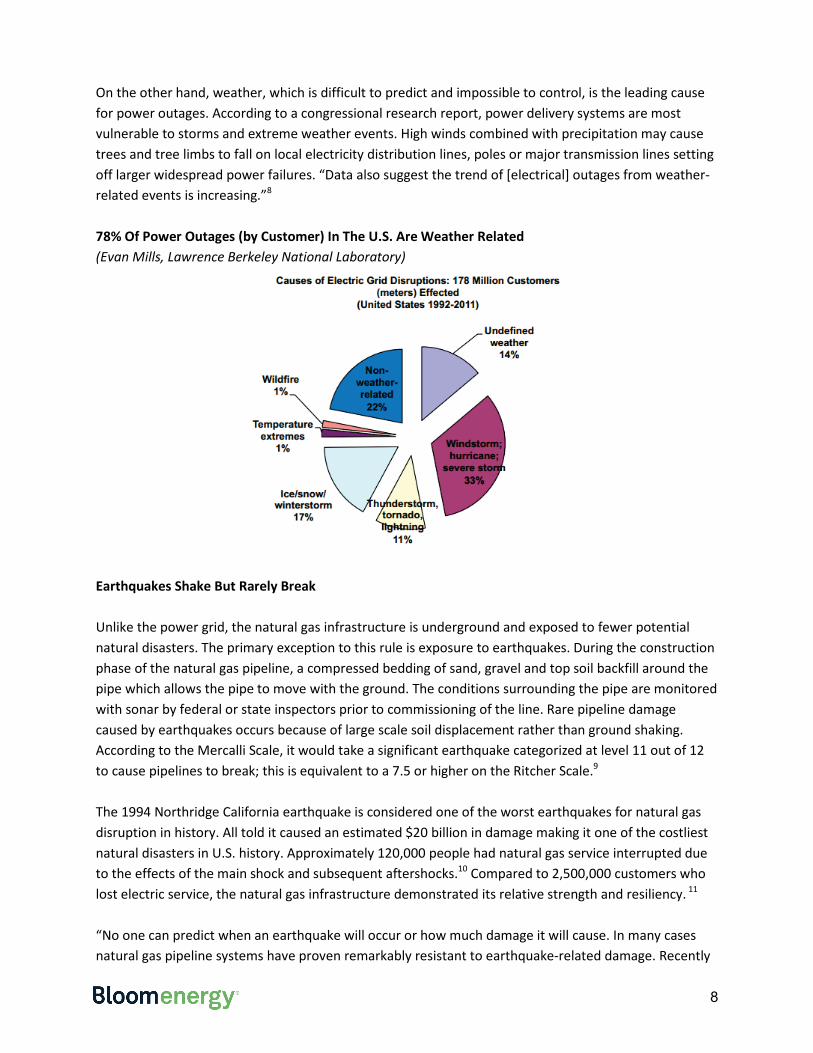
On the other hand, weather, which is difficult to predict and impossible to control, is the leading cause for power outages. According to a congressional research report, power delivery systems are most vulnerable to storms and extreme weather events. High winds combined with precipitation may cause trees and tree limbs to fall on local electricity distribution lines, poles or major transmission lines setting off larger widespread power failures. “Data also suggest the trend of [electrical] outages from weather-related events is increasing.”8 78% Of Power Outages (by Customer) In The U.S. Are Weather Related (Evan Mills, Lawrence Berkeley National Laboratory)
Earthquakes Shake But Rarely Break Unlike the power grid, the natural gas infrastructure is underground and exposed to fewer potential natural disasters. The primary exception to this rule is exposure to earthquakes. During the construction phase of the natural gas pipeline, a compressed bedding of sand, gravel and top soil backfill around the pipe which allows the pipe to move with the ground. The conditions surrounding the pipe are monitored with sonar by federal or state inspectors prior to commissioning of the line. Rare pipeline damage caused by earthquakes occurs because of large scale soil displacement rather than ground shaking. According to the Mercalli Scale, it would take a significant earthquake categorized at level 11 out of 12 to cause pipelines to break; this is equivalent to a 7.5 or higher on the Ritcher Scale.9 The 1994 Northridge California earthquake is considered one of the worst earthquakes for natural gas disruption in history. All told it caused an estimated $20 billion in damage making it one of the costliest natural disasters in U.S. history. Approximately 120,000 people had natural gas service interrupted due to the effects of the main shock and subsequent aftershocks.10 Compared to 2,500,000 customers who lost electric service, the natural gas infrastructure demonstrated its relative strength and resiliency. 11 “No one can predict when an earthquake will occur or how much damage it will cause. In many cases natural gas pipeline systems have proven remarkably resistant to earthquake-related damage. Recently
8

installed natural gas pipelines are made of high-strength steel or polyethylene plastic. These materials are flexible enough to withstand significant earth movement without sustaining damage.”12
Conclusion Storm-related power outages cost the U.S. economy between $20 billion and $55 billion annually.9 In addition, electric grid outages often occur due to overload, aging infrastructure, downed tree limbs or unfortunate interactions between power lines and wildlife. When electricity goes out, the design of the natural gas system allows it to continue to run, and the gas delivery network continues unaffected. As a result, a technology that can reliably convert natural gas into electricity offers the most reliable source of electricity available.
9
References 1 US Department of Energy, Energy Information Administration, “Electric Emergency Incident and Disturbance Report.” 2 Massachusetts Institute of Technology, Lincoln Laboratory, “Interdependence of the Electricity Generation System and the Natural Gas System and Implications for Energy Security,” 15 May 2013. 3 American Gas Association, “How Does the Natural Gas Delivery System Work?” http://www.aga.org/Kc/aboutnaturalgas/consumerinfo/Pages/NGDeliverySystem.aspx
4 Black & Veatch, The Electric Reliability Council of Texas (ERCOT), “Gas Curtailment Risk Study,” March 2012, Dallas, TX, http://www.ercot.com/content/news/presentations/2012/BV%20ERCOT%20Gas%20Study%20Report%20March%202012.pdf. 5 Department of Transportation, Pipeline & Hazardous Material Safety Administration, http://primis.phmsa.dot.gov/comm/.
6 Department of Transportation, Pipeline & Hazardous Material Safety Administration, http://opsweb.phmsa.dot.gov/pipelineforum/facts-and-stats/pipeline-101/. 7The Interstate Natural Gas Association of America (INGAA). http://www.ingaa.org/cms/4921.aspx. 8 Campbell, Richard J., Specialist in Energy Policy, Congressional Research Service, “Weather-Related Power Outages and Electric System Resiliency,” 28 August 2012, http://www.fas.org/sgp/crs/misc/R42696.pdf. 9 Source: Department of Natural Resources, Missouri, http://www.dnr.mo.gov/geology/geosrv/geores/richt_mercali_relation.htm. 10California Seismic Safety Commission. “Improving Natural Gas Safety in Earthquakes,” 11 July 2002, http://www.seismic.ca.gov/pub/CSSC_2002-03_Natural%20Gas%20Safety.pdf. 11 Resilience of Integrated Power and Water Systems, http://mceer.buffalo.edu/publications/resaccom/04-sp01/06_shino.pdf. 12 Questar Gas, “Earthquake preparedness and natural gas,” http://www.questargas.com/brochures/59053.pdf.
10