lecture 19 In-situ Metrologyee290h/fa05/Lectures/PDF/lecture 19 In...Lecture 19: In Situ Metrology...
46
Lecture 19: In Situ Metrology Spanos EE290H F05 1 In-Situ Metrology The Art of the Possible
Transcript of lecture 19 In-situ Metrologyee290h/fa05/Lectures/PDF/lecture 19 In...Lecture 19: In Situ Metrology...
Lecture 19: In Situ Metrology
SpanosEE290H F05
1
In-Situ Metrology
The Art of the Possible
Lecture 19: In Situ Metrology
SpanosEE290H F05
2
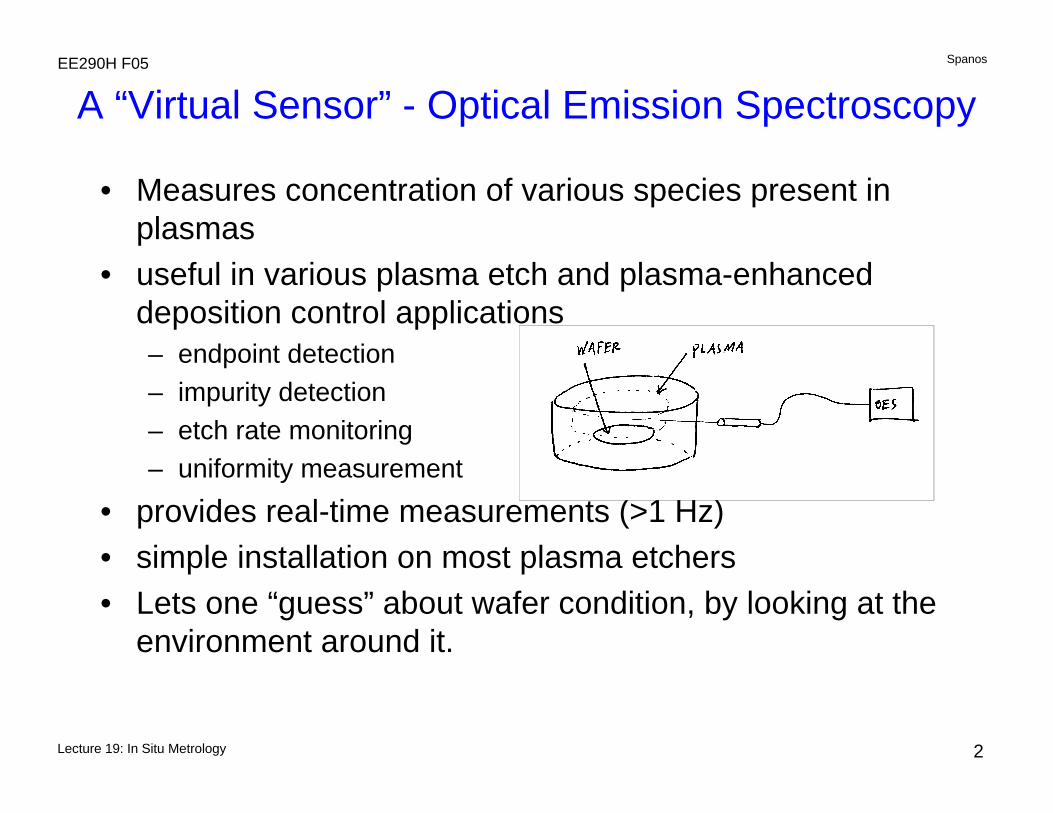
A “Virtual Sensor” - Optical Emission Spectroscopy
• Measures concentration of various species present in plasmas
• useful in various plasma etch and plasma-enhanced deposition control applications– endpoint detection– impurity detection– etch rate monitoring– uniformity measurement
• provides real-time measurements (>1 Hz)• simple installation on most plasma etchers• Lets one “guess” about wafer condition, by looking at the
environment around it.
Lecture 19: In Situ Metrology
SpanosEE290H F05
3
OES (cont.)
• operation principle– plasmas contain ions, neutral radicals, energetic
electrons– plasma discharge light
A + e A* + e, A* A+hνhere A* is the excited state of particle A
• frequency of emitted light – depends on allowable energy transitions– is characteristic of species– sometimes there is no useful emission signature in
OES (ex: SiH3 in PECVD with silane plasma)
Lecture 19: In Situ Metrology
SpanosEE290H F05
4
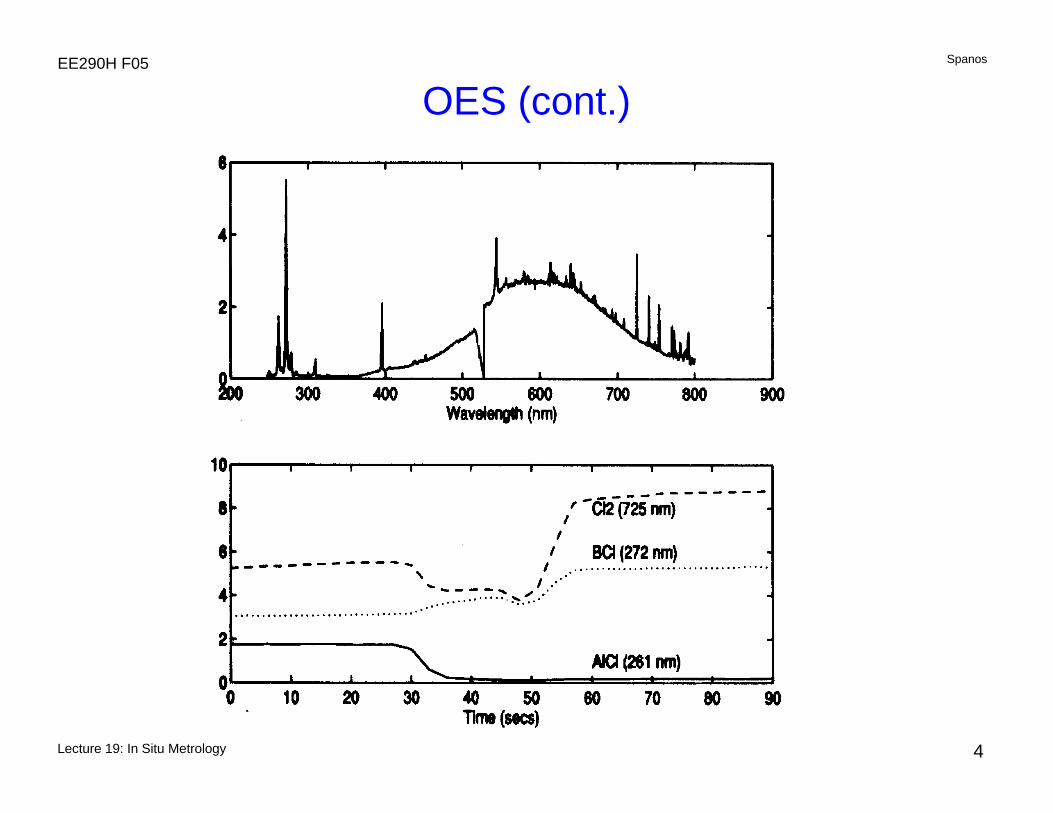
OES (cont.)
Lecture 19: In Situ Metrology
SpanosEE290H F05
5
OES (cont.)
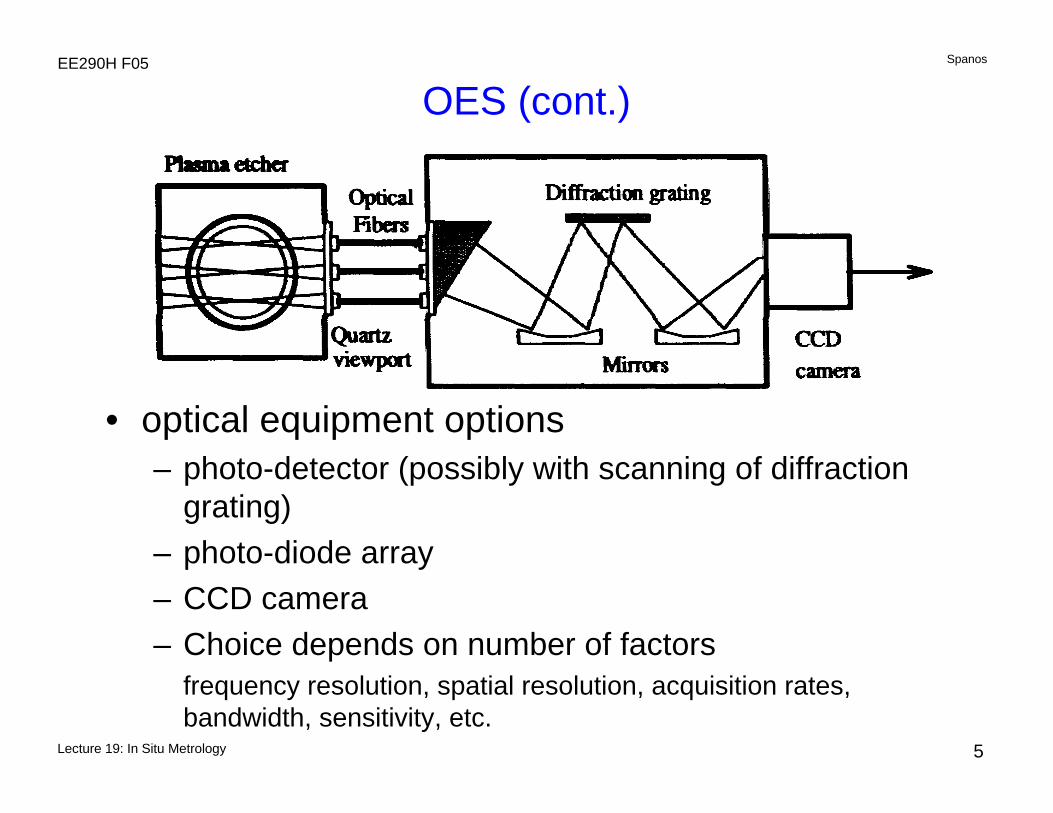
• optical equipment options– photo-detector (possibly with scanning of diffraction
grating)– photo-diode array– CCD camera– Choice depends on number of factors
frequency resolution, spatial resolution, acquisition rates, bandwidth, sensitivity, etc.
Lecture 19: In Situ Metrology
SpanosEE290H F05
6
OES (cont.)
• Signal Processing Issues– OES intensities depend on several factors in addition
to species concentration, such asExcitation probability (strongly dependent on RF power), Optical collection efficiency (drifts over time due to residue build-up on window).
– full-spectrum OES may require data compression and noise reduction.
– signal intensity may be too weak in small area etches (vias and contact cuts in oxide, detection of trace Cu sputter targets in Al-Cu etches, etc.)
Lecture 19: In Situ Metrology
SpanosEE290H F05
7
Laser-Induced Fluoresence
• basic idea use a pulsed laser to excite plasma, observe induced emissionlaser can be tuned to cause specific excitationscan detect species that have no natural emission SiH3
can detect species in ground state
• detailsNd-YAG laser source @1064 nm used to pump tunable dye laser pulsed lasers provide much more power in short excitation phase thus emission exceeds backgroundcollection optics at 90o to source to minimize scattered lightcan detect and measure CF,CF2,SiO,SiN,BCl,Cl2+,...
Lecture 19: In Situ Metrology
SpanosEE290H F05
8
LIF (cont.), LAS• issues
– excellent spatial resolution (5 microns)– excellent temporal resolution (100nsec)– sensitivity 106-108 particles/cm3
– complex collection optics and signal processing– more complex than OES, but much more accurate– requires side viewing port– requires actinometry for calibration– limited to species with absorption in 200- 900nm range
• other option -- Laser absorption spectroscopy– tunable laser diode is used as source in IF range– absorption is very low here, so multiple passes are needed – path length is ~ 1Km– poorer resolution– qualitative tool
Lecture 19: In Situ Metrology
SpanosEE290H F05
9
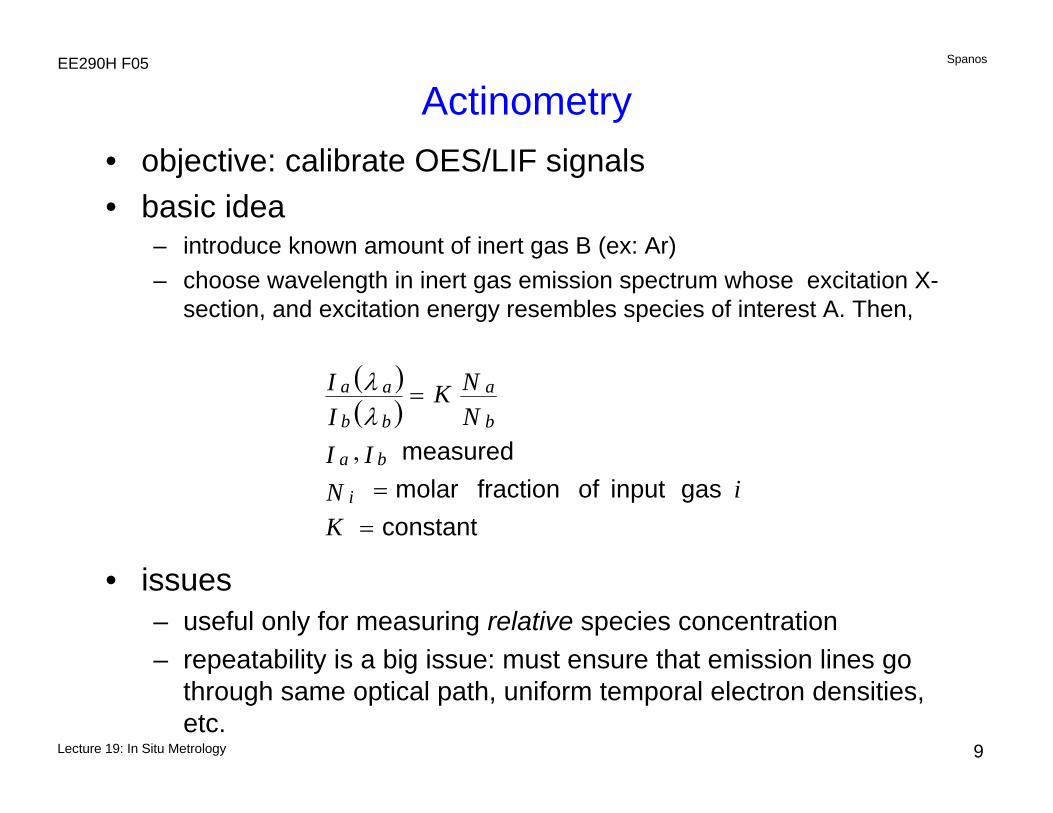
Actinometry• objective: calibrate OES/LIF signals • basic idea
– introduce known amount of inert gas B (ex: Ar)– choose wavelength in inert gas emission spectrum whose excitation X-
section, and excitation energy resembles species of interest A. Then,
• issues– useful only for measuring relative species concentration– repeatability is a big issue: must ensure that emission lines go
through same optical path, uniform temporal electron densities, etc.
( )( )
constant gas input of fraction molar
measured
==
=
K i N
IINNK
II
i
ba
b
a
bb
aa
,λλ
Lecture 19: In Situ Metrology
SpanosEE290H F05
10
Diffraction gratings• used to spectrally resolve light• operating principle
– close parallel lines or steps etched on a surface– mechanically made gratings: etched glass or plastic – holographically patterned gratings: higher transmission, flatter
response– modern gratings are blazed: periodic phase shifting across
grating, concentrates light energy in a specific order
• performance characteristicspeak location is at sinθ = mλ/dresolving power R = λ/Δλ = Nmdispersion D = Δθ/Δλ = m/dcosθd = spacing, N = number of lines, m = orderλ = wavelength of incident light, θ = viewing angle
Lecture 19: In Situ Metrology
SpanosEE290H F05
11
Monochromators
• basic idea– essentially a tunable narrow-band wavelength selective optical filter– uses a diffraction grating
• issues– accuracy of selected wavelength– calibration– efficiency (transmission ~ 10 %)
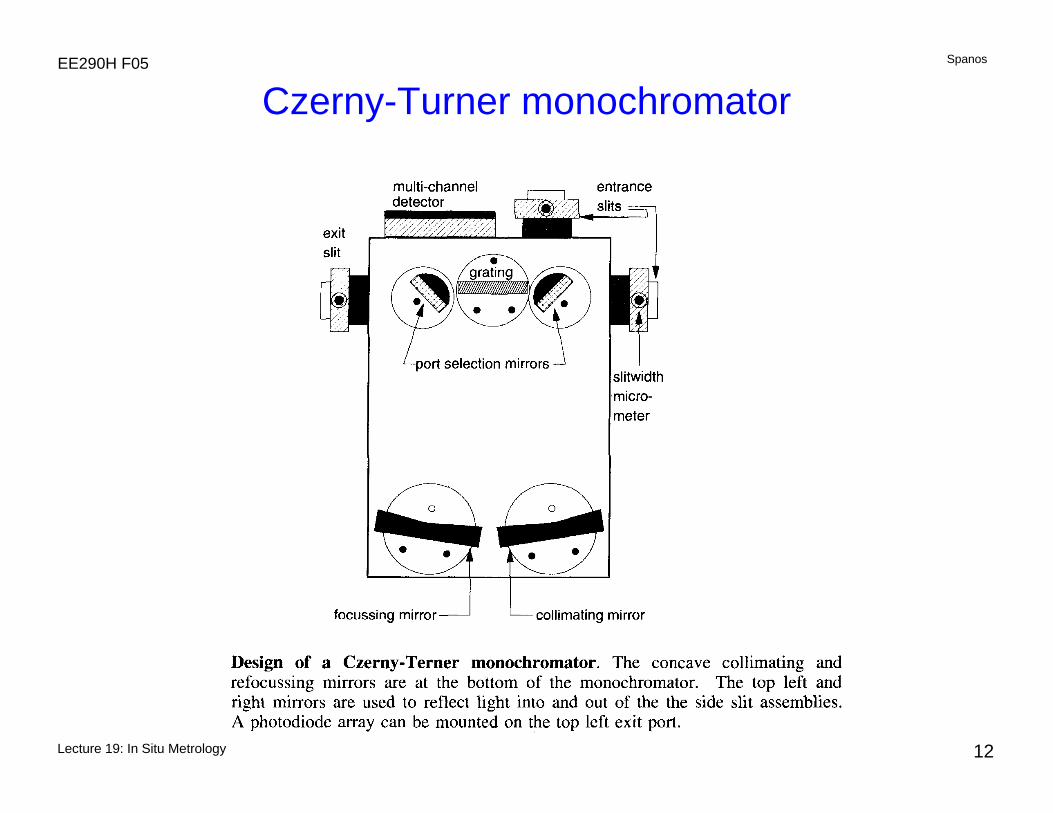
• Czerny-Turner monochromator– grating is rotated by a stepper drive– angle of rotation determines wavelength of light at exit slit
• dielectric bandpass filters– fixed wavelength applications– transmission ~ 50 - 70 %
Lecture 19: In Situ Metrology
SpanosEE290H F05
12
Czerny-Turner monochromator
Lecture 19: In Situ Metrology
SpanosEE290H F05
13
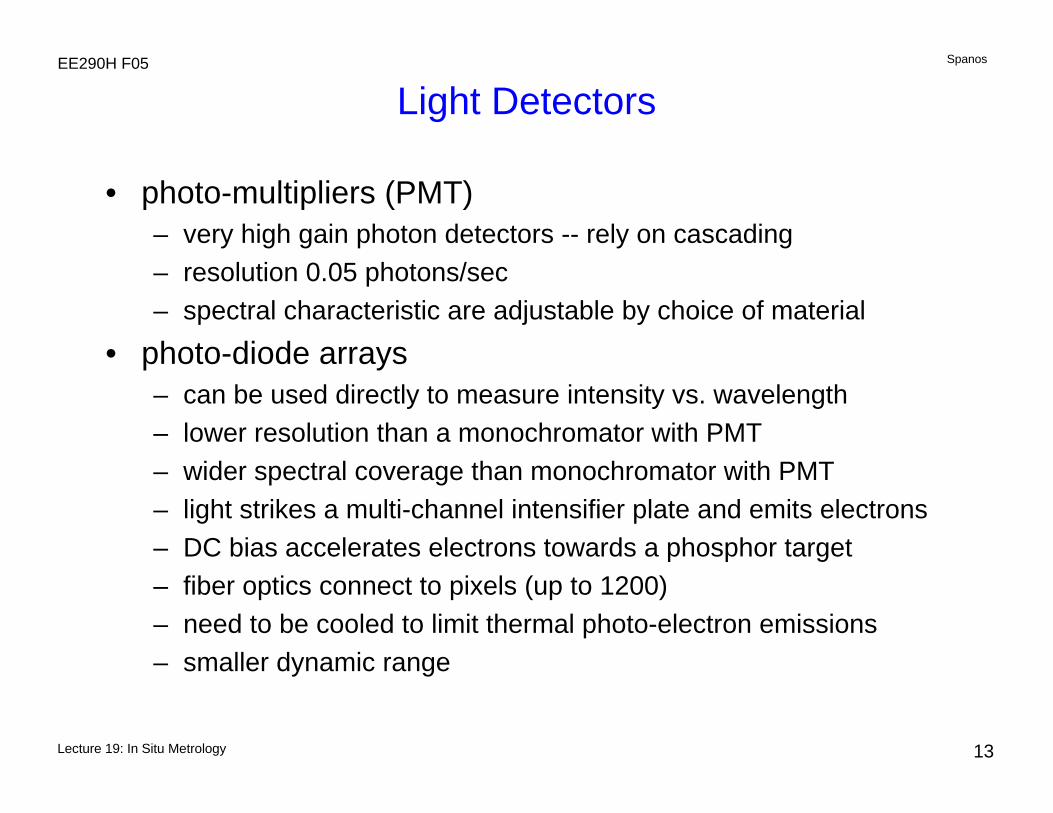
Light Detectors
• photo-multipliers (PMT)– very high gain photon detectors -- rely on cascading – resolution 0.05 photons/sec– spectral characteristic are adjustable by choice of material
• photo-diode arrays– can be used directly to measure intensity vs. wavelength– lower resolution than a monochromator with PMT– wider spectral coverage than monochromator with PMT– light strikes a multi-channel intensifier plate and emits electrons– DC bias accelerates electrons towards a phosphor target– fiber optics connect to pixels (up to 1200)– need to be cooled to limit thermal photo-electron emissions– smaller dynamic range
Lecture 19: In Situ Metrology
SpanosEE290H F05
14
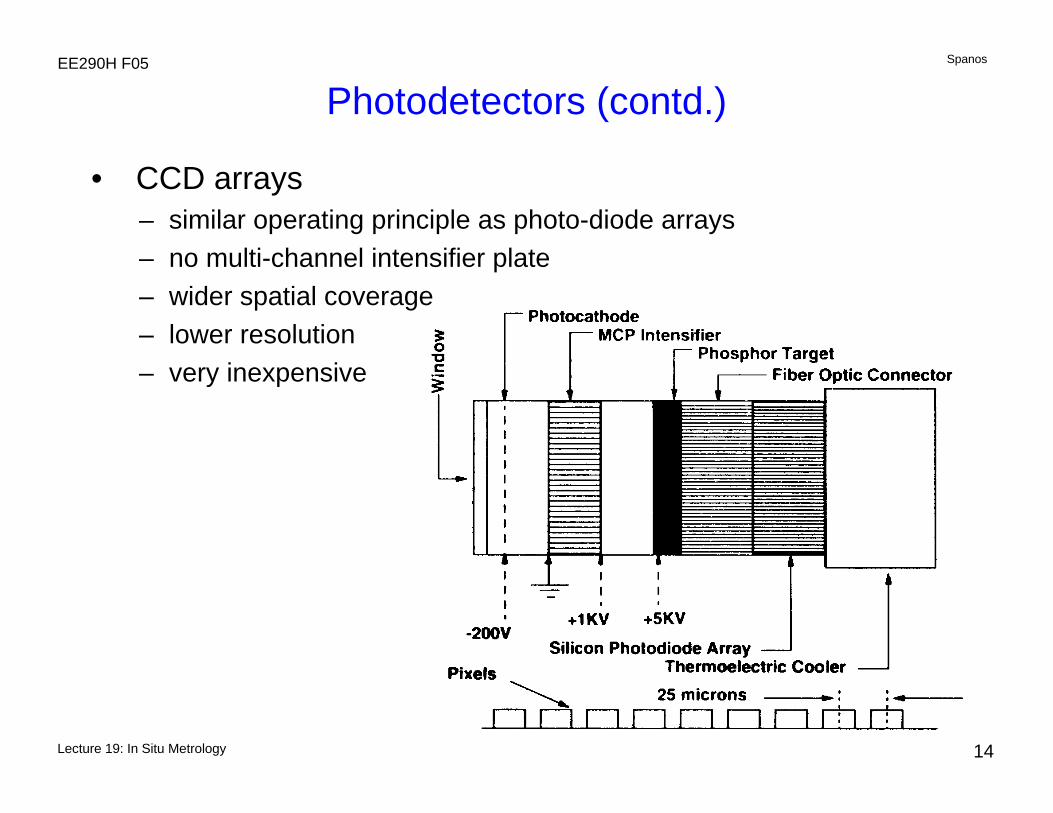
Photodetectors (contd.)
• CCD arrays– similar operating principle as photo-diode arrays– no multi-channel intensifier plate– wider spatial coverage– lower resolution– very inexpensive
Lecture 19: In Situ Metrology
SpanosEE290H F05
15
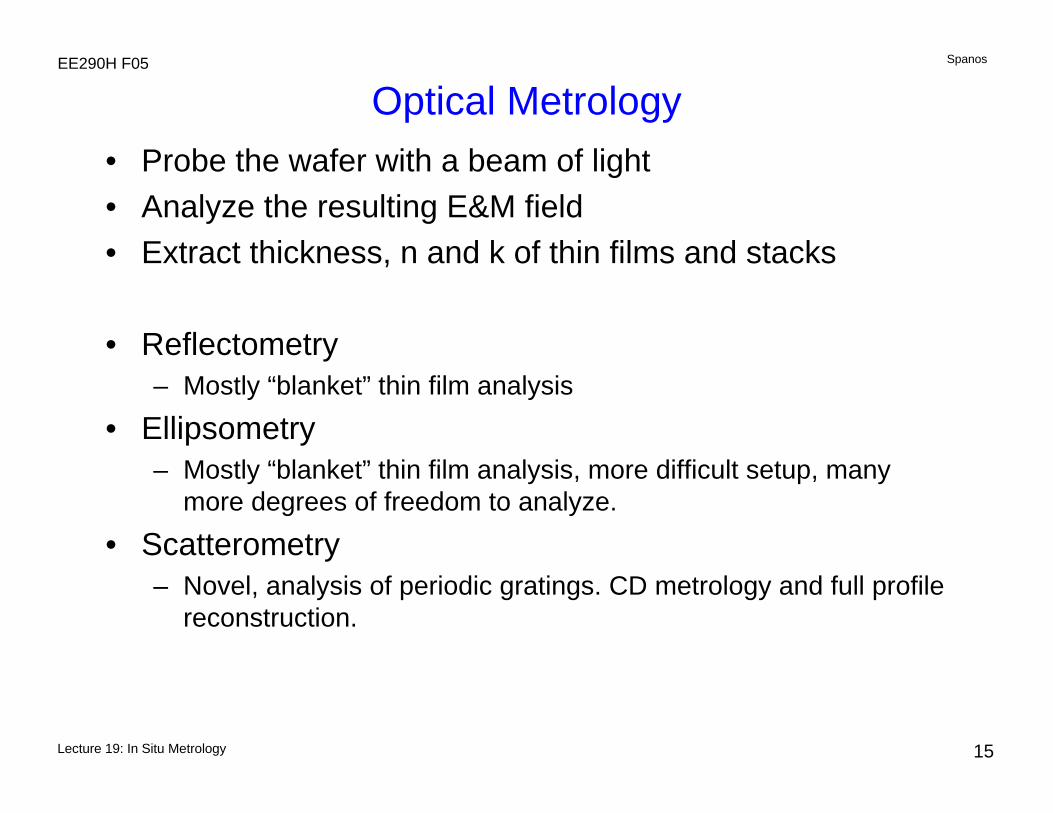
Optical Metrology• Probe the wafer with a beam of light• Analyze the resulting E&M field• Extract thickness, n and k of thin films and stacks
• Reflectometry– Mostly “blanket” thin film analysis
• Ellipsometry– Mostly “blanket” thin film analysis, more difficult setup, many
more degrees of freedom to analyze.
• Scatterometry– Novel, analysis of periodic gratings. CD metrology and full profile
reconstruction.
Lecture 19: In Situ Metrology
SpanosEE290H F05
16
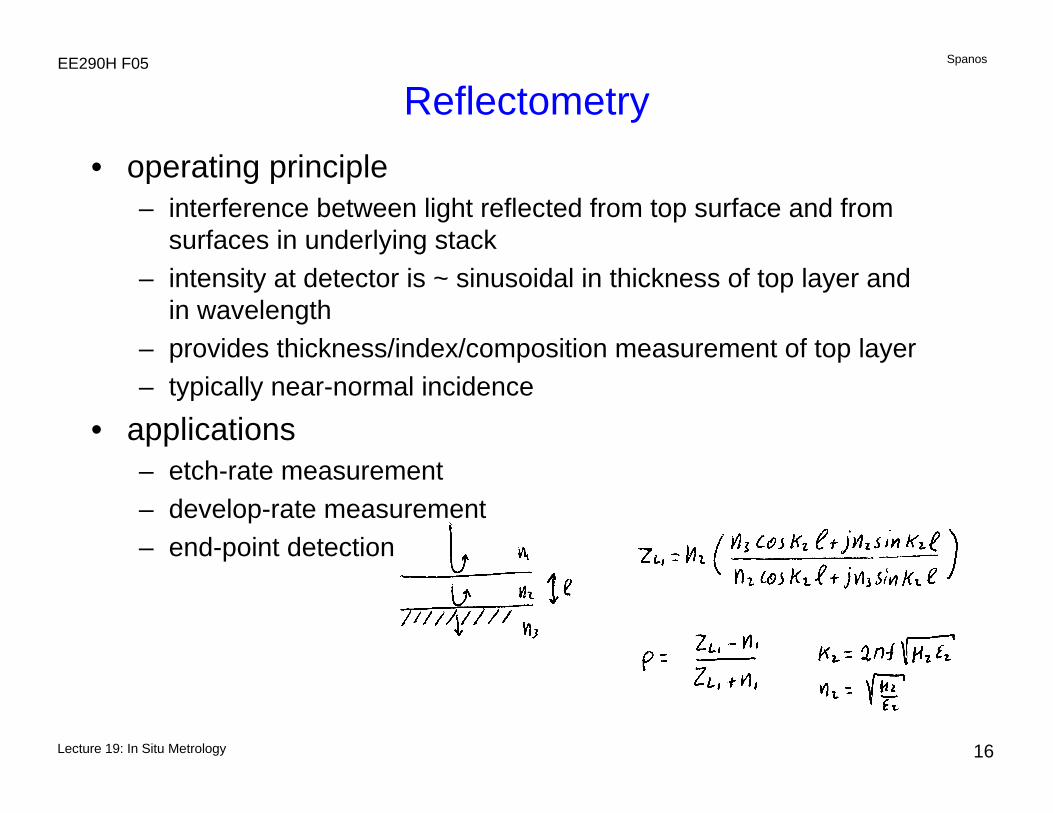
Reflectometry• operating principle
– interference between light reflected from top surface and from surfaces in underlying stack
– intensity at detector is ~ sinusoidal in thickness of top layer and in wavelength
– provides thickness/index/composition measurement of top layer– typically near-normal incidence
• applications– etch-rate measurement– develop-rate measurement– end-point detection
Lecture 19: In Situ Metrology
SpanosEE290H F05
17
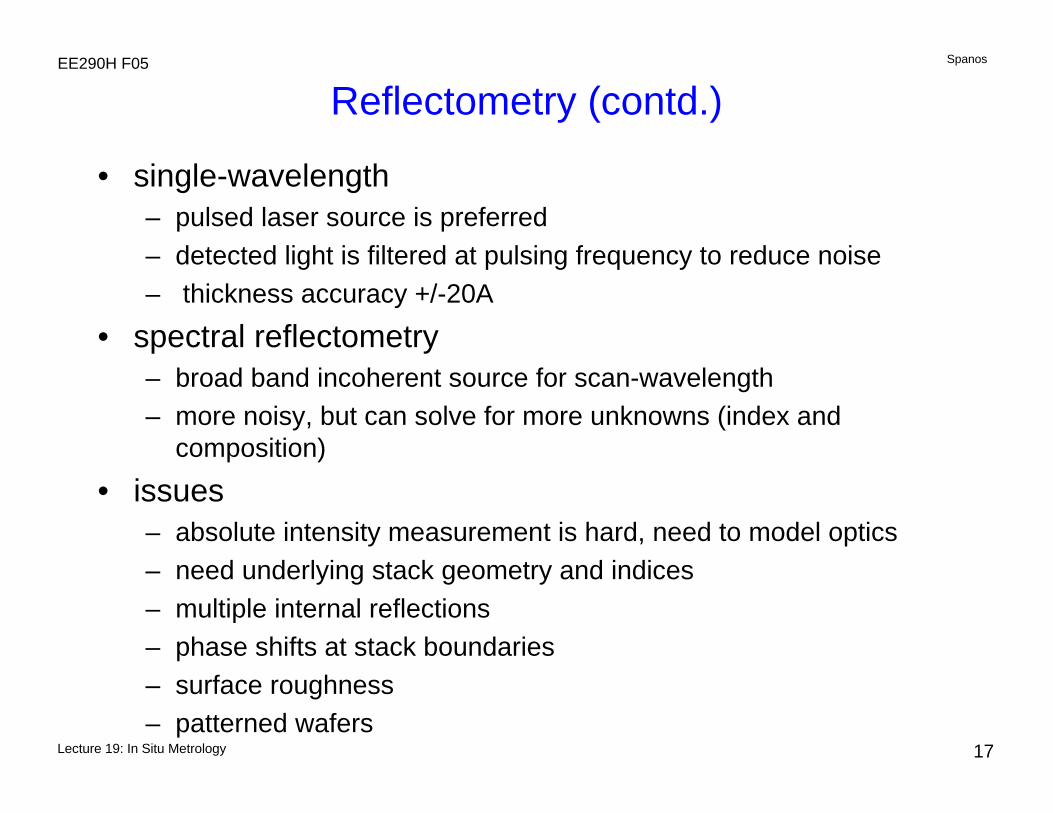
Reflectometry (contd.)
• single-wavelength– pulsed laser source is preferred– detected light is filtered at pulsing frequency to reduce noise– thickness accuracy +/-20A
• spectral reflectometry– broad band incoherent source for scan-wavelength – more noisy, but can solve for more unknowns (index and
composition)
• issues– absolute intensity measurement is hard, need to model optics– need underlying stack geometry and indices– multiple internal reflections– phase shifts at stack boundaries– surface roughness– patterned wafers
Lecture 19: In Situ Metrology
SpanosEE290H F05
18
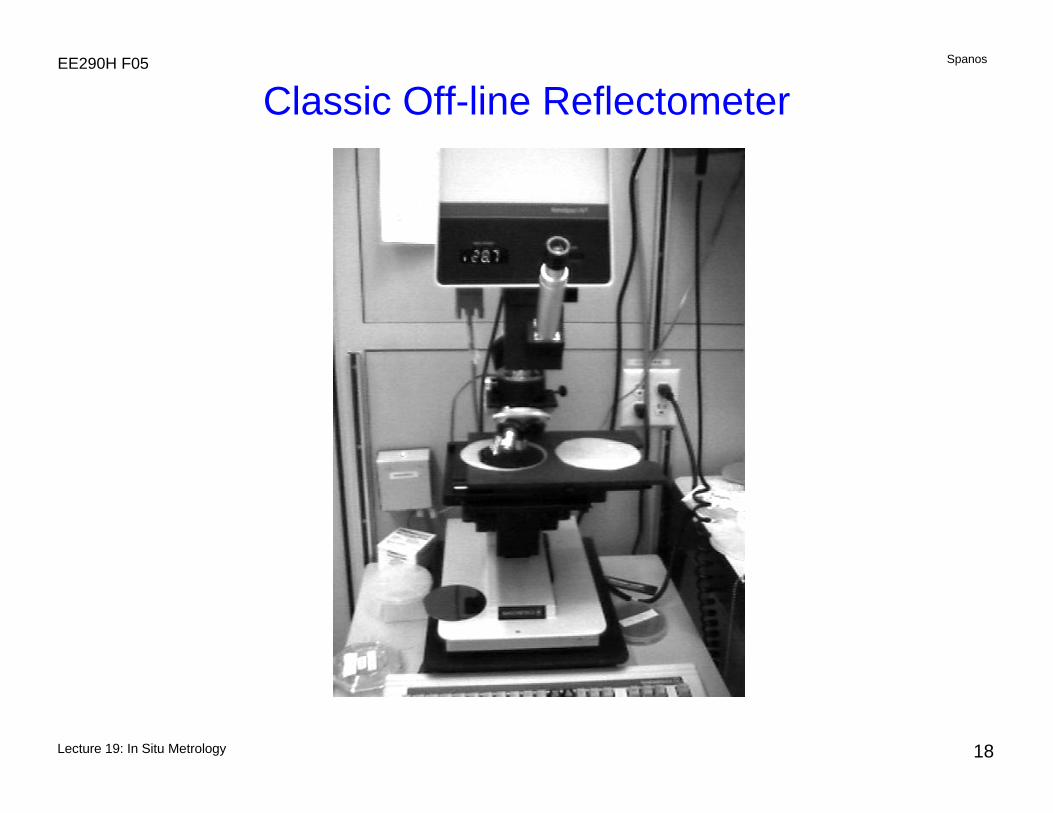
Classic Off-line Reflectometer
Lecture 19: In Situ Metrology
SpanosEE290H F05
19
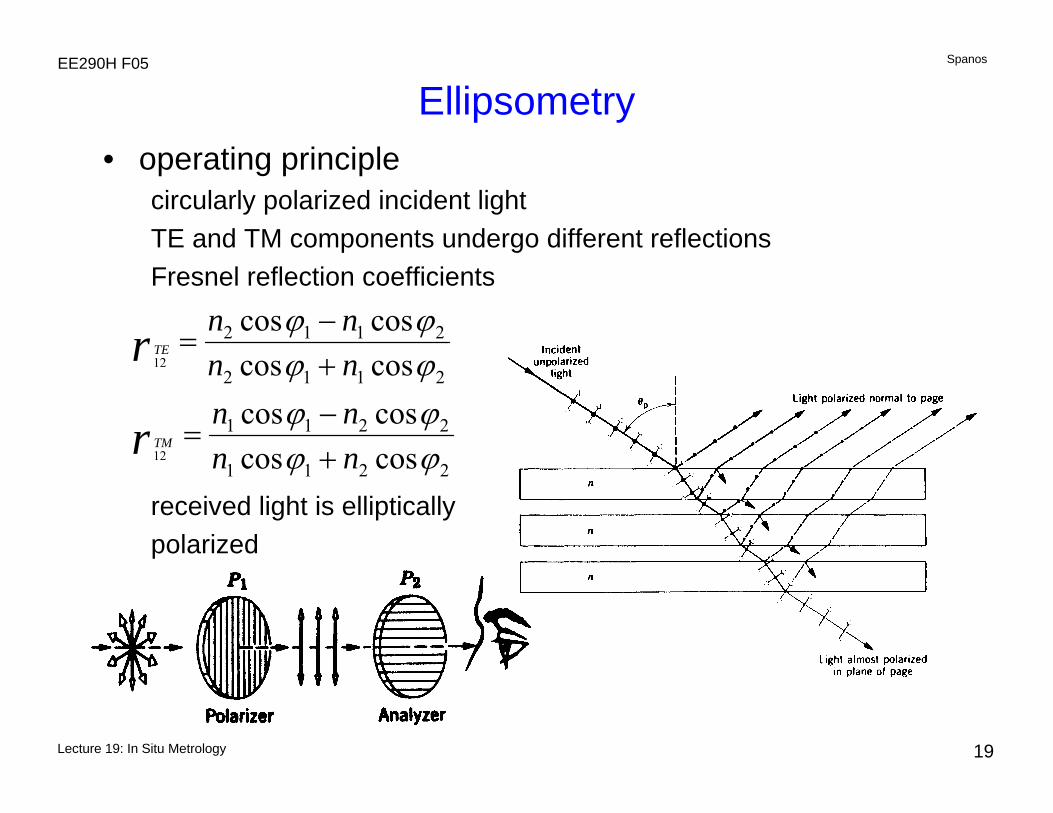
Ellipsometry• operating principle
circularly polarized incident light TE and TM components undergo different reflectionsFresnel reflection coefficients
received light is ellipticallypolarized
2211
2211
2112
2112
coscoscoscoscoscoscoscos
12
12
ϕϕϕϕϕϕϕϕ
nnnnnnnn
r
r
TM
TE
+−
=
+−
=
Lecture 19: In Situ Metrology
SpanosEE290H F05
20
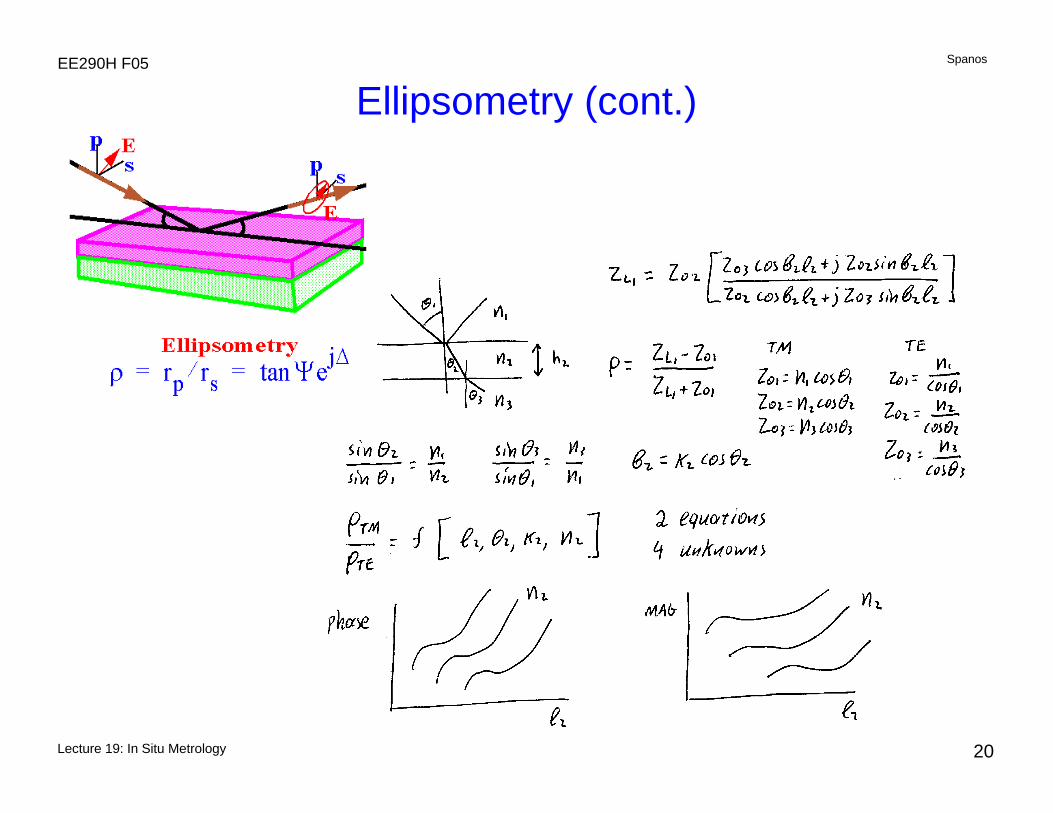
Ellipsometry (cont.)
Lecture 19: In Situ Metrology
SpanosEE290H F05
21
Ellipsometry (contd.)
• issues– polarization of detected light is measured by nulling– no need to have intensity measurements– polarized light source
• comments– can measure 2 quantities -- typically index and film
thickness– spectrally and spatially resolved ellipsometry– extremely accurate -- index +/-.1%, thickness +/- 4A– more expensive and delicate than reflectometry
Lecture 19: In Situ Metrology
SpanosEE290H F05
22
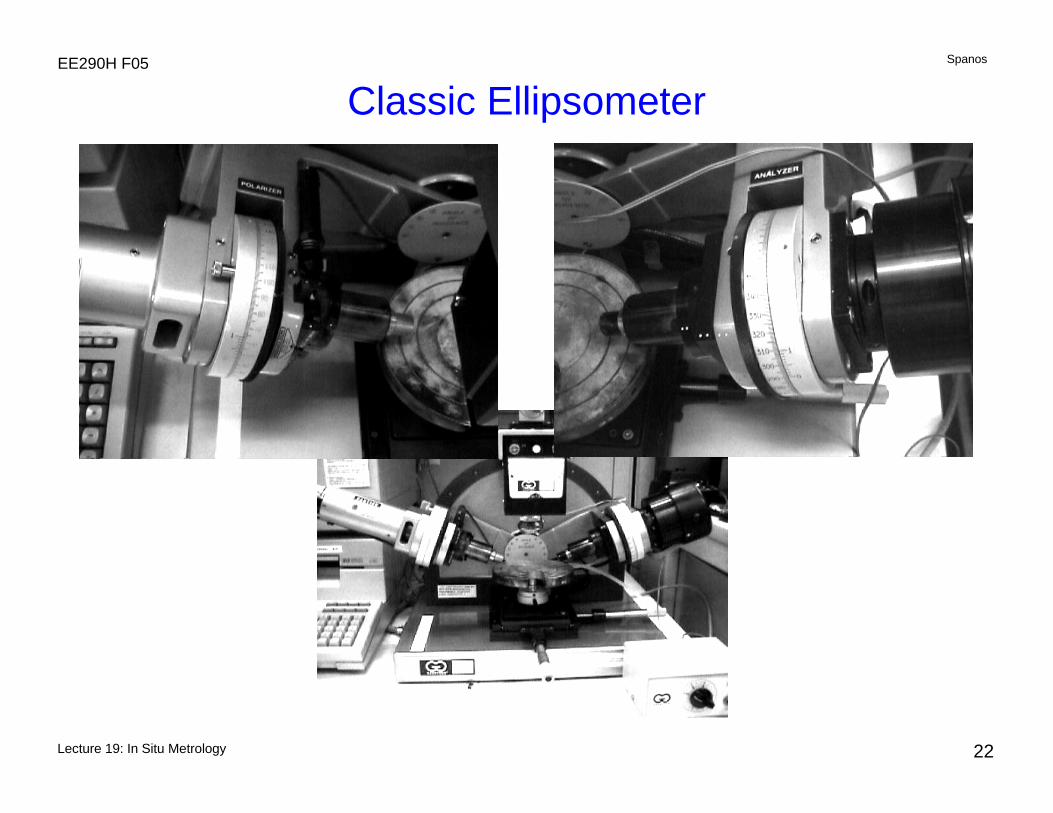
Classic Ellipsometer
Lecture 19: In Situ Metrology
SpanosEE290H F05
23
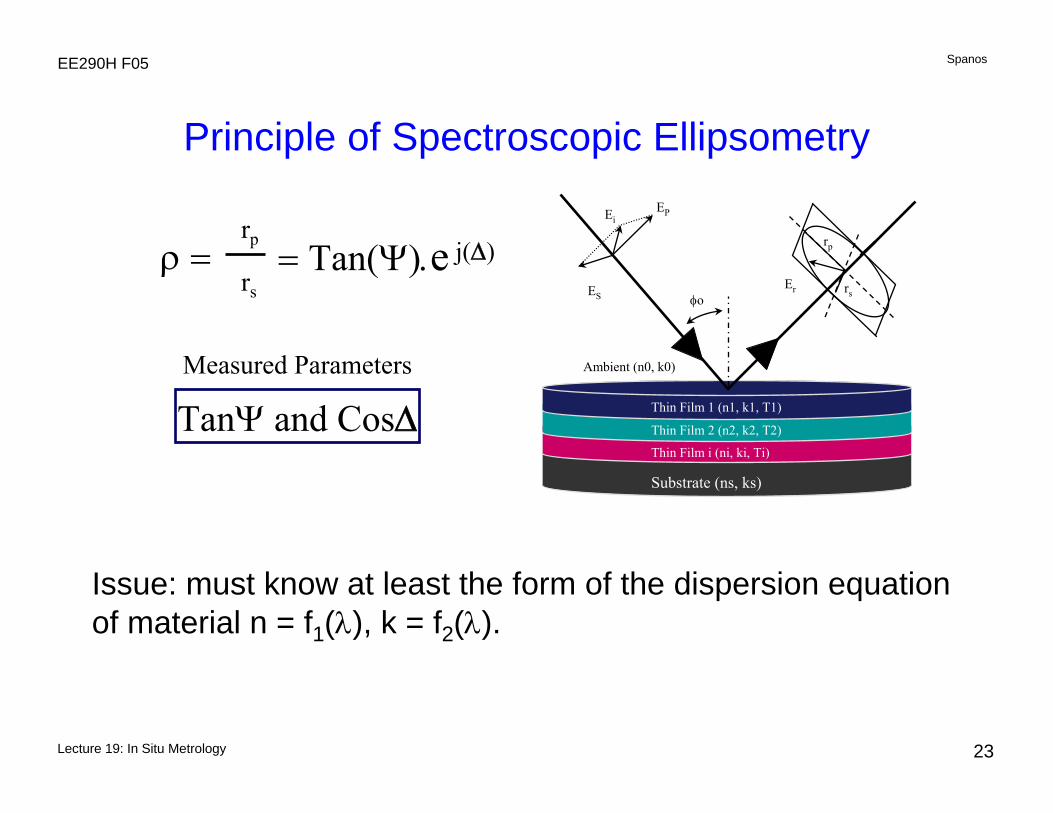
Substrate (ns, ks)
Thin Film 1 (n1, k1, T1)
Thin Film 2 (n2, k2, T2)
Thin Film i (ni, ki, Ti)
ρ = rp
rs= Tan(Ψ).e j(Δ)
Measured Parameters
TanΨ and CosΔ
Ambient (n0, k0)
φoES
EiEP
rs
rp
Er
Principle of Spectroscopic Ellipsometry
Issue: must know at least the form of the dispersion equationof material n = f1(λ), k = f2(λ).
Lecture 19: In Situ Metrology
SpanosEE290H F05
24
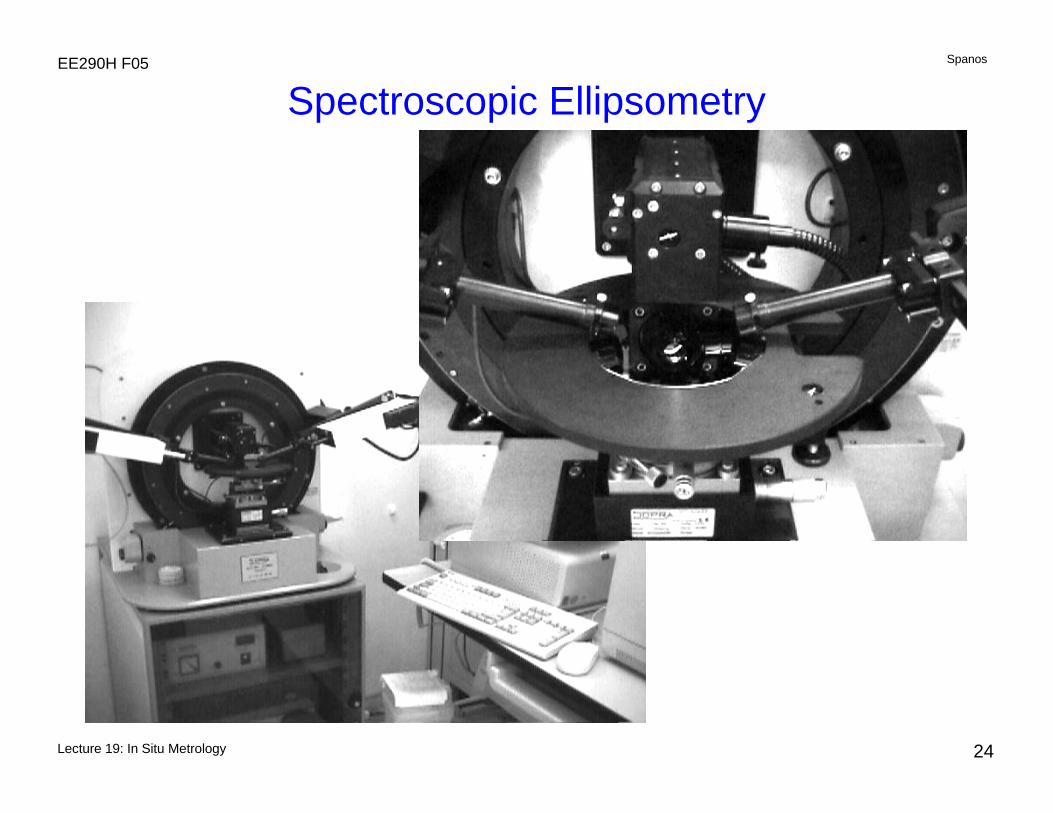
Spectroscopic Ellipsometry
Lecture 19: In Situ Metrology
SpanosEE290H F05
25
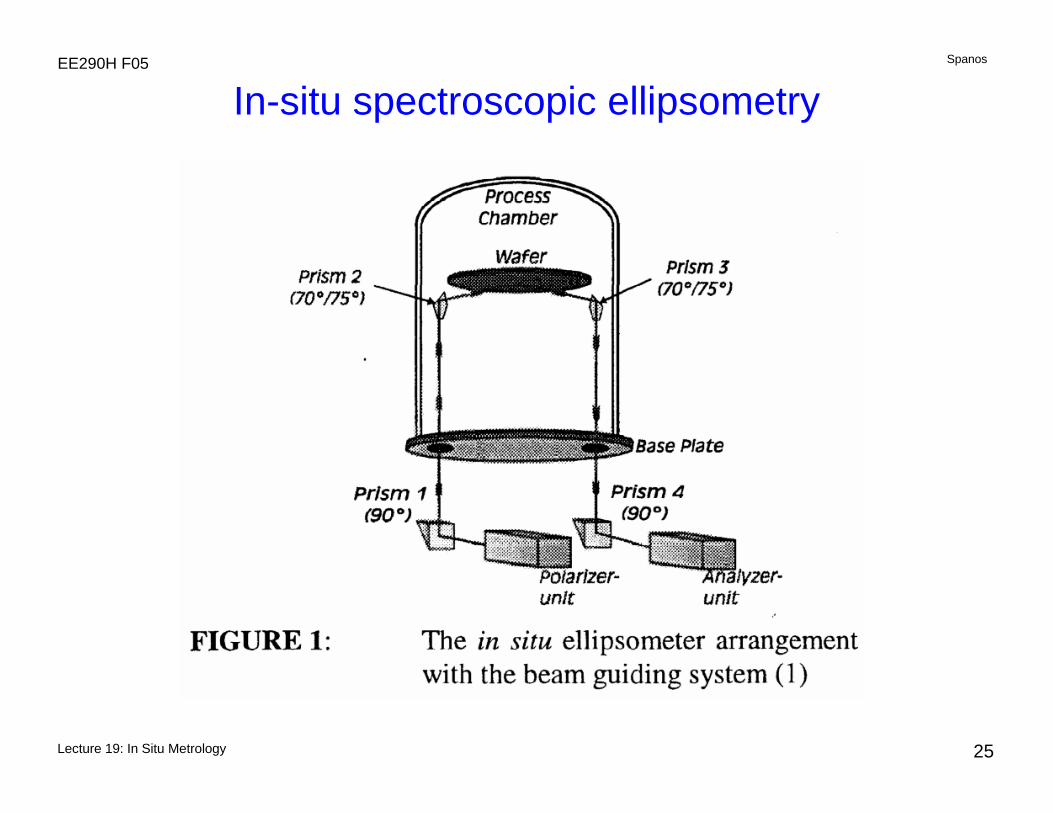
In-situ spectroscopic ellipsometry
Lecture 19: In Situ Metrology
SpanosEE290H F05
26
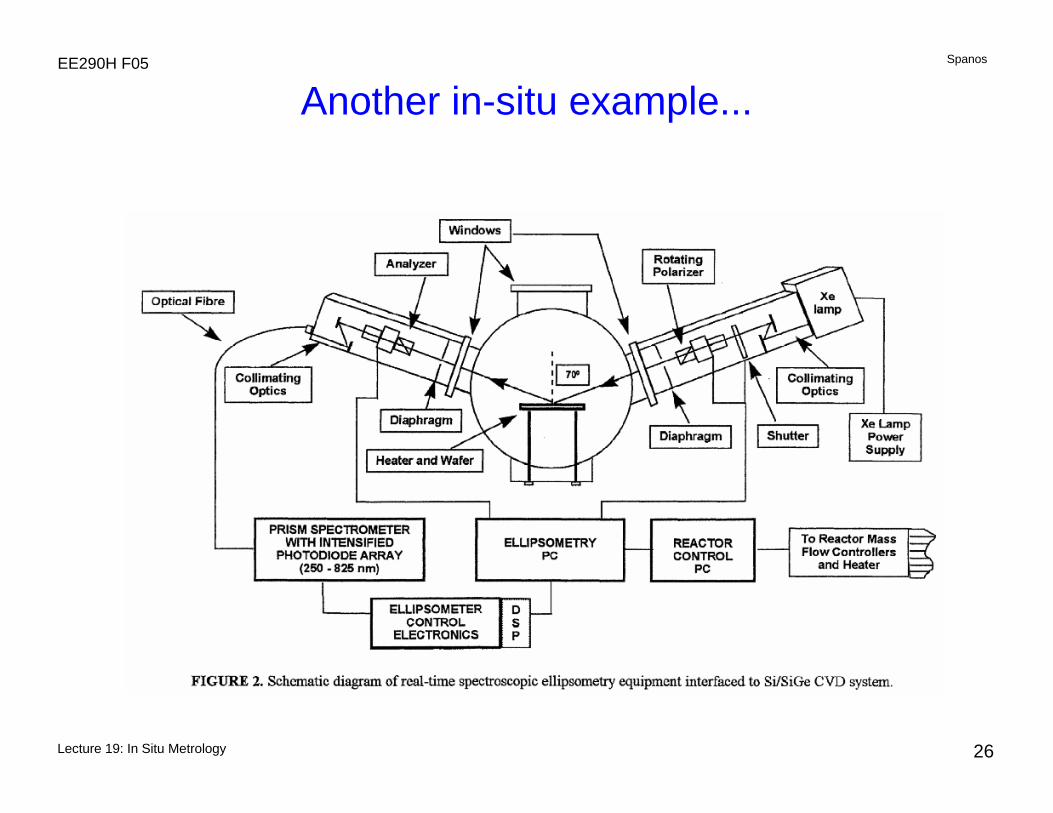
Another in-situ example...
Lecture 19: In Situ Metrology
SpanosEE290H F05
27
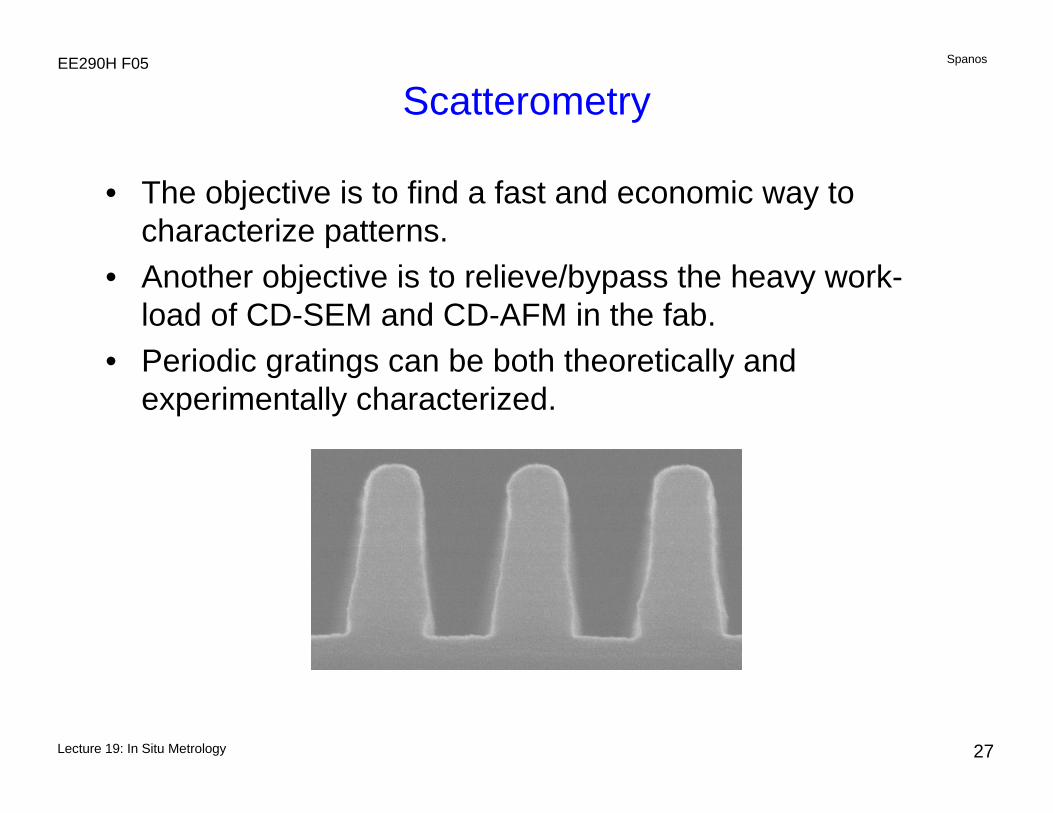
Scatterometry
• The objective is to find a fast and economic way to characterize patterns.
• Another objective is to relieve/bypass the heavy work-load of CD-SEM and CD-AFM in the fab.
• Periodic gratings can be both theoretically and experimentally characterized.
Lecture 19: In Situ Metrology
SpanosEE290H F05
28
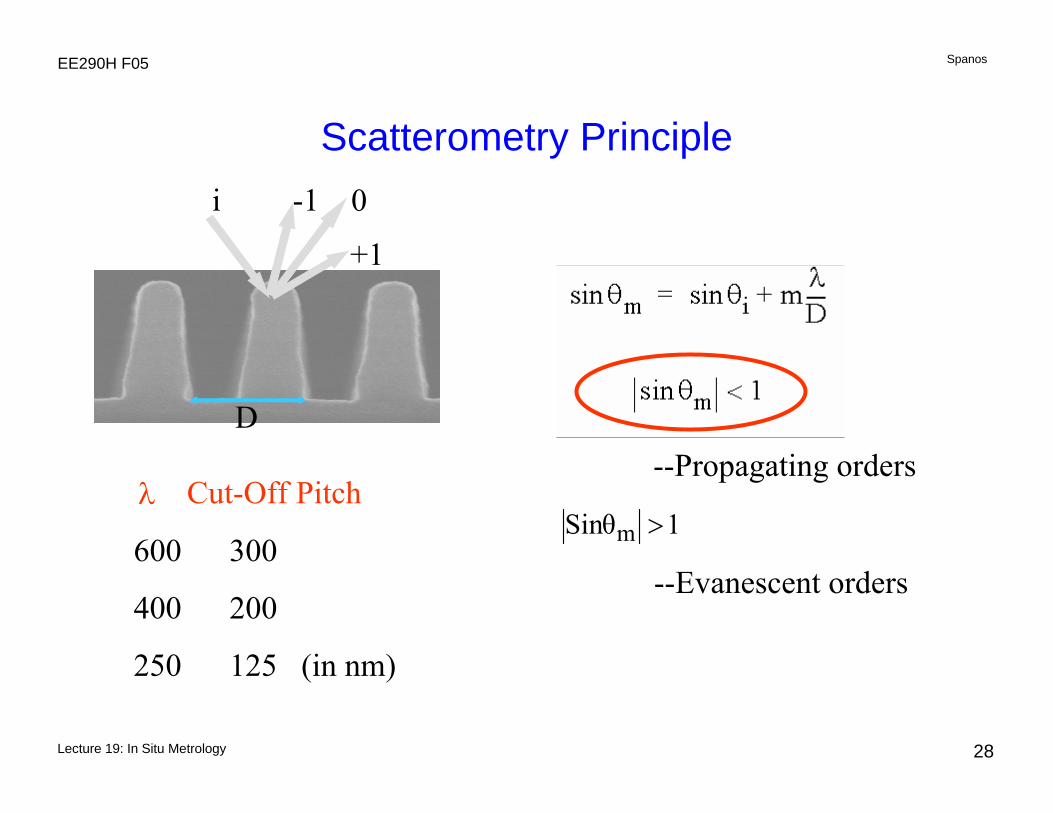
--Propagating orders
i 0
+1
-1
D
λ Cut-Off Pitch
600 300
400 200
250 125 (in nm)
1θSin m >
--Evanescent orders
Scatterometry Principle
Lecture 19: In Situ Metrology
SpanosEE290H F05
29
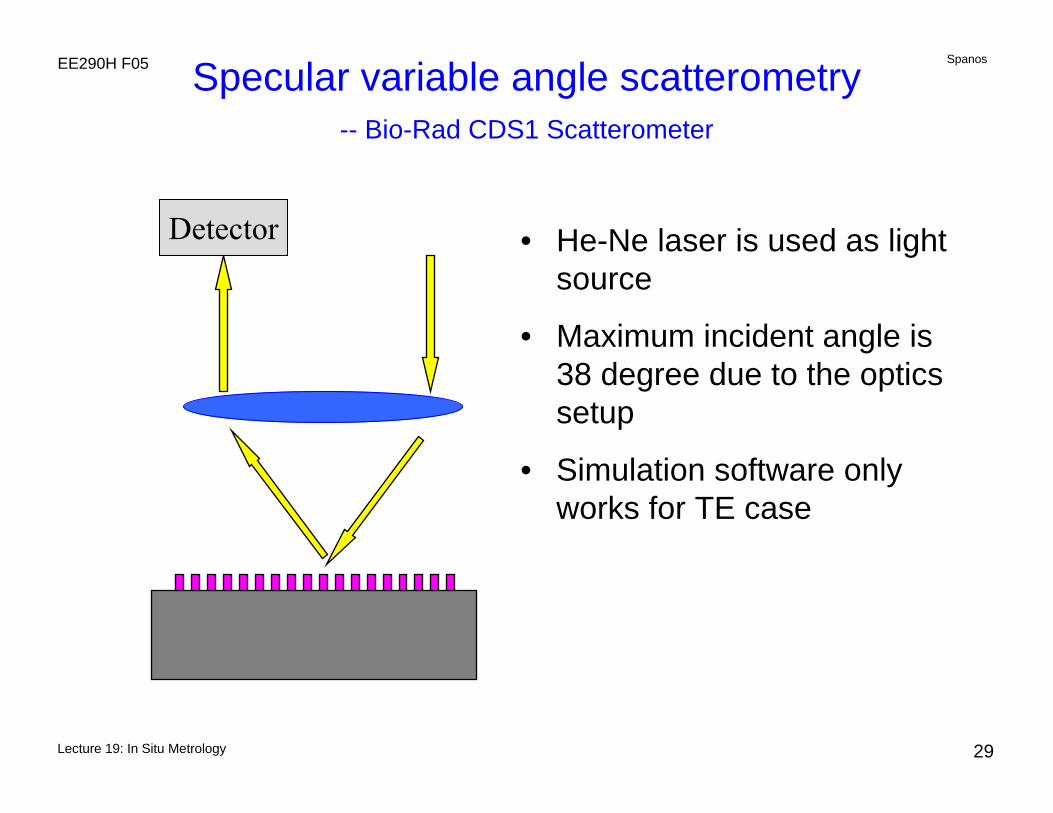
Specular variable angle scatterometry-- Bio-Rad CDS1 Scatterometer
Detector • He-Ne laser is used as light source
• Maximum incident angle is 38 degree due to the optics setup
• Simulation software only works for TE case
Lecture 19: In Situ Metrology
SpanosEE290H F05
30
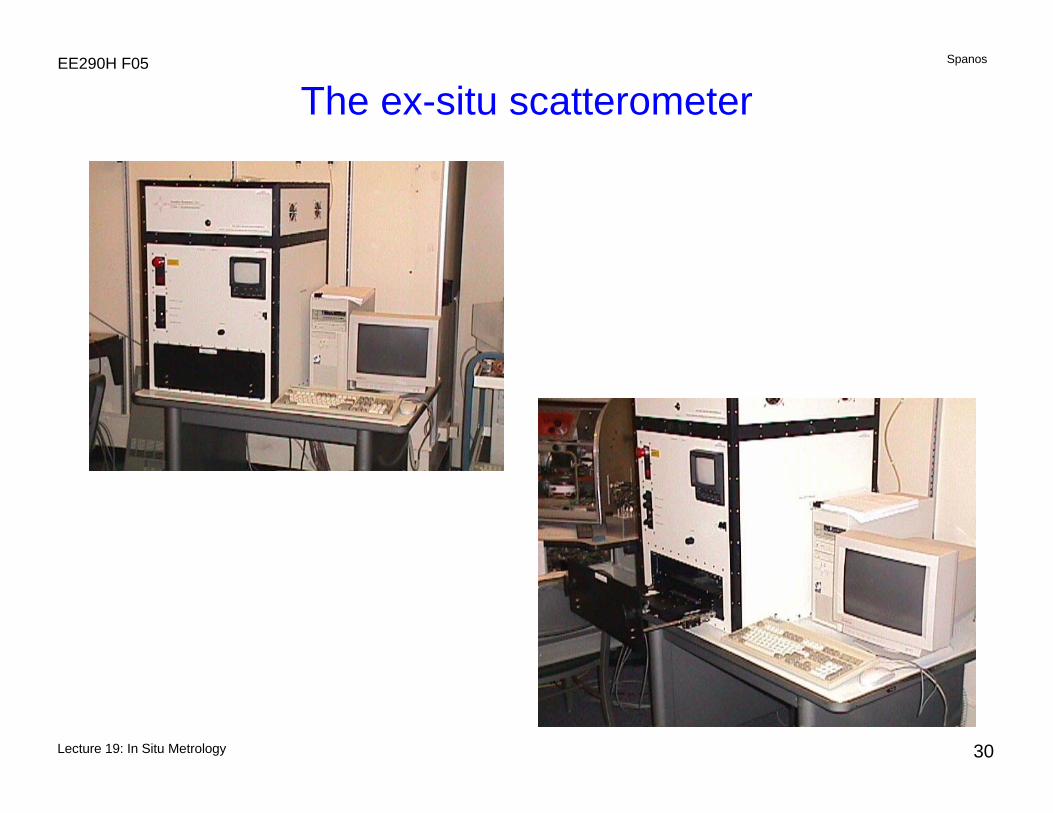
The ex-situ scatterometer
Lecture 19: In Situ Metrology
SpanosEE290H F05
31
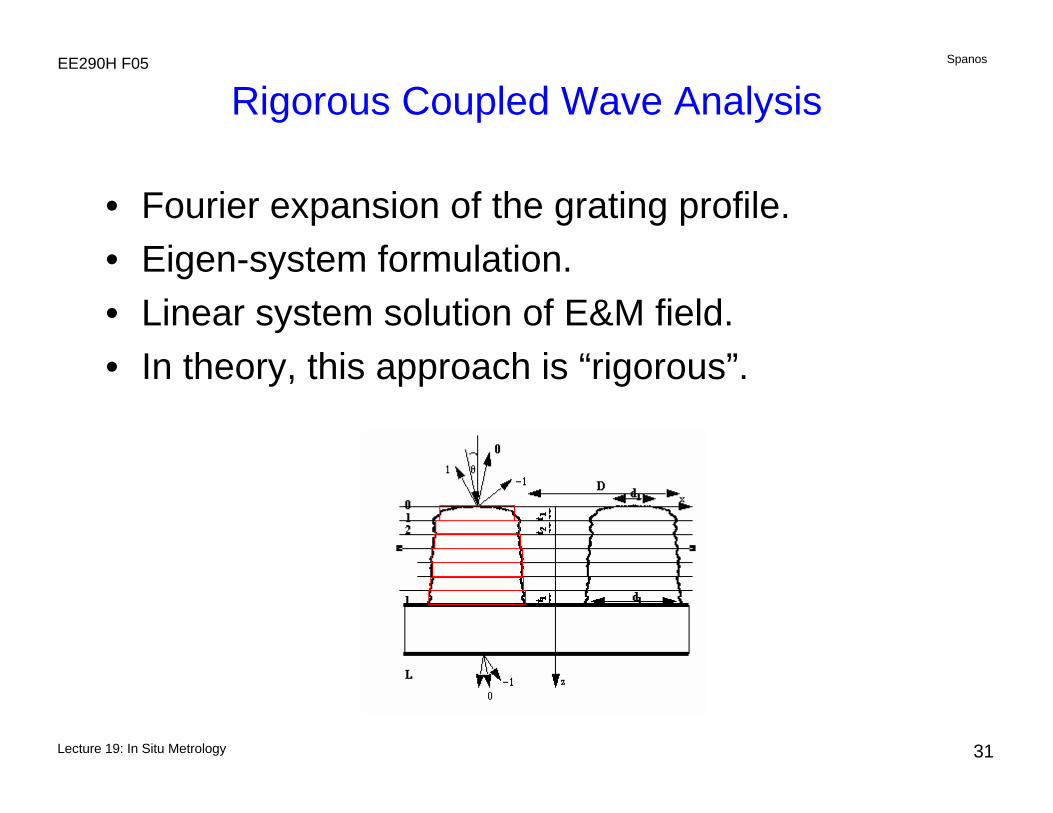
Rigorous Coupled Wave Analysis
• Fourier expansion of the grating profile.• Eigen-system formulation.• Linear system solution of E&M field.• In theory, this approach is “rigorous”.
Lecture 19: In Situ Metrology
SpanosEE290H F05
32
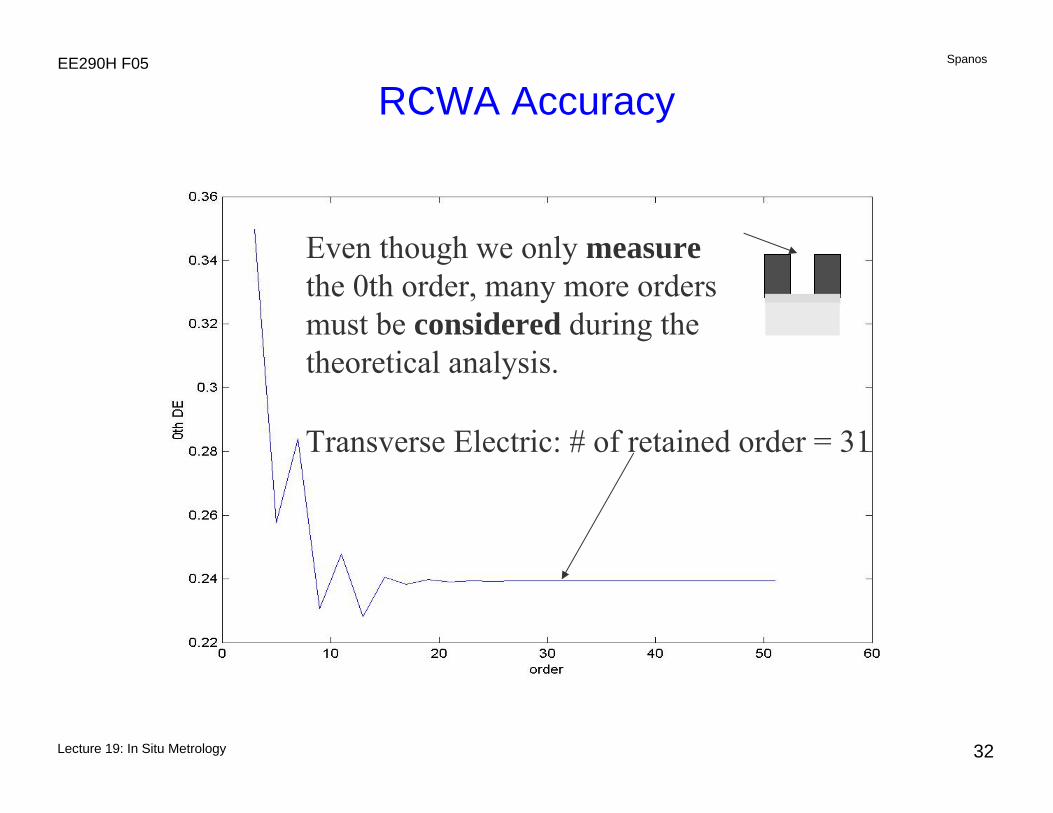
RCWA Accuracy
Transverse Electric: # of retained order = 31
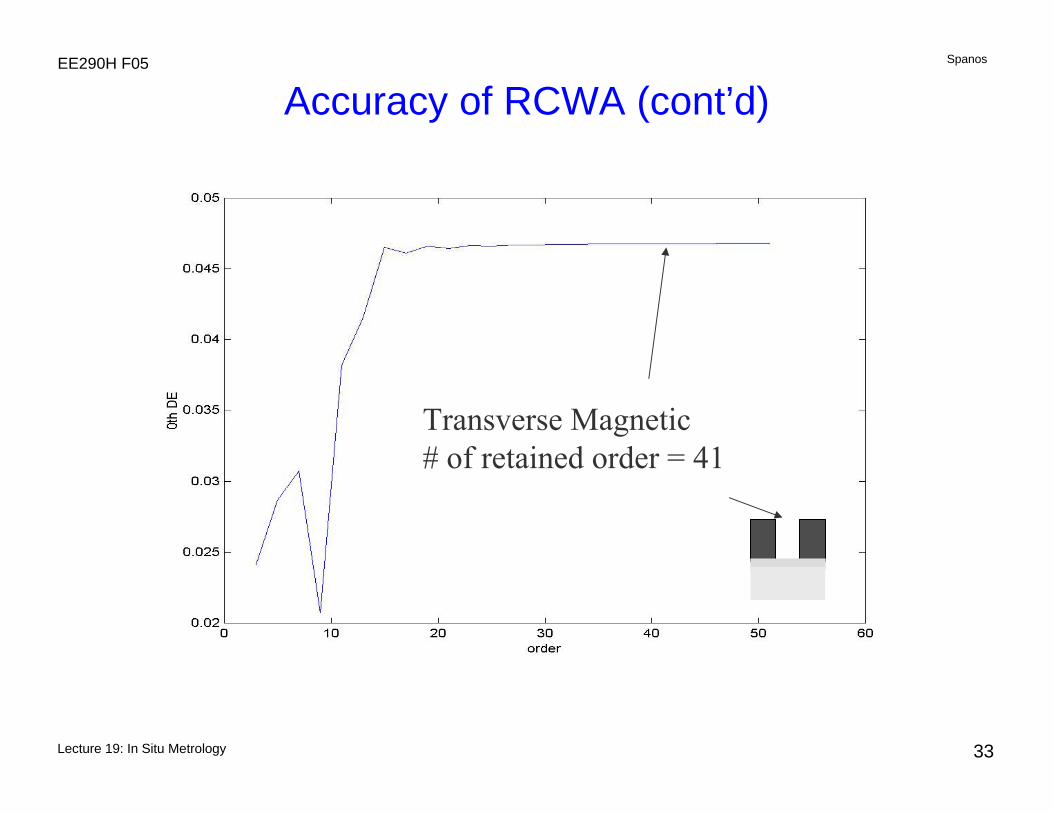
Even though we only measurethe 0th order, many more ordersmust be considered during thetheoretical analysis.
Lecture 19: In Situ Metrology
SpanosEE290H F05
33
Accuracy of RCWA (cont’d)
Transverse Magnetic # of retained order = 41
Lecture 19: In Situ Metrology
SpanosEE290H F05
34
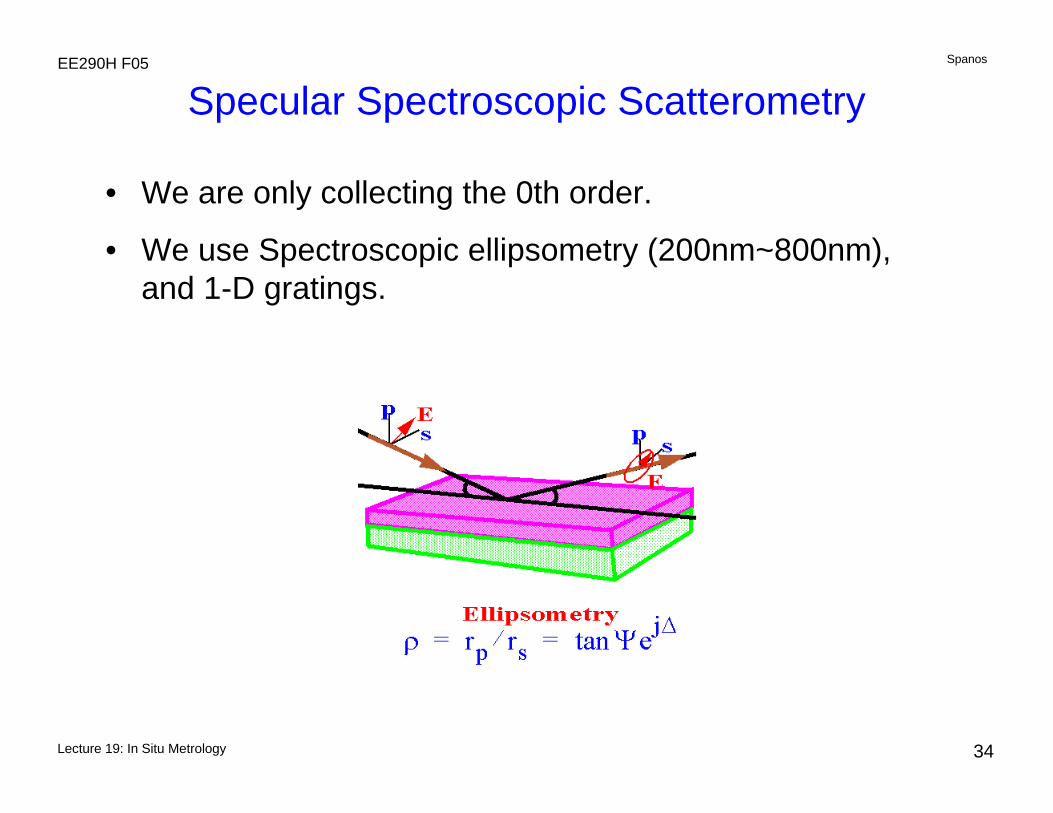
Specular Spectroscopic Scatterometry
• We are only collecting the 0th order.
• We use Spectroscopic ellipsometry (200nm~800nm), and 1-D gratings.
Lecture 19: In Situ Metrology
SpanosEE290H F05
35
Experimental Verification
• Verification of the forward diffraction grating simulation is done using given CD profiles.
• Verification of the inverse CD profile extraction is done from given Spectroscopic Ellipsometry measurements.
Lecture 19: In Situ Metrology
SpanosEE290H F05
36
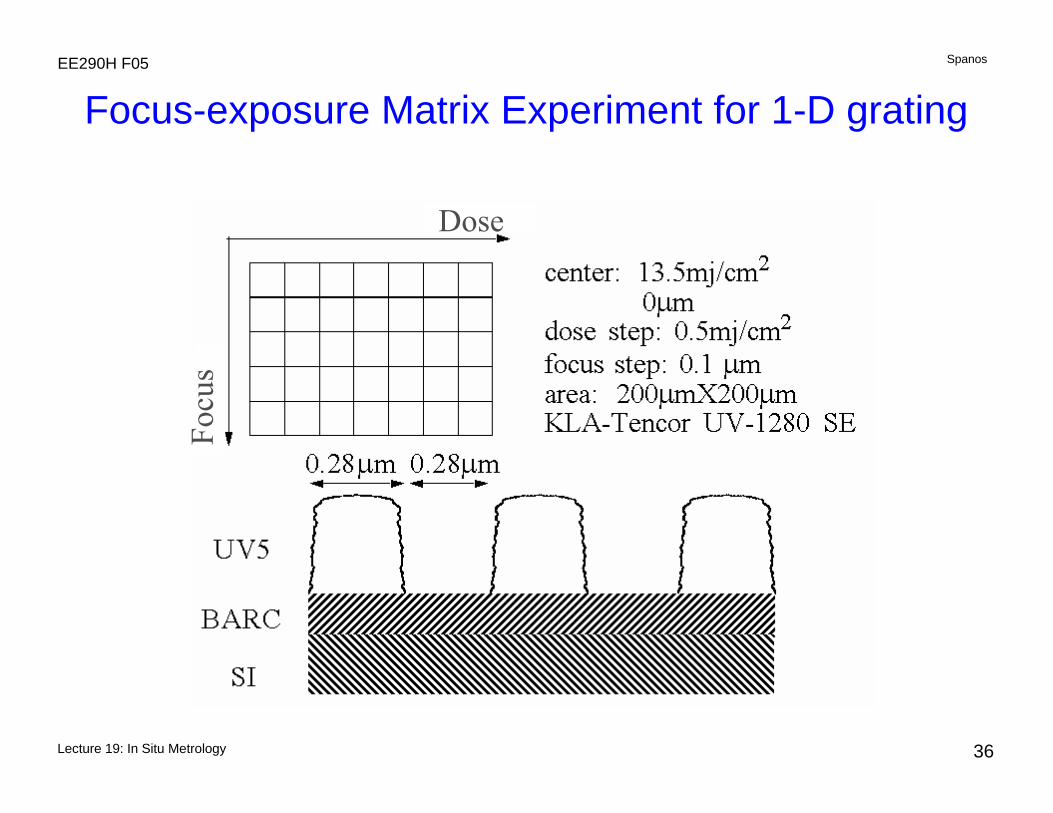
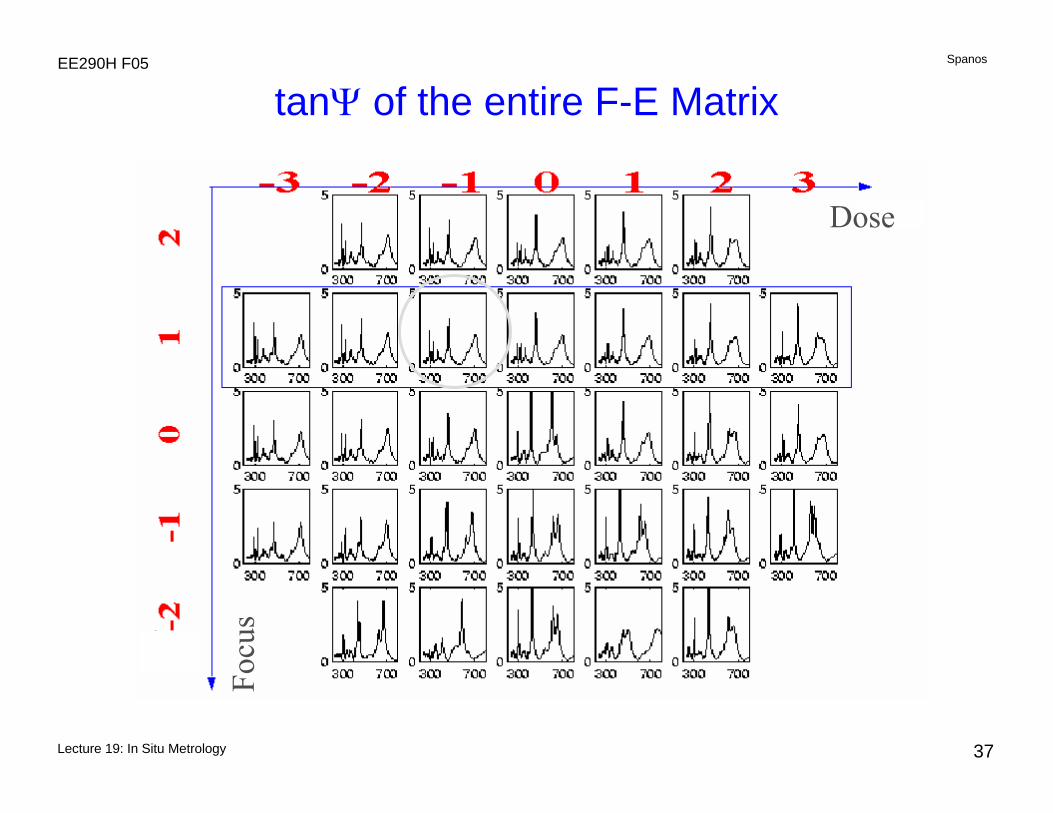
Focus-exposure Matrix Experiment for 1-D grating
DoseFo
cus
Lecture 19: In Situ Metrology
SpanosEE290H F05
37
tanΨ of the entire F-E Matrix
DoseFo
cus
Lecture 19: In Situ Metrology
SpanosEE290H F05
38
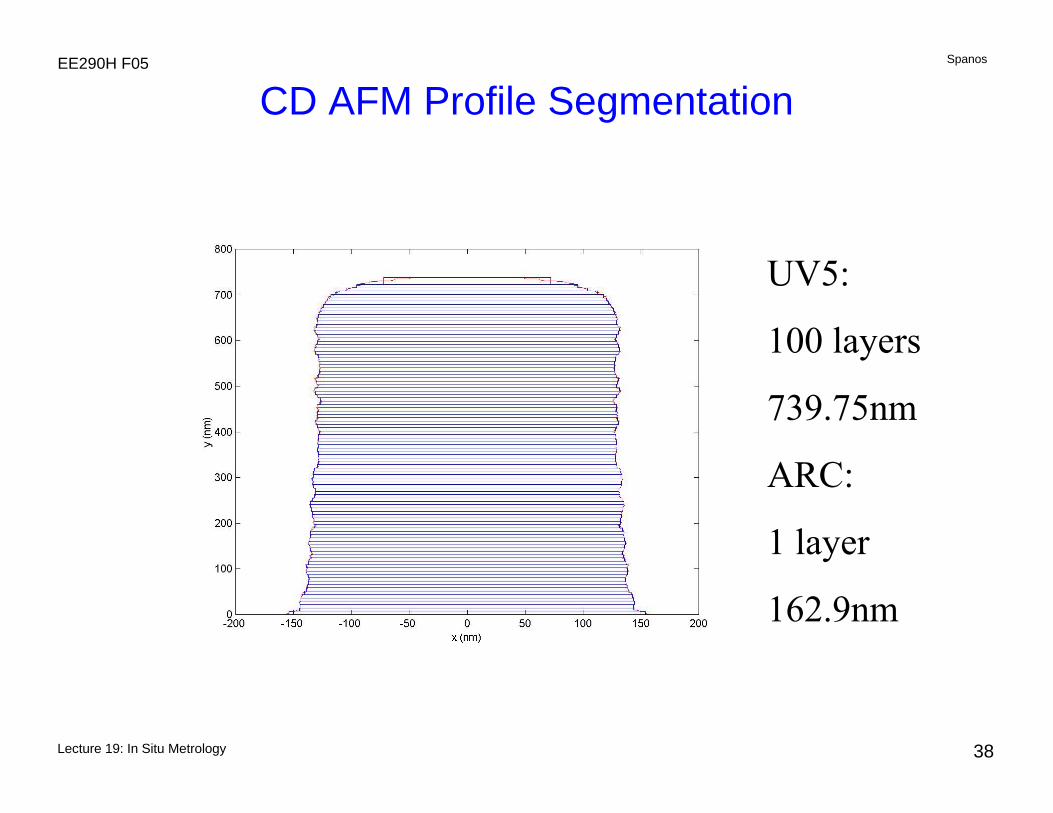
CD AFM Profile Segmentation
UV5:
100 layers
739.75nm
ARC:
1 layer
162.9nm
Lecture 19: In Situ Metrology
SpanosEE290H F05
39
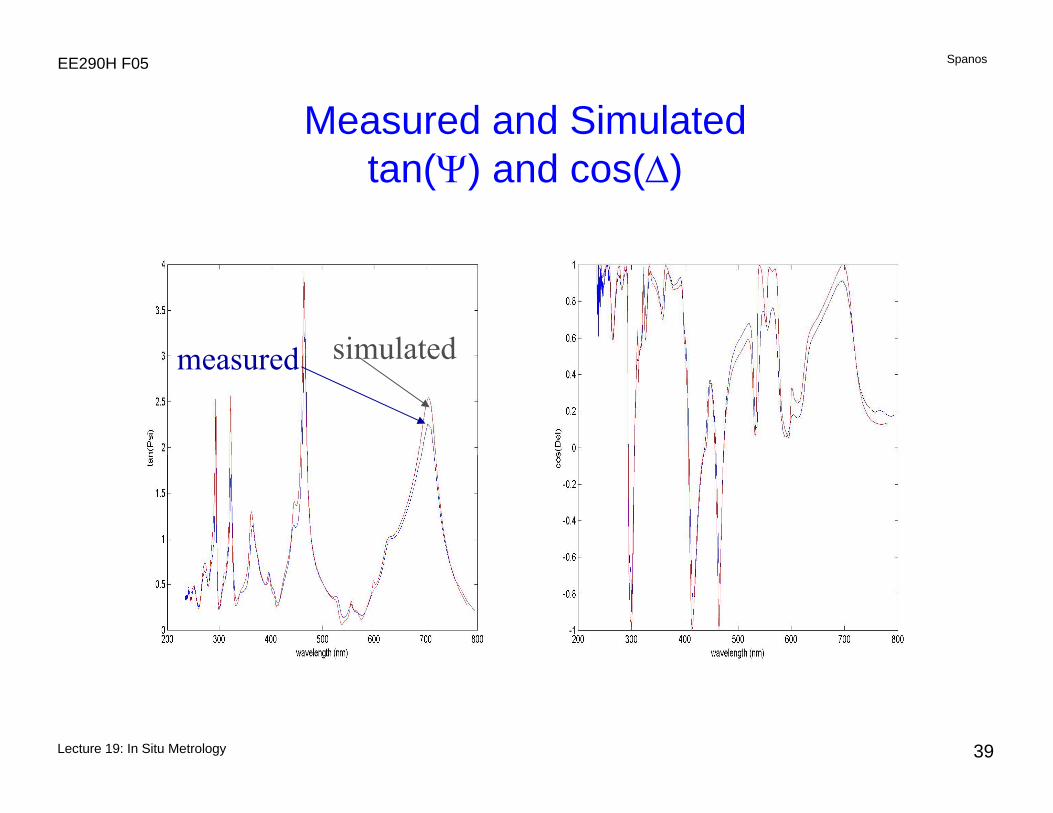
Measured and Simulatedtan(Ψ) and cos(Δ)
simulatedmeasured
Lecture 19: In Situ Metrology
SpanosEE290H F05
40
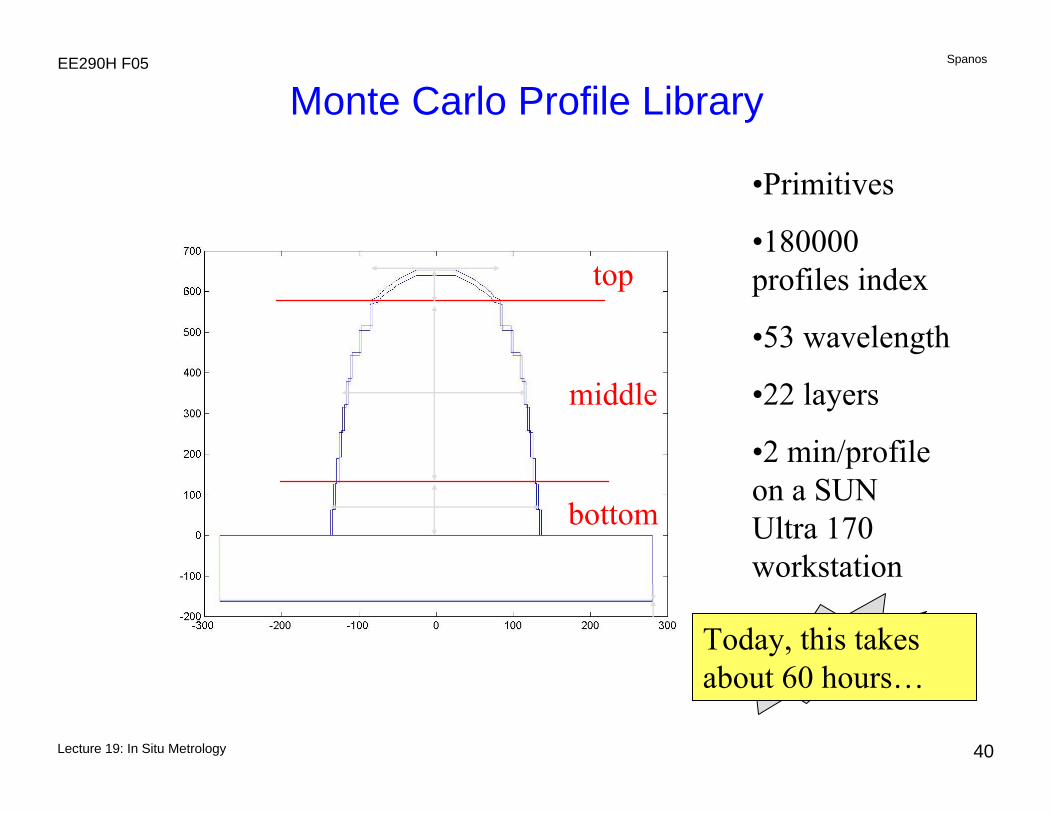
Monte Carlo Profile Library
top
middle
bottom
•Primitives
•180000 profiles index
•53 wavelength
•22 layers
•2 min/profile on a SUN Ultra 170 workstation
6000hrsToday, this takes about 60 hours…
Lecture 19: In Situ Metrology
SpanosEE290H F05
41
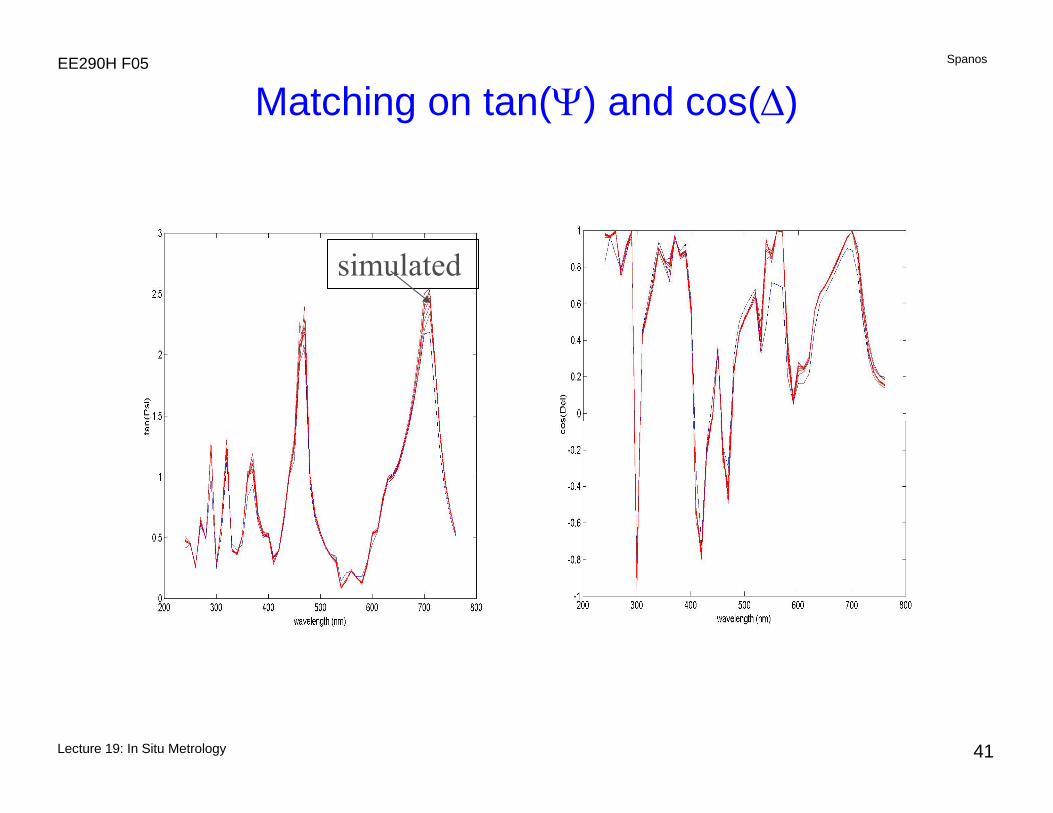
Matching on tan(Ψ) and cos(Δ)
simulatedmeasured
Lecture 19: In Situ Metrology
SpanosEE290H F05
42
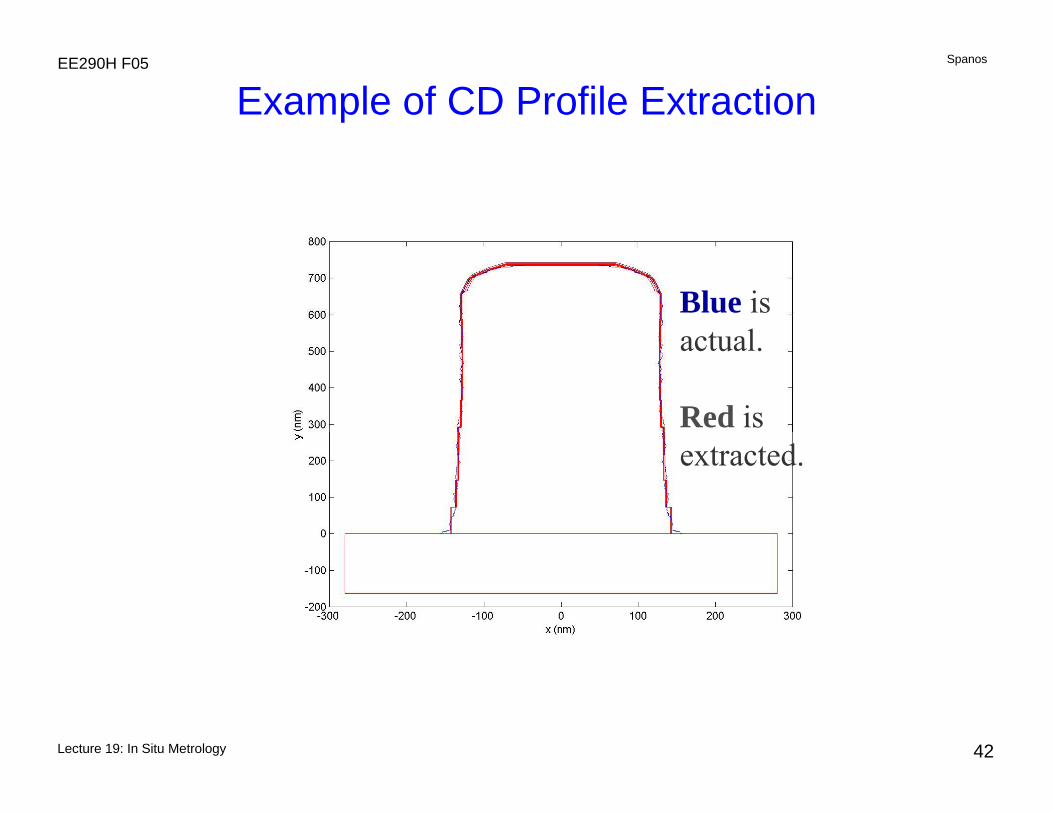
Example of CD Profile Extraction
Blue isactual.
Red isextracted.
Lecture 19: In Situ Metrology
SpanosEE290H F05
43
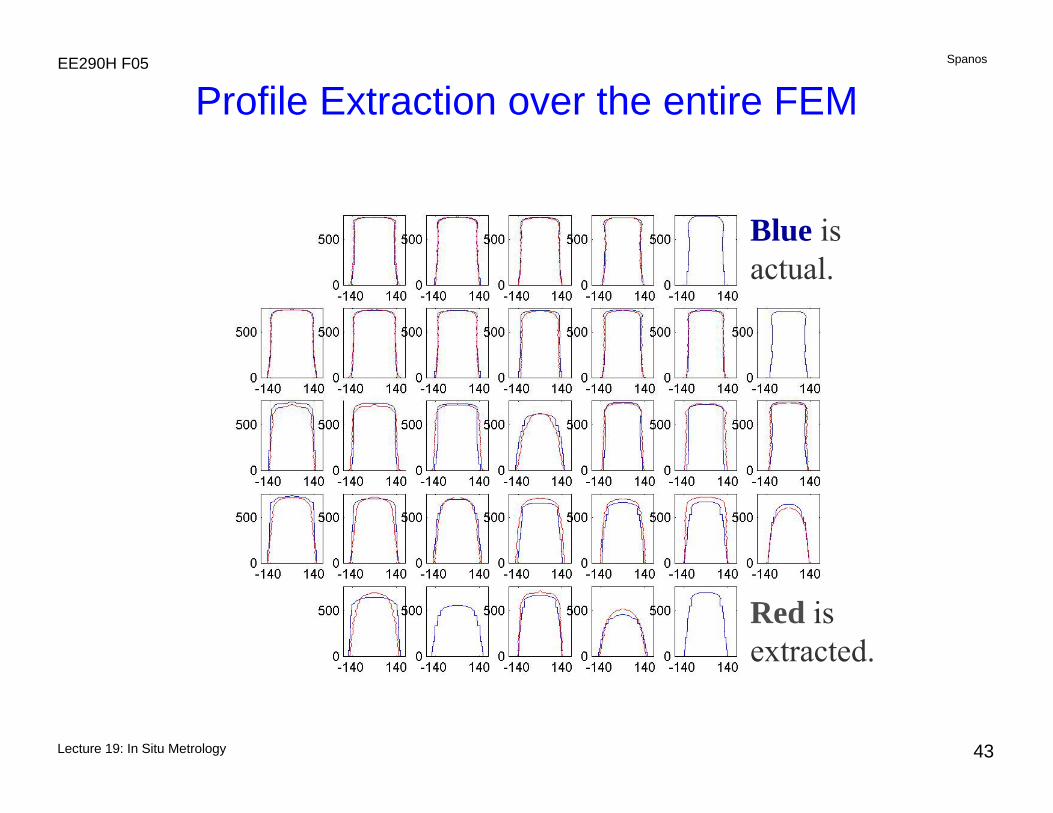
Profile Extraction over the entire FEM
Blue isactual.
Red isextracted.
Lecture 19: In Situ Metrology
SpanosEE290H F05
44
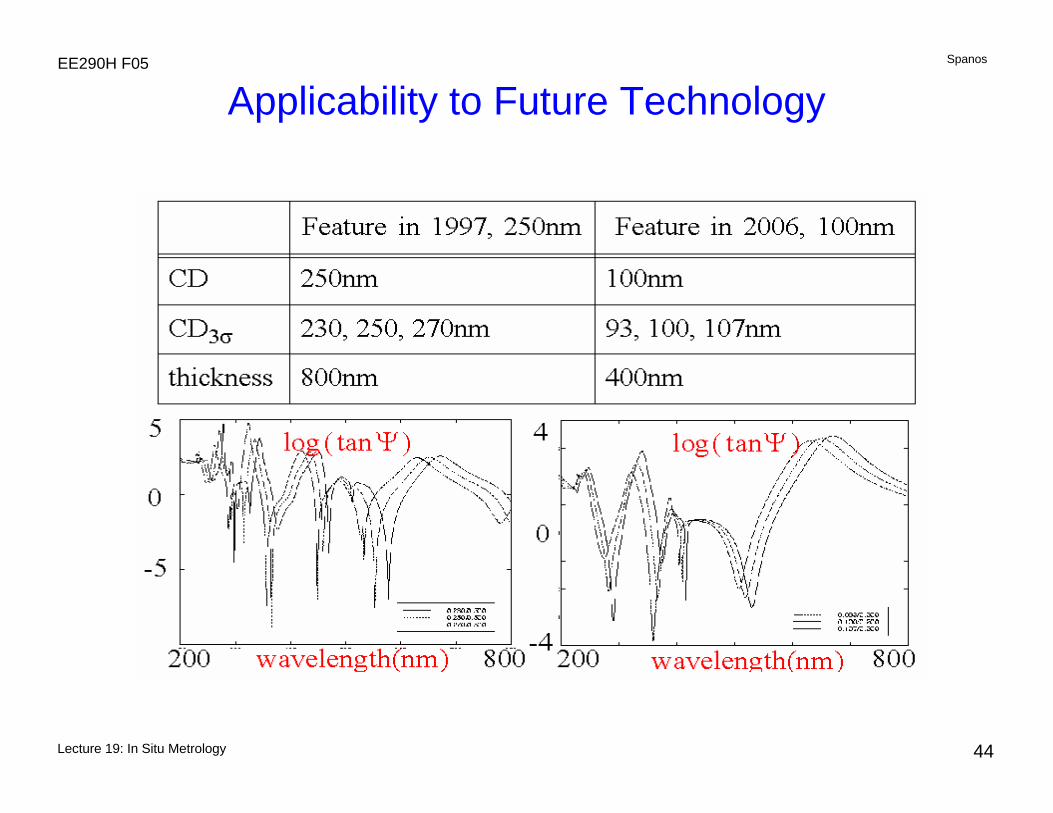
Applicability to Future Technology
Lecture 19: In Situ Metrology
SpanosEE290H F05
45
Conclusions, so far
• OES is an example of a “virtual” wafer sensor.• Reflectometry, Ellipsometry and Scatterometry can be
real, in-situ, direct wafer sensors.• Implementation and commercialization has started:
– CMP (reflectometry)
– furnace operations (ellipsometry, reflectometry)
– CD-control (scatterometry on the wafer track)
– Big issue in in-situ metrology: cost/complexity of the sensor, relationship between suppliers.
Next time: chamber and on-wafer sensors.
Lecture 19: In Situ Metrology
SpanosEE290H F05
46
An Update on Scatterometry
• During the last three years, spectroscopic CD-scatterometry (now known as Optical CD) has spread rapidly in IC production.
• TEL (the largest equipment vendor for Lithography and Plasma) acquired Timbre Tech (the leader in OCD and a Berkeley startup) and is now selling an in-line OCD solution for their tracks.
• Applied has partnered with Nanometrics.• Others have partnered with KLA-Tencor.• It is widely expected to be a $1B/year industry.