Global Mitigation of Non-CO 2 Greenhouse Gases: … Mitigation of Non-CO 2 Greenhouse Gases: ......
24
Global Mitigation of Non-CO 2 Greenhouse Gases: 2010-2030 Executive Summary United States Environmental Protection Agency Office of Atmospheric Programs (6207J) Washington, DC 20005 EPA-430-S-14-001 March 2014
Transcript of Global Mitigation of Non-CO 2 Greenhouse Gases: … Mitigation of Non-CO 2 Greenhouse Gases: ......

1
Global Mitigation of Non-CO2 Greenhouse Gases: 2010-2030
Executive Summary
United States Environmental Protection AgencyOffice of Atmospheric Programs (6207J)Washington, DC 20005
EPA-430-S-14-001March 2014

Table of Contents
Introduction 2
Energy Coal Mining 4
Oil and Natural Gas Systems 6
Waste Landfills 8
Wastewater 10
Industrial Processes Nitric and Adipic Acid Production 12
Refrigeration and Air Conditioning 14
Solvents 16
Foams Manufacturing, Use, and Disposal 18
Aerosols 20
Fire Protection 22
Aluminum Production 24
HCFC-22 Production 26
Semiconductor Manufacturing 28
Electric Power Systems 30
Magnesium Production 32
Photovoltaic Cell Manufacturing 34
Flat Panel Display Manufacturing 36
Agriculture Livestock 38
Rice Cultivation 40
Croplands 42
2
Climate change is influenced by a number of social and environmental factors. The change in our Earth’s climate is largely driven by emissions of greenhouse gases (GHGs) to the atmosphere. While some GHG emissions occur through natural processes, the largest share of GHG emissions come from human activities. GHG emissions from anthropogenic sources have increased significantly over a relatively short time frame (~100 years) and are projected to grow appreciably over the next 20 years.
Policy development and planning efforts are underway at all levels of society to identify climate change strategies that effectively reduce future greenhouse gas emissions and prepare communities to adapt to the Earth’s changing climate. GHG mitigation analysis continues to play an important role in the formation of climate change policy. A large body of research has been dedicated to analyzing ways to reduce carbon dioxide (CO2) emissions.
While this work is critical to developing effective climate policy, other GHG gases can play an important role in the effort to address global climate change. These non-carbon dioxide (non-CO2) GHGs include methane (CH4), nitrous oxide (N2O), and a number of industrial gases such as fluorinated gases.
Non-CO2 greenhouse gases are more potent than CO2 (per unit weight) at trapping heat within the atmosphere. Global warming potential (GWP) is the factor that quantifies the heat trapping potential of each GHG relative to that of carbon dioxide (CO2). For example, methane has a GWP value of 21 which means that each molecule of methane released into the atmosphere is 21 more times effective at trapping heat compared to an equivalent unit of CO2. The table shows the list of GHG gases with their GWP values that are considered in this report.
Marginal abatement cost curves (MACCs) are an analytical tool commonly used in mitigation analysis to assist policy
Greenhouse Gases Abbreviation GWP (100 year)
Carbon Dioxide CO2 1Methane CH4 21Nitrous Oxide N2O 310Hydrofluorocarbons HFCs 140 to 11,700Sulfur Hexafluoride SF6 23,900
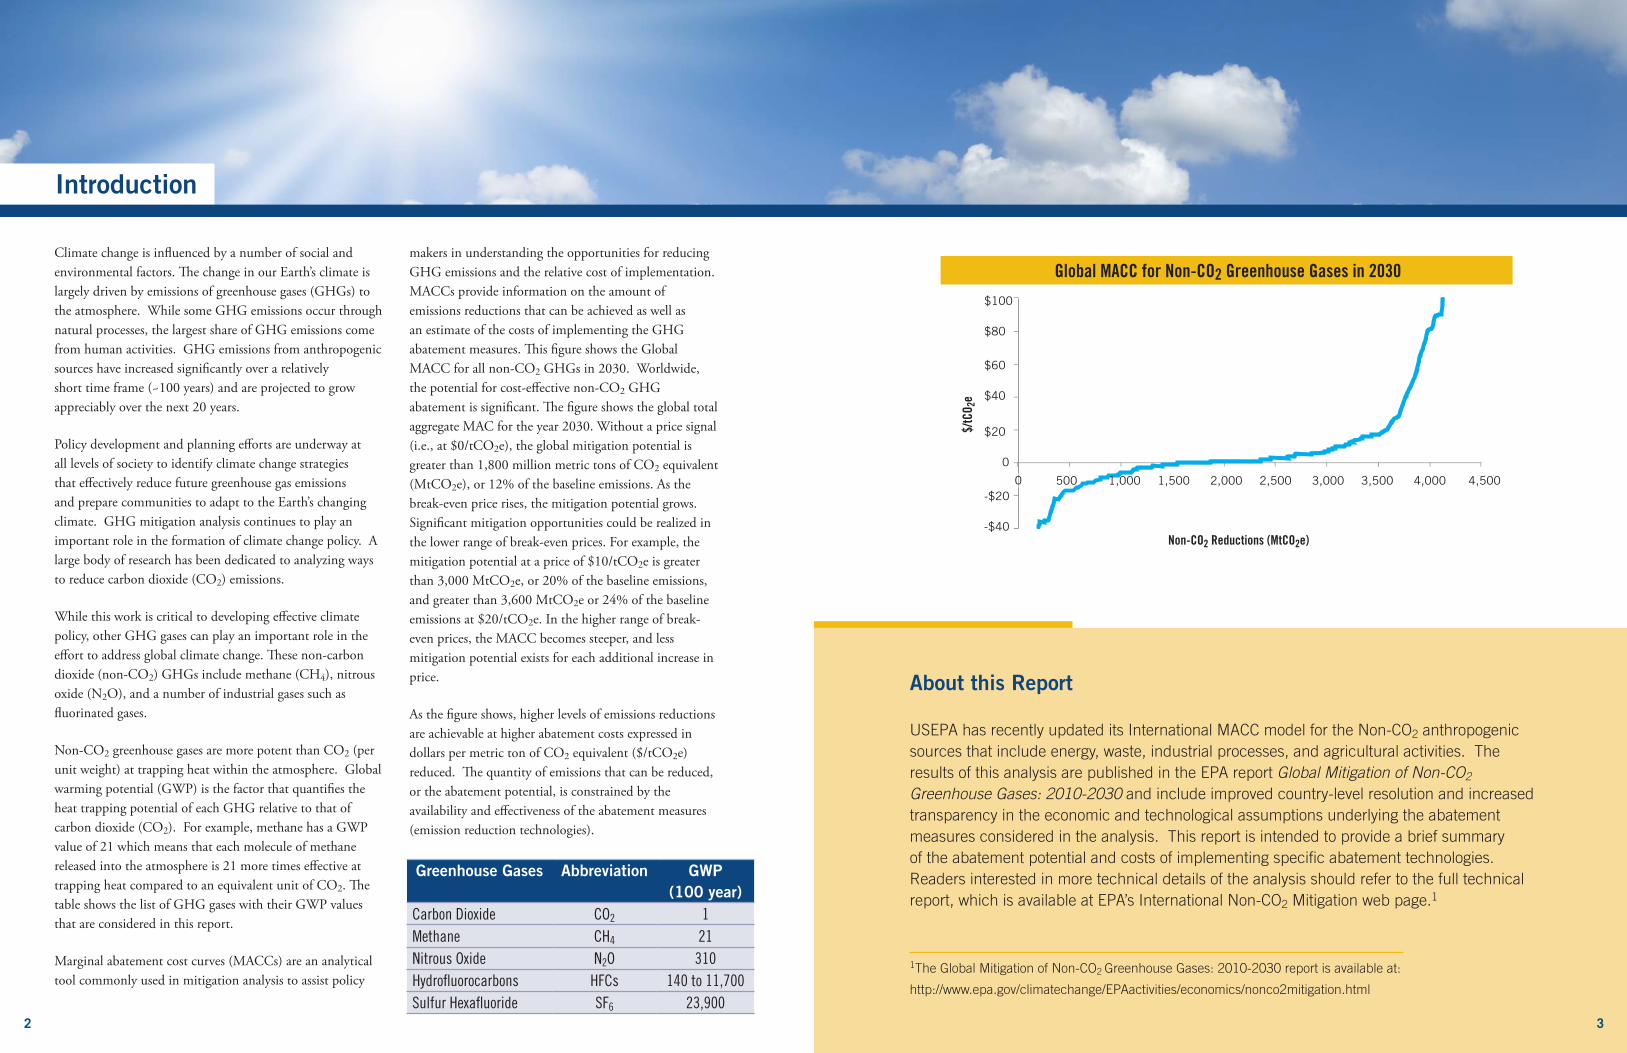
makers in understanding the opportunities for reducing GHG emissions and the relative cost of implementation. MACCs provide information on the amount of emissions reductions that can be achieved as well as an estimate of the costs of implementing the GHG abatement measures. This figure shows the Global MACC for all non-CO2 GHGs in 2030. Worldwide, the potential for cost-effective non-CO2 GHG abatement is significant. The figure shows the global total aggregate MAC for the year 2030. Without a price signal (i.e., at $0/tCO2e), the global mitigation potential is greater than 1,800 million metric tons of CO2 equivalent (MtCO2e), or 12% of the baseline emissions. As the break-even price rises, the mitigation potential grows. Significant mitigation opportunities could be realized in the lower range of break-even prices. For example, the mitigation potential at a price of $10/tCO2e is greater than 3,000 MtCO2e, or 20% of the baseline emissions, and greater than 3,600 MtCO2e or 24% of the baseline emissions at $20/tCO2e. In the higher range of break-even prices, the MACC becomes steeper, and less mitigation potential exists for each additional increase in price.
As the figure shows, higher levels of emissions reductions are achievable at higher abatement costs expressed in dollars per metric ton of CO2 equivalent ($/tCO2e) reduced. The quantity of emissions that can be reduced, or the abatement potential, is constrained by the availability and effectiveness of the abatement measures (emission reduction technologies).
About this Report
USEPA has recently updated its International MACC model for the Non-CO2 anthropogenic sources that include energy, waste, industrial processes, and agricultural activities. The results of this analysis are published in the EPA report Global Mitigation of Non-CO2 Greenhouse Gases: 2010-2030 and include improved country-level resolution and increased transparency in the economic and technological assumptions underlying the abatement measures considered in the analysis. This report is intended to provide a brief summary of the abatement potential and costs of implementing specific abatement technologies. Readers interested in more technical details of the analysis should refer to the full technical report, which is available at EPA’s International Non-CO2 Mitigation web page.1
1The Global Mitigation of Non-CO2 Greenhouse Gases: 2010-2030 report is available at:
http://www.epa.gov/climatechange/EPAactivities/economics/nonco2mitigation.html
Introduction
Non-CO2 Reductions (MtCO2e)
$/tC
O 2e
$60
$40
$100
$80
-$20
-$40
$20
0
500 1,000 1,500 2,000 2,500 3,000 3,500 4,000 4,5000
Global MACC for Non-CO2 Greenhouse Gases in 2030
3
4
Energy AgricultureWaste
Coal Mining
468
Land�lls
Refrigeration &Air Conditioning
Livestock
IndustrialProcesses
Oil & NaturalGas Systems
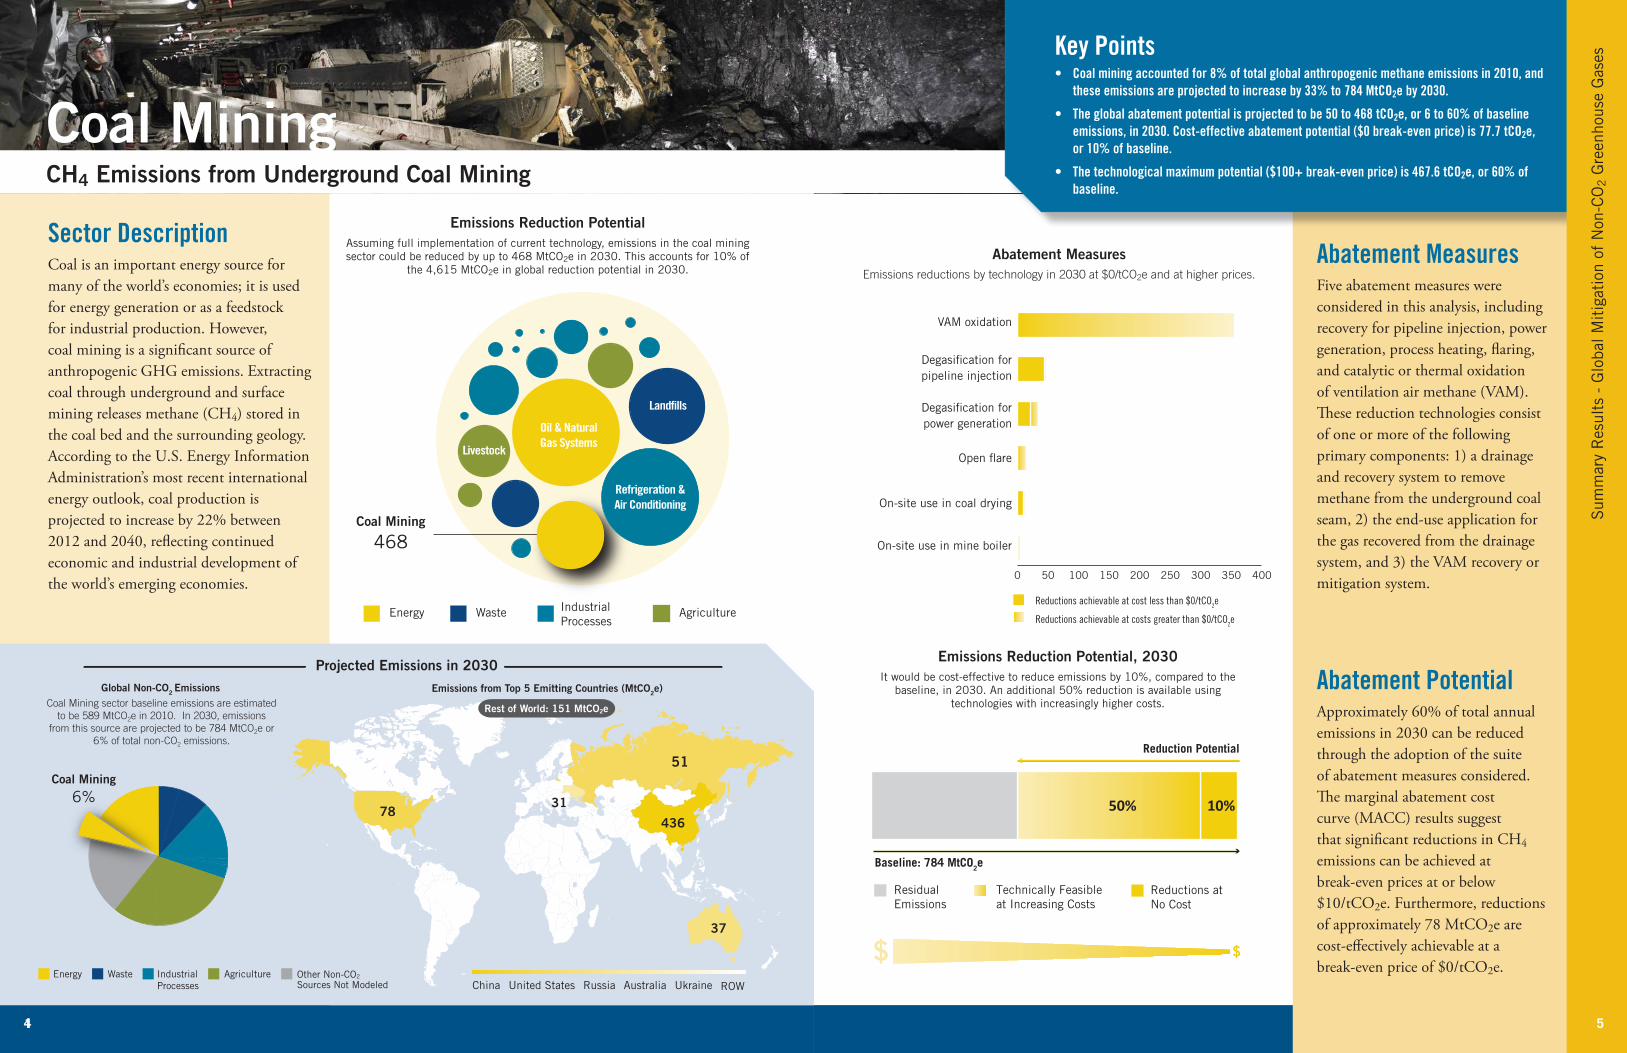
Emissions Reduction Potential Assuming full implementation of current technology, emissions in the coal mining sector could be reduced by up to 468 MtCO2e in 2030 This accounts for 10% of
the 4,615 MtCO2e in global reduction potential in 2030
78436
51
52
31
37
ROWUnited States Russia Australia UkraineChina
Coal Mining
6%
Emissions from Top 5 Emitting Countries (MtCO2e)Global Non-CO2 Emissions
IndustrialProcesses
AgricultureEnergy Waste
Coal Mining sector baseline emissions are estimated to be 589 MtCO2e in 2010. In 2030, emissions
from this source are projected to be 784 MtCO2e or 6% of total non-CO2 emissions.
Other Non-CO2
Sources Not Modeled
Projected Emissions in 2030
Rest of World: 151 MtCO2e
Sector DescriptionCoal is an important energy source for many of the world’s economies; it is used for energy generation or as a feedstock for industrial production. However, coal mining is a significant source of anthropogenic GHG emissions. Extracting coal through underground and surface mining releases methane (CH4) stored in the coal bed and the surrounding geology. According to the U.S. Energy Information Administration’s most recent international energy outlook, coal production is projected to increase by 22% between 2012 and 2040, reflecting continued economic and industrial development of the world’s emerging economies.
1
Abatement MeasuresFive abatement measures were considered in this analysis, including recovery for pipeline injection, power generation, process heating, flaring, and catalytic or thermal oxidation of ventilation air methane (VAM). These reduction technologies consist of one or more of the following primary components: 1) a drainage and recovery system to remove methane from the underground coal seam, 2) the end-use application for the gas recovered from the drainage system, and 3) the VAM recovery or mitigation system.
Abatement PotentialApproximately 60% of total annual emissions in 2030 can be reduced through the adoption of the suite of abatement measures considered. The marginal abatement cost curve (MACC) results suggest that significant reductions in CH4 emissions can be achieved at break-even prices at or below $10/tCO2e. Furthermore, reductions of approximately 78 MtCO2e are cost-effectively achievable at a break-even price of $0/tCO2e.
Key Points• Coal mining accounted for 8% of total global anthropogenic methane emissions in 2010, and
these emissions are projected to increase by 33% to 784 MtCO2e by 2030.
• The global abatement potential is projected to be 50 to 468 tCO2e, or 6 to 60% of baseline emissions, in 2030. Cost-effective abatement potential ($0 break-even price) is 77.7 tCO2e, or 10% of baseline.
• The technological maximum potential ($100+ break-even price) is 467.6 tCO2e, or 60% of baseline.
Coal Mining CH4 Emissions from Underground Coal Mining
Emissions Reduction Potential, 2030
It would be cost-effective to reduce emissions by 10%, compared to the baseline, in 2030 An additional 50% reduction is available using
technologies with increasingly higher costs
Baseline: 784 MtCO2e
Technically Feasibleat Increasing Costs
Residual Emissions
Reductions at No Cost
Reduction Potential
50% 10%
$ $
5
Sum
mar
y R
esul
ts -
Glo
bal M
itig
atio
n of
Non
-CO
2 G
reen
hous
e G
ases
0 50 100 150 200 250 300 350 400
VAM oxidation
Degasi�cation forpipeline injection
Degasi�cation forpower generation
Open �are
On-site use in coal drying
On-site use in mine boiler
Reductions achievable at cost less than $0/tCO2e
Reductions achievable at costs greater than $0/tCO2e
Abatement MeasuresEmissions reductions by technology in 2030 at $0/tCO2e and at higher prices.
6 7
United StatesRussia Iraq UzbekistanKuwait
Oil & Natural Gas Systems
16%
313107
418
52116188
ROW
Emissions from Top 5 Emitting Countries (MtCO2e)Global Non-CO2 Emissions
IndustrialProcesses
AgricultureEnergy Waste
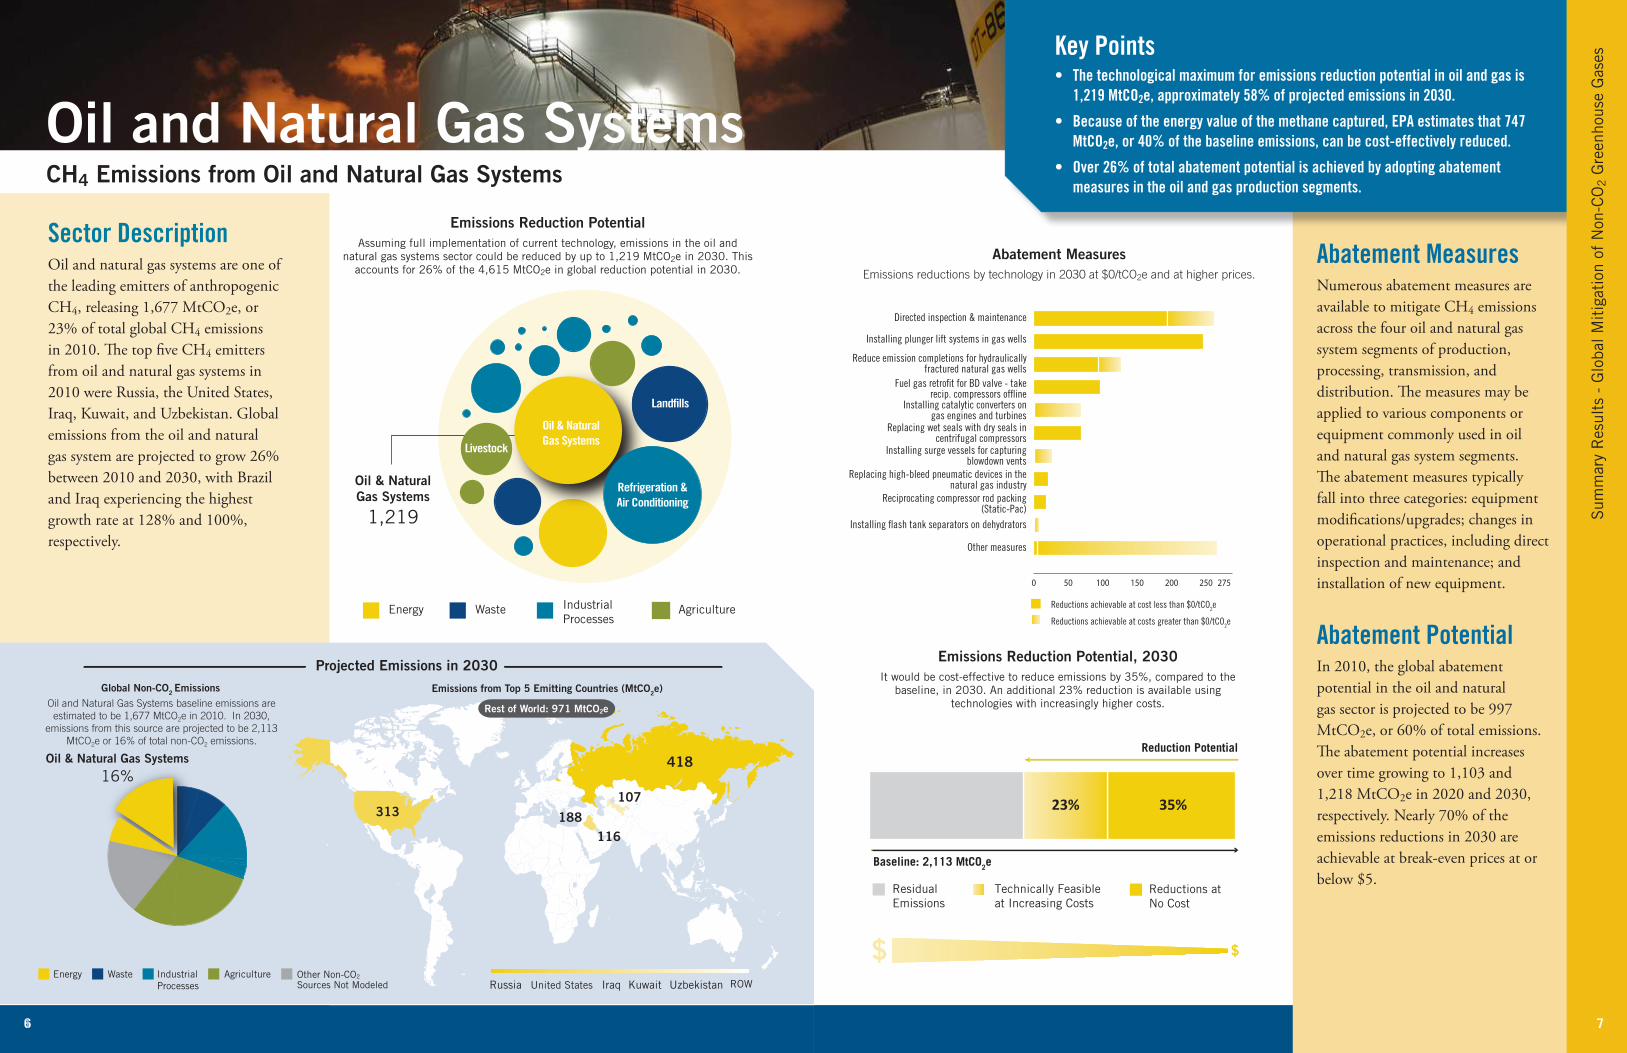
Oil and Natural Gas Systems baseline emissions are estimated to be 1,677 MtCO2e in 2010. In 2030,
emissions from this source are projected to be 2,113 MtCO2e or 16% of total non-CO2 emissions.
Other Non-CO2
Sources Not Modeled
Projected Emissions in 2030
Rest of World: 971 MtCO2e
Energy AgricultureWaste
Oil & NaturalGas Systems
1,219
Land�lls
Refrigeration &Air Conditioning
Livestock
IndustrialProcesses
Oil & NaturalGas Systems
Sector DescriptionOil and natural gas systems are one of the leading emitters of anthropogenic CH4, releasing 1,677 MtCO2e, or 23% of total global CH4 emissions in 2010. The top five CH4 emitters from oil and natural gas systems in 2010 were Russia, the United States, Iraq, Kuwait, and Uzbekistan. Global emissions from the oil and natural gas system are projected to grow 26% between 2010 and 2030, with Brazil and Iraq experiencing the highest growth rate at 128% and 100%, respectively.
1
Sum
mar
y R
esul
ts -
Glo
bal M
itig
atio
n of
Non
-CO
2 G
reen
hous
e G
ases
Abatement MeasuresNumerous abatement measures are available to mitigate CH4 emissions across the four oil and natural gas system segments of production, processing, transmission, and distribution. The measures may be applied to various components or equipment commonly used in oil and natural gas system segments. The abatement measures typically fall into three categories: equipment modifications/upgrades; changes in operational practices, including direct inspection and maintenance; and installation of new equipment.
Abatement PotentialIn 2010, the global abatement potential in the oil and natural gas sector is projected to be 997 MtCO2e, or 60% of total emissions. The abatement potential increases over time growing to 1,103 and 1,218 MtCO2e in 2020 and 2030, respectively. Nearly 70% of the emissions reductions in 2030 are achievable at break-even prices at or below $5.
Key Points• The technological maximum for emissions reduction potential in oil and gas is
1,219 MtCO2e, approximately 58% of projected emissions in 2030.
• Because of the energy value of the methane captured, EPA estimates that 747 MtCO2e, or 40% of the baseline emissions, can be cost-effectively reduced.
• Over 26% of total abatement potential is achieved by adopting abatement measures in the oil and gas production segments.
Oil and Natural Gas Systems CH4 Emissions from Oil and Natural Gas Systems
Emissions Reduction Potential, 2030
It would be cost-effective to reduce emissions by 35%, compared to the baseline, in 2030 An additional 23% reduction is available using
technologies with increasingly higher costs
0 100 200 300 400 500 600 700
0 10 20 30 40 50 60 70 80 90 100
0 10 20 30 40 50 60 70 80 90 100
Baseline: 2,113 MtCO2e
Technically Feasibleat Increasing Costs
Residual Emissions
Reductions at No Cost
Reduction Potential
23% 35%
$ $
Emissions Reduction PotentialAssuming full implementation of current technology, emissions in the oil and
natural gas systems sector could be reduced by up to 1,219 MtCO2e in 2030 This accounts for 26% of the 4,615 MtCO2e in global reduction potential in 2030
7
0 50 100 150 200 250 275
Directed inspection & maintenance
Installing plunger lift systems in gas wells
Reduce emission completions for hydraulically fractured natural gas wells
Fuel gas retro�t for BD valve - take recip. compressors of�ine
Installing catalytic converters on gas engines and turbines
Replacing wet seals with dry seals in centrifugal compressors
Installing surge vessels for capturingblowdown vents
Replacing high-bleed pneumatic devices in the natural gas industry
Reciprocating compressor rod packing (Static-Pac)
Installing �ash tank separators on dehydrators
Other measures
Reductions achievable at cost less than $0/tCO2e
Reductions achievable at costs greater than $0/tCO2e
Abatement MeasuresEmissions reductions by technology in 2030 at $0/tCO2e and at higher prices.

United States Mexico Russia MalaysiaChina ROW
Emissions from Top 5 Emitting Countries (MtCO2e)Global Non-CO2 Emissions
IndustrialProcesses
AgricultureEnergy Waste
128
68
49
42
40
Land�lls sector baseline emissions are estimated to be 847 MtCO2e in 2010. In 2030, emissions from
this source are projected to be 959 MtCO2e or 7% of total non-CO2 emissions.
Other Non-CO2
Sources Not Modeled
Projected Emissions in 2030
Rest of World: 632 MtCO2e
Land�lls
7%
Emissions Reduction Potential, 2030
It would be cost-effective to reduce emissions by 12%, compared to the baseline, in 2030 An additional 49% reduction is available using
technologies with increasingly higher costs
Energy AgricultureWaste
Landfills
589
Land�lls
Refrigeration &Air Conditioning
Livestock
IndustrialProcesses
Oil & NaturalGas Systems
Baseline: 959 MtCO2e
Technically Feasibleat Increasing Costs
Residual Emissions
Reductions at No Cost
Reduction Potential
49% 12%
$ $
Emissions Reduction Potential Assuming full implementation of current technology, emissions in the landfill
sector could be reduced by up to 589 MtCO2e in 2030 This accounts for 13% of the 4,615 MtCO2e in global reduction potential in 2030
8 9
Sector DescriptionLandfills produce methane in combination with other landfill gases (LFGs) through the natural process of bacterial decomposition of organic waste under anaerobic conditions. LFG is generated over a period of several decades with gas flows usually beginning 1 to 2 years after the waste is put in place. The amount of methane generated by landfills per country is determined by a number of factors that include population size, the quantity of waste disposed of per capita, composition of the waste disposed of, and the waste management practices applied at the landfill.
1
Landfills CH4 Emissions from Municipal Solid Waste (MSW) Landfills
0 10 20 30 40 50 60 70 80
Electricity generation w/ reciprocating engine
Waste to energy (WTE)
Mechanical biological treatment (MBT)
Composting
Anaerobic digestion
Paper recycling
Land�ll gas recovery for direct use
Flaring of land�ll gas
Enhanced oxidation
Electricity generation w/ gas turbine
Electricity generation w/ CHP
Electricity generation w/microturbine
Reductions achievable at cost less than $0/tCO2e
Reductions achievable at costs greater than $0/tCO2e
Abatement MeasuresEmissions reductions by technology in 2030 at $0/tCO2e and at higher prices.
Abatement Measures Several abatement measures are available to control landfill methane emissions, and they are commonly grouped into three major categories: (1) collection and flaring, (2) LFG utilization systems (LFG capture for energy use), and (3) enhanced waste diversion practices (e.g., recycling and reuse programs). Although flaring is currently the most common abatement measure, LFG utilization options may be more cost-effective. Under favorable market conditions, recycling and reuse or composting alternatives may provide additional means for reducing emissions from landfills.
Abatement PotentialGlobal abatement potential in the solid waste landfill sector is estimated to be approximately 589 MtCO2e of total annual emissions in 2030, or 61% of the baseline emissions. The marginal abatement cost curve results suggest that there are significant opportunities for CH4 reductions in the landfill sector at costs below $20 per tCO2e emissions reduced. Furthermore, approximately 70 to 80 MtCO2e of reductions are cost-effective at current energy prices.
Key Points• Global abatement potential from landfills is 589 MtCO2e, roughly 61% of
projected baseline emissions in 2030.
• Abatement measures with costs below $20/tCO2e can achieve a 30% reduction in baseline emissions.
• Abatement measures include (1) conversion of landfill gas to energy and (2) waste diversion projects that use waste in the production of new products.
Sum
mar
y R
esul
ts -
Glo
bal M
itig
atio
n of
Non
-CO
2 G
reen
hous
e G
ases
9

10
Emissions Reduction Potential, 2030
It would be cost-effective to reduce emissions by 1%, compared to the baseline, in 2030 An additional 35% reduction is available using
technologies with increasingly higher costs
Energy AgricultureWaste
Wastewater
218
Land�lls
Refrigeration &Air Conditioning
Livestock
IndustrialProcesses
Oil & NaturalGas Systems
Baseline: 609 MtCO2e
Technically Feasibleat Increasing Costs
Residual Emissions
Reductions at No Cost
Reduction Potential
35% 1%
$ $
Emissions Reduction Potential Assuming full implementation of current technology, emissions in the
wastewater sector could be reduced by up to 218 MtCO2e in 2030 This accounts for 5% of the 4,615 MtCO2e in global reduction potential in 2030
Sector DescriptionWastewater is the fifth largest emitter of anthropogenic CH4, accounting for more than 500 MtCO2e in 2010; wastewater treatment is also a source of N2O emissions. Domestic and industrial wastewater treatment activities can lead to venting and fugitive emissions of CH4, which are produced when organic material decomposes under anaerobic conditions of wastewater in a facility. Most developed countries use aerobic wastewater treatment systems to minimize the amount of CH4 generated, but many developing countries rely on systems such as septic tanks, latrines, open sewers, and lagoons, which allow for greater levels of anaerobic decomposition.
1
Key Points• Methane (CH4) emissions from wastewater treatment accounted for over 500
MtCO2e in 2010 and are projected to grow 20% by 2030.
• The estimated maximum abatement potential in 2030 is 218 MtCO2e, or 36% of projected emissions.
• Abatement measures with costs less than $30 tCO2e can achieve a 15% reduction in CH4 emissions in 2030.
Wastewater CH4 Emissions from Municipal Wastewater Systems
Sum
mar
y R
esul
ts -
Glo
bal M
itig
atio
n of
Non
-CO
2 G
reen
hous
e G
ases
Abatement Measures CH4 emissions from wastewater can be significantly reduced through improvements to infrastructure and equipment. Abatement measures available in the wastewater sector include installing aerobic wastewater treatment plants on an individual or centralized scale and installing anaerobic wastewater treatment plants with cogeneration. Factors such as economic resources, population density, government, and technical capabilities are important in determining the potential for mitigating emissions from the wastewater sector.
Abatement Potential The global abatement potential of CH4 from wastewater treatment is 138 MtCO2e in 2020 rising to 218 MtCO2e in 2030. This level of CH4 mitigation is considered to be the technological maximum abatement potential because high-cost abatement measures in the wastewater treatment sector significantly constrain the abatement achievable at lower carbon prices. Cost-effective emissions reductions are limited to 3.4 MtCO2e—less than 1% of business as usual (BAU) emissions in 2030.
United StatesMexicoNigeria IndiaChina
30
58
138
42
52
78
Emissions from Top 5 Emitting Countries (MtCO2e)Global Non-CO2 Emissions
IndustrialProcesses
AgricultureEnergy Waste
The Wastewater sector baseline emissions are estimated to be 512 MtCO2e in 2010. In 2030,
emissions from this source are projected to be 609 MtCO2e or 5% of total non-CO2 emissions.
Other Non-CO2
Sources Not Modeled
Projected Emissions in 2030
Rest of World: 252 MtCO2e
ROW
Wastewater
5%
11
0 20 40 60 80 100 120
Latrine to aerobic Wwtp
Open sewer to aerobic Wwtp
Septic tank to aerobic Wwtp
Wastewater treatment plant with anaerobic sludge digester with co-gen
Reductions achievable at cost less than $0/tCO2e
Reductions achievable at costs greater than $0/tCO2e
Abatement MeasuresEmissions reductions by technology in 2030 at $0/tCO2e and at higher prices.

12 13
Energy AgricultureWaste
Nitric andAdipic AcidProduction
116
Land�lls
Refrigeration &Air Conditioning
Livestock
IndustrialProcesses
Oil & NaturalGas Systems
Baseline: 147 MtCO2e
Technically Feasibleat Increasing Costs
Residual Emissions
Reductions at No Cost
Reduction Potential
79% 0%
$ $
United States South Korea China UkraineBrazil ROW
3723
10
52
7
14
Emissions from Top 5 Emitting Countries (MtCO2e)Global Non-CO2 Emissions
IndustrialProcesses
AgricultureEnergy Waste
Nitric and Adipic Acid Production baseline emissions are estimated to be 118 MtCO2e in 2010. In 2030, emissions from this source are projected to be 147 MtCO2e or 1% of total non-CO2 emissions.
Other Non-CO2
Sources Not Modeled
Projected Emissions in 2030
Rest of World: 209 MtCO2e
Nitric & AdipicAcid
Production
1%
Sector DescriptionNitric and adipic acid are commonly used as feedstock in manufacturing a variety of commercial products, particularly fertilizer and synthetic fibers. The process used to produce nitric and adipic acid generates significant quantities of nitrous oxide (N2O) as a by-product. The production of nitric and adipic acid is expected to increase over time, driven by continued growth in demand for fertilizer and synthetic fibers.
1
Sum
mar
y R
esul
ts -
Glo
bal M
itig
atio
n of
Non
-CO
2 G
reen
hous
e G
ases
Abatement MeasuresN2O emissions can be mitigated through a number of alternative abatement measures. In nitric acid production, reduction technologies are categorized by their location in the production process. Secondary reduction technologies, such as homogeneous thermal decomposition and catalytic decomposition, are installed at an intermediate point in the production process. Tertiary reduction technologies, such as catalytic decomposition and nonselective catalytic reduction units, are applied to the tail gas streams at the end of the production process. The implementation of one technology over another is driven largely by facility design constraints and/or cost considerations. Thermal destruction is the single abatement measure considered in this analysis.
Abatement PotentialThe global abatement potential in the nitric and adipic acid sector is approximately 116 MtCO2e of total annual emissions in 2030, or 79% of projected baseline emissions. The marginal abatement cost curve results show that maximum reduction potential is achievable at break-even prices below $50/tCO2e. Over two-thirds of the abatement potential is achievable at break-even prices between $0 and $20.
Key Points• The global abatement potential is 116 MtCO2e, or 79% of projected emissions in
2030.
• A 65% reduction in emissions is achievable at break-even prices below $20.
• Abatement measure selection is driven by facility design constraints and/or operating costs.
Nitric and Adipic Acid ProductionN2O Emissions from Nitric and Adipic Acid Production
Emissions Reduction Potential, 2030
It would be cost-effective to reduce emissions by 0%, compared to the baseline, in 2030 An additional 79% reduction is available using
technologies with increasingly higher costs
Emissions Reduction Potential Assuming full implementation of current technology, emissions in the nitric and adipic acid production sector could be reduced by up to 116 MtCO2e in 2030
This accounts for 3% of the 4,615 MtCO2e in global reduction potential in 2030
13
Reductions achievable at cost less than $0/tCO2e
Reductions achievable at costs greater than $0/tCO2e
0 5 10 15 20 25 30
Tail-gas catalytic decomposition
Non-selective catalytic reduction
Catalytic decomposition in the burner
Homogeneous decompositionin the burner
Thermal destruction
Abatement MeasuresEmissions reductions by technology in 2030 at $0/tCO2e and at higher prices.
14 15
Energy AgricultureWaste
Refrigeration &Air Conditioning
994
Land�lls
Refrigeration &Air Conditioning
Livestock
IndustrialProcesses
Oil & NaturalGas Systems
Baseline: 1,596 MtCO2e
Technically Feasibleat Increasing Costs
Residual Emissions
Reductions at No Cost
Reduction Potential
32% 30%
$ $
United StatesChina South Korea Russia Japan ROW
Emissions from Top 5 Emitting Countries (MtCO2e)
IndustrialProcesses
AgricultureEnergy Waste Other Non-CO2
Sources Not Modeled
Projected Emissions in 2030
Refrigeration &Air Conditioning
12%
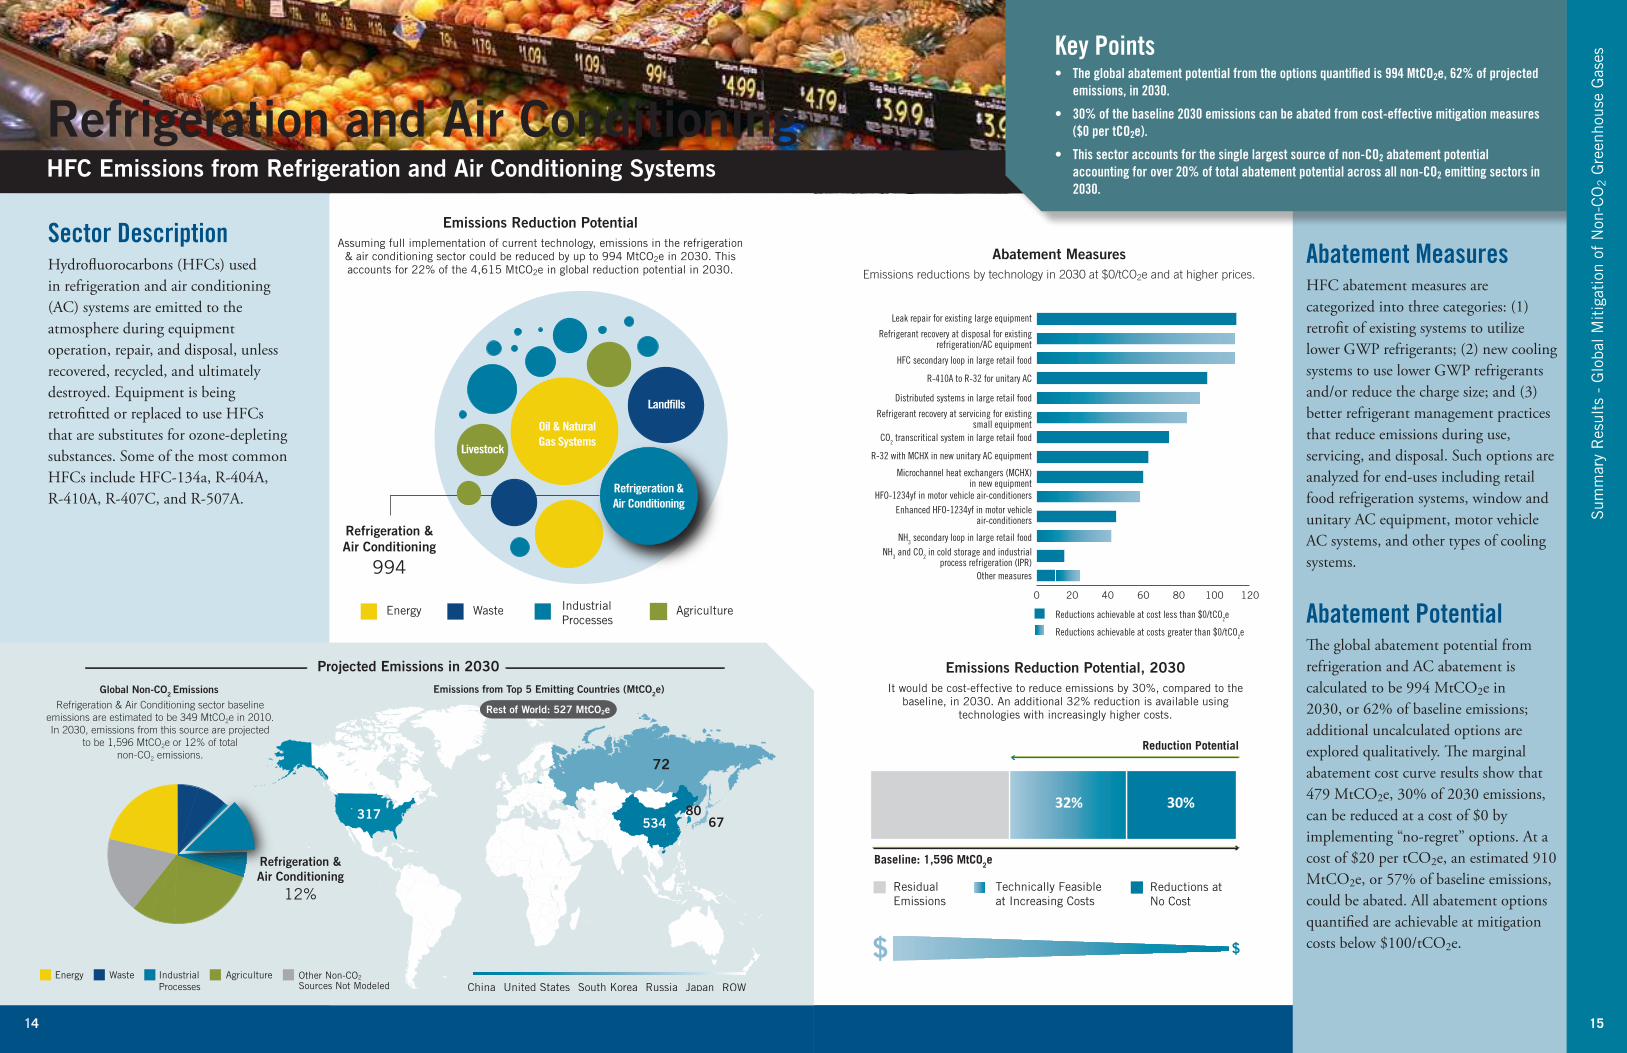
Refrigeration & Air Conditioning sector baseline emissions are estimated to be 349 MtCO2e in 2010. In 2030, emissions from this source are projected
to be 1,596 MtCO2e or 12% of total non-CO2 emissions.
Global Non-CO2 Emissions
317534
72
52
8067
Rest of World: 527 MtCO2e
Sector DescriptionHydrofluorocarbons (HFCs) used in refrigeration and air conditioning (AC) systems are emitted to the atmosphere during equipment operation, repair, and disposal, unless recovered, recycled, and ultimately destroyed. Equipment is being retrofitted or replaced to use HFCs that are substitutes for ozone-depleting substances. Some of the most common HFCs include HFC-134a, R-404A, R-410A, R-407C, and R-507A.
1
Sum
mar
y R
esul
ts -
Glo
bal M
itig
atio
n of
Non
-CO
2 G
reen
hous
e G
ases
Abatement MeasuresHFC abatement measures are categorized into three categories: (1) retrofit of existing systems to utilize lower GWP refrigerants; (2) new cooling systems to use lower GWP refrigerants and/or reduce the charge size; and (3) better refrigerant management practices that reduce emissions during use, servicing, and disposal. Such options are analyzed for end-uses including retail food refrigeration systems, window and unitary AC equipment, motor vehicle AC systems, and other types of cooling systems.
Abatement PotentialThe global abatement potential from refrigeration and AC abatement is calculated to be 994 MtCO2e in 2030, or 62% of baseline emissions; additional uncalculated options are explored qualitatively. The marginal abatement cost curve results show that 479 MtCO2e, 30% of 2030 emissions, can be reduced at a cost of $0 by implementing “no-regret” options. At a cost of $20 per tCO2e, an estimated 910 MtCO2e, or 57% of baseline emissions, could be abated. All abatement options quantified are achievable at mitigation costs below $100/tCO2e.
Key Points• The global abatement potential from the options quantified is 994 MtCO2e, 62% of projected
emissions, in 2030.
• 30% of the baseline 2030 emissions can be abated from cost-effective mitigation measures ($0 per tCO2e).
• This sector accounts for the single largest source of non-CO2 abatement potential accounting for over 20% of total abatement potential across all non-CO2 emitting sectors in 2030.
Refrigeration and Air ConditioningHFC Emissions from Refrigeration and Air Conditioning Systems
Emissions Reduction Potential, 2030
It would be cost-effective to reduce emissions by 30%, compared to the baseline, in 2030 An additional 32% reduction is available using
technologies with increasingly higher costs
Emissions Reduction Potential Assuming full implementation of current technology, emissions in the refrigeration
& air conditioning sector could be reduced by up to 994 MtCO2e in 2030 This accounts for 22% of the 4,615 MtCO2e in global reduction potential in 2030
15
0 20 40 60 80 100 120
Leak repair for existing large equipment
Refrigerant recovery at disposal for existing refrigeration/AC equipment
HFC secondary loop in large retail food
R-410A to R-32 for unitary AC
Distributed systems in large retail food
Refrigerant recovery at servicing for existingsmall equipment
CO2 transcritical system in large retail food
R-32 with MCHX in new unitary AC equipment
Microchannel heat exchangers (MCHX)in new equipment
HFO-1234yf in motor vehicle air-conditionersEnhanced HFO-1234yf in motor vehicle
air-conditioners
NH3 secondary loop in large retail foodNH3 and CO2 in cold storage and industrial
process refrigeration (IPR)Other measures
Reductions achievable at cost less than $0/tCO2e
Reductions achievable at costs greater than $0/tCO2e
Abatement MeasuresEmissions reductions by technology in 2030 at $0/tCO2e and at higher prices.
16 17
Energy AgricultureWaste
Solvents
6 Land�lls
Refrigeration &Air Conditioning
Livestock
IndustrialProcesses
Oil & NaturalGas Systems
Baseline: 2 MtCO2e
Technically Feasibleat Increasing Costs
Residual Emissions
Reductions at No Cost
Reduction Potential
50%9%
$ $
JapanChina Russia South KoreaUnited States ROW
Emissions from Top 5 Emitting Countries (MtCO2e)
IndustrialProcesses
AgricultureEnergy Waste Other Non-CO2
Sources Not Modeled
Projected Emissions in 2030
Solvents
0.1%
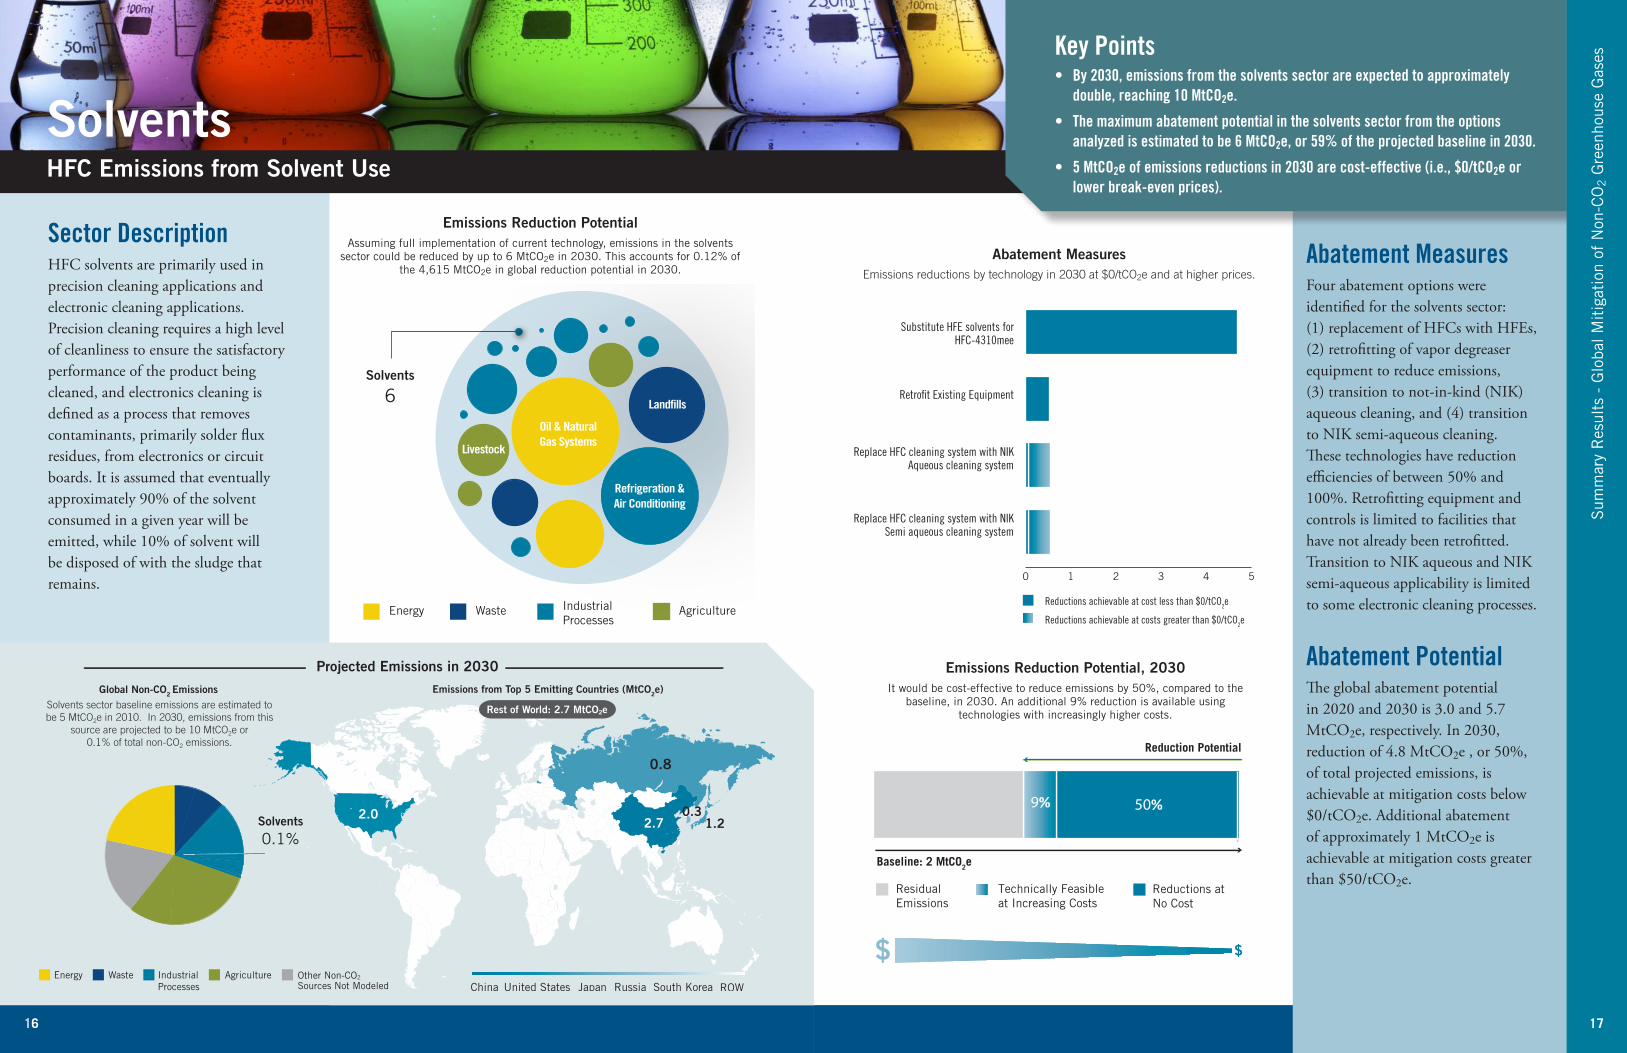
Solvents sector baseline emissions are estimated to be 5 MtCO2e in 2010. In 2030, emissions from this
source are projected to be 10 MtCO2e or 0.1% of total non-CO2 emissions.
Global Non-CO2 Emissions
2.02.7
0.8
52
0.31.2
Rest of World: 2.7 MtCO2e
Sector DescriptionHFC solvents are primarily used in precision cleaning applications and electronic cleaning applications. Precision cleaning requires a high level of cleanliness to ensure the satisfactory performance of the product being cleaned, and electronics cleaning is defined as a process that removes contaminants, primarily solder flux residues, from electronics or circuit boards. It is assumed that eventually approximately 90% of the solvent consumed in a given year will be emitted, while 10% of solvent will be disposed of with the sludge that remains.
1
Sum
mar
y R
esul
ts -
Glo
bal M
itig
atio
n of
Non
-CO
2 G
reen
hous
e G
ases
Abatement MeasuresFour abatement options were identified for the solvents sector: (1) replacement of HFCs with HFEs, (2) retrofitting of vapor degreaser equipment to reduce emissions, (3) transition to not-in-kind (NIK) aqueous cleaning, and (4) transition to NIK semi-aqueous cleaning. These technologies have reduction efficiencies of between 50% and 100%. Retrofitting equipment and controls is limited to facilities that have not already been retrofitted. Transition to NIK aqueous and NIK semi-aqueous applicability is limited to some electronic cleaning processes.
Abatement PotentialThe global abatement potential in 2020 and 2030 is 3.0 and 5.7 MtCO2e, respectively. In 2030, reduction of 4.8 MtCO2e , or 50%, of total projected emissions, is achievable at mitigation costs below $0/tCO2e. Additional abatement of approximately 1 MtCO2e is achievable at mitigation costs greater than $50/tCO2e.
Key Points• By 2030, emissions from the solvents sector are expected to approximately
double, reaching 10 MtCO2e.
• The maximum abatement potential in the solvents sector from the options analyzed is estimated to be 6 MtCO2e, or 59% of the projected baseline in 2030.
• 5 MtCO2e of emissions reductions in 2030 are cost-effective (i.e., $0/tCO2e or lower break-even prices).
SolventsHFC Emissions from Solvent Use
Emissions Reduction Potential, 2030
It would be cost-effective to reduce emissions by 50%, compared to the baseline, in 2030 An additional 9% reduction is available using
technologies with increasingly higher costs
Emissions Reduction Potential Assuming full implementation of current technology, emissions in the solvents
sector could be reduced by up to 6 MtCO2e in 2030 This accounts for 0 12% of the 4,615 MtCO2e in global reduction potential in 2030
17
0 1 2 3 4 5
Reductions achievable at cost less than $0/tCO2e
Reductions achievable at costs greater than $0/tCO2e
Substitute HFE solvents for HFC-4310mee
Retro�t Existing Equipment
Replace HFC cleaning system with NIK Aqueous cleaning system
Replace HFC cleaning system with NIK Semi aqueous cleaning system
Abatement MeasuresEmissions reductions by technology in 2030 at $0/tCO2e and at higher prices.
18 19
Japan ItalyGermany FranceUnited States ROW
311
8
52
6
265
Emissions from Top 5 Emitting Countries (MtCO2e)
IndustrialProcesses
AgricultureEnergy Waste Other Non-CO2
Sources Not Modeled
Projected Emissions in 2030
Rest of World: 17 MtCO2e
Foams
1%
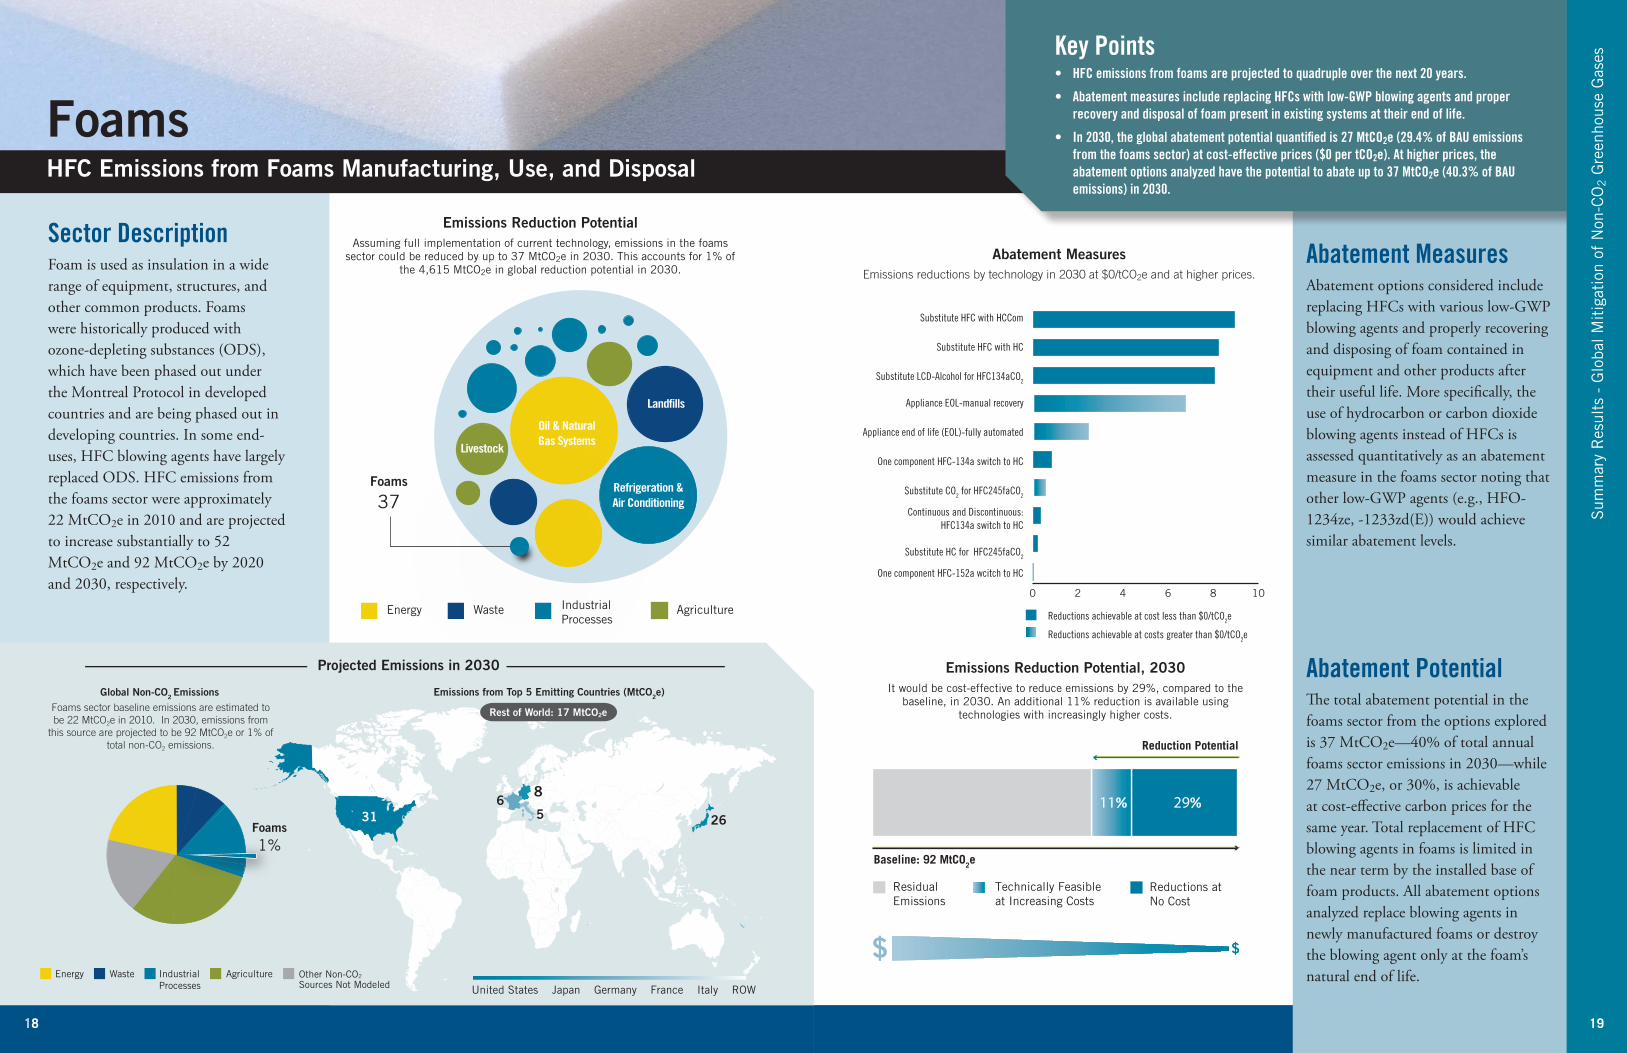
Foams sector baseline emissions are estimated to be 22 MtCO2e in 2010. In 2030, emissions from
this source are projected to be 92 MtCO2e or 1% of total non-CO2 emissions.
Global Non-CO2 Emissions
Energy AgricultureWaste
Foams
37
Land�lls
Refrigeration &Air Conditioning
Livestock
IndustrialProcesses
Oil & NaturalGas Systems
Baseline: 92 MtCO2e
Technically Feasibleat Increasing Costs
Residual Emissions
Reductions at No Cost
Reduction Potential
11% 29%
$ $
Sector DescriptionFoam is used as insulation in a wide range of equipment, structures, and other common products. Foams were historically produced with ozone-depleting substances (ODS), which have been phased out under the Montreal Protocol in developed countries and are being phased out in developing countries. In some end-uses, HFC blowing agents have largely replaced ODS. HFC emissions from the foams sector were approximately 22 MtCO2e in 2010 and are projected to increase substantially to 52 MtCO2e and 92 MtCO2e by 2020 and 2030, respectively.
1
Sum
mar
y R
esul
ts -
Glo
bal M
itig
atio
n of
Non
-CO
2 G
reen
hous
e G
ases
Abatement MeasuresAbatement options considered include replacing HFCs with various low-GWP blowing agents and properly recovering and disposing of foam contained in equipment and other products after their useful life. More specifically, the use of hydrocarbon or carbon dioxide blowing agents instead of HFCs is assessed quantitatively as an abatement measure in the foams sector noting that other low-GWP agents (e.g., HFO-1234ze, -1233zd(E)) would achieve similar abatement levels.
Abatement PotentialThe total abatement potential in the foams sector from the options explored is 37 MtCO2e—40% of total annual foams sector emissions in 2030—while 27 MtCO2e, or 30%, is achievable at cost-effective carbon prices for the same year. Total replacement of HFC blowing agents in foams is limited in the near term by the installed base of foam products. All abatement options analyzed replace blowing agents in newly manufactured foams or destroy the blowing agent only at the foam’s natural end of life.
Key Points• HFC emissions from foams are projected to quadruple over the next 20 years.
• Abatement measures include replacing HFCs with low-GWP blowing agents and proper recovery and disposal of foam present in existing systems at their end of life.
• In 2030, the global abatement potential quantified is 27 MtCO2e (29.4% of BAU emissions from the foams sector) at cost-effective prices ($0 per tCO2e). At higher prices, the abatement options analyzed have the potential to abate up to 37 MtCO2e (40.3% of BAU emissions) in 2030.
FoamsHFC Emissions from Foams Manufacturing, Use, and Disposal
Emissions Reduction Potential, 2030
It would be cost-effective to reduce emissions by 29%, compared to the baseline, in 2030 An additional 11% reduction is available using
technologies with increasingly higher costs
Emissions Reduction Potential Assuming full implementation of current technology, emissions in the foams
sector could be reduced by up to 37 MtCO2e in 2030 This accounts for 1% of the 4,615 MtCO2e in global reduction potential in 2030
19
0 2 4 6 8 10
Reductions achievable at cost less than $0/tCO2e
Reductions achievable at costs greater than $0/tCO2e
Substitute HFC with HCCom
Substitute HFC with HC
Substitute LCD-Alcohol for HFC134aCO2
Appliance EOL-manual recovery
Appliance end of life (EOL)-fully automated
One component HFC-134a switch to HC
Substitute CO2 for HFC245faCO2
Continuous and Discontinuous: HFC134a switch to HC
Substitute HC for HFC245faCO2
One component HFC-152a wcitch to HC
Abatement MeasuresEmissions reductions by technology in 2030 at $0/tCO2e and at higher prices.
20 21
Energy AgricultureWaste
AerosolsProduct Use
97
Land�lls
Refrigeration &Air Conditioning
Livestock
IndustrialProcesses
Oil & NaturalGas Systems
Baseline: 92 MtCO2e
Technically Feasibleat Increasing Costs
Residual Emissions
Reductions at No Cost
Reduction Potential
18% 48%
$ $
1657
6
135
China United States RussiaIndia Mexico ROW
Emissions from Top 5 Emitting Countries (MtCO2e)
IndustrialProcesses
AgricultureEnergy Waste Other Non-CO2
Sources Not Modeled
Projected Emissions in 2030
Rest of World: 49 MtCO2e
AerosolsProduct Use
1%
Aerosols sector baseline emissions are estimated to be 45 MtCO2e in 2010. In 2030, emissions from this
source are projected to be 146 MtCO2e or 1% of total non-CO2 emissions.
Global Non-CO2 Emissions
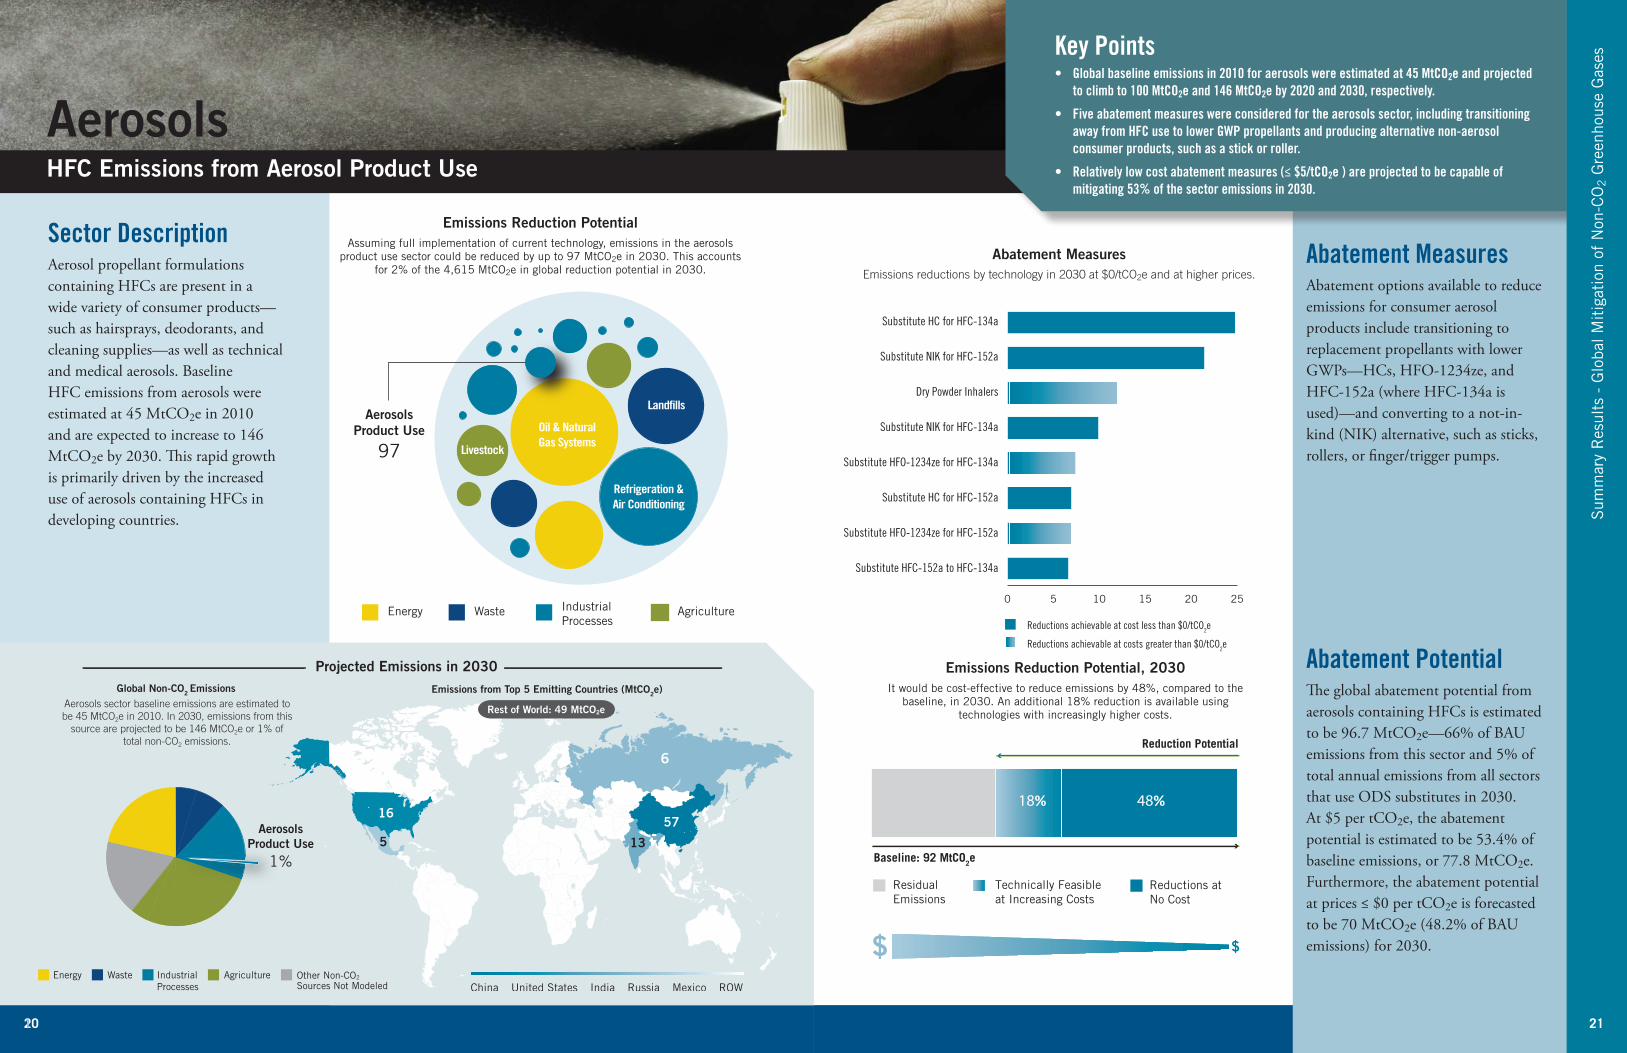
Sector DescriptionAerosol propellant formulations containing HFCs are present in a wide variety of consumer products—such as hairsprays, deodorants, and cleaning supplies—as well as technical and medical aerosols. Baseline HFC emissions from aerosols were estimated at 45 MtCO2e in 2010 and are expected to increase to 146 MtCO2e by 2030. This rapid growth is primarily driven by the increased use of aerosols containing HFCs in developing countries.
1
Sum
mar
y R
esul
ts -
Glo
bal M
itig
atio
n of
Non
-CO
2 G
reen
hous
e G
ases
Abatement Measures Abatement options available to reduce emissions for consumer aerosol products include transitioning to replacement propellants with lower GWPs—HCs, HFO-1234ze, and HFC-152a (where HFC-134a is used)—and converting to a not-in-kind (NIK) alternative, such as sticks, rollers, or finger/trigger pumps.
Abatement Potential The global abatement potential from aerosols containing HFCs is estimated to be 96.7 MtCO2e—66% of BAU emissions from this sector and 5% of total annual emissions from all sectors that use ODS substitutes in 2030. At $5 per tCO2e, the abatement potential is estimated to be 53.4% of baseline emissions, or 77.8 MtCO2e. Furthermore, the abatement potential at prices ≤ $0 per tCO2e is forecasted to be 70 MtCO2e (48.2% of BAU emissions) for 2030.
Key Points• Global baseline emissions in 2010 for aerosols were estimated at 45 MtCO2e and projected
to climb to 100 MtCO2e and 146 MtCO2e by 2020 and 2030, respectively.
• Five abatement measures were considered for the aerosols sector, including transitioning away from HFC use to lower GWP propellants and producing alternative non-aerosol consumer products, such as a stick or roller.
• Relatively low cost abatement measures (≤ $5/tCO2e ) are projected to be capable of mitigating 53% of the sector emissions in 2030.
AerosolsHFC Emissions from Aerosol Product Use
Emissions Reduction Potential, 2030
It would be cost-effective to reduce emissions by 48%, compared to the baseline, in 2030 An additional 18% reduction is available using
technologies with increasingly higher costs
Emissions Reduction Potential Assuming full implementation of current technology, emissions in the aerosols
product use sector could be reduced by up to 97 MtCO2e in 2030 This accounts for 2% of the 4,615 MtCO2e in global reduction potential in 2030
21
Abatement MeasuresEmissions reductions by technology in 2030 at $0/tCO2e and at higher prices.
Substitute HC for HFC-134a
Substitute NIK for HFC-152a
Dry Powder Inhalers
Substitute NIK for HFC-134a
Substitute HFO-1234ze for HFC-134a
Substitute HC for HFC-152a
Substitute HFO-1234ze for HFC-152a
Substitute HFC-152a to HFC-134a
0 5 10 15 20 25
Reductions achievable at cost less than $0/tCO2e
Reductions achievable at costs greater than $0/tCO2e
22 23
Energy AgricultureWaste
FireProtection
6 Land�lls
Refrigeration &Air Conditioning
Livestock
IndustrialProcesses
Oil & NaturalGas Systems
Baseline: 59 MtCO2e
Technically Feasibleat Increasing Costs
Residual Emissions
Reductions at No Cost
Reduction Potential
11% 0%
$ $
6
5
3
5
3
4
Australia MexicoPolandChina ROWJapan
Emissions from Top 5 Emitting Countries (MtCO2e)
IndustrialProcesses
AgricultureEnergy Waste Other Non-CO2
Sources Not Modeled
Projected Emissions in 2030
Rest of World: 36 MtCO2e
FireProtection
0.4%
Fire Protection sector baseline emissions are estimated to be 21 MtCO2e in 2010. In 2030,
emissions from this source are projected to be 59 MtCO2e or 0.4% of total non-CO2 emissions.
Global Non-CO2 Emissions
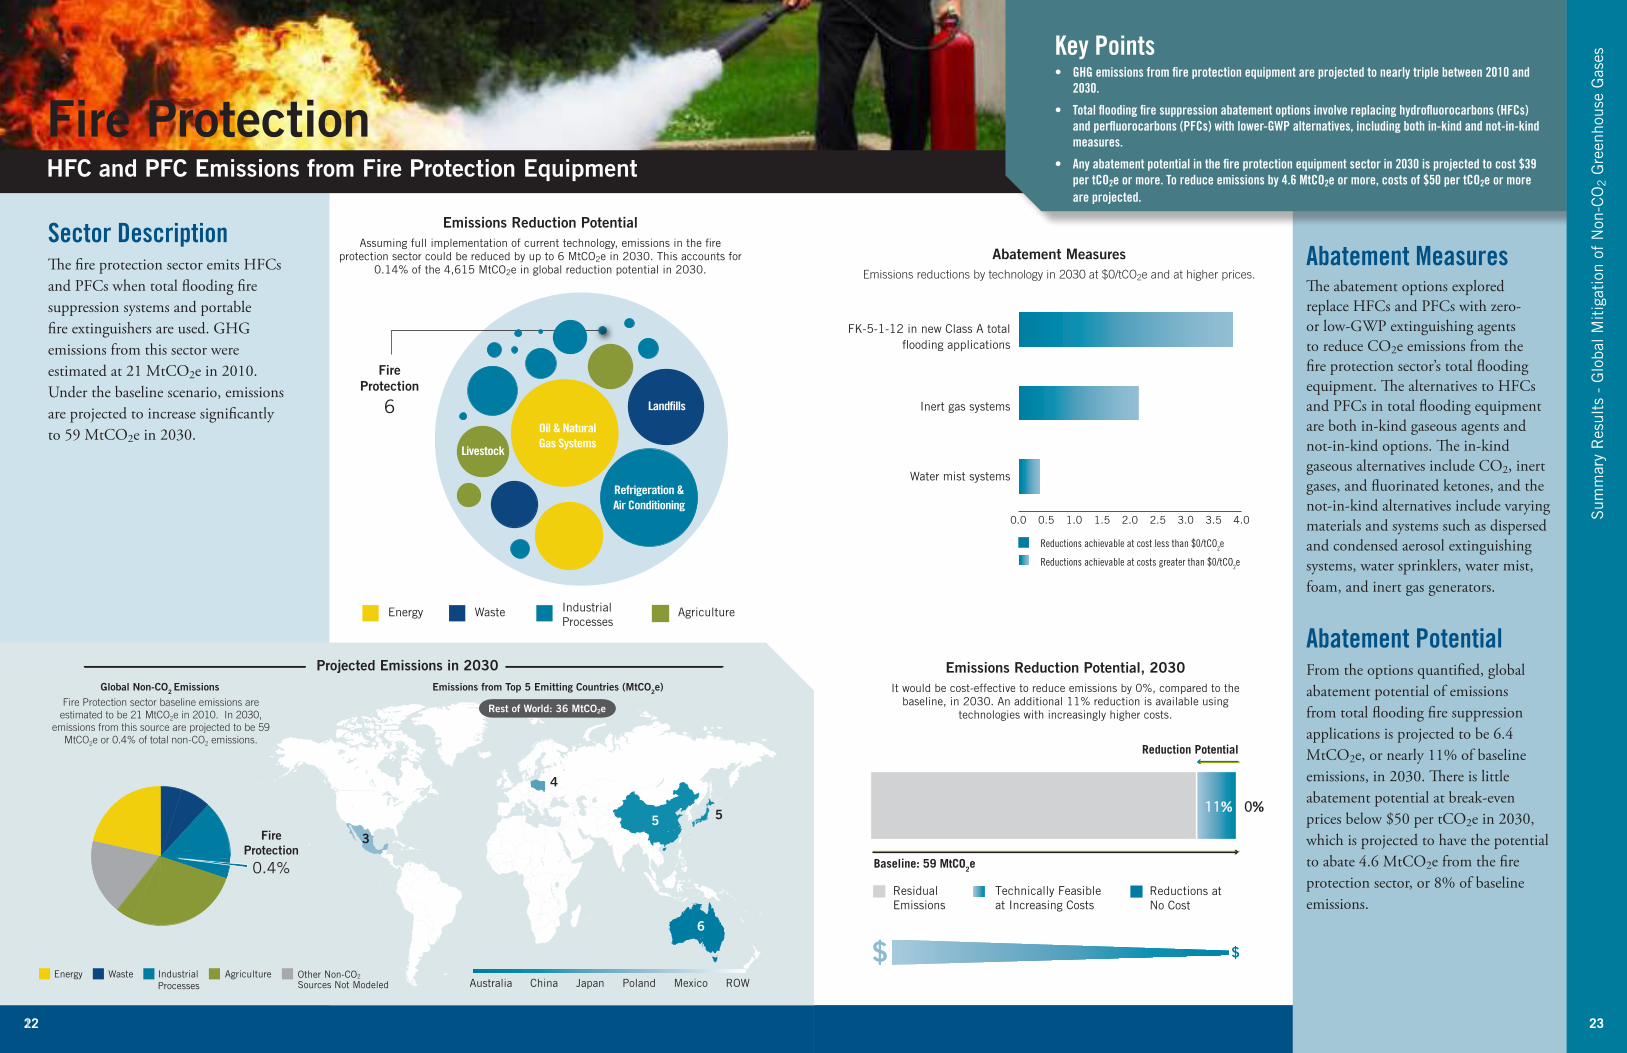
Sector DescriptionThe fire protection sector emits HFCs and PFCs when total flooding fire suppression systems and portable fire extinguishers are used. GHG emissions from this sector were estimated at 21 MtCO2e in 2010. Under the baseline scenario, emissions are projected to increase significantly to 59 MtCO2e in 2030.
1
Sum
mar
y R
esul
ts -
Glo
bal M
itig
atio
n of
Non
-CO
2 G
reen
hous
e G
ases
Abatement MeasuresThe abatement options explored replace HFCs and PFCs with zero- or low-GWP extinguishing agents to reduce CO2e emissions from the fire protection sector’s total flooding equipment. The alternatives to HFCs and PFCs in total flooding equipment are both in-kind gaseous agents and not-in-kind options. The in-kind gaseous alternatives include CO2, inert gases, and fluorinated ketones, and the not-in-kind alternatives include varying materials and systems such as dispersed and condensed aerosol extinguishing systems, water sprinklers, water mist, foam, and inert gas generators.
Abatement Potential From the options quantified, global abatement potential of emissions from total flooding fire suppression applications is projected to be 6.4 MtCO2e, or nearly 11% of baseline emissions, in 2030. There is little abatement potential at break-even prices below $50 per tCO2e in 2030, which is projected to have the potential to abate 4.6 MtCO2e from the fire protection sector, or 8% of baseline emissions.
Key Points• GHG emissions from fire protection equipment are projected to nearly triple between 2010 and
2030.
• Total flooding fire suppression abatement options involve replacing hydrofluorocarbons (HFCs) and perfluorocarbons (PFCs) with lower-GWP alternatives, including both in-kind and not-in-kind measures.
• Any abatement potential in the fire protection equipment sector in 2030 is projected to cost $39 per tCO2e or more. To reduce emissions by 4.6 MtCO2e or more, costs of $50 per tCO2e or more are projected.
Fire ProtectionHFC and PFC Emissions from Fire Protection Equipment
Emissions Reduction Potential, 2030
It would be cost-effective to reduce emissions by 0%, compared to the baseline, in 2030 An additional 11% reduction is available using
technologies with increasingly higher costs
Emissions Reduction Potential Assuming full implementation of current technology, emissions in the fire
protection sector could be reduced by up to 6 MtCO2e in 2030 This accounts for 0 14% of the 4,615 MtCO2e in global reduction potential in 2030
23
Water mist systems
FK-5-1-12 in new Class A total �ooding applications
Inert gas systems
Reductions achievable at cost less than $0/tCO2e
Reductions achievable at costs greater than $0/tCO2e
0.0 0.5 1.0 1.5 2.0 2.5 3.0 3.5 4.0
Abatement MeasuresEmissions reductions by technology in 2030 at $0/tCO2e and at higher prices.

24 25
Energy AgricultureWaste
AluminumProduction
22Land�lls
Refrigeration &Air Conditioning
Livestock
IndustrialProcesses
Oil & NaturalGas Systems
Baseline: 37 MtCO2e
Technically Feasibleat Increasing Costs
Residual Emissions
Reductions at No Cost
Reduction Potential
51% 7%
$ $
418
2
52
1
3
China AustraliaRussiaUnited States ROW
Emissions from Top 5 Emitting Countries (MtCO2e)
IndustrialProcesses
AgricultureEnergy Waste Other Non-CO2
Sources Not Modeled
Projected Emissions in 2030
Rest of World: 9 MtCO2e
Canada
PrimaryAluminumProduction
0.3%
Aluminum Production sector baseline emissions are estimated to be 26 MtCO2e in 2010. In 2030,
emissions from this source are projected to be 37 MtCO2e or 0.3% of total non-CO2emissions.
Global Non-CO2 Emissions
Sector DescriptionThe aluminum production industry produces perfluorocarbon (PFC) emissions during brief process upset conditions in the aluminum smelting process. Despite a decline in global emissions of PFCs from primary aluminum production between 2000 and 2010, baseline emissions are projected to grow by 42%, from 26 MtCO2e in 2010 to 37 MtCO2e in 2030.
1
Sum
mar
y R
esul
ts -
Glo
bal M
itig
atio
n of
Non
-CO
2 G
reen
hous
e G
ases
Abatement Measures Abatement options in the primary aluminum production sector are primarily associated with installing or upgrading process computer control systems and alumina point-feed sys-tem. The options considered involve (1) a minor retrofit to upgrade the process computer control systems and (2) a major retrofit to the process computer control systems coupled with the installation of alumina point-feed systems.
Abatement Potential Global abatement potential in the primary aluminum sector is projected to be 21.6 MtCO2e, or nearly 58% of baseline emissions in 2030. In the absence of any policy incentive to reduce PFC emissions, cost-effective abatement of 2.5 MtCO2e is available. Additional mitigation is feasible with the adoption of more costly mitigation measures. In 2030, mitigation measures with costs less than or equal to $30/tCO2e have the potential to reduce emissions by 17 MtCO2e, or 80% of the total abatement potential.
Key Points• PFC emissions from aluminum production represent the third largest source of fluorinated
greenhouse gas (F-GHG) emissions in the industrial sector.
• Primary abatement measures include installation of or upgrades to process computer control systems and the installation of systems to allow more precise alumina feeding.
• Abatement measures in this sector have the potential to reduce over half of the projected baseline emissions.
Aluminum Production PFC Emissions from Primary Aluminum Production
Emissions Reduction Potential, 2030
It would be cost-effective to reduce emissions by 7%, compared to the baseline, in 2030 An additional 51% reduction is available using
technologies with increasingly higher costs
Emissions Reduction Potential Assuming full implementation of current technology, emissions in the aluminum production sector could be reduced by up to 22 MtCO2e in 2030 This accounts
for 0 47% of the 4,615 MtCO2e in global reduction potential in 2030
0 5 10 15
72
Minor retro�t (process computer control
systems only)
Major retro�t (process computer control
systems + alumina point feeding)
Reductions achievable at cost less than $0/tCO2e
Reductions achievable at costs greater than $0/tCO2e
0 5 10 15
25
Abatement MeasuresEmissions reductions by technology in 2030 at $0/tCO2e and at higher prices.
26 27
Energy AgricultureWaste
HCFC-22Production
255
Land�lls
Refrigeration &Air Conditioning
Livestock
IndustrialProcesses
Oil & NaturalGas Systems
Baseline: 286 MtCO2e
Technically Feasibleat Increasing Costs
Residual Emissions
Reductions at No Cost
Reduction Potential
89% 0%
$ $
China South Korea VenezuelaMexicoIndia ROW
29147
284
5
Emissions from Top 5 Emitting Countries (MtCO2e)
IndustrialProcesses
AgricultureEnergy Waste Other Non-CO2
Sources Not Modeled
Projected Emissions in 2030
Rest of World: 19 MtCO2e
HCFC-22Production
2%
HCFC-22 Production sector baseline emissions are estimated to be 128 MtCO2e in 2010. In 2030,
emissions from this source are projected to be 286 MtCO2e or 2% of total non-CO2 emissions.
Global Non-CO2 Emissions
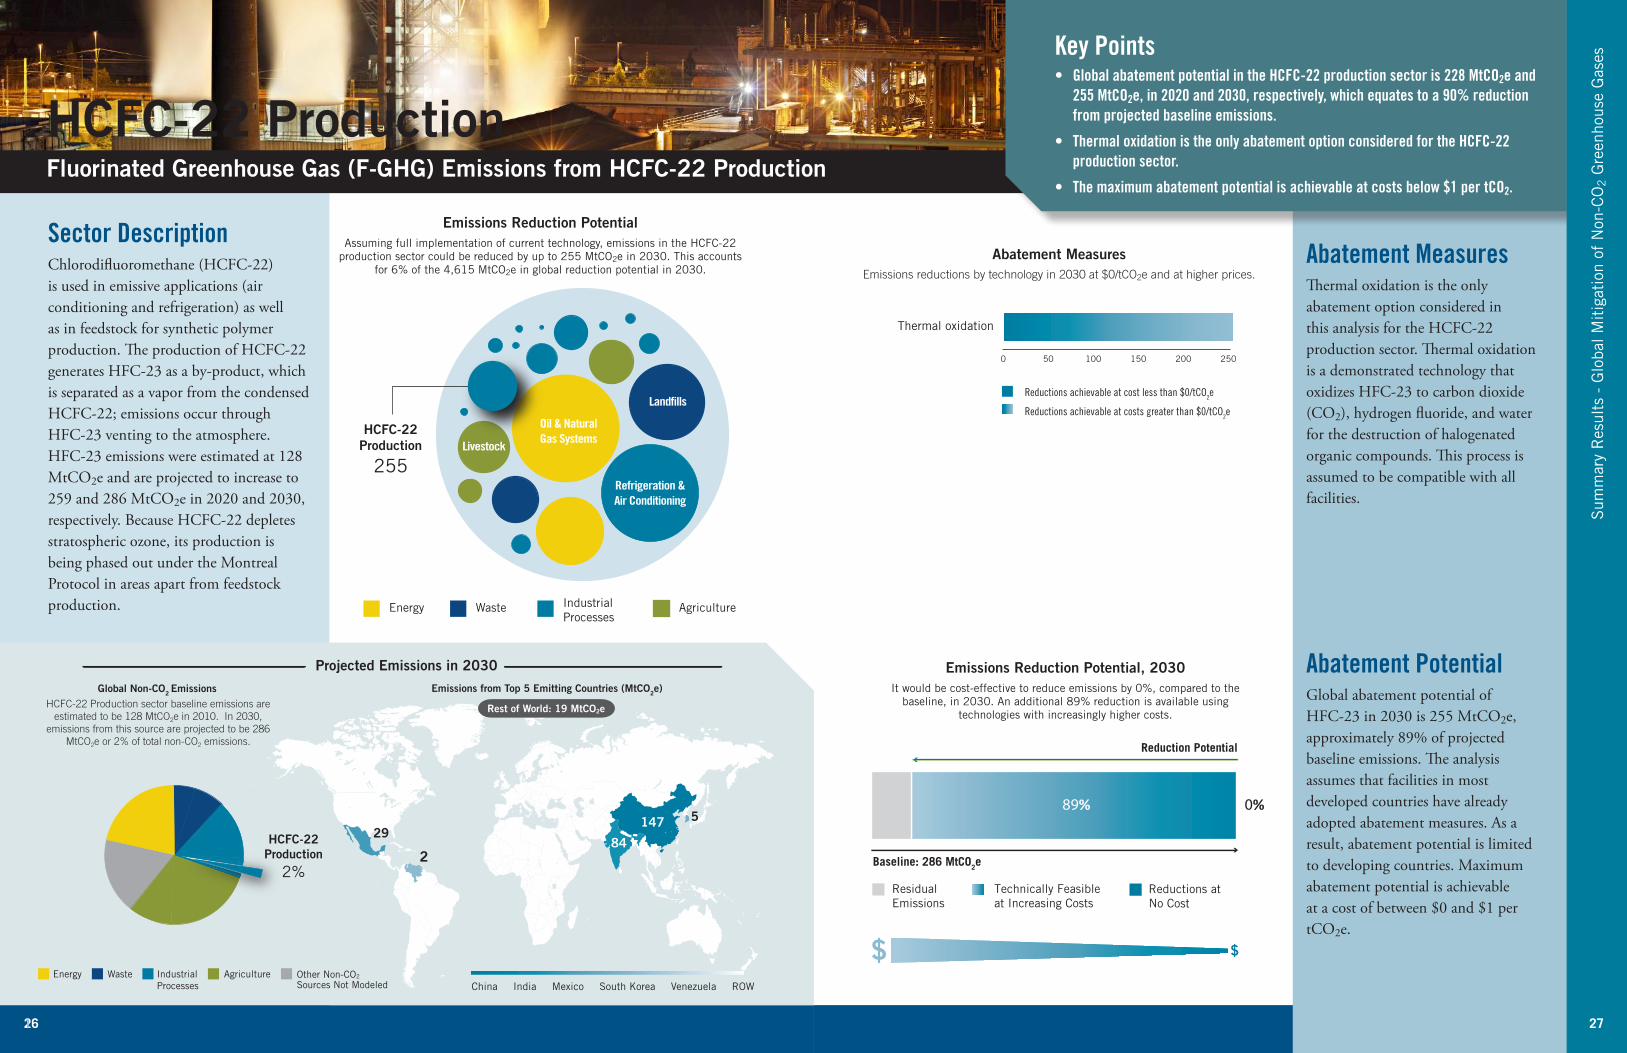
Sector DescriptionChlorodifluoromethane (HCFC-22) is used in emissive applications (air conditioning and refrigeration) as well as in feedstock for synthetic polymer production. The production of HCFC-22 generates HFC-23 as a by-product, which is separated as a vapor from the condensed HCFC-22; emissions occur through HFC-23 venting to the atmosphere. HFC-23 emissions were estimated at 128 MtCO2e and are projected to increase to 259 and 286 MtCO2e in 2020 and 2030, respectively. Because HCFC-22 depletes stratospheric ozone, its production is being phased out under the Montreal Protocol in areas apart from feedstock production.
1
Sum
mar
y R
esul
ts -
Glo
bal M
itig
atio
n of
Non
-CO
2 G
reen
hous
e G
ases
Abatement Measures Thermal oxidation is the only abatement option considered in this analysis for the HCFC-22 production sector. Thermal oxidation is a demonstrated technology that oxidizes HFC-23 to carbon dioxide (CO2), hydrogen fluoride, and water for the destruction of halogenated organic compounds. This process is assumed to be compatible with all facilities.
Abatement Potential Global abatement potential of HFC-23 in 2030 is 255 MtCO2e, approximately 89% of projected baseline emissions. The analysis assumes that facilities in most developed countries have already adopted abatement measures. As a result, abatement potential is limited to developing countries. Maximum abatement potential is achievable at a cost of between $0 and $1 per tCO2e.
Key Points• Global abatement potential in the HCFC-22 production sector is 228 MtCO2e and
255 MtCO2e, in 2020 and 2030, respectively, which equates to a 90% reduction from projected baseline emissions.
• Thermal oxidation is the only abatement option considered for the HCFC-22 production sector.
• The maximum abatement potential is achievable at costs below $1 per tCO2.
HCFC-22 Production Fluorinated Greenhouse Gas (F-GHG) Emissions from HCFC-22 Production
Emissions Reduction Potential, 2030
It would be cost-effective to reduce emissions by 0%, compared to the baseline, in 2030 An additional 89% reduction is available using
technologies with increasingly higher costs
Emissions Reduction Potential Assuming full implementation of current technology, emissions in the HCFC-22
production sector could be reduced by up to 255 MtCO2e in 2030 This accounts for 6% of the 4,615 MtCO2e in global reduction potential in 2030
0 50 100 150 200 250
Thermal oxidation
Reductions achievable at cost less than $0/tCO2e
Reductions achievable at costs greater than $0/tCO2e
27
Abatement MeasuresEmissions reductions by technology in 2030 at $0/tCO2e and at higher prices.
28 29
Energy AgricultureWaste
SemiconductorManufacturing
4Land�lls
Refrigeration &Air Conditioning
Livestock
IndustrialProcesses
Oil & NaturalGas Systems
Baseline: 22 MtCO2e
Technically Feasibleat Increasing Costs
Residual Emissions
Reductions at No Cost
Reduction Potential
19% 1%
$ $
China JapanUnited States South KoreaSingapore
45
52
3
14
ROW
Emissions from Top 5 Emitting Countries (MtCO2e)
IndustrialProcesses
AgricultureEnergy Waste Other Non-CO2
Sources Not Modeled
Projected Emissions in 2030
Rest of World: 4 MtCO2e
SemiconductorManufacturing
0.2%
Semiconductor Manufacturing sector baseline emissions are estimated to be 18 MtCO2e in 2010.
In 2030, emissions from this source are projected to be 22 MtCO2e or 0.2% of total non-CO2 emissions.
Global Non-CO2 Emissions
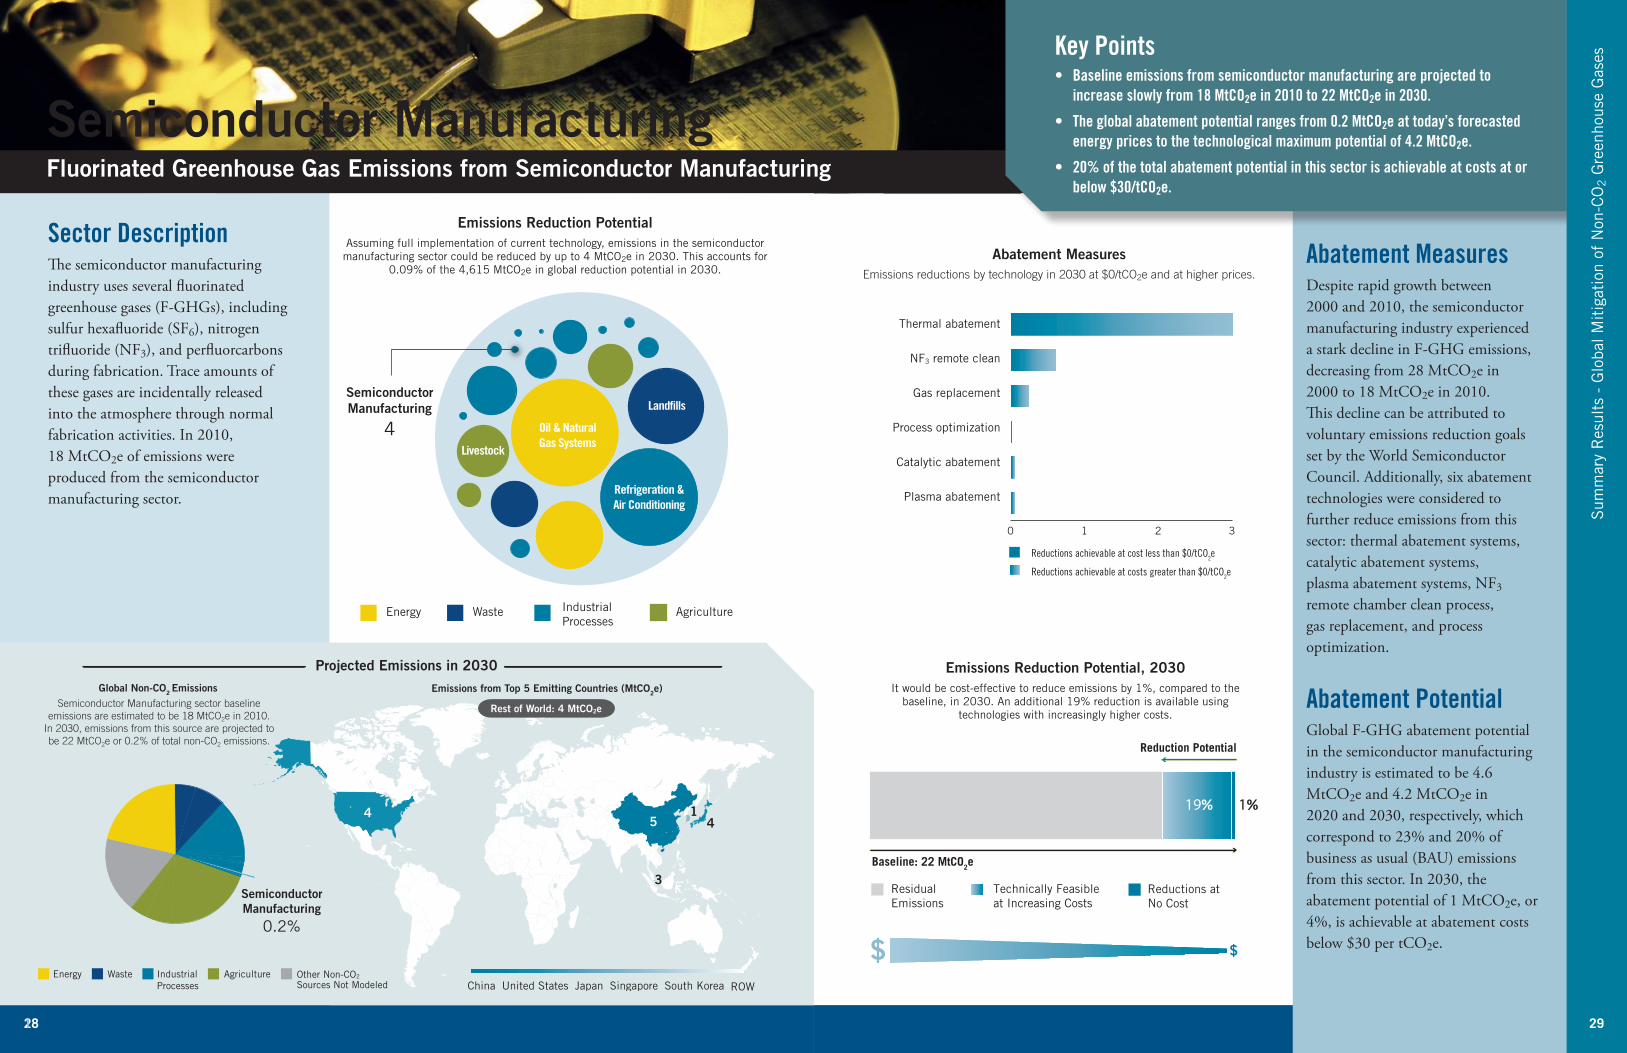
Sector DescriptionThe semiconductor manufacturing industry uses several fluorinated greenhouse gases (F-GHGs), including sulfur hexafluoride (SF6), nitrogen trifluoride (NF3), and perfluorcarbons during fabrication. Trace amounts of these gases are incidentally released into the atmosphere through normal fabrication activities. In 2010, 18 MtCO2e of emissions were produced from the semiconductor manufacturing sector.
1
Sum
mar
y R
esul
ts -
Glo
bal M
itig
atio
n of
Non
-CO
2 G
reen
hous
e G
ases
Abatement MeasuresDespite rapid growth between 2000 and 2010, the semiconductor manufacturing industry experienced a stark decline in F-GHG emissions, decreasing from 28 MtCO2e in 2000 to 18 MtCO2e in 2010. This decline can be attributed to voluntary emissions reduction goals set by the World Semiconductor Council. Additionally, six abatement technologies were considered to further reduce emissions from this sector: thermal abatement systems, catalytic abatement systems, plasma abatement systems, NF3 remote chamber clean process, gas replacement, and process optimization.
Abatement PotentialGlobal F-GHG abatement potential in the semiconductor manufacturing industry is estimated to be 4.6 MtCO2e and 4.2 MtCO2e in 2020 and 2030, respectively, which correspond to 23% and 20% of business as usual (BAU) emissions from this sector. In 2030, the abatement potential of 1 MtCO2e, or 4%, is achievable at abatement costs below $30 per tCO2e.
Key Points• Baseline emissions from semiconductor manufacturing are projected to
increase slowly from 18 MtCO2e in 2010 to 22 MtCO2e in 2030.
• The global abatement potential ranges from 0.2 MtCO2e at today’s forecasted energy prices to the technological maximum potential of 4.2 MtCO2e.
• 20% of the total abatement potential in this sector is achievable at costs at or below $30/tCO2e.
Semiconductor Manufacturing Fluorinated Greenhouse Gas Emissions from Semiconductor Manufacturing
Emissions Reduction Potential, 2030
It would be cost-effective to reduce emissions by 1%, compared to the baseline, in 2030 An additional 19% reduction is available using
technologies with increasingly higher costs
Emissions Reduction Potential Assuming full implementation of current technology, emissions in the semiconductor manufacturing sector could be reduced by up to 4 MtCO2e in 2030 This accounts for
0 09% of the 4,615 MtCO2e in global reduction potential in 2030
29
Thermal abatement
NF3 remote clean
Gas replacement
Process optimization
Catalytic abatement
Plasma abatement
Reductions achievable at cost less than $0/tCO2e
Reductions achievable at costs greater than $0/tCO2e
0 1 2 3
Abatement MeasuresEmissions reductions by technology in 2030 at $0/tCO2e and at higher prices.
30 31
Energy AgricultureWaste
Electric PowerSystems
43Land�lls
Refrigeration &Air Conditioning
Livestock
IndustrialProcesses
Oil & NaturalGas Systems
Baseline: 64 MtCO2e
Technically Feasibleat Increasing Costs
Residual Emissions
Reductions at No Cost
Reduction Potential
12%55%
$ $
China South KoreaBrazilIndiaUnited States ROW
1026
4
2
3
Emissions from Top 5 Emitting Countries (MtCO2e)
IndustrialProcesses
AgricultureEnergy Waste Other Non-CO2
Sources Not Modeled
Projected Emissions in 2030
Rest of World: 18 MtCO2e
ElectricPower Systems
0.5%
The Electric Power Systems sector baseline emissions are estimated to be 44 MtCO2e in 2010.
In 2030, emissions from this source are projected to be 64 MtCO2e or 0.5% of total non-CO2 emissions.
Global Non-CO2 Emissions
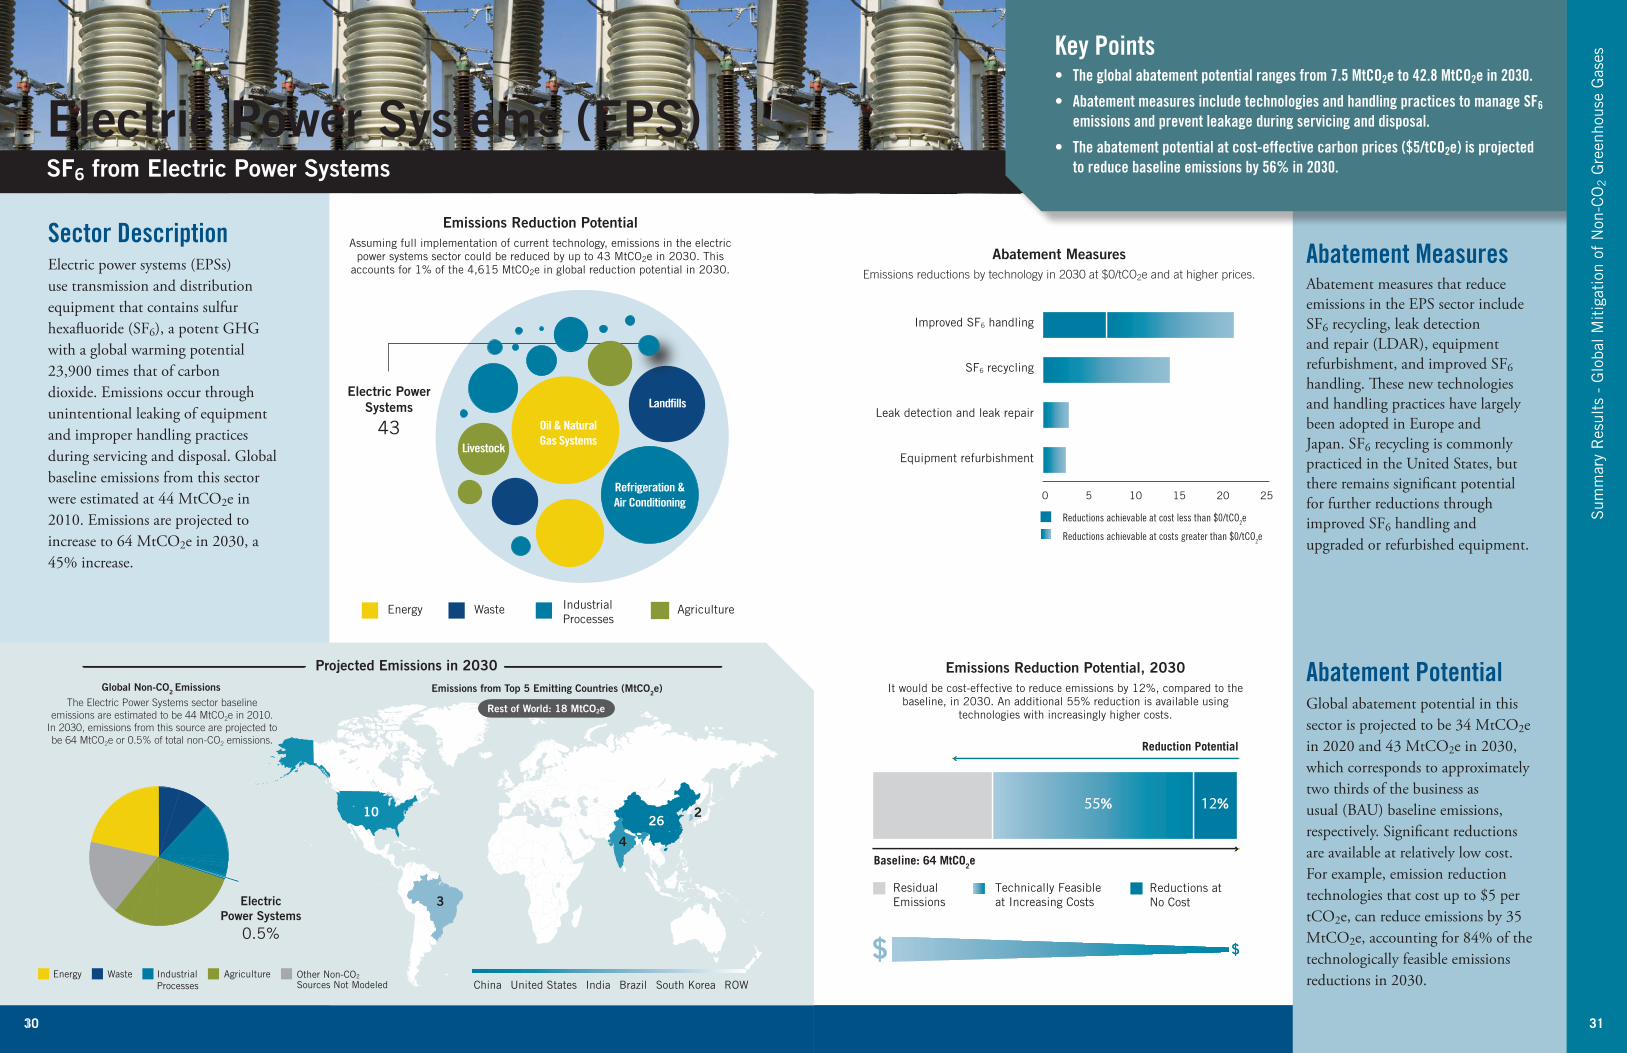
Sector DescriptionElectric power systems (EPSs) use transmission and distribution equipment that contains sulfur hexafluoride (SF6), a potent GHG with a global warming potential 23,900 times that of carbon dioxide. Emissions occur through unintentional leaking of equipment and improper handling practices during servicing and disposal. Global baseline emissions from this sector were estimated at 44 MtCO2e in 2010. Emissions are projected to increase to 64 MtCO2e in 2030, a 45% increase.
1
Sum
mar
y R
esul
ts -
Glo
bal M
itig
atio
n of
Non
-CO
2 G
reen
hous
e G
ases
Abatement Measures Abatement measures that reduce emissions in the EPS sector include SF6 recycling, leak detection and repair (LDAR), equipment refurbishment, and improved SF6 handling. These new technologies and handling practices have largely been adopted in Europe and Japan. SF6 recycling is commonly practiced in the United States, but there remains significant potential for further reductions through improved SF6 handling and upgraded or refurbished equipment.
Abatement Potential Global abatement potential in this sector is projected to be 34 MtCO2e in 2020 and 43 MtCO2e in 2030, which corresponds to approximately two thirds of the business as usual (BAU) baseline emissions, respectively. Significant reductions are available at relatively low cost. For example, emission reduction technologies that cost up to $5 per tCO2e, can reduce emissions by 35 MtCO2e, accounting for 84% of the technologically feasible emissions reductions in 2030.
Key Points• The global abatement potential ranges from 7.5 MtCO2e to 42.8 MtCO2e in 2030.
• Abatement measures include technologies and handling practices to manage SF6 emissions and prevent leakage during servicing and disposal.
• The abatement potential at cost-effective carbon prices ($5/tCO2e) is projected to reduce baseline emissions by 56% in 2030.
Electric Power Systems (EPS) SF6 from Electric Power Systems
Emissions Reduction Potential, 2030
It would be cost-effective to reduce emissions by 12%, compared to the baseline, in 2030 An additional 55% reduction is available using
technologies with increasingly higher costs
Emissions Reduction Potential Assuming full implementation of current technology, emissions in the electric
power systems sector could be reduced by up to 43 MtCO2e in 2030 This accounts for 1% of the 4,615 MtCO2e in global reduction potential in 2030
Improved SF6 handling
SF6 recycling
Leak detection and leak repair
Equipment refurbishment
0 5 10 15 20 25
Reductions achievable at cost less than $0/tCO2e
Reductions achievable at costs greater than $0/tCO2e
31
Abatement MeasuresEmissions reductions by technology in 2030 at $0/tCO2e and at higher prices.

32 33
Alternate cover gas - NovecTM612
Alternate cover gas - HFC-134a
Alternate cover gas - SO2
0.0 0.5 1.0 1.5 2.0 2.5
Reductions achievable at cost less than $0/tCO2e
Reductions achievable at costs greater than $0/tCO2e
Energy AgricultureWaste
MagnesiumProduction
5
Land�lls
Refrigeration &Air Conditioning
Livestock
IndustrialProcesses
Oil & NaturalGas Systems
Baseline: 5 MtCO2e
Technically Feasibleat Increasing Costs
Residual Emissions
Reductions at No Cost
Reduction Potential
97%1%
$ $
China Russia Kazakhstan UkraineIsrael ROW
Emissions from Top 5 Emitting Countries (MtCO2e)
IndustrialProcesses
AgricultureEnergy Waste Other Non-CO2
Sources Not Modeled
Projected Emissions in 2030
MagnesiumProduction
0.04%
The Magnesium Production sector baseline emissions are estimated to be 5 MtCO2e in 2010. In 2030, emissions from this source are projected to be 5 MtCO2e or 0.04% of total non-CO2 emissions.
Global Non-CO2 Emissions
1.60
2.31
0.58
0.56
0.10
Rest of World: 0.08 MtCO2e
Sector DescriptionMagnesium production uses sulfur hexafluoride (SF6) as a cover gas during production and casting to prevent spontaneous combustion of molten magnesium in the presence of air. The use of SF6 can result in fugitive emissions during manufacturing processes. Advanced initiatives in the magnesium industry to phase out the use of SF6 have resulted in a 50% reduction in global SF6 emissions from 10 MtCO2e to 5 MtCO2e between 2000 and 2010.
1
Sum
mar
y R
esul
ts -
Glo
bal M
itig
atio
n of
Non
-CO
2 G
reen
hous
e G
ases
Abatement MeasuresThree abatement measures are available for reducing SF6 emissions in production and processing, all of which involve replacing SF6 with an alternative cover gas: SO2, HFC-134a, or Novec 612. Although toxicity, odor, and corrosive properties are a concern of using SO2 as a cover gas, it can potentially eliminate SF6 emissions entirely through improved containment and pollution control systems. HFC-134a, along with other fluorinated gas, contains fewer associated health, odor, and corrosive impacts than SO2, but it does have global warming potential. Novec 612 is currently being used in a diecasting facility, and the replacement of SF6 with Novec 612 is under evaluation.
Abatement PotentialThe global abatement potential of SF6 emissions in the magnesium sector is 5 MtCO2e, approximately 98% of projected emissions. The maximum reduction potential for the suite of reduction technologies is 98% of projected emissions in 2030. These reductions can be achieved at a cost of less than $5/tCO2e.
Key Points• The global abatement potential of 98% is achieved through three abatement
measures that substitute SF6 with alternative gases.
• From 2010 to 2030, SF6 emissions are projected to stay in the range of 5 MtCO2e.
• Full abatement potential can be achieved at break-even prices of $5/tCO2e or less.
Magnesium Production SF6 Emissions from Magnesium Production
Emissions Reduction Potential, 2030
It would be cost-effective to reduce emissions by 97%, compared to the baseline, in 2030 An additional 1% reduction is available using
technologies with increasingly higher costs
Emissions Reduction Potential Assuming full implementation of current technology, emissions in the magnesium production sector could be reduced by up to 5 MtCO2e in 2030 This accounts for
0 11% of the 4,615 MtCO2e in global reduction potential in 2030
33
Abatement MeasuresEmissions reductions by technology in 2030 at $0/tCO2e and at higher prices.
34 35
NF3 remote clean
Thermal abatement
Catalytic abatement
Plasma abatement
0.0 0.2 0.4 0.6 0.8 1.0 1.2
Reductions achievable at cost less than $0/tCO2e
Reductions achievable at costs greater than $0/tCO2e
Energy AgricultureWaste
PhotovoltaicCell
Manufacturing
2Land�lls
Refrigeration &Air Conditioning
Livestock
IndustrialProcesses
Oil & NaturalGas Systems
Baseline: 2 MtCO2e
Technically Feasibleat Increasing Costs
Residual Emissions
Reductions at No Cost
Reduction Potential
0%90%
$ $
1
1.22
0.09
0.19
0.06
0.02
China Malaysia South KoreaGermanyJapan ROW
Emissions from Top 5 Emitting Countries (MtCO2e)
IndustrialProcesses
AgricultureEnergy Waste Other Non-CO2
Sources Not Modeled
Projected Emissions in 2030
Rest of World: 0.29 MtCO2e
PhotovoltaicCell Manufacturing
0.01%
The Photovoltaic Cell Manufacturing sector baseline emissions are estimated to be 2 MtCO2e in 2010. In
2030, emissions from this source are projected to be 2 MtCO2e or 0.01% of total non-CO2 emissions.
Global Non-CO2 Emissions
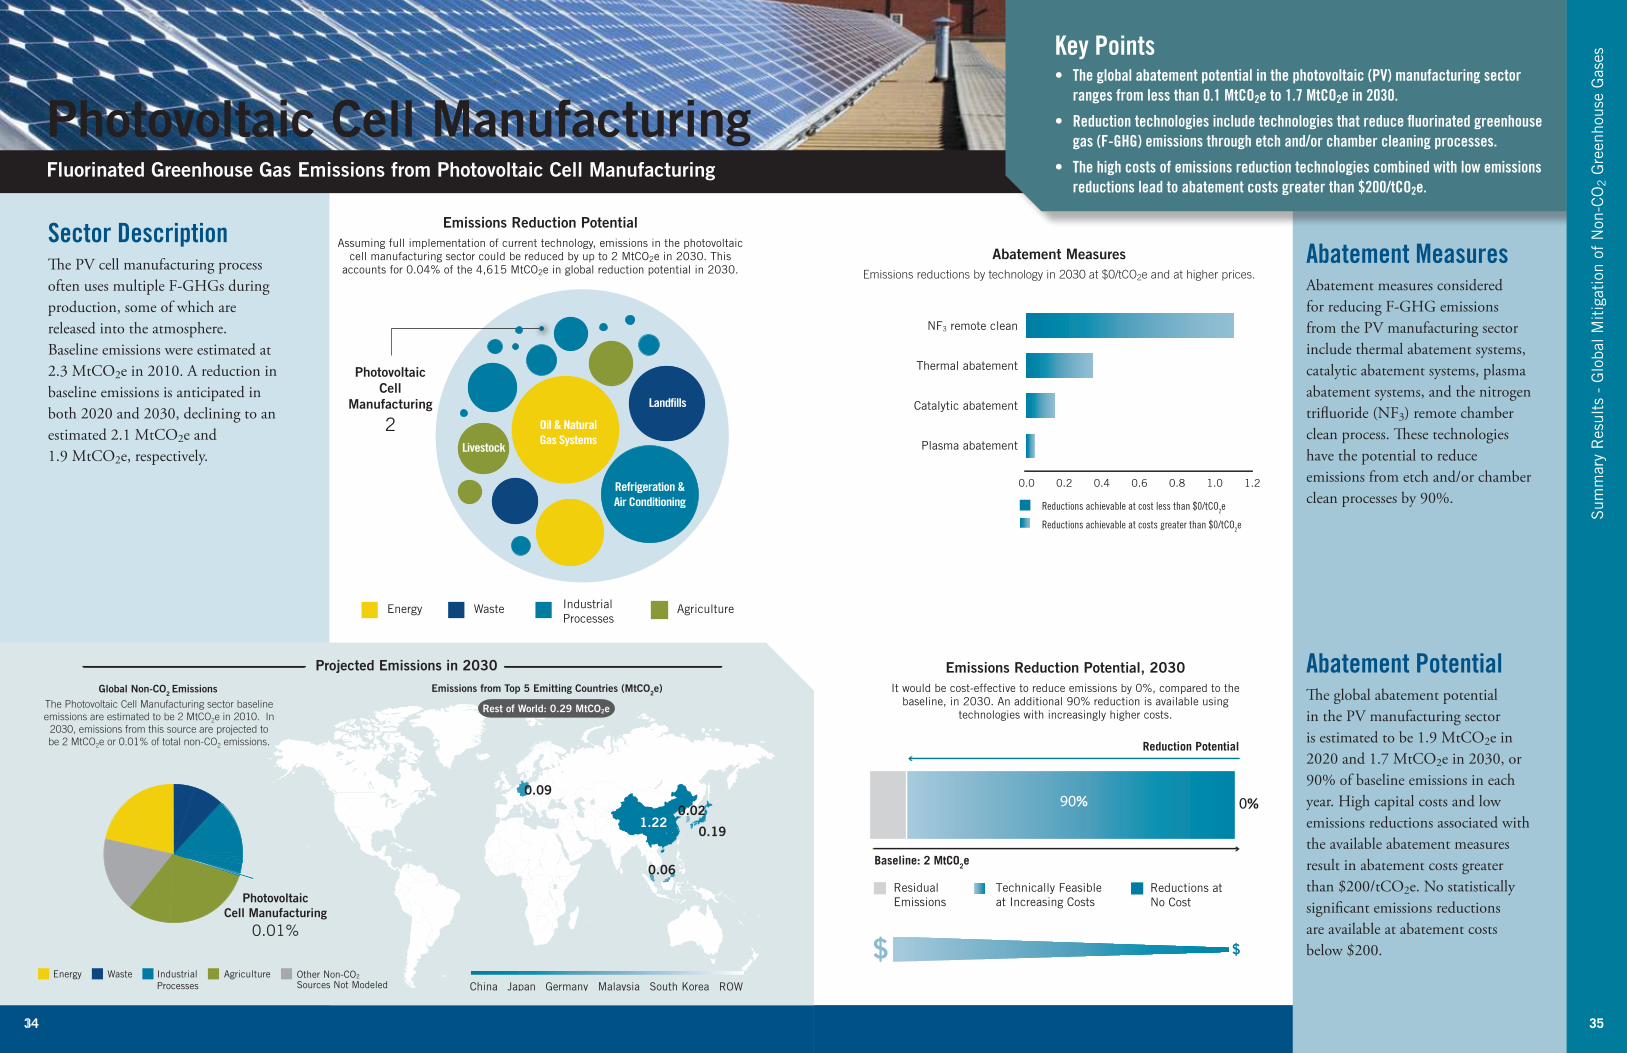
Sector DescriptionThe PV cell manufacturing process often uses multiple F-GHGs during production, some of which are released into the atmosphere. Baseline emissions were estimated at 2.3 MtCO2e in 2010. A reduction in baseline emissions is anticipated in both 2020 and 2030, declining to an estimated 2.1 MtCO2e and 1.9 MtCO2e, respectively.
1
Sum
mar
y R
esul
ts -
Glo
bal M
itig
atio
n of
Non
-CO
2 G
reen
hous
e G
ases
Abatement MeasuresAbatement measures considered for reducing F-GHG emissions from the PV manufacturing sector include thermal abatement systems, catalytic abatement systems, plasma abatement systems, and the nitrogen trifluoride (NF3) remote chamber clean process. These technologies have the potential to reduce emissions from etch and/or chamber clean processes by 90%.
Abatement PotentialThe global abatement potential in the PV manufacturing sector is estimated to be 1.9 MtCO2e in 2020 and 1.7 MtCO2e in 2030, or 90% of baseline emissions in each year. High capital costs and low emissions reductions associated with the available abatement measures result in abatement costs greater than $200/tCO2e. No statistically significant emissions reductions are available at abatement costs below $200.
Key Points• The global abatement potential in the photovoltaic (PV) manufacturing sector
ranges from less than 0.1 MtCO2e to 1.7 MtCO2e in 2030.
• Reduction technologies include technologies that reduce fluorinated greenhouse gas (F-GHG) emissions through etch and/or chamber cleaning processes.
• The high costs of emissions reduction technologies combined with low emissions reductions lead to abatement costs greater than $200/tCO2e.
Photovoltaic Cell Manufacturing Fluorinated Greenhouse Gas Emissions from Photovoltaic Cell Manufacturing
Emissions Reduction Potential, 2030
It would be cost-effective to reduce emissions by 0%, compared to the baseline, in 2030 An additional 90% reduction is available using
technologies with increasingly higher costs
Emissions Reduction Potential Assuming full implementation of current technology, emissions in the photovoltaic
cell manufacturing sector could be reduced by up to 2 MtCO2e in 2030 This accounts for 0 04% of the 4,615 MtCO2e in global reduction potential in 2030
35
Abatement MeasuresEmissions reductions by technology in 2030 at $0/tCO2e and at higher prices.
36 37
Thermal abatement
NF3 remote clean
Catalytic abatement
Central abatement system
Plasma abatement
Gas replacement
0 1 2 3 4 5
Reductions achievable at cost less than $0/tCO2e
Reductions achievable at costs greater than $0/tCO2e
Energy AgricultureWaste
Flat PanelDisplay
Manufacturing
10 Land�lls
Refrigeration &Air Conditioning
Livestock
IndustrialProcesses
Oil & NaturalGas Systems
0 100 200 300 400 500 600 700
0 10 20 30 40 50 60 70 80 90 100
0 10 20 30 40 50 60 70 80 90 100
2 90% 0%
Baseline: 2 MtCO2e
Technically Feasibleat Increasing Costs
Residual Emissions
Reductions at No Cost
Reduction Potential
80% 0%
$ $
1
5.90.5
0.1
5.6
ROW
Emissions from Top 5 Emitting Countries (MtCO2e)
IndustrialProcesses
AgricultureEnergy Waste Other Non-CO2
Sources Not Modeled
Projected Emissions in 2030
Rest of World: 0.0 MtCO2eThe Flat Panel Display Manufacturing sector
baseline emissions are estimated to be 7 MtCO2e in 2010. In 2030, emissions from this source are
projected to be 12 MtCO2e or 0.1% of total non-CO2 emissions.
Global Non-CO2 Emissions
China SingaporeSouth Korea Japan
Flat PanelDisplay
Manufacturing
0.1%
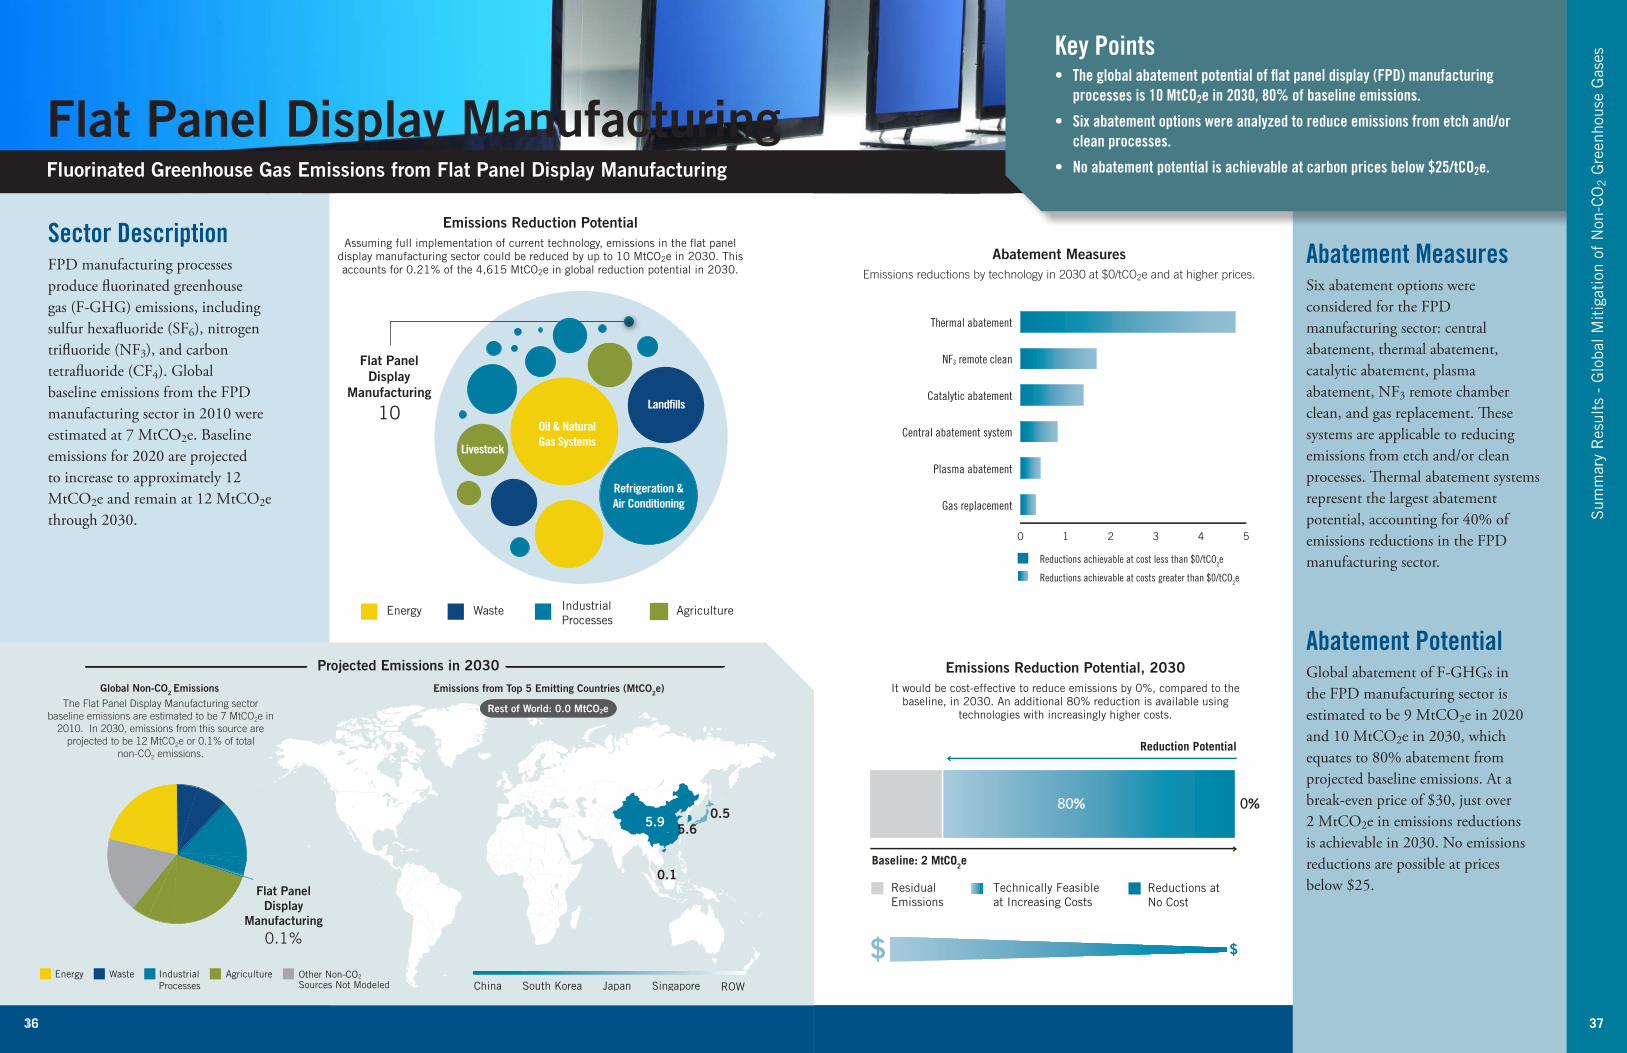
Sector DescriptionFPD manufacturing processes produce fluorinated greenhouse gas (F-GHG) emissions, including sulfur hexafluoride (SF6), nitrogen trifluoride (NF3), and carbon tetrafluoride (CF4). Global baseline emissions from the FPD manufacturing sector in 2010 were estimated at 7 MtCO2e. Baseline emissions for 2020 are projected to increase to approximately 12 MtCO2e and remain at 12 MtCO2e through 2030.
1
Sum
mar
y R
esul
ts -
Glo
bal M
itig
atio
n of
Non
-CO
2 G
reen
hous
e G
ases
Abatement Measures Six abatement options were considered for the FPD manufacturing sector: central abatement, thermal abatement, catalytic abatement, plasma abatement, NF3 remote chamber clean, and gas replacement. These systems are applicable to reducing emissions from etch and/or clean processes. Thermal abatement systems represent the largest abatement potential, accounting for 40% of emissions reductions in the FPD manufacturing sector.
Abatement Potential Global abatement of F-GHGs in the FPD manufacturing sector is estimated to be 9 MtCO2e in 2020 and 10 MtCO2e in 2030, which equates to 80% abatement from projected baseline emissions. At a break-even price of $30, just over 2 MtCO2e in emissions reductions is achievable in 2030. No emissions reductions are possible at prices below $25.
Key Points• The global abatement potential of flat panel display (FPD) manufacturing
processes is 10 MtCO2e in 2030, 80% of baseline emissions.
• Six abatement options were analyzed to reduce emissions from etch and/or clean processes.
• No abatement potential is achievable at carbon prices below $25/tCO2e.
Flat Panel Display Manufacturing Fluorinated Greenhouse Gas Emissions from Flat Panel Display Manufacturing
Emissions Reduction Potential, 2030
It would be cost-effective to reduce emissions by 0%, compared to the baseline, in 2030 An additional 80% reduction is available using
technologies with increasingly higher costs
Emissions Reduction Potential Assuming full implementation of current technology, emissions in the flat panel
display manufacturing sector could be reduced by up to 10 MtCO2e in 2030 This accounts for 0 21% of the 4,615 MtCO2e in global reduction potential in 2030
37
Abatement MeasuresEmissions reductions by technology in 2030 at $0/tCO2e and at higher prices.

38 39
United StatesIndia Brazil PakistanChina
Livestock
21%
186 278
344
246
122
ROW
Emissions from Top 5 Emitting Countries (MtCO2e)
IndustrialProcesses
AgricultureEnergy Waste Other Non-CO2
Sources Not Modeled
Projected Emissions in 2030
Rest of World: 1,553 MtCO2eThe Livestock sector baseline emissions are
estimated to be 2,286 MtCO2e in 2010. In 2030, emissions from this source are projected to be
2,729 MtCO2e or 21% of total non-CO2 emissions.
Global Non-CO2 Emissions
Antimethanogen
Propionate precursors
Improved feed conversion
Large-scale complete mix digesterwith engine
Large-scale covered lagoon with engine
Large-scale complete mix digesterwithout engine
Large-scale covered lagoon without engine
Intensive grazing
Antibiotics
Large-scale �xed-�lm digester with engine
Large-scale �xed-�lm digesterwithout engine
Other measures
0 10 20 30 40 50 60 70
Reductions achievable at cost less than $0/tCO2e
Reductions achievable at costs greater than $0/tCO2e
Energy IndustrialProcesses
AgricultureWaste
Livestock
269
Land�lls
Oil & NaturalGas Systems
Refrigeration &Air Conditioning
Livestock
Baseline: 2,729 MtCO2e
Technically Feasibleat Increasing Costs
Residual Emissions
Reductions at No Cost
Reduction Potential
3%7%
$ $
Sector DescriptionLivestock operations generate methane (CH4) and nitrous oxide (N2O) emissions. The greenhouse gas (GHG) emissions mainly come from two sources: enteric fermentation and manure management. Methane is produced as a by-product of the digestive process in animals through a microbial fermentation process. Manure N2O emissions result from nitrification and denitrification of the nitrogen that is excreted in manure and urine. Global baseline emissions from the livestock sector were estimated to grow from 2,202 to 2,729 MtCO2e from 2010 to 2030.
Sum
mar
y R
esul
ts -
Glo
bal M
itig
atio
n of
Non
-CO
2 G
reen
hous
e G
ases
Abatement Measures The report considered six enteric fermentation (CH4) abatement measures: improved feed conversion efficiency, antibiotics, bovine soma-trotropin (bST), propionate precur-sors, antimethanogen vaccines, and intensive pasture management. It also included two manure management (N2O) abatement measures: small and large digesters (complete-mix, plug-flow, fixed film) and covered lagoons. The largest reductions resulted from implementation of antimethanogen vaccines, propionate precursors, and small digesters.
Abatement Potential Technologically feasible global abatement potential for the livestock sector was estimated at 267 MtCO2e in 2030, a 10% reduction compared to the baseline. In 2030, a reduction of 58 MtCO2e is cost-effective under current projections and 162 MtCO2e would be possible at an abatement cost of $30/tCO2e.
Key Points• The livestock sector accounts for 21% of baseline non-CO2 emissions in 2030.
• The largest low-cost reductions in emissions resulted from implementation of strategies to improve feed conversion efficiency, incorporate feed supplements, and increase the use of small-scale anaerobic digesters.
• The technologically feasible abatement potential of the livestock sector is 267 MtCO2e in 2030, 10% of baseline emissions.
Livestock Emissions from Livestock Operations
Emissions Reduction Potential, 2030
It would be cost-effective to reduce emissions by 3%, compared to the baseline, in 2030 An additional 7% reduction is available using
technologies with increasingly higher costs
Emissions Reduction Potential Assuming full implementation of current technology, emissions in the livestock
sector could be reduced by up to 269 MtCO2e in 2030 This accounts for 6% of the 4,615 MtCO2e in global reduction potential in 2030
39
Abatement MeasuresEmissions reductions by technology in 2030 at $0/tCO2e and at higher prices.

40 41
India Indonesia VietnamChinaBangladesh ROW
77
86165
92
162
Emissions from Top 5 Emitting Countries (MtCO2e)
IndustrialProcesses
AgricultureEnergy Waste Other Non-CO2
Sources Not Modeled
Projected Emissions in 2030
Rest of World: 176 MtCO2e
Rice
6%
The Rice Cultivation sector baseline emissions are estimated to be 565 MtCO2e in 2010. In 2030, emissions from this source are projected to be 756 MtCO2e or 6% of total non-CO2 emissions.
Global Non-CO2 Emissions
Mid-season drainage with 50% residue incorporation and 30% reduced fertilizer usage
Switch CF to dry land with 50% residue incorporation
Switch CF to Mid-season drainage with 100% residue incorporation
Switch CF to Mid-season drainage with 50% residue and 30% reduced fertilizer usage
Switch CF to dry land with 50% residue and 20% reduced fertilizer usage
Switch from RF to base with 50% residue incorporation and auto-fertilization
Switch Rain-fed to CF with 50% residue incorporation and use of nitrogen inhibitors
Switch from CF to Mid-season drainage use of slow release fertilizer
Switch Rain-fed to CF with 50% residue incorporation and no tillage
Switch from CF to Mid-season drainage with 50% residue and dry-seeding
Switch Mid-season drainage to AWD with 50% residue incorporation and use of nitrogen inhibitors
Switch from CF to Mid-season drainage with no till practices
0 3 6 9 1216.2086.91
4
11
Reductions achievable at cost less than $0/tCO2e
Reductions achievable at costs greater than $0/tCO2e
Other measures
Energy AgricultureWaste
Rice
200Land�lls
Refrigeration &Air Conditioning
Livestock
IndustrialProcesses
Oil & NaturalGas Systems
Baseline: 756 MtCO2e
Technically Feasibleat Increasing Costs
Residual Emissions
Reductions at No Cost
Reduction Potential
8%18%
$ $
Sector DescriptionRice cultivation is a source of methane (CH4) and nitrous oxide (N2O) emissions, and changes in soil organic carbon (C) stocks. When paddy fields are flooded, decomposition of organic material depletes the oxygen in the soil and floodwater, causing anaerobic conditions. Human activities influence soil N2O emissions (use of fertilizers and other crop management practices) and soil C stocks (residue and crop yield management). Global baseline emissions from the rice cultivation sector were estimated to grow from 565 to 756 MtCO2e from 2010 to 2030.
Sum
mar
y R
esul
ts -
Glo
bal M
itig
atio
n of
Non
-CO
2 G
reen
hous
e G
ases
Abatement MeasuresFive types of abatement measures were considered: paddy flooding (continuous, mid-season, alternating, dry), crop residue incorporation (50% and 100%), tillage (conventional and no-till), fertilization application (conventional, ammonium sulfate, nitrification inhibitor, slow-release, reduced use, auto fertilization), and direct seeding. Switching to dry-land production provides the largest emissions reductions, though it results in major reductions in rice yield.
Abatement PotentialTechnologically feasible global abatement potential for the rice cultivation sector was estimated at 203 MtCO2e in 2020 and 200 MtCO2e in 2030, 28% and 26% reductions compared to the baseline. In 2030, a reduction of 58 MtCO2e at an abatement cost of $0/tCO2e and 135 MtCO2e would be possible at a cost of $30/tCO2e.
Key Points• The rice cultivation sector accounts for 6% of baseline non-CO2 emissions in
2030.
• Among five abatement measures evaluated, switching to dryland production provides the largest emissions reductions.
• The technologically feasible reduction potential of the rice cultivation sector is 200 MtCO2e in 2030, 26% of baseline sector emissions.
Rice Cultivation Methane (CH4) and Nitrous Oxide (N2O) Emissions from Rice Cultivation
Emissions Reduction Potential, 2030
It would be cost-effective to reduce emissions by 8%, compared to the baseline, in 2030 An additional 18% reduction is available using
technologies with increasingly higher costs
Emissions Reduction Potential Assuming full implementation of current technology, emissions in the rice sector
could be reduced by up to 200 MtCO2e in 2030 This accounts for 4% of the 4,615 MtCO2e in global reduction potential in 2030
Abatement MeasuresEmissions reductions by technology in 2030 at $0/tCO2e and at higher prices.
41
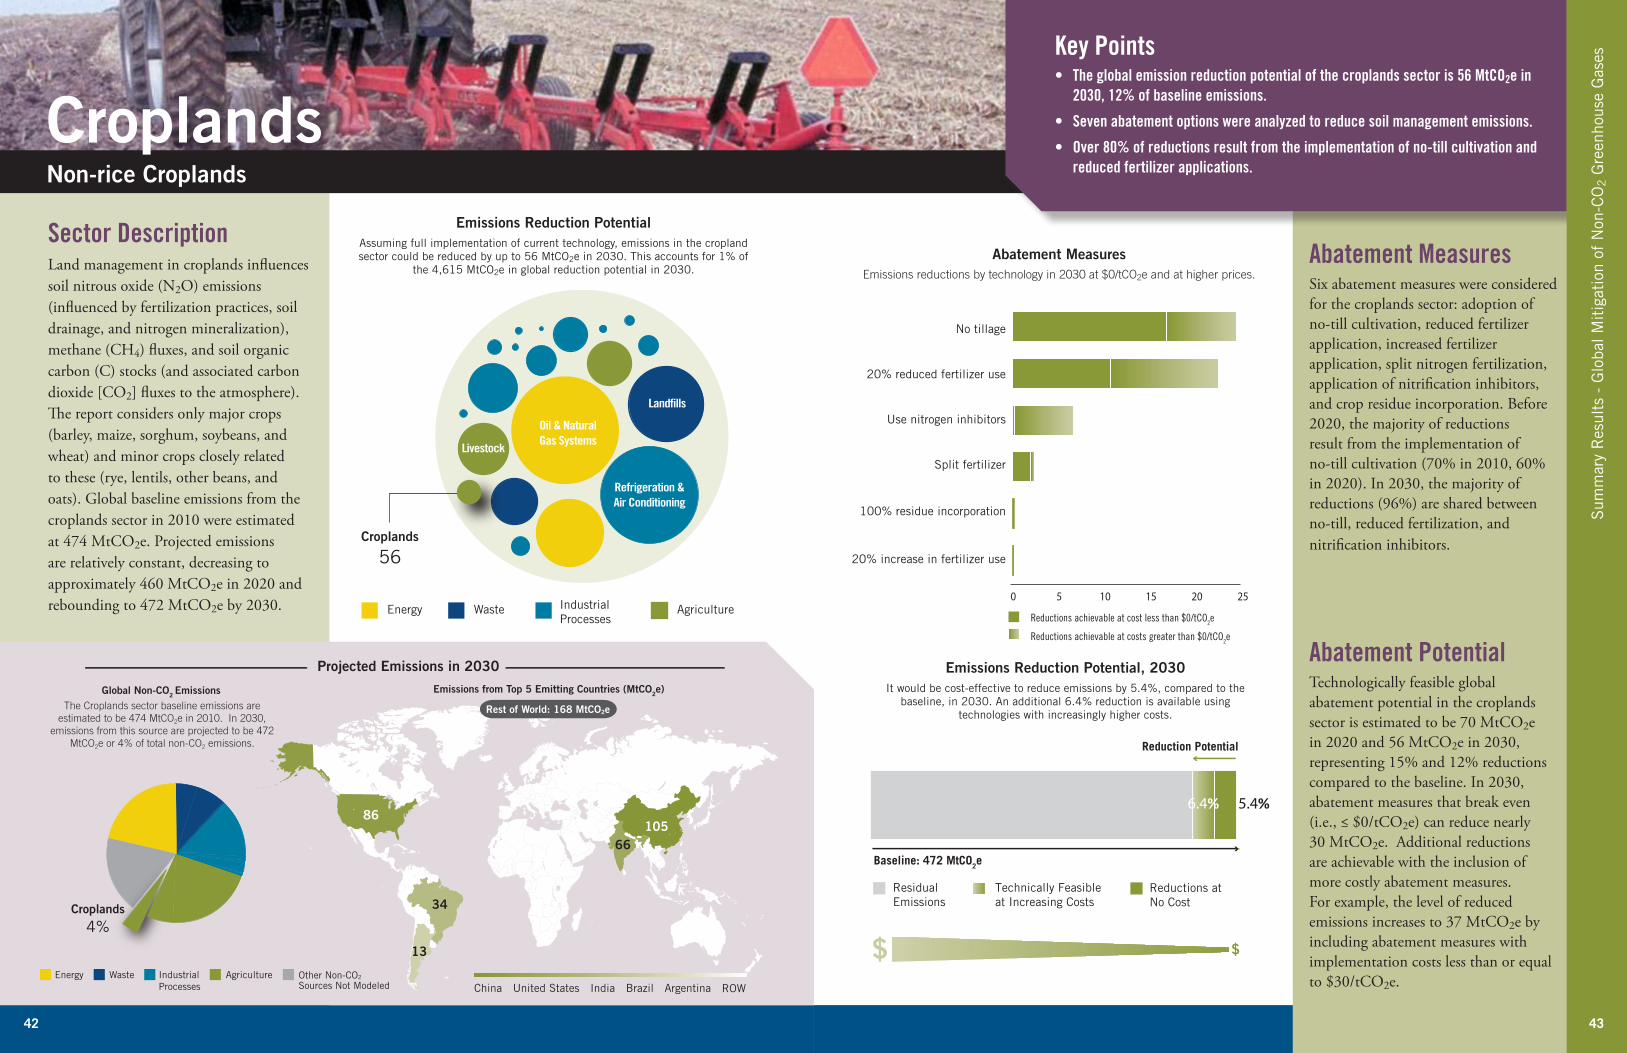
42 43
United States India Brazil ArgentinaChina
86105
66
13
34
ROW
Emissions from Top 5 Emitting Countries (MtCO2e)
IndustrialProcesses
AgricultureEnergy Waste Other Non-CO2
Sources Not Modeled
Projected Emissions in 2030
Rest of World: 168 MtCO2e
Croplands
4%
The Croplands sector baseline emissions are estimated to be 474 MtCO2e in 2010. In 2030,
emissions from this source are projected to be 472 MtCO2e or 4% of total non-CO2 emissions.
Global Non-CO2 Emissions
Energy AgricultureWaste
Croplands
56
Land�lls
Refrigeration &Air Conditioning
Livestock
IndustrialProcesses
Oil & NaturalGas Systems
Baseline: 472 MtCO2e
Technically Feasibleat Increasing Costs
Residual Emissions
Reductions at No Cost
Reduction Potential
6.4% 5.4%
$ $
Sector DescriptionLand management in croplands influences soil nitrous oxide (N2O) emissions (influenced by fertilization practices, soil drainage, and nitrogen mineralization), methane (CH4) fluxes, and soil organic carbon (C) stocks (and associated carbon dioxide [CO2] fluxes to the atmosphere). The report considers only major crops (barley, maize, sorghum, soybeans, and wheat) and minor crops closely related to these (rye, lentils, other beans, and oats). Global baseline emissions from the croplands sector in 2010 were estimated at 474 MtCO2e. Projected emissions are relatively constant, decreasing to approximately 460 MtCO2e in 2020 and rebounding to 472 MtCO2e by 2030.
Sum
mar
y R
esul
ts -
Glo
bal M
itig
atio
n of
Non
-CO
2 G
reen
hous
e G
ases
Abatement Measures Six abatement measures were considered for the croplands sector: adoption of no-till cultivation, reduced fertilizer application, increased fertilizer application, split nitrogen fertilization, application of nitrification inhibitors, and crop residue incorporation. Before 2020, the majority of reductions result from the implementation of no-till cultivation (70% in 2010, 60% in 2020). In 2030, the majority of reductions (96%) are shared between no-till, reduced fertilization, and nitrification inhibitors.
Abatement Potential Technologically feasible global abatement potential in the croplands sector is estimated to be 70 MtCO2e in 2020 and 56 MtCO2e in 2030, representing 15% and 12% reductions compared to the baseline. In 2030, abatement measures that break even (i.e., ≤ $0/tCO2e) can reduce nearly 30 MtCO2e. Additional reductions are achievable with the inclusion of more costly abatement measures. For example, the level of reduced emissions increases to 37 MtCO2e by including abatement measures with implementation costs less than or equal to $30/tCO2e.
Key Points• The global emission reduction potential of the croplands sector is 56 MtCO2e in
2030, 12% of baseline emissions.
• Seven abatement options were analyzed to reduce soil management emissions.
• Over 80% of reductions result from the implementation of no-till cultivation and reduced fertilizer applications.
Croplands Non-rice Croplands
Emissions Reduction Potential, 2030
It would be cost-effective to reduce emissions by 5 4%, compared to the baseline, in 2030 An additional 6 4% reduction is available using
technologies with increasingly higher costs
Emissions Reduction Potential Assuming full implementation of current technology, emissions in the cropland sector could be reduced by up to 56 MtCO2e in 2030 This accounts for 1% of
the 4,615 MtCO2e in global reduction potential in 2030
43
No tillage
20% reduced fertilizer use
Use nitrogen inhibitors
Split fertilizer
100% residue incorporation
20% increase in fertilizer use
0 5 10 15 20 25
Reductions achievable at cost less than $0/tCO2e
Reductions achievable at costs greater than $0/tCO2e
Abatement MeasuresEmissions reductions by technology in 2030 at $0/tCO2e and at higher prices.

United States Environm
ental Protection AgencyO
ffice of Atmospheric Program
s (6207J)W
ashington, DC 20005