
“Future Direction of Mining in South Africa” growth for the period 2011-2020 Source: ... The...
28
4.800 1 “Future Direction of Mining in South Africa” Roger Baxter Senior Executive: Economics & Strategy Presentation to Wits University Mining Student Conference 27 July 2013 Presentation outline The Local Context Unpacking the growth constraints RSA Mining “Putting South Africa First” Why Mining is Crucial to South Africa Resolving the challenges Recognising the industry’s potential The Global Context
Transcript of “Future Direction of Mining in South Africa” growth for the period 2011-2020 Source: ... The...
4.800
1
“Future Direction of Mining in South Africa”
Roger Baxter
Senior Executive: Economics & Strategy
Presentation to Wits University Mining Student Conference
27 July 2013
Presentation outline
The Local Context
Unpacking the growth constraints
RSA Mining “Putting South Africa First”
Why Mining is Crucial to South Africa
Resolving the challenges
Recognising the industry’s potential
The Global Context

4.800
2
Commodity outlook, short-term stress, long-term growth in demand
SHORT-TERM WEAKNESS
• World economy is recovering from the 1st global recession in 61 years.
• Recovery is unevenly distributed, with advanced economies sluggish and developing countries growing at a faster pace.
• The recession in the Eurozone and the soft landing in the Chinese economy has negatively impacted South Africa (lower demand and prices)
LONG-TERM STRUCTURAL FUNDAMENTALS ARE POSITIVE
• The materials intensive nature of growth in emerging economies will continue in the next few decade caused by continued urbanization and industrialization.
• Companies now focused on value vs growth.
The prospects of Commodities at a global level are mostly driven by economic growth
SINCE 2008, THE GLOBAL COMMODITIES MARKETS HAVE BEEN
HIT BY THE MULTIPLE EFFECTS OF:
• The “W” shaped boom-recession-recovery-recession-slow recovery in the
EuroZone due to the sovereign debt crisis
• The slowdown in economic growth in China (towards a soft landing).
• The “V” shaped boom-recession-recovery and then continued below potential
growth performance of the US economy.
BUT PROSPECTS ARE STABILISING:
• Despite ongoing structural issues the Eurozone is expected to post a modest
positive growth rate in 2014.
• China’s economy has stabilised and is expected to grow at >7% in 2013.
• The US economy is showing positive signs of recovery, with consumer
confidence rising.

4.800
3
PWC Annual Mining Report Titles
• 2005 “Enter the Dragon”
• 2007 “Riding the wave”
• 2008 “as good as it gets”
• 2009 “When the going gets tough”
• 2010 “Back to the Boom”
• 2011 “The game has changed”
• 2012 “The Growing Disconnect”
• 2013 “A Confidence Crisis”
The Global Mining Industry is currently struggling:
In 2012. for the top 40 mining companies:
• Revenues are flat at $731 billion.
• Net profit has halved (down 49% to $68 billion).
• Companies have had to issue $108 billion in debt, so gearing has risen from 13% to 24%.
• Capex is down 21% to $110 billion.
• Market values have fallen by 20% in early 2013.
• There are 5 new CEOs at top 10 companies.
• While China accounts for 40% of metals demand
• There is a crisis of confidence.

4.800
4
The World economy is slowly recovering
Source: IMF WEO October 2012
-5
-3
-1
1
3
5
7
9
11
13
15
20
00
20
01
20
02
20
03
20
04
20
05
20
06
20
07
20
08
20
09
20
10
20
11
20
12
20
13
20
14
20
15
20
16
20
17
% G
DP
gro
wth
rate
Economic growth rate in USA, EU and China
China
United States
European Union
Economic weakness in EU zone resulted in downward pressure on the spot price of Platinum
� GDP is a key driver to Pt demand
� Pt demand is mainly driven by carbon emission legislation hence Euro dependence
� Europe consumes 40% of Pt demand and 40% is used in autocats
� Platinum has not recovered because its demand most impacted by Euro crisis and increased recycling
� Automotive producers have reduced load rates and thrifted away from platinum towards palladium
Source: IMF, Johnson Matthey
8
4.800
5.000
6
4.400
6.800
4.600
6.400
5
5.200
5.400
5.600
5.800
6.000
4
3
2
1
0
-1
-2
-3
6.600
-5
201220112010200920082007
-4
200520042003200220012000
6.200
2006
Pt Demand (koz) - RH Axis
Euro Area GDP, % change
World GDP, % change
Historic GDP & Pt Demand
GD
P -
% c
hange
ko
z P
t
Financial Crisis
Year

4.800
5
Risks at the Global level remain…….
0
50
100
150
200
250
300
2000
2001
2002
2003
2004
2005
2006
2007
2008
2009
2010
2011
2012
2013
2014
2015
2016
% o
f G
DP
Gross public debt as a % of GDP
Germany
Japan
United Kingdom
United States
Source: IMF WEO Oct 2012
Despite the volatility in the short-term, the long-term fundamentals are positive for growth in
commodity demand
• Long term drivers of demand remain intact:
» Trends in urbanization and industrialization appear to be entrenched for the next few decades in China, India and other EMs.
» By 2050 another 3 billion people at the global level will urbanize. Most of this urbanization will take place in emerging market economies (UN population division).
» The infrastructure expenditure to accommodate global urbanization is significant.
» The quantity of minerals required to support this urbanization will remain large.

4.800
6
World urban population growth
(Billion people)
Rising urbanisation, 3 billion people to urbanise by 2050 (most of the growth in Africa)
Source: UN, McKinsey
0.4
0.5
0.5
0.8
0.5
3.0
3.5
4.0
4.5
5.0
5.5
6.0
6.5
7.0
7.5
2010 Urban Pop. China India Other Asia Africa RoW 2050 Urban Pop.
The world is set to urbanise close to another 3 billion people by the middleof the century
Fixed investment will mostly be into infrastructure in emerging economies…….
Source: IMF WEO Oct 2012
0
5
10
15
20
25
30
35
2000
2001
2002
2003
2004
2005
2006
2007
2008
2009
2010
2011
2012
2013
2014
2015
2016
2017
% o
f G
DP
Fixed investment expenditures
World
Advanced economies
Emerging market and developing economies

4.800
7
Copper, 27
Iron ore, 21
Thermal coal, 16
Gold, 15
Coking coal, 11
Nickel, 11Uranium, 1
Citibank - growth projects by commodity on a production volume basis, 2011-2020
Top 6 minerals, expected greenfield production growth for the period 2011-2020
Source: CitiBank
Shifting Risks: The Game is Changing (E&Y)
1. Skills shortage
2. Industry consolidation
3. Infrastructure access
4. Maintaining a social license to operate
5. Climate change concerns
6. Rising costs (cost inflation)
7. Pipeline shrinkage
8. Resource nationalism
9. Access to secure energy
10. Increased regulation
Source: “Business Risks Facing Mining and Metals, 2012-2013, Ernst & Young
1. Resource nationalism
2. Skills shortage
3. Infrastructure access
4. Cost inflation
5. Capital project execution
6. Maintaining a social license to operate
7. Price and currency volatility
8. Capital management & access
9. Sharing the benefits
10. Fraud and corruption
20122008

4.800
8
Presentation outline
The Local Context
Unpacking the growth constraints
RSA Mining “Putting South Africa First”
Why Mining is Crucial to South Africa
Resolving the challenges
Recognising the industry’s potential
The Global Context
Perceptions about Mining by RSA’s people in general
•Little link made between role of minerals and the functioning of a modern society.
•Little credit given to the mining industry for playing a key role in South Africa’s economic development over past 130 years, which has transformed South Africa into the most industrialised country in Africa

4.800
9
Metals and minerals in a Smart Phone
• Copper (16 grams) ¹
• Silver (0.35 grams) ¹
• Gold (0.034 grams) ¹
• Palladium (0.015 grams) ¹
• Platinum (0.00034 grams) ¹
• Ceramic magnetic switches containing rare earths ²
• Indium²
• Titanium dioxide ²
• Indium tin oxide ²
• ¹ source – USGS http://pubs.usgs.gov/fs/2006/3097/• ² source – NRC critical minerals report
Metals and Minerals in a car
• 960kg iron &steel
• 109kg Aluminum
• 22.7kg Carbon
• 19 kg Copper, 34kg for a
hybrid
• 19kg Silicon
• 11 kg Lead
• 10kg Zinc
• 7.7kg manganese
• 6.8kg Chromium
• 4.1kg Nickel
• 0.4 kg Platinum
•+Antimony, barium, beryllium, cobalt, gallium, gold, magnesium, molybdenum, neodymium, indium, palladium, •Sulphur, rhodium, silver, strontium, tin, titanium, tungsten,vanadium, zirconium.

4.800
10
Even a Wind Turbine uses a significant amount of metals and minerals
• 335 tons of steel
• 4.7 tons of copper
• 13 tons of fiberglass
• 3 tons of aluminum
• 1,200 tons of
reinforced concrete
Even the cosmetics and makeup are made from minerals
• Talc
• Mica
• Kaolin
• Calcite
• Titanium dioxide
• Zinc oxide
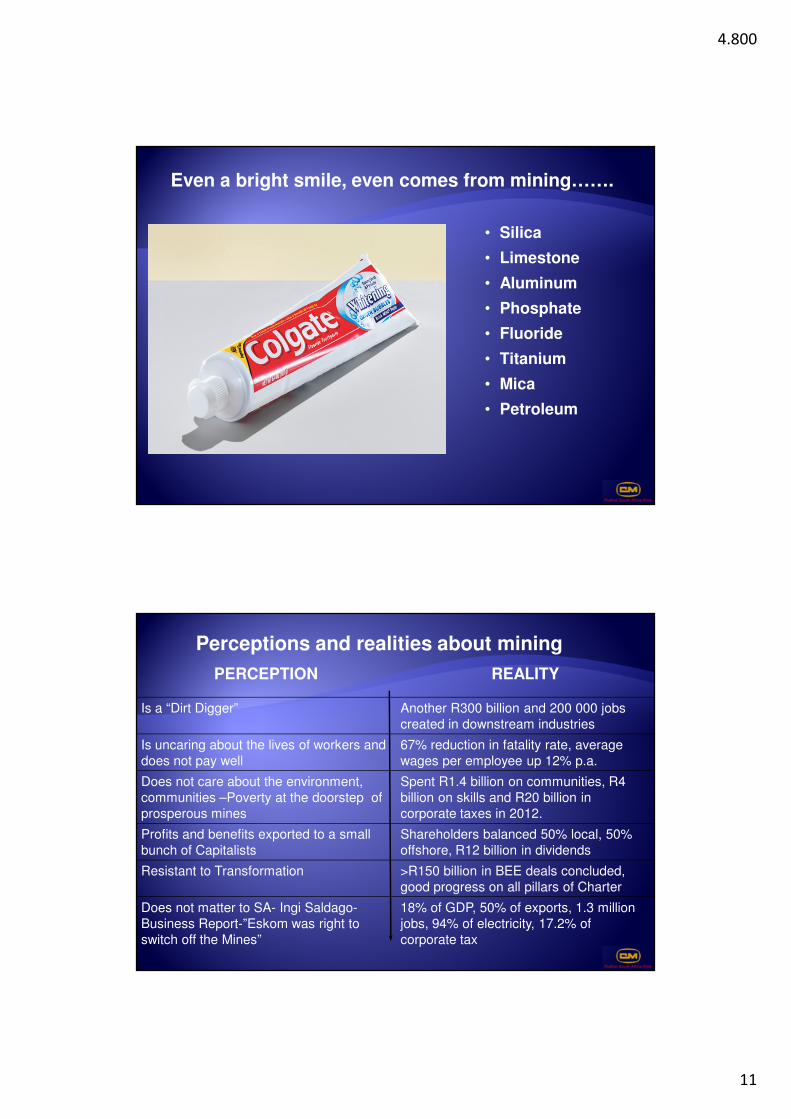
4.800
11
• Silica
• Limestone
• Aluminum
• Phosphate
• Fluoride
• Titanium
• Mica
• Petroleum
Even a bright smile, even comes from mining…….
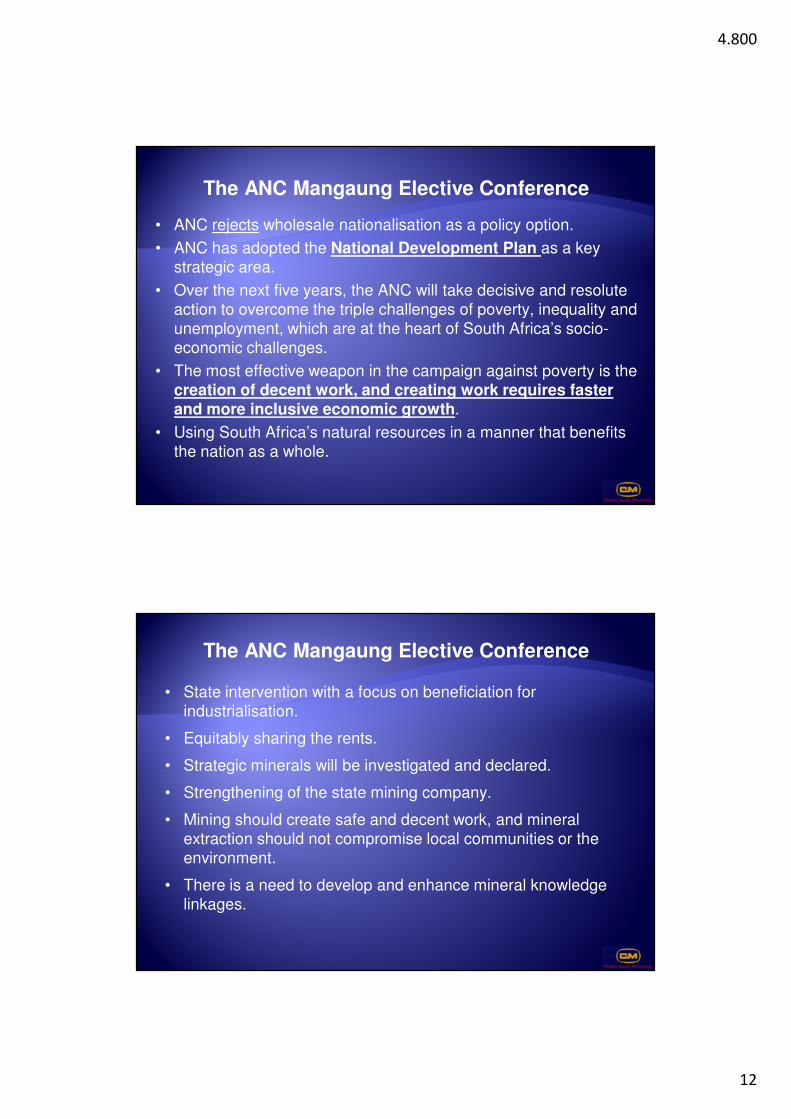
Perceptions and realities about mining
PERCEPTION REALITY
Is a “Dirt Digger” Another R300 billion and 200 000 jobs created in downstream industries
Is uncaring about the lives of workers and does not pay well
67% reduction in fatality rate, average wages per employee up 12% p.a.
Does not care about the environment, communities –Poverty at the doorstep of prosperous mines
Spent R1.4 billion on communities, R4 billion on skills and R20 billion in corporate taxes in 2012.
Profits and benefits exported to a small bunch of Capitalists
Shareholders balanced 50% local, 50% offshore, R12 billion in dividends
Resistant to Transformation >R150 billion in BEE deals concluded, good progress on all pillars of Charter
Does not matter to SA- Ingi Saldago-Business Report-”Eskom was right to switch off the Mines”
18% of GDP, 50% of exports, 1.3 million jobs, 94% of electricity, 17.2% of corporate tax
4.800
12
The ANC Mangaung Elective Conference
• ANC rejects wholesale nationalisation as a policy option.
• ANC has adopted the National Development Plan as a key strategic area.
• Over the next five years, the ANC will take decisive and resolute action to overcome the triple challenges of poverty, inequality and unemployment, which are at the heart of South Africa’s socio-economic challenges.
• The most effective weapon in the campaign against poverty is the creation of decent work, and creating work requires faster and more inclusive economic growth.
• Using South Africa’s natural resources in a manner that benefits the nation as a whole.
The ANC Mangaung Elective Conference
• State intervention with a focus on beneficiation for industrialisation.
• Equitably sharing the rents.
• Strategic minerals will be investigated and declared.
• Strengthening of the state mining company.
• Mining should create safe and decent work, and mineral extraction should not compromise local communities or the environment.
• There is a need to develop and enhance mineral knowledge linkages.

4.800
13
The Chamber of Mines supports the ANC Policy Resolutions
• A greater degree of certainty is emerging.
• In a number of areas the “how” is critically important.– Encouraging further beneficiation is an important issue and
further work the “how” is taking place.
– Energy security can be guaranteed through private sector investment and cooperation between government and the private sector.
Presentation outline
The Local Context
Unpacking the growth constraints
RSA Mining “Putting South Africa First”
Why Mining is Crucial to South Africa
Resolving the challenges
Recognising the industry’s potential
The Global Context
4.800
14
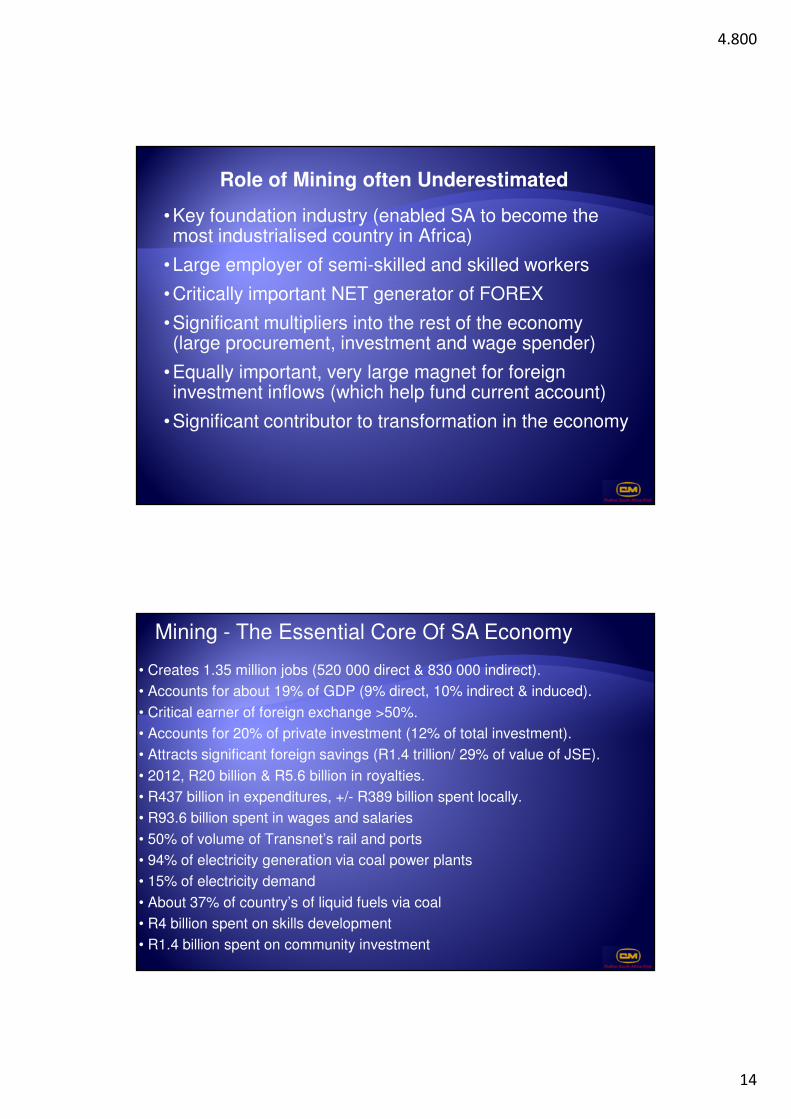
Role of Mining often Underestimated
•Key foundation industry (enabled SA to become the most industrialised country in Africa)
•Large employer of semi-skilled and skilled workers
•Critically important NET generator of FOREX
•Significant multipliers into the rest of the economy (large procurement, investment and wage spender)
•Equally important, very large magnet for foreign investment inflows (which help fund current account)
•Significant contributor to transformation in the economy
Mining - The Essential Core Of SA Economy
• Creates 1.35 million jobs (520 000 direct & 830 000 indirect).
• Accounts for about 19% of GDP (9% direct, 10% indirect & induced).
• Critical earner of foreign exchange >50%.
• Accounts for 20% of private investment (12% of total investment).
• Attracts significant foreign savings (R1.4 trillion/ 29% of value of JSE).
• 2012, R20 billion & R5.6 billion in royalties.
• R437 billion in expenditures, +/- R389 billion spent locally.
• R93.6 billion spent in wages and salaries
• 50% of volume of Transnet’s rail and ports
• 94% of electricity generation via coal power plants
• 15% of electricity demand
• About 37% of country’s of liquid fuels via coal
• R4 billion spent on skills development
• R1.4 billion spent on community investment

4.800
15
The linkages of mining to the economy
Mining’s direct contribution:
•GDP R230 Billion or 9% of GDP
•Jobs 499 217
The Induced Impact:
•GDP R136,1 billion or 6% of GDP
•Jobs 496,319
First round impact:
•GDP R59 billion or 2.3% of GDP
•Jobs 207 949
Indirect impact
•GDP R42.7 billion or 1.7% of GDP
•Jobs 149,898
The Total Contribution of Mining to the Economy
•GDP R468 billion or 18.7% of GDP
•Jobs 1,353,383 (16.6% of total employment)
Source: Quantec & IDC, 2010 data
Downstream beneficiation is far bigger than people think!
• About 99% of RSA's cement is made locally from locally mined products
• 80% of RSA's steel is made locally from locally mined iron ore, chrome, manganese, coking coal
• 30% of RSA’s liquid fuels are produced from locally mined coal
• 94% of RSA's electricity is produced from locally mined coal
• Most of our domestic chemicals, fertilisers, waxes, polymers, plastics, etc., are fabricated using locally mined minerals & coal
• 13% of the world's platinum catalytic converters are made in RSA, and so on
Overall another R300 billion in sales value and >200 000 jobs are created in the downstream beneficiation industries. Extra value is
being created where the commercial opportunities exist

4.800
16
Side-stream beneficiation is a significant industry in its own right
• Significant industries have developed to provide goods and services to the mining sector:
• The Johannesburg Securities Exchange was established in 1887 and is the world’s 22nd largest exchange.
• Financial and legal services were started to support mining and now accounts for 20% of GDP.
• Significant education, skills development and knowledge cluster has evolved and developed around mining.
• The development of infrastructure (rail, ports, electricity, etc.) is still dominated by demand from mining.
• A significant manufacturing sector still supplied goods into mining, steel, mining equipment, explosives, etc.
Overall, this industry is significant (2.3% of GDP and >200 000 jobs) and has become a big exporter into the rest of Africa.
Minerals & Metals In South Africa: A Significant Value Added Cluster
ScienceTechnology
Exploration
Geoscience
Suppliers
Mining is one of the most extensive and best developed South African industrial clusters
Extensive sciences & technology network/research
Broad expertise in geoscience
Large exploration expertise
Large number suppliers of equipment and services
World class educational and skills development systems and institutions
Sophisticated financial institutions (JSE, banks, legal)
Large scale smelting and refining.
Mining
SmeltersRefineries
GovernancePolicy
Equityfinancing
Professional
schools

4.800
17
South Africa has significant geological potential
0 10 20 30 40 50 60 70 80 90 100
PGM's
ManganeseChromium
GoldAlumino-Silicates
VermiculiteVanadium
Zirconium MineralsTitanium minerals
FluorsparAntimony
Phosphate rock
NickelUranium
LeadCoal
ZincSilicon
Iron ore
% of global .South African reserves for key minerals, 2008
1
1
1
1
1
2
2
2
2
2
4
4
5
5
6
8
8
8
9
South Africa, is not mature mining real estate! The country still has
significant geological potential
Global rank
Source: DMR/USGS
Mining has significant potential
• If growth constraints can be removed mining can:
– Grow at 3% to 5% p.a., resulting in a much more balanced country growth rate (double size of mining by 2028).
– If mining had grown at same pace as rest of economy between 1994 and 2011, it would have increased the country’s growth rate to 3.9% from 3.2%, a significant difference.
– At a 5% growth rate, the mining industry can increase exports and reduce the savings-investment constraint.
– Add another 100 000 to 200 000 direct jobs.

4.800
18
Rough growth potential of some of the bulks:
• Iron ore could double production within 5 to 10 years to >100 million tons (MT) per year by 2020. Employment could rise from 18 000 to 30 000 people. Biggest constraints: rail
• Coal production has to rise from current 254 MT p.a. to >320 MT by 2020 to satisfy Eskom, replacement & exports. Jobs could increase from current 80 000 to 100 000 by 2020. Biggest constraints: rail, regulatory issues (environmental).
• Manganese could double/treble production from the current 7.2 MT to 15MT/20MT by 2020. Employment could rise from current 5879 to >10 000 in this period. Biggest constraint: lack of access to efficient cost competitive heavy haul rail
These three bulks could significantly increase their export
earnings and GDP contribution and add about 50 000 jobs, if
the constraints are resolved.
Two scenarios were developed for the forward looking scenarios
Current constraints are
relieved
Constrained by current
bottlenecks
Costs grow at
historic rates
Cost increases are
reduced to half of
historic rates
Cost Management
A‘Low
road’
‘High
road’
CB
D
Prod
uct
ion
gro
wth
A “high road” is very possible for South Africa’s mining sector
Source: McKinsey

4.800
19
But RSA mining has not met its potential
• RSA mining missed out on the last commodity boom with a -1% p.a. decline in mining GDP between 2001 and 2008, versus 5% growth rate in top 20 mining economies mining sectors.
• The prices for gold and platinum have plunged in 1H2013.
• Costs have continued to rise too quickly (electricity prices have trebled in the past 5 years).
• 61% of gold mines are loss-making and 59% of platinum mines are loss-making at current prices.
• The industry was hit by a wave of unprotected strikes last year and by the unfortunate Marikana tragedy.
• The industry has faced infrastructure constraints (shortages of electricity, rail and water).
• The industry has faced bouts of policy uncertainty (the nationalisation discussion, the review of mining taxation, the possible introduction of a carbon tax, etc.)
Presentation outline
The Local Context
Unpacking the growth constraints
RSA Mining “Putting South Africa First”
Why Mining is Crucial to South Africa
Resolving the challenges
Recognising the industry’s potential
The Global Context

4.800
20
South Africa: Going for Sustainable, Balanced and Labour Absorptive Growth
•Progress has been made to get the economy back on to a higher growth path (3.2% 1994 to 2012).
•However, SA’s labour participation rate at 42% is low vs peers (~61%), its unemployment rate is too high (>20%).
•Government has now placed the creation of meaningful employment
as a central objective of economic policy.
•All parties recognise that higher levels of sustainable, balanced and
labour absorbing economic growth is key to reducing unemployment
•Government has developed the National Development Plan and the New Growth Path focusing on economic growth and employment
creation.
South
Africa
While South Africa’s growth rate has risen to 3.2% p.a. 1994-2012, it is just too slow to meaningfully tackle
unemployment & poverty

4.800
21
Too much of the economy’s recent growth has been driven by credit fuelled non-tradable demand side, &
tradable export sectors have languished…..
Non-tradable sectors
Source: StatsSA
0
200 000
400 000
600 000
800 000
1 000 000
1 200 000
1 400 000
1 600 000
1 800 000
2 000 000
R'm
illio
ns
South Africa: Contribution to GDP in real terms, non-tradable vs tradable sectors of economy (real terms)
Non-tradable
Tradable
To ensure more balanced and higher levels of growth & job creation the country needs its tradable
export sectors to grow at a much faster pace
THIS IS WHERE MINING FITS IN.
• Mining has a very large employment, foreign exchange earning and GDP multipliers.
• The MIGDETT Mining Growth Strategy, the New Growth Path and National Development Plan both recognise the critically important role that mining can play in growing investment, exports, GDP and the multiplier effects.

4.800
22
Presentation outline
The Local Context
Unpacking the growth constraints
RSA Mining “Putting South Africa First”
Why Mining is Crucial to South Africa
Resolving the challenges
Recognising the industry’s potential
The Global Context
Competitiveness drivers
The key threats to competitiveness of SA
mining are:
▪ Infrastructure (electricity, rail)
▪ Policy uncertainty and some challenges in regulatory framework
▪ Social licence to operate1
▪ Human capital/ skills
▪ Institutional capacity
▪ Rapidly rising costs
Competitiveness drivers of mining
SOURCE: McKinsey & Company
Competitiveness threat
Competitive advantage
Mixed picture
Market context
Regulatory environment
Product demandEnabling factorsInfrastructure
Ease of doing business▪ Social licence
▪ Security of tenure▪ Rule of law
▪ Macroeconomic stability
Factor market efficiency
Industry structure
Inherent potential
Natural resource endowment
Human capital/ skills
Geographical factors
Accessibility of markets
Domestic demand
International demand
Regulatory and legal requirements
Institutional capacity
1 Dealt primarily in sustainability and transformation workstreams

4.800
23
Enabling factors:
• Ease of doing business – SA favourably ranked in top quartile.
• Infrastructure – at a general level SA’s infrastructure is ranked as reasonable, but specific constraints have emerged (rail & electricity)
• Social license to operate (safety, health, environment, etc.,) -important component of the industry’s long term license to operate.
• Macroeconomic stability – the country has adopted prudent macroeconomic policies, but volatile exchange rate is a challenge.
• Political stability – SA is a stable constitutional democracy.
• Technological readiness – SA ranks in 3rd quartile, but firm level technology absorption is in top quartile.
• Business sophistication – SA ranked favourably in 2nd quartile.
• Innovation capability – SA ranked favourably in 2nd quartile, with quality of R&D & scientific research organisations in top quartile.
South Africa is ranked 39th easiest place to do business
(out of 185 economies)
BadGood
4.800
24
South Africa has excellent policy potential assuming best practice
• The country’s mineral laws are congruent with global best practice (MPRDA, taxation system and Royalty Act), but some areas require further work (environmental licensing, strategic minerals, beneficiation, etc.).
• Recent policy uncertainty regarding the nationalisation debate has been negative (but is now resolved).
• Unfortunately, this uncertainty is reflected in the 2013 Fraser Institute Survey which ranks South Africa in position 64 out of 96 countries.
• An MPRDA Amendment Bill has been released for public comment.
• A country taxation review is scheduled for 2h13.
Presentation outline
The Local Context
Unpacking the growth constraints
RSA Mining “Putting South Africa First”
Why Mining is Crucial to South Africa
Resolving the challenges
Recognising the industry’s potential
The Global Context

4.800
25
Resolving the challenges in the mining sector
• Very strong level of commitment in MIGDETT and Deputy President’s Mining Dialogue process by industry, government and labour leadership to resolving the challenges.
• Signed a stability and peace accord with all the stakeholders in the mining sector.
• Most of the stakeholders have signed the Framework Agreement for a Sustainable Mining Industry (June 2013).
• Engaging all stakeholders including government, unions, the investment community, local communities and other parties.
• Commission of enquiry into the Marikana tragedy.
The mining industry is making a positive contribution
• The industry is making significant progress on the Mining Charter targets and is committed to “Putting South Africa First”.
• Industry is contributing significantly to community development (R1.4 billion last year), but can make this more effective in terms of better partnerships.
• Other role players have just as important role to play (such as local government) in service delivery and community development.
• Industry spent R4 billion on skills development and training (excluding the skills levy).
• Average wages in mining lift the average for all workers (R93 billion paid in wages in 2012).
• R20 billion paid in corporate taxes in 2012.
• Industry is procuring significant % locally.

4.800
26
Presentation outline
The Local Context
Unpacking the growth constraints
RSA Mining “Putting South Africa First”
Why Mining is Crucial to South Africa
Resolving the challenges
Recognising the industry’s potential
The Global Context
South African Mining Industry of the Future?
Skilled
workforce, transformed,
productive, decent wages and
non-discriminatory, safe &
healthy workplaces
Management not only
focus on profits, but provide
decent jobs, play positive role in
mining communities and
sensitive to environment
Government and trade unions: proud of and
fully supportive of the mining industry and acknowledge
industry as important for the country
� Key exporter � Key earner of foreign
exchange � Key taxpayer � Creator of decent jobs � Developer of skills� Key contributor to
economy
Investors regard industry as a
good investment destination
Constructive
Partnerships built on
TRUST

4.800
27
What is the mining sector doing to help resolve issues?
• The Mining Company Leadership through the Chamber have agreed to
“Putting South Africa First”
What is the mining sector doing to help resolve issues?.
• The industry is demonstrating it is a good corporate citizen:
– Demonstrating positive role industry does play in economy & society.
– Upping game in areas where industry lags.
• The Chamber is building cooperative relationships with key stakeholders
• Developing a positive contribution model:
– Improving effectiveness on issues such as community development through establishment of regional processes.
• Engaging with relevant movers and shakers on key issues:
– Mining industry’s potential contribution to the NDP
– Competitiveness
– Labour market stability
– Community investment
– Improving SHEC performance

4.800
28
Conclusion
Mining matters for the growth, development and transformation of South Africa