Exports and Productivity – Comparable Evidence for … and Productivity – Comparable Evidence...
82
P OLICY R ESEARCH WORKING P APER 4418 Exports and Productivity – Comparable Evidence for 14 Countries The International Study Group on Exports and Productivity The World Bank Development Research Group Trade Team November 2007 WPS4418 Public Disclosure Authorized Public Disclosure Authorized Public Disclosure Authorized Public Disclosure Authorized Public Disclosure Authorized Public Disclosure Authorized Public Disclosure Authorized Public Disclosure Authorized
Transcript of Exports and Productivity – Comparable Evidence for … and Productivity – Comparable Evidence...
Policy ReseaRch WoRking PaPeR 4418
Exports and Productivity – Comparable Evidence for 14 Countries
The International Study Group on Exports and Productivity
The World BankDevelopment Research GroupTrade TeamNovember 2007
WPS4418P
ublic
Dis
clos
ure
Aut
horiz
edP
ublic
Dis
clos
ure
Aut
horiz
edP
ublic
Dis
clos
ure
Aut
horiz
edP
ublic
Dis
clos
ure
Aut
horiz
edP
ublic
Dis
clos
ure
Aut
horiz
edP
ublic
Dis
clos
ure
Aut
horiz
edP
ublic
Dis
clos
ure
Aut
horiz
edP
ublic
Dis
clos
ure
Aut
horiz
ed
Produced by the Research Support Team
Abstract
The Policy Research Working Paper Series disseminates the findings of work in progress to encourage the exchange of ideas about development issues. An objective of the series is to get the findings out quickly, even if the presentations are less than fully polished. The papers carry the names of the authors and should be cited accordingly. The findings, interpretations, and conclusions expressed in this paper are entirely those of the authors. They do not necessarily represent the views of the International Bank for Reconstruction and Development/World Bank and its affiliated organizations, or those of the Executive Directors of the World Bank or the governments they represent.
Policy ReseaRch WoRking PaPeR 4418
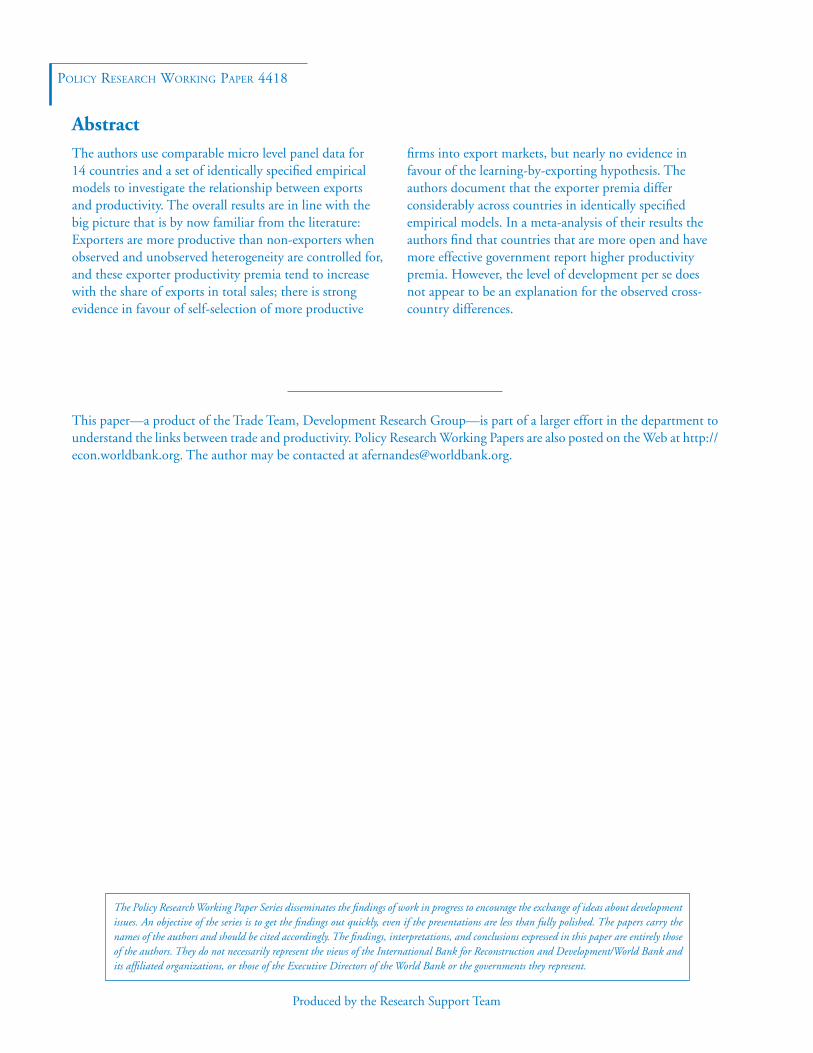
The authors use comparable micro level panel data for 14 countries and a set of identically specified empirical models to investigate the relationship between exports and productivity. The overall results are in line with the big picture that is by now familiar from the literature: Exporters are more productive than non-exporters when observed and unobserved heterogeneity are controlled for, and these exporter productivity premia tend to increase with the share of exports in total sales; there is strong evidence in favour of self-selection of more productive
This paper—a product of the Trade Team, Development Research Group—is part of a larger effort in the department to understand the links between trade and productivity. Policy Research Working Papers are also posted on the Web at http://econ.worldbank.org. The author may be contacted at [email protected].
firms into export markets, but nearly no evidence in favour of the learning-by-exporting hypothesis. The authors document that the exporter premia differ considerably across countries in identically specified empirical models. In a meta-analysis of their results the authors find that countries that are more open and have more effective government report higher productivity premia. However, the level of development per se does not appear to be an explanation for the observed cross-country differences.
Exports and Productivity – Comparable Evidence for 14 Countries
The International Study Group on Exports and Productivity 1
Keywords: Exports, productivity, micro data, international comparison
JEL classification: F14, D21
1 The International Study Group on Exports and Productivity consists of teams working with firm (establishment or enterprise) level data from 14 countries. Substantial contributions to the results reported in this paper were made by the following members of the teams: Austria (Leonhard Pertl, Stefano Schiavo), Belgium (Mirabelle Muuls, Mauro Pisu), Chile (Roberto Álvarez, Patricio Jaramillo, Ricardo A. López), China (Johannes Van Biesebroeck, Loren Brandt, Yifan Zhang), Colombia (Ana M. Fernandes, Alberto Isgut), Denmark (Rasmus Jørgensen, Ulrich Kaiser), France (Flora Bellone, Liza Jabbour, Patrick Musso, Lionel Nesta), Germany (Helmut Fryges, Joachim Wagner), Italy (Davide Castellani, Francesco Serti, Chiara Tomasi, Antonello Zanfei), Republic of Ireland (Stefanie Haller, Frances Ruane), Slovenia (Joze P. Damijan, Crt Kostevc, Saso Polanec), Spain (Jose C. Fariñas, Liza Jabbour, Juan A. Máñez, Ana Martin, Maria E. Rochina, Juan A. Sanchis), Sweden (Martin Andersson, Sara Johansson), and the United Kingdom (David Greenaway, Richard Kneller, Mauro Pisu). Ana Fernandes, Holger Görg and Alberto Isgut contributed to the meta-analysis. Joachim Wagner ([email protected]) coordinates the group and serves as the corresponding author for this international comparison paper. Special thanks go to Brigitte Scheiter who took care of collecting all the results and preparing the voluminous tables in an excellent way.
2
1. Motivation
In 1995, Bernard and Jensen published the first of series of papers that use large
comprehensive longitudinal data from surveys performed regularly by official statistics in the
United States to look at differences between exporters and non-exporters in various
dimensions of firm performance, including productivity (see Bernard and Jensen 1995, 1999,
2004). These papers started a new strand of economic literature, as researchers all over the
world began to use the rich data sets collected by the statistical offices to study the export
activity of firms, its causes, and its consequences. The extent and causes of productivity
differentials between exporters and their counterparts which sell on the domestic market only
is one of the core topics addressed.
In this literature, two alternative but not mutually exclusive hypotheses about why
exporters can be expected to be more productive than non-exporting firms are discussed and
investigated empirically (see Bernard and Jensen 1999; Bernard and Wagner 1997). The first
hypothesis points to self-selection of the more productive firms into export markets. The
reason for this is that there exist additional costs of selling goods in foreign countries. The
range of extra costs include transportation costs, distribution or marketing costs, personnel
with skills to manage foreign networks, or production costs in modifying current domestic
products for foreign consumption. These costs provide an entry barrier that less productive
firms cannot overcome. Furthermore, the behaviour of firms might be forward-looking in the
sense that the desire to export tomorrow may lead a firm to improve performance today to be
competitive in the foreign market. Cross-section differences between exporters and non-
exporters, therefore, may in part be explained by ex-ante differences between firms: The more
productive firms become exporters. The second hypothesis points to the role of learning-by-
exporting. Knowledge flows from international buyers and competitors help to improve the
post-entry performance of export starters. Furthermore, firms participating in international
3
markets are exposed to more intense competition and must improve faster than firms who sell
their products domestically only. Exporting makes firms more productive.
Summarizing the results from a comprehensive survey of the empirical literature that
covers 45 studies with data from 33 countries published between 1995 and 2006, Wagner
(2007) argues that, details aside, the big picture that emerges after some ten years of micro-
econometric research in the relationship between exporting and productivity is that exporters
are more productive than non-exporters, and that the more productive firms self-select into
export markets, while exporting does not necessarily improve productivity.2 However, this
big picture hides a lot of heterogeneity. Cross-country comparisons, and even cross-study
comparisons for one country, are difficult because the studies differ in details of the approach
used. Therefore, the jury is still out on many of the issues regarding the relationship between
exporting and productivity, including the absolute size of the productivity advantage needed
to clear the export market hurdle and the reasons for differences in this size between
countries, the reasons for the existence or not of learning-by-exporting effects in some
countries, the determinants of ex-ante productivity premia of export starters, and the
mechanisms by which learning from exporting occurs.
One promising approach to generate stylised facts in a more convincing way
suggested in Wagner (2007) is to coordinate micro-econometric studies for many countries
ex-ante, and to agree on a common approach and on the specification of the empirical models
estimated. The outcome of such a joint effort would be a set of results that could be compared
not only qualitatively (i.e. with regard to the signs and the statistical significance of the
estimated coefficients) but with a view on the magnitude of the estimated effects, too.
This paper reports the results of an effort to proceed in this manner. Teams working
with micro level data for 14 countries joined to form The International Study Group on
2 For contemporaneous but less comprehensive surveys of this literature with a partly different focus, see López (2005) and Greenaway and Kneller (2007).
4
Exports and Productivity, with the aim of producing a set of internationally comparable
results based on identically specified empirical models and using the same computer
programmes. The paper reports the results of this exercise and also provides an attempt to
explain cross-country differences in the productivity premia using meta-analysis techniques.
The rest of the paper is organised as follows: Section 2 provides information on the
countries included, the data used, and descriptive statistics on export participation. Section 3
reports the so-called exporter productivity premia, defined as the ceteris paribus percentage
difference of productivity between exporters and non-exporters. Section 4 and Section 5
present the results of empirical investigations of the two hypotheses mentioned above, namely
self-selection of more productive firms into export markets, and learning-by-exporting.
Section 6 performs robustness checks of the results. Section 7 concludes.
2. Countries, Data Sets and Descriptive Evidence on Export Participation
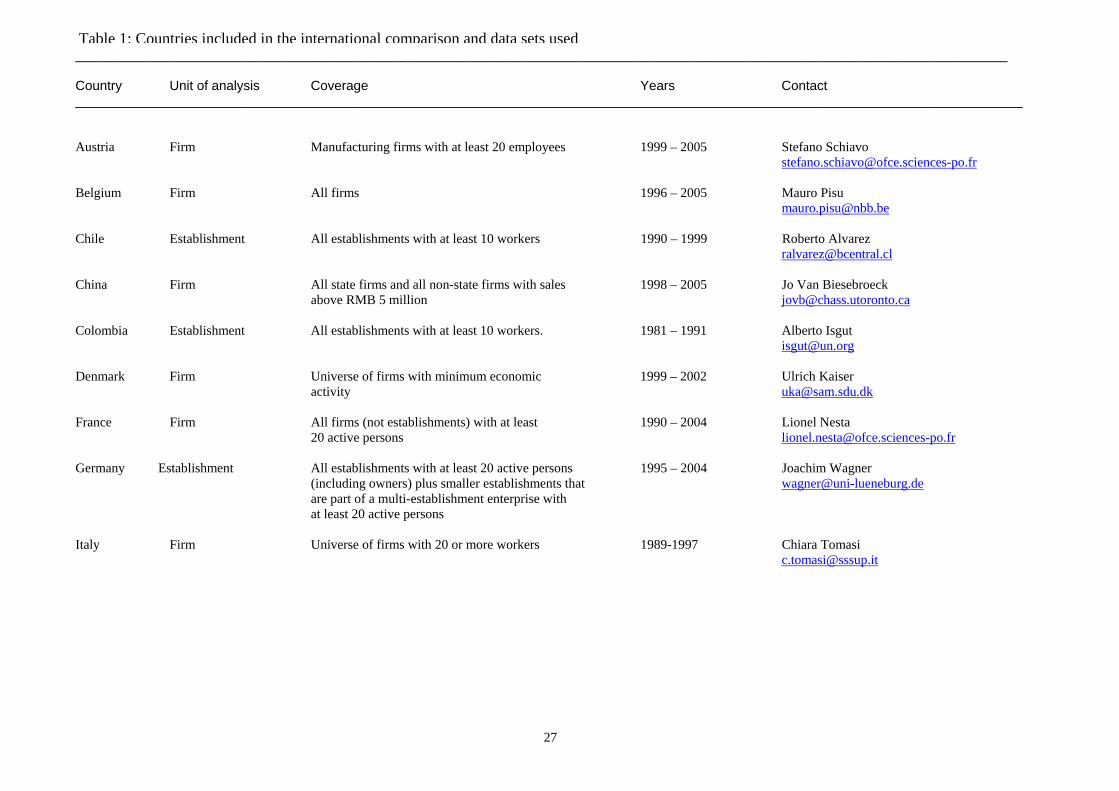
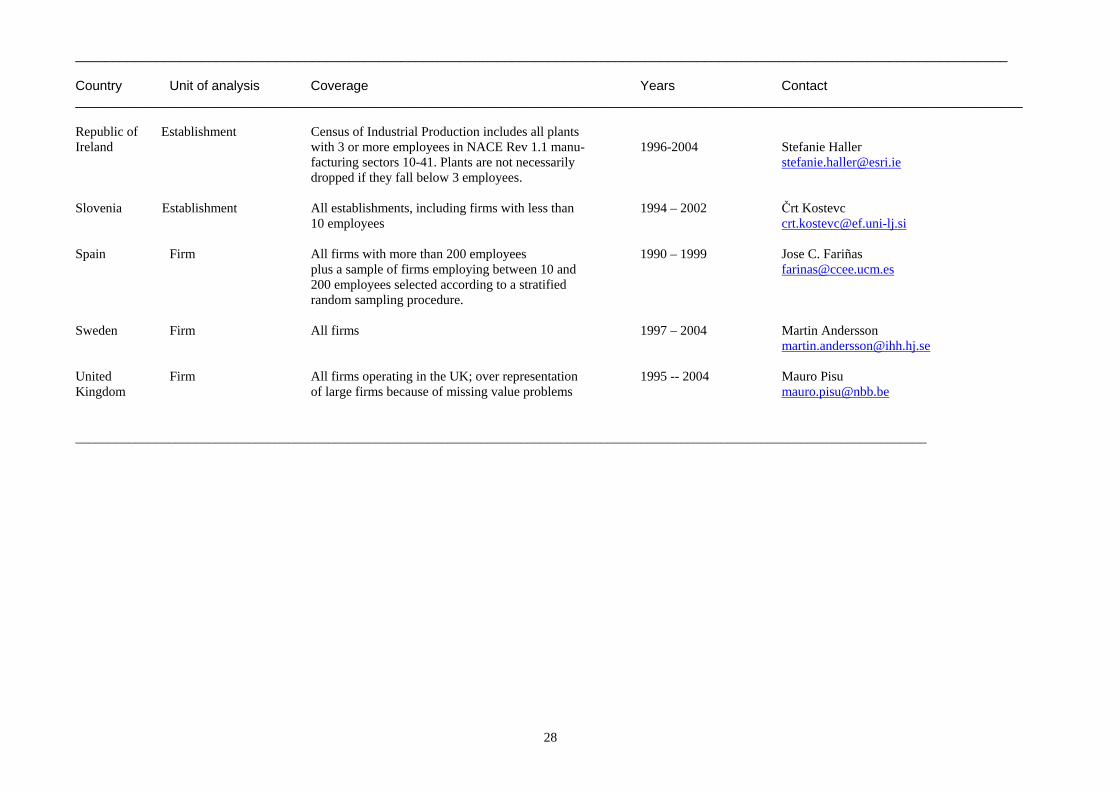
A list of the 14 countries involved in this international comparison study, and some
information on the data sets used, are given in Table 1. While most of the countries come
from the European Union, Chile and Colombia from South America and China from Asia are
included, too.3
[Table 1 near here]
The data are either at the level of the establishment (the plant, the local production unit) or at
the level of the firm (the legal unit). Unfortunately, it was neither possible to aggregate all
establishment level data to the firm level, nor was it possible to split up firm level information
to the establishment level. This different level of aggregation is one dimension in which the
results reported in this study are not truly comparable across all countries. The other
3 The composition of the sample of countries included is the result of a call for participation sent out by Joachim Wagner early in 2005 to all authors of studies covered in Wagner (2007). Unfortunately, not all of them agreed to participate, but, fortunately, others joined later when they heard of the project. Researchers from countries not yet represented in the group are cordially invited to join – please contact Joachim Wagner by mailing to [email protected].
5
dimension is due to the different years covered. If we had limited the data used to years that
are covered in all data sets, we would have ended up with a reduced set of countries and a
small number of years. Therefore, we decided to use all the information at hand, and to
control for the different years covered in the estimation of the empirical models. For any
details of the data sets used, and how to access them, readers may contact the persons listed in
Table 1.
Some of the data sets cover units with at least 20 employees, some with at least 10
employees, and some have information on all units. Results reported in this paper are for units
with at least 20 employees; for those countries whose data sets cover units with at least 10
employees, comparable results are shown in a set of Tables in Appendix III. Furthermore, all
computations are limited to units from manufacturing industries with NACE 2 letters code
DA to DN (or ISIC code 15 to 36); a list of these industries is given in Appendix I.1.
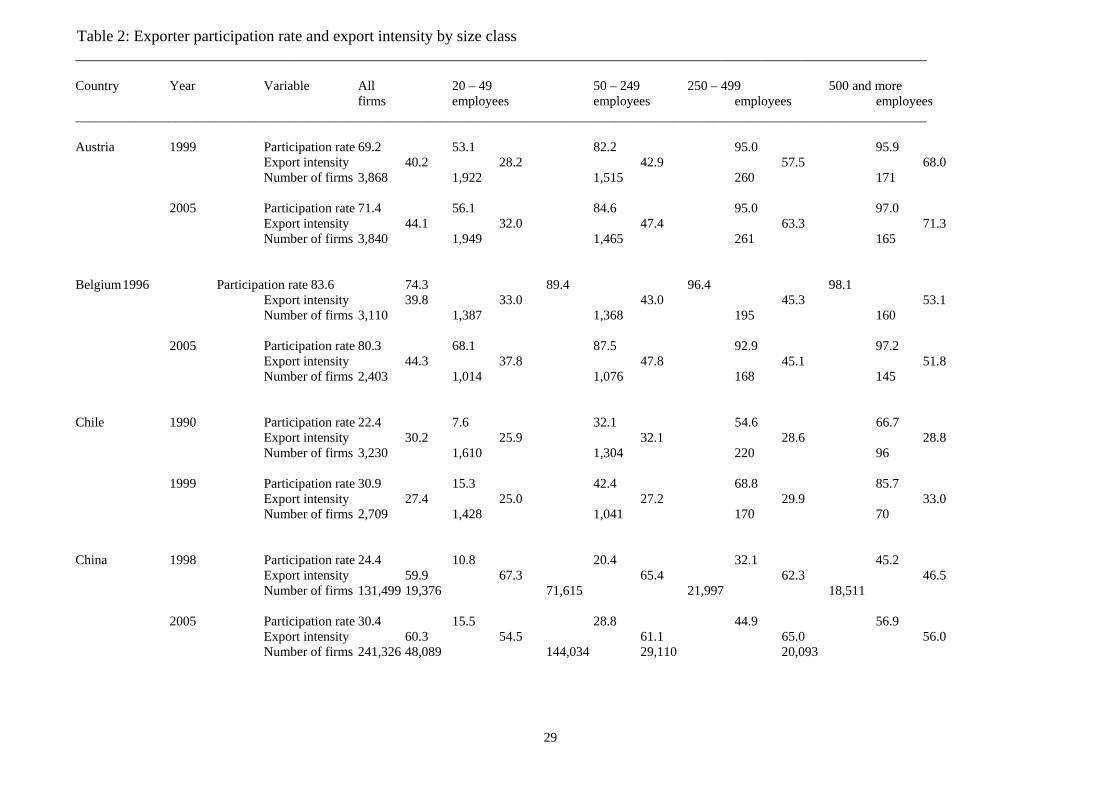
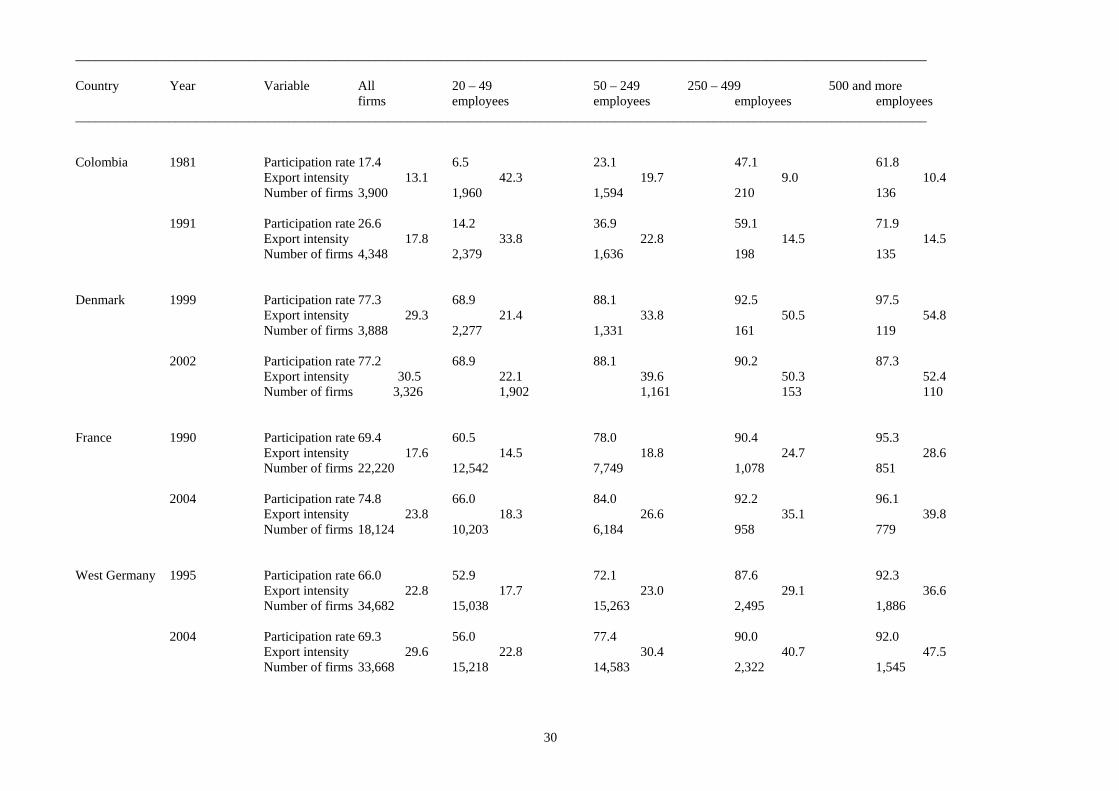
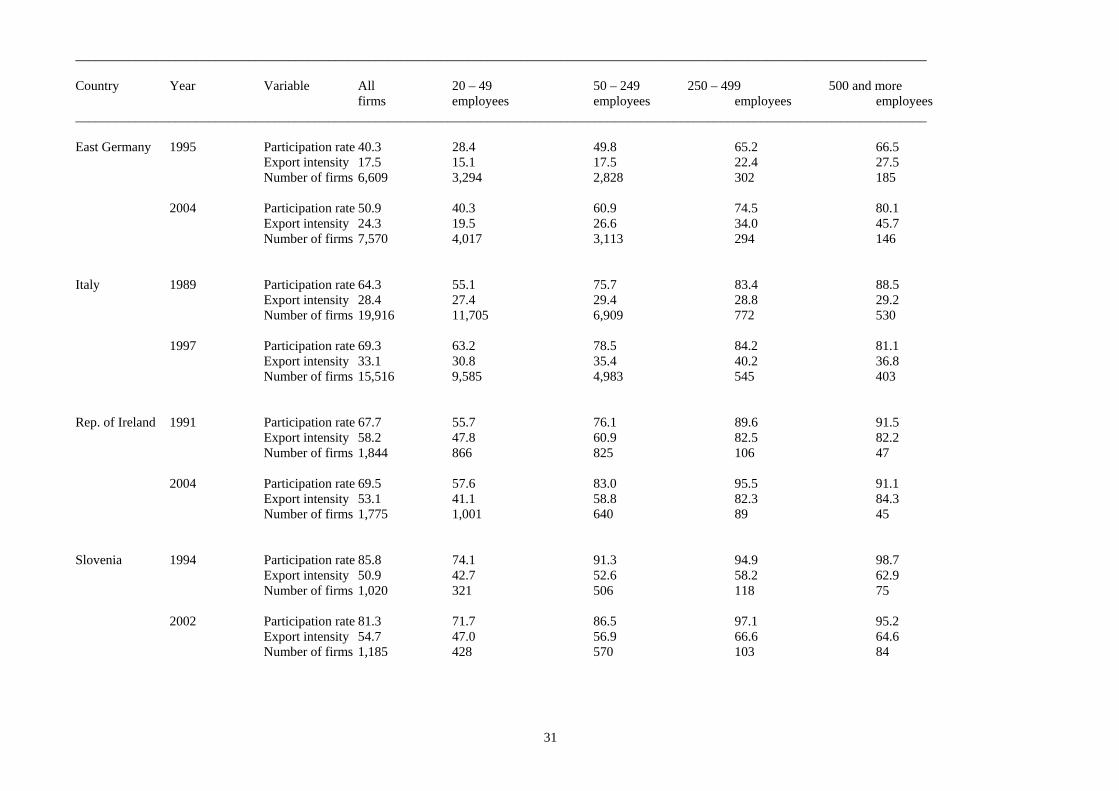
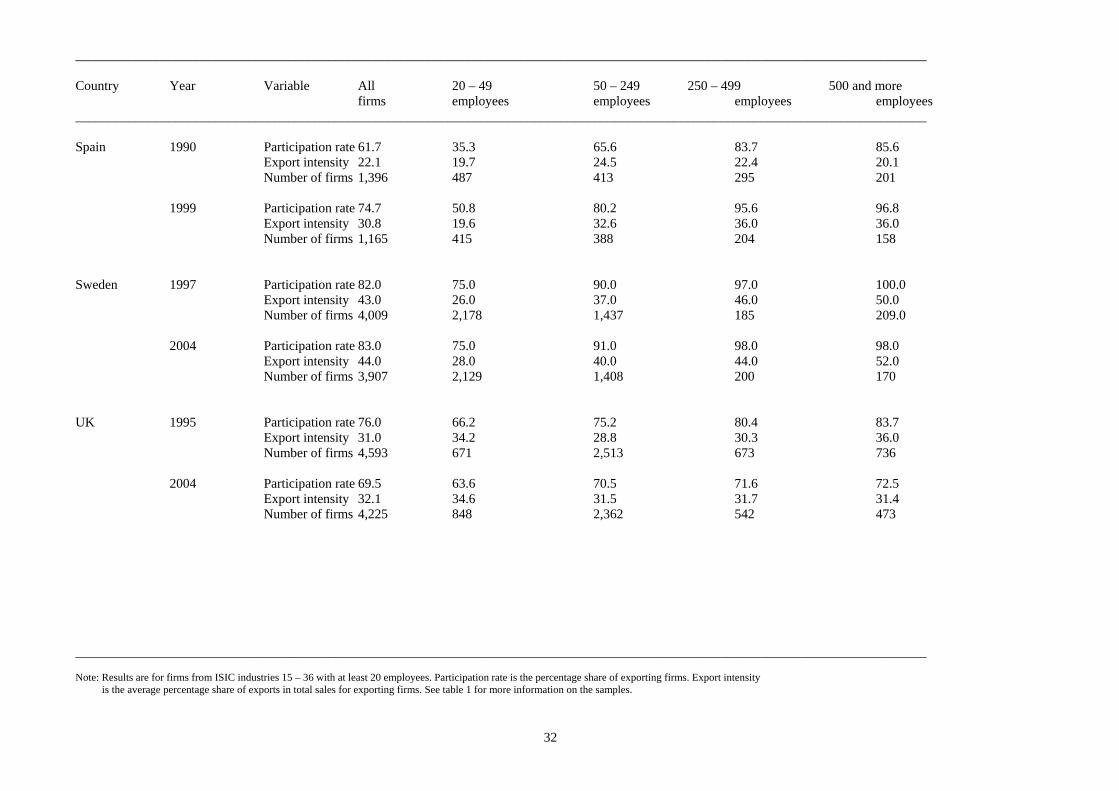
The exporter participation rate (defined as the percentage of exporting firms) and the
export intensity rate (defined as the average share of exports in total sales for exporting firms)
in the 14 countries4 are reported for both the first and the last year covered in the data set used
here for all units and for units from four size classes (20 – 49 employees; 50 – 249 employees;
250 – 499 employees; 500 and more employees) in Table 2.
[Table 2 near here]
Table 2 documents that both the exporter participation rate and the export intensity differ
widely across the countries covered in this study. Looking at the figure for all firms,5 and the
most recent year covered, the exporter participation rate ranges from 26.6 percent for
Colombia to 83 percent for Sweden. Note that this participation rate is loosely decreasing in
the size of the domestic markets of the countries (with China and Germany being outliers
4 Given that there are still large differences between West Germany and the former communist East Germany, results are reported for both parts of Germany individually. 5 From now on we will use the term ‘firm’ to refer to the unit of analysis irrespective of whether the data are collected at the establishment or the enterprise level.
6
here). Furthermore, it did not increase over the period covered for all countries; for instance,
the share of manufacturing firms active in exporting did not grow for Belgium, Denmark,
Slovenia, and the UK. The export participation rate tends to be higher among firms from the
larger size classes, although there is no strict relationship in this for Denmark, Italy, the
Republic of Ireland, Slovenia, and Sweden. Looking at export intensity, there are again
remarkable cross-country differences. While exports cover only a small share of all sales of
exporters from Colombia (18 percent), France and East Germany (24 percent), this share is
rather high in Austria, Belgium and Sweden (44 percent), the Republic of Ireland (53
percent), and especially China (60 percent), and it increases with firm size in more than half
of the countries covered.6
3. Empirical Results I: Exporter Productivity Premia
To investigate differences in productivity between exporters and non-exporters we
start with the computation of the so-called exporter productivity premia, defined as the ceteris
paribus percentage difference of productivity between exporters and non-exporters.
Productivity is measured in a number of different ways in the literature, including labour
productivity (defined as sales, or value added, per employee, or per hour worked) and several
variants of total factor productivity. Given that information on value added, hours worked,
and the capital stock used in the firm is available for some of the countries included in this
international comparison project only, we have to rely on the simplest measure of
productivity, i.e. sales per employee (measured in constant prices).7
6 Appendix I.2 documents that both the exporter participation rate and the export intensity differ widely between industries in a country, and between countries in an industry. 7 For a robustness check of the results based on different measures of productivity for some countries see Section 6 below. Note that value added is not necessarily a better basis to measure productivity than sales, turnover or gross output. The reason is that value added does not track production in a year as closely as gross output or turnover would do (see Oulton and O’Mahony 1994, pp. 25ff). Bartelsman and Doms (2000, p. 575) point to the fact that heterogeneity in labour productivity has been found to be accompanied by similar heterogeneity in total factor productivity. Furthermore, Foster, Haltiwanger and Syverson (2005) show that productivity measures that are based on sales (i.e., quantities multiplied by prices) and measures that are based on quantities only are highly positively correlated.
7
The exporter labour productivity premia are computed from a regression of log labour
productivity on the current export status dummy and a set of control variables
(1) ln LPit = a + ß Exportit + c Controlit + eit
where i is the index of the firm, t is the index of the year, LP is labour productivity,
Export is a dummy variable for current export status (1 if the firm exports in year t, 0 else),
Control is a vector of control variables that includes the log of number of employees and its
squared value to measure firm size, the log of wages and salaries per employee (in constant
prices) to proxy for human capital, and a full set of interaction terms of 4-digit industry-
dummies8 and year dummies to control for industry-specific differences in capital intensity
and shocks, and e is an error term. The exporter productivity premium, computed from the
estimated coefficient ß as 100*(exp(ß)-1), shows the average percentage difference in labour
productivity between exporters and non-exporters controlling for the characteristics included
in the vector Control. To control for unobserved plant heterogeneity due to time-invariant
firm characteristics which might be correlated with the variables included in the empirical
model and which might lead to a biased estimate of the exporter productivity premia, a variant
of (1) is estimated including fixed firm effects, also.
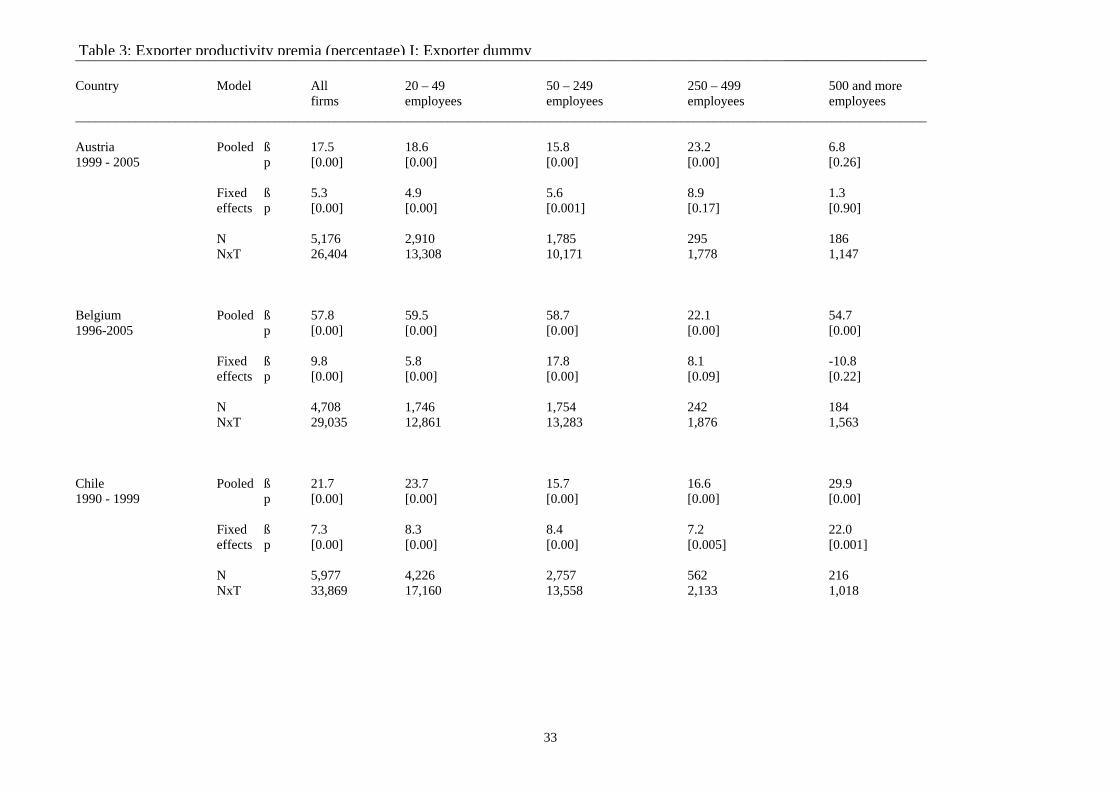
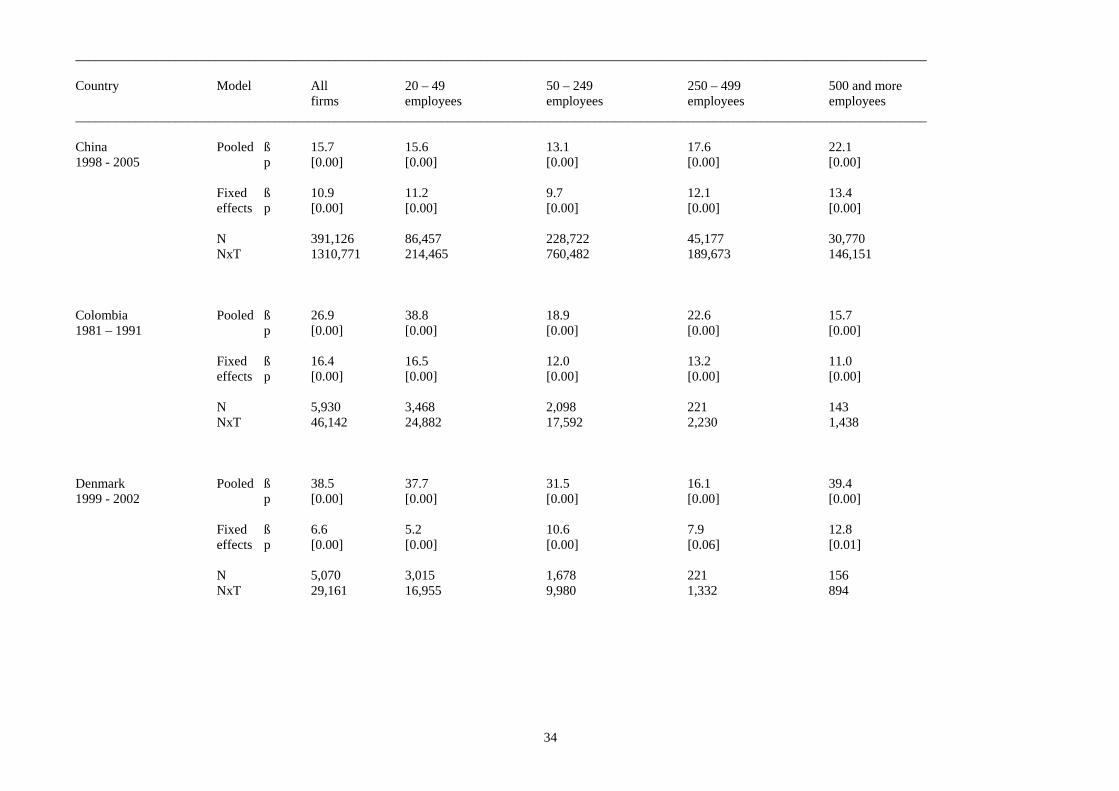
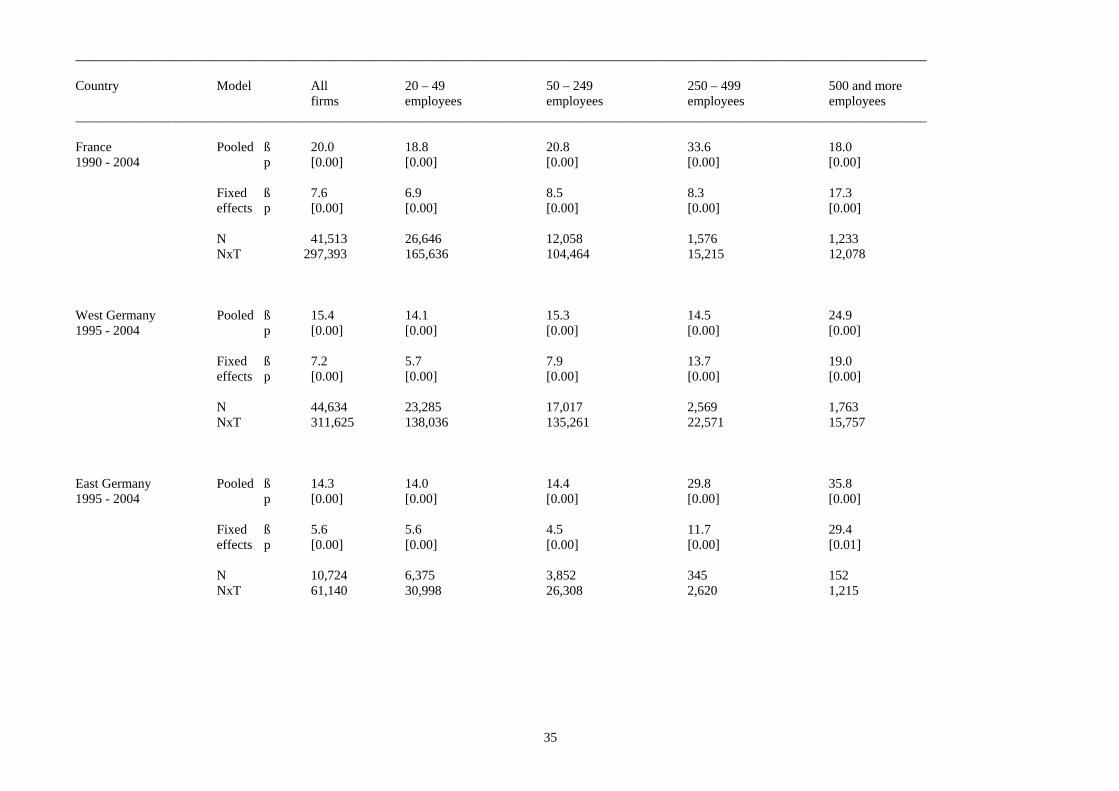
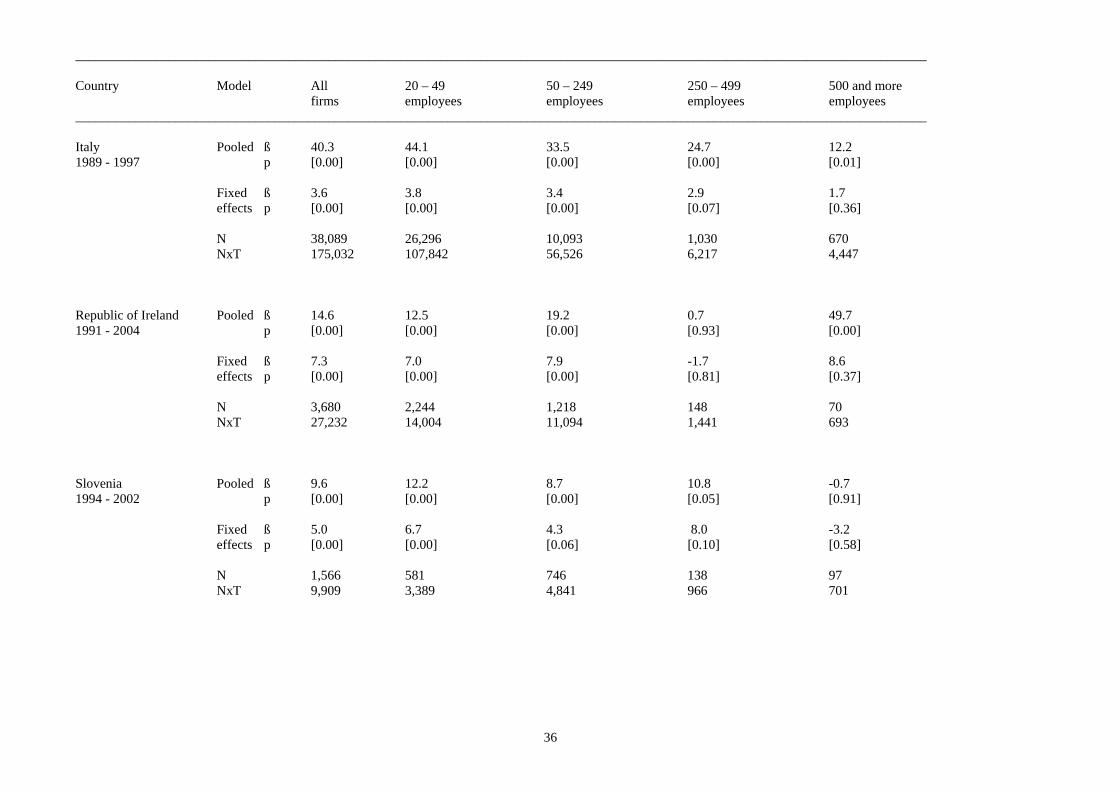
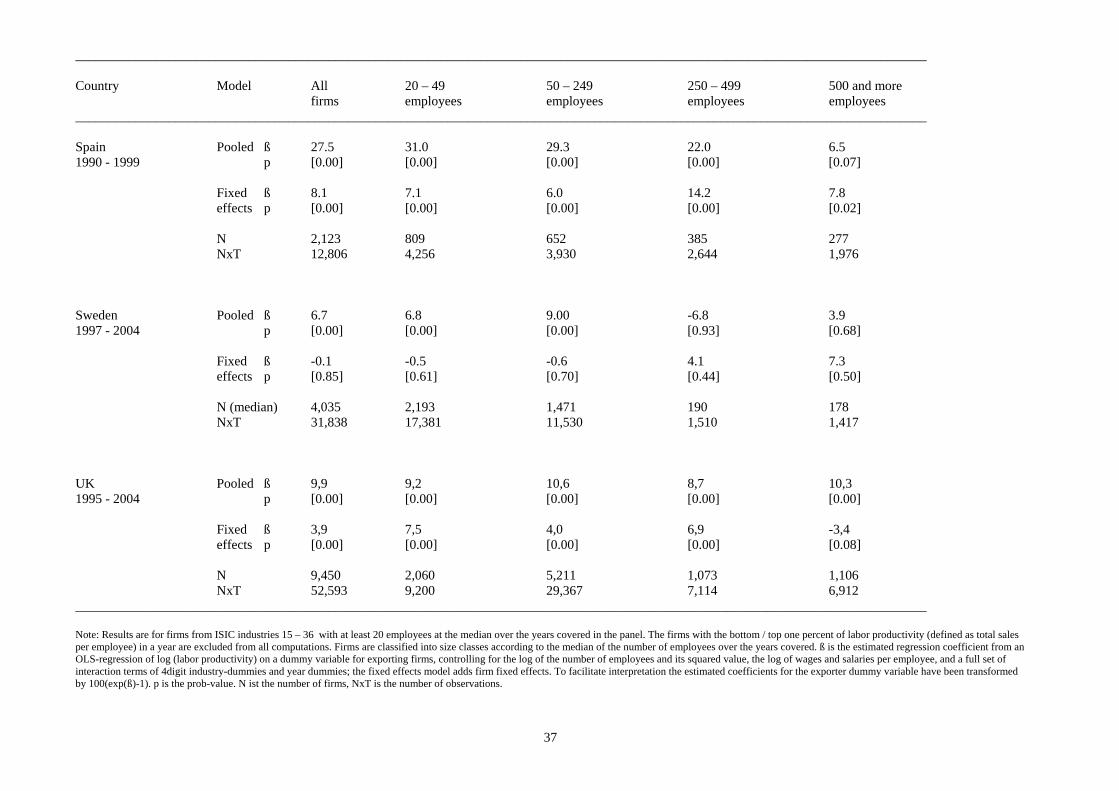
Results for the estimated exporter productivity premia from empirical models with and
without fixed firm effects for each of the 14 countries are reported in Table 3 for samples
covering all firms with more than 20 employees, and firms from the four size classes.9
[Table 3 near here]
8 3-digit industry-dummies had to be used in the case of Italy and Spain. 9 To control for the effects of extreme observations that are often found in these data from official statistics due to reporting errors or idiosyncratic events, the firms with the bottom / top one percent labour productivity in a year are excluded from all computations for this and all following Tables in this study. Furthermore, firms are classified into size classes according to the median of the number of employees over the years covered.
8
Looking at the results for all firms we find that the estimated premia are always statistically
significantly different from zero, and often rather large, for pooled data. If fixed firm effects
are added to control for unobserved heterogeneity the estimated premia are still statistically
significant in all countries but Sweden,10 but the point estimates are much smaller compared
to the results based on pooled data only. Unobserved firm heterogeneity does matter, and,
therefore, we will concentrate on the results from the model including fixed effects.
Table 3 gives new insights on the relative magnitude of the export premia across
countries. For a large majority of countries (6 over the 13 for which export premia are found
statistically significant), the premia lie in a range of 6.6 to 8.1 percent. Two subgroups of
countries emerge however which display relatively high and relatively low export premia.
The first subgroup includes Colombia (16.4 percent) and Belgium (9.8 percent) while the
second subgroup includes Austria (5.3 percent), UK (3.9 percent), Italy (3.6 percent),
Slovenia (5 percent), and East Germany (5.6 percent). Interestingly, the size of the premia
seems to be unrelated to the degree of economic development of the countries - the order of
magnitude is the same for Chile and China on the one hand, and France, West Germany, the
Republic of Ireland and Spain on the other hand. This is illustrated in Figure 1 where the
estimated exporter premia are plotted against GDP per capita. If Colombia and Sweden
(where the exporter premium is not statistically different from zero) are disregarded, the
scatterplot reveals a rather flat structure.11
[Figure 1 near here]
10 There is no definite reason for the insignificance of the productivity premia in the Swedish case. One plausible explanation is that Sweden has a limited domestic market and entry costs to the neighboring countries (Denmark, Norway and Finland) are supposedly low (cf. Andersson 2007). Another is that many Swedish firms belong to multinational corporations with established trading networks to foreign countries. Andersson, Johansson and Lööf (2007) show that about 35 % of Swedish manufacturing firms belong to MNEs and that MNEs are responsible for over 90 % of the total value of Sweden’s exports. 11 Using firm-level data for 5 East Asian countries, Hallward-Driemeier et al. (2002) find that the magnitude of the export premia is larger in countries with lower per capita income. They argue that developed countries have less-integrated markets, which allows non-exporters with low levels of productivity to survive. In contrast, in more developed economies domestic markets are more integrated, making more difficult for low-productivity non-exporting firms to survive. The meta-analysis presented later in this paper confirms that more open economies have higher export premia.
9
Looking at results by size class we do not find a clear-cut pattern for the magnitude of
the premia. For some countries, including Austria, Belgium, Italy, the Republic of Ireland,
Slovenia and the UK, the point estimates are statistically insignificant at the usual confidence
level of five percent for the largest size class, and sometimes for the firms from the second
largest size class, too.12 This is not the case for the least developed countries in our sample
(China, and Colombia), but it is also not the case for Denmark, France, Germany, and Spain.
Again, there is no apparent link between the size of the premia and the degree of economic
development of the countries. Note, furthermore, that the exporter participation rate in the size
classes does not appear to be related to the statistical significance or otherwise to the
estimated exporter premia – a case in point are Austria and France that have rather similar
participation rates among the firms from the highest size class (see Table 2) but totally
different results for the estimated exporter productivity premia.
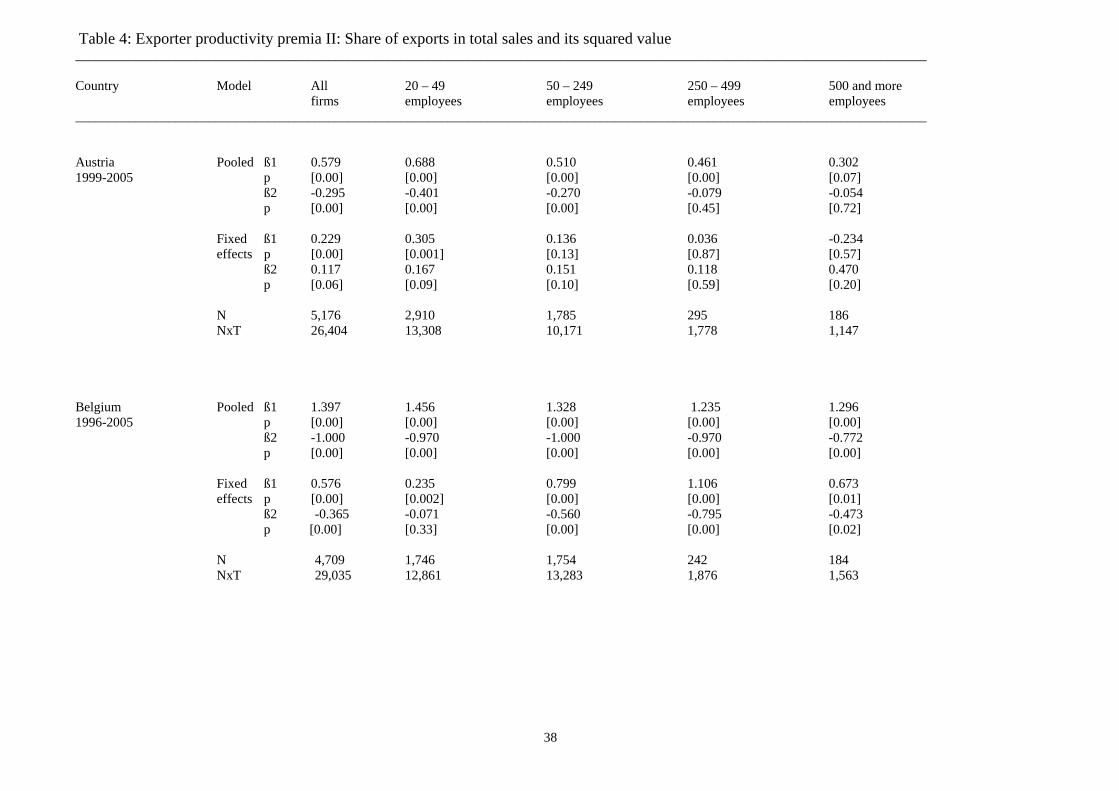
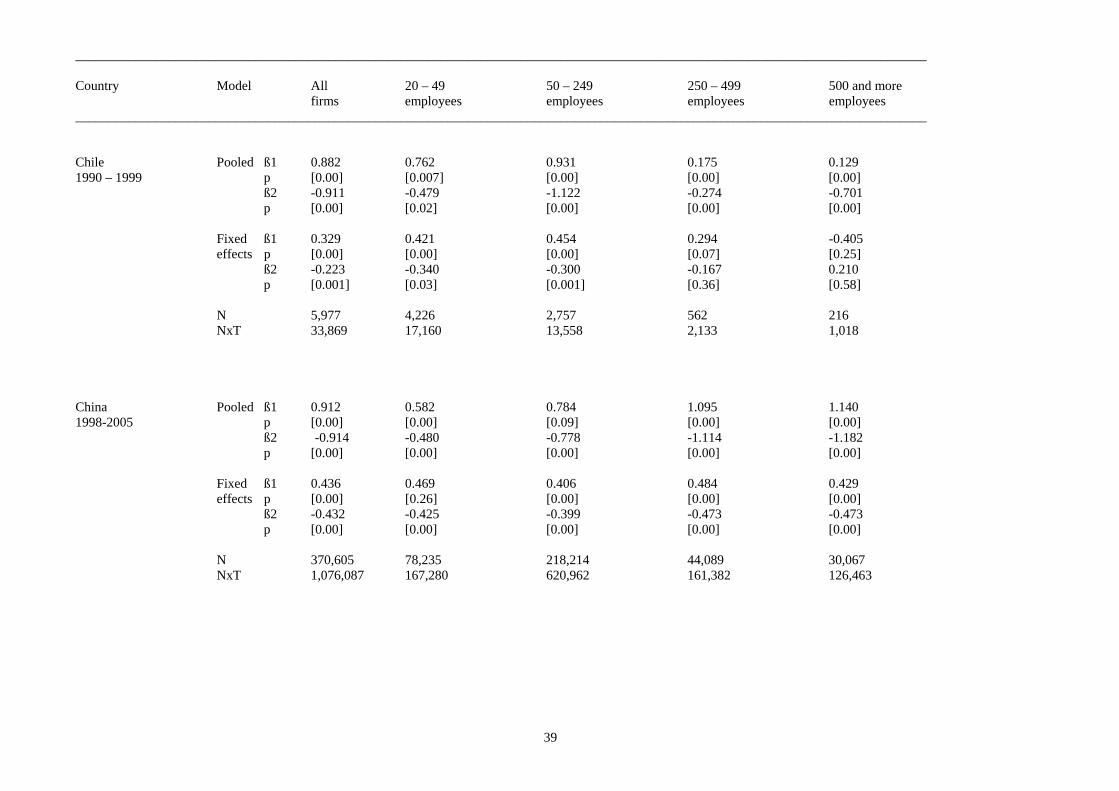
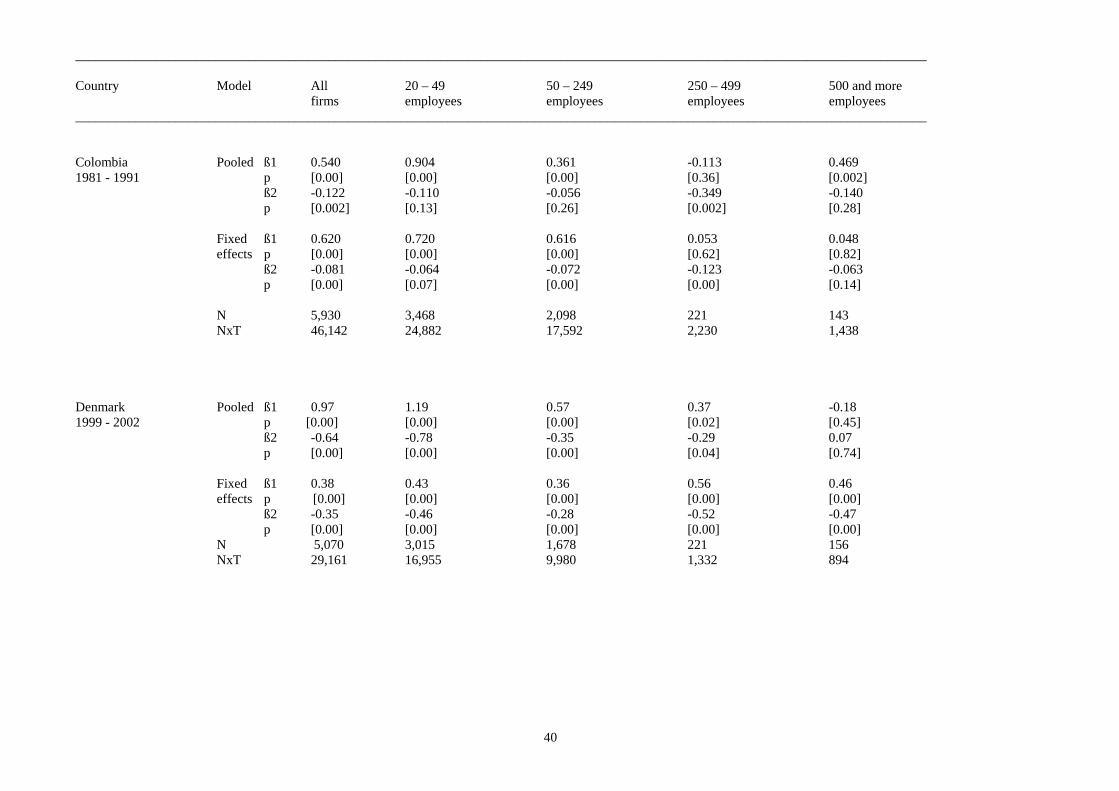
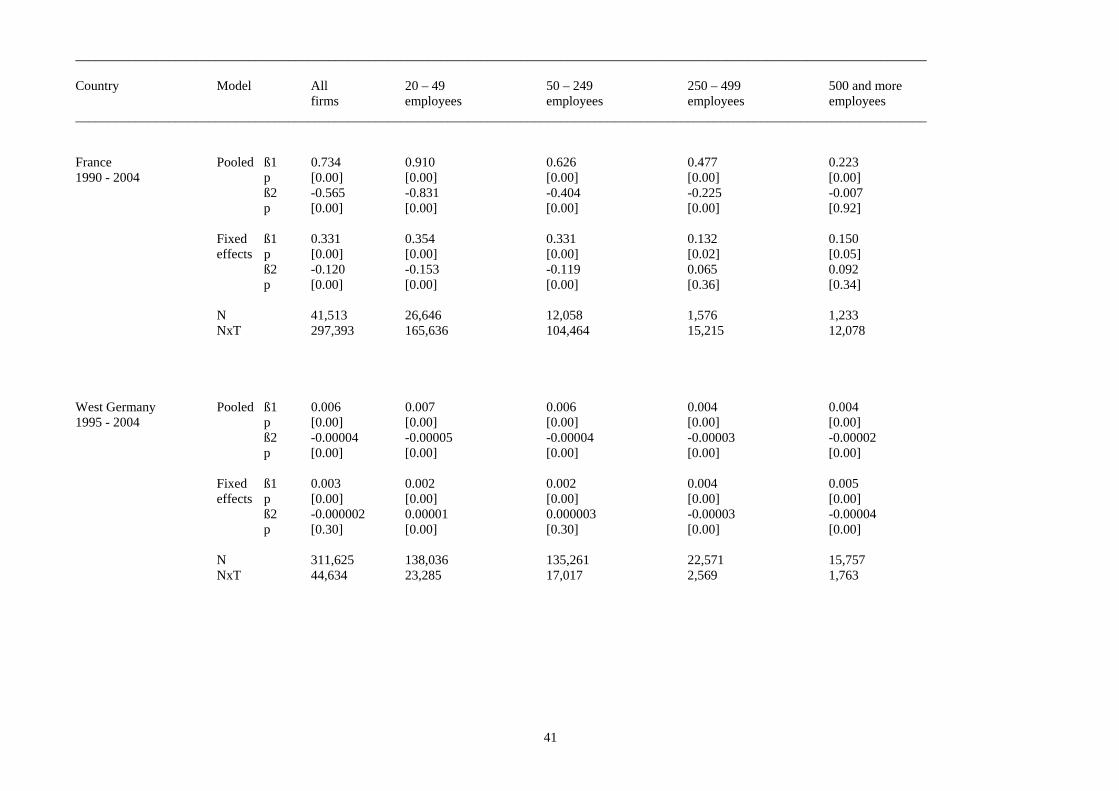
To investigate how the premia vary with export intensity, a modified version of the
empirical model (1) is used where the dummy variable indicating the export status is replaced
by the share of exports in total sales and its squared value. The results are reported in Table 4.
[Table 4 near here]
Given that the results differ considerably when fixed firm effects are added to the
model estimated with pooled data, we again focus on the results from the empirical model
controlling for unobserved firm heterogeneity. From the results reported in Table 4 for all
firms we conclude that the share of exports in total sales matters for the size of the exporter
productivity premia in all countries but Slovenia13 because at least one of the two estimated
coefficients (for the share of exports in total sales, and for its squared value) is statistically
different from zero at the five percent level. Looking at the pattern of the signs of the
estimated coefficients, and focusing on point estimates that are statistically different from
12 This is likely caused by the fact that most large firms do export, so that there is not enough variation in the sample to yield a statistically significant coefficient; see Table 2.
10
zero at the five percent level, we find that the exporter productivity premium varies with the
share of exports in total sales as follows:
• it increases (either both estimated coefficients have a positive sign, or the coefficient
with a negative sign is statistically insignificant) in Austria, West Germany, East
Germany, Italy, Republic of Ireland, and the UK;14
• it increases at a decreasing rate (the coefficient of the share of exports in total sales is
positive, the coefficient of the squared value is negative, and the estimated maximum
is reached for a value of the share of exports that is either higher than 100 percent, or
very high compared to the average share of exports in total sales of the exporting firms
according to Table 2) in Belgium, Chile, Colombia, Denmark, France, and Spain;
• it increases, reaches a maximum at around 50 percent, and decreases afterwards in
China; and
• it decreases (the positive coefficient of the squared term is statistically insignificant) in
Sweden.
As in the case of the exporter productivity premia estimated from the exporter status
dummy variable, the degree of economic development of the countries does not appear to
matter for the pattern of the relationship between export intensity and productivity when
eyeballing the data. Note that the sign pattern often differs between the size classes, and that
for some size classes the results point to no relationship between export intensity and
productivity at all even when there is a statistically significant relationship for all firms taken
together.
While eyeballing the results gives us some idea of what may or may not drive the
differences, we also pursue a more rigorous approach by conducting a meta-regression
13 This is in line with findings from other studies using Slovenian firm data; for a discussion see Damijan, Polanec and Prasnicar (2004) and Damijan and Kostevc (2006). 14 In the UK data the sign pattern is “- / +”, but the estimated minimum of the parabola is 8.3 percent, so this indicates that the exporter premium is increasing in the share of exports in total sales in general.
11
analysis based on the coefficient estimates reported in Tables 3 and 4. Meta-analysis is a tool
that can be fruitfully used to summarise, and explain variations in results of a number of
similar empirical studies concerned with one research topic.15 To be more precise, we
estimate an equation of the form
(2) coefficientj = βXj + εj
where the dependent variable is the coefficient reported in Tables 3 or 4 and X is a vector of
potential explanatory variables, including both variables relating to the estimation method and
country characteristics. We allow the error term to be correlated within but not across
countries. A detailed list of variables included in our analysis is provided in Appendix II.
The results for a meta-regression analysis on the results from Tables 3 and 4 are
provided in Table 5. Columns (1) to (3) provide results based on the coefficients in Table 3.
In the first column we use as explanatory variables some characteristics of the estimation
method, i.e., whether the estimation is fixed effects or not, the number of observations used,
and dummy variables for the size class for which the estimation was carried out.16 Also, we
include a full set of country dummy variables with Slovenia being the baseline country. The
results show that the estimation technique matters – unsurprisingly, fixed effects estimates
are, on average, lower than those obtained from OLS. The number of observations and size
class does not seem to matter, however. As for the country dummies, we find that all
countries except Sweden have a positive and statistically significant coefficient, i.e., the
export premium is, all other things equal, higher in these countries than in Slovenia. However,
the point estimates vary substantially, from 1 (UK) to 21 (Belgium).
[Table 5 near here]
We then try to explain the strong differences across countries that were indicated by
the dummies. In a first step (column 2) we replace the dummies by two characteristics of the
15 Görg and Strobl (2001) is a recent example of a meta-analysis in the international economics literature.
12
different datasets: a dummy to proxy whether or not the data is at establishment (vs. firm)
level and the midpoint year of the country’s sample. However, neither of these two variables
returns a statistically significant coefficient.
In column (3) we include a host of other country characteristics that may potentially
explain differences in export premia. These include the size of the economy, proxied by the
GDP, its level of development, proxied by GDP per capita, the overall openness of the
economy, and institutional characteristics. The latter are proxied using indices on the ease of
doing business, the effectiveness of government and regulatory quality. We can justify the
inclusion of these variables based on recent models of firm heterogeneity (Melitz 2003),
where the existence of trade costs explains why only some firm export. We expect more open
economies and those with better institutional characteristics to have lower trade costs. In such
a case, the productivity differential between exporters and non-exporter would tend to be
lower.
Including these variables in the regression shows that, once we control for a number of
observable country characteristics and other attributes of the data and estimation technique,
estimates from establishment level data are systematically higher than those from firm level
data. The meta-regression analysis verifies the lack of a statistically significant relationship
between export premia and GDP per capita reported in Figure 1. However, we find that other
country-specific variables matter. For instance, we find that country size, proxied by the
country’s GDP, is positively related to the export premia, although the effect is small.
Furthermore, we find that in more open economies exporting firms display larger differentials
vis-à-vis non exporters. As for the indicators on institutional quality we find that countries
with a more business friendly environment, and countries with more effective government
also show, ceteris paribus, higher exporting premia.
16 The baseline category is large firms with more than 500 employees. Note that we do not include as dependent variables in the meta-analysis regressions the coefficients obtained based on all firms, we only include the coefficients obtained by size class.
13
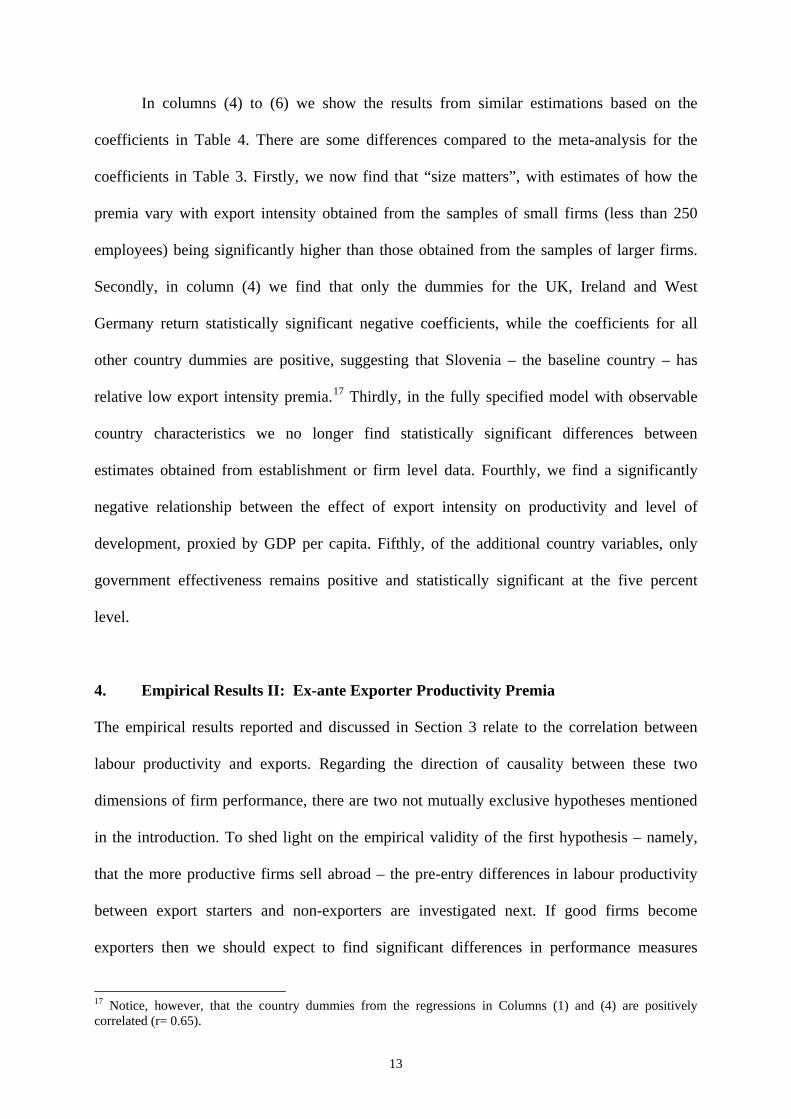
In columns (4) to (6) we show the results from similar estimations based on the
coefficients in Table 4. There are some differences compared to the meta-analysis for the
coefficients in Table 3. Firstly, we now find that “size matters”, with estimates of how the
premia vary with export intensity obtained from the samples of small firms (less than 250
employees) being significantly higher than those obtained from the samples of larger firms.
Secondly, in column (4) we find that only the dummies for the UK, Ireland and West
Germany return statistically significant negative coefficients, while the coefficients for all
other country dummies are positive, suggesting that Slovenia – the baseline country – has
relative low export intensity premia.17 Thirdly, in the fully specified model with observable
country characteristics we no longer find statistically significant differences between
estimates obtained from establishment or firm level data. Fourthly, we find a significantly
negative relationship between the effect of export intensity on productivity and level of
development, proxied by GDP per capita. Fifthly, of the additional country variables, only
government effectiveness remains positive and statistically significant at the five percent
level.
4. Empirical Results II: Ex-ante Exporter Productivity Premia
The empirical results reported and discussed in Section 3 relate to the correlation between
labour productivity and exports. Regarding the direction of causality between these two
dimensions of firm performance, there are two not mutually exclusive hypotheses mentioned
in the introduction. To shed light on the empirical validity of the first hypothesis – namely,
that the more productive firms sell abroad – the pre-entry differences in labour productivity
between export starters and non-exporters are investigated next. If good firms become
exporters then we should expect to find significant differences in performance measures
17 Notice, however, that the country dummies from the regressions in Columns (1) and (4) are positively correlated (r= 0.65).
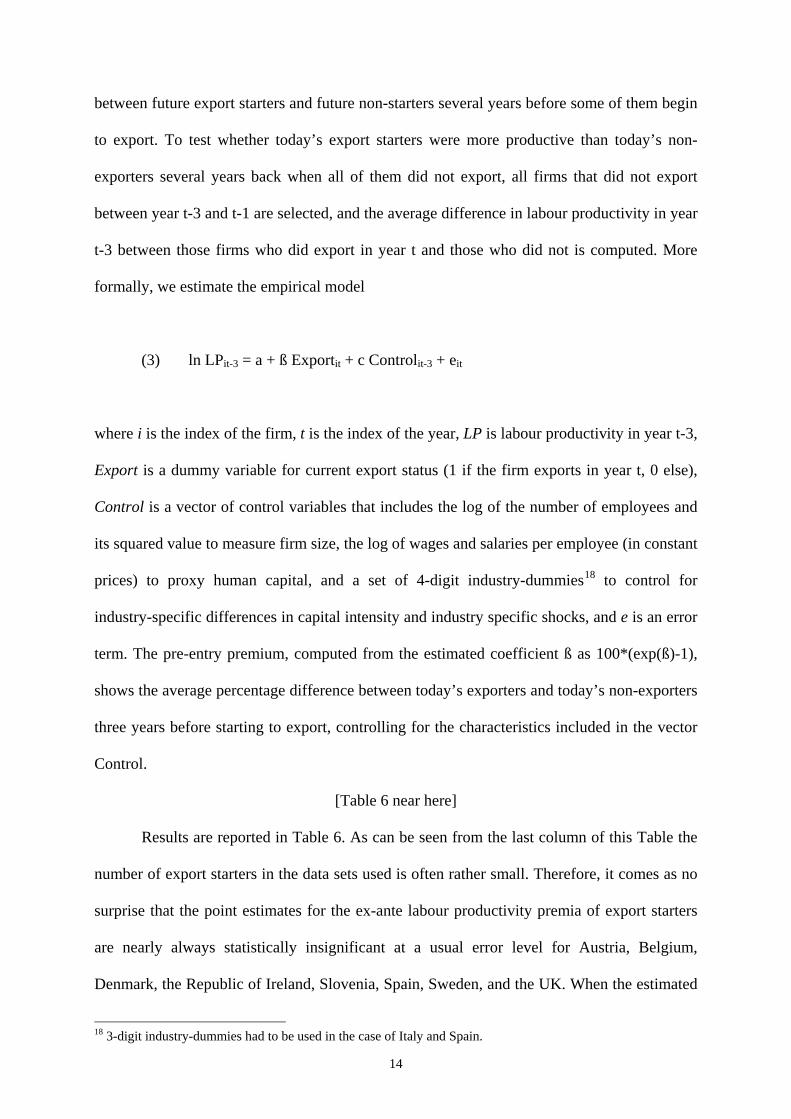
14
between future export starters and future non-starters several years before some of them begin
to export. To test whether today’s export starters were more productive than today’s non-
exporters several years back when all of them did not export, all firms that did not export
between year t-3 and t-1 are selected, and the average difference in labour productivity in year
t-3 between those firms who did export in year t and those who did not is computed. More
formally, we estimate the empirical model
(3) ln LPit-3 = a + ß Exportit + c Controlit-3 + eit
where i is the index of the firm, t is the index of the year, LP is labour productivity in year t-3,
Export is a dummy variable for current export status (1 if the firm exports in year t, 0 else),
Control is a vector of control variables that includes the log of the number of employees and
its squared value to measure firm size, the log of wages and salaries per employee (in constant
prices) to proxy human capital, and a set of 4-digit industry-dummies18 to control for
industry-specific differences in capital intensity and industry specific shocks, and e is an error
term. The pre-entry premium, computed from the estimated coefficient ß as 100*(exp(ß)-1),
shows the average percentage difference between today’s exporters and today’s non-exporters
three years before starting to export, controlling for the characteristics included in the vector
Control.
[Table 6 near here]
Results are reported in Table 6. As can be seen from the last column of this Table the
number of export starters in the data sets used is often rather small. Therefore, it comes as no
surprise that the point estimates for the ex-ante labour productivity premia of export starters
are nearly always statistically insignificant at a usual error level for Austria, Belgium,
Denmark, the Republic of Ireland, Slovenia, Spain, Sweden, and the UK. When the estimated
18 3-digit industry-dummies had to be used in the case of Italy and Spain.
15
ex-ante premia in these countries are statistically different from zero, however, they are
positive.
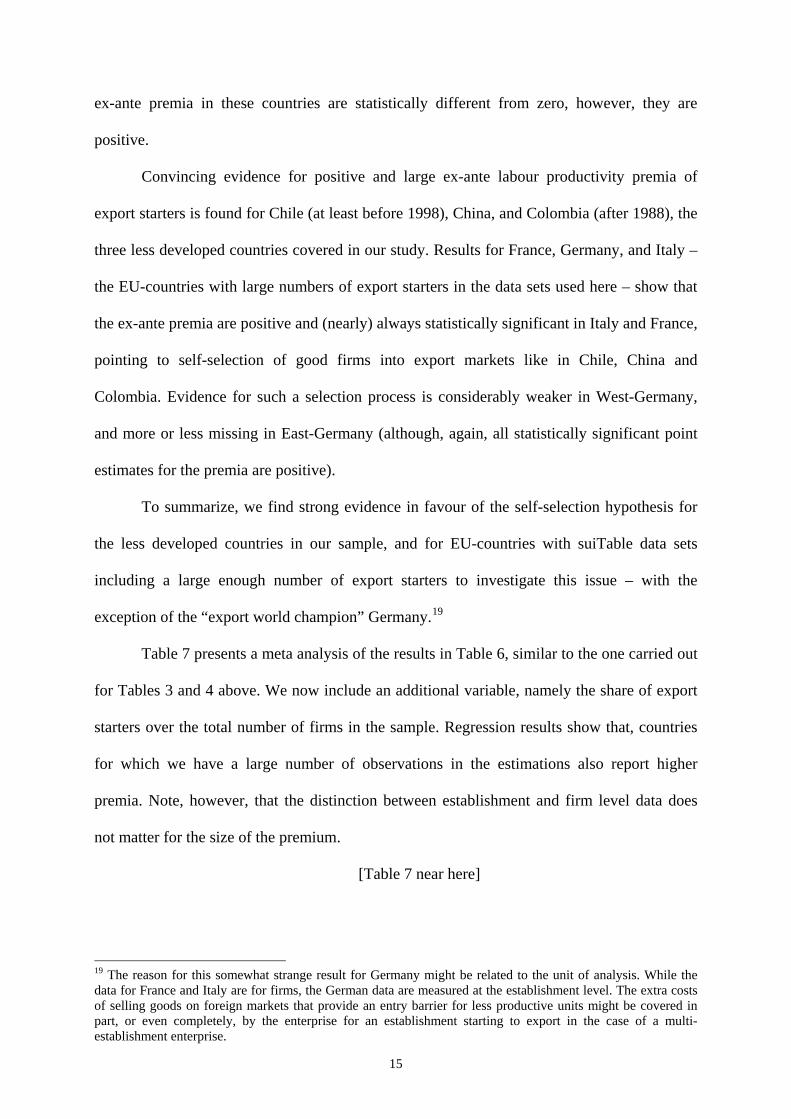
Convincing evidence for positive and large ex-ante labour productivity premia of
export starters is found for Chile (at least before 1998), China, and Colombia (after 1988), the
three less developed countries covered in our study. Results for France, Germany, and Italy –
the EU-countries with large numbers of export starters in the data sets used here – show that
the ex-ante premia are positive and (nearly) always statistically significant in Italy and France,
pointing to self-selection of good firms into export markets like in Chile, China and
Colombia. Evidence for such a selection process is considerably weaker in West-Germany,
and more or less missing in East-Germany (although, again, all statistically significant point
estimates for the premia are positive).
To summarize, we find strong evidence in favour of the self-selection hypothesis for
the less developed countries in our sample, and for EU-countries with suiTable data sets
including a large enough number of export starters to investigate this issue – with the
exception of the “export world champion” Germany.19
Table 7 presents a meta analysis of the results in Table 6, similar to the one carried out
for Tables 3 and 4 above. We now include an additional variable, namely the share of export
starters over the total number of firms in the sample. Regression results show that, countries
for which we have a large number of observations in the estimations also report higher
premia. Note, however, that the distinction between establishment and firm level data does
not matter for the size of the premium.
[Table 7 near here]
19 The reason for this somewhat strange result for Germany might be related to the unit of analysis. While the data for France and Italy are for firms, the German data are measured at the establishment level. The extra costs of selling goods on foreign markets that provide an entry barrier for less productive units might be covered in part, or even completely, by the enterprise for an establishment starting to export in the case of a multi-establishment enterprise.
16
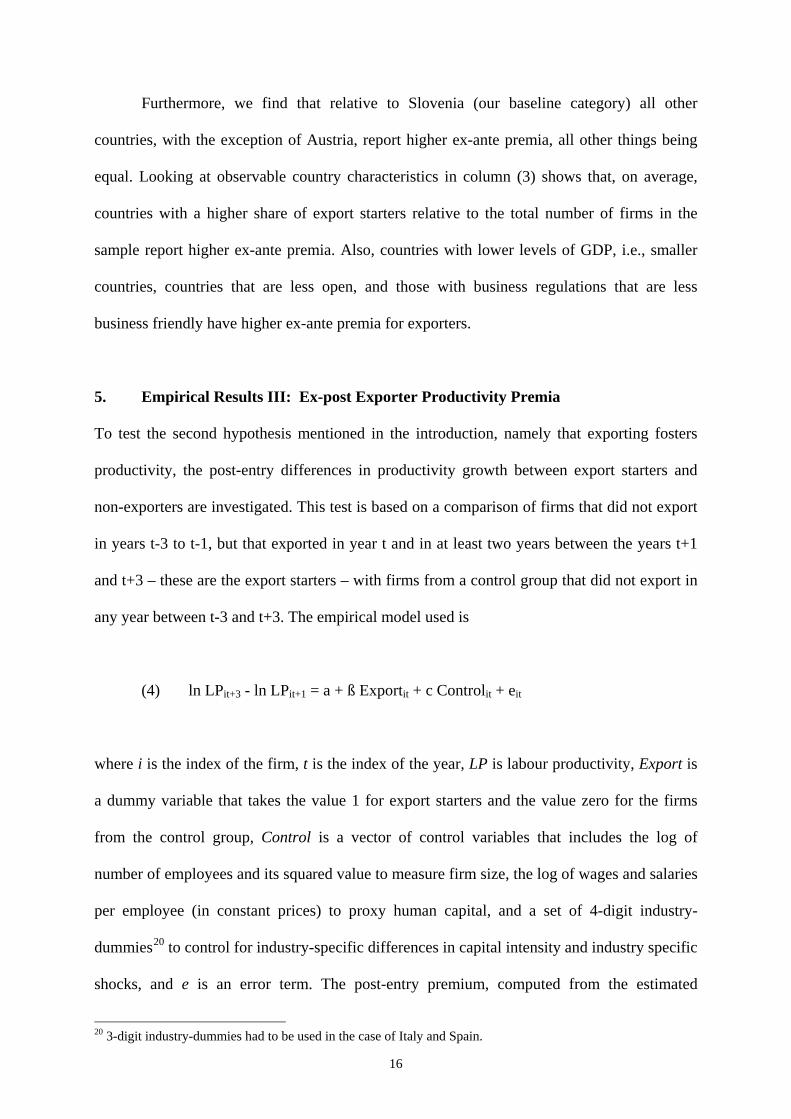
Furthermore, we find that relative to Slovenia (our baseline category) all other
countries, with the exception of Austria, report higher ex-ante premia, all other things being
equal. Looking at observable country characteristics in column (3) shows that, on average,
countries with a higher share of export starters relative to the total number of firms in the
sample report higher ex-ante premia. Also, countries with lower levels of GDP, i.e., smaller
countries, countries that are less open, and those with business regulations that are less
business friendly have higher ex-ante premia for exporters.
5. Empirical Results III: Ex-post Exporter Productivity Premia
To test the second hypothesis mentioned in the introduction, namely that exporting fosters
productivity, the post-entry differences in productivity growth between export starters and
non-exporters are investigated. This test is based on a comparison of firms that did not export
in years t-3 to t-1, but that exported in year t and in at least two years between the years t+1
and t+3 – these are the export starters – with firms from a control group that did not export in
any year between t-3 and t+3. The empirical model used is
(4) ln LPit+3 - ln LPit+1 = a + ß Exportit + c Controlit + eit
where i is the index of the firm, t is the index of the year, LP is labour productivity, Export is
a dummy variable that takes the value 1 for export starters and the value zero for the firms
from the control group, Control is a vector of control variables that includes the log of
number of employees and its squared value to measure firm size, the log of wages and salaries
per employee (in constant prices) to proxy human capital, and a set of 4-digit industry-
dummies20 to control for industry-specific differences in capital intensity and industry specific
shocks, and e is an error term. The post-entry premium, computed from the estimated
20 3-digit industry-dummies had to be used in the case of Italy and Spain.

17
coefficient ß as 100*(exp(ß)-1), shows the average percentage difference in the growth of
labour productivity between the export starters and non-exporters over the three years after
the start, controlling for the characteristics included in the vector Control.
[Table 8 near here]
Results are reported in Table 8. Again, the numbers of export starters that can be
monitored with the data sets available for this study are too small for most countries to offer a
solid basis for a reliable empirical investigation. Overall, the results are mixed, with positive
and negative statistically significant estimates for some years in some countries. Looking at
the results for France, West Germany, and Italy, where the numbers of starters seem to be
large enough for our purpose, we find evidence in favour of the learning-by-exporting
hypothesis for Italy only.
Table 9 reports a meta-analysis of the results in Table 8. Unfortunately, this analysis
does not prove very fruitful in this case. Apart from a handful of country dummy variables all
other variables are statistically insignificant. This may at least be partly due to the small
number of observations available for this analysis.
[Table 9 near here]
6. Robustness Checks
To check the robustness of our results we repeat our empirical analysis with different
measures of productivity, and with firms having at least 10 employees included in the
samples, for the countries where the data needed are available to us.
6.1 Results for Different Productivity Measures
As a first robustness check, we repeat the calculations in Tables 3, 6, and 8 using two
different dependent variables. Subtracting intermediate inputs (which include raw materials
and energy where possible) from total sales, we construct value added and divide it by
18
employment as before to obtain a more customary measure of labour productivity (VA/L).
Subtracting (1-sj)* ln (K/L) from value added per worker, where sj is the wage share in value
added for industry j, we obtain an estimate of total factor productivity (TFP) which is our
third dependent variable.
In Tables 10, 11, and 12, we report results for these two new dependent variables. For
data availability reasons, the results can be obtained only for a subset of the countries. As the
sample size is often reduced due to missing value added or capital information, we report
results using all three dependent variables on the same sub-sample for which we observe TFP.
As before, we drop the 1% outliers at the top and bottom of the productivity distributions. The
reported statistics are calculated exactly as before in Tables 3, 6, and 8, respectively.
The results prove remarkably robust for the new dependent variables. The exporter
productivity premia on the full sample, in Table 10, remain positive and significantly different
from zero for all countries if we use value added per worker instead of sales per worker. The
magnitudes of the effects are uniformly smaller, and the declines range from a factor of seven
for Belgium to less than 10% decline for Colombia. Using TFP as dependent variable, some
coefficients become insignificant and some of the OLS estimates even turn negative. The
preferred fixed effects results remain positive in each case and significantly different from
zero at the 1% level in three of the seven cases. The magnitudes of the export premia are on
average 40% lower if TFP is used as dependent variable rather than sales per worker.
[Table 10 near here]
Comparing export starters to non-starters three years before they enter the export
market, results in Table 11, we find a similar pattern. Most coefficient estimates remain
positive using VA/L as dependent variable, but their size and significance are lower. The same
is true for Belgium, China, and Italy if we use TFP as dependent variable. For Colombia,
19
France, and the U.K., negative effects dominate but most of them are not statistically
significant.21
[Table 11 near here]
Finally, results in Table 12 revisit the learning-by-exporting question by looking at
productivity premia three years after new exporters entered the export market. The flimsy
support using sales per worker as dependent variable is mirrored by the estimates in the first
column, and support is not overwhelming for the other two dependent variables either. Still,
for some countries the support gets slightly stronger using VA/L or TFP as dependent
variable, although the significance tends to be quite low. Positive and marginally significant
results remain for Italy most years and weak support gets a tad stronger for Belgium, France,
Ireland and the UK. The negative coefficient estimates for China for S/L become much
smaller for TFP and even turn positive in one year. Results for Colombia are never
significant. In contrast with the results in the previous two Tables, the TFP results are not
uniformly weaker. A caveat is in order though. We measure TFP assuming the same
importance of capital for all firms in an industry.22 If exporters and non-exporters operate
with a different technology, as Van Biesebroeck (2006) argues, they would face a different
capital-labour trade-off. Especially in countries or industries where the majority of firms do
not export this will lead to an overestimate of productivity for exporters as they accumulate
capital.
[Table 12 near here]
21 Negative estimates would suggest that firms invest in new capital equipment prior to entering the export market, as shown by Van Biesebroeck (2005) using data on African firms. The exercise in this paper does not allow examining this idea as we do not follow the same groups of entrants over time.
20
6.2 Results for Units with At Least 10 Employees
In order to ensure comparability across countries the main results had to be restricted to units
– firms or establishments – with 20 and more employees. For those countries with a small
average unit size this means that up to 50% of their firm population is outside the analysis.
Appendix III presents results from repeating the analysis for those countries where
information on units with 10 or more employees is available as a second robustness check.
The Tables are organised and numbered so that they can be compared directly to those in the
main part of the paper. With some qualifications the main results continue to hold.
The descriptive statistics in Appendix III Table 2 indicate that export participation is
increasing in unit size, thus when the group of units with 10-19 employees are included the
rate of export participation for all units decreases somewhat. The same observation is true in
most cases for export intensity, with the exceptions of Colombia where export intensity
decreases with firm size as well as Belgium and Sweden where close to 50% and in some
years more of the units with 10-19 employees are exporters.
The results for exporter productivity premia measured by export status in Appendix III
Table 3 also indicate that exporters have significantly higher labour productivity than non-
exporters. The size of the overall coefficient from the fixed effect regression is slightly larger
for almost all countries when compared to the results for units with 20 and more employees.
Exceptions here are Colombia where the coefficients are nearly unchanged and Denmark
where the premium for exporters is lower in the sample with 10 or more employees.
The relationship between the exporter productivity premium and the share of exports
in total sales as described in Section 3 is somewhat more pronounced for most countries when
estimated from the sample with 10 or more employees (Appendix III Table 4). It remains
insignificant for the UK and Slovenia in the fixed effect regressions. In the case of Belgium
the linear term becomes negative and the squared term for export intensity remains
22 Estimating productivity econometrically would require the same assumption.
21
statistically significant, but loses its economic significance. For Colombia the size of the
coefficient on export intensity is nearly unchanged while the size of the coefficient on export
intensity squared is almost halved in absolute value terms.
Where the ex-ante exporter productivity premium was estimated to be positive and
significant in the sample with 20 or more employees, this is confirmed by larger and more
precise estimates for nearly all cases in the samples with 10 or more employees depicted in
Appendix III Table 6. An exception here is Sweden; in the sample with 20 or more employees
none of the ex-ante exporter productivity premia are significant. In turn, when the units with
10 or more employees are added the ex-ante exporter productivity premia are negative for all
years and nearly all of them are significant at the 5% level.
Finally, the results from Appendix III Table 8 do not provide any more evidence of
ex-post exporter productivity premia than in the samples with 20 or more employees apart
from the occasional cohort. This is despite the fact that the number of export starters and
controls is somewhat larger in this more comprehensive set of units with 10 and more
employees.
7. Concluding Remarks
The overall results from our study that uses comparable micro level panel data for 14
countries to look at the relationships between exports and productivity using identically
specified empirical models are in line with the big picture that is by now familiar from the
literature: Exporters are more productive than non-exporters when observed and unobserved
heterogeneity is controlled for, and these exporter productivity premia tend to increase with
the share of exports in total sales. Furthermore, we find strong evidence in favour of the self-
selection hypothesis for the less developed countries in our sample, and for all EU-countries
with data sets including a large enough number of export starters to investigate this issue but
22
Germany. On the other hand, we find evidence in favour of the learning-by-exporting
hypothesis for Italy only.
However, the paucity of evidence on learning-by-exporting found on this paper should
be qualified, as it might be dependent on the specific methodology utilized. For instance, a
number of recent works find positive effect of export experience on productivity using more
sophisticated estimation techniques and controlling for the bias caused by the self-selection of
the most productive plants into exporting (see e.g. Van Biesebrock, 2005; Isgut and
Fernandes, 2007; Lileeva and Trefler, 2007; and De Loecker, 2007). Moreover, the positive
results on Italy are robust to the use of more sophisticated techniques such as propensity score
matching and difference-in-differences (Serti and Tomasi, 2007). More research is needed on
this area.
The main contribution to the literature added by this study is to document that the
magnitude of exporter premia differs considerably across countries even in the identically
specified empirical models that are used here. We also find that the size of the premia is
unrelated to the degree of economic development of the countries – the order of magnitude is
the same for Chile and China on the one hand, and France, West Germany, the Republic of
Ireland and Spain on the other hand. Conducting a meta-regression analysis of our results we
find that this is true even when controlling for other country and sample characteristics. We
also find that countries that are more open and have more effective government report higher
productivity premia.
Furthermore, although the exporter productivity premia tend to increase with the share
of exports in total sales, this pattern is far from identical for the countries covered in our
study. And the ex-ante productivity premia for export starters that might be interpreted as the
productivity advantage that future export starters must at least have to cover the extra costs
associated with becoming an exporter, seem to differ by an order of magnitude between
countries as exemplified by the results for France and Italy reported in Table 6.

23
A next step in the analysis of the relation between exports and productivity should
closely focus on these cross-country differences that were shown by our study not to be
related to the use of different types of data nor to the application of differently specified
empirical models in the econometric investigations. A solid understanding of the nature and
the causes of these differences across countries is a pre-requisite for any sound policy-
oriented conclusions that might help to foster export-driven growth.
24
References
Andersson, Martin. 2007. “Entry Costs and Adjustments on the Extensive Margin – an
analysis of how familiarity breeds exports”, CESIS Working Paper, Royal Institute of
Technology, Stockholm
Andersson, Martin, Sara Johansson and Hans Lööf. 2007. ”Firm Performance and
International Trade – evidence from a small open economy”, Royal Institute of
Technology, Stockholm
Bartelsman, Eric J. and Mark Doms. 2000. “Understanding Productivity: Lessons from
Longitudinal Data.” Journal of Economic Literature XXXVIII (3), 569-594.
Bernard, Andrew B. and J. Bradford Jensen. 1995. “Exporters, Jobs, and Wages in U.S.
Manufacturing: 1976-1987.” Brookings Papers on Economic Activity:
Microeconomics. 67-119.
Bernard, Andrew B. and J. Bradford Jensen. 1999. “Exceptional exporter performance: cause,
effect, or both?” Journal of International Economics 47, 1-25.
Bernard, Andrew B. and J. Bradford Jensen. 2004. “Exporting and Productivity in the USA.”
Oxford Review of Economic Policy 20, 343-357.
Bernard, Andrew B. and Joachim Wagner. 1997. “Exports and Success in German
Manufacturing.” Weltwirtschaftliches Archiv / Review of World Economics 133, 134-
157.
Damijan, Joze P., Saso Polanec and Janez Prasnikar. 2004. “Self-selection, Export Market
Heterogeneity and Productivity Improvements: Firm Level Evidence from Slovenia.”
Katholieke Universiteit Leuven, LICOS Discussion Paper 148.
Damijan, Joze P. and Crt Kostevc. 2006. “ Learning-by-Exporting: Continuous Productivity
Improvements or Capacity Utilization Effects? Evidence from Slovenian Firms.”
Review of World Economics 142, 599-614.
25
De Loecker Jan. 2007. “Do Exports Generate Higher Productivity? Evidence from Slovenia.”
Journal of International Economics, 73, September 2007, 69–98
Foster, Lucia, John Haltiwanger and Chad Syverson. 2005. “Reallocation, Firm Turnover, and
Efficiency: Selection on Productivity or Profitability?” Institute for the Study of Labor
IZA DP No. 1705, August.
Görg, Holger and Eric Strobl. 2001. "Multinational companies and productivity spillovers: A
meta-analysis." Economic Journal 111, F723-F739
Greenaway, David and Richard Kneller. 2007. “Firm Heterogeneity, Exporting and Foreign
Direct Investment: A Survey.” Economic Journal 117, F134-F161.
Hallward-Driemeier, Mary, Giuseppe Iarossi and Kenneth L. Sokoloff. 2002. “Export and
Manufacturing Productivity in East Asia: A Comparative Analysis with Firm-Level
Data.” NBER Working Paper 8894.
Isgut, Alberto and Ana Fernandes. 2007. "Learning-by-Exporting Effects: Are They for
Real?" MPRA Paper 3121, University Library of Munich, Germany.
Kaufmann, Daniel, Kraay, Aart and Massimo Mastruzzi, 2007. "Governance Matters V:
Governance Indicators for 1996-2006," World Bank Policy Research Working Paper
4280.
Lileeva Alla and Daniel Trefler. 2007. “Improved Access to Foreign Markets Raises Plant-
Level Productivity ... for Some Plants.” NBER Working Paper No. 13297.
López, Ricardo A. 2005. “Trade and Growth: Reconciling the Macroeconomic and
Microeconomic Evidence.” Journal of Economic Surveys 19, 623-648.
Melitz, M. J. (2003). “The Impact of Trade on Intra-Industry Reallocations and Aggregate
Industry Productivity.” Econometrica 71, 1695-1725.
Oulton, Nicholas and Mary O’Mahony. 1994. “Productivity Growth – A Study of British
Industry 1954-1986”, The National Institute of Economic and Social Research
Occasional Papers XLVI, Cambridge: Cambridge University Press.
26
Serti, Francesco and Chiara Tomasi. 2007. “Self Selection and Post-Entry effects of Exports:
Evidence from Italian Manufacturing firms.” LEM Papers Series No. 2007/20.
Van Biesebroeck, Johannes. 2005. “Exporting Raises Productivity in sub-Saharan African
Manufacturing Firms.” Journal of International Economics 67(2), 373-391.
Van Biesebroeck, Johannes. 2006. “The Sensitivity of Productivity Estimates: Revisiting
Three Important Productivity Debates.” Journal of Business and Economic Statistics
(forthcoming).
Wagner, Joachim. 2007. “Exports and Productivity: A Survey of the Evidence from Firm-
level Data.” The World Economy 30, 1, 60-82.
World Bank, 2005. Doing Business 2005. Washington, DC. World Bank, 2007. World Development Indicators, Washington, DC.
______________________________________________________________________________________________________________________________ Country Unit of analysis Coverage Years Contact ________________________________________________________________________________________________________________________________
27
Austria Firm Manufacturing firms with at least 20 employees 1999 – 2005 Stefano Schiavo [email protected] Belgium Firm All firms 1996 – 2005 Mauro Pisu [email protected] Chile Establishment All establishments with at least 10 workers 1990 – 1999 Roberto Alvarez [email protected] China Firm All state firms and all non-state firms with sales 1998 – 2005 Jo Van Biesebroeck above RMB 5 million [email protected] Colombia Establishment All establishments with at least 10 workers. 1981 – 1991 Alberto Isgut [email protected] Denmark Firm Universe of firms with minimum economic 1999 – 2002 Ulrich Kaiser activity [email protected] France Firm All firms (not establishments) with at least 1990 – 2004 Lionel Nesta 20 active persons [email protected] Germany Establishment All establishments with at least 20 active persons 1995 – 2004 Joachim Wagner (including owners) plus smaller establishments that [email protected] are part of a multi-establishment enterprise with at least 20 active persons Italy Firm Universe of firms with 20 or more workers 1989-1997 Chiara Tomasi [email protected]
Table 1: Countries included in the international comparison and data sets used
______________________________________________________________________________________________________________________________ Country Unit of analysis Coverage Years Contact ________________________________________________________________________________________________________________________________
28
Republic of Establishment Census of Industrial Production includes all plants Ireland with 3 or more employees in NACE Rev 1.1 manu- 1996-2004 Stefanie Haller facturing sectors 10-41. Plants are not necessarily [email protected] dropped if they fall below 3 employees. Slovenia Establishment All establishments, including firms with less than 1994 – 2002 Črt Kostevc 10 employees [email protected] Spain Firm All firms with more than 200 employees 1990 – 1999 Jose C. Fariñas
plus a sample of firms employing between 10 and [email protected] 200 employees selected according to a stratified
random sampling procedure.
Sweden Firm All firms 1997 – 2004 Martin Andersson [email protected] United Firm All firms operating in the UK; over representation 1995 -- 2004 Mauro Pisu Kingdom of large firms because of missing value problems [email protected] ________________________________________________________________________________________________________________________________
________________________________________________________________________________________________________________________________ Country Year Variable All 20 – 49 50 – 249 250 – 499 500 and more firms employees employees employees employees ________________________________________________________________________________________________________________________________
29
Austria 1999 Participation rate 69.2 53.1 82.2 95.0 95.9 Export intensity 40.2 28.2 42.9 57.5 68.0 Number of firms 3,868 1,922 1,515 260 171 2005 Participation rate 71.4 56.1 84.6 95.0 97.0 Export intensity 44.1 32.0 47.4 63.3 71.3 Number of firms 3,840 1,949 1,465 261 165 Belgium 1996 Participation rate 83.6 74.3 89.4 96.4 98.1 Export intensity 39.8 33.0 43.0 45.3 53.1
Number of firms 3,110 1,387 1,368 195 160 2005 Participation rate 80.3 68.1 87.5 92.9 97.2 Export intensity 44.3 37.8 47.8 45.1 51.8 Number of firms 2,403 1,014 1,076 168 145 Chile 1990 Participation rate 22.4 7.6 32.1 54.6 66.7 Export intensity 30.2 25.9 32.1 28.6 28.8 Number of firms 3,230 1,610 1,304 220 96 1999 Participation rate 30.9 15.3 42.4 68.8 85.7
Export intensity 27.4 25.0 27.2 29.9 33.0 Number of firms 2,709 1,428 1,041 170 70
China 1998 Participation rate 24.4 10.8 20.4 32.1 45.2 Export intensity 59.9 67.3 65.4 62.3 46.5 Number of firms 131,499 19,376 71,615 21,997 18,511 2005 Participation rate 30.4 15.5 28.8 44.9 56.9 Export intensity 60.3 54.5 61.1 65.0 56.0 Number of firms 241,326 48,089 144,034 29,110 20,093
Table 2: Exporter participation rate and export intensity by size class
________________________________________________________________________________________________________________________________ Country Year Variable All 20 – 49 50 – 249 250 – 499 500 and more firms employees employees employees employees ________________________________________________________________________________________________________________________________
30
Colombia 1981 Participation rate 17.4 6.5 23.1 47.1 61.8 Export intensity 13.1 42.3 19.7 9.0 10.4 Number of firms 3,900 1,960 1,594 210 136 1991 Participation rate 26.6 14.2 36.9 59.1 71.9 Export intensity 17.8 33.8 22.8 14.5 14.5 Number of firms 4,348 2,379 1,636 198 135 Denmark 1999 Participation rate 77.3 68.9 88.1 92.5 97.5 Export intensity 29.3 21.4 33.8 50.5 54.8 Number of firms 3,888 2,277 1,331 161 119 2002 Participation rate 77.2 68.9 88.1 90.2 87.3 Export intensity 30.5 22.1 39.6 50.3 52.4 Number of firms 3,326 1,902 1,161 153 110 France 1990 Participation rate 69.4 60.5 78.0 90.4 95.3 Export intensity 17.6 14.5 18.8 24.7 28.6 Number of firms 22,220 12,542 7,749 1,078 851 2004 Participation rate 74.8 66.0 84.0 92.2 96.1 Export intensity 23.8 18.3 26.6 35.1 39.8 Number of firms 18,124 10,203 6,184 958 779 West Germany 1995 Participation rate 66.0 52.9 72.1 87.6 92.3 Export intensity 22.8 17.7 23.0 29.1 36.6 Number of firms 34,682 15,038 15,263 2,495 1,886 2004 Participation rate 69.3 56.0 77.4 90.0 92.0 Export intensity 29.6 22.8 30.4 40.7 47.5 Number of firms 33,668 15,218 14,583 2,322 1,545
________________________________________________________________________________________________________________________________ Country Year Variable All 20 – 49 50 – 249 250 – 499 500 and more firms employees employees employees employees ________________________________________________________________________________________________________________________________
31
East Germany 1995 Participation rate 40.3 28.4 49.8 65.2 66.5 Export intensity 17.5 15.1 17.5 22.4 27.5 Number of firms 6,609 3,294 2,828 302 185 2004 Participation rate 50.9 40.3 60.9 74.5 80.1 Export intensity 24.3 19.5 26.6 34.0 45.7 Number of firms 7,570 4,017 3,113 294 146 Italy 1989 Participation rate 64.3 55.1 75.7 83.4 88.5 Export intensity 28.4 27.4 29.4 28.8 29.2 Number of firms 19,916 11,705 6,909 772 530 1997 Participation rate 69.3 63.2 78.5 84.2 81.1 Export intensity 33.1 30.8 35.4 40.2 36.8 Number of firms 15,516 9,585 4,983 545 403 Rep. of Ireland 1991 Participation rate 67.7 55.7 76.1 89.6 91.5 Export intensity 58.2 47.8 60.9 82.5 82.2 Number of firms 1,844 866 825 106 47 2004 Participation rate 69.5 57.6 83.0 95.5 91.1 Export intensity 53.1 41.1 58.8 82.3 84.3 Number of firms 1,775 1,001 640 89 45 Slovenia 1994 Participation rate 85.8 74.1 91.3 94.9 98.7 Export intensity 50.9 42.7 52.6 58.2 62.9 Number of firms 1,020 321 506 118 75 2002 Participation rate 81.3 71.7 86.5 97.1 95.2 Export intensity 54.7 47.0 56.9 66.6 64.6 Number of firms 1,185 428 570 103 84
________________________________________________________________________________________________________________________________ Country Year Variable All 20 – 49 50 – 249 250 – 499 500 and more firms employees employees employees employees ________________________________________________________________________________________________________________________________
32
Spain 1990 Participation rate 61.7 35.3 65.6 83.7 85.6 Export intensity 22.1 19.7 24.5 22.4 20.1 Number of firms 1,396 487 413 295 201 1999 Participation rate 74.7 50.8 80.2 95.6 96.8 Export intensity 30.8 19.6 32.6 36.0 36.0
Number of firms 1,165 415 388 204 158 Sweden 1997 Participation rate 82.0 75.0 90.0 97.0 100.0
Export intensity 43.0 26.0 37.0 46.0 50.0 Number of firms 4,009 2,178 1,437 185 209.0 2004 Participation rate 83.0 75.0 91.0 98.0 98.0 Export intensity 44.0 28.0 40.0 44.0 52.0 Number of firms 3,907 2,129 1,408 200 170 UK 1995 Participation rate 76.0 66.2 75.2 80.4 83.7 Export intensity 31.0 34.2 28.8 30.3 36.0
Number of firms 4,593 671 2,513 673 736 2004 Participation rate 69.5 63.6 70.5 71.6 72.5 Export intensity 32.1 34.6 31.5 31.7 31.4 Number of firms 4,225 848 2,362 542 473 ________________________________________________________________________________________________________________________________ Note: Results are for firms from ISIC industries 15 – 36 with at least 20 employees. Participation rate is the percentage share of exporting firms. Export intensity is the average percentage share of exports in total sales for exporting firms. See table 1 for more information on the samples.
________________________________________________________________________________________________________________________________ Country Model All 20 – 49 50 – 249 250 – 499 500 and more firms employees employees employees employees ________________________________________________________________________________________________________________________________
33
Austria Pooled ß 17.5 18.6 15.8 23.2 6.8 1999 - 2005 p [0.00] [0.00] [0.00] [0.00] [0.26]
Fixed ß 5.3 4.9 5.6 8.9 1.3 effects p [0.00] [0.00] [0.001] [0.17] [0.90]
N 5,176 2,910 1,785 295 186 NxT 26,404 13,308 10,171 1,778 1,147 Belgium Pooled ß 57.8 59.5 58.7 22.1 54.7 1996-2005 p [0.00] [0.00] [0.00] [0.00] [0.00] Fixed ß 9.8 5.8 17.8 8.1 -10.8
effects p [0.00] [0.00] [0.00] [0.09] [0.22] N 4,708 1,746 1,754 242 184 NxT 29,035 12,861 13,283 1,876 1,563 Chile Pooled ß 21.7 23.7 15.7 16.6 29.9 1990 - 1999 p [0.00] [0.00] [0.00] [0.00] [0.00] Fixed ß 7.3 8.3 8.4 7.2 22.0 effects p [0.00] [0.00] [0.00] [0.005] [0.001]
N 5,977 4,226 2,757 562 216 NxT 33,869 17,160 13,558 2,133 1,018
Table 3: Exporter productivity premia (percentage) I: Exporter dummy
________________________________________________________________________________________________________________________________ Country Model All 20 – 49 50 – 249 250 – 499 500 and more firms employees employees employees employees ________________________________________________________________________________________________________________________________
34
China Pooled ß 15.7 15.6 13.1 17.6 22.1 1998 - 2005 p [0.00] [0.00] [0.00] [0.00] [0.00] Fixed ß 10.9 11.2 9.7 12.1 13.4 effects p [0.00] [0.00] [0.00] [0.00] [0.00] N 391,126 86,457 228,722 45,177 30,770
NxT 1310,771 214,465 760,482 189,673 146,151 Colombia Pooled ß 26.9 38.8 18.9 22.6 15.7 1981 – 1991 p [0.00] [0.00] [0.00] [0.00] [0.00]
Fixed ß 16.4 16.5 12.0 13.2 11.0 effects p [0.00] [0.00] [0.00] [0.00] [0.00] N 5,930 3,468 2,098 221 143 NxT 46,142 24,882 17,592 2,230 1,438 Denmark Pooled ß 38.5 37.7 31.5 16.1 39.4 1999 - 2002 p [0.00] [0.00] [0.00] [0.00] [0.00] Fixed ß 6.6 5.2 10.6 7.9 12.8 effects p [0.00] [0.00] [0.00] [0.06] [0.01]
N 5,070 3,015 1,678 221 156 NxT 29,161 16,955 9,980 1,332 894
________________________________________________________________________________________________________________________________ Country Model All 20 – 49 50 – 249 250 – 499 500 and more firms employees employees employees employees ________________________________________________________________________________________________________________________________
35
France Pooled ß 20.0 18.8 20.8 33.6 18.0 1990 - 2004 p [0.00] [0.00] [0.00] [0.00] [0.00] Fixed ß 7.6 6.9 8.5 8.3 17.3 effects p [0.00] [0.00] [0.00] [0.00] [0.00] N 41,513 26,646 12,058 1,576 1,233 NxT 297,393 165,636 104,464 15,215 12,078 West Germany Pooled ß 15.4 14.1 15.3 14.5 24.9 1995 - 2004 p [0.00] [0.00] [0.00] [0.00] [0.00] Fixed ß 7.2 5.7 7.9 13.7 19.0 effects p [0.00] [0.00] [0.00] [0.00] [0.00] N 44,634 23,285 17,017 2,569 1,763 NxT 311,625 138,036 135,261 22,571 15,757 East Germany Pooled ß 14.3 14.0 14.4 29.8 35.8 1995 - 2004 p [0.00] [0.00] [0.00] [0.00] [0.00] Fixed ß 5.6 5.6 4.5 11.7 29.4 effects p [0.00] [0.00] [0.00] [0.00] [0.01] N 10,724 6,375 3,852 345 152 NxT 61,140 30,998 26,308 2,620 1,215
________________________________________________________________________________________________________________________________ Country Model All 20 – 49 50 – 249 250 – 499 500 and more firms employees employees employees employees ________________________________________________________________________________________________________________________________
36
Italy Pooled ß 40.3 44.1 33.5 24.7 12.2 1989 - 1997 p [0.00] [0.00] [0.00] [0.00] [0.01] Fixed ß 3.6 3.8 3.4 2.9 1.7 effects p [0.00] [0.00] [0.00] [0.07] [0.36] N 38,089 26,296 10,093 1,030 670 NxT 175,032 107,842 56,526 6,217 4,447 Republic of Ireland Pooled ß 14.6 12.5 19.2 0.7 49.7 1991 - 2004 p [0.00] [0.00] [0.00] [0.93] [0.00] Fixed ß 7.3 7.0 7.9 -1.7 8.6 effects p [0.00] [0.00] [0.00] [0.81] [0.37] N 3,680 2,244 1,218 148 70 NxT 27,232 14,004 11,094 1,441 693 Slovenia Pooled ß 9.6 12.2 8.7 10.8 -0.7 1994 - 2002 p [0.00] [0.00] [0.00] [0.05] [0.91] Fixed ß 5.0 6.7 4.3 8.0 -3.2 effects p [0.00] [0.00] [0.06] [0.10] [0.58] N 1,566 581 746 138 97 NxT 9,909 3,389 4,841 966 701
________________________________________________________________________________________________________________________________ Country Model All 20 – 49 50 – 249 250 – 499 500 and more firms employees employees employees employees ________________________________________________________________________________________________________________________________
37
Spain Pooled ß 27.5 31.0 29.3 22.0 6.5 1990 - 1999 p [0.00] [0.00] [0.00] [0.00] [0.07] Fixed ß 8.1 7.1 6.0 14.2 7.8 effects p [0.00] [0.00] [0.00] [0.00] [0.02] N 2,123 809 652 385 277 NxT 12,806 4,256 3,930 2,644 1,976 Sweden Pooled ß 6.7 6.8 9.00 -6.8 3.9 1997 - 2004 p [0.00] [0.00] [0.00] [0.93] [0.68] Fixed ß -0.1 -0.5 -0.6 4.1 7.3 effects p [0.85] [0.61] [0.70] [0.44] [0.50] N (median) 4,035 2,193 1,471 190 178 NxT 31,838 17,381 11,530 1,510 1,417 UK Pooled ß 9,9 9,2 10,6 8,7 10,3 1995 - 2004 p [0.00] [0.00] [0.00] [0.00] [0.00] Fixed ß 3,9 7,5 4,0 6,9 -3,4 effects p [0.00] [0.00] [0.00] [0.00] [0.08] N 9,450 2,060 5,211 1,073 1,106 NxT 52,593 9,200 29,367 7,114 6,912 ________________________________________________________________________________________________________________________________ Note: Results are for firms from ISIC industries 15 – 36 with at least 20 employees at the median over the years covered in the panel. The firms with the bottom / top one percent of labor productivity (defined as total sales per employee) in a year are excluded from all computations. Firms are classified into size classes according to the median of the number of employees over the years covered. ß is the estimated regression coefficient from an OLS-regression of log (labor productivity) on a dummy variable for exporting firms, controlling for the log of the number of employees and its squared value, the log of wages and salaries per employee, and a full set of interaction terms of 4digit industry-dummies and year dummies; the fixed effects model adds firm fixed effects. To facilitate interpretation the estimated coefficients for the exporter dummy variable have been transformed by 100(exp(ß)-1). p is the prob-value. N ist the number of firms, NxT is the number of observations.
________________________________________________________________________________________________________________________________ Country Model All 20 – 49 50 – 249 250 – 499 500 and more firms employees employees employees employees ________________________________________________________________________________________________________________________________
38
Austria Pooled ß1 0.579 0.688 0.510 0.461 0.302 1999-2005 p [0.00] [0.00] [0.00] [0.00] [0.07] ß2 -0.295 -0.401 -0.270 -0.079 -0.054
p [0.00] [0.00] [0.00] [0.45] [0.72]
Fixed ß1 0.229 0.305 0.136 0.036 -0.234 effects p [0.00] [0.001] [0.13] [0.87] [0.57]
ß2 0.117 0.167 0.151 0.118 0.470 p [0.06] [0.09] [0.10] [0.59] [0.20]
N 5,176 2,910 1,785 295 186 NxT 26,404 13,308 10,171 1,778 1,147
Belgium Pooled ß1 1.397 1.456 1.328 1.235 1.296 1996-2005 p [0.00] [0.00] [0.00] [0.00] [0.00] ß2 -1.000 -0.970 -1.000 -0.970 -0.772 p [0.00] [0.00] [0.00] [0.00] [0.00] Fixed ß1 0.576 0.235 0.799 1.106 0.673 effects p [0.00] [0.002] [0.00] [0.00] [0.01] ß2 -0.365 -0.071 -0.560 -0.795 -0.473 p [0.00] [0.33] [0.00] [0.00] [0.02] N 4,709 1,746 1,754 242 184 NxT 29,035 12,861 13,283 1,876 1,563
Table 4: Exporter productivity premia II: Share of exports in total sales and its squared value
________________________________________________________________________________________________________________________________ Country Model All 20 – 49 50 – 249 250 – 499 500 and more firms employees employees employees employees ________________________________________________________________________________________________________________________________
39
Chile Pooled ß1 0.882 0.762 0.931 0.175 0.129 1990 – 1999 p [0.00] [0.007] [0.00] [0.00] [0.00] ß2 -0.911 -0.479 -1.122 -0.274 -0.701 p [0.00] [0.02] [0.00] [0.00] [0.00] Fixed ß1 0.329 0.421 0.454 0.294 -0.405 effects p [0.00] [0.00] [0.00] [0.07] [0.25] ß2 -0.223 -0.340 -0.300 -0.167 0.210 p [0.001] [0.03] [0.001] [0.36] [0.58] N 5,977 4,226 2,757 562 216 NxT 33,869 17,160 13,558 2,133 1,018 China Pooled ß1 0.912 0.582 0.784 1.095 1.140 1998-2005 p [0.00] [0.00] [0.09] [0.00] [0.00] ß2 -0.914 -0.480 -0.778 -1.114 -1.182 p [0.00] [0.00] [0.00] [0.00] [0.00] Fixed ß1 0.436 0.469 0.406 0.484 0.429 effects p [0.00] [0.26] [0.00] [0.00] [0.00] ß2 -0.432 -0.425 -0.399 -0.473 -0.473 p [0.00] [0.00] [0.00] [0.00] [0.00] N 370,605 78,235 218,214 44,089 30,067 NxT 1,076,087 167,280 620,962 161,382 126,463
________________________________________________________________________________________________________________________________ Country Model All 20 – 49 50 – 249 250 – 499 500 and more firms employees employees employees employees ________________________________________________________________________________________________________________________________
40
Colombia Pooled ß1 0.540 0.904 0.361 -0.113 0.469 1981 - 1991 p [0.00] [0.00] [0.00] [0.36] [0.002] ß2 -0.122 -0.110 -0.056 -0.349 -0.140 p [0.002] [0.13] [0.26] [0.002] [0.28] Fixed ß1 0.620 0.720 0.616 0.053 0.048 effects p [0.00] [0.00] [0.00] [0.62] [0.82] ß2 -0.081 -0.064 -0.072 -0.123 -0.063 p [0.00] [0.07] [0.00] [0.00] [0.14] N 5,930 3,468 2,098 221 143 NxT 46,142 24,882 17,592 2,230 1,438 Denmark Pooled ß1 0.97 1.19 0.57 0.37 -0.18 1999 - 2002 p [0.00] [0.00] [0.00] [0.02] [0.45] ß2 -0.64 -0.78 -0.35 -0.29 0.07 p [0.00] [0.00] [0.00] [0.04] [0.74] Fixed ß1 0.38 0.43 0.36 0.56 0.46 effects p [0.00] [0.00] [0.00] [0.00] [0.00] ß2 -0.35 -0.46 -0.28 -0.52 -0.47 p [0.00] [0.00] [0.00] [0.00] [0.00] N 5,070 3,015 1,678 221 156 NxT 29,161 16,955 9,980 1,332 894
________________________________________________________________________________________________________________________________ Country Model All 20 – 49 50 – 249 250 – 499 500 and more firms employees employees employees employees ________________________________________________________________________________________________________________________________
41
France Pooled ß1 0.734 0.910 0.626 0.477 0.223 1990 - 2004 p [0.00] [0.00] [0.00] [0.00] [0.00] ß2 -0.565 -0.831 -0.404 -0.225 -0.007 p [0.00] [0.00] [0.00] [0.00] [0.92] Fixed ß1 0.331 0.354 0.331 0.132 0.150 effects p [0.00] [0.00] [0.00] [0.02] [0.05] ß2 -0.120 -0.153 -0.119 0.065 0.092 p [0.00] [0.00] [0.00] [0.36] [0.34] N 41,513 26,646 12,058 1,576 1,233 NxT 297,393 165,636 104,464 15,215 12,078 West Germany Pooled ß1 0.006 0.007 0.006 0.004 0.004 1995 - 2004 p [0.00] [0.00] [0.00] [0.00] [0.00] ß2 -0.00004 -0.00005 -0.00004 -0.00003 -0.00002 p [0.00] [0.00] [0.00] [0.00] [0.00] Fixed ß1 0.003 0.002 0.002 0.004 0.005 effects p [0.00] [0.00] [0.00] [0.00] [0.00] ß2 -0.000002 0.00001 0.000003 -0.00003 -0.00004
p [0.30] [0.00] [0.30] [0.00] [0.00] N 311,625 138,036 135,261 22,571 15,757 NxT 44,634 23,285 17,017 2,569 1,763
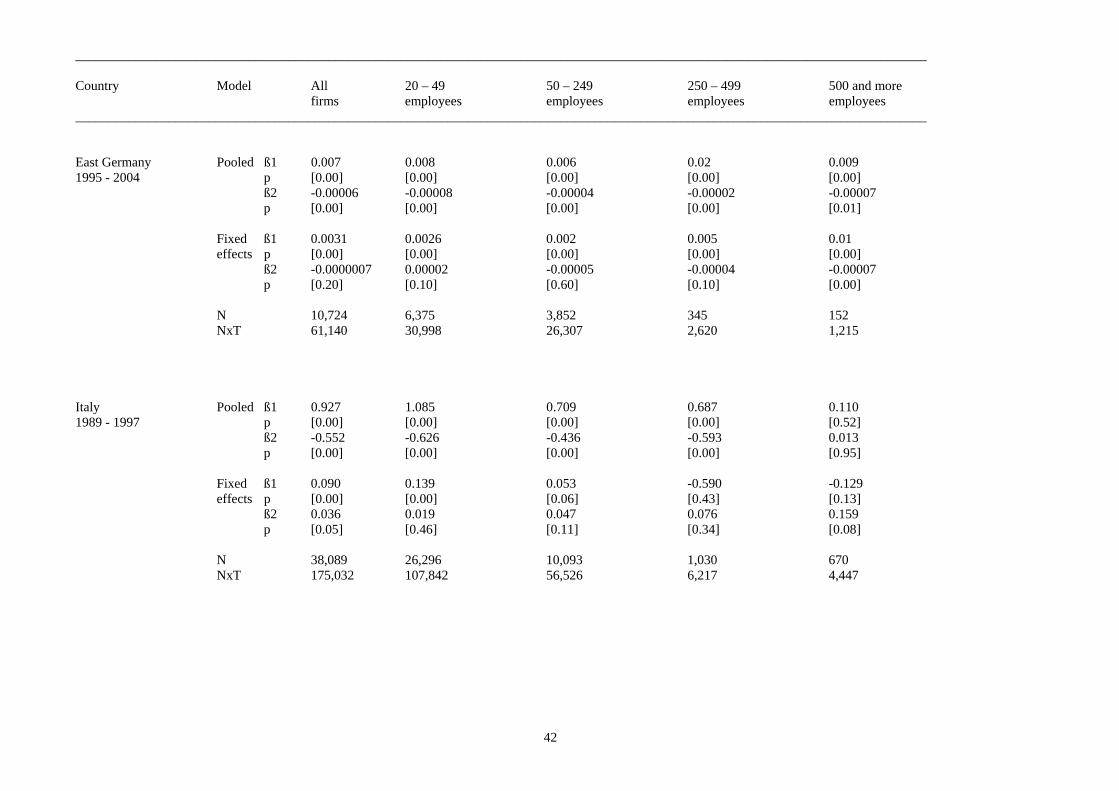
________________________________________________________________________________________________________________________________ Country Model All 20 – 49 50 – 249 250 – 499 500 and more firms employees employees employees employees ________________________________________________________________________________________________________________________________
42
East Germany Pooled ß1 0.007 0.008 0.006 0.02 0.009 1995 - 2004 p [0.00] [0.00] [0.00] [0.00] [0.00] ß2 -0.00006 -0.00008 -0.00004 -0.00002 -0.00007 p [0.00] [0.00] [0.00] [0.00] [0.01] Fixed ß1 0.0031 0.0026 0.002 0.005 0.01 effects p [0.00] [0.00] [0.00] [0.00] [0.00] ß2 -0.0000007 0.00002 -0.00005 -0.00004 -0.00007 p [0.20] [0.10] [0.60] [0.10] [0.00] N 10,724 6,375 3,852 345 152 NxT 61,140 30,998 26,307 2,620 1,215 Italy Pooled ß1 0.927 1.085 0.709 0.687 0.110 1989 - 1997 p [0.00] [0.00] [0.00] [0.00] [0.52] ß2 -0.552 -0.626 -0.436 -0.593 0.013 p [0.00] [0.00] [0.00] [0.00] [0.95] Fixed ß1 0.090 0.139 0.053 -0.590 -0.129 effects p [0.00] [0.00] [0.06] [0.43] [0.13] ß2 0.036 0.019 0.047 0.076 0.159 p [0.05] [0.46] [0.11] [0.34] [0.08] N 38,089 26,296 10,093 1,030 670 NxT 175,032 107,842 56,526 6,217 4,447
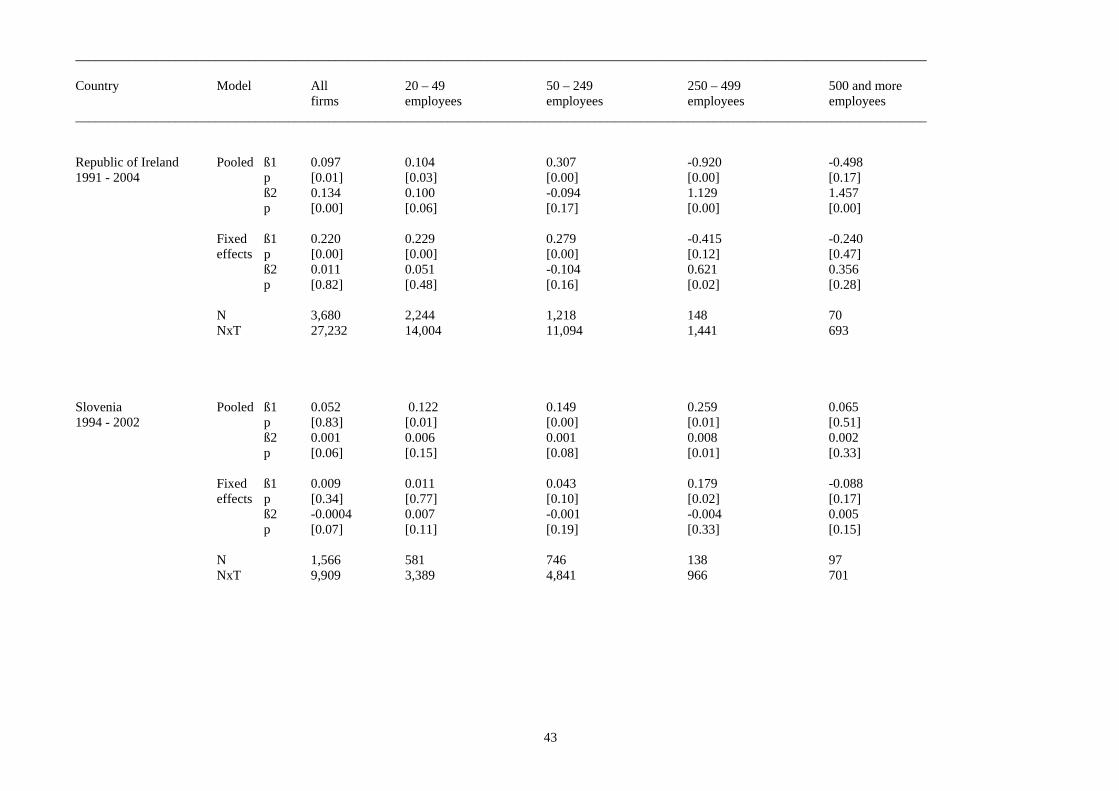
________________________________________________________________________________________________________________________________ Country Model All 20 – 49 50 – 249 250 – 499 500 and more firms employees employees employees employees ________________________________________________________________________________________________________________________________
43
Republic of Ireland Pooled ß1 0.097 0.104 0.307 -0.920 -0.498 1991 - 2004 p [0.01] [0.03] [0.00] [0.00] [0.17] ß2 0.134 0.100 -0.094 1.129 1.457 p [0.00] [0.06] [0.17] [0.00] [0.00] Fixed ß1 0.220 0.229 0.279 -0.415 -0.240 effects p [0.00] [0.00] [0.00] [0.12] [0.47] ß2 0.011 0.051 -0.104 0.621 0.356 p [0.82] [0.48] [0.16] [0.02] [0.28] N 3,680 2,244 1,218 148 70 NxT 27,232 14,004 11,094 1,441 693 Slovenia Pooled ß1 0.052 0.122 0.149 0.259 0.065 1994 - 2002 p [0.83] [0.01] [0.00] [0.01] [0.51] ß2 0.001 0.006 0.001 0.008 0.002 p [0.06] [0.15] [0.08] [0.01] [0.33] Fixed ß1 0.009 0.011 0.043 0.179 -0.088 effects p [0.34] [0.77] [0.10] [0.02] [0.17] ß2 -0.0004 0.007 -0.001 -0.004 0.005 p [0.07] [0.11] [0.19] [0.33] [0.15] N 1,566 581 746 138 97 NxT 9,909 3,389 4,841 966 701
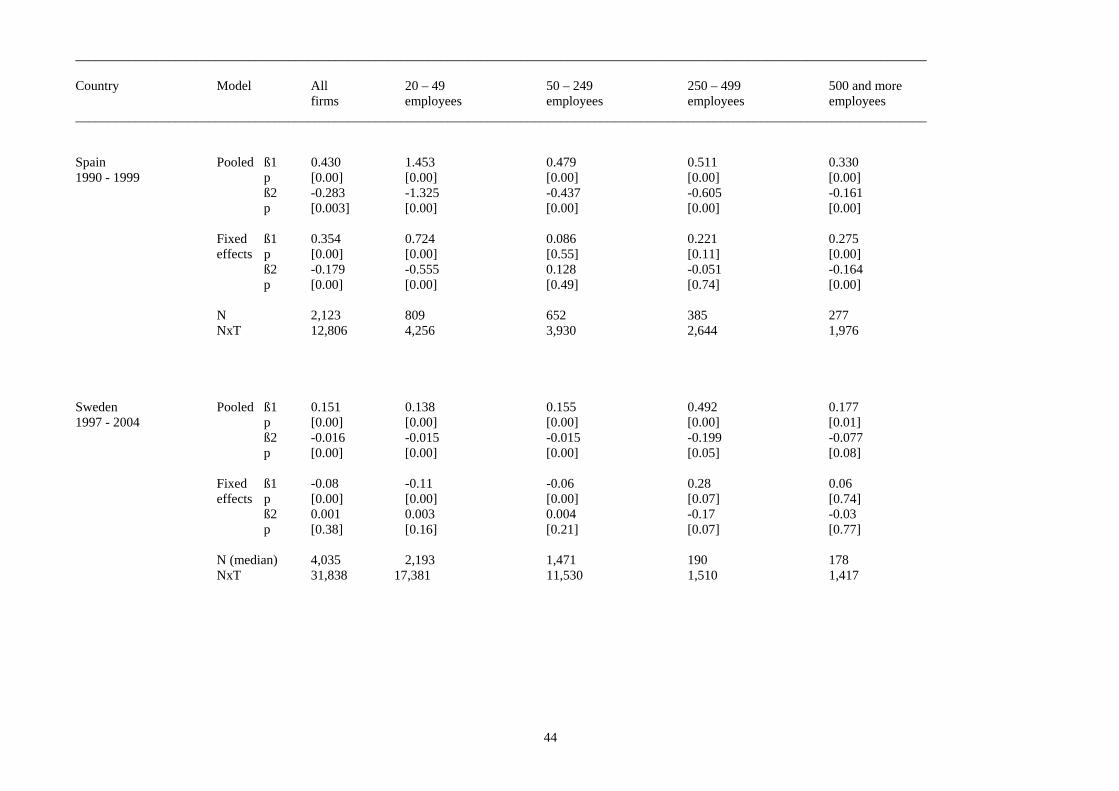
________________________________________________________________________________________________________________________________ Country Model All 20 – 49 50 – 249 250 – 499 500 and more firms employees employees employees employees ________________________________________________________________________________________________________________________________
44
Spain Pooled ß1 0.430 1.453 0.479 0.511 0.330 1990 - 1999 p [0.00] [0.00] [0.00] [0.00] [0.00] ß2 -0.283 -1.325 -0.437 -0.605 -0.161 p [0.003] [0.00] [0.00] [0.00] [0.00] Fixed ß1 0.354 0.724 0.086 0.221 0.275 effects p [0.00] [0.00] [0.55] [0.11] [0.00] ß2 -0.179 -0.555 0.128 -0.051 -0.164 p [0.00] [0.00] [0.49] [0.74] [0.00] N 2,123 809 652 385 277 NxT 12,806 4,256 3,930 2,644 1,976 Sweden Pooled ß1 0.151 0.138 0.155 0.492 0.177 1997 - 2004 p [0.00] [0.00] [0.00] [0.00] [0.01] ß2 -0.016 -0.015 -0.015 -0.199 -0.077 p [0.00] [0.00] [0.00] [0.05] [0.08] Fixed ß1 -0.08 -0.11 -0.06 0.28 0.06 effects p [0.00] [0.00] [0.00] [0.07] [0.74] ß2 0.001 0.003 0.004 -0.17 -0.03 p [0.38] [0.16] [0.21] [0.07] [0.77] N (median) 4,035 2,193 1,471 190 178 NxT 31,838 17,381 11,530 1,510 1,417
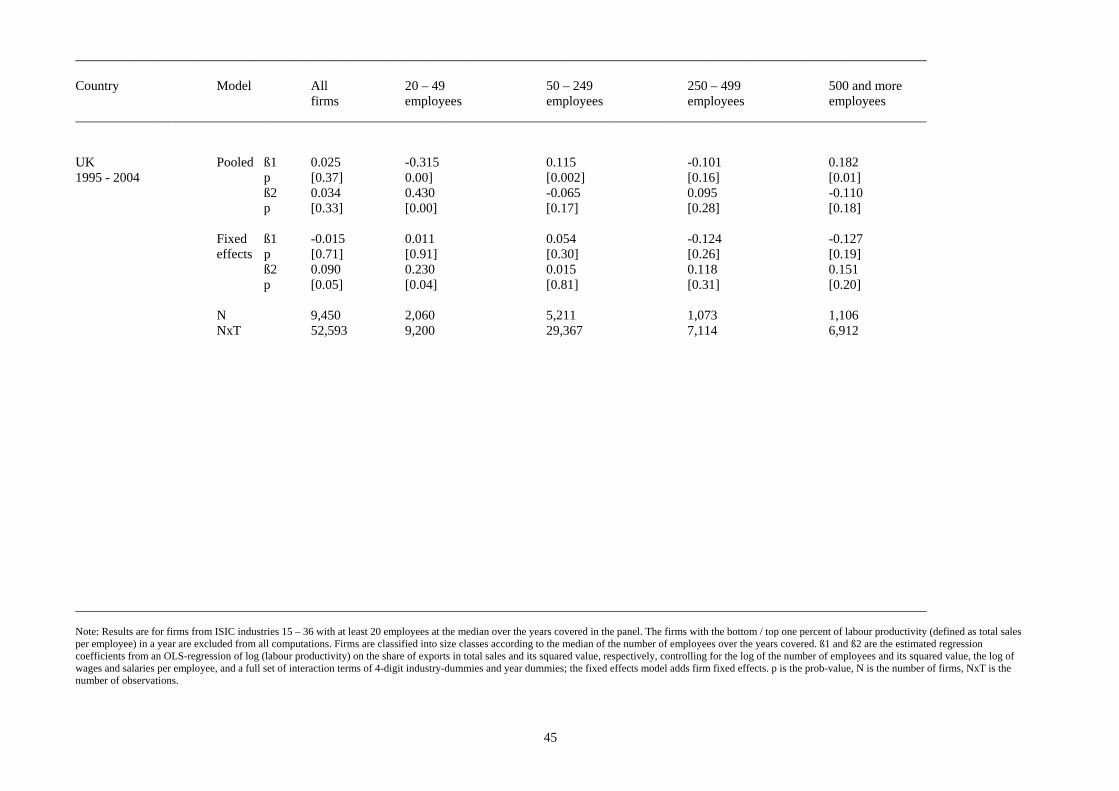
________________________________________________________________________________________________________________________________ Country Model All 20 – 49 50 – 249 250 – 499 500 and more firms employees employees employees employees ________________________________________________________________________________________________________________________________
45
UK Pooled ß1 0.025 -0.315 0.115 -0.101 0.182 1995 - 2004 p [0.37] 0.00] [0.002] [0.16] [0.01] ß2 0.034 0.430 -0.065 0.095 -0.110 p [0.33] [0.00] [0.17] [0.28] [0.18] Fixed ß1 -0.015 0.011 0.054 -0.124 -0.127 effects p [0.71] [0.91] [0.30] [0.26] [0.19] ß2 0.090 0.230 0.015 0.118 0.151 p [0.05] [0.04] [0.81] [0.31] [0.20] N 9,450 2,060 5,211 1,073 1,106 NxT 52,593 9,200 29,367 7,114 6,912 ________________________________________________________________________________________________________________________________ Note: Results are for firms from ISIC industries 15 – 36 with at least 20 employees at the median over the years covered in the panel. The firms with the bottom / top one percent of labour productivity (defined as total sales per employee) in a year are excluded from all computations. Firms are classified into size classes according to the median of the number of employees over the years covered. ß1 and ß2 are the estimated regression coefficients from an OLS-regression of log (labour productivity) on the share of exports in total sales and its squared value, respectively, controlling for the log of the number of employees and its squared value, the log of wages and salaries per employee, and a full set of interaction terms of 4-digit industry-dummies and year dummies; the fixed effects model adds firm fixed effects. p is the prob-value, N is the number of firms, NxT is the number of observations.
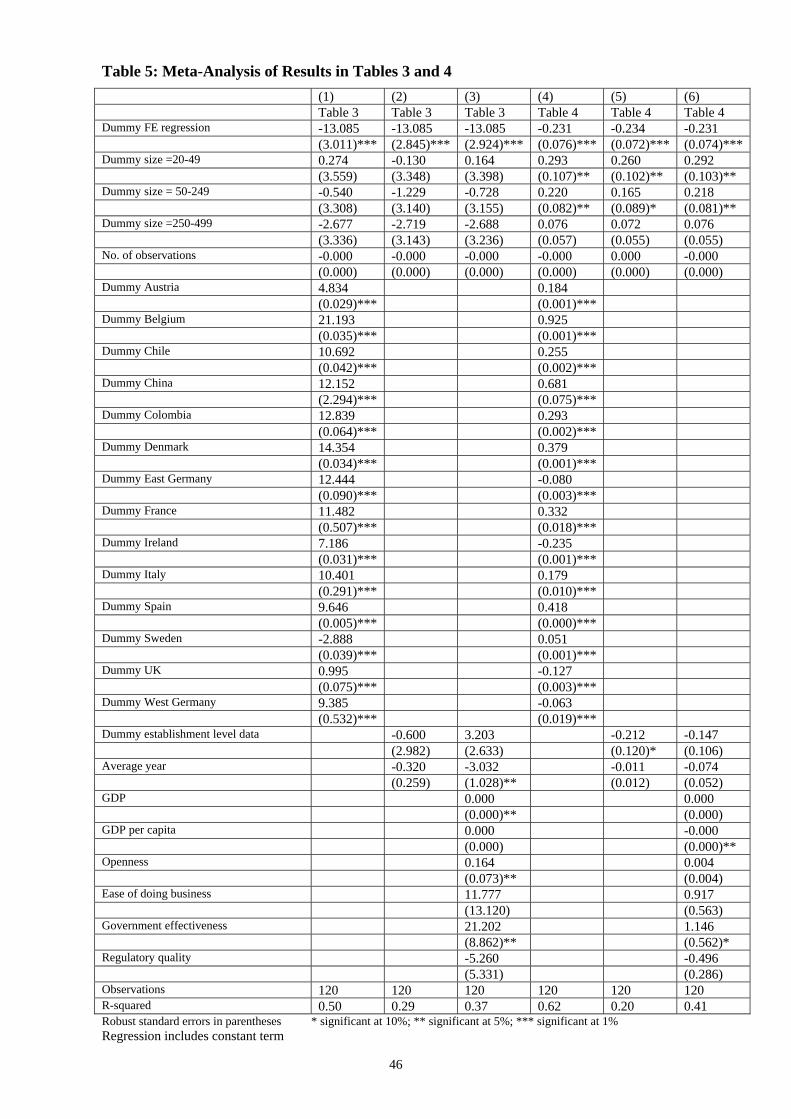
46
Table 5: Meta-Analysis of Results in Tables 3 and 4 (1) (2) (3) (4) (5) (6) Table 3 Table 3 Table 3 Table 4 Table 4 Table 4 Dummy FE regression -13.085 -13.085 -13.085 -0.231 -0.234 -0.231 (3.011)*** (2.845)*** (2.924)*** (0.076)*** (0.072)*** (0.074)*** Dummy size =20-49 0.274 -0.130 0.164 0.293 0.260 0.292 (3.559) (3.348) (3.398) (0.107)** (0.102)** (0.103)** Dummy size = 50-249 -0.540 -1.229 -0.728 0.220 0.165 0.218 (3.308) (3.140) (3.155) (0.082)** (0.089)* (0.081)** Dummy size =250-499 -2.677 -2.719 -2.688 0.076 0.072 0.076 (3.336) (3.143) (3.236) (0.057) (0.055) (0.055) No. of observations -0.000 -0.000 -0.000 -0.000 0.000 -0.000 (0.000) (0.000) (0.000) (0.000) (0.000) (0.000) Dummy Austria 4.834 0.184 (0.029)*** (0.001)*** Dummy Belgium 21.193 0.925 (0.035)*** (0.001)*** Dummy Chile 10.692 0.255 (0.042)*** (0.002)*** Dummy China 12.152 0.681 (2.294)*** (0.075)*** Dummy Colombia 12.839 0.293 (0.064)*** (0.002)*** Dummy Denmark 14.354 0.379 (0.034)*** (0.001)*** Dummy East Germany 12.444 -0.080 (0.090)*** (0.003)*** Dummy France 11.482 0.332 (0.507)*** (0.018)*** Dummy Ireland 7.186 -0.235 (0.031)*** (0.001)*** Dummy Italy 10.401 0.179 (0.291)*** (0.010)*** Dummy Spain 9.646 0.418 (0.005)*** (0.000)*** Dummy Sweden -2.888 0.051 (0.039)*** (0.001)*** Dummy UK 0.995 -0.127 (0.075)*** (0.003)*** Dummy West Germany 9.385 -0.063 (0.532)*** (0.019)*** Dummy establishment level data -0.600 3.203 -0.212 -0.147 (2.982) (2.633) (0.120)* (0.106) Average year -0.320 -3.032 -0.011 -0.074 (0.259) (1.028)** (0.012) (0.052) GDP 0.000 0.000 (0.000)** (0.000) GDP per capita 0.000 -0.000 (0.000) (0.000)** Openness 0.164 0.004 (0.073)** (0.004) Ease of doing business 11.777 0.917 (13.120) (0.563) Government effectiveness 21.202 1.146 (8.862)** (0.562)* Regulatory quality -5.260 -0.496 (5.331) (0.286) Observations 120 120 120 120 120 120 R-squared 0.50 0.29 0.37 0.62 0.20 0.41 Robust standard errors in parentheses * significant at 10%; ** significant at 5%; *** significant at 1% Regression includes constant term
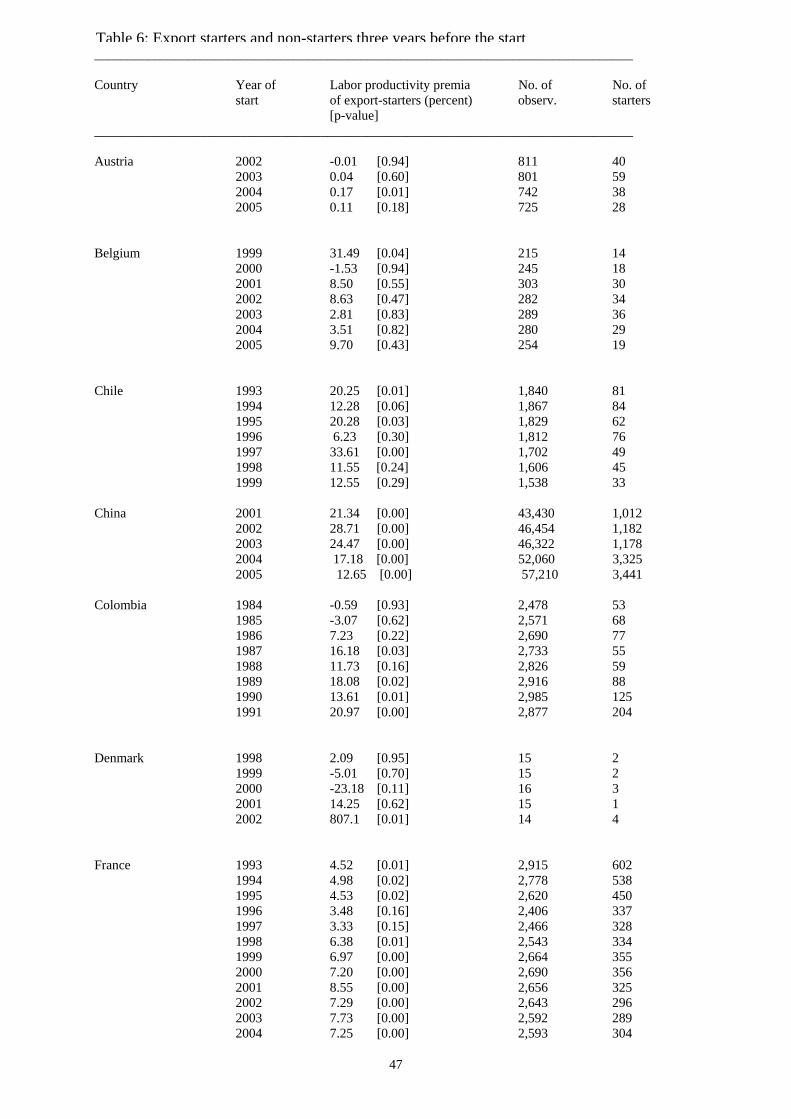
_________________________________________________________________________________ Country Year of Labor productivity premia No. of No. of start of export-starters (percent) observ. starters [p-value] _________________________________________________________________________________
47
Austria 2002 -0.01 [0.94] 811 40
2003 0.04 [0.60] 801 59 2004 0.17 [0.01] 742 38 2005 0.11 [0.18] 725 28
Belgium 1999 31.49 [0.04] 215 14 2000 -1.53 [0.94] 245 18 2001 8.50 [0.55] 303 30 2002 8.63 [0.47] 282 34 2003 2.81 [0.83] 289 36 2004 3.51 [0.82] 280 29 2005 9.70 [0.43] 254 19 Chile 1993 20.25 [0.01] 1,840 81
1994 12.28 [0.06] 1,867 84 1995 20.28 [0.03] 1,829 62 1996 6.23 [0.30] 1,812 76 1997 33.61 [0.00] 1,702 49 1998 11.55 [0.24] 1,606 45 1999 12.55 [0.29] 1,538 33
China 2001 21.34 [0.00] 43,430 1,012
2002 28.71 [0.00] 46,454 1,182 2003 24.47 [0.00] 46,322 1,178 2004 17.18 [0.00] 52,060 3,325 2005 12.65 [0.00] 57,210 3,441
Colombia 1984 -0.59 [0.93] 2,478 53
1985 -3.07 [0.62] 2,571 68 1986 7.23 [0.22] 2,690 77 1987 16.18 [0.03] 2,733 55 1988 11.73 [0.16] 2,826 59 1989 18.08 [0.02] 2,916 88 1990 13.61 [0.01] 2,985 125 1991 20.97 [0.00] 2,877 204
Denmark 1998 2.09 [0.95] 15 2
1999 -5.01 [0.70] 15 2 2000 -23.18 [0.11] 16 3 2001 14.25 [0.62] 15 1 2002 807.1 [0.01] 14 4
France 1993 4.52 [0.01] 2,915 602
1994 4.98 [0.02] 2,778 538 1995 4.53 [0.02] 2,620 450 1996 3.48 [0.16] 2,406 337 1997 3.33 [0.15] 2,466 328 1998 6.38 [0.01] 2,543 334 1999 6.97 [0.00] 2,664 355 2000 7.20 [0.00] 2,690 356 2001 8.55 [0.00] 2,656 325 2002 7.29 [0.00] 2,643 296 2003 7.73 [0.00] 2,592 289 2004 7.25 [0.00] 2,593 304
Table 6: Export starters and non-starters three years before the start
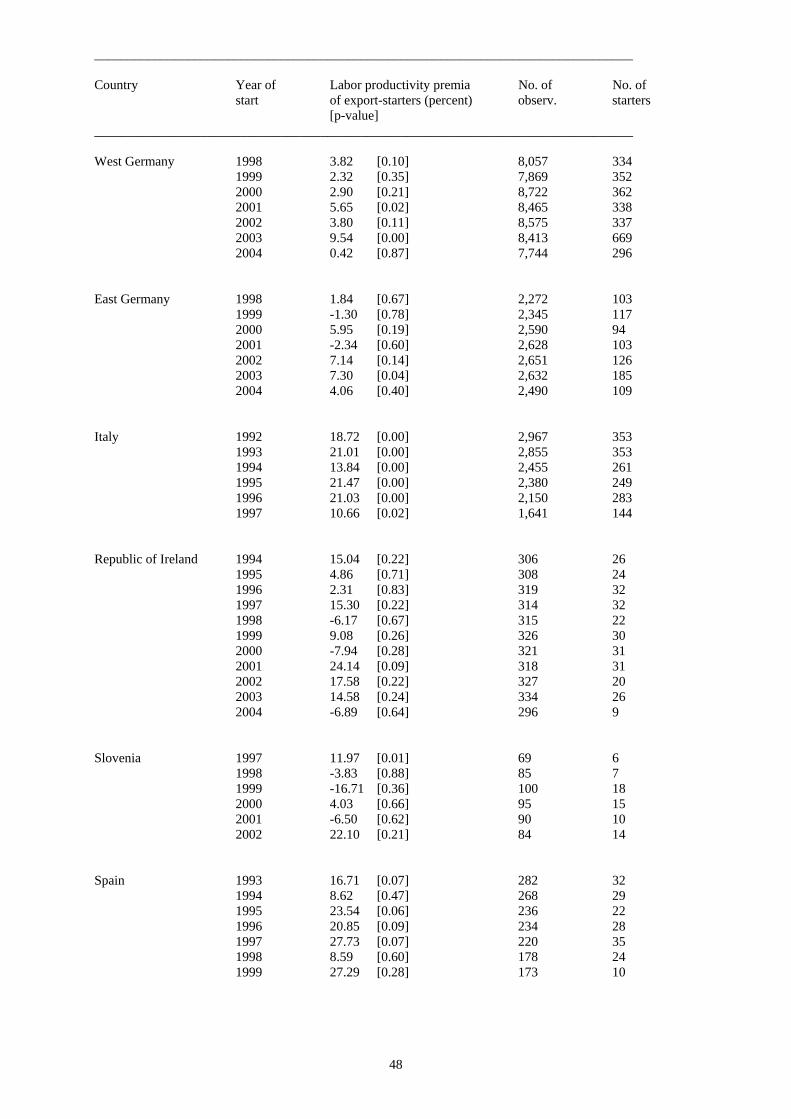
_________________________________________________________________________________ Country Year of Labor productivity premia No. of No. of start of export-starters (percent) observ. starters [p-value] _________________________________________________________________________________
48
West Germany 1998 3.82 [0.10] 8,057 334 1999 2.32 [0.35] 7,869 352 2000 2.90 [0.21] 8,722 362 2001 5.65 [0.02] 8,465 338 2002 3.80 [0.11] 8,575 337 2003 9.54 [0.00] 8,413 669 2004 0.42 [0.87] 7,744 296 East Germany 1998 1.84 [0.67] 2,272 103
1999 -1.30 [0.78] 2,345 117 2000 5.95 [0.19] 2,590 94 2001 -2.34 [0.60] 2,628 103 2002 7.14 [0.14] 2,651 126 2003 7.30 [0.04] 2,632 185 2004 4.06 [0.40] 2,490 109
Italy 1992 18.72 [0.00] 2,967 353
1993 21.01 [0.00] 2,855 353 1994 13.84 [0.00] 2,455 261 1995 21.47 [0.00] 2,380 249 1996 21.03 [0.00] 2,150 283 1997 10.66 [0.02] 1,641 144
Republic of Ireland 1994 15.04 [0.22] 306 26
1995 4.86 [0.71] 308 24 1996 2.31 [0.83] 319 32 1997 15.30 [0.22] 314 32 1998 -6.17 [0.67] 315 22 1999 9.08 [0.26] 326 30 2000 -7.94 [0.28] 321 31 2001 24.14 [0.09] 318 31 2002 17.58 [0.22] 327 20 2003 14.58 [0.24] 334 26 2004 -6.89 [0.64] 296 9
Slovenia 1997 11.97 [0.01] 69 6
1998 -3.83 [0.88] 85 7 1999 -16.71 [0.36] 100 18 2000 4.03 [0.66] 95 15 2001 -6.50 [0.62] 90 10 2002 22.10 [0.21] 84 14
Spain 1993 16.71 [0.07] 282 32
1994 8.62 [0.47] 268 29 1995 23.54 [0.06] 236 22 1996 20.85 [0.09] 234 28 1997 27.73 [0.07] 220 35 1998 8.59 [0.60] 178 24 1999 27.29 [0.28] 173 10
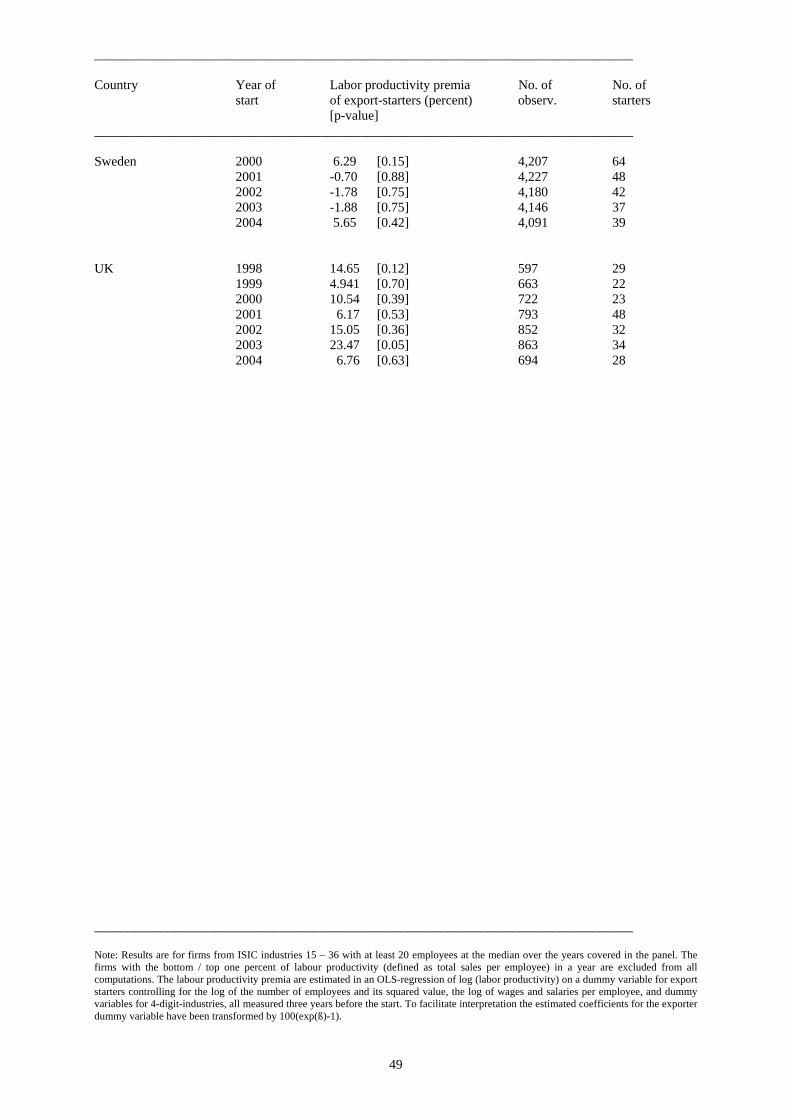
_________________________________________________________________________________ Country Year of Labor productivity premia No. of No. of start of export-starters (percent) observ. starters [p-value] _________________________________________________________________________________
49
Sweden 2000 6.29 [0.15] 4,207 64 2001 -0.70 [0.88] 4,227 48 2002 -1.78 [0.75] 4,180 42 2003 -1.88 [0.75] 4,146 37 2004 5.65 [0.42] 4,091 39 UK 1998 14.65 [0.12] 597 29
1999 4.941 [0.70] 663 22 2000 10.54 [0.39] 722 23 2001 6.17 [0.53] 793 48 2002 15.05 [0.36] 852 32 2003 23.47 [0.05] 863 34 2004 6.76 [0.63] 694 28
_________________________________________________________________________________ Note: Results are for firms from ISIC industries 15 – 36 with at least 20 employees at the median over the years covered in the panel. The firms with the bottom / top one percent of labour productivity (defined as total sales per employee) in a year are excluded from all computations. The labour productivity premia are estimated in an OLS-regression of log (labor productivity) on a dummy variable for export starters controlling for the log of the number of employees and its squared value, the log of wages and salaries per employee, and dummy variables for 4-digit-industries, all measured three years before the start. To facilitate interpretation the estimated coefficients for the exporter dummy variable have been transformed by 100(exp(ß)-1).
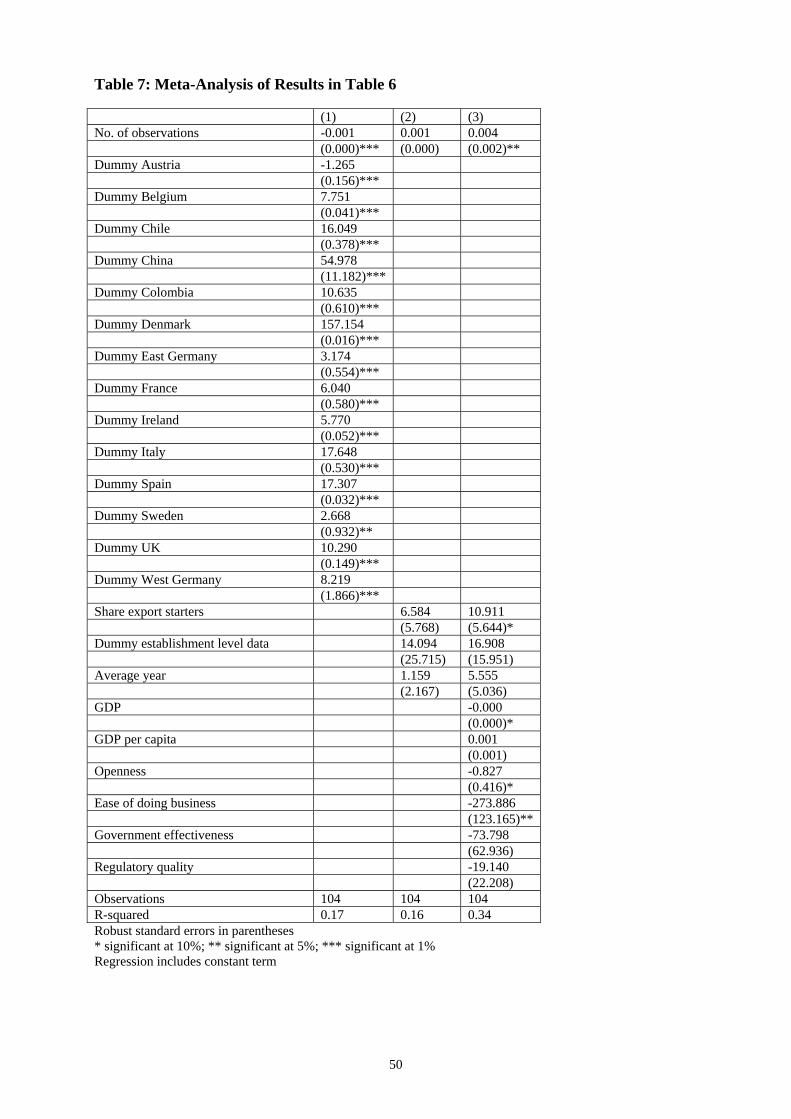
50
Table 7: Meta-Analysis of Results in Table 6 (1) (2) (3) No. of observations -0.001 0.001 0.004 (0.000)*** (0.000) (0.002)** Dummy Austria -1.265 (0.156)*** Dummy Belgium 7.751 (0.041)*** Dummy Chile 16.049 (0.378)*** Dummy China 54.978 (11.182)*** Dummy Colombia 10.635 (0.610)*** Dummy Denmark 157.154 (0.016)*** Dummy East Germany 3.174 (0.554)*** Dummy France 6.040 (0.580)*** Dummy Ireland 5.770 (0.052)*** Dummy Italy 17.648 (0.530)*** Dummy Spain 17.307 (0.032)*** Dummy Sweden 2.668 (0.932)** Dummy UK 10.290 (0.149)*** Dummy West Germany 8.219 (1.866)*** Share export starters 6.584 10.911 (5.768) (5.644)* Dummy establishment level data 14.094 16.908 (25.715) (15.951) Average year 1.159 5.555 (2.167) (5.036) GDP -0.000 (0.000)* GDP per capita 0.001 (0.001) Openness -0.827 (0.416)* Ease of doing business -273.886 (123.165)** Government effectiveness -73.798 (62.936) Regulatory quality -19.140 (22.208) Observations 104 104 104 R-squared 0.17 0.16 0.34 Robust standard errors in parentheses * significant at 10%; ** significant at 5%; *** significant at 1% Regression includes constant term
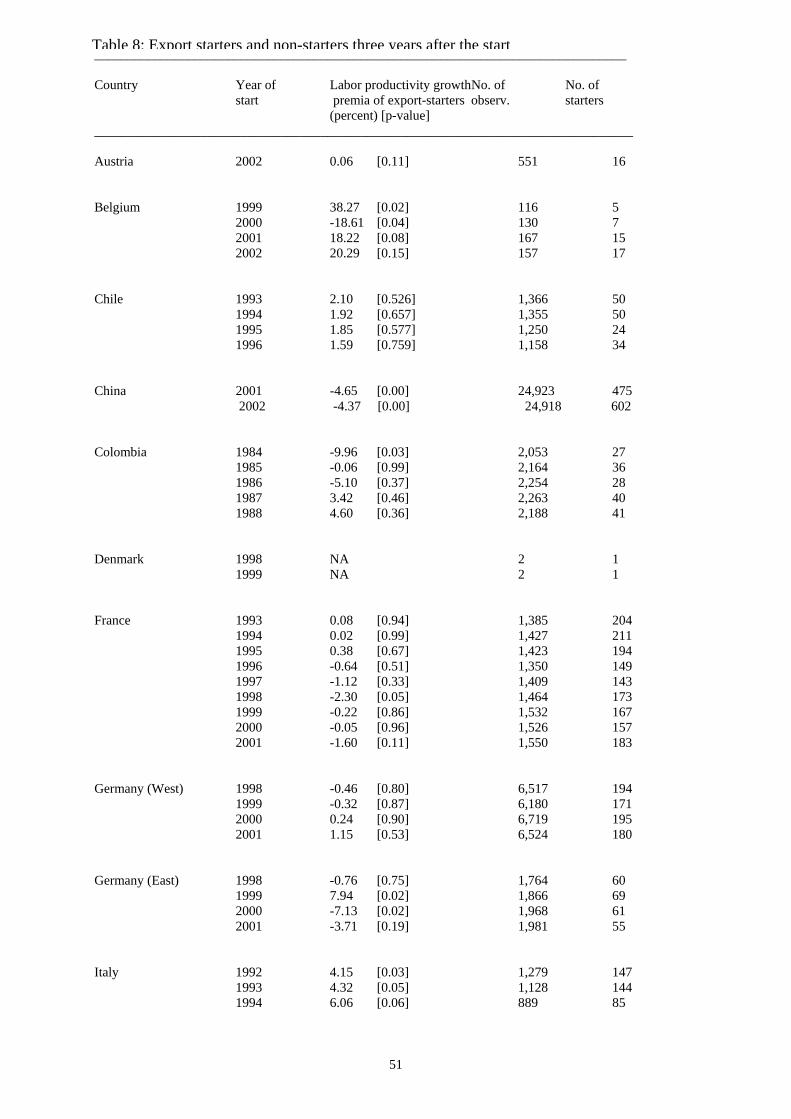
________________________________________________________________________________ Country Year of Labor productivity growth No. of No. of start premia of export-starters observ. starters (percent) [p-value] _________________________________________________________________________________
51
Austria 2002 0.06 [0.11] 551 16 Belgium 1999 38.27 [0.02] 116 5
2000 -18.61 [0.04] 130 7 2001 18.22 [0.08] 167 15 2002 20.29 [0.15] 157 17
Chile 1993 2.10 [0.526] 1,366 50
1994 1.92 [0.657] 1,355 50 1995 1.85 [0.577] 1,250 24 1996 1.59 [0.759] 1,158 34
China 2001 -4.65 [0.00] 24,923 475 2002 -4.37 [0.00] 24,918 602 Colombia 1984 -9.96 [0.03] 2,053 27
1985 -0.06 [0.99] 2,164 36 1986 -5.10 [0.37] 2,254 28 1987 3.42 [0.46] 2,263 40 1988 4.60 [0.36] 2,188 41
Denmark 1998 NA 2 1
1999 NA 2 1 France 1993 0.08 [0.94] 1,385 204
1994 0.02 [0.99] 1,427 211 1995 0.38 [0.67] 1,423 194 1996 -0.64 [0.51] 1,350 149 1997 -1.12 [0.33] 1,409 143 1998 -2.30 [0.05] 1,464 173 1999 -0.22 [0.86] 1,532 167 2000 -0.05 [0.96] 1,526 157 2001 -1.60 [0.11] 1,550 183
Germany (West) 1998 -0.46 [0.80] 6,517 194
1999 -0.32 [0.87] 6,180 171 2000 0.24 [0.90] 6,719 195 2001 1.15 [0.53] 6,524 180
Germany (East) 1998 -0.76 [0.75] 1,764 60
1999 7.94 [0.02] 1,866 69 2000 -7.13 [0.02] 1,968 61 2001 -3.71 [0.19] 1,981 55
Italy 1992 4.15 [0.03] 1,279 147
1993 4.32 [0.05] 1,128 144 1994 6.06 [0.06] 889 85
Table 8: Export starters and non-starters three years after the start
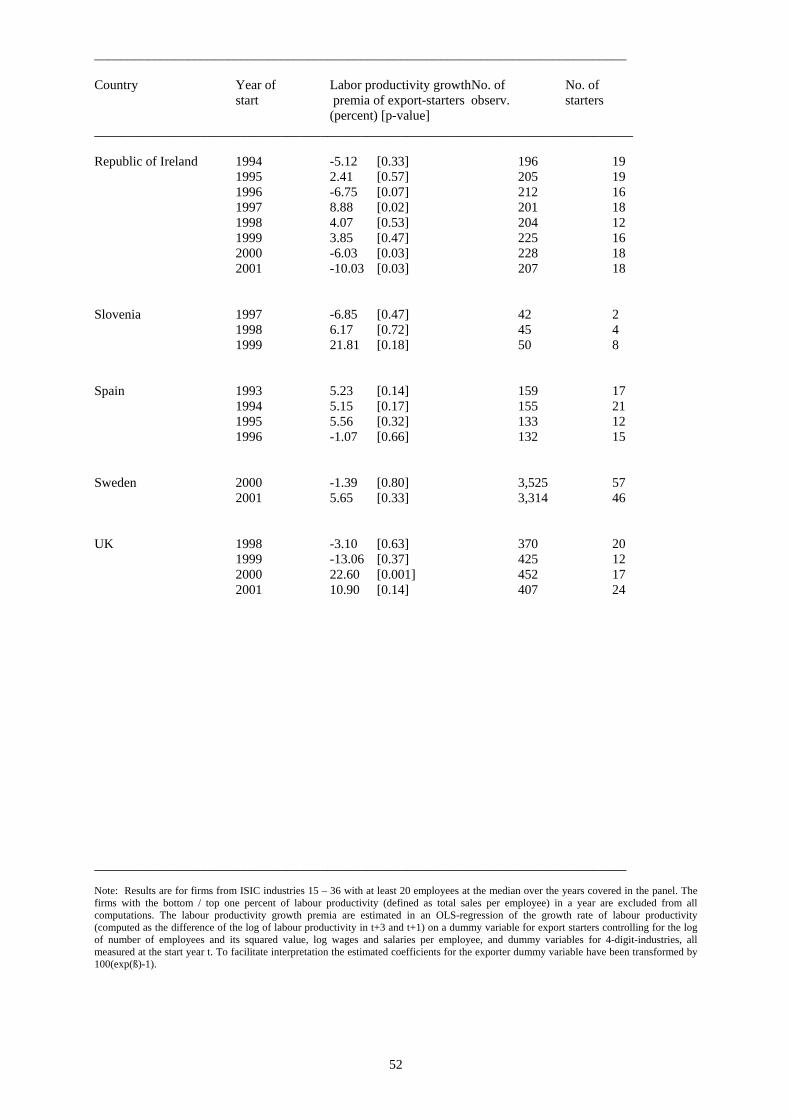
________________________________________________________________________________ Country Year of Labor productivity growth No. of No. of start premia of export-starters observ. starters (percent) [p-value] _________________________________________________________________________________
52
Republic of Ireland 1994 -5.12 [0.33] 196 19
1995 2.41 [0.57] 205 19 1996 -6.75 [0.07] 212 16 1997 8.88 [0.02] 201 18 1998 4.07 [0.53] 204 12 1999 3.85 [0.47] 225 16 2000 -6.03 [0.03] 228 18 2001 -10.03 [0.03] 207 18
Slovenia 1997 -6.85 [0.47] 42 2
1998 6.17 [0.72] 45 4 1999 21.81 [0.18] 50 8
Spain 1993 5.23 [0.14] 159 17
1994 5.15 [0.17] 155 21 1995 5.56 [0.32] 133 12 1996 -1.07 [0.66] 132 15
Sweden 2000 -1.39 [0.80] 3,525 57 2001 5.65 [0.33] 3,314 46 UK 1998 -3.10 [0.63] 370 20
1999 -13.06 [0.37] 425 12 2000 22.60 [0.001] 452 17 2001 10.90 [0.14] 407 24
________________________________________________________________________________ Note: Results are for firms from ISIC industries 15 – 36 with at least 20 employees at the median over the years covered in the panel. The firms with the bottom / top one percent of labour productivity (defined as total sales per employee) in a year are excluded from all computations. The labour productivity growth premia are estimated in an OLS-regression of the growth rate of labour productivity (computed as the difference of the log of labour productivity in t+3 and t+1) on a dummy variable for export starters controlling for the log of number of employees and its squared value, log wages and salaries per employee, and dummy variables for 4-digit-industries, all measured at the start year t. To facilitate interpretation the estimated coefficients for the exporter dummy variable have been transformed by 100(exp(ß)-1).
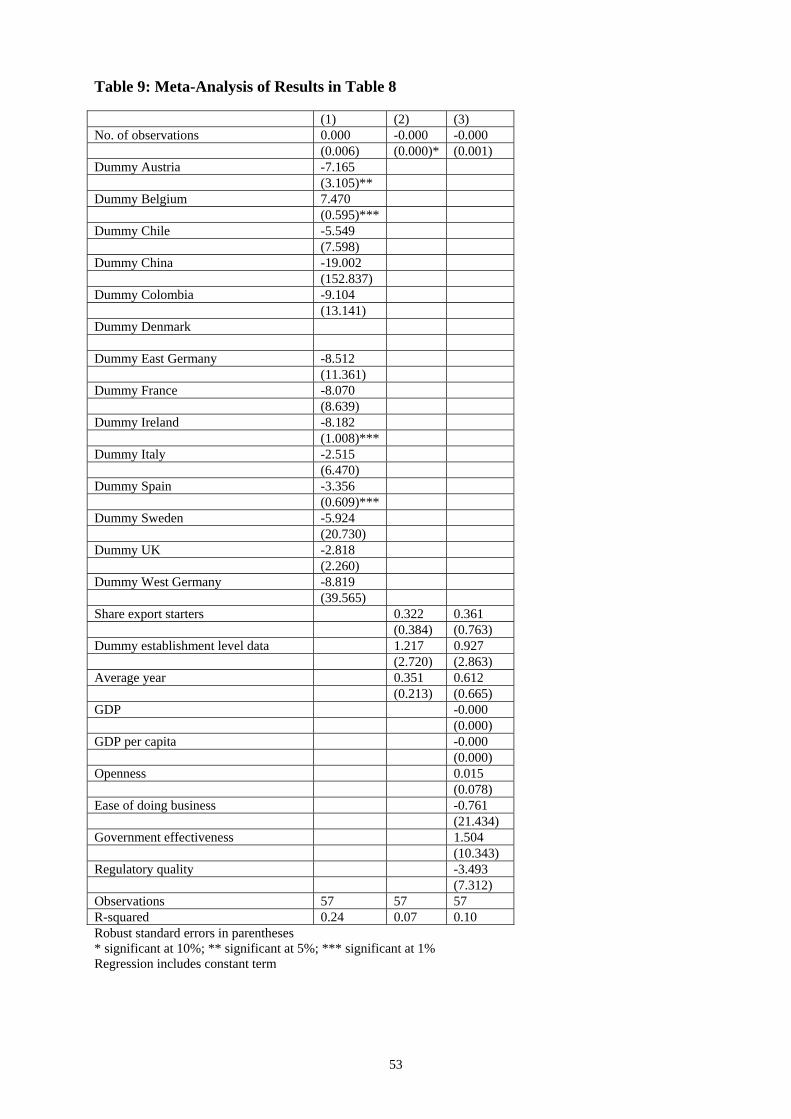
53
Table 9: Meta-Analysis of Results in Table 8 (1) (2) (3) No. of observations 0.000 -0.000 -0.000 (0.006) (0.000)* (0.001) Dummy Austria -7.165 (3.105)** Dummy Belgium 7.470 (0.595)*** Dummy Chile -5.549 (7.598) Dummy China -19.002 (152.837) Dummy Colombia -9.104 (13.141) Dummy Denmark Dummy East Germany -8.512 (11.361) Dummy France -8.070 (8.639) Dummy Ireland -8.182 (1.008)*** Dummy Italy -2.515 (6.470) Dummy Spain -3.356 (0.609)*** Dummy Sweden -5.924 (20.730) Dummy UK -2.818 (2.260) Dummy West Germany -8.819 (39.565) Share export starters 0.322 0.361 (0.384) (0.763) Dummy establishment level data 1.217 0.927 (2.720) (2.863) Average year 0.351 0.612 (0.213) (0.665) GDP -0.000 (0.000) GDP per capita -0.000 (0.000) Openness 0.015 (0.078) Ease of doing business -0.761 (21.434) Government effectiveness 1.504 (10.343) Regulatory quality -3.493 (7.312) Observations 57 57 57 R-squared 0.24 0.07 0.10 Robust standard errors in parentheses * significant at 10%; ** significant at 5%; *** significant at 1% Regression includes constant term
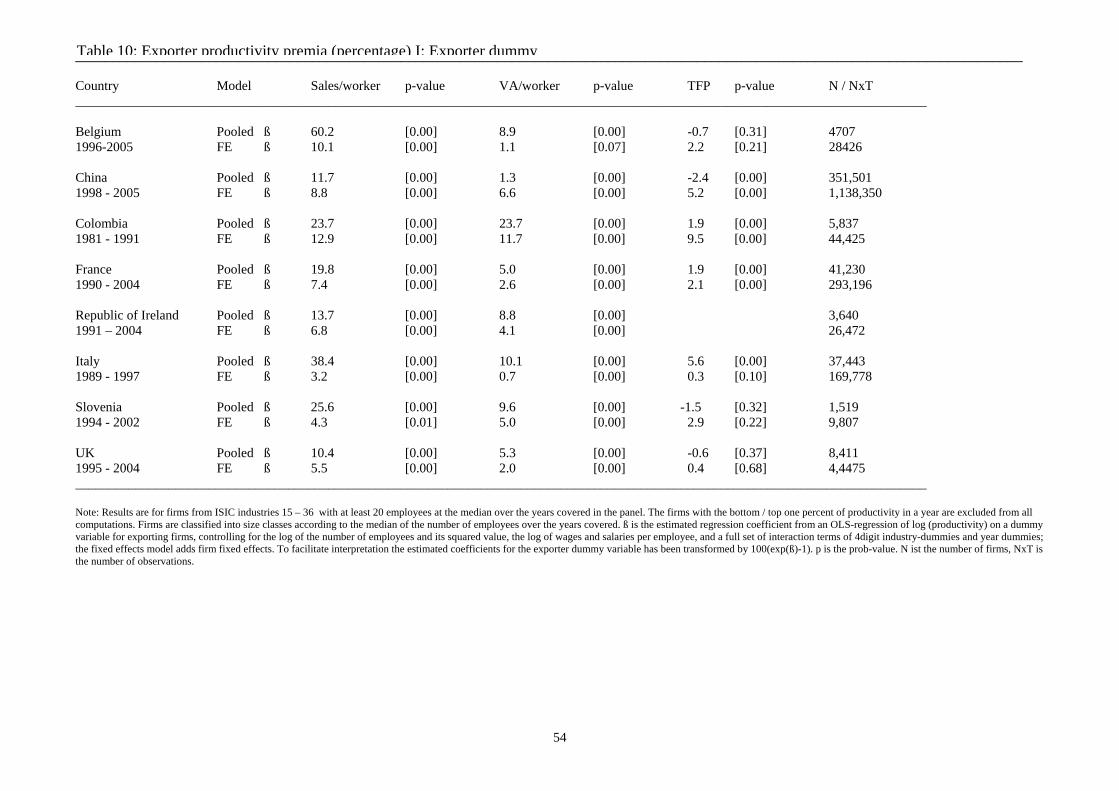
________________________________________________________________________________________________________________________________ Country Model Sales/worker p-value VA/worker p-value TFP p-value N / NxT ________________________________________________________________________________________________________________________________
54
Belgium Pooled ß 60.2 [0.00] 8.9 [0.00] -0.7 [0.31] 4707 1996-2005 FE ß 10.1 [0.00] 1.1 [0.07] 2.2 [0.21] 28426 China Pooled ß 11.7 [0.00] 1.3 [0.00] -2.4 [0.00] 351,501 1998 - 2005 FE ß 8.8 [0.00] 6.6 [0.00] 5.2 [0.00] 1,138,350 Colombia Pooled ß 23.7 [0.00] 23.7 [0.00] 1.9 [0.00] 5,837 1981 - 1991 FE ß 12.9 [0.00] 11.7 [0.00] 9.5 [0.00] 44,425 France Pooled ß 19.8 [0.00] 5.0 [0.00] 1.9 [0.00] 41,230 1990 - 2004 FE ß 7.4 [0.00] 2.6 [0.00] 2.1 [0.00] 293,196 Republic of Ireland Pooled ß 13.7 [0.00] 8.8 [0.00] 3,640 1991 – 2004 FE ß 6.8 [0.00] 4.1 [0.00] 26,472 Italy Pooled ß 38.4 [0.00] 10.1 [0.00] 5.6 [0.00] 37,443 1989 - 1997 FE ß 3.2 [0.00] 0.7 [0.00] 0.3 [0.10] 169,778 Slovenia Pooled ß 25.6 [0.00] 9.6 [0.00] -1.5 [0.32] 1,519 1994 - 2002 FE ß 4.3 [0.01] 5.0 [0.00] 2.9 [0.22] 9,807 UK Pooled ß 10.4 [0.00] 5.3 [0.00] -0.6 [0.37] 8,411 1995 - 2004 FE ß 5.5 [0.00] 2.0 [0.00] 0.4 [0.68] 4,4475 ________________________________________________________________________________________________________________________________ Note: Results are for firms from ISIC industries 15 – 36 with at least 20 employees at the median over the years covered in the panel. The firms with the bottom / top one percent of productivity in a year are excluded from all computations. Firms are classified into size classes according to the median of the number of employees over the years covered. ß is the estimated regression coefficient from an OLS-regression of log (productivity) on a dummy variable for exporting firms, controlling for the log of the number of employees and its squared value, the log of wages and salaries per employee, and a full set of interaction terms of 4digit industry-dummies and year dummies; the fixed effects model adds firm fixed effects. To facilitate interpretation the estimated coefficients for the exporter dummy variable has been transformed by 100(exp(ß)-1). p is the prob-value. N ist the number of firms, NxT is the number of observations.
Table 10: Exporter productivity premia (percentage) I: Exporter dummy
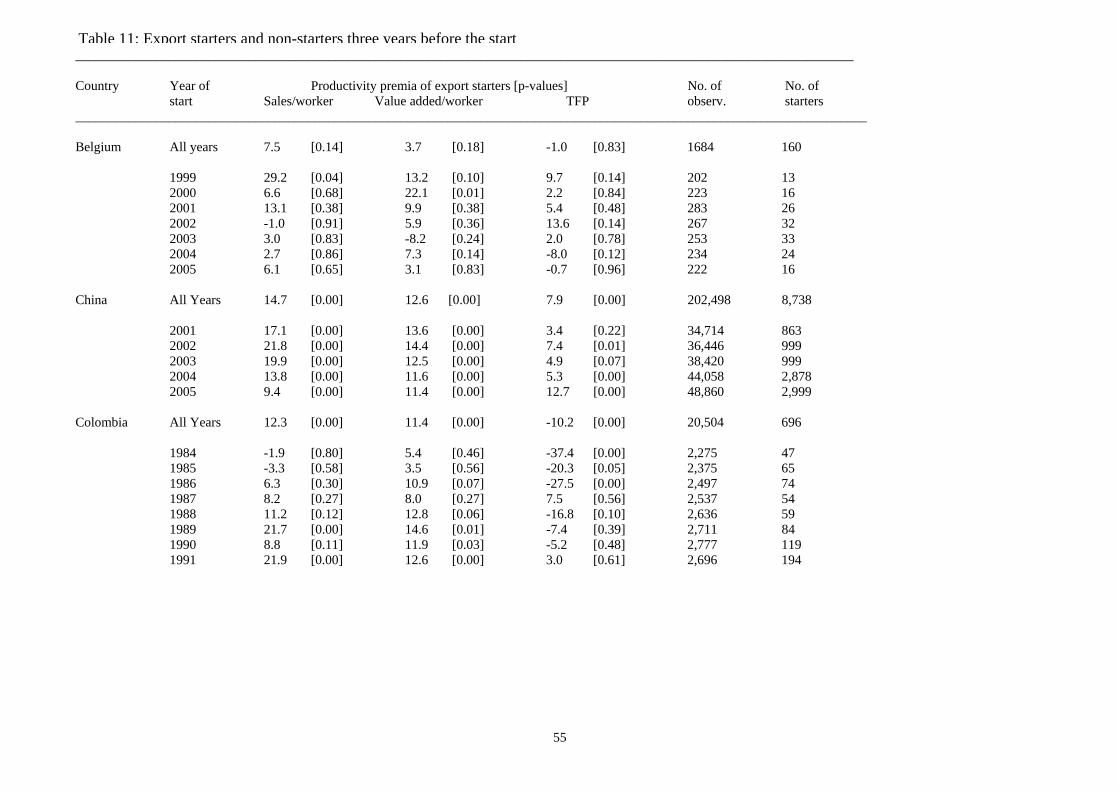
_____________________________________________________________________________________________________________________ Country Year of Productivity premia of export starters [p-values] No. of No. of start Sales/worker Value added/worker TFP observ. starters _______________________________________________________________________________________________________________________
55
Belgium All years 7.5 [0.14] 3.7 [0.18] -1.0 [0.83] 1684 160 1999 29.2 [0.04] 13.2 [0.10] 9.7 [0.14] 202 13 2000 6.6 [0.68] 22.1 [0.01] 2.2 [0.84] 223 16 2001 13.1 [0.38] 9.9 [0.38] 5.4 [0.48] 283 26 2002 -1.0 [0.91] 5.9 [0.36] 13.6 [0.14] 267 32 2003 3.0 [0.83] -8.2 [0.24] 2.0 [0.78] 253 33 2004 2.7 [0.86] 7.3 [0.14] -8.0 [0.12] 234 24 2005 6.1 [0.65] 3.1 [0.83] -0.7 [0.96] 222 16 China All Years 14.7 [0.00] 12.6 [0.00] 7.9 [0.00] 202,498 8,738 2001 17.1 [0.00] 13.6 [0.00] 3.4 [0.22] 34,714 863
2002 21.8 [0.00] 14.4 [0.00] 7.4 [0.01] 36,446 999 2003 19.9 [0.00] 12.5 [0.00] 4.9 [0.07] 38,420 999 2004 13.8 [0.00] 11.6 [0.00] 5.3 [0.00] 44,058 2,878 2005 9.4 [0.00] 11.4 [0.00] 12.7 [0.00] 48,860 2,999
Colombia All Years 12.3 [0.00] 11.4 [0.00] -10.2 [0.00] 20,504 696 1984 -1.9 [0.80] 5.4 [0.46] -37.4 [0.00] 2,275 47
1985 -3.3 [0.58] 3.5 [0.56] -20.3 [0.05] 2,375 65 1986 6.3 [0.30] 10.9 [0.07] -27.5 [0.00] 2,497 74 1987 8.2 [0.27] 8.0 [0.27] 7.5 [0.56] 2,537 54 1988 11.2 [0.12] 12.8 [0.06] -16.8 [0.10] 2,636 59 1989 21.7 [0.00] 14.6 [0.01] -7.4 [0.39] 2,711 84 1990 8.8 [0.11] 11.9 [0.03] -5.2 [0.48] 2,777 119 1991 21.9 [0.00] 12.6 [0.00] 3.0 [0.61] 2,696 194
Table 11: Export starters and non-starters three years before the start
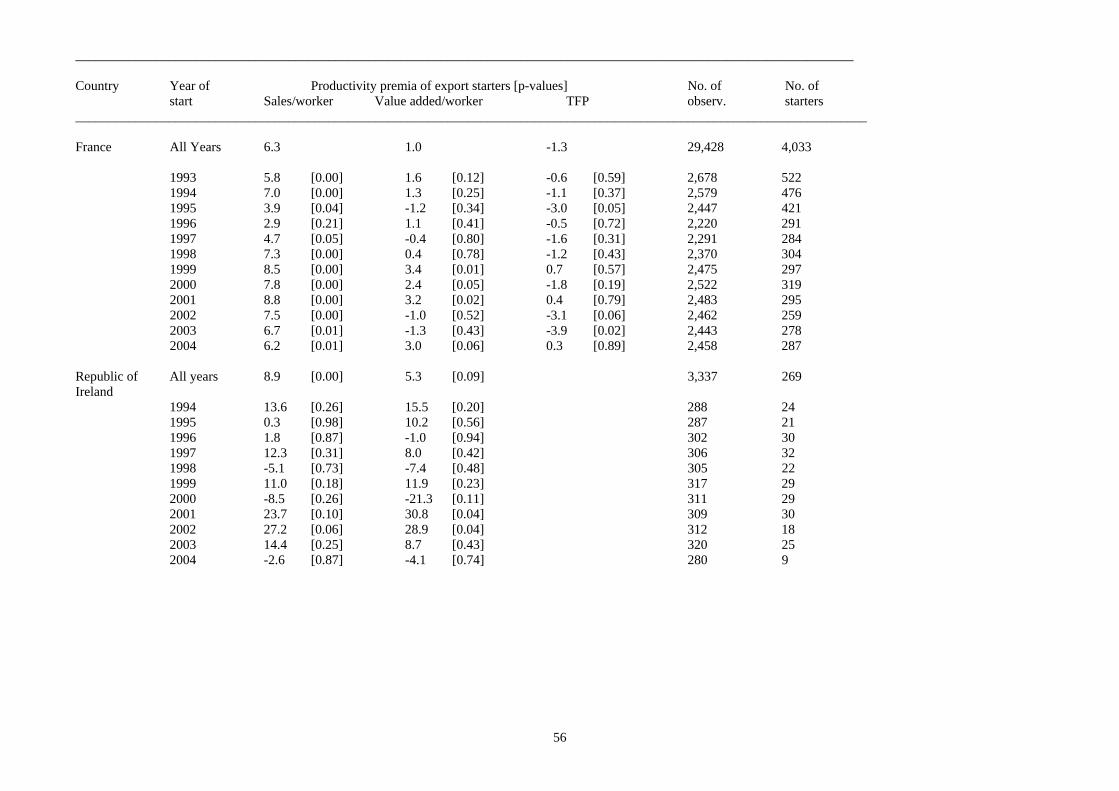
_____________________________________________________________________________________________________________________ Country Year of Productivity premia of export starters [p-values] No. of No. of start Sales/worker Value added/worker TFP observ. starters _______________________________________________________________________________________________________________________
56
France All Years 6.3 1.0 -1.3 29,428 4,033 1993 5.8 [0.00] 1.6 [0.12] -0.6 [0.59] 2,678 522 1994 7.0 [0.00] 1.3 [0.25] -1.1 [0.37] 2,579 476 1995 3.9 [0.04] -1.2 [0.34] -3.0 [0.05] 2,447 421 1996 2.9 [0.21] 1.1 [0.41] -0.5 [0.72] 2,220 291 1997 4.7 [0.05] -0.4 [0.80] -1.6 [0.31] 2,291 284 1998 7.3 [0.00] 0.4 [0.78] -1.2 [0.43] 2,370 304 1999 8.5 [0.00] 3.4 [0.01] 0.7 [0.57] 2,475 297 2000 7.8 [0.00] 2.4 [0.05] -1.8 [0.19] 2,522 319 2001 8.8 [0.00] 3.2 [0.02] 0.4 [0.79] 2,483 295 2002 7.5 [0.00] -1.0 [0.52] -3.1 [0.06] 2,462 259 2003 6.7 [0.01] -1.3 [0.43] -3.9 [0.02] 2,443 278 2004 6.2 [0.01] 3.0 [0.06] 0.3 [0.89] 2,458 287 Republic of All years 8.9 [0.00] 5.3 [0.09] 3,337 269 Ireland
1994 13.6 [0.26] 15.5 [0.20] 288 24 1995 0.3 [0.98] 10.2 [0.56] 287 21
1996 1.8 [0.87] -1.0 [0.94] 302 30 1997 12.3 [0.31] 8.0 [0.42] 306 32 1998 -5.1 [0.73] -7.4 [0.48] 305 22 1999 11.0 [0.18] 11.9 [0.23] 317 29 2000 -8.5 [0.26] -21.3 [0.11] 311 29 2001 23.7 [0.10] 30.8 [0.04] 309 30 2002 27.2 [0.06] 28.9 [0.04] 312 18 2003 14.4 [0.25] 8.7 [0.43] 320 25 2004 -2.6 [0.87] -4.1 [0.74] 280 9

_____________________________________________________________________________________________________________________ Country Year of Productivity premia of export starters [p-values] No. of No. of start Sales/worker Value added/worker TFP observ. starters _______________________________________________________________________________________________________________________
57
Italy All Years 18.3 4.5 3.0 14,345 1,612 1992 17.6 [0.00] 4.0 [0.01] 3.1 [0.03] 2,920 346 1993 21.5 [0.00] 4.4 [0.00] 2.9 [0.04] 2,819 344 1994 15.3 [0.00] 2.8 [0.09] 2.1 [0.20] 2,433 258 1995 21.6 [0.00] 5.7 [0.00] 2.8 [0.10] 2,370 243 1996 20.4 [0.00] 6.9 [0.00] 5.1 [0.00] 2,145 278 1997 8.8 [0.04] 2.4 [0.29] 0.8 [0.68] 1,658 143 UK All Years 4.2 [0.30] -0.6 [0.82] -2.0 [0.67] 4080 162 1998 31.9 [0.03] -3.4 [0.60] -20.0 [0.01] 465 24 1999 -4.9 [0.64] -2.1 [0.83] -11.2 [0.42] 509 15 2000 13.9 [0.17] 5.9 [0.49] -8.5 [0.60] 561 18 2001 -5.5 [0.55] -7.7 [0.31] -6.3 [0.58] 621 37 2002 -11.4 [0.18] -1.6 [0.80] -13.7 [0.38] 679 24 2003 19.4 [0.08] 11.6 [0.09] 38.6 [0.02] 696 25 2004 23.9 [0.12] 9.6 [0.28] 14.7 [0.24] 549 19 _________________________________________________________________________________________________________ Note: Results are for firms from ISIC industries 15 – 36 with at least 20 employees at the median over the years covered in the panel. The firms with the bottom / top one percent of productivity in a year are excluded from all computations. The productivity premia are estimated in an OLS-regression of log (productivity) on a dummy variable for export starters controlling for the log of the number of employees and its squared value, the log of wages and salaries per employee, and dummy variables for 4-digit-industries, all measured three years before the start. To facilitate interpretation the estimated coefficients for the exporter dummy variable has been transformed by 100(exp(ß)-1).
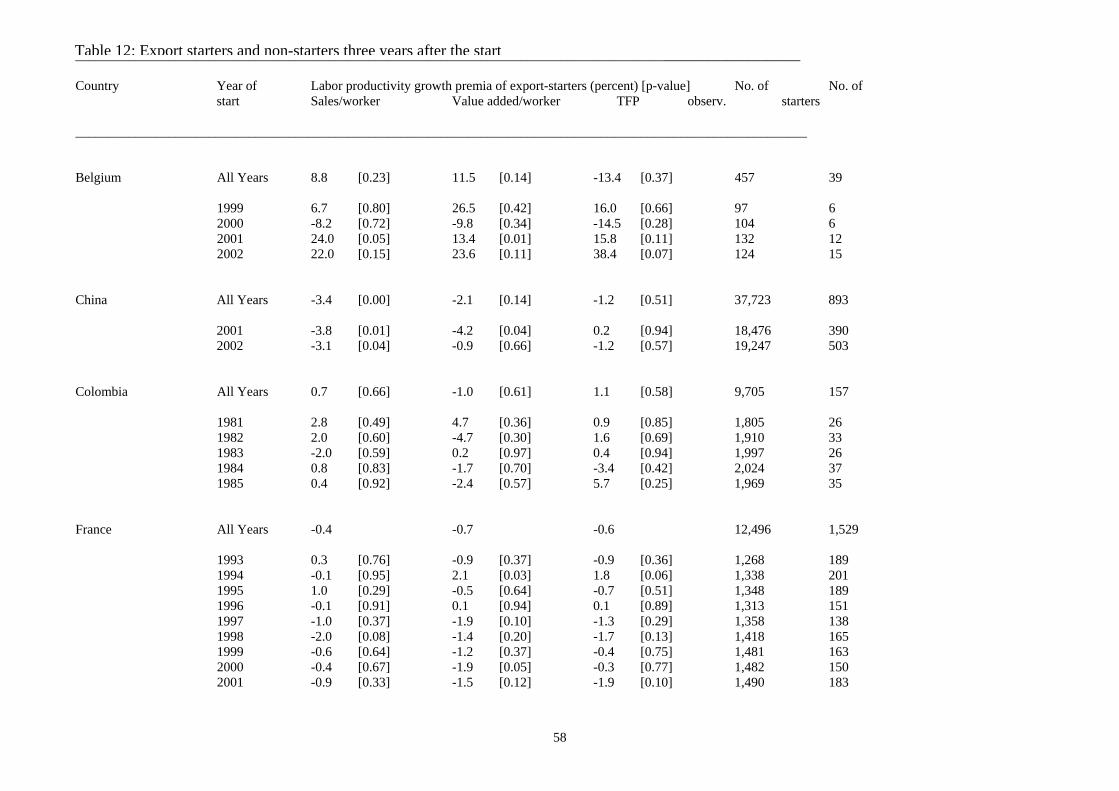
_____________________________________________________________________________________________________________ Country Year of Labor productivity growth premia of export-starters (percent) [p-value] No. of No. of start Sales/worker Value added/worker TFP observ. starters ______________________________________________________________________________________________________________
58
Belgium All Years 8.8 [0.23] 11.5 [0.14] -13.4 [0.37] 457 39 1999 6.7 [0.80] 26.5 [0.42] 16.0 [0.66] 97 6 2000 -8.2 [0.72] -9.8 [0.34] -14.5 [0.28] 104 6 2001 24.0 [0.05] 13.4 [0.01] 15.8 [0.11] 132 12 2002 22.0 [0.15] 23.6 [0.11] 38.4 [0.07] 124 15 China All Years -3.4 [0.00] -2.1 [0.14] -1.2 [0.51] 37,723 893 2001 -3.8 [0.01] -4.2 [0.04] 0.2 [0.94] 18,476 390 2002 -3.1 [0.04] -0.9 [0.66] -1.2 [0.57] 19,247 503 Colombia All Years 0.7 [0.66] -1.0 [0.61] 1.1 [0.58] 9,705 157 1981 2.8 [0.49] 4.7 [0.36] 0.9 [0.85] 1,805 26 1982 2.0 [0.60] -4.7 [0.30] 1.6 [0.69] 1,910 33 1983 -2.0 [0.59] 0.2 [0.97] 0.4 [0.94] 1,997 26 1984 0.8 [0.83] -1.7 [0.70] -3.4 [0.42] 2,024 37 1985 0.4 [0.92] -2.4 [0.57] 5.7 [0.25] 1,969 35 France All Years -0.4 -0.7 -0.6 12,496 1,529 1993 0.3 [0.76] -0.9 [0.37] -0.9 [0.36] 1,268 189 1994 -0.1 [0.95] 2.1 [0.03] 1.8 [0.06] 1,338 201 1995 1.0 [0.29] -0.5 [0.64] -0.7 [0.51] 1,348 189 1996 -0.1 [0.91] 0.1 [0.94] 0.1 [0.89] 1,313 151 1997 -1.0 [0.37] -1.9 [0.10] -1.3 [0.29] 1,358 138 1998 -2.0 [0.08] -1.4 [0.20] -1.7 [0.13] 1,418 165 1999 -0.6 [0.64] -1.2 [0.37] -0.4 [0.75] 1,481 163 2000 -0.4 [0.67] -1.9 [0.05] -0.3 [0.77] 1,482 150 2001 -0.9 [0.33] -1.5 [0.12] -1.9 [0.10] 1,490 183
Table 12: Export starters and non-starters three years after the start
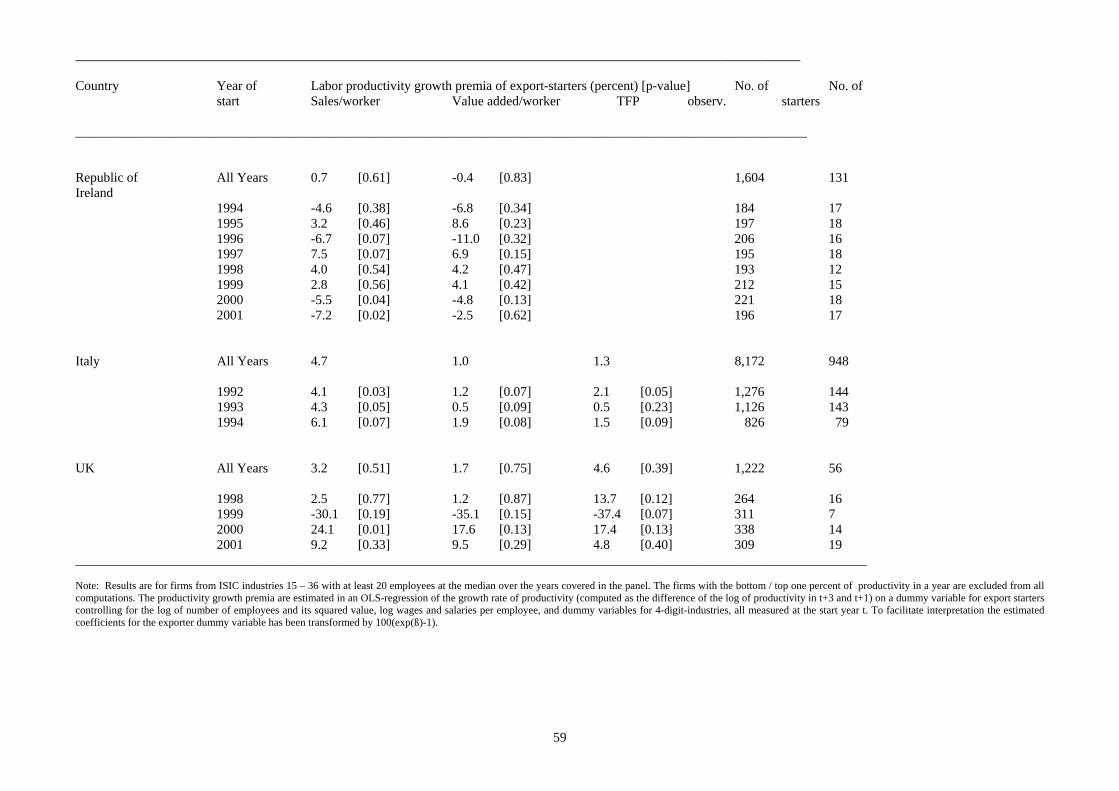
_____________________________________________________________________________________________________________ Country Year of Labor productivity growth premia of export-starters (percent) [p-value] No. of No. of start Sales/worker Value added/worker TFP observ. starters ______________________________________________________________________________________________________________
59
Republic of All Years 0.7 [0.61] -0.4 [0.83] 1,604 131 Ireland 1994 -4.6 [0.38] -6.8 [0.34] 184 17 1995 3.2 [0.46] 8.6 [0.23] 197 18 1996 -6.7 [0.07] -11.0 [0.32] 206 16 1997 7.5 [0.07] 6.9 [0.15] 195 18 1998 4.0 [0.54] 4.2 [0.47] 193 12 1999 2.8 [0.56] 4.1 [0.42] 212 15 2000 -5.5 [0.04] -4.8 [0.13] 221 18 2001 -7.2 [0.02] -2.5 [0.62] 196 17 Italy All Years 4.7 1.0 1.3 8,172 948 1992 4.1 [0.03] 1.2 [0.07] 2.1 [0.05] 1,276 144 1993 4.3 [0.05] 0.5 [0.09] 0.5 [0.23] 1,126 143 1994 6.1 [0.07] 1.9 [0.08] 1.5 [0.09] 826 79 UK All Years 3.2 [0.51] 1.7 [0.75] 4.6 [0.39] 1,222 56 1998 2.5 [0.77] 1.2 [0.87] 13.7 [0.12] 264 16 1999 -30.1 [0.19] -35.1 [0.15] -37.4 [0.07] 311 7 2000 24.1 [0.01] 17.6 [0.13] 17.4 [0.13] 338 14 2001 9.2 [0.33] 9.5 [0.29] 4.8 [0.40] 309 19 _______________________________________________________________________________________________________________________ Note: Results are for firms from ISIC industries 15 – 36 with at least 20 employees at the median over the years covered in the panel. The firms with the bottom / top one percent of productivity in a year are excluded from all computations. The productivity growth premia are estimated in an OLS-regression of the growth rate of productivity (computed as the difference of the log of productivity in t+3 and t+1) on a dummy variable for export starters controlling for the log of number of employees and its squared value, log wages and salaries per employee, and dummy variables for 4-digit-industries, all measured at the start year t. To facilitate interpretation the estimated coefficients for the exporter dummy variable has been transformed by 100(exp(ß)-1).
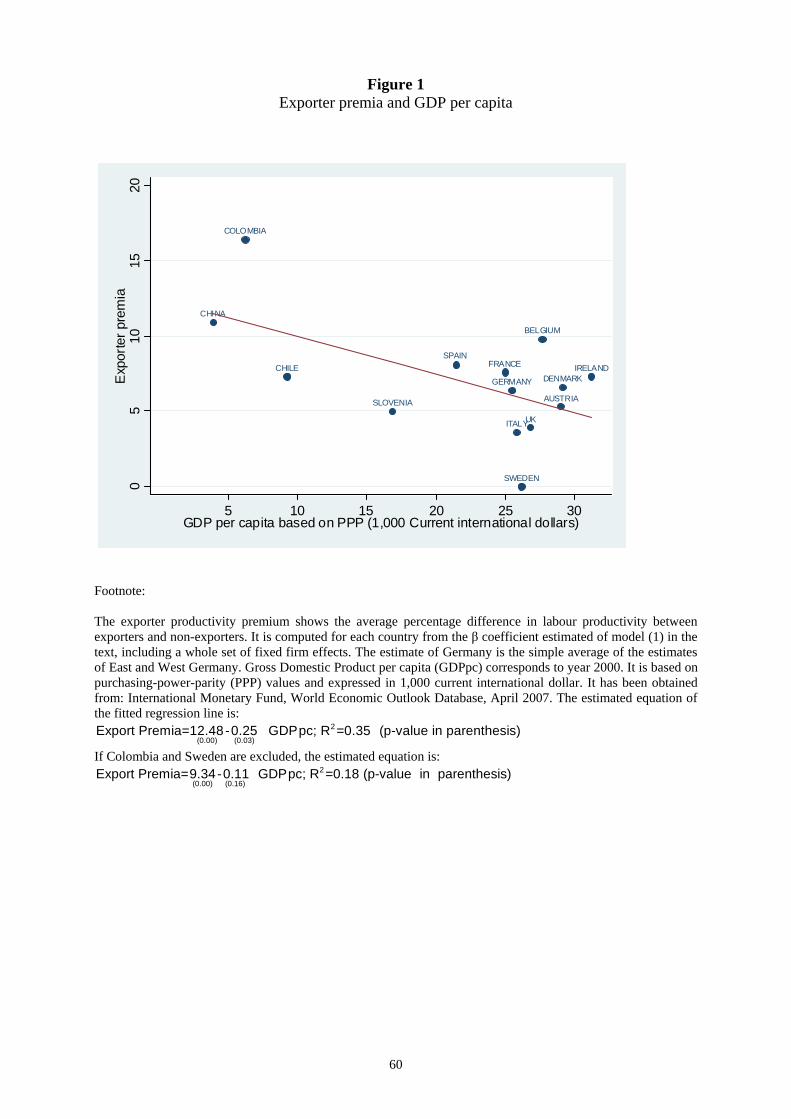
60
Figure 1 Exporter premia and GDP per capita
AUSTRIA
BELGIUM
CHILE
CHINA
COLOMBIA
DENMARK
FRANCE
GERMANYIRELAND
ITALY
SLOVENIA
SPAIN
SWEDEN
UK
05
1015
20E
xpor
ter p
rem
ia
5 10 15 20 25 30GDP per capita based on PPP (1,000 Current international dollars)
Footnote: The exporter productivity premium shows the average percentage difference in labour productivity between exporters and non-exporters. It is computed for each country from the β coefficient estimated of model (1) in the text, including a whole set of fixed firm effects. The estimate of Germany is the simple average of the estimates of East and West Germany. Gross Domestic Product per capita (GDPpc) corresponds to year 2000. It is based on purchasing-power-parity (PPP) values and expressed in 1,000 current international dollar. It has been obtained from: International Monetary Fund, World Economic Outlook Database, April 2007. The estimated equation of the fitted regression line is:
2
(0.00) (0.03)Export Premia=12.48-0.25 GDPpc; R =0.35 (p-value in parenthesis)
If Colombia and Sweden are excluded, the estimated equation is: 2
(0.00) (0.16)Export Premia=9.34-0.11 GDPpc; R =0.18 (p-value in parenthesis)
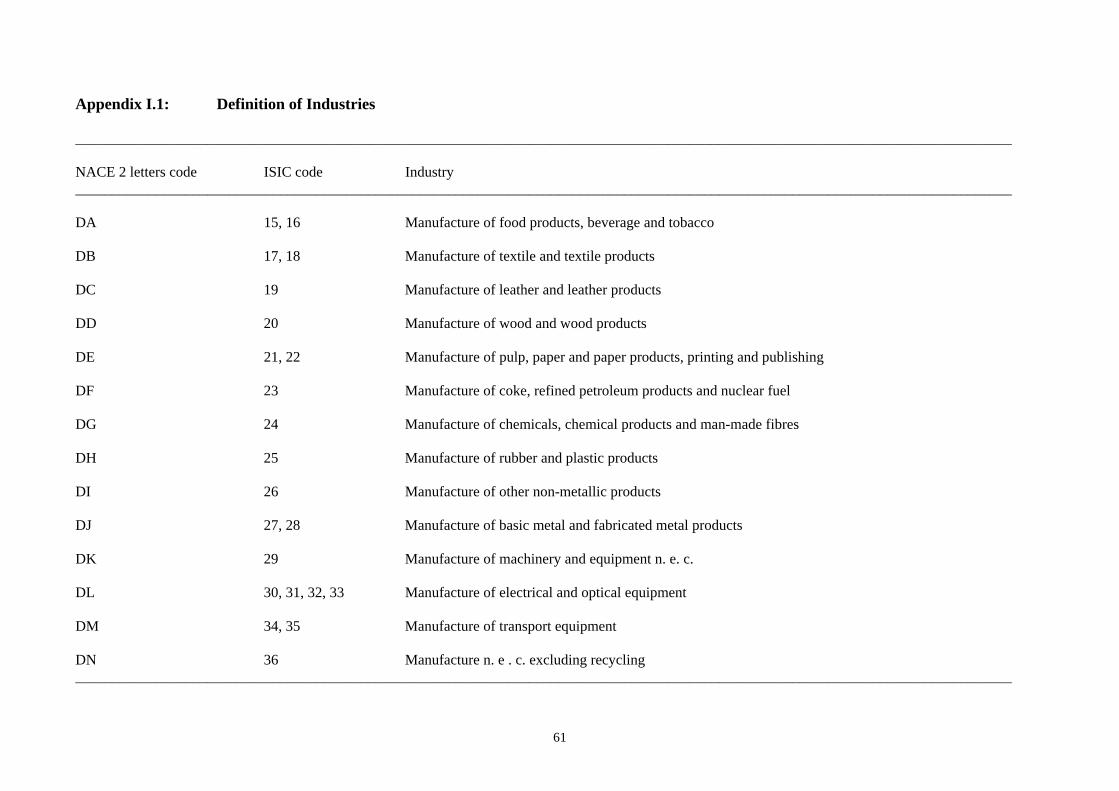
61
Appendix I.1: Definition of Industries ________________________________________________________________________________________________________________________________ NACE 2 letters code ISIC code Industry ________________________________________________________________________________________________________________________________ DA 15, 16 Manufacture of food products, beverage and tobacco DB 17, 18 Manufacture of textile and textile products DC 19 Manufacture of leather and leather products DD 20 Manufacture of wood and wood products DE 21, 22 Manufacture of pulp, paper and paper products, printing and publishing DF 23 Manufacture of coke, refined petroleum products and nuclear fuel DG 24 Manufacture of chemicals, chemical products and man-made fibres DH 25 Manufacture of rubber and plastic products DI 26 Manufacture of other non-metallic products DJ 27, 28 Manufacture of basic metal and fabricated metal products DK 29 Manufacture of machinery and equipment n. e. c. DL 30, 31, 32, 33 Manufacture of electrical and optical equipment DM 34, 35 Manufacture of transport equipment DN 36 Manufacture n. e . c. excluding recycling ________________________________________________________________________________________________________________________________
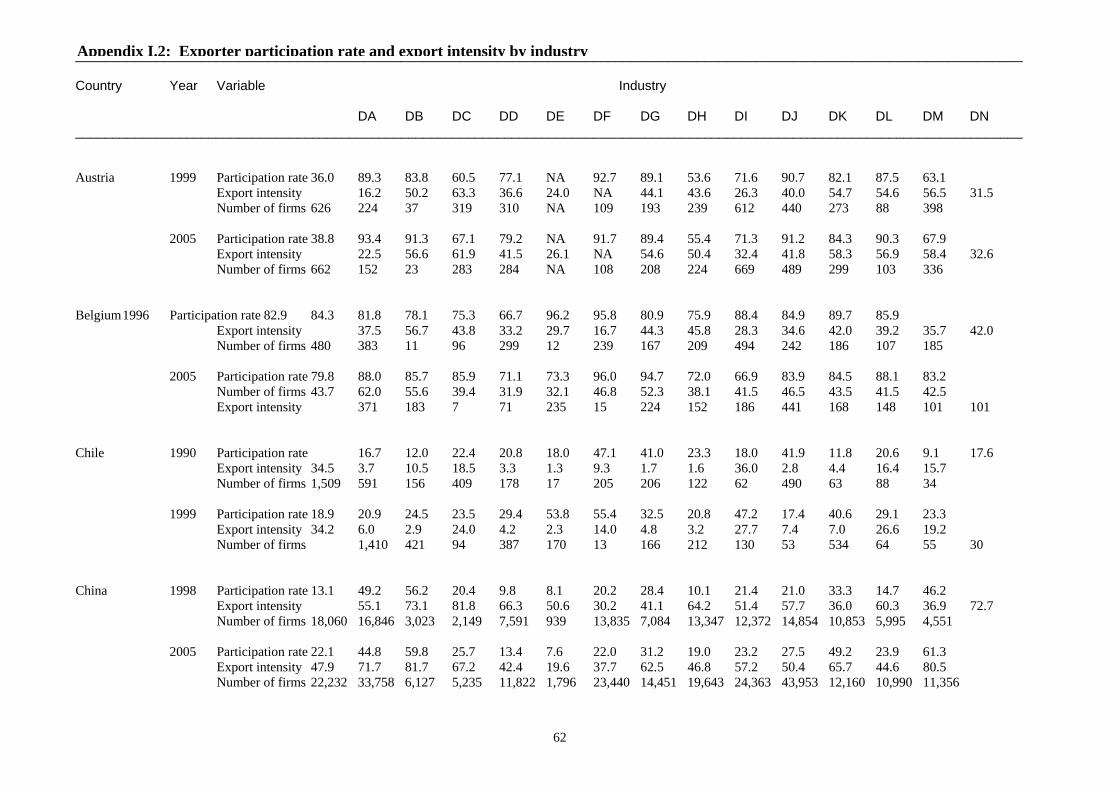
________________________________________________________________________________________________________________________________ Country Year Variable Industry DA DB DC DD DE DF DG DH DI DJ DK DL DM DN ________________________________________________________________________________________________________________________________
62
Austria 1999 Participation rate 36.0 89.3 83.8 60.5 77.1 NA 92.7 89.1 53.6 71.6 90.7 82.1 87.5 63.1 Export intensity 16.2 50.2 63.3 36.6 24.0 NA 44.1 43.6 26.3 40.0 54.7 54.6 56.5 31.5
Number of firms 626 224 37 319 310 NA 109 193 239 612 440 273 88 398
2005 Participation rate 38.8 93.4 91.3 67.1 79.2 NA 91.7 89.4 55.4 71.3 91.2 84.3 90.3 67.9 Export intensity 22.5 56.6 61.9 41.5 26.1 NA 54.6 50.4 32.4 41.8 58.3 56.9 58.4 32.6 Number of firms 662 152 23 283 284 NA 108 208 224 669 489 299 103 336
Belgium 1996 Participation rate 82.9 84.3 81.8 78.1 75.3 66.7 96.2 95.8 80.9 75.9 88.4 84.9 89.7 85.9 Export intensity 37.5 56.7 43.8 33.2 29.7 16.7 44.3 45.8 28.3 34.6 42.0 39.2 35.7 42.0 Number of firms 480 383 11 96 299 12 239 167 209 494 242 186 107 185
2005 Participation rate 79.8 88.0 85.7 85.9 71.1 73.3 96.0 94.7 72.0 66.9 83.9 84.5 88.1 83.2 Number of firms 43.7 62.0 55.6 39.4 31.9 32.1 46.8 52.3 38.1 41.5 46.5 43.5 41.5 42.5 Export intensity 371 183 7 71 235 15 224 152 186 441 168 148 101 101
Chile 1990 Participation rate 16.7 12.0 22.4 20.8 18.0 47.1 41.0 23.3 18.0 41.9 11.8 20.6 9.1 17.6
Export intensity 34.5 3.7 10.5 18.5 3.3 1.3 9.3 1.7 1.6 36.0 2.8 4.4 16.4 15.7 Number of firms 1,509 591 156 409 178 17 205 206 122 62 490 63 88 34
1999 Participation rate 18.9 20.9 24.5 23.5 29.4 53.8 55.4 32.5 20.8 47.2 17.4 40.6 29.1 23.3 Export intensity 34.2 6.0 2.9 24.0 4.2 2.3 14.0 4.8 3.2 27.7 7.4 7.0 26.6 19.2 Number of firms 1,410 421 94 387 170 13 166 212 130 53 534 64 55 30
China 1998 Participation rate 13.1 49.2 56.2 20.4 9.8 8.1 20.2 28.4 10.1 21.4 21.0 33.3 14.7 46.2
Export intensity 55.1 73.1 81.8 66.3 50.6 30.2 41.1 64.2 51.4 57.7 36.0 60.3 36.9 72.7 Number of firms 18,060 16,846 3,023 2,149 7,591 939 13,835 7,084 13,347 12,372 14,854 10,853 5,995 4,551
2005 Participation rate 22.1 44.8 59.8 25.7 13.4 7.6 22.0 31.2 19.0 23.2 27.5 49.2 23.9 61.3
Export intensity 47.9 71.7 81.7 67.2 42.4 19.6 37.7 62.5 46.8 57.2 50.4 65.7 44.6 80.5 Number of firms 22,232 33,758 6,127 5,235 11,822 1,796 23,440 14,451 19,643 24,363 43,953 12,160 10,990 11,356
Appendix I.2: Exporter participation rate and export intensity by industry
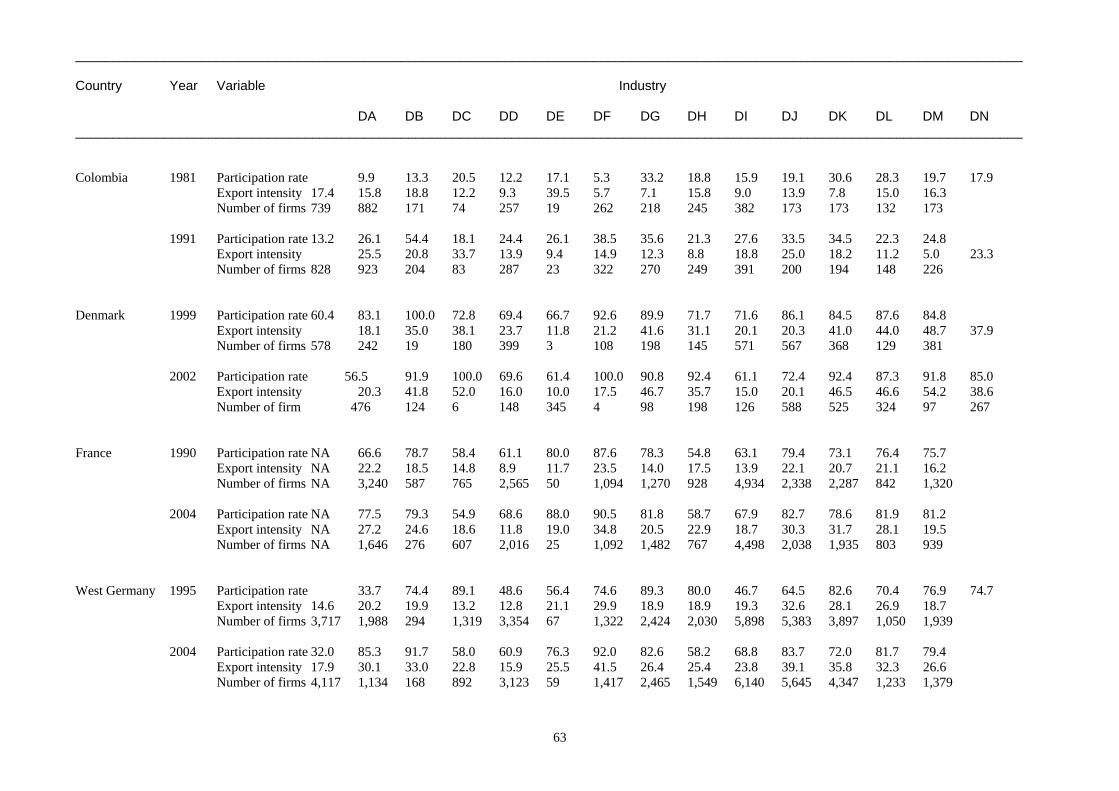
________________________________________________________________________________________________________________________________ Country Year Variable Industry DA DB DC DD DE DF DG DH DI DJ DK DL DM DN ________________________________________________________________________________________________________________________________
63
Colombia 1981 Participation rate 9.9 13.3 20.5 12.2 17.1 5.3 33.2 18.8 15.9 19.1 30.6 28.3 19.7 17.9
Export intensity 17.4 15.8 18.8 12.2 9.3 39.5 5.7 7.1 15.8 9.0 13.9 7.8 15.0 16.3 Number of firms 739 882 171 74 257 19 262 218 245 382 173 173 132 173
1991 Participation rate 13.2 26.1 54.4 18.1 24.4 26.1 38.5 35.6 21.3 27.6 33.5 34.5 22.3 24.8
Export intensity 25.5 20.8 33.7 13.9 9.4 14.9 12.3 8.8 18.8 25.0 18.2 11.2 5.0 23.3 Number of firms 828 923 204 83 287 23 322 270 249 391 200 194 148 226 Denmark 1999 Participation rate 60.4 83.1 100.0 72.8 69.4 66.7 92.6 89.9 71.7 71.6 86.1 84.5 87.6 84.8 Export intensity 18.1 35.0 38.1 23.7 11.8 21.2 41.6 31.1 20.1 20.3 41.0 44.0 48.7 37.9 Number of firms 578 242 19 180 399 3 108 198 145 571 567 368 129 381 2002 Participation rate 56.5 91.9 100.0 69.6 61.4 100.0 90.8 92.4 61.1 72.4 92.4 87.3 91.8 85.0 Export intensity 20.3 41.8 52.0 16.0 10.0 17.5 46.7 35.7 15.0 20.1 46.5 46.6 54.2 38.6 Number of firm 476 124 6 148 345 4 98 198 126 588 525 324 97 267 France 1990 Participation rate NA 66.6 78.7 58.4 61.1 80.0 87.6 78.3 54.8 63.1 79.4 73.1 76.4 75.7
Export intensity NA 22.2 18.5 14.8 8.9 11.7 23.5 14.0 17.5 13.9 22.1 20.7 21.1 16.2 Number of firms NA 3,240 587 765 2,565 50 1,094 1,270 928 4,934 2,338 2,287 842 1,320
2004 Participation rate NA 77.5 79.3 54.9 68.6 88.0 90.5 81.8 58.7 67.9 82.7 78.6 81.9 81.2 Export intensity NA 27.2 24.6 18.6 11.8 19.0 34.8 20.5 22.9 18.7 30.3 31.7 28.1 19.5 Number of firms NA 1,646 276 607 2,016 25 1,092 1,482 767 4,498 2,038 1,935 803 939
West Germany 1995 Participation rate 33.7 74.4 89.1 48.6 56.4 74.6 89.3 80.0 46.7 64.5 82.6 70.4 76.9 74.7
Export intensity 14.6 20.2 19.9 13.2 12.8 21.1 29.9 18.9 18.9 19.3 32.6 28.1 26.9 18.7 Number of firms 3,717 1,988 294 1,319 3,354 67 1,322 2,424 2,030 5,898 5,383 3,897 1,050 1,939
2004 Participation rate 32.0 85.3 91.7 58.0 60.9 76.3 92.0 82.6 58.2 68.8 83.7 72.0 81.7 79.4
Export intensity 17.9 30.1 33.0 22.8 15.9 25.5 41.5 26.4 25.4 23.8 39.1 35.8 32.3 26.6 Number of firms 4,117 1,134 168 892 3,123 59 1,417 2,465 1,549 6,140 5,645 4,347 1,233 1,379
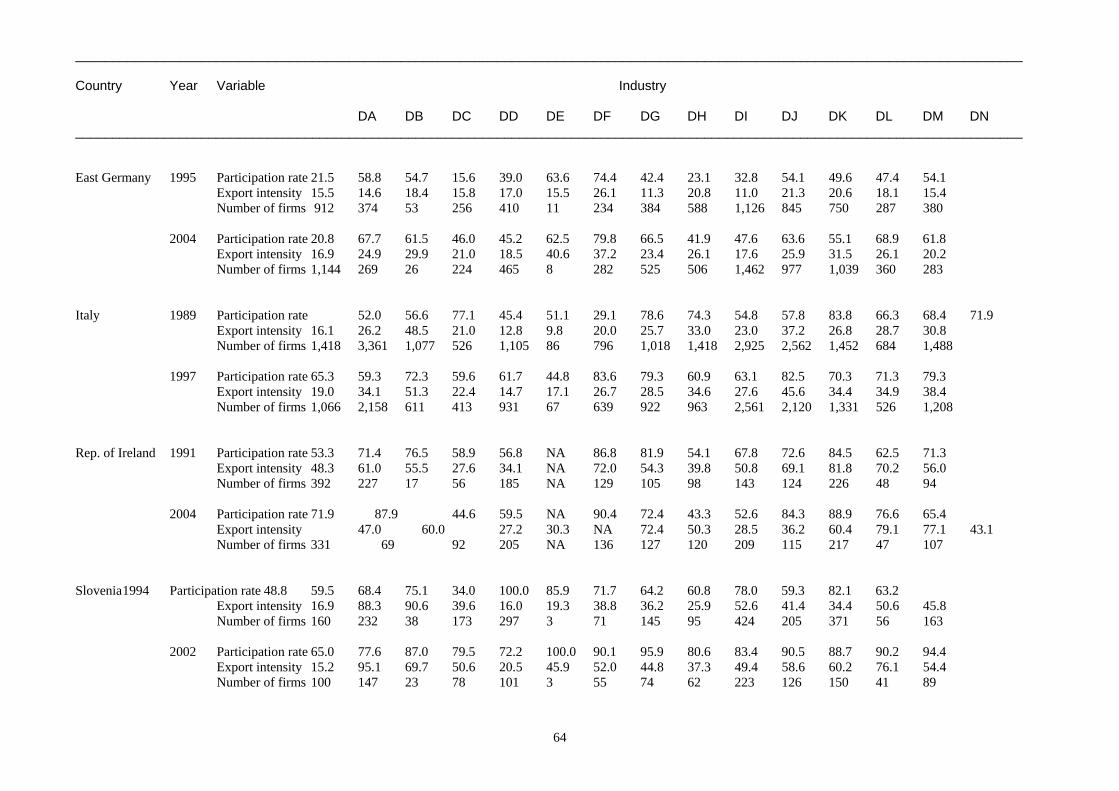
________________________________________________________________________________________________________________________________ Country Year Variable Industry DA DB DC DD DE DF DG DH DI DJ DK DL DM DN ________________________________________________________________________________________________________________________________
64
East Germany 1995 Participation rate 21.5 58.8 54.7 15.6 39.0 63.6 74.4 42.4 23.1 32.8 54.1 49.6 47.4 54.1
Export intensity 15.5 14.6 18.4 15.8 17.0 15.5 26.1 11.3 20.8 11.0 21.3 20.6 18.1 15.4 Number of firms 912 374 53 256 410 11 234 384 588 1,126 845 750 287 380
2004 Participation rate 20.8 67.7 61.5 46.0 45.2 62.5 79.8 66.5 41.9 47.6 63.6 55.1 68.9 61.8 Export intensity 16.9 24.9 29.9 21.0 18.5 40.6 37.2 23.4 26.1 17.6 25.9 31.5 26.1 20.2 Number of firms 1,144 269 26 224 465 8 282 525 506 1,462 977 1,039 360 283
Italy 1989 Participation rate 52.0 56.6 77.1 45.4 51.1 29.1 78.6 74.3 54.8 57.8 83.8 66.3 68.4 71.9
Export intensity 16.1 26.2 48.5 21.0 12.8 9.8 20.0 25.7 33.0 23.0 37.2 26.8 28.7 30.8 Number of firms 1,418 3,361 1,077 526 1,105 86 796 1,018 1,418 2,925 2,562 1,452 684 1,488
1997 Participation rate 65.3 59.3 72.3 59.6 61.7 44.8 83.6 79.3 60.9 63.1 82.5 70.3 71.3 79.3
Export intensity 19.0 34.1 51.3 22.4 14.7 17.1 26.7 28.5 34.6 27.6 45.6 34.4 34.9 38.4 Number of firms 1,066 2,158 611 413 931 67 639 922 963 2,561 2,120 1,331 526 1,208
Rep. of Ireland 1991 Participation rate 53.3 71.4 76.5 58.9 56.8 NA 86.8 81.9 54.1 67.8 72.6 84.5 62.5 71.3
Export intensity 48.3 61.0 55.5 27.6 34.1 NA 72.0 54.3 39.8 50.8 69.1 81.8 70.2 56.0 Number of firms 392 227 17 56 185 NA 129 105 98 143 124 226 48 94
2004 Participation rate 71.9 87.9 44.6 59.5 NA 90.4 72.4 43.3 52.6 84.3 88.9 76.6 65.4
Export intensity 47.0 60.0 27.2 30.3 NA 72.4 50.3 28.5 36.2 60.4 79.1 77.1 43.1 Number of firms 331 69 92 205 NA 136 127 120 209 115 217 47 107 Slovenia 1994 Participation rate 48.8 59.5 68.4 75.1 34.0 100.0 85.9 71.7 64.2 60.8 78.0 59.3 82.1 63.2
Export intensity 16.9 88.3 90.6 39.6 16.0 19.3 38.8 36.2 25.9 52.6 41.4 34.4 50.6 45.8 Number of firms 160 232 38 173 297 3 71 145 95 424 205 371 56 163
2002 Participation rate 65.0 77.6 87.0 79.5 72.2 100.0 90.1 95.9 80.6 83.4 90.5 88.7 90.2 94.4
Export intensity 15.2 95.1 69.7 50.6 20.5 45.9 52.0 44.8 37.3 49.4 58.6 60.2 76.1 54.4 Number of firms 100 147 23 78 101 3 55 74 62 223 126 150 41 89
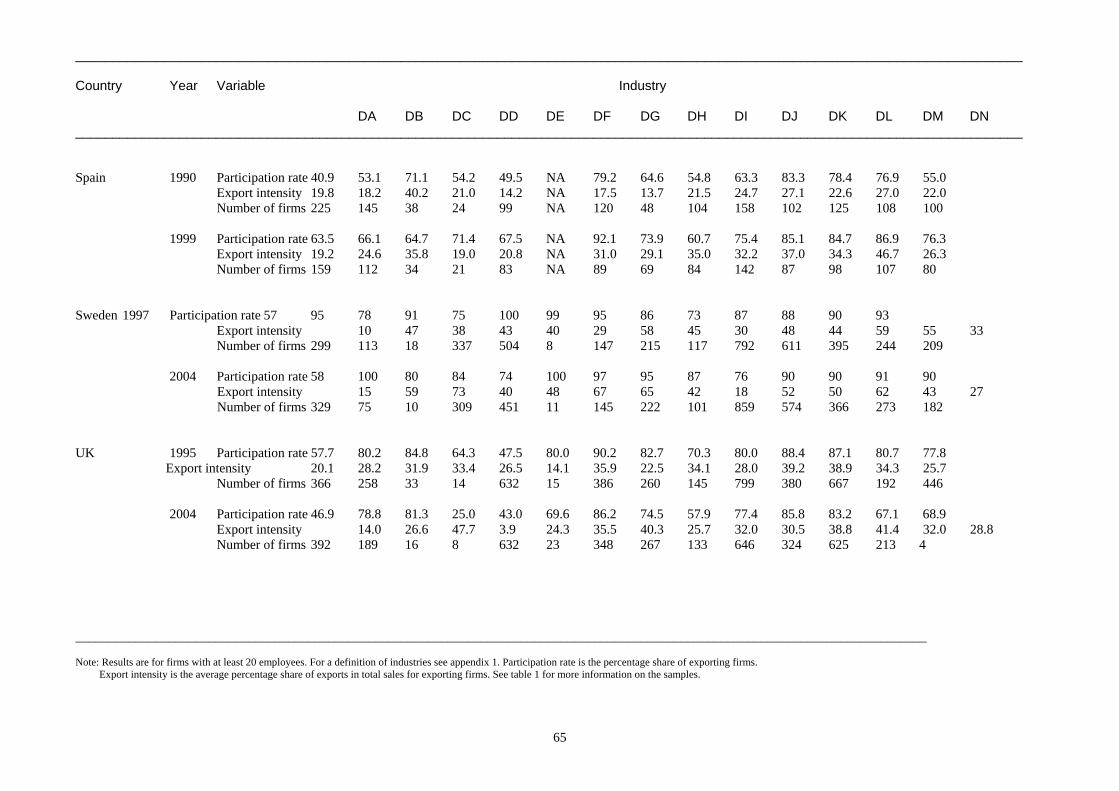
________________________________________________________________________________________________________________________________ Country Year Variable Industry DA DB DC DD DE DF DG DH DI DJ DK DL DM DN ________________________________________________________________________________________________________________________________
65
Spain 1990 Participation rate 40.9 53.1 71.1 54.2 49.5 NA 79.2 64.6 54.8 63.3 83.3 78.4 76.9 55.0
Export intensity 19.8 18.2 40.2 21.0 14.2 NA 17.5 13.7 21.5 24.7 27.1 22.6 27.0 22.0 Number of firms 225 145 38 24 99 NA 120 48 104 158 102 125 108 100
1999 Participation rate 63.5 66.1 64.7 71.4 67.5 NA 92.1 73.9 60.7 75.4 85.1 84.7 86.9 76.3
Export intensity 19.2 24.6 35.8 19.0 20.8 NA 31.0 29.1 35.0 32.2 37.0 34.3 46.7 26.3 Number of firms 159 112 34 21 83 NA 89 69 84 142 87 98 107 80
Sweden 1997 Participation rate 57 95 78 91 75 100 99 95 86 73 87 88 90 93 Export intensity 10 47 38 43 40 29 58 45 30 48 44 59 55 33 Number of firms 299 113 18 337 504 8 147 215 117 792 611 395 244 209 2004 Participation rate 58 100 80 84 74 100 97 95 87 76 90 90 91 90
Export intensity 15 59 73 40 48 67 65 42 18 52 50 62 43 27 Number of firms 329 75 10 309 451 11 145 222 101 859 574 366 273 182
UK 1995 Participation rate 57.7 80.2 84.8 64.3 47.5 80.0 90.2 82.7 70.3 80.0 88.4 87.1 80.7 77.8 Export intensity 20.1 28.2 31.9 33.4 26.5 14.1 35.9 22.5 34.1 28.0 39.2 38.9 34.3 25.7 Number of firms 366 258 33 14 632 15 386 260 145 799 380 667 192 446 2004 Participation rate 46.9 78.8 81.3 25.0 43.0 69.6 86.2 74.5 57.9 77.4 85.8 83.2 67.1 68.9
Export intensity 14.0 26.6 47.7 3.9 24.3 35.5 40.3 25.7 32.0 30.5 38.8 41.4 32.0 28.8 Number of firms 392 189 16 8 632 23 348 267 133 646 324 625 213 4
________________________________________________________________________________________________________________________________ Note: Results are for firms with at least 20 employees. For a definition of industries see appendix 1. Participation rate is the percentage share of exporting firms. Export intensity is the average percentage share of exports in total sales for exporting firms. See table 1 for more information on the samples.
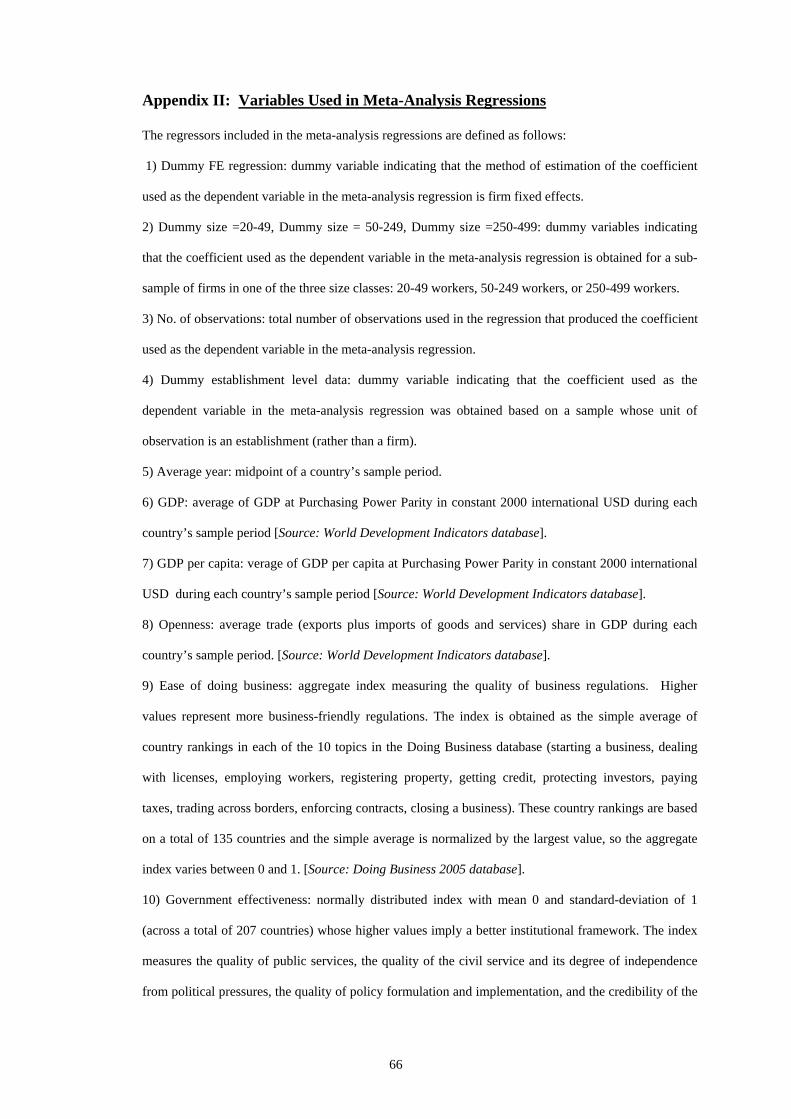
66
Appendix II: Variables Used in Meta-Analysis Regressions
The regressors included in the meta-analysis regressions are defined as follows:
1) Dummy FE regression: dummy variable indicating that the method of estimation of the coefficient
used as the dependent variable in the meta-analysis regression is firm fixed effects.
2) Dummy size =20-49, Dummy size = 50-249, Dummy size =250-499: dummy variables indicating
that the coefficient used as the dependent variable in the meta-analysis regression is obtained for a sub-
sample of firms in one of the three size classes: 20-49 workers, 50-249 workers, or 250-499 workers.
3) No. of observations: total number of observations used in the regression that produced the coefficient
used as the dependent variable in the meta-analysis regression.
4) Dummy establishment level data: dummy variable indicating that the coefficient used as the
dependent variable in the meta-analysis regression was obtained based on a sample whose unit of
observation is an establishment (rather than a firm).
5) Average year: midpoint of a country’s sample period.
6) GDP: average of GDP at Purchasing Power Parity in constant 2000 international USD during each
country’s sample period [Source: World Development Indicators database].
7) GDP per capita: verage of GDP per capita at Purchasing Power Parity in constant 2000 international
USD during each country’s sample period [Source: World Development Indicators database].
8) Openness: average trade (exports plus imports of goods and services) share in GDP during each
country’s sample period. [Source: World Development Indicators database].
9) Ease of doing business: aggregate index measuring the quality of business regulations. Higher
values represent more business-friendly regulations. The index is obtained as the simple average of
country rankings in each of the 10 topics in the Doing Business database (starting a business, dealing
with licenses, employing workers, registering property, getting credit, protecting investors, paying
taxes, trading across borders, enforcing contracts, closing a business). These country rankings are based
on a total of 135 countries and the simple average is normalized by the largest value, so the aggregate
index varies between 0 and 1. [Source: Doing Business 2005 database].
10) Government effectiveness: normally distributed index with mean 0 and standard-deviation of 1
(across a total of 207 countries) whose higher values imply a better institutional framework. The index
measures the quality of public services, the quality of the civil service and its degree of independence
from political pressures, the quality of policy formulation and implementation, and the credibility of the

67
government’s commitment to such policies. [Source: Governance Indicators of Kaufmann, Kraay, and
Mastruzzi (2007)].
11) Regulatory quality: normally distributed index with mean 0 and standard-deviation of 1 (across a
total of 207 countries) whose higher values imply a better institutional framework. The index measures
the ability of the government to formulate and implement sound policies and regulations that permit and
promote private sector development. [Source: Governance Indicators of Kaufmann, Kraay, and
Mastruzzi (2007)].
General note: for all the country characteristics, values for West Germany were used for East Germany
also.
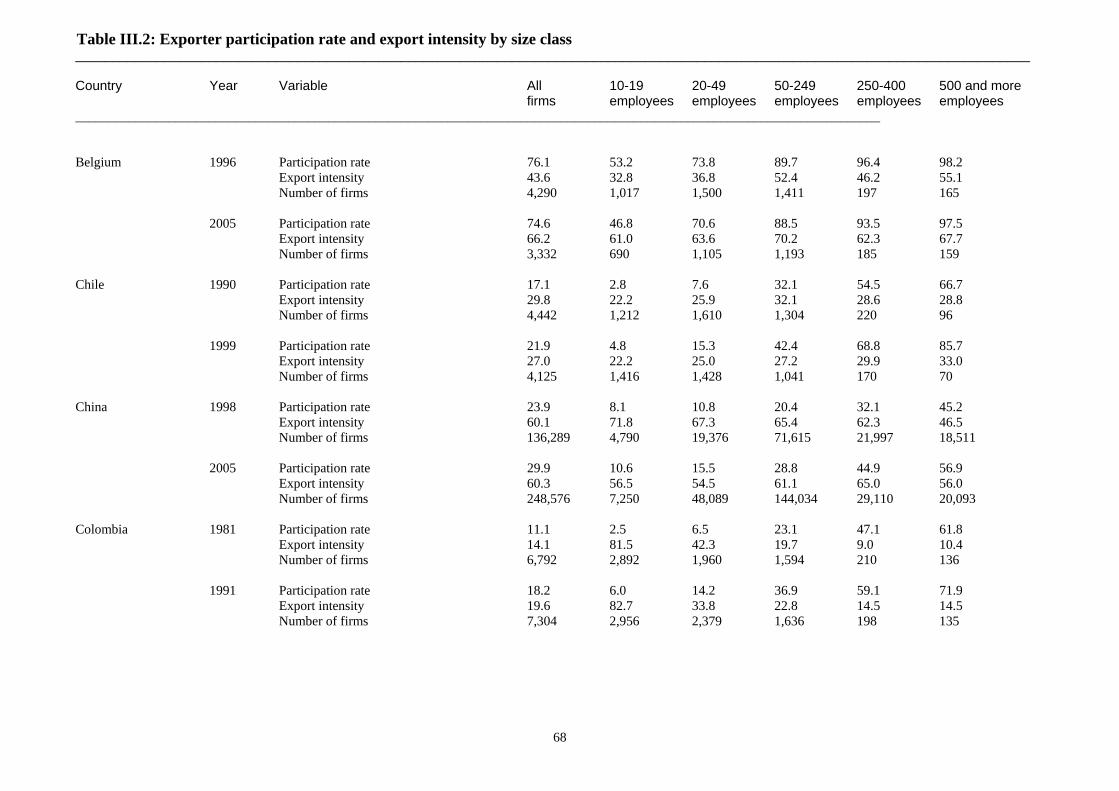
_________________________________________________________________________________________________________________________________ Country Year Variable All 10-19 20-49 50-249 250-400 500 and more firms employees employees employees employees employees _________________________________________________________________________________________________________________________
68
Belgium 1996 Participation rate 76.1 53.2 73.8 89.7 96.4 98.2 Export intensity 43.6 32.8 36.8 52.4 46.2 55.1 Number of firms 4,290 1,017 1,500 1,411 197 165 2005 Participation rate 74.6 46.8 70.6 88.5 93.5 97.5 Export intensity 66.2 61.0 63.6 70.2 62.3 67.7 Number of firms 3,332 690 1,105 1,193 185 159 Chile 1990 Participation rate 17.1 2.8 7.6 32.1 54.5 66.7 Export intensity 29.8 22.2 25.9 32.1 28.6 28.8 Number of firms 4,442 1,212 1,610 1,304 220 96 1999 Participation rate 21.9 4.8 15.3 42.4 68.8 85.7
Export intensity 27.0 22.2 25.0 27.2 29.9 33.0 Number of firms 4,125 1,416 1,428 1,041 170 70
China 1998 Participation rate 23.9 8.1 10.8 20.4 32.1 45.2 Export intensity 60.1 71.8 67.3 65.4 62.3 46.5 Number of firms 136,289 4,790 19,376 71,615 21,997 18,511 2005 Participation rate 29.9 10.6 15.5 28.8 44.9 56.9 Export intensity 60.3 56.5 54.5 61.1 65.0 56.0 Number of firms 248,576 7,250 48,089 144,034 29,110 20,093 Colombia 1981 Participation rate 11.1 2.5 6.5 23.1 47.1 61.8 Export intensity 14.1 81.5 42.3 19.7 9.0 10.4 Number of firms 6,792 2,892 1,960 1,594 210 136 1991 Participation rate 18.2 6.0 14.2 36.9 59.1 71.9 Export intensity 19.6 82.7 33.8 22.8 14.5 14.5 Number of firms 7,304 2,956 2,379 1,636 198 135
Table III.2: Exporter participation rate and export intensity by size class
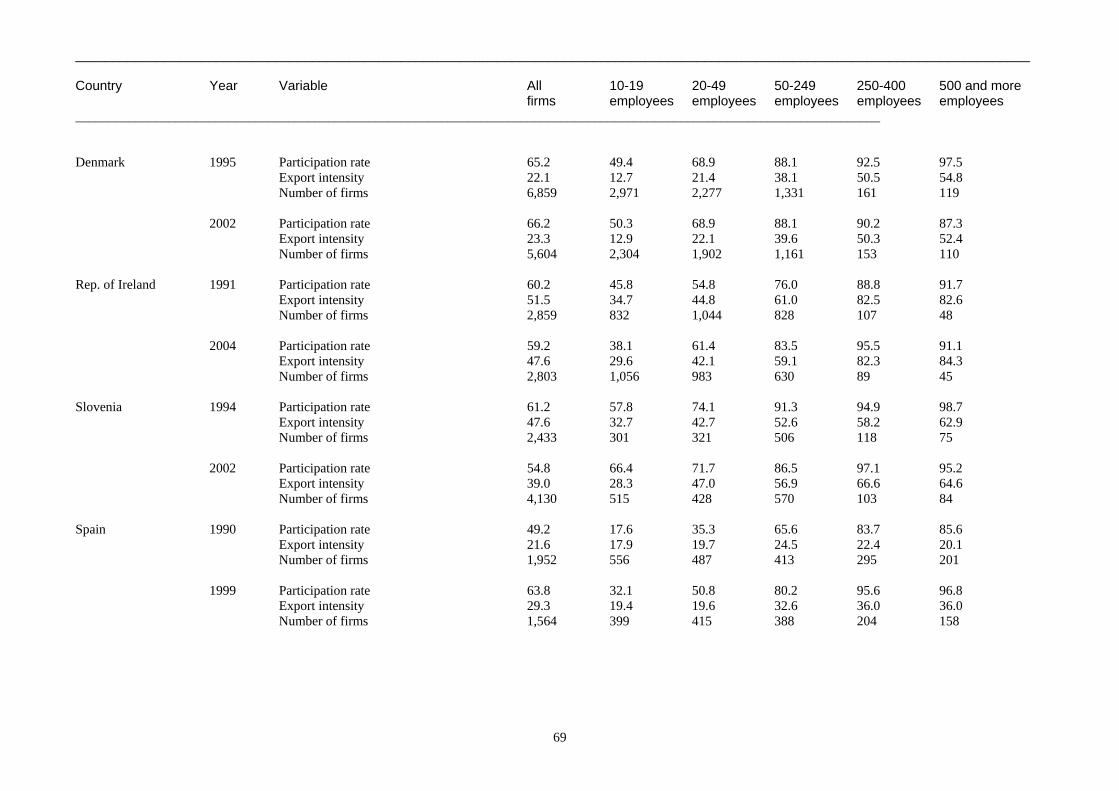
_________________________________________________________________________________________________________________________________ Country Year Variable All 10-19 20-49 50-249 250-400 500 and more firms employees employees employees employees employees _________________________________________________________________________________________________________________________
69
Denmark 1995 Participation rate 65.2 49.4 68.9 88.1 92.5 97.5 Export intensity 22.1 12.7 21.4 38.1 50.5 54.8 Number of firms 6,859 2,971 2,277 1,331 161 119 2002 Participation rate 66.2 50.3 68.9 88.1 90.2 87.3 Export intensity 23.3 12.9 22.1 39.6 50.3 52.4 Number of firms 5,604 2,304 1,902 1,161 153 110 Rep. of Ireland 1991 Participation rate 60.2 45.8 54.8 76.0 88.8 91.7 Export intensity 51.5 34.7 44.8 61.0 82.5 82.6 Number of firms 2,859 832 1,044 828 107 48 2004 Participation rate 59.2 38.1 61.4 83.5 95.5 91.1 Export intensity 47.6 29.6 42.1 59.1 82.3 84.3 Number of firms 2,803 1,056 983 630 89 45 Slovenia 1994 Participation rate 61.2 57.8 74.1 91.3 94.9 98.7 Export intensity 47.6 32.7 42.7 52.6 58.2 62.9 Number of firms 2,433 301 321 506 118 75 2002 Participation rate 54.8 66.4 71.7 86.5 97.1 95.2 Export intensity 39.0 28.3 47.0 56.9 66.6 64.6 Number of firms 4,130 515 428 570 103 84 Spain 1990 Participation rate 49.2 17.6 35.3 65.6 83.7 85.6 Export intensity 21.6 17.9 19.7 24.5 22.4 20.1 Number of firms 1,952 556 487 413 295 201 1999 Participation rate 63.8 32.1 50.8 80.2 95.6 96.8 Export intensity 29.3 19.4 19.6 32.6 36.0 36.0
Number of firms 1,564 399 415 388 204 158
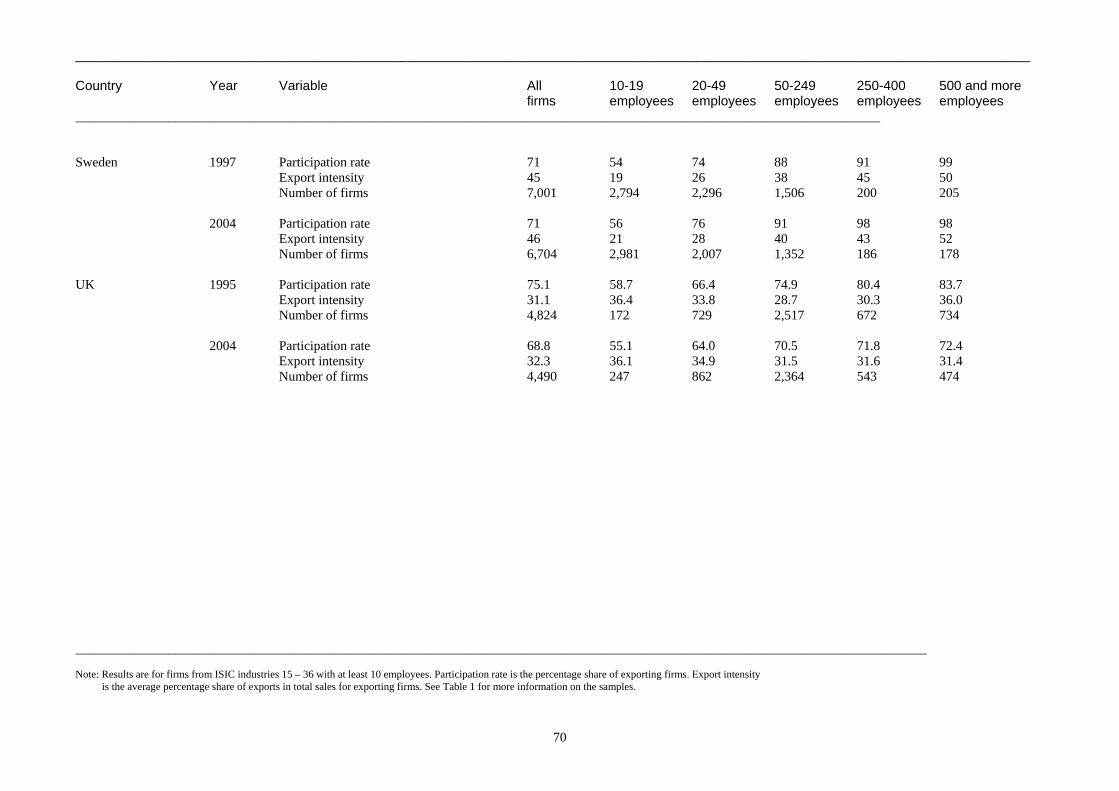
_________________________________________________________________________________________________________________________________ Country Year Variable All 10-19 20-49 50-249 250-400 500 and more firms employees employees employees employees employees _________________________________________________________________________________________________________________________
70
Sweden 1997 Participation rate 71 54 74 88 91 99 Export intensity 45 19 26 38 45 50 Number of firms 7,001 2,794 2,296 1,506 200 205 2004 Participation rate 71 56 76 91 98 98 Export intensity 46 21 28 40 43 52 Number of firms 6,704 2,981 2,007 1,352 186 178 UK 1995 Participation rate 75.1 58.7 66.4 74.9 80.4 83.7 Export intensity 31.1 36.4 33.8 28.7 30.3 36.0
Number of firms 4,824 172 729 2,517 672 734 2004 Participation rate 68.8 55.1 64.0 70.5 71.8 72.4 Export intensity 32.3 36.1 34.9 31.5 31.6 31.4 Number of firms 4,490 247 862 2,364 543 474 ________________________________________________________________________________________________________________________________ Note: Results are for firms from ISIC industries 15 – 36 with at least 10 employees. Participation rate is the percentage share of exporting firms. Export intensity is the average percentage share of exports in total sales for exporting firms. See Table 1 for more information on the samples.
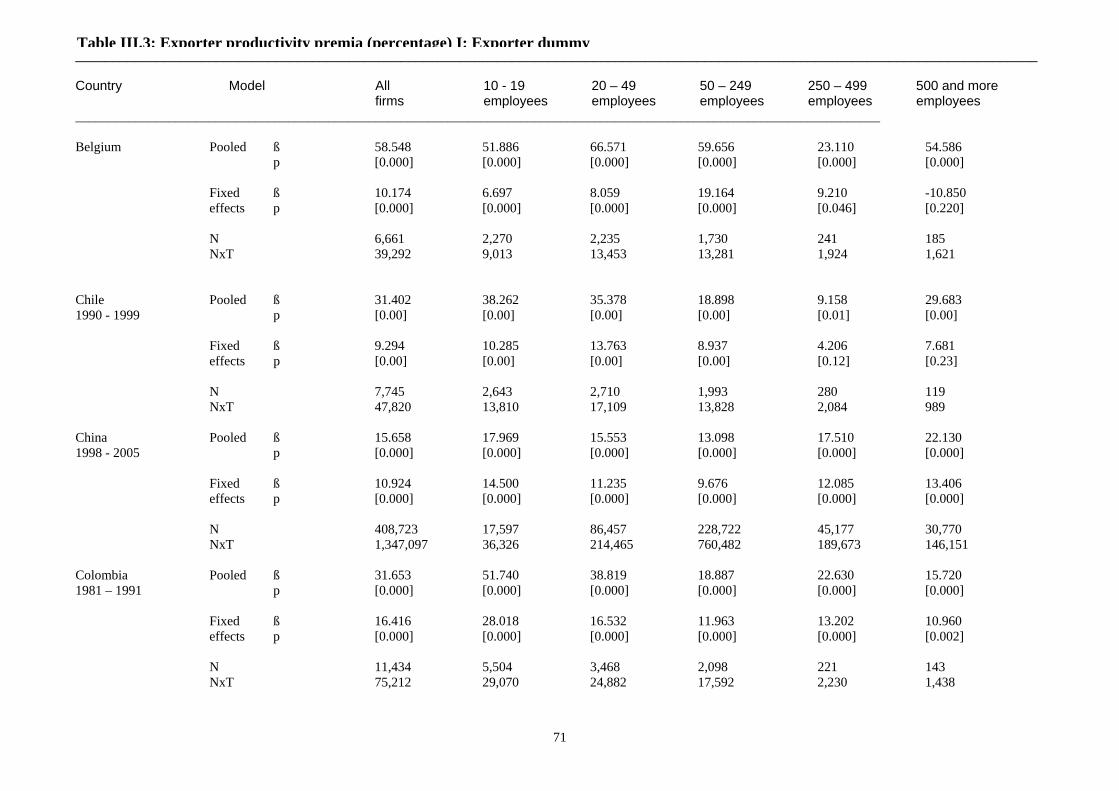
__________________________________________________________________________________________________________________________________ Country Model All 10 - 19 20 – 49 50 – 249 250 – 499 500 and more firms employees employees employees employees employees _________________________________________________________________________________________________________________________
71
Belgium Pooled ß 58.548 51.886 66.571 59.656 23.110 54.586
p [0.000] [0.000] [0.000] [0.000] [0.000] [0.000] Fixed ß 10.174 6.697 8.059 19.164 9.210 -10.850
effects p [0.000] [0.000] [0.000] [0.000] [0.046] [0.220] N 6,661 2,270 2,235 1,730 241 185 NxT 39,292 9,013 13,453 13,281 1,924 1,621 Chile Pooled ß 31.402 38.262 35.378 18.898 9.158 29.683 1990 - 1999 p [0.00] [0.00] [0.00] [0.00] [0.01] [0.00] Fixed ß 9.294 10.285 13.763 8.937 4.206 7.681 effects p [0.00] [0.00] [0.00] [0.00] [0.12] [0.23] N 7,745 2,643 2,710 1,993 280 119 NxT 47,820 13,810 17,109 13,828 2,084 989 China Pooled ß 15.658 17.969 15.553 13.098 17.510 22.130 1998 - 2005 p [0.000] [0.000] [0.000] [0.000] [0.000] [0.000] Fixed ß 10.924 14.500 11.235 9.676 12.085 13.406 effects p [0.000] [0.000] [0.000] [0.000] [0.000] [0.000] N 408,723 17,597 86,457 228,722 45,177 30,770
NxT 1,347,097 36,326 214,465 760,482 189,673 146,151 Colombia Pooled ß 31.653 51.740 38.819 18.887 22.630 15.720 1981 – 1991 p [0.000] [0.000] [0.000] [0.000] [0.000] [0.000]
Fixed ß 16.416 28.018 16.532 11.963 13.202 10.960 effects p [0.000] [0.000] [0.000] [0.000] [0.000] [0.002] N 11,434 5,504 3,468 2,098 221 143 NxT 75,212 29,070 24,882 17,592 2,230 1,438
Table III.3: Exporter productivity premia (percentage) I: Exporter dummy
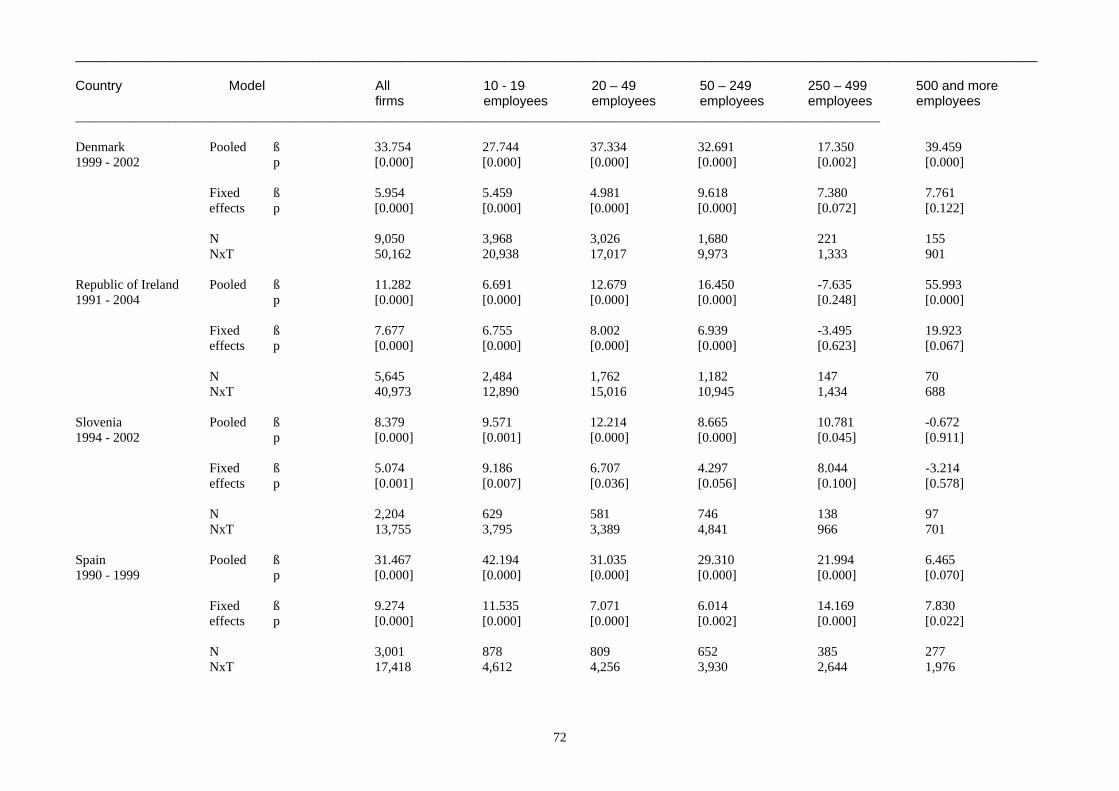
__________________________________________________________________________________________________________________________________ Country Model All 10 - 19 20 – 49 50 – 249 250 – 499 500 and more firms employees employees employees employees employees _________________________________________________________________________________________________________________________
72
Denmark Pooled ß 33.754 27.744 37.334 32.691 17.350 39.459 1999 - 2002 p [0.000] [0.000] [0.000] [0.000] [0.002] [0.000] Fixed ß 5.954 5.459 4.981 9.618 7.380 7.761 effects p [0.000] [0.000] [0.000] [0.000] [0.072] [0.122] N 9,050 3,968 3,026 1,680 221 155 NxT 50,162 20,938 17,017 9,973 1,333 901 Republic of Ireland Pooled ß 11.282 6.691 12.679 16.450 -7.635 55.993 1991 - 2004 p [0.000] [0.000] [0.000] [0.000] [0.248] [0.000] Fixed ß 7.677 6.755 8.002 6.939 -3.495 19.923 effects p [0.000] [0.000] [0.000] [0.000] [0.623] [0.067] N 5,645 2,484 1,762 1,182 147 70 NxT 40,973 12,890 15,016 10,945 1,434 688 Slovenia Pooled ß 8.379 9.571 12.214 8.665 10.781 -0.672 1994 - 2002 p [0.000] [0.001] [0.000] [0.000] [0.045] [0.911] Fixed ß 5.074 9.186 6.707 4.297 8.044 -3.214 effects p [0.001] [0.007] [0.036] [0.056] [0.100] [0.578] N 2,204 629 581 746 138 97 NxT 13,755 3,795 3,389 4,841 966 701 Spain Pooled ß 31.467 42.194 31.035 29.310 21.994 6.465 1990 - 1999 p [0.000] [0.000] [0.000] [0.000] [0.000] [0.070] Fixed ß 9.274 11.535 7.071 6.014 14.169 7.830 effects p [0.000] [0.000] [0.000] [0.002] [0.000] [0.022] N 3,001 878 809 652 385 277 NxT 17,418 4,612 4,256 3,930 2,644 1,976
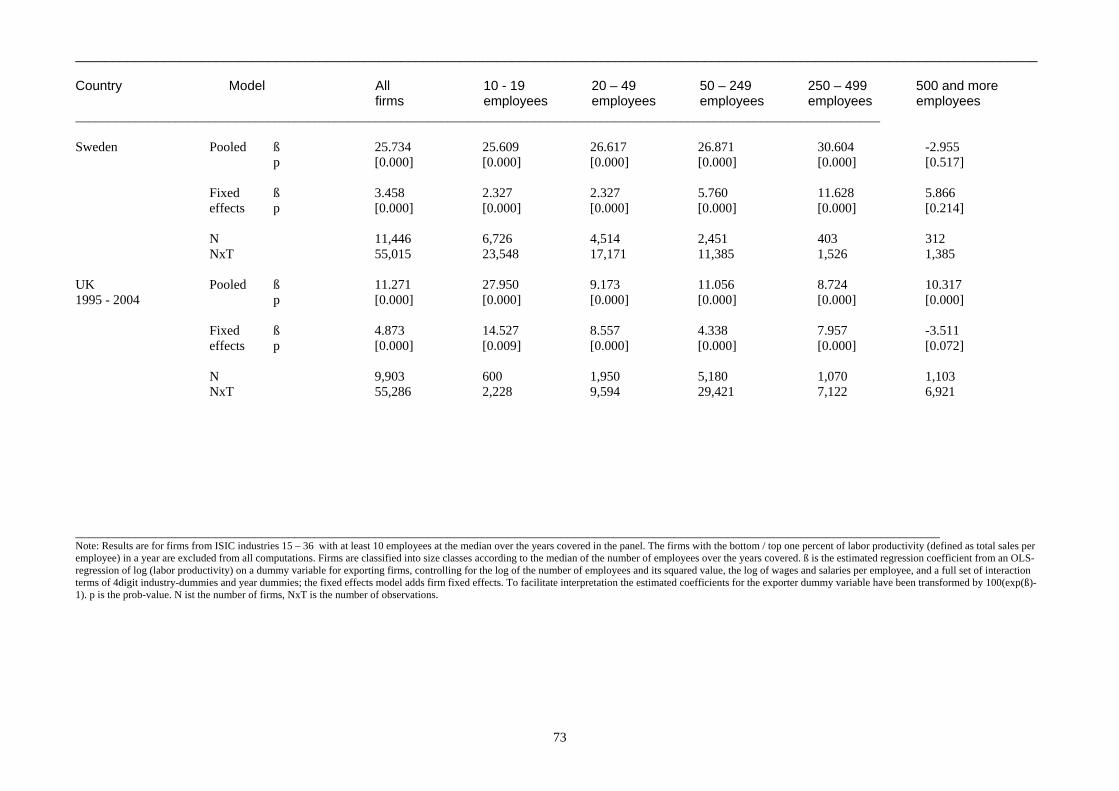
__________________________________________________________________________________________________________________________________ Country Model All 10 - 19 20 – 49 50 – 249 250 – 499 500 and more firms employees employees employees employees employees _________________________________________________________________________________________________________________________
73
Sweden Pooled ß 25.734 25.609 26.617 26.871 30.604 -2.955 p [0.000] [0.000] [0.000] [0.000] [0.000] [0.517] Fixed ß 3.458 2.327 2.327 5.760 11.628 5.866 effects p [0.000] [0.000] [0.000] [0.000] [0.000] [0.214] N 11,446 6,726 4,514 2,451 403 312 NxT 55,015 23,548 17,171 11,385 1,526 1,385 UK Pooled ß 11.271 27.950 9.173 11.056 8.724 10.317 1995 - 2004 p [0.000] [0.000] [0.000] [0.000] [0.000] [0.000] Fixed ß 4.873 14.527 8.557 4.338 7.957 -3.511 effects p [0.000] [0.009] [0.000] [0.000] [0.000] [0.072] N 9,903 600 1,950 5,180 1,070 1,103 NxT 55,286 2,228 9,594 29,421 7,122 6,921 __________________________________________________________________________________________________________________________________ Note: Results are for firms from ISIC industries 15 – 36 with at least 10 employees at the median over the years covered in the panel. The firms with the bottom / top one percent of labor productivity (defined as total sales per employee) in a year are excluded from all computations. Firms are classified into size classes according to the median of the number of employees over the years covered. ß is the estimated regression coefficient from an OLS-regression of log (labor productivity) on a dummy variable for exporting firms, controlling for the log of the number of employees and its squared value, the log of wages and salaries per employee, and a full set of interaction terms of 4digit industry-dummies and year dummies; the fixed effects model adds firm fixed effects. To facilitate interpretation the estimated coefficients for the exporter dummy variable have been transformed by 100(exp(ß)-1). p is the prob-value. N ist the number of firms, NxT is the number of observations.
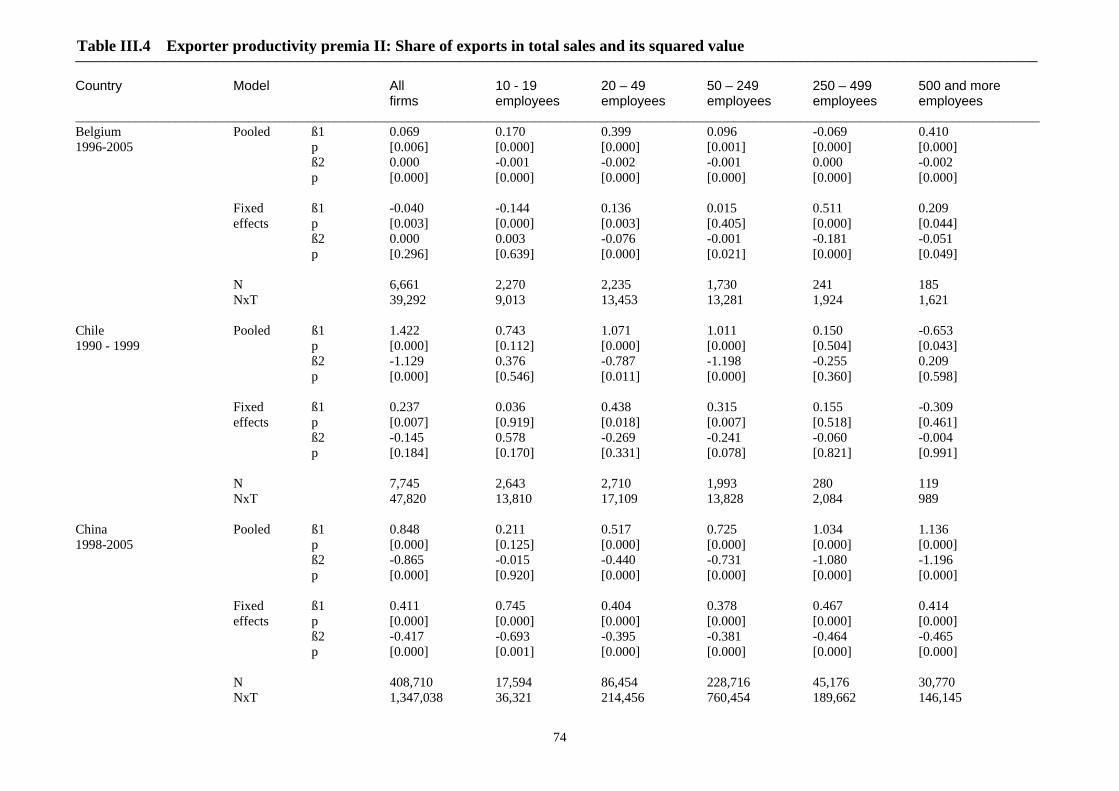
__________________________________________________________________________________________________________________________________ Country Model All 10 - 19 20 – 49 50 – 249 250 – 499 500 and more firms employees employees employees employees employees _________________________________________________________________________________________________________________________________________________
74
Belgium Pooled ß1 0.069 0.170 0.399 0.096 -0.069 0.410 1996-2005 p [0.006] [0.000] [0.000] [0.001] [0.000] [0.000] ß2 0.000 -0.001 -0.002 -0.001 0.000 -0.002 p [0.000] [0.000] [0.000] [0.000] [0.000] [0.000] Fixed ß1 -0.040 -0.144 0.136 0.015 0.511 0.209 effects p [0.003] [0.000] [0.003] [0.405] [0.000] [0.044] ß2 0.000 0.003 -0.076 -0.001 -0.181 -0.051 p [0.296] [0.639] [0.000] [0.021] [0.000] [0.049] N 6,661 2,270 2,235 1,730 241 185 NxT 39,292 9,013 13,453 13,281 1,924 1,621 Chile Pooled ß1 1.422 0.743 1.071 1.011 0.150 -0.653 1990 - 1999 p [0.000] [0.112] [0.000] [0.000] [0.504] [0.043] ß2 -1.129 0.376 -0.787 -1.198 -0.255 0.209 p [0.000] [0.546] [0.011] [0.000] [0.360] [0.598] Fixed ß1 0.237 0.036 0.438 0.315 0.155 -0.309 effects p [0.007] [0.919] [0.018] [0.007] [0.518] [0.461] ß2 -0.145 0.578 -0.269 -0.241 -0.060 -0.004 p [0.184] [0.170] [0.331] [0.078] [0.821] [0.991] N 7,745 2,643 2,710 1,993 280 119 NxT 47,820 13,810 17,109 13,828 2,084 989
China Pooled ß1 0.848 0.211 0.517 0.725 1.034 1.136 1998-2005 p [0.000] [0.125] [0.000] [0.000] [0.000] [0.000] ß2 -0.865 -0.015 -0.440 -0.731 -1.080 -1.196 p [0.000] [0.920] [0.000] [0.000] [0.000] [0.000] Fixed ß1 0.411 0.745 0.404 0.378 0.467 0.414 effects p [0.000] [0.000] [0.000] [0.000] [0.000] [0.000] ß2 -0.417 -0.693 -0.395 -0.381 -0.464 -0.465 p [0.000] [0.001] [0.000] [0.000] [0.000] [0.000] N 408,710 17,594 86,454 228,716 45,176 30,770 NxT 1,347,038 36,321 214,456 760,454 189,662 146,145
Table III.4 Exporter productivity premia II: Share of exports in total sales and its squared value
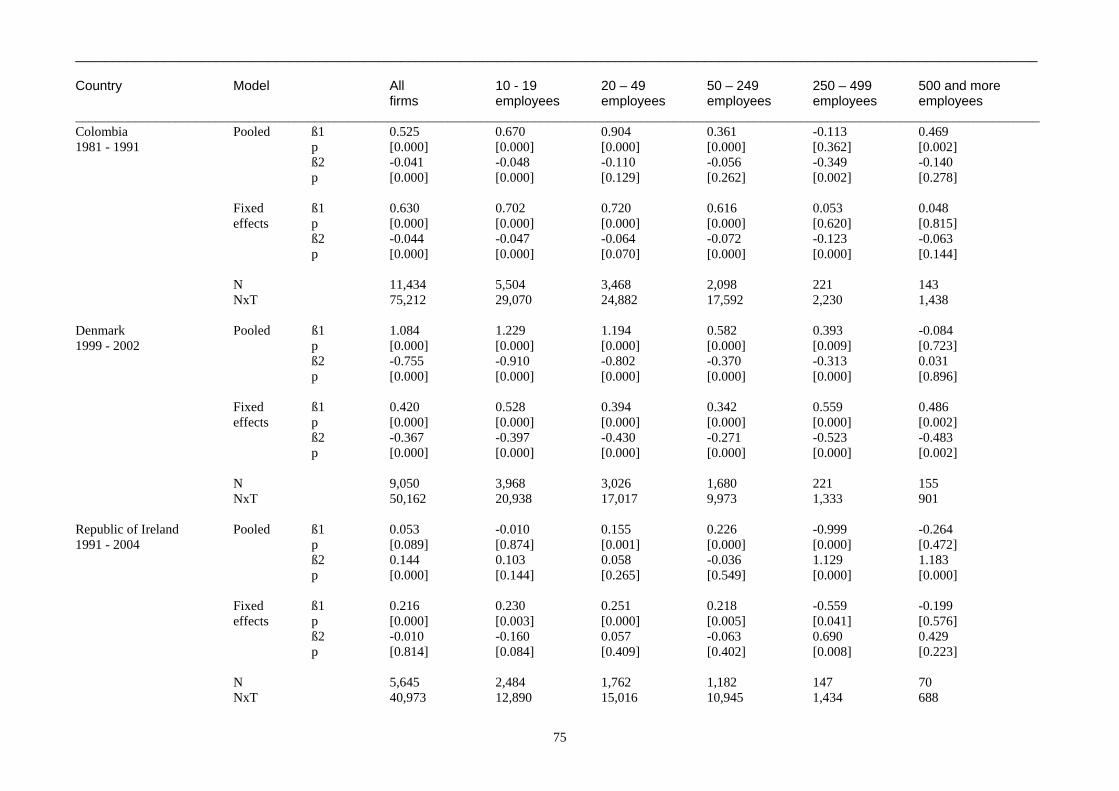
__________________________________________________________________________________________________________________________________ Country Model All 10 - 19 20 – 49 50 – 249 250 – 499 500 and more firms employees employees employees employees employees _________________________________________________________________________________________________________________________________________________
75
Colombia Pooled ß1 0.525 0.670 0.904 0.361 -0.113 0.469 1981 - 1991 p [0.000] [0.000] [0.000] [0.000] [0.362] [0.002] ß2 -0.041 -0.048 -0.110 -0.056 -0.349 -0.140 p [0.000] [0.000] [0.129] [0.262] [0.002] [0.278] Fixed ß1 0.630 0.702 0.720 0.616 0.053 0.048 effects p [0.000] [0.000] [0.000] [0.000] [0.620] [0.815] ß2 -0.044 -0.047 -0.064 -0.072 -0.123 -0.063 p [0.000] [0.000] [0.070] [0.000] [0.000] [0.144] N 11,434 5,504 3,468 2,098 221 143 NxT 75,212 29,070 24,882 17,592 2,230 1,438 Denmark Pooled ß1 1.084 1.229 1.194 0.582 0.393 -0.084 1999 - 2002 p [0.000] [0.000] [0.000] [0.000] [0.009] [0.723] ß2 -0.755 -0.910 -0.802 -0.370 -0.313 0.031 p [0.000] [0.000] [0.000] [0.000] [0.000] [0.896] Fixed ß1 0.420 0.528 0.394 0.342 0.559 0.486 effects p [0.000] [0.000] [0.000] [0.000] [0.000] [0.002] ß2 -0.367 -0.397 -0.430 -0.271 -0.523 -0.483 p [0.000] [0.000] [0.000] [0.000] [0.000] [0.002] N 9,050 3,968 3,026 1,680 221 155 NxT 50,162 20,938 17,017 9,973 1,333 901 Republic of Ireland Pooled ß1 0.053 -0.010 0.155 0.226 -0.999 -0.264 1991 - 2004 p [0.089] [0.874] [0.001] [0.000] [0.000] [0.472] ß2 0.144 0.103 0.058 -0.036 1.129 1.183 p [0.000] [0.144] [0.265] [0.549] [0.000] [0.000] Fixed ß1 0.216 0.230 0.251 0.218 -0.559 -0.199 effects p [0.000] [0.003] [0.000] [0.005] [0.041] [0.576] ß2 -0.010 -0.160 0.057 -0.063 0.690 0.429 p [0.814] [0.084] [0.409] [0.402] [0.008] [0.223] N 5,645 2,484 1,762 1,182 147 70 NxT 40,973 12,890 15,016 10,945 1,434 688
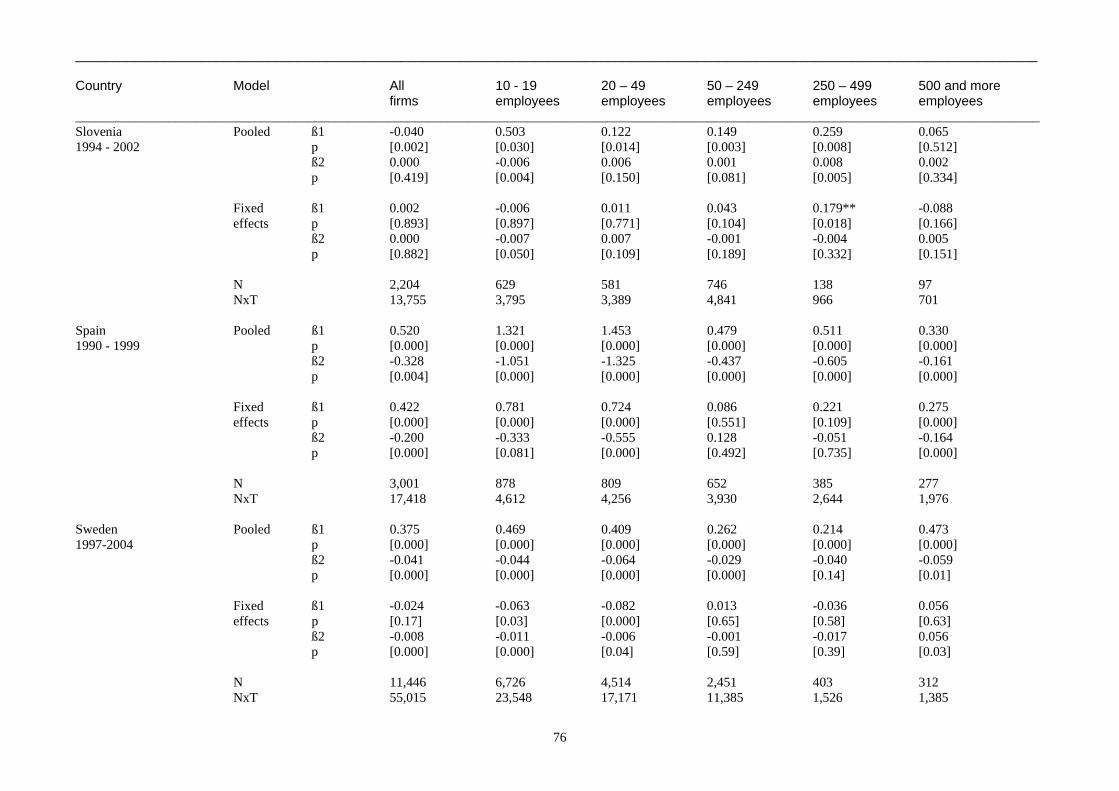
__________________________________________________________________________________________________________________________________ Country Model All 10 - 19 20 – 49 50 – 249 250 – 499 500 and more firms employees employees employees employees employees _________________________________________________________________________________________________________________________________________________
76
Slovenia Pooled ß1 -0.040 0.503 0.122 0.149 0.259 0.065 1994 - 2002 p [0.002] [0.030] [0.014] [0.003] [0.008] [0.512] ß2 0.000 -0.006 0.006 0.001 0.008 0.002 p [0.419] [0.004] [0.150] [0.081] [0.005] [0.334] Fixed ß1 0.002 -0.006 0.011 0.043 0.179** -0.088 effects p [0.893] [0.897] [0.771] [0.104] [0.018] [0.166] ß2 0.000 -0.007 0.007 -0.001 -0.004 0.005 p [0.882] [0.050] [0.109] [0.189] [0.332] [0.151] N 2,204 629 581 746 138 97 NxT 13,755 3,795 3,389 4,841 966 701 Spain Pooled ß1 0.520 1.321 1.453 0.479 0.511 0.330 1990 - 1999 p [0.000] [0.000] [0.000] [0.000] [0.000] [0.000] ß2 -0.328 -1.051 -1.325 -0.437 -0.605 -0.161 p [0.004] [0.000] [0.000] [0.000] [0.000] [0.000] Fixed ß1 0.422 0.781 0.724 0.086 0.221 0.275 effects p [0.000] [0.000] [0.000] [0.551] [0.109] [0.000] ß2 -0.200 -0.333 -0.555 0.128 -0.051 -0.164 p [0.000] [0.081] [0.000] [0.492] [0.735] [0.000] N 3,001 878 809 652 385 277 NxT 17,418 4,612 4,256 3,930 2,644 1,976 Sweden Pooled ß1 0.375 0.469 0.409 0.262 0.214 0.473 1997-2004 p [0.000] [0.000] [0.000] [0.000] [0.000] [0.000] ß2 -0.041 -0.044 -0.064 -0.029 -0.040 -0.059 p [0.000] [0.000] [0.000] [0.000] [0.14] [0.01] Fixed ß1 -0.024 -0.063 -0.082 0.013 -0.036 0.056 effects p [0.17] [0.03] [0.000] [0.65] [0.58] [0.63] ß2 -0.008 -0.011 -0.006 -0.001 -0.017 0.056 p [0.000] [0.000] [0.04] [0.59] [0.39] [0.03] N 11,446 6,726 4,514 2,451 403 312 NxT 55,015 23,548 17,171 11,385 1,526 1,385
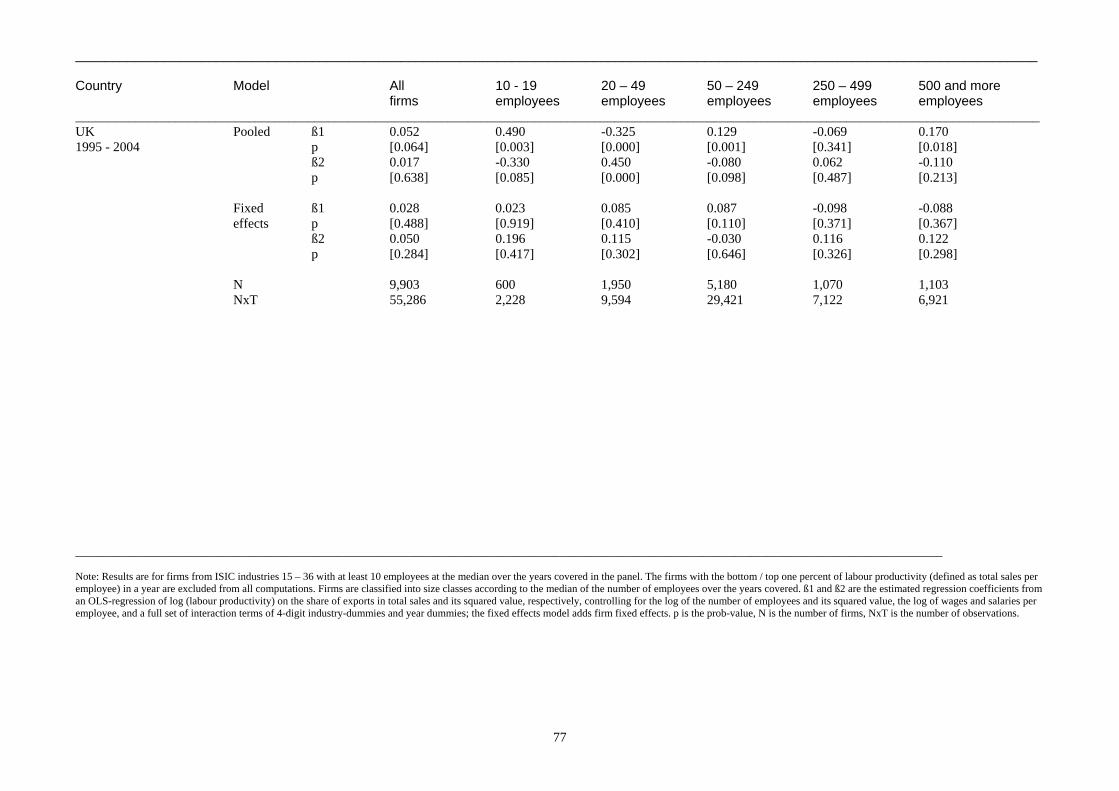
__________________________________________________________________________________________________________________________________ Country Model All 10 - 19 20 – 49 50 – 249 250 – 499 500 and more firms employees employees employees employees employees _________________________________________________________________________________________________________________________________________________
77
UK Pooled ß1 0.052 0.490 -0.325 0.129 -0.069 0.170 1995 - 2004 p [0.064] [0.003] [0.000] [0.001] [0.341] [0.018] ß2 0.017 -0.330 0.450 -0.080 0.062 -0.110 p [0.638] [0.085] [0.000] [0.098] [0.487] [0.213] Fixed ß1 0.028 0.023 0.085 0.087 -0.098 -0.088 effects p [0.488] [0.919] [0.410] [0.110] [0.371] [0.367] ß2 0.050 0.196 0.115 -0.030 0.116 0.122 p [0.284] [0.417] [0.302] [0.646] [0.326] [0.298] N 9,903 600 1,950 5,180 1,070 1,103 NxT 55,286 2,228 9,594 29,421 7,122 6,921 ___________________________________________________________________________________________________________________________________________________________________ Note: Results are for firms from ISIC industries 15 – 36 with at least 10 employees at the median over the years covered in the panel. The firms with the bottom / top one percent of labour productivity (defined as total sales per employee) in a year are excluded from all computations. Firms are classified into size classes according to the median of the number of employees over the years covered. ß1 and ß2 are the estimated regression coefficients from an OLS-regression of log (labour productivity) on the share of exports in total sales and its squared value, respectively, controlling for the log of the number of employees and its squared value, the log of wages and salaries per employee, and a full set of interaction terms of 4-digit industry-dummies and year dummies; the fixed effects model adds firm fixed effects. p is the prob-value, N is the number of firms, NxT is the number of observations.
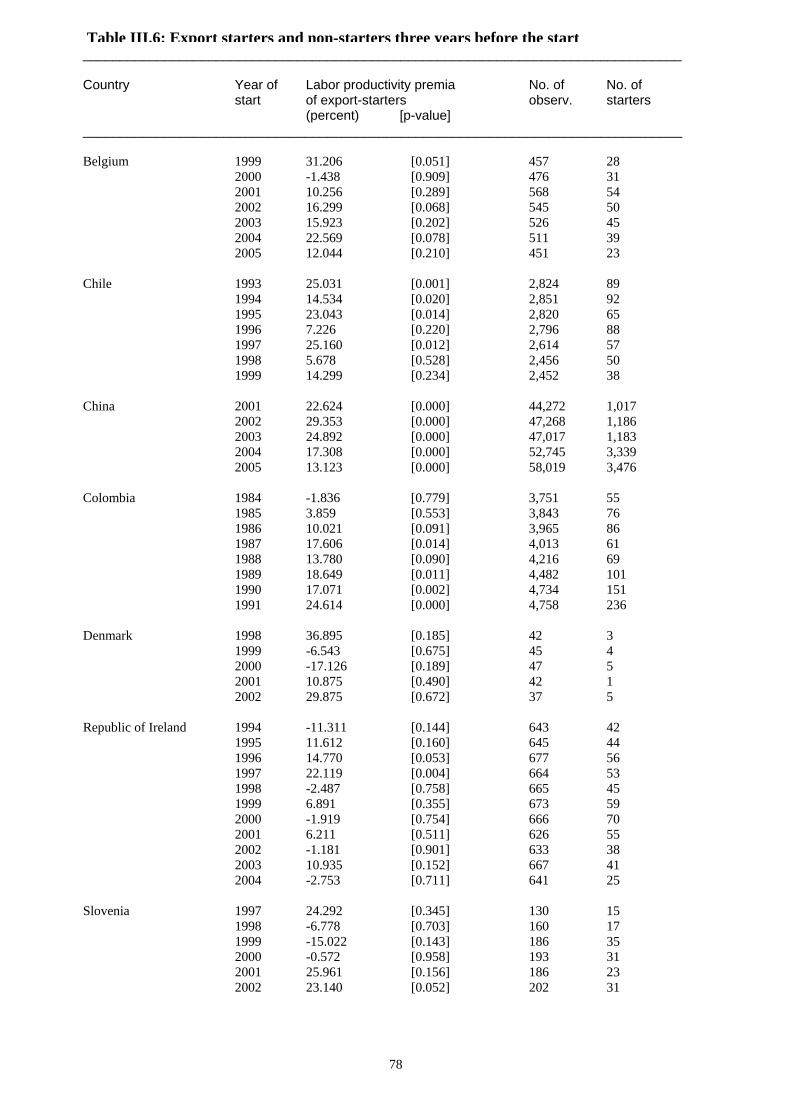
_________________________________________________________________________________ Country Year of Labor productivity premia No. of No. of start of export-starters observ. starters (percent) [p-value] _________________________________________________________________________________
78
Belgium 1999 31.206 [0.051] 457 28 2000 -1.438 [0.909] 476 31 2001 10.256 [0.289] 568 54 2002 16.299 [0.068] 545 50 2003 15.923 [0.202] 526 45 2004 22.569 [0.078] 511 39 2005 12.044 [0.210] 451 23 Chile 1993 25.031 [0.001] 2,824 89 1994 14.534 [0.020] 2,851 92 1995 23.043 [0.014] 2,820 65 1996 7.226 [0.220] 2,796 88 1997 25.160 [0.012] 2,614 57 1998 5.678 [0.528] 2,456 50 1999 14.299 [0.234] 2,452 38 China 2001 22.624 [0.000] 44,272 1,017 2002 29.353 [0.000] 47,268 1,186 2003 24.892 [0.000] 47,017 1,183 2004 17.308 [0.000] 52,745 3,339 2005 13.123 [0.000] 58,019 3,476 Colombia 1984 -1.836 [0.779] 3,751 55 1985 3.859 [0.553] 3,843 76 1986 10.021 [0.091] 3,965 86 1987 17.606 [0.014] 4,013 61 1988 13.780 [0.090] 4,216 69 1989 18.649 [0.011] 4,482 101 1990 17.071 [0.002] 4,734 151 1991 24.614 [0.000] 4,758 236 Denmark 1998 36.895 [0.185] 42 3 1999 -6.543 [0.675] 45 4 2000 -17.126 [0.189] 47 5 2001 10.875 [0.490] 42 1 2002 29.875 [0.672] 37 5 Republic of Ireland 1994 -11.311 [0.144] 643 42 1995 11.612 [0.160] 645 44 1996 14.770 [0.053] 677 56 1997 22.119 [0.004] 664 53 1998 -2.487 [0.758] 665 45 1999 6.891 [0.355] 673 59 2000 -1.919 [0.754] 666 70 2001 6.211 [0.511] 626 55 2002 -1.181 [0.901] 633 38 2003 10.935 [0.152] 667 41 2004 -2.753 [0.711] 641 25 Slovenia 1997 24.292 [0.345] 130 15 1998 -6.778 [0.703] 160 17 1999 -15.022 [0.143] 186 35 2000 -0.572 [0.958] 193 31 2001 25.961 [0.156] 186 23 2002 23.140 [0.052] 202 31
Table III.6: Export starters and non-starters three years before the start
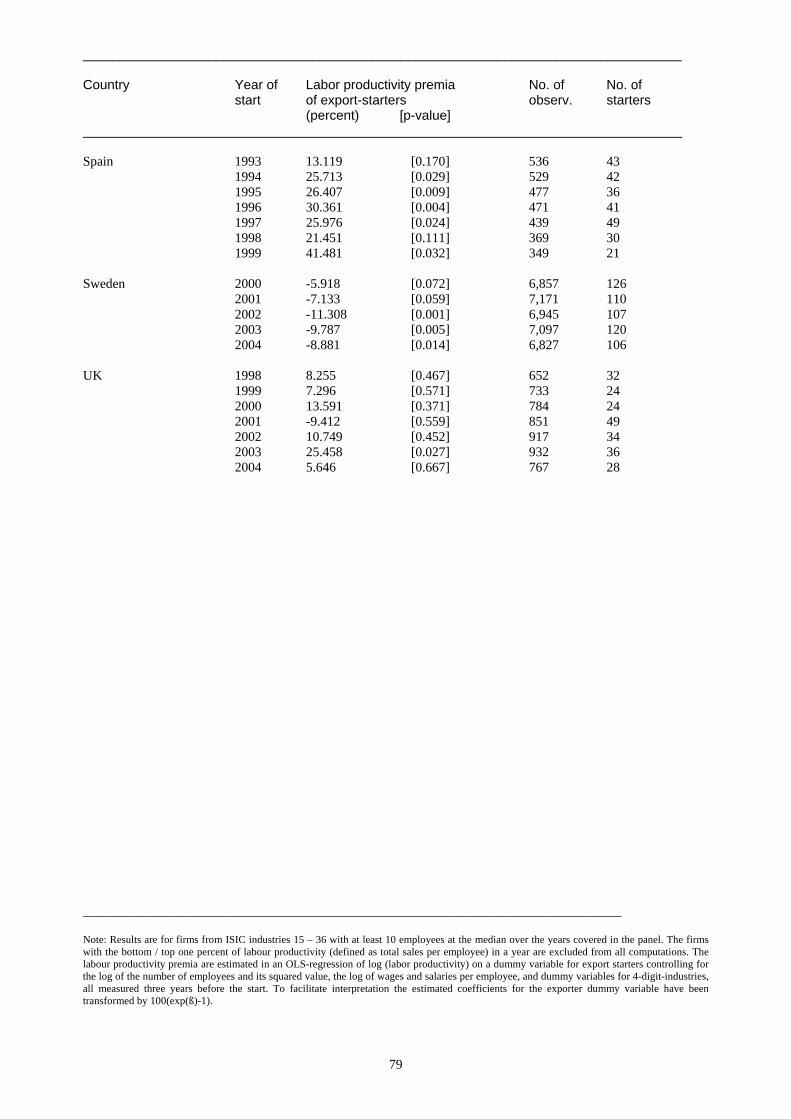
_________________________________________________________________________________ Country Year of Labor productivity premia No. of No. of start of export-starters observ. starters (percent) [p-value] _________________________________________________________________________________
79
Spain 1993 13.119 [0.170] 536 43 1994 25.713 [0.029] 529 42 1995 26.407 [0.009] 477 36 1996 30.361 [0.004] 471 41 1997 25.976 [0.024] 439 49 1998 21.451 [0.111] 369 30 1999 41.481 [0.032] 349 21 Sweden 2000 -5.918 [0.072] 6,857 126 2001 -7.133 [0.059] 7,171 110 2002 -11.308 [0.001] 6,945 107 2003 -9.787 [0.005] 7,097 120 2004 -8.881 [0.014] 6,827 106 UK 1998 8.255 [0.467] 652 32 1999 7.296 [0.571] 733 24 2000 13.591 [0.371] 784 24 2001 -9.412 [0.559] 851 49 2002 10.749 [0.452] 917 34 2003 25.458 [0.027] 932 36 2004 5.646 [0.667] 767 28 _________________________________________________________________________________ Note: Results are for firms from ISIC industries 15 – 36 with at least 10 employees at the median over the years covered in the panel. The firms with the bottom / top one percent of labour productivity (defined as total sales per employee) in a year are excluded from all computations. The labour productivity premia are estimated in an OLS-regression of log (labor productivity) on a dummy variable for export starters controlling for the log of the number of employees and its squared value, the log of wages and salaries per employee, and dummy variables for 4-digit-industries, all measured three years before the start. To facilitate interpretation the estimated coefficients for the exporter dummy variable have been transformed by 100(exp(ß)-1).
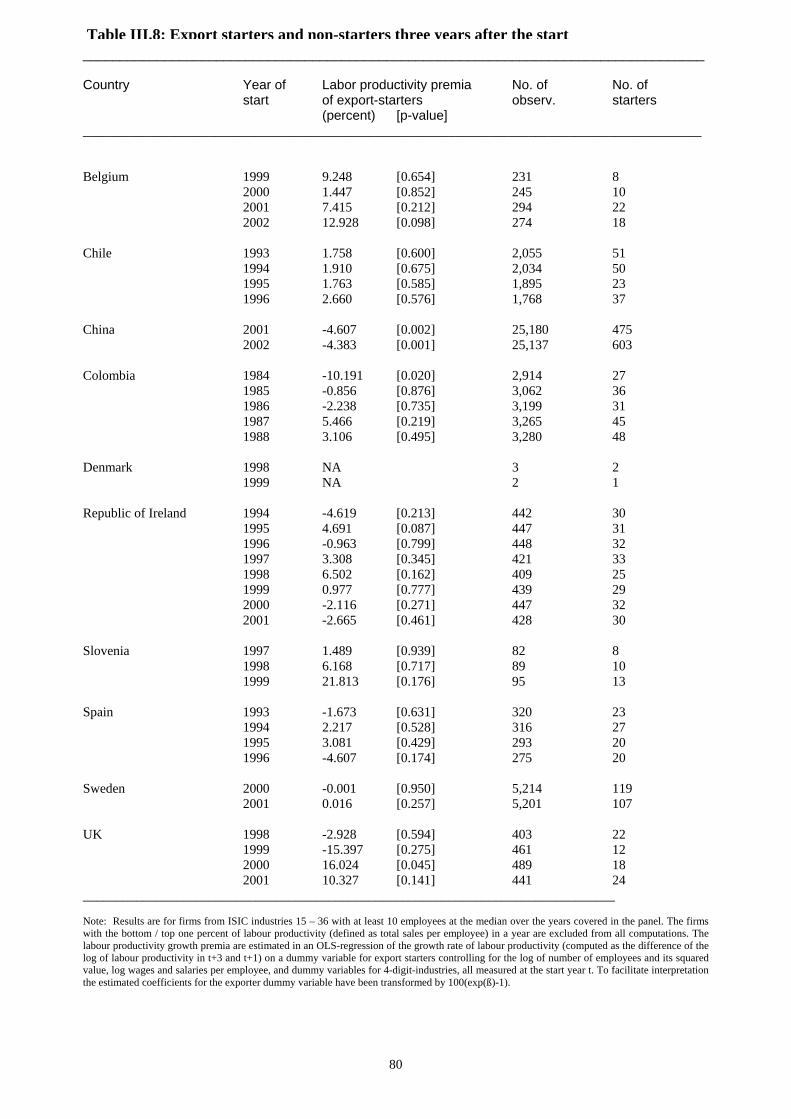
____________________________________________________________________________________ Country Year of Labor productivity premia No. of No. of start of export-starters observ. starters (percent) [p-value] _____________________________________________________________________________________________
80
Belgium 1999 9.248 [0.654] 231 8 2000 1.447 [0.852] 245 10 2001 7.415 [0.212] 294 22 2002 12.928 [0.098] 274 18 Chile 1993 1.758 [0.600] 2,055 51 1994 1.910 [0.675] 2,034 50 1995 1.763 [0.585] 1,895 23 1996 2.660 [0.576] 1,768 37 China 2001 -4.607 [0.002] 25,180 475 2002 -4.383 [0.001] 25,137 603 Colombia 1984 -10.191 [0.020] 2,914 27 1985 -0.856 [0.876] 3,062 36 1986 -2.238 [0.735] 3,199 31 1987 5.466 [0.219] 3,265 45 1988 3.106 [0.495] 3,280 48 Denmark 1998 NA 3 2 1999 NA 2 1 Republic of Ireland 1994 -4.619 [0.213] 442 30 1995 4.691 [0.087] 447 31 1996 -0.963 [0.799] 448 32 1997 3.308 [0.345] 421 33 1998 6.502 [0.162] 409 25 1999 0.977 [0.777] 439 29 2000 -2.116 [0.271] 447 32 2001 -2.665 [0.461] 428 30 Slovenia 1997 1.489 [0.939] 82 8 1998 6.168 [0.717] 89 10 1999 21.813 [0.176] 95 13 Spain 1993 -1.673 [0.631] 320 23 1994 2.217 [0.528] 316 27 1995 3.081 [0.429] 293 20 1996 -4.607 [0.174] 275 20 Sweden 2000 -0.001 [0.950] 5,214 119 2001 0.016 [0.257] 5,201 107 UK 1998 -2.928 [0.594] 403 22 1999 -15.397 [0.275] 461 12 2000 16.024 [0.045] 489 18 2001 10.327 [0.141] 441 24 ________________________________________________________________________________ Note: Results are for firms from ISIC industries 15 – 36 with at least 10 employees at the median over the years covered in the panel. The firms with the bottom / top one percent of labour productivity (defined as total sales per employee) in a year are excluded from all computations. The labour productivity growth premia are estimated in an OLS-regression of the growth rate of labour productivity (computed as the difference of the log of labour productivity in t+3 and t+1) on a dummy variable for export starters controlling for the log of number of employees and its squared value, log wages and salaries per employee, and dummy variables for 4-digit-industries, all measured at the start year t. To facilitate interpretation the estimated coefficients for the exporter dummy variable have been transformed by 100(exp(ß)-1).
Table III.8: Export starters and non-starters three years after the start


![geographyeducore.weebly.com · Web viewexception as it has productivity comparable to wetlands because of its rich diversity of primary producers] In the options, mangroves are transitional](https://static.fdocuments.in/doc/165x107/61284d865b5236747706c0fb/web-view-exception-as-it-has-productivity-comparable-to-wetlands-because-of-its.jpg)