ESTE Investor Presentation 3.11.16 - Earthstone Energy forward-looking statements include statements...
25
0 Investor Presentation March 2016
Transcript of ESTE Investor Presentation 3.11.16 - Earthstone Energy forward-looking statements include statements...

0
Investor Presentation
March 2016

1
Disclaimer
Forward-Looking Statements
This presentation contains forward-looking statements within the meaning of Section 27A of the Securities Act of 1933, as amended (the “Securities Act”),and Section 21E of the Securities Exchange Act of 1934, as amended. Statements that are not strictly historical statements constitute forward-lookingstatements and may often, but not always, be identified by the use of such words such as “expects,” “believes,” “intends,” “anticipates,” “plans,” “estimates,”“potential,” “possible,” or “probable” or statements that certain actions, events or results “may,” “will,” “should,” or “could” be taken, occur or be achieved.The forward-looking statements include statements about oil and gas pricing assumptions, future operations, estimates of reserve and production volumes,estimates of capital expenditures, expansion of production and reserves, future growth potential, possible acquisitions, and the ability to raise future capital.Forward-looking statements are based on expectations and assumptions and analyses made by Earthstone Energy, Inc. (“Earthstone”) in light ofexperience and perception of historical trends, current conditions and expected future developments, as well as other factors appropriate under thecircumstances. However, whether actual results and developments will conform with expectations is subject to a number of risks and uncertainties, includingadverse changes in oil and gas prices or protracted periods of low oil and gas prices; problems that may arise in the integration of the businesses involvedwith the transactions generally described on page 3; that the transactions may involve additional and unexpected costs; the risks of the oil and gas industry(for example, operational risks in exploring for, developing and producing crude oil and natural gas; risks and uncertainties involving geology of oil and gasdeposits); the uncertainty of reserve estimates; the uncertainty of estimates and projections relating to future production, costs and expenses; potentialdelays or changes in plans with respect to exploration or development projects or capital expenditures; health, safety and environmental risks and risksrelated to weather; inability of management to execute its plans to meet its goals; shortages of drilling equipment, oil field personnel and services;unavailability of gathering systems, pipelines and processing facilities; the possibility that government policies may change; and that foreign production ratesmay change. Earthstone’s annual report on Form 10-K for the year ended December 31, 2014 and other Securities and Exchange Commission (“SEC”)filings discuss some of the important risk factors identified that may affect Earthstone’s business, results of operations, and financial condition. Earthstoneundertakes no obligation to revise or update publicly any forward-looking statements except as required by law.

2
Investment Highlights
Eagle Ford and Bakken Concentration
• Oil-weighted reserves• Growth through drill bit and acquisitions• ~240 operated Eagle Ford locations• ~200 non-operated Bakken locations• Upside from down-spacing and other
formations
Strong, Well Capitalized Balance Sheet
• Significant cash balance• Common equity• Traditional reserve-based credit facility• $80mm borrowing base• No additional securities outstanding
Proven Management Team
• Operational excellence• Four prior successful public entities• Repeat investors• Market recognition

3
Strategic Combination on December 19, 2014
Earthstone closed two transformational transactions, creating a well-capitalized company with significant growth opportunities and substantial economic drilling inventory
• Oak Valley received 9.124 million shares in exchange for its oil and gas properties and cash
‐ Appointed Mr. Frank Lodzinski as President and CEO
‐ Transaction is Mr. Lodzinski’s fourth public strategic combination
• Flatonia received 2.957 million shares for additional working interests in Fayette and Gonzales Counties, Texas
‐ Increased leasehold interest in properties from 30% to 50%
‐ Current Eagle Ford position in Fayette, Gonzales, and Karnes Counties now totals 22,585 net acres
• Houston headquarters and Denver office to facilitate Rockies expansion
From 0 to 22.2 MMBoe in 2 years Doubled reserves in 2014 through drill bit and acquisitions
Public Shareholders
1.754mm shares (12.6%)
9.124mm shares(66.0%)
2.957mm shares (21.4%)
13.835mm sharesNYSE MKT: “ESTE”
Flatonia Energy, LLC
Note: 1 Flatonia Energy, LLC is wholly-owned by Parallel Resource Partners, LLC and a 50% joint owner in Earthstone’s Eagle Ford project in Fayette and Gonzales Counties

4
Oak Valley Resources, LLC owns 66.0% of Earthstone. Oak Valley’s members include:
Earthstone Management• Significant equity investors• CEO has over 40 years of experience • Executive officers average over 30 years of industry
experience• Senior executives have worked together in multiple
successful entities
EnCap Investments L.P.• Leading provider of private equity to the independent
E&P sector• 25-year history of providing capital • Repeat investors • Long relationship with Management
Vlasic Group• Partnered with Management for
26 consecutive years• Former investor and director of
GeoResources and predecessor entities
• Previously affiliated with Vlasic Foods prior to sale to Campbell Soup
Wells Fargo Energy Capital• Part of Wells Fargo Energy Group,
a $30bn capital provider to the North American energy industry
• Predecessor entities have previously invested with Management
Friends and Family• Many repeat investors • Long-term investment horizons• Petroleum engineers, geologists,
portfolio managers, endowments, family trusts, investment bankers, lawyers, and other accredited persons
• Source of incremental deal flow and advice

5
Management• Strong management and technical team with demonstrated ability and prior success• Equity investors—interests are clearly aligned with shareholders
Years of Experience
Years Working Together
Responsibility
Frank Lodzinski 43 25 President and CEO
Robert Anderson 29 11 Corporate Development and Reservoir Engineering
Steve Collins 27 18 Completions and Operations
Chris Cottrell 32 16 Land and Marketing
Tim Merrifield 36 14 Geological and Geophysical
Francis Mury 41 25 Drilling and Development
Ray Singleton 37 - Operations and A&D, Northern Region (Former President and CEO of ESTE)
Neil Cohen 12 3 Finance
Bret Wonson 14 5 Accounting
6
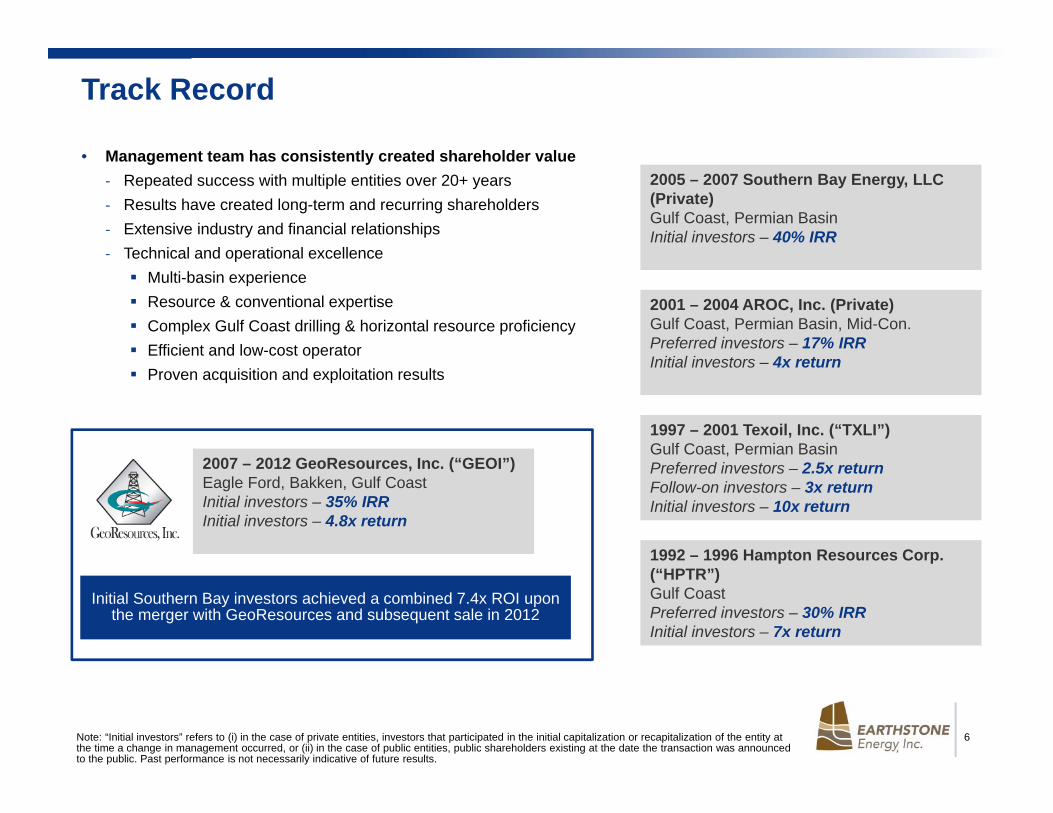
Track Record
2001 – 2004 AROC, Inc. (Private) Gulf Coast, Permian Basin, Mid-Con.Preferred investors – 17% IRRInitial investors – 4x return
2005 – 2007 Southern Bay Energy, LLC (Private)Gulf Coast, Permian BasinInitial investors – 40% IRR
1997 – 2001 Texoil, Inc. (“TXLI”)Gulf Coast, Permian BasinPreferred investors – 2.5x returnFollow-on investors – 3x returnInitial investors – 10x return
1992 – 1996 Hampton Resources Corp. (“HPTR”)Gulf CoastPreferred investors – 30% IRRInitial investors – 7x return
• Management team has consistently created shareholder value‐ Repeated success with multiple entities over 20+ years‐ Results have created long-term and recurring shareholders‐ Extensive industry and financial relationships ‐ Technical and operational excellence Multi-basin experience Resource & conventional expertise Complex Gulf Coast drilling & horizontal resource proficiency Efficient and low-cost operator Proven acquisition and exploitation results
2007 – 2012 GeoResources, Inc. (“GEOI”) Eagle Ford, Bakken, Gulf CoastInitial investors – 35% IRRInitial investors – 4.8x return
Initial Southern Bay investors achieved a combined 7.4x ROI upon the merger with GeoResources and subsequent sale in 2012
Note: “Initial investors” refers to (i) in the case of private entities, investors that participated in the initial capitalization or recapitalization of the entity at the time a change in management occurred, or (ii) in the case of public entities, public shareholders existing at the date the transaction was announced to the public. Past performance is not necessarily indicative of future results.

7
GeoResources – Performance Summary
Proved Reserve Growth (MMBoe)(1)Stock Performance (%)
Production Growth (Boepd)(1)EBITDA Growth ($mm)(1)
Merger with Southern Bay to Sale Announcement
(1) 2012 figures based on 2H 2012 actuals and 2H 2012 internal projections.
3.317.2
49.2 45.866.7
89.2
177.6
$0.0
$50.0
$100.0
$150.0
$200.0
2006 2007 2008 2009 2010 2011 2012
CAGR = 94%
7681,826
3,3884,589
5,091 5,270
9,130
0
2,500
5,000
7,500
10,000
2006 2007 2008 2009 2010 2011 2012
CAGR = 51%
$0.0
$10.0
$20.0
$30.0
$40.0
2007 2008 2009 2010 2011 2012
Initial Investors:IRR = 35%Return on Capital = 4.8x
2.4
15.7 14.6
20.724.0
29.2
35.9
0.0
10.0
20.0
30.0
40.0
2006 2007 2008 2009 2010 2011 2012
CAGR = 57%

8
Go-Forward Strategy
Utilize similar strategy to previous entities which delivered significant returns to shareholders
Corporate StrategyAsset Strategy
• Optimize Existing Properties‐ Implement operational improvements and efficiencies‐ Drive costs down in all aspects of drilling and
production‐ Fully define geological and engineering upside
• Enhance Production / Cash Flow‐ Acquire producing assets‐ Pursue tactical operated acquisitions in proximity to
existing properties/fields‐ Divest non-core properties
• Growth Through the Drill Bit‐ Acquire acreage at favorable terms‐ Continue to generate and de-risk high-impact drilling
opportunities‐ Execute multi-year development drilling program
• Deliver superior returns to shareholders• Maintain financial flexibility and a strong balance sheet to
facilitate additional acquisitions• Focus on 2 to 3 basins• Achieve low development, operating, and G&A cost
structure• Consistently improve operating margins• Generate significant cash flow and net income

9
M&A / A&D
• M&A / A&D Execution‐ Grow Eagle Ford position and complimentary assets‐ Acquire another core drilling area; focus areas include Bakken, Rockies, and Permian‐ Portfolio rationalization – consider divesting non‐core properties
Financial• Maintain reasonable equity / debt mix• Seek additional external equity and/or debt for acquisitions, as needed
Operational
• Eagle Ford ‐ Increase EURs via longer laterals‐ Enhance daily production, cost structure, free cash flow, and PV‐10‐ Expand into Karnes County and further down‐trend
• Upper Austin Chalk‐ Develop additional locations, hold large acreage positions
• Upside:‐ Capture and de‐risk Upper Eagle Ford formation‐ Test Buda and other formations
Organizational• With price improvement and company growth:
‐ Continue to hire top technical talent; build “bench strength” in G&G and engineering‐ Expand Denver presence
Near-Term Goals
10
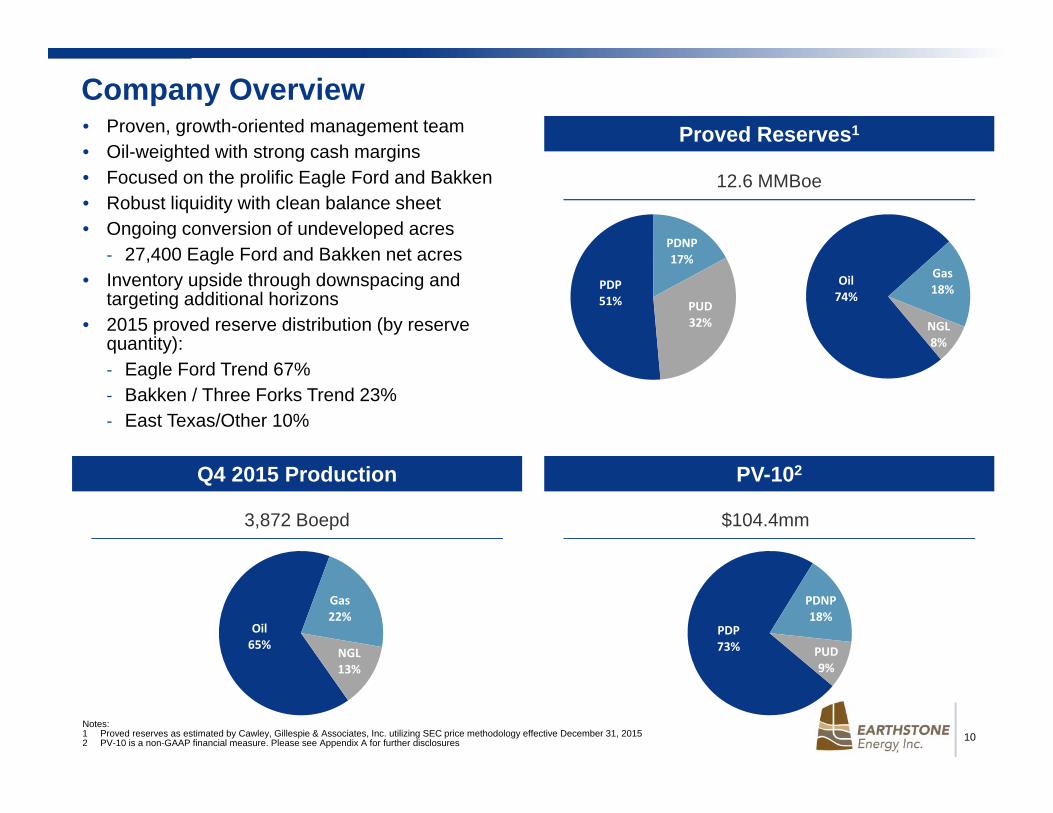
Oil74%
Gas18%
NGL8%
PDP51%
PDNP17%
PUD32%
Oil65%
Gas22%
NGL13%
Company Overview• Proven, growth-oriented management team• Oil-weighted with strong cash margins• Focused on the prolific Eagle Ford and Bakken• Robust liquidity with clean balance sheet• Ongoing conversion of undeveloped acres
‐ 27,400 Eagle Ford and Bakken net acres• Inventory upside through downspacing and
targeting additional horizons• 2015 proved reserve distribution (by reserve
quantity):‐ Eagle Ford Trend 67% ‐ Bakken / Three Forks Trend 23%‐ East Texas/Other 10%
Proved Reserves1
3,872 Boepd
PDP73%
PDNP18%
PUD9%
$104.4mm
Q4 2015 Production PV-102
12.6 MMBoe
Notes:1 Proved reserves as estimated by Cawley, Gillespie & Associates, Inc. utilizing SEC price methodology effective December 31, 20152 PV-10 is a non-GAAP financial measure. Please see Appendix A for further disclosures
11
Asset Overview

12
Southern Region
Conventional and unconventional assets
Texas
Oklahoma
South Texas
East TexasOther
Eagle Ford / Austin Chalk
Zapata County:770 net acres;7 PDP wells; Lobo formation; operated and non-operated
Webb County:2,500 net acres; waterflood;86% operated working interest23 PDP wells
La Salle County:2,900 net acres; 10% to 15% working interest64 PDP wells, ~180 drilling locations
Gonzales/Fayette/Karnes Counties:18,600 net acres; 33% to 50% working interest;operated; 76 PDP wells,~240 Eagle Ford and ~8
Austin Chalk drilling locations
Le Flore County:13,900 net acres; 33 PDP wells in Red Oak Field
East Texas:7,960 net acres prospective for Travis Peak, Pettet, Rodessa, James Lime, and Haynesville/Bossier formations72 PDP wells and an inventory of ~135 drilling locations
Milam County:11,600 net acres prospective for Austin Chalk, Buda, Eagle Ford, Georgetown, and Woodbine formations
Note: Estimated number of locations include proved undeveloped as well as management’s estimates of additional potential. Actual locations drilled and quantities that may be ultimately recovered from the Company’s interests could differ substantially from management’s estimates.
Grayson County:325 net acres prospective for horizontal Viola play2 PDP wells

13
Eagle Ford – Summary• Operated Fayette, Gonzales, and Karnes
Counties
‐ 38,000 gross / 18,600 net leasehold acres
‐ Working interests range from 33% to 50%
• 64 gross producing wells (62 operated / 2 non-op)
• January 2016 average gross production of ~5,100 Boepd (98% operated)
• Approximately 240 identified gross Eagle Ford drilling locations
• Majority of acreage covered by 173 square mile 3-D seismic shoot
‐ Avoid faulting for steering Eagle Ford wells
‐ Indicate natural fractures
‐ Delineate other prospective opportunities
• Other Potential: Upper Eagle Ford, Austin Chalk, Buda, Wilcox, and Edwards
• Non-operated La Salle County
‐ 25,400 gross / 2,900 net leasehold acres
‐ Working interests range from 10% to 15%

14
Frio
JacksonYegua-Cockfield
WechesQueen City
ReklawCarrizo Sand
Wilcox Sands
Midway Shale
Navarro / Taylor Shale
Pecan Gap / Anacacho Chalk Pecan Gap Shale
Upper Eagle Ford ShaleEagle Ford Carbonate
Lower Eagle Ford Shale
Taylor Sands
Formation
Buda LimestoneDel Rio Shale
Georgetown Limestone
Edwards Limestone
Glenrose Limestone
Travis Peak / Cotton Valley
Smackover
Louann Salt
UpperAsh Mkr
Vicksburg
Pre Louann Salt
Missing / ErodedSection
Stratigraphic ColumnS.W. Fayette & N.E. Gonzales Co.’s, Texas
Navarro Sands
UPPER AUSTIN CHALK TARGET
LOWER AUSTIN CHALK TARGET
EAGLE FORD TARGET
7750’ – 11000’
8250’ – 11600’
8300’ – 11650’Gidding
s Au
stin Cha
lk Field In
terval
Eagleville Field
Interval
Southe
rn
Bay Eagle
Ford
Interval
Eagle Ford and Austin Chalk Intervals Across the Acreage
15
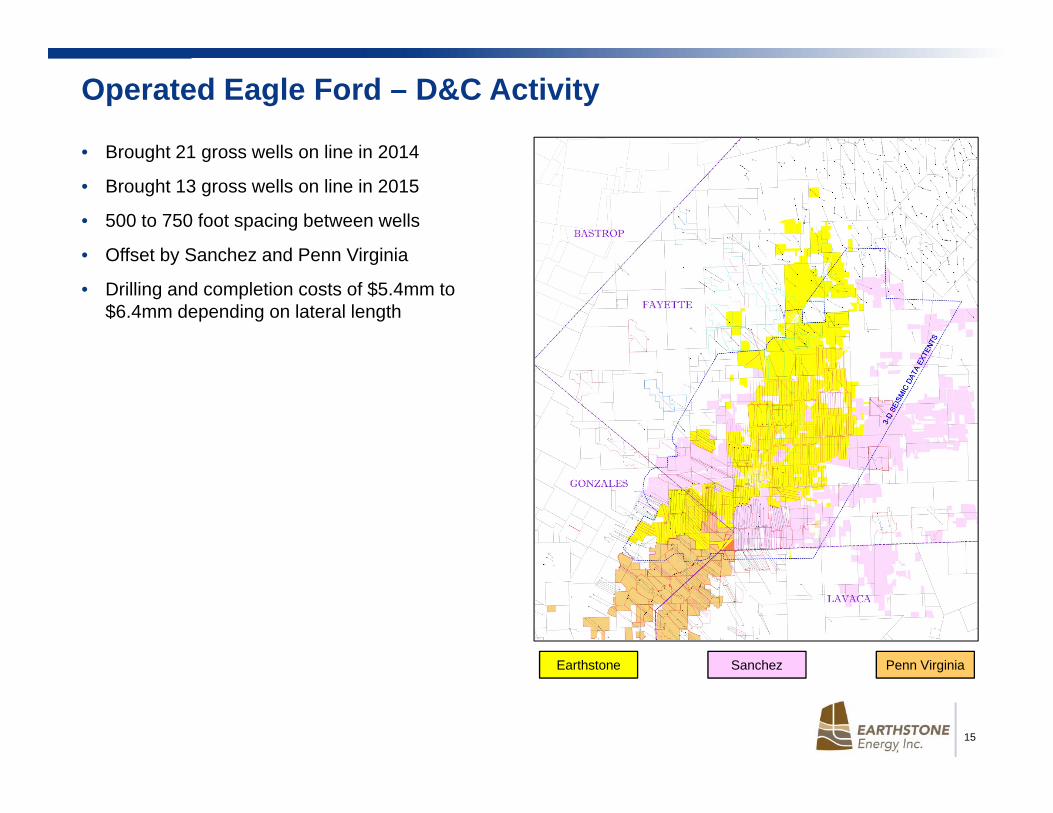
Operated Eagle Ford – D&C Activity
• Brought 21 gross wells on line in 2014
• Brought 13 gross wells on line in 2015
• 500 to 750 foot spacing between wells
• Offset by Sanchez and Penn Virginia
• Drilling and completion costs of $5.4mm to $6.4mm depending on lateral length
Earthstone Sanchez Penn Virginia
16
0
2000
4000
6000
8000
10000
12000
14000
16000
18000
0 2 4 6 8 10 12 14 16 18 20
Dep
th (ft M
D)
Days
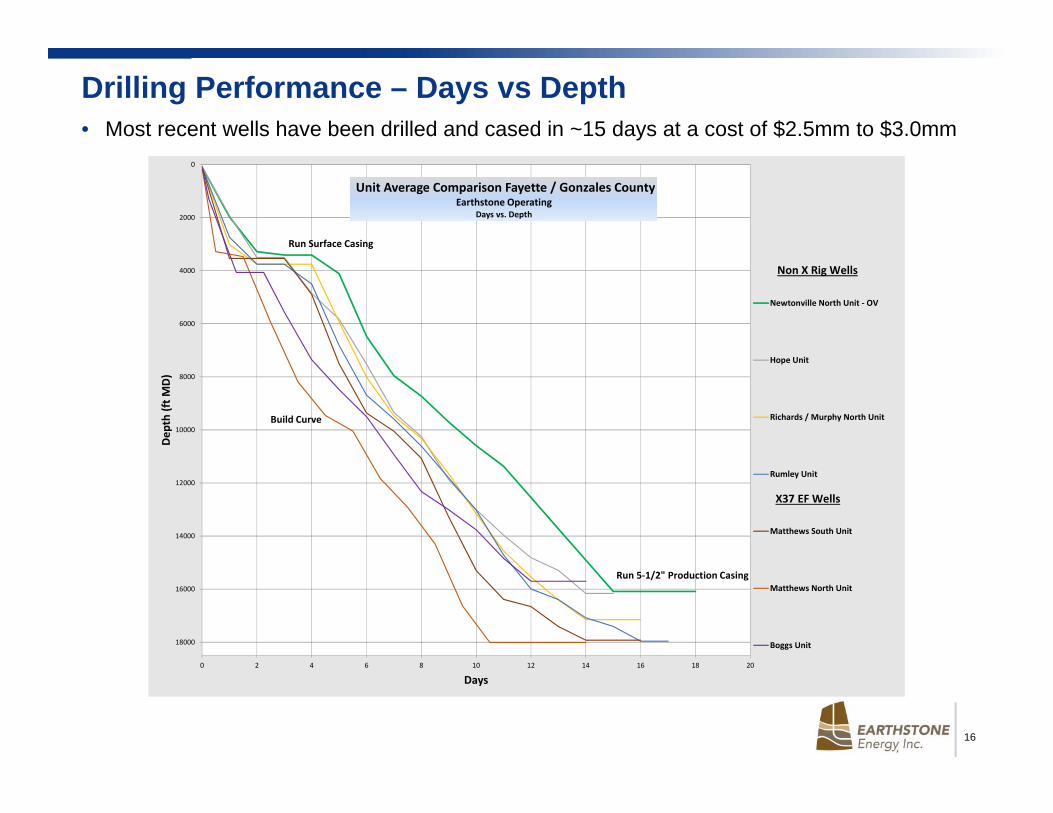
Unit Average Comparison Fayette / Gonzales CountyEarthstone Operating
Days vs. Depth
Newtonville North Unit ‐ OV
Hope Unit
Richards / Murphy North Unit
Rumley Unit
Matthews South Unit
Matthews North Unit
Boggs Unit
Run Surface Casing
Build Curve
Run 5‐1/2" Production Casing
Non X Rig Wells
X37 EF Wells
Drilling Performance – Days vs Depth• Most recent wells have been drilled and cased in ~15 days at a cost of $2.5mm to $3.0mm

17
167,560
197,121 187,506
160,643 170,262 177,167
123,313 119,941 117,175 110,592 100,000
0
50,000
100,000
150,000
200,000
250,000
Kolar‐Labatt(3)
Flatonia SW(3)
Flatonia SW(5)
Newtonville N.(4)
Garza(2)
Richards N(3)
Murphy N(2)
Hope(2)
Rumley(2)
Matthews S(2)
Goal
1,422
1,820
1,570 1,409 1,365 1,345
1,166 1,070
968 965
0
250
500
750
1,000
1,250
1,500
1,750
2,000
Kolar‐Labatt(3)
Flatonia SW(3)
Flatonia SW(5)
Newtonville N.(4)
Garza(2)
Richards N(3)
Murphy N(2)
Hope(2)
Rumley(2)
Matthews S(2)
796 820
1,077
894957
1,045 1,086 1,078989 974
1,287
0
200
400
600
800
1,000
1,200
1,400
Kolar‐Labatt(3)
Flatonia SW(3)
Flatonia SW(5)
Newtonville N.(4)
Garza(2)
Richards N(3)
Murphy N(2)
Hope(5)
Rumley(5)
Matthews S(1)
Matthews N(2)
221 200
177 187
159 174 167 171 175
162 142 140
0
50
100
150
200
250
Kolar‐Labatt(3)
Flatonia SW(3)
Flatonia SW(5)
Newtonville N.(4)
Garza(2)
Richards N(3)
Murphy N(2)
Hope(5)
Rumley(5)
Matthews S(1)
Matthews N(2)
Goal
Eagle Ford Drilling and Completion TrendsPad Averages
Notes: Amount in parentheses indicates the number of wells drilled/completedAnalysis excludes three wells that involved a side-track and four wells that required intermediate casing
Feet Drilled per Day Drilling Capex per Foot Drilled ($/Foot)
Completion Capex per Stage ($/Stage) Total Well Cost per Lateral Length ($/Foot)

18
Recent Eagle Ford Acquisitions – Karnes and Gonzales Counties
• Acquired 3,050 gross / 1,185 net acres in Karnes and Southern Gonzales Counties
• Potential for 33+ gross Eagle Ford locations
• Laterals of 5,000 feet to 7,000 feet
• Operational control with 33% to 50% working interest
• In Q4 2015, drilled four well pad in Karnes County, with first production expected in H2 2016
• No near-term lease obligations
‐ HBP acreage
‐ 2017 to 2018 expirations

19
Recent Eagle Ford Acquisitions – Karnes and Gonzales Counties
Month Acquired June 2015 June 2015 August 2015 Total
County Karnes Gonzales Gonzales
Objective Eagle Ford Eagle Ford Eagle Ford
Leasehold Acres:
Gross 350 1,000 1,650 3,050
Net 115 500 550 1,185
Working Interest 33% 50% 33% 39%
Spacing (Feet) 500 500 500
Gross Drilling Locations
4 13 16 33
Operated
• Eagle Ford Development Plans
‐ Approximately 33 planned gross Eagle Ford drilling locations in Karnes and Southern Gonzales Counties
‐ Four gross wells drilled in Q4 2015, with continued future development subject to prices
‐ Significant producing Eagle Ford well control
20
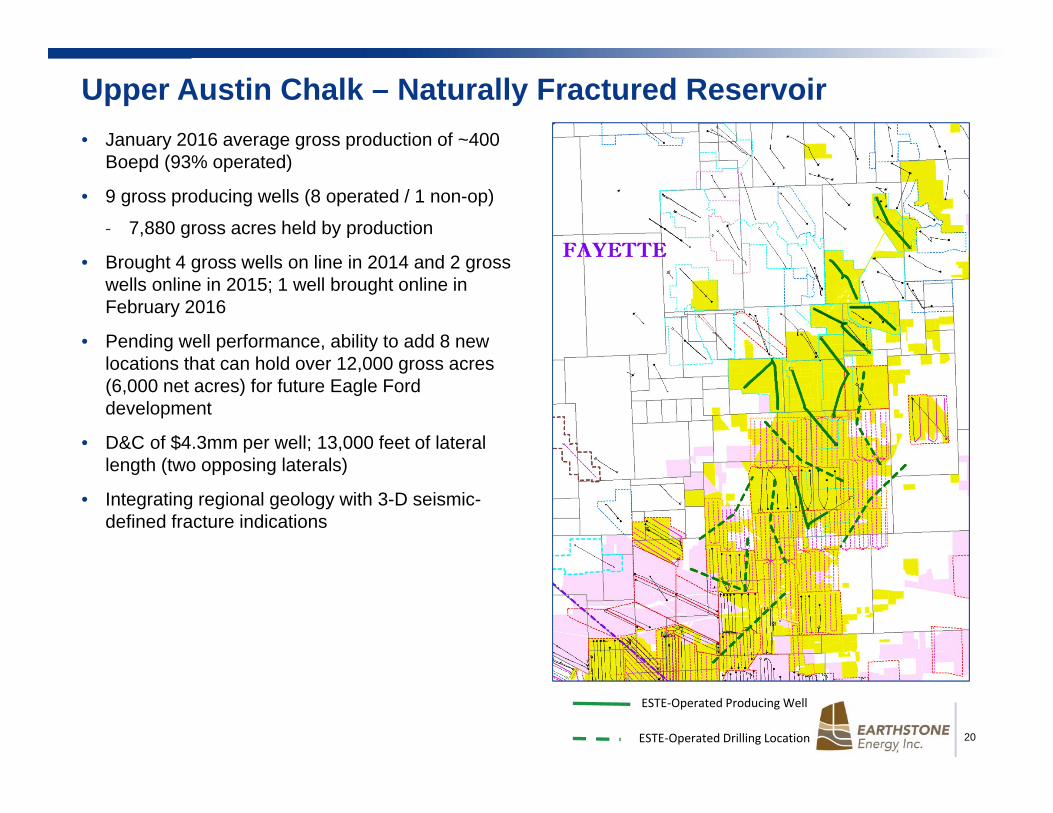
Upper Austin Chalk – Naturally Fractured Reservoir• January 2016 average gross production of ~400
Boepd (93% operated)
• 9 gross producing wells (8 operated / 1 non-op)
‐ 7,880 gross acres held by production
• Brought 4 gross wells on line in 2014 and 2 gross wells online in 2015; 1 well brought online in February 2016
• Pending well performance, ability to add 8 new locations that can hold over 12,000 gross acres (6,000 net acres) for future Eagle Ford development
• D&C of $4.3mm per well; 13,000 feet of lateral length (two opposing laterals)
• Integrating regional geology with 3-D seismic-defined fracture indications
ESTE‐Operated Producing Well
ESTE‐Operated Drilling Location

21
Williston Basin – Bakken/Three Forks Play
• Expand acreage• Acquire production• Establish operating presence
• 5,900 net core acres predominantly in McKenzie and Dunn Counties of North Dakota that are prospective for the Bakken/Three Forks formation
• 136 gross wells producing‐ Average working interest of ~4%‐ 35 gross wells currently being drilled or
completed• ~140 potential gross drilling locations• Primary operators include: Statoil, Oasis,
ConocoPhillips/Burlington, Continental, ExxonMobil/XTO, Marathon, SM Energy
• Majority of units in McKenzie County, ND
‐ Banks Field
Largest development area
Interest in 22 spacing units
Operators down-spacing to 6-7 wells per unit in the Bakken
‐ Indian Hill Field
Near-Term StrategySummary
Note: Estimated number of locations include proved undeveloped as well as management’s estimates of additional potential. Actual locations drilled and quantities that may be ultimately recovered from Earthstone’s interests could differ substantially from management’s estimates.

22
285,000
770,000
Oil (Bbls) Gas (MMBtu)
Oil and Gas Production Hedged Swap Positions
Avg. hedged oil price = $54.17/BblAvg. hedged gas price = $2.530/MMBtu
Oil / Gas QuantityOil – BBls/moGas – MMBtu/mo
Period Fixed Price
Oil 5,000 Jan ‘16 – Mar ’16 57.00
Oil 10,000 Jan ‘16 – Jun ’16 58.00
Oil 10,000 Jan ‘16 – Dec ’16 60.80
Oil 10,000 Apr ‘16 – Mar ’17 42.30
Gas 70,000 Feb ‘16 – Dec ‘16 2.530
Gas 40,000 Jan ‘17 – Dec ‘17 2.785
2016 Hedging Summary
23
Appendix A – PV-10
Present Value Discounted at 10% (“PV-10”) is a non-GAAP financial measure that differs from the GAAP measure “standardized measure ofdiscounted future net cash flows” in that PV-10 is calculated without regard to future income taxes. Earthstone and Lynden management believe thatthe presentation of the PV-10 value is relevant and useful to investors because it presents the estimated discounted future net cash flows attributableto our estimated proved reserves independent of our income tax attributes, thereby isolating the intrinsic value of the estimated future cash flowsattributable to our reserves. Because many factors that are unique to each individual company impact the amount of future income taxes to be paid,Earthstone and Lynden believe the use of a pre-tax measure provides greater comparability of assets when evaluating companies. PV-10 does notnecessarily represent the fair market value of oil and natural gas properties. PV-10 is not a measure of financial or operational performance underGAAP, nor should it be considered in isolation or as a substitute for the standardized measure of discounted future net cash flows as defined underGAAP.
PV-10s as of December 31, 2015 utilized SEC price methodology and were based on $50.28 per barrel of oil and $2.590 per MMBTU for natural gas.
24
Frank Lodzinski President and CEO
Robert Anderson EVP, Corporate Development and Engineering
Neil Cohen VP, Finance, and Treasurer
Corporate Headquarters
Houston 1400 Woodloch Forest Drive | Suite 300 | The Woodlands, TX 77380 | (281) 298-4246
Denver 633 17th Street | Suite 2320 | Denver, CO 80202 | (303) 296-3076
Website www.earthstoneenergy.com
Contact Information