EFFECTS OF PORTLAND CEMENT PARTICLE SIZE … OF PORTLAND CEMENT PARTICLE SIZE ON HEAT OF HYDRATION...
95
EFFECTS OF PORTLAND CEMENT PARTICLE SIZE ON HEAT OF HYDRATION Contract No. BDK84 977-13 Final Report December 2013 Submitted to Miss Sandra Bell ([email protected]) The Florida Department of Transportation Research Center 605 Suwannee Street, MS 30 Tallahassee, FL 32399 c/o Dr. Harvey DeFord, Ph.D. Structures Materials Research Specialist State Materials Office Submitted by Dr. Abla Zayed ([email protected]) Department of Civil & Environmental Engineering University of South Florida 4202 E Fowler Avenue Tampa; Florida 33620
Transcript of EFFECTS OF PORTLAND CEMENT PARTICLE SIZE … OF PORTLAND CEMENT PARTICLE SIZE ON HEAT OF HYDRATION...

EFFECTS OF PORTLAND CEMENT PARTICLE SIZE ON HEAT OF
HYDRATION
Contract No. BDK84 977-13
Final Report
December 2013
Submitted to Miss Sandra Bell ([email protected])
The Florida Department of Transportation Research Center
605 Suwannee Street, MS 30 Tallahassee, FL 32399
c/o Dr. Harvey DeFord, Ph.D. Structures Materials Research Specialist
State Materials Office
Submitted by
Dr. Abla Zayed ([email protected]) Department of Civil & Environmental Engineering
University of South Florida 4202 E Fowler Avenue Tampa; Florida 33620

ii
DISCLAIMER
The opinions, findings, and conclusions expressed in this publication are those of the authors and
not necessarily those of the State of Florida Department of Transportation (FDOT), the U.S.
Department of Transportation (USDOT), or the Federal Highway Administration (FHWA).
iii
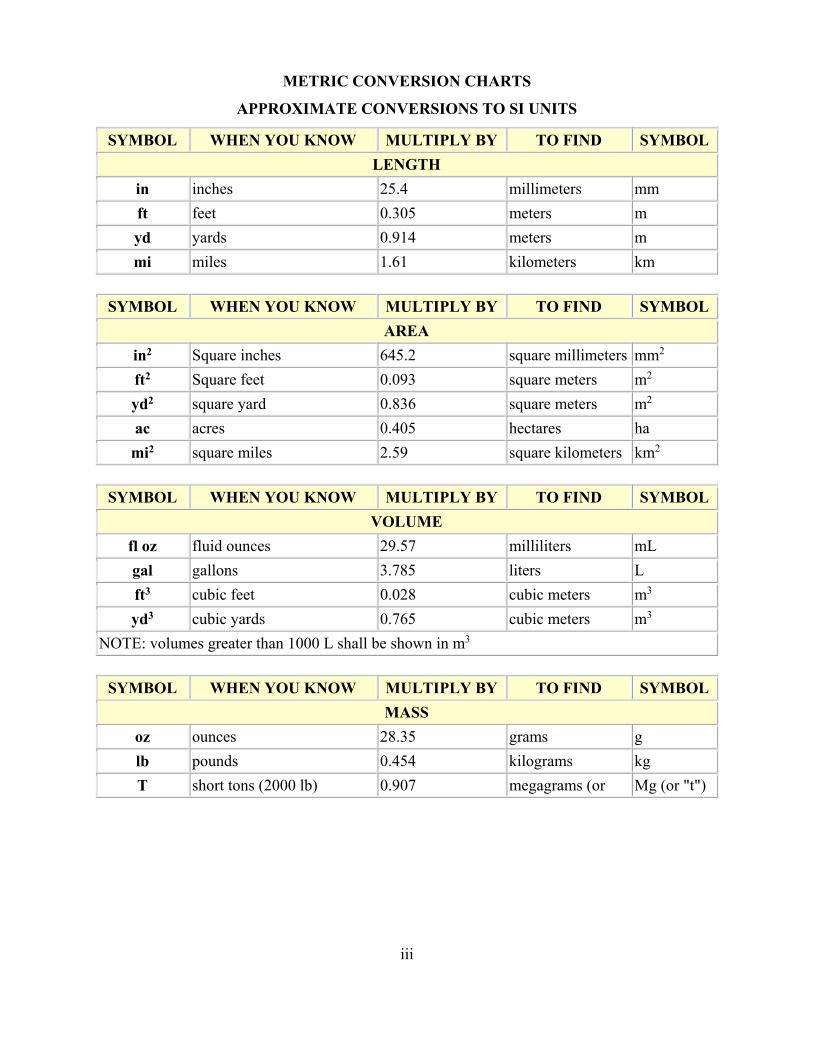
METRIC CONVERSION CHARTS
APPROXIMATE CONVERSIONS TO SI UNITS
SYMBOL WHEN YOU KNOW MULTIPLY BY TO FIND SYMBOL
LENGTH
in inches 25.4 millimeters mm
ft feet 0.305 meters m
yd yards 0.914 meters m
mi miles 1.61 kilometers km
SYMBOL WHEN YOU KNOW MULTIPLY BY TO FIND SYMBOL
AREA
in2 Square inches 645.2 square millimeters mm2
ft2 Square feet 0.093 square meters m2
yd2 square yard 0.836 square meters m2
ac acres 0.405 hectares ha
mi2 square miles 2.59 square kilometers km2
SYMBOL WHEN YOU KNOW MULTIPLY BY TO FIND SYMBOL
VOLUME
fl oz fluid ounces 29.57 milliliters mL
gal gallons 3.785 liters L
ft3 cubic feet 0.028 cubic meters m3
yd3 cubic yards 0.765 cubic meters m3
NOTE: volumes greater than 1000 L shall be shown in m3
SYMBOL WHEN YOU KNOW MULTIPLY BY TO FIND SYMBOL
MASS
oz ounces 28.35 grams g
lb pounds 0.454 kilograms kg
T short tons (2000 lb) 0.907 megagrams (or Mg (or "t")

iv
APPROXIMATE CONVERSIONS TO SI UNITS
SYMBOL WHEN YOU KNOW MULTIPLY BY TO FIND SYMBOL
TEMPERATURE (exact degrees) oF Fahrenheit 5 (F-32)/9 or (F-
32)/1.8 Celsius oC
SYMBOL WHEN YOU KNOW MULTIPLY BY TO FIND SYMBOL
ILLUMINATION
fc foot-candles 10.76 lux lx
fl foot-Lamberts 3.426 candela/m2 cd/m2
SYMBOL WHEN YOU KNOW MULTIPLY BY TO FIND SYMBOL
FORCE and PRESSURE or STRESS
lbf poundforce 4.45 newtons N
lbf/in2 poundforce per square inch 6.89 kilopascals kPa
APPROXIMATE CONVERSIONS TO SI UNITS
SYMBOL WHEN YOU KNOW MULTIPLY BY TO FIND SYMBOL
LENGTH
mm millimeters 0.039 inches in
m meters 3.28 feet ft
m meters 1.09 yards yd
km kilometers 0.621 miles mi
SYMBOL WHEN YOU KNOW MULTIPLY BY TO FIND SYMBOL
AREA
mm2 square millimeters 0.0016 square inches in2
m2 square meters 10.764 square feet ft2
m2 square meters 1.195 square yards yd2
ha hectares 2.47 acres ac
km2 square kilometers 0.386 square miles mi2

v
APPROXIMATE CONVERSIONS TO SI UNITS
SYMBOL WHEN YOU KNOW MULTIPLY BY TO FIND SYMBOL
VOLUME
mL milliliters 0.034 fluid ounces fl oz
L liters 0.264 gallons gal
m3 cubic meters 35.314 cubic feet ft3
m3 cubic meters 1.307 cubic yards yd3
SYMBOL WHEN YOU KNOW MULTIPLY BY TO FIND SYMBOL
MASS
g grams 0.035 ounces oz
kg kilograms 2.202 pounds lb
Mg (or "t") megagrams (or "metric ton")
1.103 short tons (2000 lb)
T
SYMBOL WHEN YOU KNOW MULTIPLY BY TO FIND SYMBOL
TEMPERATURE (exact degrees) oC Celsius 1.8C+32 Fahrenheit oF
SYMBOL WHEN YOU KNOW MULTIPLY BY TO FIND SYMBOL
ILLUMINATION
lx lux 0.0929 foot-candles fc
cd/m2 candela/m2 0.2919 foot-Lamberts fl
SYMBOL WHEN YOU KNOW MULTIPLY BY TO FIND SYMBOL
FORCE and PRESSURE or STRESS
N newtons 0.225 poundforce lbf
kPa kilopascals 0.145 poundforce per square inch
lbf/in2
*SI is the symbol for the International System of Units. Appropriate rounding should be made to comply with Section 4 of ASTM E380. (Revised March 2003)

vi
Technical Report Documentation Page 1. Report No.
2. Government Accession No.
3. Recipient's Catalog No.
4. Title and Subtitle
EFFECT OF PORTLAND CEMENT PARTICLE SIZE ON HEAT OF HYDRATION
5. Report Date
January 2014
6. Performing Organization Code
7. Author(s)
Abla Zayed, Ph.D. Ahmadreza Sedaghat, M.Sc., PE., Andre Bien-Aime, M.Sc., and Natalya Shanahan, M.Sc.
8. Performing Organization Report No.
9. Performing Organization Name and Address
Department of Civil and Environmental Engineering University of South Florida 4202 E Fowler Avenue; ENG 118 Tampa, FL 33620
10. Work Unit No. (TRAIS)
11. Contract or Grant No.
BDK84 977-13
12. Sponsoring Agency Name and Address
Florida Department of Transportation Research Center 605 Suwannee Street, MS 30 Tallahassee, FL 32399
13. Type of Report and Period Covered
Final Report June 2010 – December 2013 14. Sponsoring Agency Code
15. Supplementary Notes
16. Abstract
Following specification harmonization for portland cements, FDOT engineers reported signs of deterioration in concrete elements due to temperature rise effects. One of the main factors that affect concrete temperature rise potential is the heat generated by portland cement during hydration. This study was initiated to identify the effect of cement fineness on the heat generated by portland cement. Eleven cements were selected for this study to address the effects of cement fineness and mineralogy. Several of the cements came from the same source but had different grinds. This was important in studying the fineness contribution to heat of hydration while maintaining similar cement mineralogy. The as-received cements from different suppliers had a wide range of mineralogical compositions which allowed the study of the effects of mineralogy on the heat of hydration. Cements were characterized through oxide chemical analysis, x-ray diffraction, Blaine fineness, laser particle size analysis, setting behavior, and strength measurements. Additionally, limited restrained shrinkage experiments were performed on two of the cements from the same source to determine the effect of cement fineness on restrained shrinkage. The findings indicate that cement fineness is better correlated to 7-day heat of hydration than the heat index expressed as C3S + 4.75 C3A. Additionally, the results indicate that a finer cement experiences higher shrinkage than a coarser cement. Comparison of activation energies indicates that cements with higher fineness have lower activation energy. For Type II moderate heat (MH) portland cements that will be used in structural concrete elements where there is a risk of cracking due to thermal stresses, it is recommended that limits be placed on the heat of hydration, the Blaine fineness, and the heat index. 17. Key Word
Blaine fineness, mean particle size, heat index, heat of hydration, heat of solution, isothermal calorimeter, ASTM C186, ASTM C150, AASHTO M85, cement mineralogy, activation energy.
18. Distribution Statement
19. Security Classif. (of this report)
Unclassified 20. Security Classif. (of this page)
Unclassified 21. No. of Pages
95 22. Price
Form DOT F 1700.7 (8-72) Reproduction of completed page authorized

vii
AKNOWLEGEMENTS
This work has been supported by the Florida Department of Transportation and the Federal
Highway Administration. The Principal Investigator appreciates the valuable discussions with Dr.
Charles Ishee, PE, the initial Project Manager, who is currently with the United States Air Force
Research Lab at Tyndall Air Force Base. The technical assistance offered throughout the course
of this work by Mr. Michael Bergin, PE and Dr. Harvey DeFord, the current Project Manager, is
greatly appreciated.

viii
EXECUTIVE SUMMARY
Scope:
The objective of this study was to address the effect of cement fineness on the heat of hydration
of portland cement. The significance of heat of hydration of portland cement is due to its role in
thermal cracking of massive concrete structural elements. Heat generated through the hydration of
portland cement is dependent on cement composition and fineness. Underestimating the amount
of heat generated during the early hydration of a portland cement can have profound effects on the
durability and service life of concrete structures that are designed and constructed using this
cement. Current standard specifications for portland cement (ASTM C150 or AASHTO M85)
present a heat index to quantify the amount of heat generated by a portland cement. The heat index
uses the phase composition of a cement as the basis for assessing its potential for heat generation.
This methodology does not take into account the effect of cement fineness on the heat generated.
Data that validate this methodology are limited, and compiled from cements that have a
substantially different mineralogical composition and particle size than the currently produced
portland cements. This study was initiated to collect scientific data to establish the validity and
limitations of the current methodology and to address the consequences of the exclusion of cement
fineness as an important criterion for the estimation of the amount of heat generated during cement
hydration at early ages.
To address the above objectives, 11 portland cements were used in this study. Of the eleven
cements, three came from one source and were labeled CLEP, CLE02 and CLE03, six cements
came from three different sources with 2 cements per source, and two cements came from two
different sources. The cements obtained from the same source have different fineness, but share
the same clinker mineralogy. Analyzing cements with essentially the same mineralogical
composition enabled the determination of the effects of cement fineness. The cements selected for

ix
this study had a wide range of fineness and mineralogy. Several characterization techniques were
used, including: x-ray fluorescence for elemental and equivalent oxide composition, x-ray
diffraction for mineralogical analysis, density measurements, heat of hydration using the solution
method and isothermal calorimetry, Blaine fineness, and particle size distribution. Selected
cements were used for activation energy determination and restrained shrinkage measurements.
The findings of this study indicate that the heat of hydration calculated from the heat index
expression for a particular cement does not reliably correspond to the measured heat of hydration
of the cement determined by either the heat of solution method or by isothermal conduction
calorimetry. Blaine fineness and particle size distribution of portland cements were found to affect
the heat generated by cement on hydration. Additionally, the experimental data show that coarser
cements had a lower restrained shrinkage and experienced longer time to crack initiation. The
findings indicate that Blaine fineness and heat of hydration obtained from direct heat
measurements (isothermal calorimetry) are valuable indicators for assessing the thermal cracking
potential of a moderate heat (MH) portland cement. Thus, for applications where the rate and
magnitude of temperature rise is of concern and MH portland cements are specified, such as for
mass concrete, measurement of heat of hydration should be required in the specifications.
Recommendations:
1. Require a maximum heat of hydration and a maximum fineness for Type II (MH)
portland cements, where temperature rise is of concern for the service life and
durability of structural elements.
2. In specifying a maximum value for the heat of hydration of Type II (MH) portland
cement, direct measurement of the heat of hydration, in accordance with ASTM C186
and/or ASTM C1072, has to be also specified. The method used for heat measurement
has to be reported.
3. For concrete mix design approval, heat of hydration has to be determined on the
cementitious materials used in the mix including chemical admixtures, in the same

x
proportions used in the concrete mix. This composite heat of hydration should be more
useful in predicting the thermal behavior when evaluating the cracking tendency of a
mix design.
4. Evaluate which method of determining heat of hydration of portland cement, ASTM
C186 or ASTM C1702, is most applicable for predicting the thermal behavior of
cementitious structures that are susceptible to cracking from thermal stresses.
5. Investigate further the effects of particle size and fineness on the shrinkage of portland
cements and blended portland cements.
6. Study the effects of blending portland cements, with commonly used pozzolanic
materials, on the hydration kinetics, heat evolution, strength development, and
microstructural development.
7. Evaluate the use of Rietveld analysis and scanning electron microscopy coupled with
energy dispersive x-ray spectroscopy, for the mineralogical characterization of
cementitious systems.

xi
TABLE OF CONTENTS
DISCLAIMER……………….. .......................................................................................... ii
METRIC CONVERTION CHARTS ................................................................................. iii
TECHNICAL REPORT DOCUMENTATION PAGE .................................................. xvii
AKNOWLEDGEMENTS.............................................................................................. xviii
EXECUTIVE SUMMARY ........................................................................................... xviii
LIST OF TABLES…….. ................................................................................................. xiii
LIST OF FIGURES ......................................................................................................... xiv
LIST OF ABBREVIATIONS ......................................................................................... xvii
LIST OF SYMBOLS ..................................................................................................... xviii
CHAPTER 1: INTRODUCTION ....................................................................................... 1
CHAPTER 2: LITERATURE REVIEW ............................................................................ 3
CHAPTER 3: METHODOLOGY .................................................................................... 12
3.1 Materials ......................................................................................................... 12
3.2 Oxide Chemical Analysis and Density Measurements of As-Received
Cements........................................................................................................... 13
3.3 Mineralogical Analysis of Cements ................................................................ 13
3.4 Particle Size Analysis for Portland Cements .................................................. 18
3.5 Heat of Hydration Measurements ................................................................... 21
3.6 Setting Time .................................................................................................... 23
3.7 Mortar Strength Measurements....................................................................... 24
3.8 Activation Energy ........................................................................................... 25
3.9 Restrained Shrinkage Measurements .............................................................. 25

xii
CHAPTER 4: RESULTS AND DISCUSSION ................................................................ 27
4.1 Introduction ..................................................................................................... 27
4.2 Chemical Characterization of As-Received Cements ..................................... 27
4.3 Mineralogical Characterization of Portland Cements ..................................... 32
4.4 Cement Particle Size Analysis ........................................................................ 32
4.5 Heat of Hydration Using Isothermal Calorimeter ........................................... 36
4.6 Activation Energy Determination ................................................................... 41
4.7 Density of As-Received Cements ................................................................... 60
4.8 Hydration Process and Cement Fineness ........................................................ 61
4.9 Restrained Shrinkage Measurements and Cement Fineness ........................... 64
CHAPTER 5: CONCLUSIONS AND RECOMMENDATIONS .................................... 67
REFERENCES……………. ............................................................................................ 69
APPENDIX……..…….. ................................................................................................... 76
Appendix A: Characteristics of Sand .................................................................... 77

xiii
LIST OF TABLES
Table 3.1: Mix Proportions for Restrained Shrinkage Test .......................................................... 26
Table 4.1: Oxide Chemical Analysis for As-Received Cements .................................................. 30
Table 4.2: Bogue-Calculated Potential Compound Content for As-Received Cements (ASTM
C150-11) ............................................................................................................................... 31
Table 4.3: Heat of Hydration (kJ/kg)-ASTM C-186 .................................................................... 31
Table 4.4: Phase Content Using QXRD ....................................................................................... 35
Table 4.5: Particle Size Analysis of As-Received Cements ......................................................... 35
Table 4.6: Fineness and 7-Day Heat of Hydration for As-Received Cements ............................. 39
Table 4.7: Summary of Hyperbolic Function Parameters ............................................................ 56
Table 4.8: Summary of Exponential Function Parameters ........................................................... 57
Table 4.9: Activation Energy for As-Received Cements .............................................................. 59
Table 4.10: Density of As-Received Cements .............................................................................. 61
Table 4.11: Restrained Shrinkage for AC Cement Mortar (w/c=0.485)....................................... 64
Table 4.12: Restrained Shrinkage for AC Cement Mortar (w/c=0.45)......................................... 65

xiv
LIST OF FIGURES
Figure 3.1: One of the Windows Showing Differences between C3S Crystal Structure of the
Cements................................................................................................................................. 15
Figure 3.2: Internal Standard Calibration Curve for M1 Alite Polymorph ................................... 18
Figure 3.3: Example of Particle Size Distribution for Portland Cement ...................................... 20
Figure 3.4: Measured Differential Particle Size Distribution for AC02 Cement ......................... 20
Figure 3.5: Profiles of Twin-Channel Isothermal Calorimeter (TAM Air) .................................. 22
Figure 4.1: Variation of 7-Day Heat of Hydration with Heat Index ............................................. 29
Figure 4.2: Effect of Blaine Fineness on the 7-Day Heat of Hydration ....................................... 34
Figure 4.3: Effect of Cement Fineness on Cumulative Heat for CLE Cements ........................... 36
Figure 4.4: Effect of Cement Fineness on Cumulative Heat for AC Cements ............................. 37
Figure 4.5: Effect of Cement Fineness on Cumulative Heat for LG Cements ............................. 37
Figure 4.6: Effect of Cement Fineness on Cumulative Heat for ZR Cements ............................. 38
Figure 4.7: Effect of Cement Fineness on Cumulative Heat for CHC Cement ............................ 38
Figure 4.8: Effect of Cement Fineness on Cumulative Heat for ERD06 Cement ........................ 39
Figure 4.9: Relationship between Heat of Hydration Determined Using Heat of Solution Method
and Isothermal Conduction Calorimetry ............................................................................... 40
Figure 4.10: Setting Properties for AC02 Cement ........................................................................ 42
Figure 4.11: Setting Properties for AC03 Cement ........................................................................ 43
Figure 4.12: Setting Properties for ZR02 Cement ........................................................................ 43
Figure 4.13: Setting Properties for ZR03 Cement ........................................................................ 44
Figure 4.14: Setting Properties for LG01 Cement ........................................................................ 44
Figure 4.15: Setting Properties for LG03 Cement ........................................................................ 45
Figure 4.16: Effect of Cement Fineness on Setting Behavior of AC Cements ............................. 45

xv
Figure 4.17: Effect of Cement Fineness on Setting Behavior of ZR Cements ............................. 46
Figure 4.18: Effect of Cement Fineness on Setting Behavior of LG Cements ............................. 46
Figure 4.19: Effect of Cement Mineralogy on Setting Behavior .................................................. 47
Figure 4.20: Compressive Strength for AC02 Cement ................................................................. 48
Figure 4.21: Compressive Strength for AC03 Cement ................................................................. 48
Figure 4.22: Compressive Strength for ZR02 Cement ................................................................. 49
Figure 4.23: Compressive Strength for ZR03 ............................................................................... 49
Figure 4.24: Compressive Strength for LG01............................................................................... 50
Figure 4.25: Strength Gain over Time for LG03 .......................................................................... 50
Figure 4.26: Effect of Cement Fineness on Strength for AC Cements ......................................... 51
Figure 4.27: Effect of Cement Fineness on Strength for ZR Cements ......................................... 51
Figure 4.28: Effect of Cement Fineness on Strength for LG Cements ......................................... 52
Figure 4.29: Effect of Cement Composition on Strength ............................................................. 52
Figure 4.30: Strength Data Fitting Using Exponential and Hyperbolic Functions on AC02 at
22°C ...................................................................................................................................... 54
Figure 4.31: Strength Data Fitting Using Exponential and Hyperbolic Functions on AC02 at
30°C ...................................................................................................................................... 55
Figure 4.32: Strength Data Fitting Using Exponential and Hyperbolic Functions on AC02 at
40°C ...................................................................................................................................... 55
Figure 4.33: Activation Energy Determination Ea Using Hyperbolic Function on AC02 ........... 58
Figure 4.34: Activation Energy Determination Ea Using Exponential Function on AC02 .......... 58
Figure 4.35: Variation of Calcium Hydroxide with Hydration Time for AC Cements ................ 62
Figure 4.36: Variation of Calcium Hydroxide with Hydration Time for ZR Cements ................ 63
Figure 4.37: Variation of Calcium Hydroxide with Hydration Time for LG Cements ................ 64

xvi
Figure 4.38: Development of Steel Ring Strain as a Function of Age for AC03 Mortar Mix ..... 66
Figure 4.39: Development of Steel Ring Strain as a Function of Age for AC02 Mortar Mix ..... 66
xvii
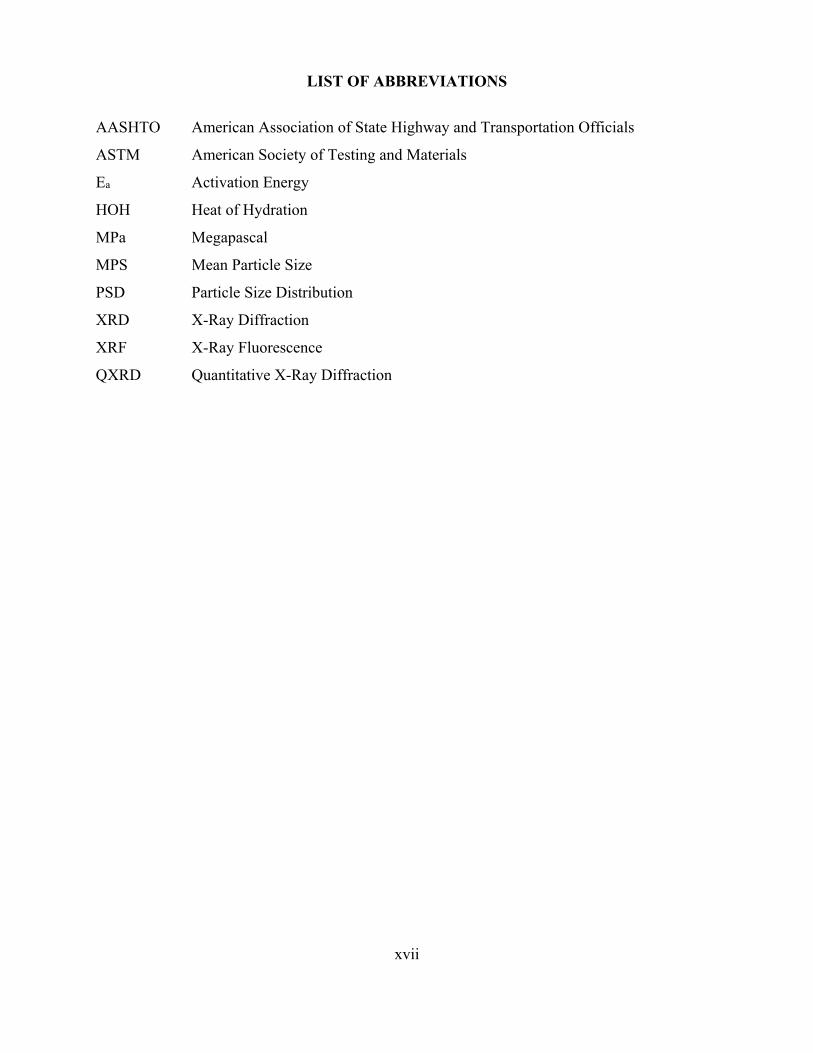
LIST OF ABBREVIATIONS
AASHTO American Association of State Highway and Transportation Officials
ASTM American Society of Testing and Materials
Ea Activation Energy
HOH Heat of Hydration
MPa Megapascal
MPS Mean Particle Size
PSD Particle Size Distribution
XRD X-Ray Diffraction
XRF X-Ray Fluorescence
QXRD Quantitative X-Ray Diffraction
xviii
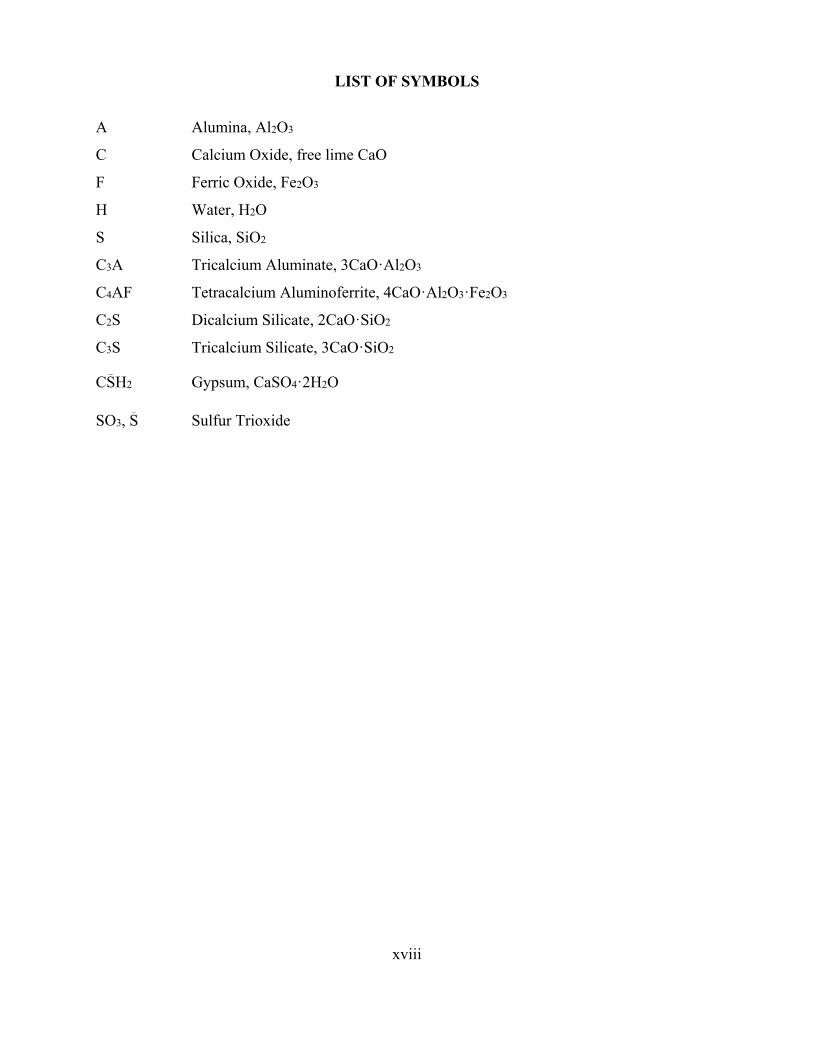
LIST OF SYMBOLS
A Alumina, Al2O3
C Calcium Oxide, free lime CaO
F Ferric Oxide, Fe2O3
H Water, H2O
S Silica, SiO2
C3A Tricalcium Aluminate, 3CaO·Al2O3
C4AF Tetracalcium Aluminoferrite, 4CaO·Al2O3·Fe2O3
C2S Dicalcium Silicate, 2CaO·SiO2
C3S Tricalcium Silicate, 3CaO·SiO2
CS_
H2 Gypsum, CaSO4·2H2O
SO3, S_
Sulfur Trioxide

1
CHAPTER 1: INTRODUCTION
Recently, standard specifications for portland cement, ASTM C150 and AASHTO
M85, have gone through several modifications. This is due to the harmonization efforts undertaken
by the Joint AASHTO-ASTM Harmonizing Task Group. The implemented changes resulting from
the harmonization efforts triggered concerns with some state agencies. The Florida Department of
Transportation (FDOT) Structures Materials Laboratory issued a report [1] indicating adverse
performance characteristics in some Florida concrete elements fabricated with Type II cements.
The report noted that this adverse performance was due to an increase in the heat of hydration of
Type II cements resulting from standard specification changes following the harmonization efforts.
The report identified the necessity of proposing “revisions to FDOT Specification 921, Portland
Cement and Blended Cement, to mitigate the adverse effects of Type II cements.”
The harmonized specifications for portland cements were based on the findings of a study
relating standard test properties of portland cement to its heat of hydration [2]. Current Type II
cement specifications do not have maximum limits on C3S or maximum limits on Blaine fineness.
The effects of tricalcium silicate and aluminate content on the heat generated by portland cement
have been long recognized [3]. However, the studies were typically conducted on cements with
similar fineness, or fineness was not considered as a factor in the heat generated. A moderate heat
(MH) Type II cement was introduced into the specifications, following harmonization, as an
alternative cement to be used in applications where moderate heat generation is needed. The heat
index, defined by the left-hand side of Equation 1.1, is used as the only standard requirement to
classify cement as moderate heat. As indicated in ASTM C150-12 [4], Note 5 “The limit on the
sum, C3S + 4.75C3A, in Table 1 provides control on the heat of hydration of the cement and is
consistent with Test Method C186-05 [8] 7-day heat of hydration limit of 335 kJ/kg (80 cal/g)”.
The heat index expression identifies the significance of the tricalcium compounds on the amount
of heat produced by portland cements, but does not address the effect of cement fineness.
C3S + 4.75 C3A 100 Equation 1.1
where C3S = percentage of tricalcium silicate (Bogue calculated)
C3A = percentage of tricalcium aluminate (Bogue calculated)
2
C3S + 4.75 C3A = heat index
According to current specifications on cements, if a portland cement Type II (MH) has a heat index
less than or equal to 90, the Blaine fineness limit of 430 m2/kg set per Standard Physical
Requirements (Table 3 ASTM C150-12 [4]) does not apply.
The current study was initiated in order to address the effects of cement particle size and
fineness on heat of hydration. Additionally, the study evaluated the effectiveness of the heat index
to estimate the heat of hydration of portland cements. Establishing these relationships was
considered necessary to insure the durability of Florida concrete structures.

3
CHAPTER 2: LITERATURE REVIEW
Temperature rise in concrete elements is primarily driven by the heat generated by the
hydration of portland cement. Heat of hydration of cement is affected by several parameters;
namely, cement composition, fineness, temperature, and w/c ratio [5]. All cement phases generate
heat on reacting with water; that is, the hydration process is exothermic in nature. The heat of
hydration of portland cement is mainly attributed to the contributions of the tricalcium silicate and
aluminate phases. In spite of that, current standard portland cement specifications for Type II or
Type II (MH) do not directly limit C3S content for moderate heat cements. However, a heat index
expression has been employed (see Equation 1.1) to aid in quantifying the total heat of hydration.
The heat index is calculated based on the phases quantified indirectly from Bogue calculations.
Previous research and published literature [6, 7] indicate that there are significant differences
between actual phase quantification through direct measurements, such as with petrographic
analysis or quantitative x-ray diffraction, and the indirect phase quantification through Bogue
calculations.
The heat of hydration measurement, which is an optional requirement for Type II (MH)
portland cements, references ASTM C186-05 [8] as the procedure for measuring heat generated
by cement during hydration. There is general consensus, in the industry and also in the published
literature [9], that this test has poor precision (among labs) and can provide conflicting results.
This test requires the use of hazardous chemicals, is expensive to run, and few labs are certified to
run the test. All these concerns have initiated efforts to provide other means by which heat of
hydration of portland cement can be assessed. A new specification for heat of hydration
measurements using isothermal conduction calorimetry has been specified under ASTM C1702-
13 [10]. However, portland cement standard specification ASTM C150-12 [4] has not yet
implemented the use of this test, which is simpler to run and has better precision than the currently
adopted heat of solution method [9].
In an attempt to develop a method to estimate the ASTM C186 heat of hydration of a
portland cement, Poole [9] conducted a study in which he examined data from the Cement and
Concrete Reference laboratory (CCRL) and the US Army Corps of Engineers. In this study, data
from 38 Type II cements with measured heats of hydration higher than 290 kJ/kg at 7 days were
analyzed. It is worth noting that 34 of the 38 cements used in this study had Blaine fineness values
4
in the range of 316-400 m2/kg. An analysis performed using a proposed equation of “unknown
origin” [9] on two hypothetical cements indicate that varying Blaine fineness gave an approximate
effect on the 7-day heat of hydration of 0.08 kJ/kg per unit change in Blaine fineness (m2/kg).
Stated differently, a change of 4 kJ/kg was calculated for a change in Blaine fineness of 50 m2/kg
using the hypothetical cements. The study concluded that fineness appears to have an effect on the
7-day heat of hydration, but to have any practical value a relatively large change in fineness would
be required. No specifics were given to define what could be considered as a significant change in
fineness. However, when cements from Verbeck and Foster [11] were statistically analyzed, Blaine
fineness was identified as a variable of significance. In the latter, the Blaine fineness ranged from
285-490 m2/kg. It was also found that an increase in Blaine fineness of 50 m2/kg results in an
increase in 7-day heat of hydration of 20 kJ/kg, which is significantly higher than the previous
prediction based on the two hypothetical cements.
Blended cements were also considered in the same study. In the case of blended cements,
the analyses included a wider range of Blaine fineness (336-534 m2/kg). It was concluded that
Blaine fineness did not appear to correlate well with the 7-day heat of hydration. However, the 7-
day strength showed some correlation with the 7-day heat of hydration but the correlation had a
low R2 value. This was explained by the possible variable contribution of different fly ashes to
strength development or heat of hydration. The study concluded that for portland cements a
combination of cement composition and fineness might be useful in predicting heat of hydration.
For blended cements, the study concluded that none of the commonly measured properties,
including fineness and strength, appear to correlate well with 7-day heat of hydration.
A recent study [12] focused on establishing a heat of hydration relationship in terms of
cement composition, fineness, and cement mineralogy (determined by quantitative x-ray
diffraction techniques) using statistical methods. The study also explored predictive models for 7-
day heat of hydration of portland cements. No single strong model emerged from this study;
however, it was concluded that mineralogical cement composition and fineness appear to be of
significance on heat of hydration.
Several studies concluded that the effect of cement fineness on early-age properties of
concrete and cement-based materials was significant [13-15]. The properties studied by Benz et
al. [13] included heat release, temperature rise and shrinkage. It was indicated that the current
emphasis on high early strength may result in susceptibility to early-age cracking. Fineness of

5
portland cement has received much attention due to its successive increase over the past 50 years
[16]. The common conclusion among those studies [13-15, 17] was to advocate the use of coarser
cements for better durability. While cement fineness has a significant impact on its heat of
hydration and, therefore, temperature rise in concrete elements, another issue of significance is the
shrinkage associated with finer portland cements. It was found that coarser cements are at a lower
risk of experiencing early age cracking than finer cements [17].
The effect of cement composition and fineness extends to the concept of activation energy
(Ea) and equivalent age. The activation energy of concrete is an important concept that is widely
implemented in predicting concrete strength and temperature rise. The concept was first introduced
in 1889 by Svante Arrhenius as the energy that must be supplied to a system for a reaction to
commence [18]. Later research [19-21] indicates that it can be considered as the parameter that
describes the temperature sensitivity of the hydration process of a cementitious system. Others
[22-25] used different qualifiers in describing the activation energy. However, there is agreement
that the term quantifies the energy barrier for reactions and it defines the reaction rate-temperature
relationship in a cementitious system. The concept of activation energy is very useful as it can help
engineers predict the performance of concrete elements under variable field conditions, including
the coupled effect of temperature and time. Examples of concrete hardened properties that can be
predicted using activation energy concept are strength, temperature rise and thermal cracking.
As the physical and chemical processes that control heat generation are different than those
that control strength gain, several researchers have contemplated if there can be a single activation
energy value that can be used in predicting strength and heat of hydration at various ages and
temperatures. Two different testing regimes are proposed in the literature for predicting activation
energy of cement; namely, compressive strength and heat of hydration. The appropriateness of
using the activation energy calculated from heat of hydration measurements to predict strength or
using the activation energy calculated from strength measurements to predict temperature rise has
been questioned [19, 26]. The consensus is that the activation energy determined through strength
measurements should only be used to predict strength while that determined through heat of
hydration should only be used for predicting temperature rise. This is due to the fact that though it
has been established that all clinker phases contribute to strength development and heat of
hydration, the extent of their individual contribution to each property is different. As an example,
while C3S is primarily responsible for early strength gain, C3A is the most effective phase in
6
controlling early heat release of cement. The contribution of the latter to strength is of limited
effect.
D'Aloia et al. [25] used Ea simulation models while varying C3A (3 & 10%) with sulfate
content (3 & 4%) and C3S (54 & 48%). Experimental work used isothermal calorimetric testing
over a temperature range of 10 to 28°C for 50 hours to investigate the influence of individual
compounds on activation energy. It was concluded that varying C3S, within this range, did not
affect the determined Ea while the effect of varying C3A for similar amounts was of significance.
Furthermore, this work indicated that the sulfate content and type affect the contribution of C3A
to activation energy. The role of sulfates on C3A hydration was also confirmed recently [27] on
work conducted on high alumina cements.
Strength-based methods for activation energy prediction rely on the maturity concept,
which uses the principle that concrete strength is directly related to both its time and temperature
history. The maturity concept was proposed in the late 1940s and early 1950s. Carino and Carino
et al. [28-30] provided a historic timeline of the maturity concept and maturity functions. These
functions are used to translate the measured temperature history of concrete into a numerical index,
which can then serve as an indicator for strength gain. ASTM C1074-11 “Standard Practice for
Estimating Concrete Strength by Maturity Method” [31] provides two maturity functions, one of
which incorporates activation energy. Additionally, this ASTM standard provides the procedures
for determination of activation energy.
In 1949, McIntosh [32] defined maturity as the product of time and temperature (above a
certain reference temperature of -1.1°C or 30°F); this product would define the curing history.
However, it was concluded that there was no simple or unique relationship that can define maturity
because strength development of concrete is governed by more complex factors than a simple
product of time and temperature. In the same year, Nurse [33] provided experimental evidence
supporting McIntosh. Nurse's evidence came from low-pressure steam curing testing. It was shown
that for different concrete mixtures, the relative strength as a function of time-temperature and
curing cycles fell reasonably close to a single non-linear curve. A critical concern regarding this
research was that the concept of datum or reference temperature was not taken into consideration;
therefore, one cannot be sure whether the temperature history reflects the temperature of the
chamber or the concrete itself.

7
Saul [34] introduced the principle of maturity concept and defined it as “Two concretes of
the same composition with the same value of maturity will have the same strength irrespective of
the temperature history that lead to this value of maturity”. Saul considered the datum temperature
to be -10.5°C and suggested that upon setting, concrete will continue to harden or gain strength at
temperatures below 0°C; therefore, maturity should be calculated with respect to the lowest
temperature at which hardening is observed. The concept was implemented in ASTM C1074-11
[31] and defined by Equation 2.1.
M{t} = ∑ (Ta-To) ∆t Equation 2.1
where M{t} = Maturity as defined by the temperature-time factor at age t (degree-
days or degree-hours)
∆t = Time interval (days or hours)
Ta = Average temperature of concrete over time interval ∆t (°C)
To = Datum temperature (°C)
Equation 2.1, also known as the Nurse-Saul function, defines the value of maturity as the
total area under time-temperature history curves of the concrete. Saul is credited for recognizing
that during early ages, temperature has a greater effect on strength development while time has the
greater effect at later ages, and that ultimately maturity is an approximation. Carino et al. [28-30]
concluded that some form of a rate constant-temperature function is needed to describe the
combined effect of time and temperature on strength development for a specific concrete mix. A
detailed procedure that relates maturity and strength was later implemented in ASTM C1074-11
[31]. The specification uses the linear hyperbolic function (Equation 2.2), to correlate the
asymptotic relation between strength and the age of the concrete mixture. Activation energy is then
determined using Equation 2.2 and 2.3.
Equation 2.2

8
where S = Average compressive strength at age t (MPa)
t = Test age (days)
Su = Limiting strength (MPa)
k = Rate constant or rate of reaction (days-1)
to = Age at which strength development is assumed to begin (days)
k T Aexp Equation 2.3
where k = Rate of reaction (day-1)
A = Frequency factor (day-1)
Ea = Activation energy (kJ/mol)
R = Universal gas constant [8.314 J/ (mol•K)]
T = Curing temperature (kelvin)
The hyperbolic function provides a good fit while maintaining the profile of the actual
strength data. Overall, the procedure outlined in ASTM C1074-11 [31] is straight forward, but its
inconsistency is often cited as a liability. In addition, initial research pertaining to development of
this method only considered ASTM Type I cement. ASTM C1074 appears to be too vague in terms
of when strength measurements should start for each temperature or for that matter when should
initial measurement be made for cements of different composition or different classifications.
Similarly, the parameter to in the hyperbolic expression indicates that the period of gradual strength
development during setting is not considered. The assumption of zero strength gain is cited as a
limitation of the hyperbolic function in modeling the hydration behavior of concrete [19, 20, 35,
36]. Carino also indicated that the hyperbolic function was limited to strength predictions up to
28-day equivalent ages. As a result, an exponential function was proposed.
The exponential function [19, 21, 28-30] is presented in Equation 2.4. It is also known as
the “exponential method” and is often used in lieu of a hyperbolic function to describe the
relationship between the rate of strength gain, the curing time, and the curing temperature. This
idea is not new but rather follows the function proposed by Hansen and Pedersen [37] (Equation

9
2.5), an empirical alternative to the hyperbolic equation relating strength development and
maturity.
S = Su or S = Su Equation 2.4
where S = Average compressive strength at age t (MPa)
t = Test age (days)
Su = Limiting strength (MPa)
τ = Time constant (days)
α or β = Shape parameters, (dimensionless)
S = Equation 2.5
where S = Strength at a given age (MPa)
= Limiting strength (MPa)
M = Maturity (Time-°C)
τ = Characteristic time constant (time)
a = Shape parameter (dimensionless)
According to Schindler and Poole, Equation 2.4 can model the gradual strength
development during the setting period and provides a better understanding of the hydration process
in a cementitious system, as it is not dependent on the setting time, to, as in the case of the
hyperbolic function. Carino [30] showed that the hyperbolic and the exponential models fit data
well and the curves were indistinguishable up to 28 days.
The maturity method is used extensively to estimate in-place strength of concrete. ASTM
C1074-11 [31] provides two maturity functions, which allow the conversion of maturity index
from reference temperatures to different curing conditions. It was suggested [28-30] that traditional
maturity defined by the Nurse-Saul function (Equation 2.1) was accurate only over some limited
temperature range. The second function, which is based on the Arrhenius concept, has been
considered to be more scientifically accurate as it makes use of the mixture's activation energy,
which is determined using at least 3 curing temperatures. The above conclusions on both maturity

10
functions were made based on observed deviations between actual strength development and that
predicted by the Nurse-Saul relationship.
The principle of Nurse-Saul implies that mixtures with the same value of maturity will
have the same strength irrespective of temperature. In other words, only a horizontal shift in
strength data should be observed; however, in some mixtures there is an additional vertical shift,
which results in an intersection of the strength curves for the same concrete mix cured at different
temperatures. The phenomenon is known as the “cross-over effect” [19, 28-30]. The underlying
factor responsible for this behavior was identified as the temperature [22, 23]. Pinto et al. [38]
stipulated that in some mixtures, lower curing temperatures often led to higher later age strength,
and vice versa.
There are many explanations provided in the literature on the cross-over effect. In general,
there is agreement that strength development of cements depends on the capillary porosity or
degree of space filling as well as the uniformity of the developed microstructure. Verbeck et al.
[39] suggested that there is a strong relationship between strength gain, capillary porosity, and the
uniformity of the distribution of the hydration products within the microstructure of the paste. It
was ultimately illustrated that the cross-over effect exists due to the increase in temperature.
Moreover, it was indicated that while an increase of hydration temperature would increase the
initial rate of hydration and therefore contribute to early hydration and early strength gain, the
opposite is true at later ages.. The formed hydration products will, in effect, make it more difficult
for hydration to proceed at later ages, which may explain the decrease in ultimate strength. These
conclusions were based on tests conducted over temperature ranges from 4.4°C to 110°C (40°F to
230°F) for 28 days.
Review of the literature indicates that there are several aspects of concrete properties that
are influenced by fineness and phase composition of portland cements. The most prominent trend
is that an increase in cement fineness increases the rate of hydration (as more surface area becomes
available for the reaction [40]), which consequently results in a higher rate of strength gain. It is
further indicated that fineness affects heat of hydration. The effect is more pronounced at early
ages where temperature rise is very critical [17, 41, 42]. Additionally, the trend was consistent
regardless of the curing temperature.
The primary focus of this study was to establish the effect of fineness on heat of hydration
of portland cements with a wide range of composition. In examining the contribution of fineness

11
to heat of hydration, different methods of heat measurement were implemented to document the
effectiveness of different methods in correlating fineness and cement mineralogy to heat of
hydration.

12
CHAPTER 3: METHODOLOGY
This chapter presents the experimental techniques and methodology implemented in
satisfying the objectives of this research.
3.1 Materials
Several cement producers were contacted in an effort to acquire portland cements in
sufficient quantities and with varied mineralogical composition to successfully accomplish the
different project tasks. The objective was to work with different suppliers that could provide the
same cement source (clinker) processed to different grinds to ensure the ability to study cement
fineness effects while maintaining the same or similar cement composition. Initially, 9 cements
were obtained from 4 different sources. The first three sources provided 2 grinds per single cement
source, and these cements were labeled AC02, AC03, ZR02, ZR03, LG01, and LG03. The fourth
source provided 3 different grinds of the same cement, labeled CLEP, CL02, and CL03, but the
quantities were limited, preventing a full round of testing . After initial testing, it was decided to
add 2 more cements in an attempt to widen the mineralogical range of the cements tested, and
these were labeled CHC and ERD06.
The cements used in this study, with the objective of assessing the effect of fineness and
cement mineralogical composition, were selected to reflect a wide range in Blaine fineness, about
200 m2/kg, and a substantial variation in tricalcium aluminate and tricalcium silicate contents.
Emphasis on these two phases is due to the fact that cement heat of hydration is primarily affected
by the tricalcium phases’ contents. Careful consideration was made in selecting the cements in
order to isolate these effects. Each set of cements had similar compositions, but different fineness.
The as-received cements conformed to ASTM C150-12 “Standard Specification for Portland
Cement Classification” [4] and the identical American Association of State Highway and
Transportation Officials (AASHTO) M85-12.
The sand used in this study for mortar mixtures preparation and as a reference material in
the isothermal calorimeter was obtained from U.S. Silica Company, 701 Boyce Memorial Drive,
Ottawa, Illinois 61350. The Ottawa Sand is finely graded sand conforming to ASTM C778-13
“Standard Specification for Standard Sand” [43]. Sand properties are presented in Appendix A.

13
Distilled water was used for all mixtures. Additionally, all specimens were cured in
saturated lime solution using 98% extra pure calcium hydroxide. This was done to eliminate
leaching of calcium hydroxide from the hydrated paste during extended curing periods, especially
at high curing temperatures.
3.2 Oxide Chemical Analysis and Density Measurements of As-Received Cements
Oxide chemical analysis of the as-received cements was conducted using x-ray
fluorescence spectroscopy (XRF) and performed by a certified commercial laboratory (CCL)
according to ASTM C114-13 [44]. XRF was used for elemental oxide quantification. ASTM
C150-12 [4] was used to determine potential mineralogical composition. The density
measurements for all of the as-received cements were conducted in accordance to ASTM C188-
09 [45].
3.3 Mineralogical Analysis of Cements
Apart from the bulk elemental oxide analysis, the phase content of portland cement is of
great significance. It is understood that different cement phases have different contributions to
concrete properties. Stutzman [46] suggested that the application of accurate measurement
techniques for cement phase quantification would improve the knowledge of their influences on
cement hydration characteristics, concrete strength development, and durability of structures.
Additionally, it renders concrete as a more predictable construction material. X-ray diffraction
(XRD) is a direct method of identification and quantification of the crystalline compounds in
portland cements [47-49]. In this study, quantitative x-ray diffraction was adopted in identifying
and quantifying crystalline phases present in all the cements used.
XRD scans of as- received cements were collected in accordance with ASTM C1365-06
(Reapproved 2011) “Standard Test Method for Determination of the Proportion of Phases in
Portland Cement and Portland-Cement Clinker Using X-ray Powder Diffraction Analysis" [50].
Mixtures of cement and ethanol 200 (99.5% pure) were prepared and wet ground in a McCrone
micronizing mill to an average particle size between 1 and 10 micrometers. The wet grinding
method was used to avoid the effect of temperature on gypsum and its possible phase
transformation to hemihydrate or anhydrite. The samples were then dried at 43°C using a Buchner
funnel and were later stored in desiccators to assist in the evaporation of ethanol and eliminate

14
possible hydration problems. After drying, the samples were placed in a sample holder and
compressed to provide a smooth and flat surface for XRD measurements. A Phillips X’Pert
PW3040 Pro diffractometer using Cu Kα radiation was used in collecting the scans. The samples
were scanned with a step size of 0.02 degrees per step and a counting time of 4 seconds per step.
The tension and current were set at 45 kV and 40 mA. The divergence slit was fixed at 1, the
receiving slit had a height of 0.2 mm, and the anti-scatter slit was fixed at 1. Rietveld refinement
was utilized for phase quantification of the as-received cements. The Rietveld method is a full-
pattern analysis method that uses a complex mathematical algorithm [51]. Duplicated tests were
conducted on each sample and the average was reported.
Quantification of cement phase composition presents a number of challenges. Although
the presence of the four major phases (C3S, C2S, C3A and C4AF) in the sample is guaranteed
together with some form of calcium sulfate, the major peaks for these phases suffer from peak
overlap. This overlap makes it difficult to determine the individual peak heights and positions,
making identification of the correct crystal structure complicated for constituents that can be
present in more than one crystalline form. For example, C3S has monoclinic polymorphs, and C3A
has a cubic and orthorhombic form. In addition, cements contain a number of minor phases, such
as alkali sulfates, periclase, and free lime that are present in small quantities, making their detection
by x-ray diffraction analysis rather challenging.
In order to aid the identification of the minor phases as well as the C3S and C3A crystal
structures, selective dissolutions of the major phases (extractions) were performed for all cements.
Salicylic acid/methanol (SAM) extraction dissolves the silicates and free lime leaving a residue of
aluminates, ferrites, and minor phases, such as periclase, carbonates, alkali sulfates and double
alkali sulfates [47, 52]. X-ray diffraction scans of the SAM extraction residues were collected for
all the cements used in this study. In addition to minor phase identification, SAM residues were
used to determine the presence of the C3A polymorph. Tricalcium aluminate can be present in
cement either in cubic or orthorhombic form or a combination of both. Although the XRD patterns
of cubic and orthorhombic C3A are very similar, orthorhombic C3A does not have a peak at 2θ of
21.8˚. In addition, cubic C3A has only one peak at 2θ of 33.3˚, while orthorhombic C3A has two
peaks in this angular range, one at 2θ of 32.9˚ and another at 2θ of 33.2˚ [47, 53]. By observing
15
the 21.8 2θ angle for cubic C3A and 32.9 2θ angle for orthorhombic C3A, it was determined that
the cements contained only cubic C3A.
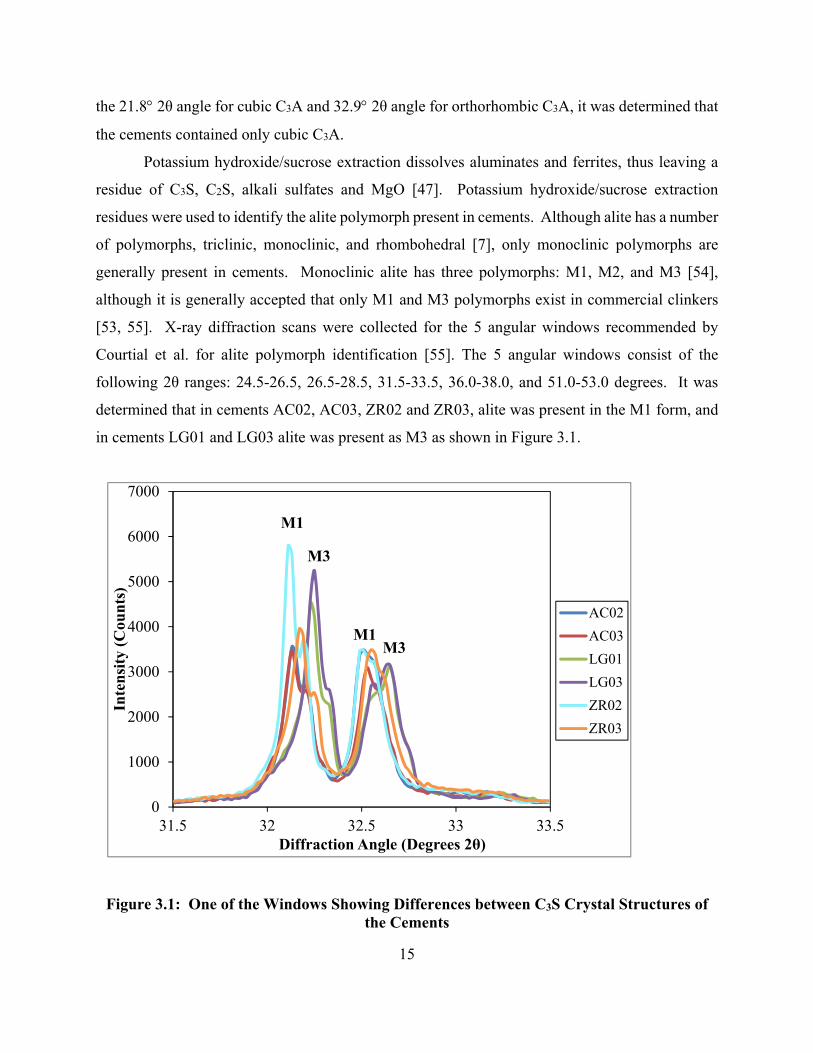
Potassium hydroxide/sucrose extraction dissolves aluminates and ferrites, thus leaving a
residue of C3S, C2S, alkali sulfates and MgO [47]. Potassium hydroxide/sucrose extraction
residues were used to identify the alite polymorph present in cements. Although alite has a number
of polymorphs, triclinic, monoclinic, and rhombohedral [7], only monoclinic polymorphs are
generally present in cements. Monoclinic alite has three polymorphs: M1, M2, and M3 [54],
although it is generally accepted that only M1 and M3 polymorphs exist in commercial clinkers
[53, 55]. X-ray diffraction scans were collected for the 5 angular windows recommended by
Courtial et al. for alite polymorph identification [55]. The 5 angular windows consist of the
following 2θ ranges: 24.5-26.5, 26.5-28.5, 31.5-33.5, 36.0-38.0, and 51.0-53.0 degrees. It was
determined that in cements AC02, AC03, ZR02 and ZR03, alite was present in the M1 form, and
in cements LG01 and LG03 alite was present as M3 as shown in Figure 3.1.
Figure 3.1: One of the Windows Showing Differences between C3S Crystal Structures of the Cements
0
1000
2000
3000
4000
5000
6000
7000
31.5 32 32.5 33 33.5
Inte
nsi
ty (
Cou
nts
)
Diffraction Angle (Degrees 2θ)
AC02
AC03
LG01
LG03
ZR02
ZR03
M3
M3
M1
M1

16
In addition, both the M1 and M3 polymorphs can have either a regular unit cell or a
superstructure unit cell, the superstructure cell being significantly larger than the regular cell [55].
Since the larger superstructure is going to have additional reflections, the presence of extra peaks
in these windows identifies the presence of a superstructure unit cell. Based on observing the peak
shapes for the cements with the M1 polymorph (AC02, AC03, ZR02 and ZR03), it was concluded
that M1 has a regular unit cell in all these cements. The presence of extra peaks for the LG01 and
LG03 cements indicate that M3 alite in these cements has a superstructure cell.
Rietveld refinement is a well-established technique for cement phase quantification.
Quantitative analysis via the Rietveld method is based on the assumption that all the phases present
in the samples have been identified and included in the analysis and that all the phases are
crystalline. The accuracy of the analysis depends on how true these assumptions are for a
particular sample. In multiphase materials suffering from peak overlap, like cements and clinkers,
it is often challenging to identify minor phases that may be present in amounts of 1-2% or less.
When the minor phases are excluded from the analysis or when amorphous material is present, the
weights of the identified phases are normalized to 100%, which can lead to overestimation. Even
though identification of the minor phases can be aided by performing selective dissolutions, as
Chung pointed out, “even when all the peaks in the x-ray diffraction pattern are accounted for, one
is still not sure whether there is any amorphous material present” [56]. This is particularly true of
cements since some researchers have reported a significant amount of unidentified/amorphous
material [57] while others found no amorphous material [58].
Because of the possibility of overestimation of the cement phase composition by the
Rietveld analysis, a C3S calibration curve was established, using internal standard analysis, in
order to confirm the results of Rietveld refinement with respect to the alite content of the cement.
Since alite usually constitutes at least half of the total mass of Types I, II and III portland cements,
it is plausible that the effect of overestimation would be most evident in the quantification of this
phase.
Internal standard analysis is based on the principle that the peak intensity of a phase,
determined either as peak height or peak area, is directly proportional to the amount of this phase
in the sample, as described by the following equation:

17
Equation 3.1
where Iij = Intensity of peak i of phase j,
Iks = Intensity of peak k of the internal standard,
xj = Weight fraction of phase j,
xs = Weight fraction of the internal standard, and
K = A constant [59].
The advantage of the single-peak internal standard analysis is that quantification of the
phase of interest is not affected by any other phases present in the sample, meaning that unlike
Rietveld analysis, it is not affected by unidentified or amorphous content.
The alite calibration curve was prepared by mixing samples of known C3S content with
10% of internal standard by total weight of sample following the general procedures described by
Klug and Alexander [59]. Titanium dioxide (TiO2) obtained from the National Institute of
Standards and Technology (NIST) as part of the Standard Reference Material (SRM) 674b set was
selected as an internal standard. TiO2 was selected for two reasons: it has a mass absorption
coefficient (MAC) close to that of cements, and most of the TiO2 diffraction peaks do not interfere
with the major peaks of portland cement.
Standard reference clinkers SRM 2686a, SRM 2687and SRM 2688 were obtained from
NIST and were used as a source of C3S for the standardization mixtures. These clinkers have
certified phase compositions and are representative of the modern-day clinkers produced by the
cement industry. The clinkers were first ground with a mortar and pestle to reduce the particle
size to below 45 microns and then ground in the McCrone micronizing mill for 10 minutes with
ethanol prior to collecting x-ray diffraction scans.
After observing 5 angular alite windows for these clinkers as described previously, it was
determined that SRM 2688 contained the M1 alite polymorph and was suitable for the preparation
of the M1-C3S calibration curve. SRM 2688 contains 64.95% of alite. Ground SRM 2688 was
mixed with 10% TiO2 to produce the 65% point on the calibration curve. In order to produce the
40 and 50% points for the calibration curve, SRM 2688 was diluted with C3A in order to achieve
the required alite content. Alite content of the sample was calculated for the SRM 2688/C3A
mixture excluding the TiO2 addition.

18
The samples were mixed in the McCrone micronizing mill for 10 minutes with 5 mL of
ethanol per every gram of sample as recommended by ASTM C1365-06 (Reapproved 2011) [50].
This was done to achieve homogeneous dispersion of the internal standard throughout the sample.
After mixing, the sample was dried in an oven at 40°C in order to evaporate the ethanol. Samples
were loaded into the sample holder using the back-loading technique and scanned using the
settings described previously. Three samples were analyzed for each point on the calibration
curve.
The diffraction pattern collected for each sample was analyzed with HighScore Plus
software in order to determine the areas of the 51.8 2θ peak of alite and the 54.3 2θ peak of TiO2.
The area ratios of the alite peak to the TiO2 peak were plotted against the alite content of the sample
fraction excluding TiO2 as shown in Figure 3.2. Subsequently, ground cements were mixed with
10% TiO2 to determine the area ratios in the as-received cements.
Figure 3.2: Internal Standard Calibration Curve for M1 Alite Polymorph
3.4 Particle Size Analysis for Portland Cements
The last step in manufacturing portland cement involves grinding of portland cement
clinker with calcium sulfate or one of its hydrates. The product of this grinding stage is known as
y = 0.0269xR² = 0.9693
0
0.2
0.4
0.6
0.8
1
1.2
1.4
1.6
1.8
2
0.0 20.0 40.0 60.0 80.0
Are
a R
atio
Alite Content of Sample (w/o)
SRM2688
Linear (SRM2688)

19
portland cement. The fineness to which cement is ground has a significant effect on the behavior
of cement, especially during the early stages of hydration [60]. For cements, there are two basic
measures of fineness; namely, Blaine (air permeability) and Turbidimetry. Blaine fineness was
used in this study. It is an indirect measure of the total surface area of each cement sample and can
be determined by the air permeability apparatus according to ASTM C204-11 “Standard Test
Method for Fineness of Hydraulic Cement by Air Permeability Apparatus” [61].
Prior to conducting Blaine fineness measurements on the as-received cements, the air-
permeability apparatus was calibrated in accordance with ASTM C204-11 section 4 [61]. A sample
bed of standard cement SRM 114 obtained from the National Institute of Standards and
Technology (NIST) was used. The calibration was run at 21.1°C (70°F) and a relative humidity of
61%. Using the same settings, Blaine fineness for the as-received cements was quantified using
triplicate trials as indicated in the specifications. The results satisfied the bias and precision of the
test standard. While the method is widely used in the cement industry for quality control, it offers
some drawbacks. For example, a single averaged value may be given to two cements with different
proportion of fines; that is, two different cements having the same surface area can give the same
Blaine value even though they have very different particle size distributions (PSD) [62, 63]. In
contrast, particle size distribution measurements provide more accurate insight on the quality and
grading of the cement [63].
PSD measurement describes the frequency and size of particles contained in a sample [64].
Typical particle sizes in portland cement vary from <1 μm to 100 μm in diameter [62]. Particle
size influences the hydration rate and strength; it is also a valuable indicator for predicting cement
quality and performance [65, 66]. The characterization of the particles of the as-received cements
was conducted using the principle of laser diffraction. That is, a particle will scatter light at an
angle determined by its particle size. The angle of scattering increases as the particle size
decreases; this method is particularly effective in the particle size range of 0.1 to 3,000 μm [64].
An LA-950 laser scattering particle size analyzer manufactured by HORIBA Instruments was used
to analyze the particle size distribution of the cements. The instrument has the capacity to measure
wet and dry samples in the range of 10 nm to 3 mm.
Sample preparation was conducted per manufacturer procedures. An adequate amount of
dry cement was homogenized by mechanical agitation through the flow cell of the instrument at
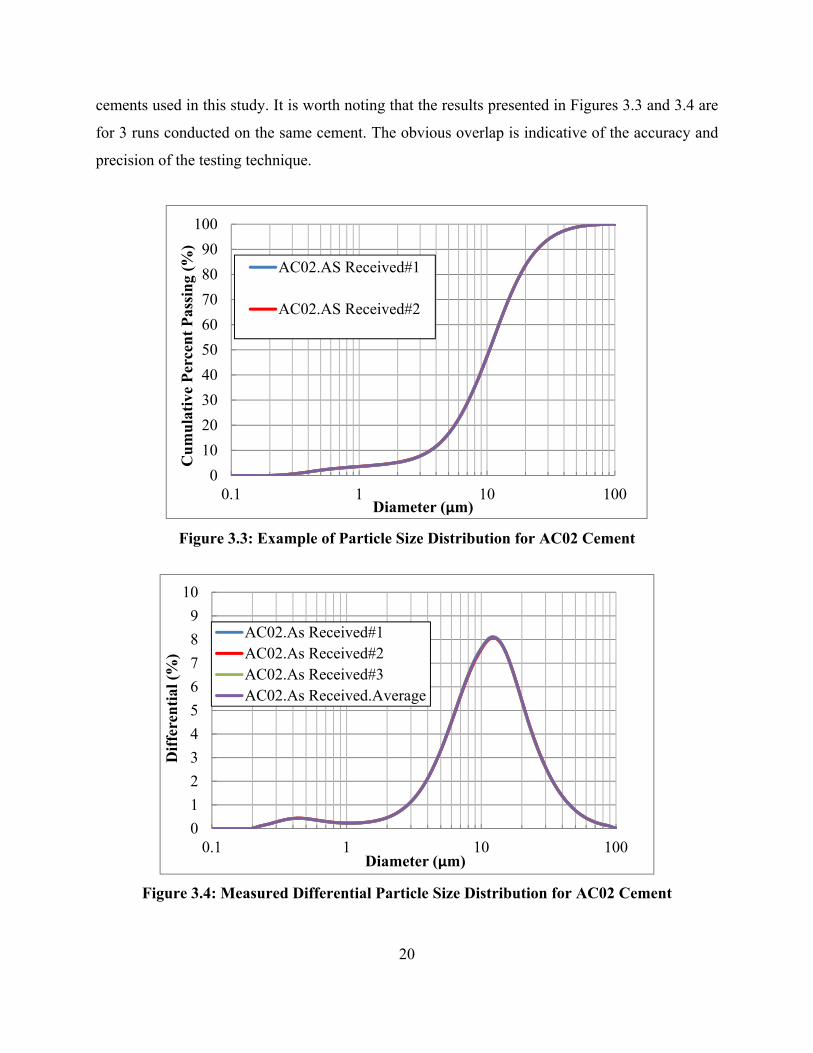
the start of measurement [65]. Figure 3.3 and 3.4 depict examples of data collected for one of the
20
cements used in this study. It is worth noting that the results presented in Figures 3.3 and 3.4 are
for 3 runs conducted on the same cement. The obvious overlap is indicative of the accuracy and
precision of the testing technique.
Figure 3.3: Example of Particle Size Distribution for AC02 Cement
Figure 3.4: Measured Differential Particle Size Distribution for AC02 Cement
0
10
20
30
40
50
60
70
80
90
100
0.1 1 10 100
Cu
mu
lati
ve P
erce
nt
Pas
sin
g (%
)
Diameter (µm)
AC02.AS Received#1
AC02.AS Received#2
0
1
2
3
4
5
6
7
8
9
10
0.1 1 10 100
Dif
fere
nti
al (
%)
Diameter (µm)
AC02.As Received#1AC02.As Received#2AC02.As Received#3AC02.As Received.Average

21
The expressions of PSD results are based on a volume distribution using measures of D10,
D50, and D90 (under size %) which identify the 10th, 50th, and 90th percentiles below a given
particle diameter [12]. D50 is also defined as the median size; that is, the size that splits the size
distribution with half above and half below the specified diameter. Similar to the concept of
average, the mean size or mean particle size (MPS) expresses the volume mean as an average of
D10, D50, and D90 [66]. In other words, MPS provides an approximation of the central point of the
particle size distribution of an entire sample on volume basis [12, 65, 66]. Triplicate tests were
conducted on all as-received cements and averages of the 3 tests were reported.
3.5 Heat of Hydration Measurements
In this study, two techniques were used to measure the heat of hydration of portland
cements; namely, isothermal conduction calorimeter and the heat of solution method. TAM Air,
an 8-channel isothermal heat conduction calorimeter by TA Instruments, was used for heat flow
measurements (Figure 3.4). Measurements were conducted according to ASTM C1072-13
“Standard Test Method for Measurement of Heat of Hydration of Hydraulic Cementitious
Materials Using Isothermal Conduction Calorimetry” internal mixing protocol [10]. The
calorimeter has an operating temperature range of 5 to 90°C. The calorimetric channels are of twin
type, consisting of a sample and a reference vessel, each with a volume of 20 ml. As shown in
Figure 3.5, the channels that are labeled “A” were used for actual mixtures while the “B” channels
contained the reference material. The thermostat uses circulating air with advanced temperature
regulating system to maintain the temperature very stable within ± 0.02°C. The temperature change
between the sample and the surroundings (kept at constant temperature) results in heat flow [67].
This is the heat that was monitored continuously. The high accuracy and stability of the thermostat
makes the calorimeter well suited for heat flow measurements over extended periods of time [68].
Built-in calibration heaters were used for calibration of the calorimetric units and general
performance testing. Calibration tests are performed on a regular basis following manufacturer
directions. Pico LogTM, which is a commercial software package, was used for data collection
and analysis.

22
Figure 3.5: Profiles of Twin-Channel Isothermal Calorimeter (TAM Air)
Paste samples were prepared using 3.3007 grams of cement mixed with 1.650 grams of
water. A fixed water-to-cement ratio (w/c) of 0.5 was maintained for all the mixtures to ensure
proper mixing for cements, especially those that have a high tricalcium silicate or aluminate
content or a high fineness. Several w/c ratios were experimented with, and it was concluded that
0.5 was appropriate for all cements used here [69]. The objective was to use a ratio that can provide
adequate paste mixing using the internal mixing protocol while maintaining a constant w/c ratio
for all cements. A mass of 12.33 grams of Ottawa sand was placed in the reference cell as the inert
sample during testing as well. The weight of the sand used in the reference cell is based on the
equivalent heat capacity of the paste mixture. In addition, the same amount of reference material
was used in the gain calibration of the calorimeter. The dry cement was loaded into an ampoule
(Figure 3.6). The ampoule contained a stirring fixture and a syringe that was loaded with the
appropriate amount of water to achieve the desired w/c ratio. The ampoule was then positioned in
a channel or a compartment of TAM Air maintained at the desired testing temperature of 23 C.
Figure 3.6 also shows the typical configuration of the ampoule and 20 ml glass with dry sample
inside the calorimeter. When the system reached the desired temperature, water was added using
the syringe. The mixture was stirred inside the calorimeter constantly for 60 seconds. Due to the
exothermic nature of cement hydration, heat is released once water touches cement [68].
Consequently, internal mixing was used as it provided the ability to record the heat of hydration
of cements right from the instant of mixing water with cement. The rate of heat production was

23
continuously monitored for a period of 7 days. All heat of hydration values reported here are based
on the average values collected for duplicate runs.
Figure 3.6: Ampoule and Typical Ampoule-Glass Container Configuration
The isothermal calorimeter used in this study has eight twin channels that partially share
the same heat sink; evidently, there is a possibility that thermal power in one channel might
possibly affect the power in neighboring channels. Wadsö [70] indicated that this might occur
when two adjacent channels have a significant difference in thermal power, or if a sample is at a
significantly different temperature than the calorimeter when it is inserted into the calorimeter.
Thus, efforts were made to minimize this effect by allowing the system to equilibrate once the
sample was inserted and initiating water injection only after the system had stabilized. It is worth
noting that all duplicate runs had less than 1% heat deviation at 1, 3 and 7 days. Heat evolution
and cumulative heat of hydration were normalized to the original mass of the anhydrous cement
in the mixture.
3.6 Setting Time
The gradual stiffening or increase in rigidity of freshly mixed concrete is commonly
referred to as setting. Cement chemistry, temperature, fineness, and water-to-cement ratio are
among the important factors that affect concrete setting time. Although setting is caused primarily
by the chemical reaction between cement and water, the setting time of concrete or mortar does
not correspond to the setting time of its cement component [62]. The initial and final setting times

24
of concrete are defined arbitrarily by the test method ASTM C403-08 “Standard Test Method for
Time of Setting of Concrete Mixtures by Penetration Resistance” [71]. In general, the initial and
final set points indicate loss of flow and the ability to sustain load for a given mix [60]. According
to Dodson [72], time of setting is a critical period where concrete is vulnerable to environmental
influences. In fact, setting time dictates appropriate times for placement, compaction, finishing, or
loading of the concrete. Initial set and final set times for mortar mixes were measured using
procedures outlined in ASTM C403-08 [71]. The time of setting was determined for the as-
received cements at three temperatures; namely, 23°C, 30°C, and 40°C. A water-to-cement ratio
(w/c) of 0.485 and a sand-to-cement ratio of 2.75 were used for mortar mixtures used in
compressive strength measurements. The mortar raw materials were preconditioned to match the
curing temperatures. The mixing procedures followed were those given in ASTM C305-13
“Standard Practice for Mechanical Mixing of Hydraulic Cement Pastes and Mortars of Plastic
Consistency” [73]. Exceptions were made at 40°C because it was difficult to maintain the room
temperature at 40°C. In addition, the penetration resistance measurements were conducted at the
corresponding temperatures except for 40°C. However, mixtures were kept at their respective
temperatures between measurements by placing the test containers in an oven set at the test
temperature. Precautions were taken to minimize the time between removing and returning the
specimen to the curing chamber.
Initial and final setting times were marked at 500 psi (3.5 MPa) and at 4000 psi (27.6 MPa),
respectively, per ASTM C403-08 [71]. The setting times were calculated from linear interpolation
of the penetration resistance versus elapsed time. Duplicate runs were conducted on all cement
mortar mixtures, and the averages of the two tests were reported. Even though setting times do not
reflect the actual compressive strength at those arbitrary points, they were used to determine the
initial compressive strength testing age for mortar cubes used in the activation energy
determination per specification requirements [31].
3.7 Mortar Strength Measurements
Mortar cubes were proportioned according to ASTM C109-13 “Standard Test Method for
Compressive Strength of Hydraulic Cement Mortars” [74]. Mortars were made with a w/c of 0.485
and a sand-to-cement ratio of 2.75. Distilled water was used for all mixtures. Mortar cubes were
mixed according to ASTM C305-13 [73]. The cubes were then cured in saturated lime solution

25
baths maintained at 3 different temperatures (22, 30, and 40°C) in accordance to Annex A.1 of the
ASTM C1074-11 [31] “Standard Practice for Estimating Concrete Strength by Maturity Method”.
A Blue M Magni Whirl 1120A-1 constant temperature bath with an agitation system was used in
curing mortar cubes. The motion of the agitator provided gentle circulation throughout the bath to
maintain constant curing temperature. The compressive strength was determined per ASTM C109-
13 [74] using an MTS 809 Axial/Torsional Test System. The strength was determined at a constant
loading rate per specifications. Strength averages were reported accordingly and checked against
the precision and bias of the testing method. For this study, any deviation of more than 6% within
a strength test average prompted reruns of that test. Average strengths were determined for at least
2 runs at each curing temperature for the selected cement, and the results were used for activation
energy determination.
3.8 Activation Energy
ASTM C1074-11 [31] procedures were used in determining the activation energies for six
of the cements studied, namely AC02, AC03, ZR02, ZR03, LG01, and LG03. These were the
cements that were supplied in enough quantities to conduct the extensive testing matrix required
to determine the activation energy. The data were analyzed using hyperbolic and exponential
functions on mortar cube strength data collected at the three temperatures of 22, 30 and 40C.
Microsoft Excel solver was used to determine the necessary parameters in both functions. Each
strength data point represents the average of three mortar cube strength tests. The initial testing
age for each mix at each temperature was dictated by the setting tests per ASTM C1074 protocol.
3.9 Restrained Shrinkage Measurements
The effect of cement fineness on the potential of concrete and mortar to crack under
restrained shrinkage conditions was also addressed in this study. Two cements were used here,
AC02 and AC03. The mix proportions used are presented in Table 3.1. Three ring specimens were
prepared for each cement and the average values reported in the next chapter.

26
Table 3.1: Mix Proportions for Restrained Shrinkage Test
Material Weight (lb)
Cement 9.0
Ottawa sand 24.75
Distilled water 4.365
w/c 0.485
Mortar flow 118
Mortar Density 2.14 g/cm3
Two strain gauges were placed diametrically, in each ring, for strain measurements. The
specimens were cured for 24 hours using wet burlap followed by air-drying. The flow and density
reported in Table 3.1 were for both cement mixes. In addressing the effect of w/c on restrained
shrinkage potential of a particular cement, additional tests were conducted at a lower w/c ratio of
0.45.

27
CHAPTER 4: RESULTS AND DISCUSSION
4.1 Introduction
The experimental data and discussion of the observed trends are presented in this chapter.
First, the properties and characteristics of the as-received cements are presented. The
characterization techniques entail chemical, mineralogical, and physical tests. Following that, heat
of hydration data are presented and correlated to cement characteristics. Next, the activation
energies determined through mortar strength testing are presented and analyzed. Finally, the effect
of cement particle fineness on restrained shrinkage and kinetics are addressed.
4.2 Chemical Characterization of As-Received Cements
As the purpose of this study was to assess the effects of cement fineness on heat of
hydration of portland cements, it was critical to select cements of the same mineralogical
composition, but of different grinds. Cements with two different grinds were obtained from each
of three cement producers. Cements from the same producer had similar mineralogy, but were
ground to different fineness. These 6 cements from 3 different producers were available in
sufficient quantities to satisfy the requirements of the desired testing protocol. These cements were
coded ZR (ZR02 and ZR03), AC (AC02 and AC03), and LG (LG01 and LG03). Cements were
obtained from an additional supplier, CLE (CLEP, CLE02, CLE03), but the amounts made
available were insufficient for all the planned testing. After initial testing, it was decided to expand
the range of cement mineralogy evaluated for this study. Two additional single-grind cements,
designated CHC and ERD06, were obtained, but the available quantities were insufficient for all
the planned testing.
The oxide chemical compositions, in weight percent (w/o), of the as-received cements are
presented in Table 4.1. Table 4.2 presents the potential phases in addition to the heat index
currently used in the specifications to assess the potential of portland cements to generate heat on
hydration. No corrections were made for possible additions. Typically, MH cements with a heat
index of less or equal to 90 do not have to be subjected to the maximum fineness requirement of
430 m2/kg (Blaine fineness). The data depicted in both tables indicate that the cements have a wide
range of alkali contents (0.25-1.13 Na2Oeq), SO3/Al2O3 ratio (0.45-0.85), tricalcium silicate (47-
65), and tricalcium aluminate (5-11). The heat indices reported for the cements also indicate a wide
range from a low of 83 to a high of 101. Note that, among the cements studied, the ZR cements

28
and the CHC cement had the highest LOI values. LG cements had the highest alkali and sulfate
content, while CLE cements had the lowest alkali and sulfate content.
The calculated potential phase contents, in weight percent (w/o), determined from Bogue
equations are listed in Table 4.2 where it can be seen that the cements had a wide range of phase
contents: C3S = 47-65, C2S = 7–20, C3A = 5–11, and C4AF = 8-12. Tricalcium silicates and
aluminates are known for their significant effect on the amount of heat generated by a portland
cement. This is why the heat index expression in current standard specifications incorporates only
those two phases. Accordingly, it would be expected that cements with the highest heat index
would have the highest heat of hydration. However, there is not necessarily a direct correlation
between the heat index and the heat of hydration determined by the heat of solution method (ASTM
C186). This can be seen by comparing heat index values (C3S+4.75C3A) in Table 4.2 with the heat
of hydration values determined per ASTM C186-05 [8], shown in Table 4.3. For example,
comparing the data for cements CLE03, CHC, ZR03, and LG03, it can be seen that these cements
had a wide range of heat indices, ranging from 83 to 101. However, these cements had about the
same 28-day heat of hydration values, 387 kJ/kg (+/- 1). At 7 days, the cement with the lowest
heat index of 83 (CLE03) had a heat value of 366 kJ/kg (87.4 cal/g) which exceeds the 80 cal/g
value listed as the maximum HOH for cements with Heat Indices of ≤ 100 in ASTM C150-12 [4].
The AC02 cement had a heat index of 91 and a HOH of 349 kJ/kg (83.4 cal/g), while cement ER06
had a heat index of 90 and HOH of 382 kJ/kg (91.3 cal/g). According to specifications, cement
ER06 was not required to satisfy the fineness limit of 4300 m2/kg since its heat index was 90. Also,
cement AC03, with a heat index of 89 did not have a fineness requirement though its HOH was
370 kJ/kg (88.4 cal/g), which was also above the 80 cal/g value. While the LG cements tested
would not be classified as Type II cements or Type II (MH) due to their high C3A contents, they
are valuable for comparison purposes.
Figure 4.1 shows the 7-day heat of hydration measured by the solution method plotted
against the heat index. The best linear fit determined using the data collected here indicates that
for a heat index of 100, cement heat of hydration is 376 kJ/kg (89.9 cal/g) and for a heat index of
90, cement heat of hydration would be about 357 kJ/kg (85.3 cal/g). This finding is not in
agreement with the data analysis conducted on CCRL cements [2]. A possible explanation is
CCRL cements might not be similar to the currently produced portland cements, which have
considerably higher fineness values.
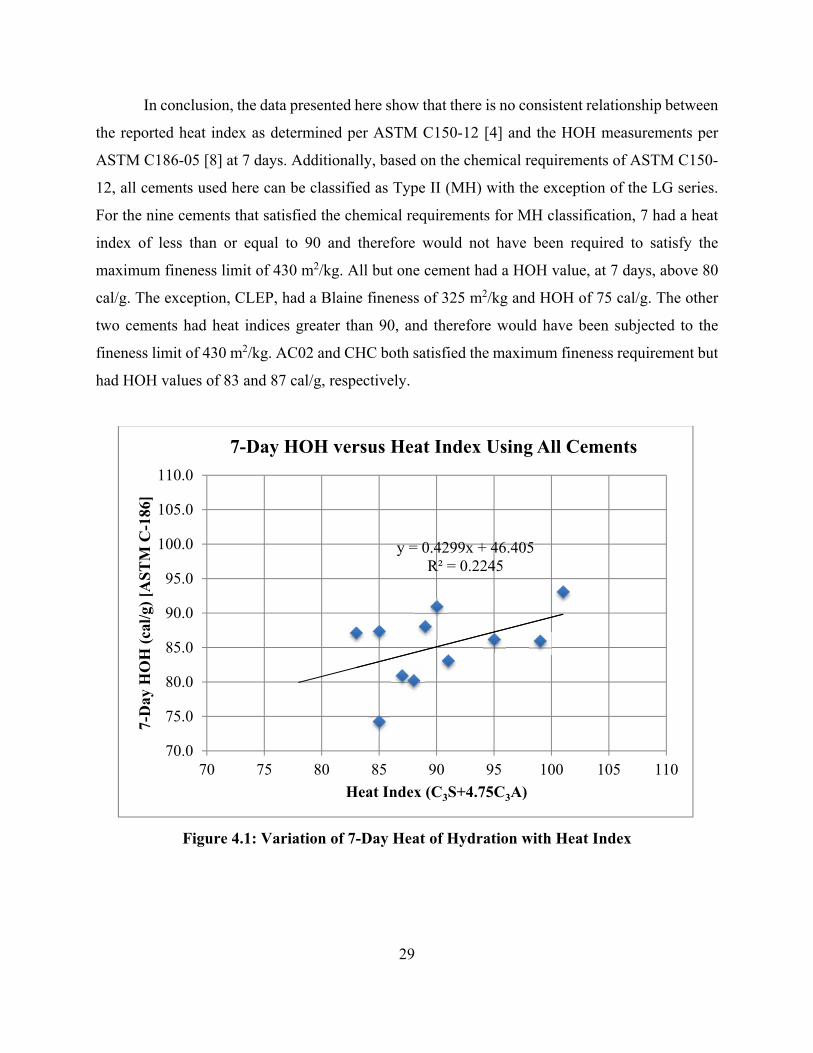
29
In conclusion, the data presented here show that there is no consistent relationship between
the reported heat index as determined per ASTM C150-12 [4] and the HOH measurements per
ASTM C186-05 [8] at 7 days. Additionally, based on the chemical requirements of ASTM C150-
12, all cements used here can be classified as Type II (MH) with the exception of the LG series.
For the nine cements that satisfied the chemical requirements for MH classification, 7 had a heat
index of less than or equal to 90 and therefore would not have been required to satisfy the
maximum fineness limit of 430 m2/kg. All but one cement had a HOH value, at 7 days, above 80
cal/g. The exception, CLEP, had a Blaine fineness of 325 m2/kg and HOH of 75 cal/g. The other
two cements had heat indices greater than 90, and therefore would have been subjected to the
fineness limit of 430 m2/kg. AC02 and CHC both satisfied the maximum fineness requirement but
had HOH values of 83 and 87 cal/g, respectively.
Figure 4.1: Variation of 7-Day Heat of Hydration with Heat Index
y = 0.4299x + 46.405R² = 0.2245
70.0
75.0
80.0
85.0
90.0
95.0
100.0
105.0
110.0
70 75 80 85 90 95 100 105 110
7-D
ay H
OH
(ca
l/g)
[A
ST
M C
-186
]
Heat Index (C3S+4.75C3A)
7-Day HOH versus Heat Index Using All Cements

30
Table 4.1: Oxide Chemical Analysis (w/o) for As-Received Cements*
Analyte CLEP CLE02 CLE03 CHC AC02 AC03 ZR02 ZR03 ERD06 LG01 LG03 SiO2 20.83 20.74 20.86 19.67 20.01 20.02 20.51 20.85 20.44 18.67 19.01 Al2O3 4.61 4.45 4.42 4.17 5.15 5.32 4.91 4.9 4.61 5.7 5.66 Fe2O3 4.2 4.07 3.86 2.89 3.86 3.88 3.7 3.62 3.14 2.63 2.55 CaO 64.33 64.83 64.02 62.94 63.52 63.43 63.54 63.5 63.45 60.15 60.89 MgO 0.83 0.92 1.12 2.58 0.92 0.93 0.63 0.64 1.06 2.92 2.76 SO3 2.06 2.58 2.82 3.23 3.18 3.99 3.03 3.33 3.7 4.83 4.6
Na2O 0.07 0.07 0.11 0.25 0.12 0.12 0.09 0.09 0.12 0.41 0.37 K2O 0.29 0.28 0.28 1.07 0.42 0.43 0.45 0.45 0.51 1.1 1.02 TiO2 0.29 0.28 0.26 0.22 0.26 0.27 0.31 0.29 0.18 0.25 0.26 P2O5 0.11 0.1 0.1 0.05 0.13 0.13 0.12 0.11 0.17 0.26 0.25
Mn2O3 0.08 0.08 0.08 0.05 0.01 0.01 0.04 0.03 0.22 0.07 0.08 SrO 0.04 0.04 0.04 0.04 0.06 0.06 0.06 0.06 0.18 0.28 0.28
Cr2O3 0.01 0.01 0.01 0.01 0.01 0.01 0.01 0.01 <0.01 0.01 0.01 ZnO 0.05 0.05 0.05 0.03 0.01 0.01 0.05 0.05 0.01 0.06 0.07
L.O.I(950°C) 1.36 1.22 1.44 2.77 2.4 1.68 2.70 2.3 1.92 2.58 2.54 Total 99.13 99.72 99.47 99.98 100.07 100.31 100.16 100.23 99.72 99.91 100.33
Na2Oeq 0.26 0.25 0.3 0.95 0.4 0.41 0.39 0.38 0.45 1.13 1.04 SO3/Al2O3 0.45 0.58 0.64 0.77 0.62 0.75 0.62 0.68 0.80 0.85 0.81
* Tests conducted by a certified commercial laboratory

31
Table 4.2: Bogue-Calculated Potential Compound Content (w/o) for As-Received Cements (ASTM C150-12)
Phase CLEP CLE02 CLE03 CHC AC02 AC03 ZR02 ZR03 ERD06 LG01 LG03 C3S 61 63 59 65 57 53 56 52 57 47 49 C2S 14 12 15 7 14 17 17 20 16 18 18 C3A 5 5 5 6 7 8 7 7 7 11 11
C4AF 13 12 12 9 12 12 11 11 10 8 8 C4AF+2C3A 23 22 22 21 26 28 25 25 24 30 30
C3S+4.75C3A* 85 87 83 95 91 89 88 85 90 99 101
* Heat Index
Table 4.3: Heat of Hydration (kJ/kg)[cal/g]-ASTM C186*
Age CLEP CLE02 CLE03 CHC AC02 AC03 ZR02 ZR03 ERD06 LG01 LG03 7 days (312)
[74.6] (340) [81.3]
(366) [87.5]
(362) [86.5]
(349) [83.4]
(370) [88.4]
(337) [80.5]
(367) [87.7]
(382) [91.3]
(361) [86.3]
(391) [93.5]
28 days (360) [86.1]
(374) [89.5]
(387) [92.5]
(388) [92.8]
(391) [93.5]
(398) [95.2]
(370) [88.5]
(386) [92.3]
(403) [96.4]
(365) [87.3]
(388) [92.8]
* Tests conducted by certified commercial laboratory

32
4.3 Mineralogical Characterization of Portland Cements
In order to address the effect of different cement phases on cement properties,
quantitative x-ray diffraction (QXRD) was performed on all the as-received cements.
Rietveld analysis was adopted here for phase quantification and the results are depicted in
Table 4.4. It is noted that tricalcium silicate quantified through XRD was in general higher
than that determined through Bogue calculations, while tricalcium aluminate was in
general lower. The disagreement between the phase content determined through XRD and
potential phase content determined through ASTM C150-12 [4] is expected as indicated in
the published literature [46, 47, 76, 77]. It is also noted that cement mineralogy alone
cannot explain fully the 7-day heat of hydration trends as measured per ASTM C186-05
[8].
4.4 Cement Particle Size Analysis
Two methods were used in characterizing cement particle size; namely, Blaine
fineness and laser particle size analysis. In the first, the total specific surface area of
particles is quantified while in the second the mass fraction or volume fraction is quantified
for specific particle diameters. Both the specific surface area and the particle size
distribution affect the water demand for a given flow. Also, for the same specific surface
area, two cements of significantly different particle size distribution will have different
water demands. A higher proportion of fines would also indicate a higher early strength
gain [60, 62]. In addition to the effect of cement mineral composition on its properties,
cement fineness affects the rate of its reaction with water, or hydration kinetics. The
published literature indicates that the effect of higher fineness is to increase the rate of
hydration due to a corresponding increase in surface area [40]. In terms of strength gain,
the effect of fineness is more pronounced on early age strength than on the ultimate strength
[17, 41].
Particle size distribution (PSD) defines the relative amount of particles at specific
sizes or size ranges. Typically, particle sizes of portland cements vary from <1 μm to 100
μm in diameter [5]. Moreover, PSD affects fresh and hardened concrete properties [17]. It

33
has been reported that a wider size distribution increases the packing density of the system
and effectively reduces water demand [76]. Consequently, it is expected that increasing the
packing density would have a positive contribution to strength gain potential. The effect of
fineness is also extended to the amount of heat generated by portland cement, which
increases with increasing fineness [5].
The results of particle size analysis for all as-received cements are presented in
Table 4.5 using Blaine fineness and particle size distribution values. The results depicted
in Table 4.5 indicate that there is in general a decrease in mean particle size with increasing
Blaine fineness. However, there are several exceptions, such as the case of CHC, where
the Blaine fineness was 575 m2/kg with a mean particle size of about 8.7 µm, compared to
AC03 cement with a higher fineness of 612 m2/kg and a higher mean particle size of about
10 µm.
As to the effect of cement fineness on the 7-day heat of hydration [8], Figure 4.2
indicates a better relationship between Blaine fineness and heat of hydration than the heat
index defined by ASTM C150-12 [4] for the cements studied here. However, it is to be
noted that the combined effect of mineralogy and fineness needs to be explored to improve
the coefficient of correlation.

34
Figure 4.2: Effect of Blaine Fineness on the 7-Day Heat of Hydration (ASTM C186)
y = 0.0419x + 65.449R² = 0.5482
60
65
70
75
80
85
90
95
100
200 300 400 500 600 700
7-D
ay H
eat
of H
ydra
tion
(ca
l/g)
[AS
TM
C18
6]
Blaine Fineness (m²/kg)

35
Table 4.4: Phase Content (w/o) Using Quantitative X-Ray Diffraction
Cement Phase
Source CLEP CLE02 CLE03 CHC AC02 AC03 ZR02 ZR03 ERD06 LG01 LG03
C3S (%) Rietveld 62 62 59 69 61 62 57 57 62 57 59 C2S (%) Rietveld 16 17 20 7 13 14 16 20 16 13 13 C3A (%) Rietveld 4 4 3 5 7 7 7 7 5 10 11 C4AF (%) Rietveld 13 13 13 7 12 13 11 11 10 6 6
Table 4.5: Particle Size Analysis of As-Received Cements
Physical Properties CLEP CLE02 CLE03 CHC AC02 AC03 ZR02 ZR03 ERD06 LG01 LG03 D10 (µm) 3.31 2.63 1.76 2.43 3.61 1.33 2.51 1.43 2.76 3.21 2.55 D50 (µm) 12.75 10.67 7.90 11.11 10.45 8.23 9.85 7.65 8.90 10.78 9.08 D90 (µm) 40.71 26.30 16.08 32.21 24.86 19.94 23.39 19.19 19.43 29.74 19.18
Median size (µm) 12.75 10.67 7.90 11.11 10.45 8.23 9.85 7.65 8.90 10.78 9.08 Mean size (MPS) [µm] 18.38 13.15 8.65 15.00 12.90 10.05 11.95 9.61 10.41 14.35 10.27
ASTM C204-Blaine Fineness (m²/kg)
325 414 575 426 417 612 402 590 494 405 530

36
4.5 Heat of Hydration Using Isothermal Calorimeter
Heat of hydration (HOH) was also determined using an isothermal calorimeter as
another method of assessing heat generation during cement hydration. As indicated
previously in Chapter 3, internal mixing was adopted here in order to capture the reaction
process from the time of water addition. The results are reported in Table 4.6 and Figures
4.3 through 4.8. The results indicate the significance of cement fineness as well as
mineralogy on the amount of heat generated by cements during hydration. It is noted that
increasing the fineness for cement from the same source, and therefore same cement
mineralogy, increased the measured heat at 7 days whether heat measurements were
conducted using procedures outlined in ASTM C186 or C1702. The results also indicate
that for cements of similar Blaine fineness, the higher the C3A and/or C3S content of
cement, the higher the heat generated at 7 days. The findings are in agreement with what
has been published in the literature on the parameters that affect heat of hydration of
portland cement; namely, cement fineness, and C3A and C3S content.
Figure 4.3: Effect of Cement Blaine Fineness on Cumulative Heat (ASTM C 1702) for CLE Cements
0
50
100
150
200
250
300
350
400
450
0 20 40 60 80 100 120 140 160 180
Tot
al H
eat
(J/g
)
Paste Age (Hours)
CLEP-23
CLE02-23
CLE03-23
CLEP Blaine Fineness= 325 m2/kgCLE02 Blaine Fineness= 414 m2/kgCLE03 Blaine Fineness= 575 m2/kg

37
Figure 4.4: Effect of Cement Blaine Fineness on Cumulative Heat (ASTM C 1702)
for AC Cements
Figure 4.5: Effect of Cement Blaine Fineness on Cumulative Heat (ASTM C 1702) for LG Cements
0
50
100
150
200
250
300
350
400
450
0 20 40 60 80 100 120 140 160 180
Tot
al H
eat
(J/g
)
Paste Age (Hours)
LG01-23
LG03-23
LG01 Blaine Fineness= 405 m2/kgLG03 Blaine Fineness= 530 m2/kg
0
50
100
150
200
250
300
350
400
450
0 20 40 60 80 100 120 140 160 180
Tot
al H
eat
(J/g
)
Paste Age (Hours)
AC02-23
AC03-23
AC02 Blaine Fineness= 417 m2/kgAC03 Blaine Fineness= 617 m2/kg

38
Figure 4.6: Effect of Cement Blaine Fineness on Cumulative Heat (ASTM C 1702) for ZR Cements
Figure 4.7: Cumulative Heat (ASTM C 1702) for CHC Cement
0
50
100
150
200
250
300
350
400
450
0 20 40 60 80 100 120 140 160 180
Tot
al H
eat
(J/g
)
Paste Age (Hours)
ZR02-23
ZR03-23
ZR02 Blaine Fineness= 402 m2/kgZR03 Blaine Fineness= 590 m2/kg
0
50
100
150
200
250
300
350
400
450
0 20 40 60 80 100 120 140 160 180
Tot
al H
eat
(J/g
)
Age (Hours)
CHC-23
CHC Blaine Fineness= 426 m2/kg
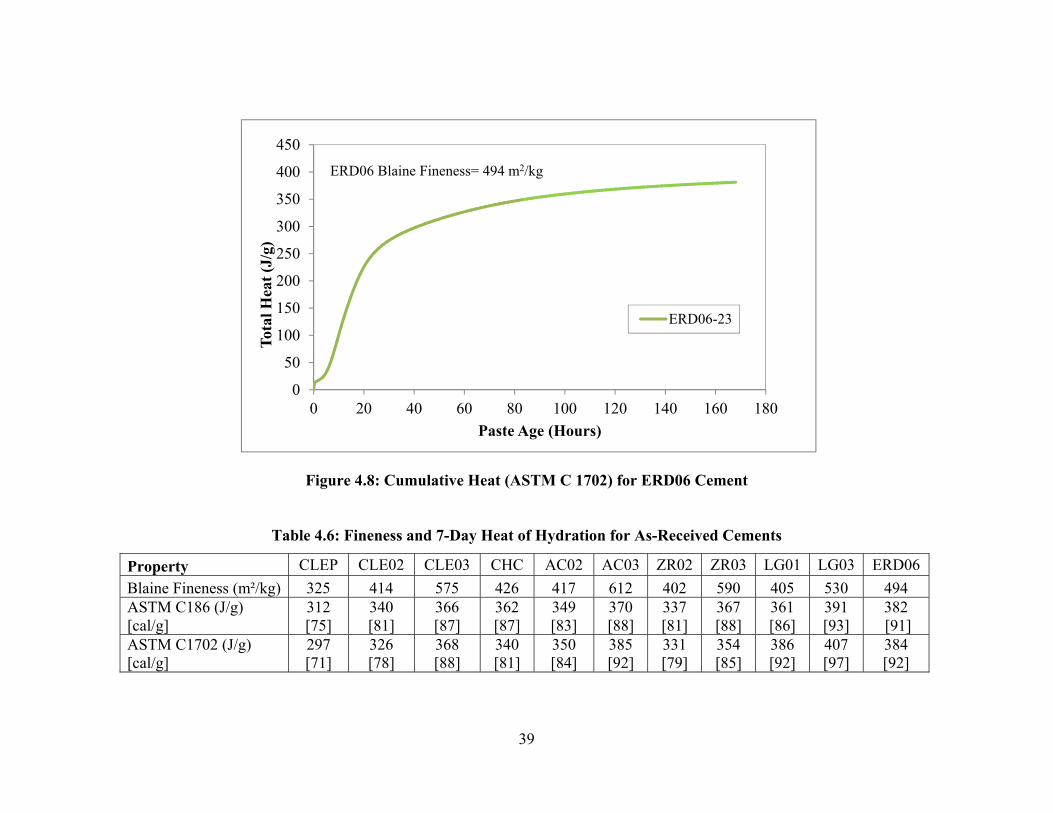
39
Figure 4.8: Cumulative Heat (ASTM C 1702) for ERD06 Cement
Table 4.6: Fineness and 7-Day Heat of Hydration for As-Received Cements
Property CLEP CLE02 CLE03 CHC AC02 AC03 ZR02 ZR03 LG01 LG03 ERD06
Blaine Fineness (m²/kg) 325 414 575 426 417 612 402 590 405 530 494 ASTM C186 (J/g) [cal/g]
312 [75]
340 [81]
366 [87]
362 [87]
349 [83]
370 [88]
337 [81]
367 [88]
361 [86]
391 [93]
382 [91]
ASTM C1702 (J/g) [cal/g]
297 [71]
326 [78]
368 [88]
340 [81]
350 [84]
385 [92]
331 [79]
354 [85]
386 [92]
407 [97]
384 [92]
0
50
100
150
200
250
300
350
400
450
0 20 40 60 80 100 120 140 160 180
Tot
al H
eat
(J/g
)
Paste Age (Hours)
ERD06-23
ERD06 Blaine Fineness= 494 m2/kg

40
Figure 4.9 examines the relationship between HOH determined using ASTM C186 and
C1702. The data indicate that there is a reasonable relationship between the two measurement
methods. The heat of solution method appears to yield lower values than the conduction method
for cements with heat of hydration values above 360 kJ/kg. However, for values less than 360,
heat of solution method gave higher heat values than those collected using isothermal calorimetry.
It is recognized that both heat measurement methods are not necessarily equivalent and used
different w/c ratios, with the heat of solution method at 0.40 and the isothermal conduction
calorimetry method at 0.50. This w/c difference could have affected the degree of hydration;
however, the effect of w/c ratio has been reported to be minimal at 7 days of hydration [79, 80].
The higher heat values measured through calorimetry are for cements that have high fineness or
high tricalcium aluminate content. For those cements, it appears that the C186 method produced
heat of hydration values that were less than those collected through isothermal calorimetry. It
would be interesting to see if this effect would be observed at shorter hydration times; that is, at
an age of 3 days.
Figure 4.9: Relationship Between Heat of Hydration Determined Using Heat of Solution
Method and Isothermal Conduction Calorimetry
y = 0.629x + 133.31R² = 0.8454
295
315
335
355
375
395
415
435
295 315 335 355 375 395 415 435
Hea
t of
Hyd
rati
on p
er A
ST
M C
186,
[k
J/k
g]
Heat of Hydration per ASTM C1702, [kJ/kg]

41
The experimental data showed that for 2 cements that had the same heat index of 85, CLEP
and ZR03, the 7-day HOH differed by 13-14 cal/g. It is also noted that these two cements had
Blaine fineness values of 325 and 590 m2/kg, with the cement of higher Blaine fineness generating
higher HOH. Additionally, for cements of similar heat index, between 87 and 89 (CLE02, ZR02,
AC03), the measured HOH varied between 7 and 14 cal/g, with corresponding Blaine fineness
values ranging between 410 and 610 m2/kg. For cements with high fineness values and/or high
tricalcium aluminate contents, the heat measured at 7 days using C186 was lower than that reported
using C1702. This finding could indicate that for cements of high fineness, C1702 might be a
better technique in assessing the heat of hydration, and subsequently predicting temperature rise,
in portland cement concrete mixes used for massive elements.
4.6 Activation Energy Determination
The concept of activation energy has been used in predicting concrete field properties.
However, the calculation is usually based on data collected in the laboratory at different ambient
temperatures than those experienced in the field. The concept has been used widely in practice and
the procedures for its implementation and data collection are outlined in ASTM C1074-11 [31].
Strength data for mortar cubes were collected at three temperatures. Additionally, the age at which
strength data were collected was based on the setting time for each mortar at each testing
temperature. As indicated in Chapter 3, the curing temperatures used in this study were 22, 30 and
40C. The effects of curing temperature on the setting profile (change in penetration resistance
with time) are depicted in Figures 4.10 through 4.15.
Increasing the curing temperature shortened the initial and final set times due to the
increased rate of hydration, especially during the early stages of the reaction where the reactions
were chemically controlled. In addressing the effect of fineness on the setting time behavior of
cements, it can be noticed that increasing fineness resulted in a consistently shorter setting time as
can be observed from the data presented in Figures 4.16 through 4.18. Figure 4.19 shows that
cement composition affected the setting behavior. LG01 and AC02 were chosen because they have
similar Blaine fineness values and mean particle sizes. The data indicate that for cements of similar
fineness and mean particle size, setting behavior appeared to be affected by the C3A, C3S, and
alkali contents, and the SO3/C3A ratio. The AC02 cement had a higher tricalcium silicate content
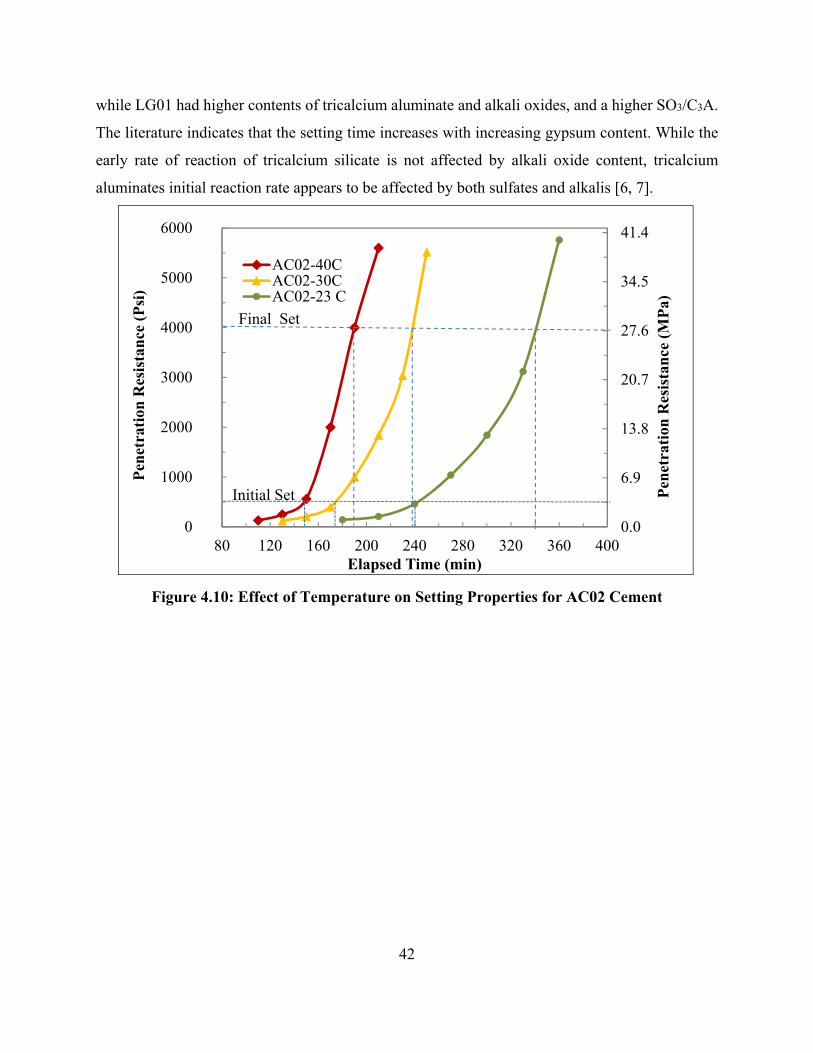
42
while LG01 had higher contents of tricalcium aluminate and alkali oxides, and a higher SO3/C3A.
The literature indicates that the setting time increases with increasing gypsum content. While the
early rate of reaction of tricalcium silicate is not affected by alkali oxide content, tricalcium
aluminates initial reaction rate appears to be affected by both sulfates and alkalis [6, 7].
Figure 4.10: Effect of Temperature on Setting Properties for AC02 Cement
0.0
6.9
13.8
20.7
27.6
34.5
41.4
0
1000
2000
3000
4000
5000
6000
80 120 160 200 240 280 320 360 400
Pen
etra
tion
Res
ista
nce
(P
si)
Elapsed Time (min)
AC02-40CAC02-30CAC02-23 C
Pen
etra
tion
Res
ista
nce
(M
Pa)
Final Set
Initial Set

43
Figure 4.11: Effect of Temperature on Setting Properties for AC03 Cement
Figure 4.12: Effect of Temperature on Setting Properties for ZR02 Cement
0.0
6.9
13.8
20.7
27.6
34.5
41.4
0
1000
2000
3000
4000
5000
6000
40 80 120 160 200 240 280 320 360 400
Pen
etra
tion
Res
ista
nce
(P
si)
Elapsed Time (min)
AC03-40CAC03-30CAC03-23C
Pen
etra
tion
Res
ista
nce
(M
Pa)
Final Set
Initial Set
0.0
6.9
13.8
20.7
27.6
34.5
41.4
0
1000
2000
3000
4000
5000
6000
80 120 160 200 240 280 320 360 400
Pen
etra
tion
Res
ista
nce
(P
si)
Elapsed Time (min)
ZR02-40CZR02-30CZR02-23C
Pen
etra
tion
Res
ista
nce
(M
Pa)
Final Set
Initial Set

44
Figure 4.13: Effect of Temperature on Setting Properties for ZR03 Cement
Figure 4.14: Effect of Temperature on Setting Properties for LG01 Cement
0.0
6.9
13.8
20.7
27.6
34.5
41.4
0
1000
2000
3000
4000
5000
6000
80 120 160 200 240 280 320 360 400
Pen
etra
tion
Res
ista
nce
(P
si)
Elapsed Time (min)
ZR03-40CZR03-30CZR03-23C
Pen
etra
tion
Res
ista
nce
(M
Pa)
Final Set
Initial
0.0
6.9
13.8
20.7
27.6
34.5
41.4
0
1000
2000
3000
4000
5000
6000
80 120 160 200 240 280 320 360 400
Pen
etra
tion
Res
ista
nce
(P
si)
Elapsed Time (min)
LG01-40CLG01-30CLG01-23C
Pen
etra
tion
Res
ista
nce
(M
Pa)
Final Set
Initial Set

45
Figure 4.15: Effect of Temperature on Setting Properties for LG03 Cement
Figure 4.16: Effect of Cement Fineness on Setting Behavior of AC Cements
0.0
6.9
13.8
20.7
27.6
34.5
41.4
0
1000
2000
3000
4000
5000
6000
80 120 160 200 240 280 320 360 400
Pen
etra
tion
Res
ista
nce
(P
si)
Elapsed Time (min)
LG03-40CLG03-30CLG03-22C
Pen
etra
tion
Res
ista
nce
(M
Pa)
Final Set
Initial Set
0.0
6.9
13.8
20.7
27.6
34.5
41.4
0
1000
2000
3000
4000
5000
6000
100 140 180 220 260 300
Pen
etra
tion
Res
ista
nce
(P
si)
Elapsed Time (min)
AC02-30CAC03-30C
Pen
etra
tion
Res
ista
nce
(M
Pa)
AC02 Blaine Fineness= 417 m2/kgAC03 Blaine Fineness= 612 m2/kg

46
Figure 4.17: Effect of Cement Fineness on Setting Behavior of ZR Cements
Figure 4.18: Effect of Cement Fineness on Setting Behavior of LG Cements
0.0
6.9
13.8
20.7
27.6
34.5
41.4
0
1000
2000
3000
4000
5000
6000
80 120 160 200 240 280 320 360 400
Pen
etra
tion
Res
ista
nce
(P
si)
Elapsed Time (min)
ZR02-30CZR03-30C
Pen
etra
tion
Res
ista
nce
(M
Pa)
ZR02 Blaine Fineness= 402 m2/kgZR03 Blaine Fineness= 590 m2/kg
0.0
6.9
13.8
20.7
27.6
34.5
41.4
0
1000
2000
3000
4000
5000
6000
100 140 180 220 260 300
Pen
etra
tion
Res
ista
nce
(P
si)
Elapsed Time (min)
LG01-30CLG03-30C
Pen
etra
tion
Res
ista
nce
(M
Pa)
Final Set
Initial Set
LG01 Blaine Fineness= 405 m2/kgLG03 Blaine Fineness= 530 m2/kg

47
Figure 4.19: Effect of Cement Mineralogy on Setting Behavior for Cements of Similar Fineness
Following setting time determination, the compressive strengths for mortar cubes prepared
using those 6 cements were determined at 3 different curing temperatures. The data are presented
in Figure 4.20 through Figure 4.25. For all cements tested here, it appears that increasing the
temperature had the effect of increasing early strength but not necessarily the later strength. This
is in agreement with the findings in the literature on the effect of curing temperature on strength
gain; that is, increasing the temperature increases early strength while the later strength decreases.
This was attributed to the more rapid production of hydration products, which resulted in a
nonuniform distribution of the hydration phases in the hydrated cement paste.
To address the effects of cement fineness and mineralogy on strength gain, several cements
were evaluated and the data are presented in Figure 4.26 through Figure 4.28. The literature
indicates that cement fineness affects compressive strength of portland cement mortar up to an age
of 7 days. However, the results presented here indicate that for cements of the same mineralogy,
the significance of cement fineness may be persistent up to an age of about 28 days. Also,
comparing cements of similar fineness but different composition, Figure 4.29 shows that for LG01
0.0
6.9
13.8
20.7
27.6
34.5
41.4
0
1000
2000
3000
4000
5000
6000
120 160 200 240 280 320
Pen
etra
tion
Res
ista
nce
(P
si)
Elapsed Time (min)
AC02-30CLG01-30C
Pen
etra
tion
Res
ista
nce
(M
Pa)
Final Set
Initial Set
AC02 Blaine Fineness= 417 m2/kgLG01 Blaine Fineness= 405 m2/kg

48
and AC02 of similar Blaine fineness (405 and 417 m2/kg respectively), the calcium silicate content
affects strength gain up to an age of 28 days.
Figure 4.20: Effect of Curing Temperature on Compressive Strength Gain with Time for AC02 Cement
Figure 4.21: Effect of Curing Temperature on Compressive Strength Gain with Time for AC03 Cement
0
5
10
15
20
25
30
35
40
45
50
0 2 4 6 8 10 12 14 16 18 20 22 24 26 28
Com
pre
ssiv
e S
tren
gth
(M
Pa)
Age (Days)
AC02
22°C
30°C
40°C
0
5
10
15
20
25
30
35
40
45
50
0 2 4 6 8 10 12 14 16 18 20 22 24 26 28
Com
pre
ssiv
e S
tren
gth
(M
Pa)
Age (Days)
AC03
22°C
30°C
40°C

49
Figure 4.22: Effect of Curing Temperature on Compressive Strength Gain with Time for ZR02 Cement
Figure 4.23: Effect of Curing Temperature on Compressive Strength Gain with Time for ZR03 Cement
0
5
10
15
20
25
30
35
40
45
50
0 2 4 6 8 10 12 14 16 18 20 22 24 26 28
Com
pre
ssiv
e S
tren
gth
( M
Pa)
Age (Days)
ZR02
22°C
30°C
40°C
0
5
10
15
20
25
30
35
40
45
50
0 2 4 6 8 10 12 14 16 18 20 22 24 26 28
Com
pre
ssiv
e S
tren
gth
(M
Pa)
Age (Days)
ZR03
22°C
30°C
40°C

50
Figure 4.24: Effect of Curing Temperature on Compressive Strength Gain with Time for LG01 Cement
Figure 4.25: Effect of Curing Temperature on Compressive Strength Gain with Time for LG03 Cement
0
5
10
15
20
25
30
35
40
45
50
0 2 4 6 8 10 12 14 16 18 20 22 24 26 28
Com
pre
ssiv
e S
tren
gth
(M
Pa)
Age (Days)
LG01
22°C
30°C
40°C
0
5
10
15
20
25
30
35
40
45
50
0 2 4 6 8 10 12 14 16 18 20 22 24 26 28
Com
pre
ssiv
e S
tren
gth
(M
Pa)
Age (Days)
LG03
22°C
30°C
40°C

51
Figure 4.26: Effect of Cement Fineness on Compressive Strength Gain with Time for AC Cements
Figure 4.27: Effect of Cement Fineness on Compressive Strength Gain with Time for ZR Cements
0
5
10
15
20
25
30
35
40
45
50
0 2 4 6 8 10 12 14 16 18 20 22 24 26 28
Com
pre
ssiv
e S
tren
gth
( M
Pa)
Age (Days)
AC03-40AC02-40
AC02 Blaine Fineness: 417 m2/kgAC03 Blaine Fineness: 612 m2/kg
0
5
10
15
20
25
30
35
40
45
50
0 2 4 6 8 10 12 14 16 18 20 22 24 26 28
Com
pre
ssiv
e S
tren
gth
( M
Pa)
Age (Days)
ZR02‐40
ZR03‐40
ZR02 Blaine Fineness: 402 m2/kgZR03 Blaine Fineness: 590 m2/kg
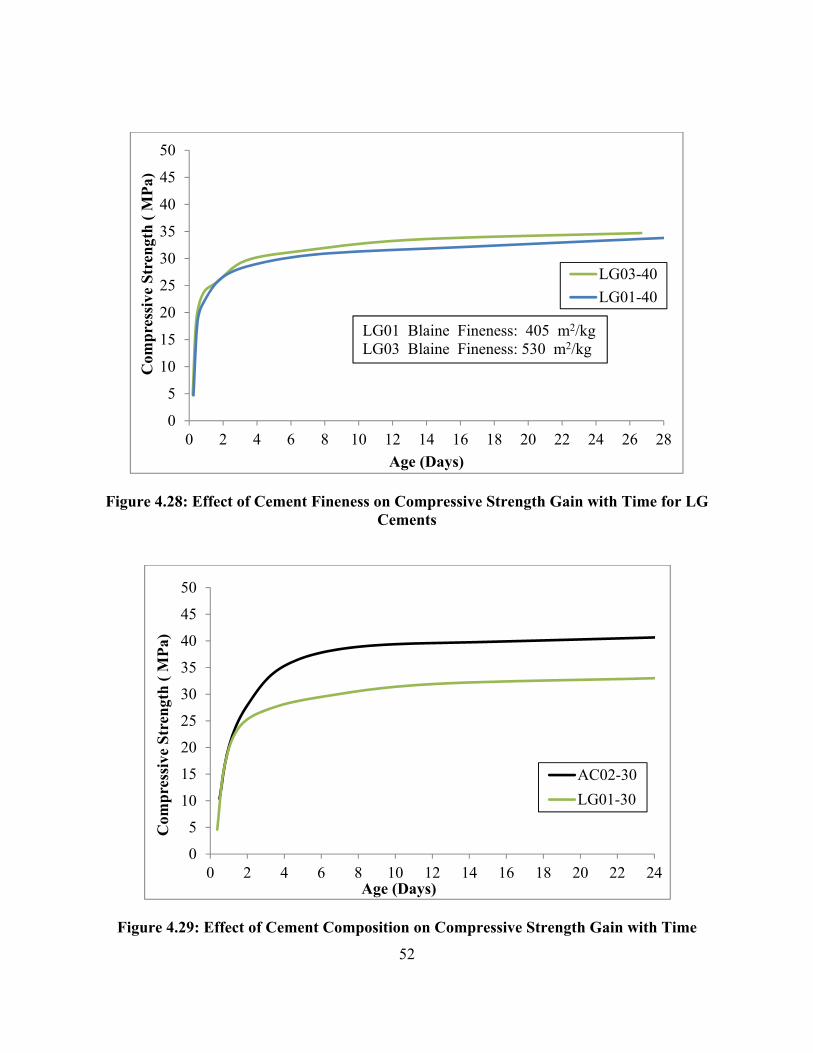
52
Figure 4.28: Effect of Cement Fineness on Compressive Strength Gain with Time for LG Cements
Figure 4.29: Effect of Cement Composition on Compressive Strength Gain with Time
0
5
10
15
20
25
30
35
40
45
50
0 2 4 6 8 10 12 14 16 18 20 22 24 26 28
Com
pre
ssiv
e S
tren
gth
( M
Pa)
Age (Days)
LG03-40
LG01-40
LG01 Blaine Fineness: 405 m2/kgLG03 Blaine Fineness: 530 m2/kg
0
5
10
15
20
25
30
35
40
45
50
0 2 4 6 8 10 12 14 16 18 20 22 24
Com
pre
ssiv
e S
tren
gth
( M
Pa)
Age (Days)
AC02-30
LG01-30

53
The process of determining the activation energy based on strength measurements is
outlined in Annex A1 of ASTM C1074-11 [31]. Two functions have been proposed and
extensively used in activation energy determination; namely an exponential function presented in
Equation 4.1 (same as Equation 2.4) and a hyperbolic function presented in Equation 4.2 (same as
Equation 2.2) and adopted in the ASTM specifications:
Equation 4.1 (2.4)
where S = Average compressive strength at age t (MPa)
t = Test age (days)
Su = Limiting strength (MPa)
τ = Time constant (days) [1/k in the hyperbolic function]
β = Curve shape parameters (dimensionless)
Equation 4.2 (2.2)
where S = Average compressive strength at age t (MPa)
t = Test age (days)
Su = Limiting strength, (MPa)
k = Rate constant or rate of reaction, (days-1)
to = Age at which strength development is assumed to begin (days)
In this work, the parameters for both functions were determined using the Solver module
of Microsoft Excel. Each function was fitted using the strength gain data at each curing
temperature. The solver minimizes the sum of the squares of the residuals to obtain the best fit for
the collected data. The coefficient of correlation (R²), which is a statistical measure of how well
the regression line approximates the real data points, was calculated for each function at each
curing temperature. R² values for the cements studied here exceeded 0.97, which indicates a good

54
fit using either function. Tables 4.7 and 4.8 depict the fitted parameters for the hyperbolic and
exponential functions, respectively. Once the parameters were determined, the calculated strengths
determined through each function were plotted along with the actual collected data points. Figures
4.30 through 4.32 show an example of the analysis procedure using AC02 cement. The actual data
and the predicted values at each curing temperature for both functions are presented. The same
procedures were adopted for each cement and the data are presented in Table 4.7 and 4.8.
Figure 4.30: Strength Data Fitting Using Exponential and Hyperbolic Functions on AC02 at 22°C
0
5
10
15
20
25
30
35
40
45
50
0 2 4 6 8 10 12 14 16 18 20 22 24 26 28
Com
pre
ssiv
e S
tren
gth
(M
Pa)
Age (Days)
AC02 at 22° C
Actual
Hyper
Exp

55
Figure 4.31: Strength Data Fitting Using Exponential and Hyperbolic Functions on AC02 at 30°C
Figure 4.32: Strength Data Fitting Using Exponential and Hyperbolic Functions on AC02 at 40°C
0
5
10
15
20
25
30
35
40
45
50
0 2 4 6 8 10 12 14 16 18 20 22 24 26 28
Com
pre
ssiv
e S
tren
gth
(M
Pa)
Age( Days)
AC02 at 30°C
Actual
Hyper
Exp
0
5
10
15
20
25
30
35
40
45
50
0 2 4 6 8 10 12 14 16 18 20 22 24 26 28
Com
pre
ssiv
e S
tren
gth
(M
Pa)
Age( Days)
AC02 at 40°C
Actual
Hyper
Exp

56
Table 4.7: Summary of Hyperbolic Function Parameters
Cement Temperature
(°C) Su
(MPa) k
(1/day) to
(hr) R²
AC02 22 44.13 0.61 7.22 0.998 30 42.58 1.15 5.29 0.998 40 40.33 2.08 3.56 0.997
AC03 22 45.68 0.84 5.37 0.999 30 42.34 1.64 3.42 0.988 40 42.86 2.52 2.22 0.986
ZR02 22 41.97 0.52 4.66 0.999 30 42.45 0.85 2.30 0.995 40 41.34 1.32 2.16 0.995
ZR03 22 48.95 0.54 2.48 0.988 30 46.10 1.13 2.51 0.989 40 44.57 2.22 2.14 0.998
LG01 22 36.05 0.90 7.60 0.998 30 32.93 2.00 6.97 0.997 40 32.29 3.50 4.68 0.982
LG03 22 35.41 1.67 8.92 0.988 30 35.69 1.83 5.00 0.974 40 33.14 3.83 3.77 0.975

57
Table 4.8: Summary of Exponential Function Parameters
Cement Temperature (°C) Su (MPa) τ (hr) ß R²
AC02 22 45.50 31.45 0.81 0.998 30 42.70 17.69 0.93 0.998 40 40.43 10.46 0.95 0.996
AC03 22 46.56 22.52 0.84 0.999 30 42.79 12.06 0.88 0.988 40 43.80 7.90 0.83 0.987
ZR02 22 43.89 33.30 0.74 0.999 30 44.81 19.61 0.70 0.998 40 43.19 13.19 0.73 0.998
ZR03 22 55.85 33.50 0.58 0.994 30 48.89 14.69 0.68 0.994 40 45.24 8.54 0.84 0.998
LG01 22 36.16 23.62 0.95 0.998 30 32.41 14.42 1.21 0.992 40 32.29 8.97 1.14 0.971
LG03 22 35.19 17.78 1.15 0.981 30 36.72 13.03 0.87 0.973 40 33.49 7.66 1.03 0.966
Once the rate of reaction (k) for the hyperbolic function and the time constant (τ) for the
exponential function were calculated, the respective activation energies were determined as shown
in Figures 4.33 and 4.34. The slope of this line was the negative quotient of the universal gas
constant R (8.3144 J/mol-K) and the activation energy Ea (kJ/mol). This procedure was followed
in quantifying Ea for all the cements. As seen in Figure 4.33 and 4.34, for both functions the natural
logarithm of the rate constants (k) or (1/τ) were plotted against the reciprocal of the absolute curing
temperature (K).

58
Figure 4.33: Activation Energy Determination Ea Using Hyperbolic Function on AC02
Figure 4.34: Activation Energy Determination Ea Using Exponential Function on AC02
y = -6303.2x + 20.892R² = 0.9955
-0.6
-0.4
-0.2
0
0.2
0.4
0.6
0.8
1
0.00315 0.00320 0.00325 0.00330 0.00335 0.00340
ln (
k)
Reciprocal of Absolute Temperature (1/K)
AC02-Hyperbolic Function
y = -5628.8x + 18.835R² = 0.9946
-0.4
-0.2
0
0.2
0.4
0.6
0.8
1
0.00315 0.00320 0.00325 0.00330 0.00335 0.00340
ln (
1/τ)
Reciprocal of Absolute Temperature (1/K)
AC02-Exponential Function

59
The results presented in Table 4.9 indicate that the activation energy values determined for
six of the as-received cements using mortar strength data showed similar trends regardless of the
function used in calculating activation energy. It was also observed that in general, increasing
cement fineness decreased activation energy except for ZR03. According to models presented in
the literature [20], incorporation of some mineral admixtures will increase activation energy.
Table 4.9: Activation Energy for As-Received Cements
Cement Ea-Hyperbolic
(kJ/mol) R²
Ea-Exponential (kJ/mol)
R² Ea Difference
(kJ/mol)
AC02 52.4 0.996 46.8 0.995 5.6 AC03 46.3 0.971 44.3 0.975 2.0 ZR02 39.8 0.992 39.3 0.983 0.5 ZR03 60.0 0.995 57.8 0.973 2.1 LG01 57.5 0.978 41.2 0.997 16.3 LG03 36.2 0.866 36.1 0.990 0.1
In order to verify the mineralogical composition of ZR cements further, calibration curves
were used in quantifying tricalcium silicates of this series. The results indicated that both ZR02
and ZR03 cements have a tricalcium silicate content of 52%. This C3S content is about 5% lower
than the amount quantified using Rietveld analysis.
For AC cements and LG cements, it was found that for the same cement mineralogy,
increasing cement fineness or decreasing cement mean particle size decreased the activation
energy determined through both exponential and hyperbolic functions. It is well established in the
literature that increasing cement fineness results in an increase in the rate of reaction. This is due
to an increase in the surface area of cement particles that is available to react with water. The
findings are in agreement with the models proposed in the literature as to the effect of increased
fineness reducing the magnitude of the calculated activation energy [20]. However, the range of
activation energy values for cements with the same mineralogy, but different fineness, appeared
to be more pronounced when using the hyperbolic function (ASTM specified). Analysis using the
hyperbolic function produced an activation energy range of 36.2-57.5 kJ/mol, whereas the
exponential function produced a range of 36.1-46.8 kJ/mol. The published literature [28-30, 81]

60
indicates that the exponential function is not sensitive enough to reflect the combined effect of
time and temperature on strength development.
Since Blaine fineness and mean particle size significantly affect the activation energy
calculated from mortar strength, it is imperative, when addressing the effect of cement mineralogy
on activation energy, that the fineness values and particle sizes are similar. This is a challenging
task given the chemical, physical and mineralogical characteristics of the cements studied here.
Comparison of AC03 and ZR03 cements (Blaine fineness values of 612 and 590 m2/kg,
respectively, and MPS of 10.1 and 9.6 μm, respectively) reveals that for cements of the same
tricalcium aluminate content, increasing C3S (QXRD-Rietveld) from 57% (ZR03) to 62% (AC03)
decreased the strength-based activation energy from 60 kJ/mol to 46 kJ/mol. This effect appeared
to be overshadowed if the mean particle size was simultaneously increased, as in the case of ZR02
and AC02. This observation appears to sustain the significance of cement particle size for
activation energy. Also, comparing AC03 and LG03 (similar MPS of 10.1 and 10.3 m,
respectively, but different Blaine fineness values of 612 and 530 m2/kg, respectively) reveals that
increasing C3A decreased the activation energy.
In conclusion, this section presented quantification of activation energy based on strength
measurements at 3 curing temperatures per ASTM C1074-11 [31]. Two functions, the hyperbolic
and exponential were used in determining the activation energy based on mortar strength data. The
findings of this study indicated that cement fineness and mean particle size have a significant effect
on the strength-based activation energy. The general observed trend was that an increase in cement
fineness and a decrease in mean particle size decreased the activation energy when considering
cements from the same source (clinker) and therefore cements of similar mineralogy. Additionally,
increasing the C3S or decreasing the SO3/C3A ratio for cements of similar Blaine fineness and
mean particle size was found to lower the activation energy determined through mortar cube
strength.
4.7 Density of As-Received Cements
The measured densities for all cements used in this study are presented in Table 4.10, where
it can be seen that ZR03 had the lowest density. In general, the densities reported here are within
the ranges published for portland cements.
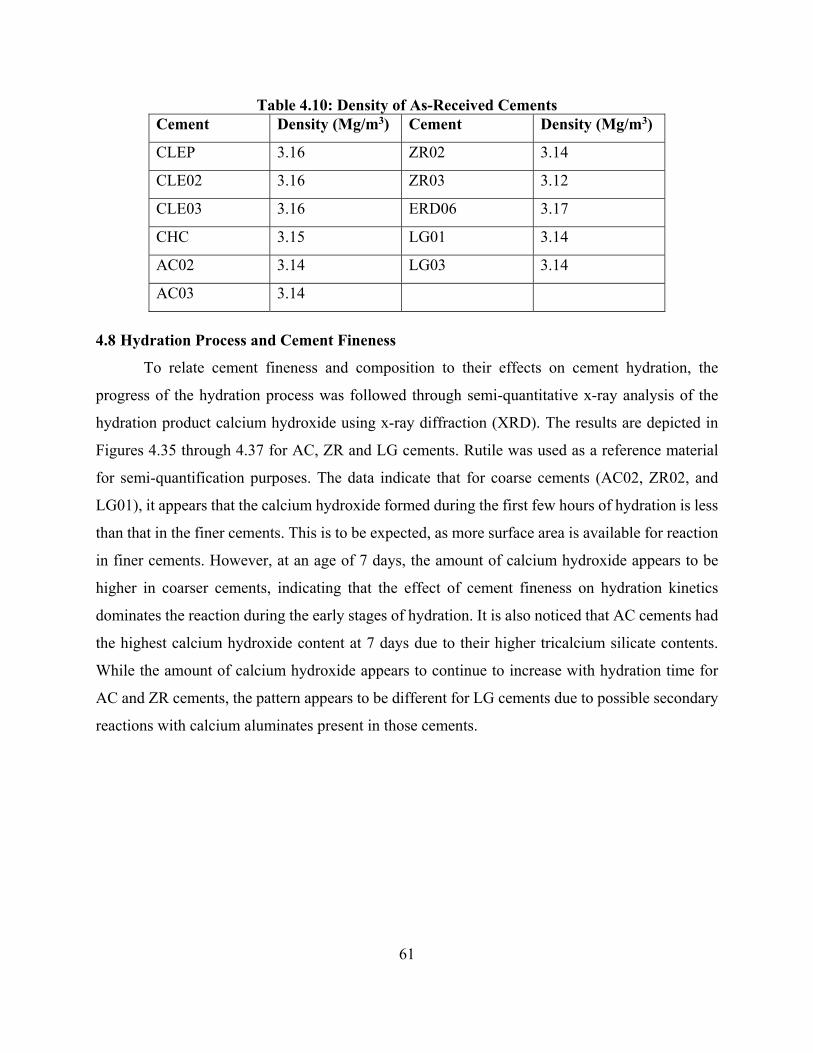
61
Table 4.10: Density of As-Received Cements Cement Density (Mg/m3) Cement Density (Mg/m3)
CLEP 3.16 ZR02 3.14
CLE02 3.16 ZR03 3.12
CLE03 3.16 ERD06 3.17
CHC 3.15 LG01 3.14
AC02 3.14 LG03 3.14
AC03 3.14
4.8 Hydration Process and Cement Fineness
To relate cement fineness and composition to their effects on cement hydration, the
progress of the hydration process was followed through semi-quantitative x-ray analysis of the
hydration product calcium hydroxide using x-ray diffraction (XRD). The results are depicted in
Figures 4.35 through 4.37 for AC, ZR and LG cements. Rutile was used as a reference material
for semi-quantification purposes. The data indicate that for coarse cements (AC02, ZR02, and
LG01), it appears that the calcium hydroxide formed during the first few hours of hydration is less
than that in the finer cements. This is to be expected, as more surface area is available for reaction
in finer cements. However, at an age of 7 days, the amount of calcium hydroxide appears to be
higher in coarser cements, indicating that the effect of cement fineness on hydration kinetics
dominates the reaction during the early stages of hydration. It is also noticed that AC cements had
the highest calcium hydroxide content at 7 days due to their higher tricalcium silicate contents.
While the amount of calcium hydroxide appears to continue to increase with hydration time for
AC and ZR cements, the pattern appears to be different for LG cements due to possible secondary
reactions with calcium aluminates present in those cements.
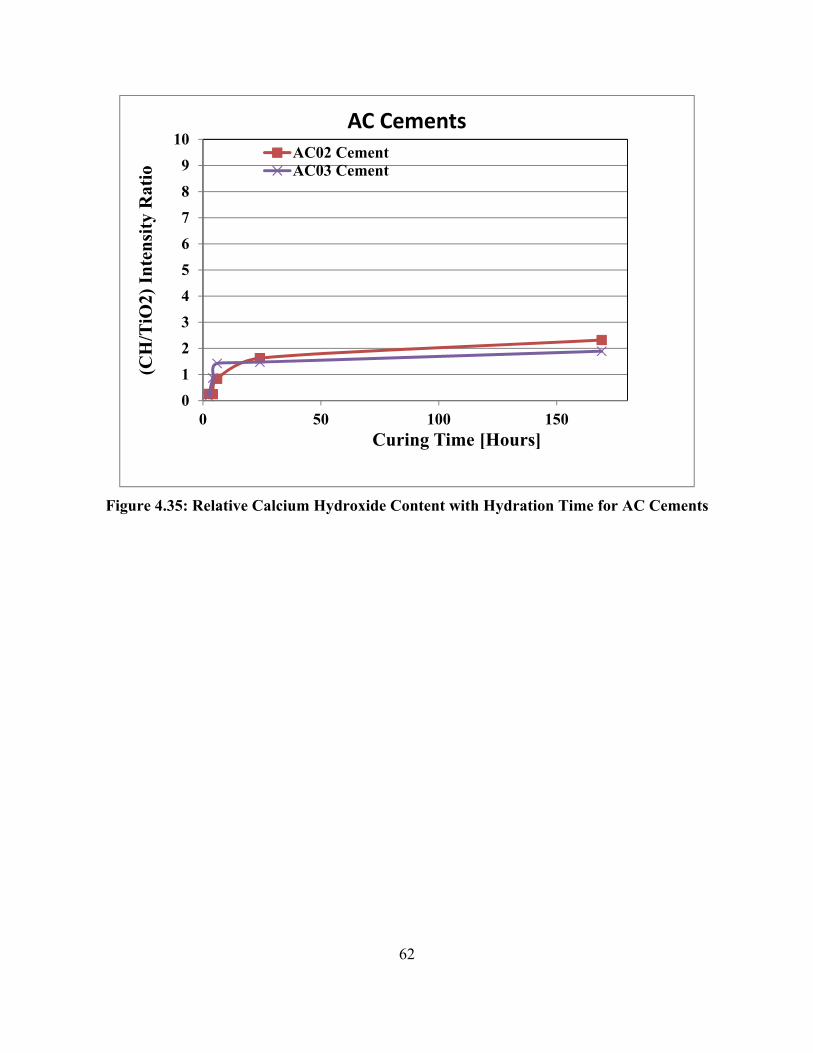
62
Figure 4.35: Relative Calcium Hydroxide Content with Hydration Time for AC Cements
0
1
2
3
4
5
6
7
8
9
10
0 50 100 150
(CH
/TiO
2) I
nte
nsi
ty R
atio
Curing Time [Hours]
AC CementsAC02 CementAC03 Cement

63
Figure 4.36: Relative Calcium Hydroxide Content with Hydration Time for ZR Cements
0
1
2
3
4
5
6
7
8
9
10
0 50 100 150
(CH
/TiO
2) I
nte
nsi
ty R
atio
Curing Time [Hours]
ZR Cements
ZR02 CementZR03 Cement

64
Figure 4.37: Relative Calcium Hydroxide Content with Hydration Time for LG Cements
4.9 Restrained Shrinkage Measurements and Cement Fineness
Three rings per mortar mix were prepared for restrained shrinkage measurements in
accordance to ASTM C1581-09a [77]. The specimens were cured for 24 hours using wet burlap
followed by air-drying. The results for restrained shrinkage experiments are presented in Table
4.11 for mixes using w/c=0.485 and Table 4.12 for mixes prepared with w/c=0.45
Table 4.11: Restrained Shrinkage for AC Cement Mortar (w/c=0.485)
Specimen Average Age at Cracking (days) AC02 7 AC03 5
0
1
2
3
4
5
6
7
8
9
10
0 50 100 150 200
(CH
/TiO
2) I
nte
nsi
ty R
atio
Curing Time [Hours]
LG Cements
LG01 CementLG03 Cement

65
Table 4.12: Restrained Shrinkage for LG, AC, and ZR Cement Mortars (w/c=0.45)
Specimen Average Age at Cracking (Days) LG01 3 LG03 3 AC02 6 AC03 5 ZR02 6 ZR03 5
The findings of this study indicate that the coarser cement mixes cracked at longer times
in agreement with the published literature [13]. According to Benz et al., coarser cements have a
lower risk for cracking at early ages compared to finer cements. Comparing the strain as a function
of time data for the AC03 and AC02 mixes, plotted in Figures 4.38 and 4.39, respectively, the time
to cracking appeared to have decreased by approximately 25-30% when cement fineness increased
from 417 to 612 m2/kg for AC02 and AC03, respectively. However, the differences did not result
in a different classification of cracking potential for the cements studied here. Based on the
definitions set in ASTM C1581-09a [77] for the criteria for cracking potential, all cements were
classified as having a high potential for cracking. Cements that were high in tricalcium aluminates
appear to have cracked at the shortest times as evident from the performance of LG cements.
-100-90-80-70-60-50-40-30-20-10
01020
0 1 2 3 4 5 6 7 8 9
Ste
el R
ing
Str
ain
, x 1
0-6
Specimen Age, Days
ACO3R4G1 Diametric
ACO3R4G2 Diametric

66
Figure 4.38: Development of Steel Ring Strain as a Function of Age for AC03 Mortar Mix
Figure 4.39: Development of Steel Ring Strain as a Function of Age for AC02 Mortar Mix
-100-90-80-70-60-50-40-30-20-10
01020
0 1 2 3 4 5 6 7 8 9
Ste
el R
ing
Str
ain
, x
10-6
Specimen Age, Days
ACO2R3G1 DiametricACO2R3G2 Diametric

67
CHAPTER 5: CONCLUSIONS AND RECOMMENDATIONS
This investigation primarily addressed the effects of cement particle size and mineralogy
on the heat of hydration of portland cement. The findings of this study can be summarized as
follows:
1. For portland cements with the same mineralogy (same source), the measured heat of
hydration (HOH) was affected by cement Blaine fineness and particle size distribution.
For cements from the same source, grinding to higher Blaine fineness or lower mean
particle size increased the measured heat of hydration. This effect was confirmed with
7-day heat of hydration measurements using a TAM Air isothermal conduction
calorimeter (internal mixing) per ASTM C1702.
2. The effect of portland cement fineness and/or mean particle size on the heat of
hydration was also assessed using ASTM C186. The results indicate that for cements
of the same mineralogy, increasing cement fineness and/or decreasing its mean particle
size increased its heat of hydration. Fineness effects were observed on the measured
heat at 7 days as well as 28 days.
3. Comparison of 2 cements, CLEP and ZR03, with the same heat index of 85, showed
that the large differences in their fineness and particle sizes resulted in a 13-14 cal/g
difference in the 7-day HOH.
4. Cements of similar Blaine fineness and heat index, in the range of 87-89, had HOH
difference of about 14 cal/g at hydration time of 7 days.
5. Increasing tricalcium silicate and/or tricalcium aluminate contents of portland cements
increased the measured heat of hydration at 7 days.
6. Portland cements produced from the same clinker (same mineralogy) showed that
activation energy was affected by cement fineness. Both AC and LG portland cements
showed a general trend of a decrease in the activation energy with an increase in cement
fineness.
7. Increasing tricalcium silicate content or decreasing the SO3/Al2O3 ratio decreased the
activation energy determined through mortar compressive strength measurements.
8. Increasing cement fineness reduced the age at cracking for Type II cements tested under
conditions of restrained shrinkage.

68
9. Increasing cement fineness increased the rate of hydration as assessed by calcium
hydroxide analysis.
Based on the findings of this study the following are recommended:
1. Require a maximum heat of hydration and a maximum fineness for Type II MH portland
cements.
2. Determine heat of hydration of portland cement by direct measurement using the
methods specified in ASTM C186 and/or ASTM 1072. The method used for heat
determination should be noted.
3. For the acceptance of concrete mix designs, heat of hydration measurements of the
cementitious system, including mineral and chemical admixtures, is recommended The
composite heat of hydration should be more useful in predicting the thermal behavior when
evaluating the cracking tendency of a mix design.
4. Evaluate which method of determining heat of hydration of portland cement, ASTM
C186 or ASTM C1702, is most applicable for predicting the thermal behavior of
cementitious structures that are susceptible to cracking from thermal stresses.
5. Investigate further the effects of particle size and fineness on the shrinkage of portland
cements and blended portland cements.
6. Study the effects of blending portland cements with commonly used pozzolanic
materials on the hydration kinetics, heat evolution, strength development, and
microstructural development.
7. Evaluate the use of Rietveld analysis and electron scanning microscopy coupled with
energy dispersive spectroscopy for mineralogical characterization of cementitious systems.

69
REFERENCES
1. Ferraro, C.C., Ishee, C. A., & Bergin, M. (2010). Report of Changes to Cement
Specifications AASHTO M85 and ASTM C150 Subsequent to Harmonization
(FL/DOT/SMO/10-536). Tallahassee, FL: Florida Department of Transportation
2. Poole, T. (2009). Predicting 7-Day Heat of Hydration of Hydraulic Cement from
Standard Test properties. Journal of the ASTM International, 6 (6), p. 10.
3. Woods, H., Steinour, H. H., & Stark, H.R. (1932). Effect of Composition of Portland
Cement on Heat Evolved During Hardening. Industrial and Engineering Chemistry, 24
(11), p. 1207-1224.
4. ASTM C150-12. (2012). “Standard Specification for Portland Cement” Annual Book of
ASTM Standards, V. 04.01, ASTM International, West Conshohocken, PA.
5. Mehta, P. & Monteiro, P. (1993). Concrete: Structure, Properties, and Materials. 2nd
ed. Englewood Cliffs, NJ: Prentice-Hall International Series in Civil Engineering and
Engineering Mechanics, p. 43-77.
6. Lea, F. M. (1970). The Chemistry of Cement and Concrete. London, Edward Arnold
7. Lea, F. M., & Hewlett, P. C. (1998). Lea's Chemistry of Cement and Concrete. London:
Arnold.
8. ASTM C186-05. (2005). “Standard Test Method for Heat of Hydration of Hydraulic
Cement” Annual Book of ASTM Standards, V. 04.01, ASTM International, West
Conshohocken, PA.
9. Poole, T. (2004). Predicting Heat of Hydration in Hydraulic Cement, unpublished report,
Research and Development Center. Published (2009) in: Journal of ASTM International
(JAI), 6 (6), p. 10
10. ASTM C1702-13. (2013). “Standard Test Method for Measurement of Heat of
Hydration of Hydraulic Cementitious Materials Using Isothermal Conduction
Calorimetry” Annual Book of ASTM Standards, V. 04.01, ASTM International, West
Conshohocken, PA.
11. Verbeck, G. J. & Foster, C. W. (1950). Long-Time Study on Cement Performance in
Concrete: Chapter 6-The Heats of Hydration of the Cements. Proceedings of the
American Society for Testing and Materials, 50 (1), p. 1-28.

70
12. Azari, H. (2010). Statistical Modeling of Cement Heat of Hydration Using Phase and
Fineness Variables. National Cooperative Highway Research Program, Transportation
Research Board of the National Academies, NCHRP web-only Document 167, p. 1-73.
13. Bentz, D.P., Sant, G., & Weiss, J. (2008). Early Age properties of Cement-Based
Materials: I. Influence of Cement Fineness. ASCE Journal of Materials in Civil
Engineering, 20(7), p. 502-508
14. Brewer, H.W. & Burrows, R.W. (1951). Coarse-Ground Cement Makes More Durable
Concrete. Journal of the American Concrete Institute, 22(5), p. 353-360.
15. Burrows, R.W. (1988). The Visible and Invisible Cracking of Concrete. American
Concrete Institute, Monograph No. 11, Farmington Hills, MI.
16. Tennis, P.D. & Bhatty, J. I. (2005). Portland Cement Characteristics-2004. Concrete
Technology Today, PCA, 26 (3).
17. Bentz, D.P. & Haecker, C.J. (1999). An Argument for using Coarse Cements in High
Performance Concretes. Cement and Concrete research, 29 (4), p. 615-618.
18. Laidler, K. (1969). Theories of Chemical Reaction Rates. New York: McGraw-Hill,
Inc., p. 1-12.
19. Schindler, S. (2002). Concrete Hydration, Temperature Development, and Setting at
Early-Ages. PhD. University of Texas.
20. Poole, J. L. (2007). Modeling Temperature Sensitivity and Heat Evolution of Concrete.
PhD, University of Texas, Austin.
21. Poole, J. L., Riding, K.A., Folliard, K. J., Juenger, M.C. G, & Schindler, A.K. (2007).
Methods for Calculating Activation Energy for Portland Cement. ACI Journal, 104 (1),
p. 303-311.
22. Kjellsen, K. O. & Detwiler, R. J. (1993). Later-Age Strength Prediction by a Modified
Maturity Model. ACI Materials Journal, 90 (3), p. 20-227.
23. Kjellsen, K. O. & Detwiler, R. J. (1992). Reaction kinetics of PC Mortars Hydrated at
Different Temperatures. Cement and Concrete Research, 22 (1), p. 112-120.
24. Kada-Benameur, H., Wirquin, E., & Duthoit, B. (2000). Determination of Apparent
Activation Energy of Concrete by Isothermal Calorimetry. Cement and Concrete
Research, 30 (2), p. 301-305.

71
25. D’Aloia, L. & Chanvillard, G. (2002)., Determining the "Apparent" Activation Energy
of Concrete: Ea - Numerical Simulation of the Heat of Hydration of Cement. Cement
and Concrete Research, 32 (8), p. 1277-1289.
26. Bien-Aime, A. (2013). Effect of Cement Chemistry and Properties on Activation
Energy. MS, University of South Florida.
27. Juenger, M. C. G., Winnefeld, F., Provis, J. L., & Ideker, J. H. (2011). Advances in
Alternative Cementitious Binders. Cement and Concrete Research, 41 (12), p. 1232-
1243.
28. Carino, N. (1991). The Maturity Method. In: Malhotra, V. and Carino, N. eds. (1991)
Handbook on Nondestructive Testing of Concrete. Boca Raton, Fl: CRC Press, p. 101-
146.
29. Carino, N. J & Lew, H. (2001). The Maturity Method: From Theory to Application: In:
Proceedings of the 2001 Structures Congress and Exposition, Washington, D.C. May
2001. Reston, VA: American Society of Civil Engineers (ASCE), p. 1-20.
30. Carino, N. J. (1984). The Maturity Method: Theory and Application. Journal of
Cement, Concrete, and Aggregates (ASTM), 6 (2), p. 61-73.
31. ASTM C1074-11. (2011). “Standard Practice for Estimating Concrete Strength by the
Maturity Method” Annual Book of ASTM Standards, V. 04.01, ASTM International,
West Conshohocken, PA.
32. McIntosh, J. (1949). Electric Curing of Concrete. Magazine of Concrete Research, 1
(1), p. 21-28.
33. Nurse, R. (1949). Steam Curing of Concrete. Magazine of Concrete Research, 1 (2), p.
7-88.
34. Saul, A. (1951). Principles Underlying the Steam Curing of Concrete at Atmospheric
Pressure. Magazine of Concrete Research, 2 (6), p. 127-140.
35. Ishee, C. A. (2011). Evaluating the Performance of Portland Cement Under Differing
Hydration Conditions, PhD, McGill University.
36. Ferraro, C. C. (2009). Determination of Test Methods for the Prediction of the Behavior
of Mass Concrete. PhD, University of Florida.

72
37. Freiesleben Hansen, P. & Pedersen, E. J. (1984). Curing of Concrete Structures. In:
CEB-General Task Group 20. (eds.) (1985) Draft CEB Guide to Durable Concrete
Structures. 1st ed. Switzerland: Comité Euro-International du Béton (CEB), p. 1-42.
38. Pinto, R.C.A & Schindler, A. K. (2010). Unified Modeling of Setting and Strength
Development. Cement and Concrete Research, 40 (1), p. 58-65.
39. Verbeck, G. J. & Helmuth, R. A. (1968). Structures and Physical Properties of Cement
Pastes. Proceedings of the International Symposium on the Chemistry of Cement, III
(1), p. 1-32.
40. Maekawa, K., Chaube, R., & Kishi, T. (1999). Modeling of Concrete Performance,
Hydration, Microstructure Formation, and Mass Transport. London: E & FN Spon.
41. Hooton, R. D., Boyd, A. J., & Bhadkamkar, D. D. (2005). Effect of Cement Fineness
and C3S Content on Properties of Concrete: A Literature Review. Portland Cement
Association, R&D Serial No.2781, p. 1-14.
42. Bentz, D.P, Garboczi, E.J., Claus, J., Haecker, C.J, & Jensen, O.M. (1999). Effects of
Cement Particle Size Distribution on Performance Properties of Portland Cement-
Based Materials. Cement and Concrete Research, 29 (10), p.1663–1671.
43. ASTM C778-13. (2013). "Standard Specification for Standard Sand" Annual Book of
ASTM Standards, Vol. 4.02, ASTM International, West Conshohocken, PA.
44. ASTM C114-13. (2013). "Standard Test Methods for Chemical Analysis of Hydraulic
Cement" Annual Book of ASTM Standards, Vol. 4.02, ASTM International, West
Conshohocken, PA.
45. ASTM C188-09. (2009). "Standard Test Method for Density of Hydraulic Cement"
Annual Book of ASTM Standards, Vol. 4.02, ASTM International, West
Conshohocken, PA.
46. Stutzman, P. E. (2005). Powder Diffraction Analysis of Hydraulic Cements: ASTM
Rietveld Round Robin Results on Precision. ICDD-Advances in X-ray Analysis, 48 (1),
p. 33-38.
47. Stutzman, P. E. (1996). Guide for X-Ray Powder Diffraction Analysis of Portland
Cement and Clinker (NISTIR 5755). National Institute of Standards and Technology,
Building and Fire Research Laboratory, p. 1-38.

73
48. Leng, Y. (2008). Materials Characterization: Introduction to Microscopic and
Spectroscopic Methods. Singapore, J. Wiley & Sons, p. 45-79.
49. Maqsood, A., & Iqbal, K. (2010). Materials Characterization by Non-Destructive
Methods. Journal of the Pakistan Materials Society, 4 (1), p. 31-38.
50. ASTM C1365-06. (Reapproved 2011). “Standard Test Method for Determination of
the Proportion of Phases in Portland Cement and Portland-Cement Clinker Using X-
Ray Powder Diffraction Analysis” Annual Book of ASTM Standards, V. 04.02, ASTM
International, West Conshohocken, PA.
51. Saoût, G., Kocaba, V., & Scrivener, K. (2011). Application of the Rietveld Method to
the Analysis of Anhydrous Cement. Cement and Concrete Research, 41 (1), p. 133-
148.
52. Gutteridge, W. A. (1979). "On the Dissolution of the Interstitial Phases in Portland
Cement." Cement and Concrete Research, Vol. 9, pp. 319-324.
53. Taylor, H. F. W. (1997). Cement Chemistry, 2nd ed., Thomas Telford Publishing,
London, UK.
54. Taylor, J. C., Hinczak, I., Matulis, C. E. (2000). “Rietveld Full-Profile Quantification
of Portland Cement Clinker: The Importance of Including a Full Crystallography of the
Major Phase Polymorphs.” Powder Diffraction, Vol. 15, No. 1, pp. 7-18.
55. Courtial, M., de Noirfontaine, M. -N., Gasecki, G., Signes-Frehel, M. (2003).
“Polymorphism of Tricalcium Silicate in Portland Cement: A Fast Visual Identification
of Structure and Superstructure.” Powder Diffraction, Vol. 18, No. 1, pp. 7-15.
56. Chung, F. H. (1974). “A New X-Ray Diffraction Method for Quantitative
Multicomponent Analysis.” Advances in X-ray Analysis. New York, NY: Springer, pp.
106-115.
57. Wilson, William, K J Krakowiak, and F J Ulm. (2012). “Crystallinity of Cement
Clinkers: Application of Rietveld Refinement.” Concrete Sustainability Hub@MIT -
Research Profile Letter. http://cshub.mit.edu/sites/default/files/documents/04-2012
CSHub-News-Brief Final.pdf.
58. Jansen, D., C. Stabler, F. Goetz-Neunhoeffer, S. Dittrich, and J. Neubauer. (2011).
“Does Ordinary Portland Cement Contain Amorphous Phase? A Quantitative Study
Using an External Standard Method.” Powder Diffraction. Vol. 26, pp. 31-38.

74
59. Klug, H. P. & Alexander, L.E. (1974). X-ray Diffraction Procedures: For
Polycrystalline and Amorphous Materials. 2nd ed. Hoboken, NJ: John Wiley & Sons.
60. Mindess, S., Young, J. F., & Darwin, D. (2003). Concrete.2nd ed. Upper Saddle River,
NJ: Prentice-Hall.
61. ASTM C204-11. (2011). “Standard Test Method for Fineness of Hydraulic Cement by
Air-Permeability Apparatus” Annual Book of ASTM Standards, V. 04.01, ASTM
International, West Conshohocken, PA.
62. Mehta, P. & Monteiro, P. (1993). Concrete: Structure, Properties, and Materials. 2nd
ed. Englewood Cliffs, NJ: Prentice-Hall International Series in Civil Engineering and
Engineering Mechanics.
63. Malvern.com. (2009). Why switch from Blaine to PSD? [online] Available at:
http://www.malvern.com/processeng/industries/cement/blaine_to_PSD.htm
[Accessed on 16 Nov 2012].
64. Jillavenkatesa, A., Dapkunas, S. J., & Lum, L. (2001). Particle Size Characterization.
National Institute of Science and Technology (NIST), Special Publication 960-1, p. 1-
49.
65. HORIBA Instruments. (2001). LA-950 Instructional Manual (2001), Irvine, CA, p. 1-
96.
66. HORIBA Instruments. (2012). A Guidebook to Particle Size Analysis. [online]
Availableat:http://www.horiba.com/fileadmin/uploads/Scientific/Documents/PSA/PS
A_Guidebook.pdf [Accessed: 14 Nov 2012].
67. Wadsö, L. (2005). Applications of an Eight-channel Isothermal Conduction
Calorimeter for Cement Hydration Studies. Cement International, issue 5, p. 94–101.
68. TA Instruments. (2008). TAM Air Calorimeter Operator's Manual (2008), New Cable,
p. 1-64.
69. Sedaghat, A. R., Zayed, A. and Sandberg, P. (2013). “Measurements and Predictions
of Heat of Hydration of Portland Cement Using Isothermal Conduction Calorimetry.”
ASTM Journal of Testing and Evaluation. Vol. 41, No. 6, pp. 1-8.
70. Wadsö, L. (2010). Operational Issues in Isothermal Calorimetry. Cement and Concrete
Research, 40 (7), p. 1129-1137.

75
71. ASTM C403-08. (2008). “Standard Test Method for Time of Setting of Concrete
Mixtures by Penetration Resistance” Annual Book of ASTM Standards, V. 04.02,
ASTM International, West Conshohocken, Pa
72. Dodson, V.H. (1994). Time of Setting. In: Klieger, P. & Lamond, J. F. eds. (1994)
Significance of Test and Properties of Concrete and Concrete-Making Materials (STP;
169C). 4th ed. Philadelphia, PA: ASTM, p. 77-87.
73. ASTM C305-13. (2013). “Standard Practice for Mechanical Mixing of Hydraulic
Cement Pastes and Mortars of Plastic Consistency” Annual Book of ASTM Standards,
V. 04.01, ASTM International, West Conshohocken, PA.
74. ASTM C109-13. (2013). “Standard Test Method for Compressive Strength of
Hydraulic Cement Mortars (Using 2-in. or [50-mm] Cube Specimens)” Annual Book
of ASTM Standards, V. 04.01, ASTM International, West Conshohocken, PA.
75. Taylor, H. F. W. (1990). Cement chemistry. New York and London, Thomas Telford,
p. 123-166.
76. Wang, A., Zhang, C., & Ningsheng, Z. (1999). The Theoretic Analysis of the
Influence of the Particle Size Distribution of Cement System on the Property of
Cement. Cement and Concrete Research, 29 (11), p. 1721–1726.
77. ASTM C1581/C1581M-09a. (2009). “Standard Method for determining Age at
Cracking and Induced Tensile Stress Characterization of Mortar and Concrete under
Restrained Shrinkage” Annual Book of ASTM Standards, V. 04.01, ASTM
International, West Conshohocken, PA.
78. See, H.T., Attiogbe, E. K., & Miltenberger, M. A. (2004). Potential for Restrained
Shrinkage Cracking of Concrete and Mortar. Cement, Concrete, and Aggregate, 26
(2), p. 123-130.

76
APPENDIX A

77
Appendix A: Characteristics of Sand