Dudley Healthy Towns - Ecosystems Knowledge Findings: Whilst overall findings headlines are provided...
32
Dudley Healthy Towns Programme Evaluation Executive Summary Professor Derek M Peters and Dr Cheryl V Jones University of Worcester December 2011
Transcript of Dudley Healthy Towns - Ecosystems Knowledge Findings: Whilst overall findings headlines are provided...
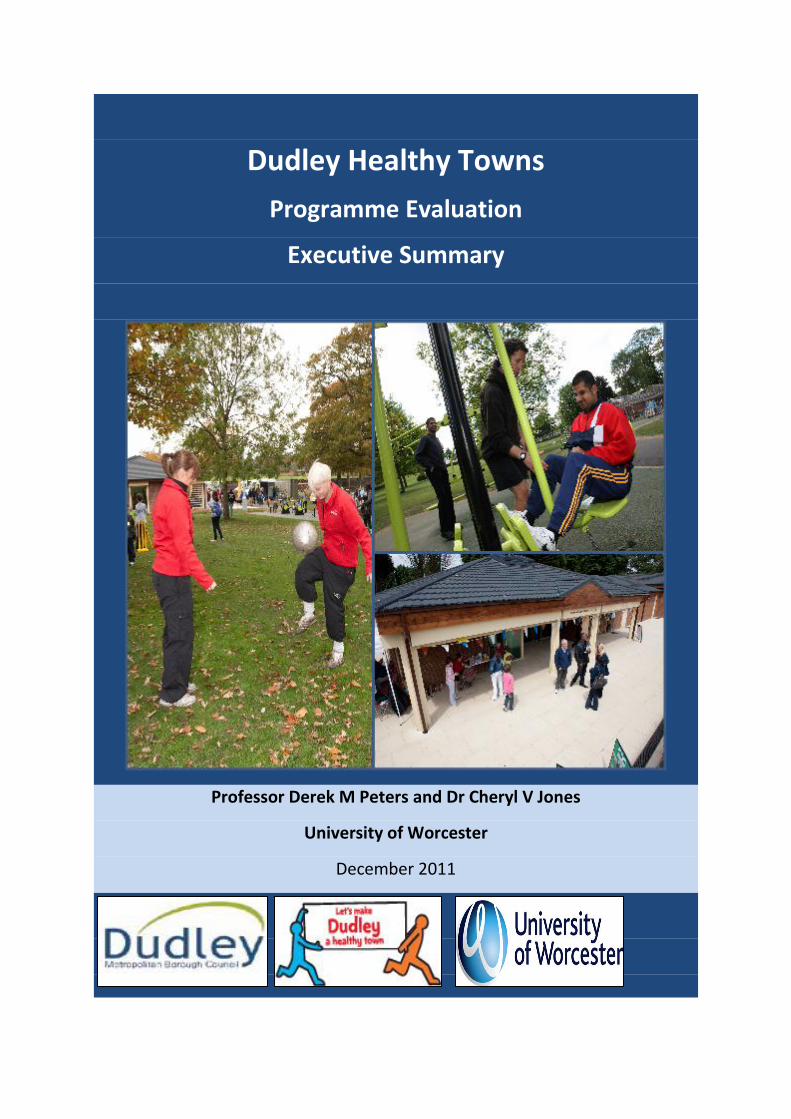
Dudley Healthy Towns
Programme Evaluation
Executive Summary
Professor Derek M Peters and Dr Cheryl V Jones
University of Worcester
December 2011

1
Acknowledgements
The Evaluation Team would like to thank the following people for their input and
assistance with the Evaluation of the Dudley Healthy Towns Initiative.
Dean Hill: Dudley Healthy Towns Programme Manager
Richard Webster: Hub photography
Kate Arnold: Communications and Public Affairs
Further information on the Dudley Healthy Towns Programme can be accessed via
the website http://www.dudleyhealthytowns.co.uk/
Programme Manager Dean Hill talking to the Mayor of Dudley Cllr Michael Evans
at the opening of one of the hubs
Evaluation Team
Dr Cheryl V Jones (Institute of Science and Environment)
Professor Derek M Peters (Institute of Sport and Exercise Science)
University of Worcester
Henwick Grove
Worcester
WR26AJ
http://www.worcester.ac.uk/
2
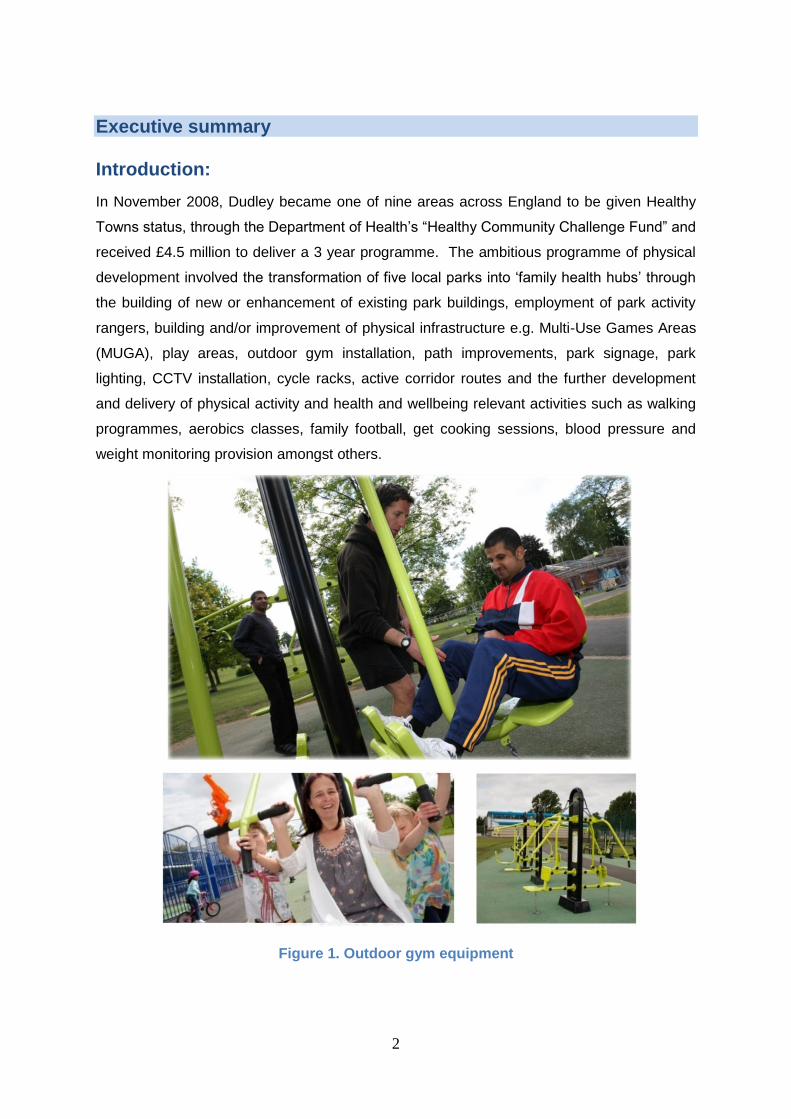
Executive summary Introduction:
In November 2008, Dudley became one of nine areas across England to be given Healthy
Towns status, through the Department of Health’s “Healthy Community Challenge Fund” and
received £4.5 million to deliver a 3 year programme. The ambitious programme of physical
development involved the transformation of five local parks into ‘family health hubs’ through
the building of new or enhancement of existing park buildings, employment of park activity
rangers, building and/or improvement of physical infrastructure e.g. Multi-Use Games Areas
(MUGA), play areas, outdoor gym installation, path improvements, park signage, park
lighting, CCTV installation, cycle racks, active corridor routes and the further development
and delivery of physical activity and health and wellbeing relevant activities such as walking
programmes, aerobics classes, family football, get cooking sessions, blood pressure and
weight monitoring provision amongst others.
Figure 1. Outdoor gym equipment
Silver Jubilee Park
3
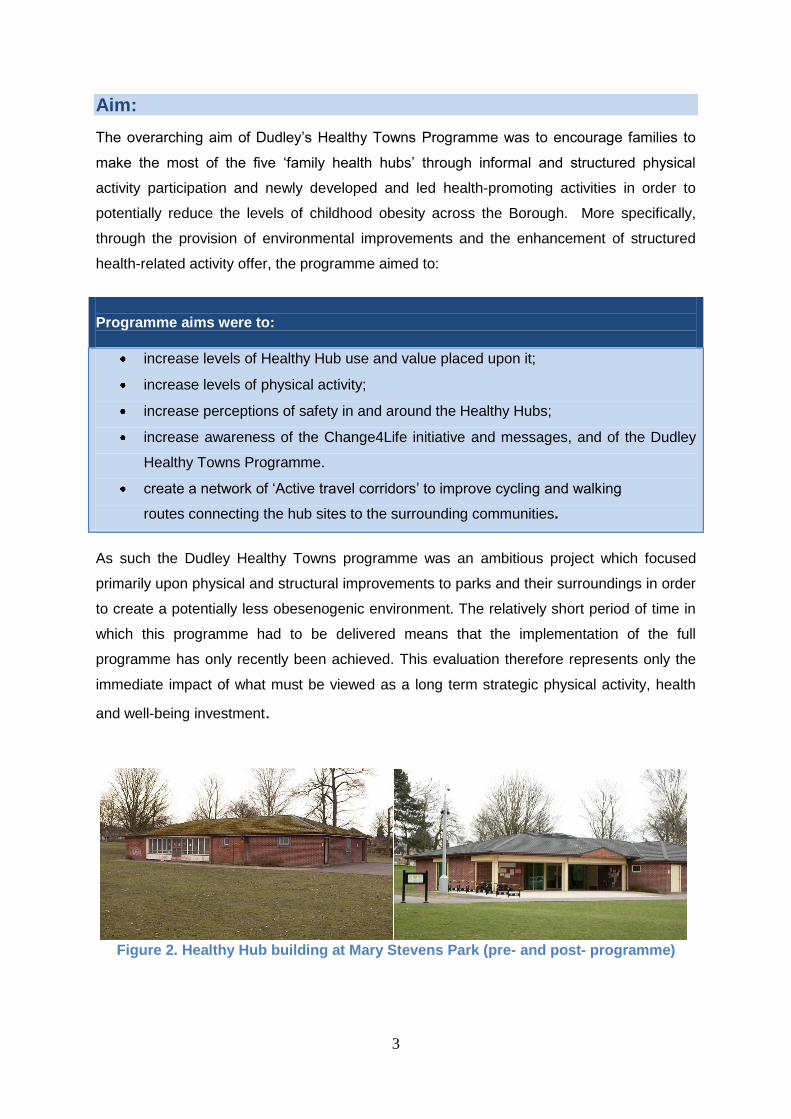
Aim:
The overarching aim of Dudley’s Healthy Towns Programme was to encourage families to
make the most of the five ‘family health hubs’ through informal and structured physical
activity participation and newly developed and led health-promoting activities in order to
potentially reduce the levels of childhood obesity across the Borough. More specifically,
through the provision of environmental improvements and the enhancement of structured
health-related activity offer, the programme aimed to:
Programme aims were to:
increase levels of Healthy Hub use and value placed upon it;
increase levels of physical activity;
increase perceptions of safety in and around the Healthy Hubs;
increase awareness of the Change4Life initiative and messages, and of the Dudley
Healthy Towns Programme.
create a network of ‘Active travel corridors’ to improve cycling and walking
routes connecting the hub sites to the surrounding communities.
As such the Dudley Healthy Towns programme was an ambitious project which focused
primarily upon physical and structural improvements to parks and their surroundings in order
to create a potentially less obesenogenic environment. The relatively short period of time in
which this programme had to be delivered means that the implementation of the full
programme has only recently been achieved. This evaluation therefore represents only the
immediate impact of what must be viewed as a long term strategic physical activity, health
and well-being investment.
Figure 2. Healthy Hub building at Mary Stevens Park (pre- and post- programme)

4
Evaluation method: The evaluation employed a three level multi-method approach:
Level one - reported park use and health relevant behaviours from healthy hub catchment area:
Population surveys (1.25km catchment around each Healthy Hub) performed in
summer 2009 and summer 2011.
Primary school assembly surveys performed in summer term 2010 and summer
term 2011.
Level two - actual park use and visitor perceptions:
Park visitor surveys performed in summer 2009, throughout 2010 and up to
the end of summer 2011.
Outdoor Gym surveys performed in summer 2010 and up to the end of
summer 2011.
Dudley Borough Council reported/recorded summer attendance figures
The data from Level two represent responses from identified hub users and visitors who
were present in the parks when completing the survey. As such these responses are from
validated hub users.
Level three - stakeholder narratives including process evaluation:
Level three data collection was subsequently reduced in scope, due to overlap
with the National Healthy Towns Evaluation Programme, and limited to
qualitative responses in the survey instruments and post-programme (summer
2011) collection of comments from relevant stakeholders.
The response rate for each level is summarised in Table 1.1 a Gantt Chart summarising
the pre- and post-survey timeline is provided in Appendix Four of the full report.

5
Figure 3. Halloween Events programme October 2010
Table Error! No text of specified style in document..1. Data collected for the evaluation into pre- and post- programme periods
Survey instrument Pre-programme (pre-October 2010)
Post-programme (post-October 2010)
Population surveys 2574 659
Visitor surveys 402 958
Outdoor gym surveys 61a 272
Park use observations 15 days 12 days
Primary school assembly ‘Qwizdom’ 364 237
Healthy school coordinator questionnaire - 4b
Healthy hub comment books / diaries - 3c aincluded in pre-programme as outdoor gyms in place before the hubs opened and the park activity rangers were in
post; breturned from 40 schools;
creturned from 3 hubs.
Learning from the evaluation methods employed: The baseline data collection instruments were too long, but were required to be so
due to the extensive scope of the evaluation;
Data obtained from park use observations, on a random date allocation basis are
vulnerable to inconsistencies due to a number of factors including variations in
weather conditions;
Online survey instruments are not the medium of choice for gathering data from park
users - personal contact appeared to maximise survey instrument completion;
Initially schools seemed less willing to participate in the baseline evaluation process
than anticipated at the outset, thus reducing he scope for evaluation from the under
16 age groups.
The evaluation was continually adapted due to revisions to the completion of the full
programme of improvements and associated activity programme delivery and as
6
such, this evaluation can provide only immediate-term data on a programme that has
only really just begun.
Recommendations for future evaluation: Develop survey instruments, each no more than 2 pages, focussed solely on project
outcomes, for each level of evaluation in order to maximise survey completion;
In applied evaluation work, be prepared to react quickly to opportunity. Whilst this
should be encouraged, the impact of such changes on increased evaluation staffing,
staff availability and overall costs needs to be considered;
Encourage schools to participate more fully in the generation of evidence in order to
gain access to the views of their pupils;
Use park activity rangers to generate the majority of future evaluation data as part of
their roles to evidence the short and longer term impact of the Programme;
Continue to evaluate the impact of the Dudley Healthy Towns Programme based on
the above recommendations, using data collected as a rolling programme throughout
the year by park activity rangers including park / facility usage observation, visitor
surveys, programme attendance figures and visitor comment diaries;
Further develop the evaluation of the only recently completed ‘active travel corridors’
as contributors to the success of the overall programme;
Seek further evaluation funding to enable the repeat of the (shortened) population
surveys, visitor surveys and enhanced school surveys in summer 2013 and every
two years subsequently to provide more robust data for the short and long term
evaluation of the programme

7
Findings:
Whilst overall findings headlines are provided in this executive summary, it must be
acknowledged that in general, there were differences apparent in responses to similar
questions asked across the different survey instruments used reflecting the responses of
Level one ‘reported users’ (population and school survey respondents) versus Level two
‘actual users’ (visitor survey respondents). Despite the relatively consistent overall
summaries for the group of five Healthy Hubs collectively, there were also marked
differences in the findings for some questions between individual Healthy Hubs. For
complete extrapolation and comprehension of these differences, it is necessary to explore
the full report.
Demographic comparisons:
Level one: reported park use and perceptions from healthy hub catchment area:
Population surveys: Respondents participating in the 2009 pre-programme survey were
invited to complete the 2011 post-programme survey. This enabled within-individual
comparisons of change in park usage and physical activity levels from pre- to post
programme. Statistical analysis was conducted to compare the demographic profile of
respondents participating in both survey periods (Wilcoxon Ranks). There was no significant
statistical difference in gender, ethnicity, or disability status between the pre and post-
programme population surveys. However, there was a statistically significant difference in
age group (p=0.000) from pre-to post-programme.
School Assembly Surveys: Statistical analysis was conducted to compare the age and
gender characteristics of respondents participating in the 2010 and 2012 school assembly
surveys. Different individuals participated in each survey period and therefore respondents
were treated as independent samples for analysis (Mann-Whitney U). There was no
significant statistical difference in gender or age between the 2010 and 2011 school
assembly surveys.
Level two evidence: actual park use and visitor perceptions:
Visitor Surveys: Statistical analysis was conducted to compare the demographic profile of
respondents participating in the pre and post-programme visitor surveys. Due to the nature
of the survey process it was inevitable that different individuals participated in each survey
8
period and therefore respondents were treated as independent samples for analysis (Mann-
Whitney U). There was no significant statistical difference in age group, ethnicity or disability
status. However, there was there was a statistically significant difference in gender between
the two survey periods (p=0.027).
Increased levels of Healthy Hub use and value:
Level one: reported park use and perceptions from healthy hub catchment area:
The percentage of hub catchment population respondents who stated that they visited
their Healthy Hub at least once per week increased from 41% pre-programme to 45%
post-programme. However, The increase was most evident for the Silver Jubilee Park
Healthy Hub (increased from 29% to 49%). This would suggest an increase in frequency
of Hub use in the catchment areas. The increase in Hub usage was not statistically
significant p=0.140.
The most common visit duration reported by the hub catchment population remained at
‘30 minutes to one hour’ which increased from 47% to 51% of respondents. This
indicates an increase in visit duration that is attributable to more than just ‘passing
through’ the Hubs. Overall, there was a statistically significant increase in visit duration
across all Hubs p= 0.025.
The most common visit profile pre- and post- programme for the population survey was
for respondents to visit on both weekdays and at weekends.
The new facilities used by the greatest percentages of respondents to the hub catchment
population survey across the five Healthy Hubs overall were the footpath improvements
(64%), the play area (59%), the outdoor gym (54%) and the Healthy Hub signage (48%).
The lowest percentages were for the health and well-being programmes (10%), the cycle
racks (13%), and the physical activity programmes (14%).
Overall the value placed on the five Healthy Hubs as open spaces for population survey
identified users to do physical activity increased with the combined categories of ‘at least
valuable’ increasing from 68% pre- to 74% post- programme. This increase was
statistically significant p= 0.012 suggesting a greater percentage of respondents now
valued their park highly as a location to participate in physical activity.
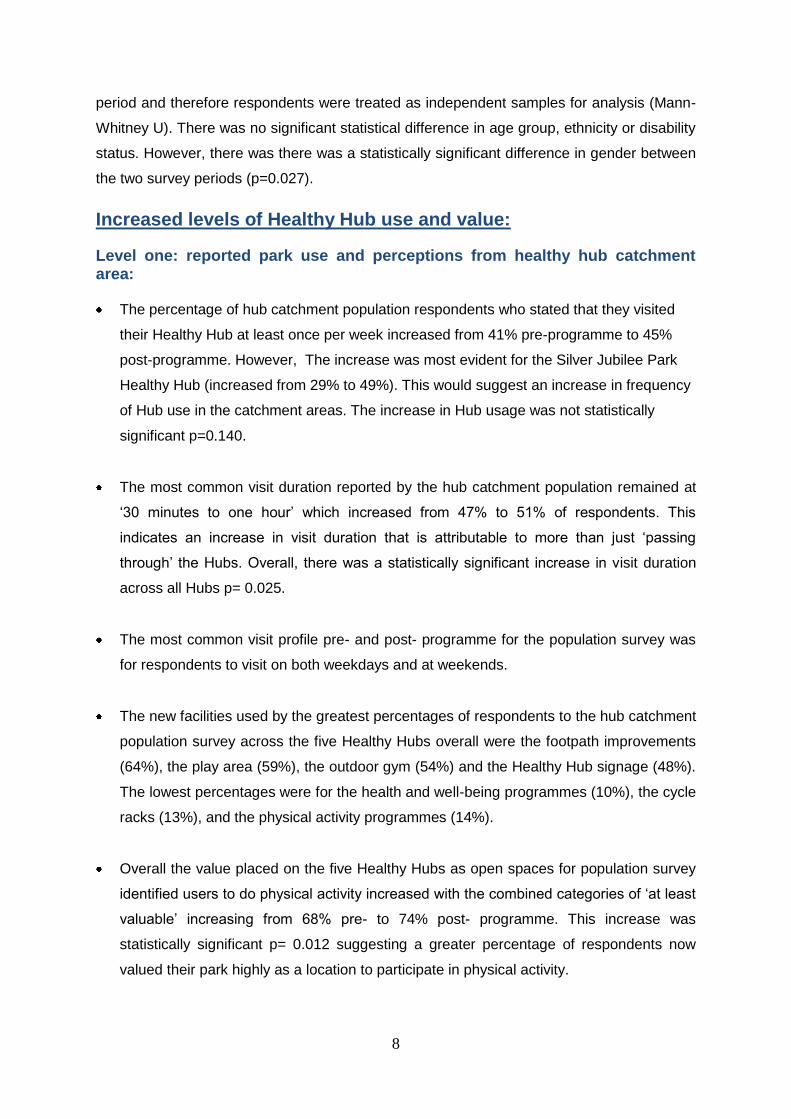
9
Overall, ratings of the new or improved facilities from the post-programme population
survey were positive with the percentages rating the facility as at least ‘good’ of 82% for
the outdoor gyms; 78% for the children’s play area; 74% for the MUGA and Hub
buildings; 70% Healthy Hub signage; 68% for the footpaths; 67% for the organised
physical activity programmes; 62% for the organised health and wellbeing programmes;
55% for the cycle racks; 50% for the park staffing and 40% for the toilet facilities. The
outdoor gyms were therefore the most highly rated improvement made as part of the
park facility infrastructure.
Overall condition of the five Healthy Hubs was identified to have improved in the last 12
months by 72% of the respondents to the post-programme population survey.
Ratings of the facilities overall from the population surveys demonstrated a consistent
pattern of improvement from pre- to post- programme with the percentage of
respondents rating the facility as ‘at least good’ shown in Table 1.2. As such, all facilities
and infrastructure originally present in the parks were also perceived to have benefitted
from the Healthy Towns programme.
Table 2. Percentage of respondents identifying facility as ‘at least good’ in pre- and post- programme population surveys overall.
Facility: Pre-programme Post-programme Increase
Park staffing 31 44 13
Sports facilities 35 57 22
Events 37 53 16
Health activities 15 44 29
Sports coaching 16 34 18
Maintenance 54 66 12
Toilets 14 31 17
Disabled access 62 66 4
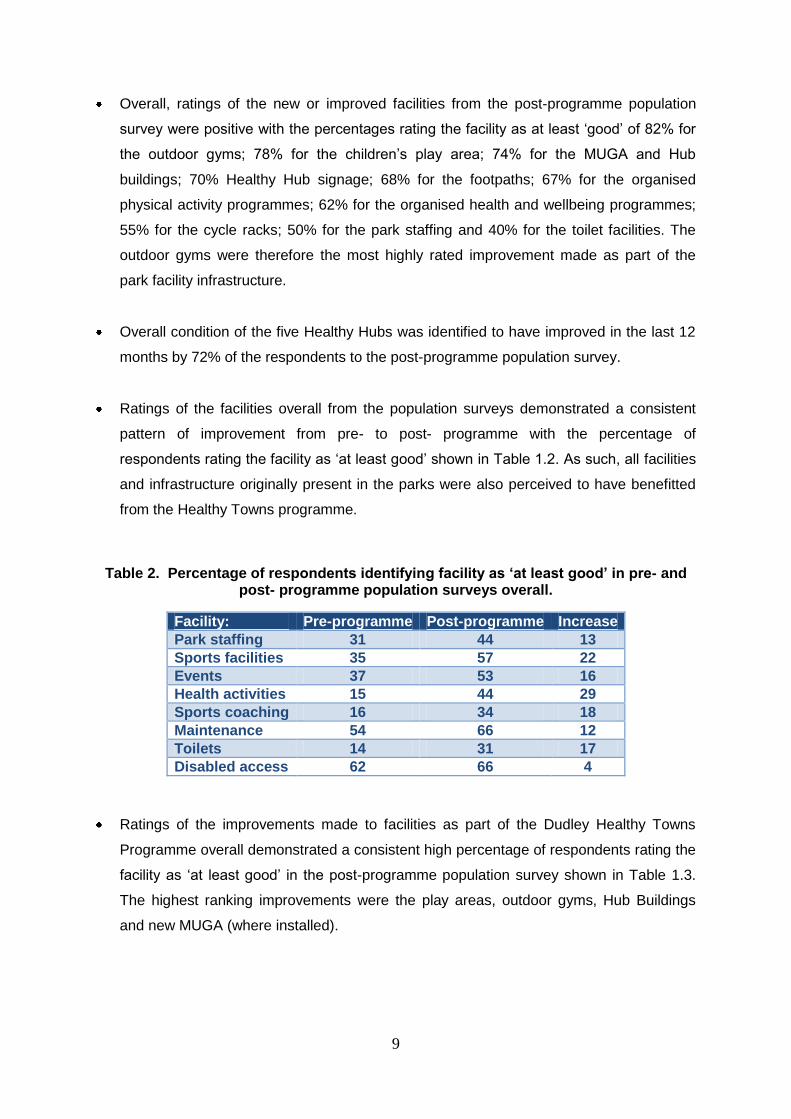
Ratings of the improvements made to facilities as part of the Dudley Healthy Towns
Programme overall demonstrated a consistent high percentage of respondents rating the
facility as ‘at least good’ in the post-programme population survey shown in Table 1.3.
The highest ranking improvements were the play areas, outdoor gyms, Hub Buildings
and new MUGA (where installed).
10
Table 3. Rating of improvement made as part of the Dudley Healthy Towns Programme (percentage of respondents to the post-programme population survey
rating the improvement as ‘at least good’).
Rating of improvement made to: % ‘at least good’
Cycle racks 55
Park Staff 50
Children’s play area 88
Toilets 48
Hub building 74
Organised PA sessions 67
Organised Health and Wellbeing sessions 62
MUGA 74
Outdoor Gym 82
Footpaths and floor markings 68
Hub signage 70
In primary school children there were reductions in the shortest visit durations (11%
down 3 to 8%) and increases in visit durations over two hours (20% up 5 to 25%) from
pre- to post- programme, demonstrating a positive shift in visit duration profile. There
was a statistically significant increase in visit duration for the Dell and Fens Pool Hub (p
0.015). However, overall there was no significant change in visit duration across all Hubs
(p=0.705).
The most common visit profile pre- and post- programme for primary school aged was
for respondents to visit on both weekdays and at weekends.
79% of schoolchildren identified the improvements made in the Healthy Hubs as at least
‘good’ with 53% identifying them as ‘brilliant’ thus representing a very positive profile
from the children surveyed.
Level two evidence: actual park use and visitor perceptions
The percentage of visitor survey respondents who stated that they visited their Healthy
Hub at least once per week increased from 41% pre-programme to 45% post-
programme. However, there was a statistically significant decrease in visit regularity
across all Hub sites (p=0.002) from pre- to post programme.
The most common visit duration reported from those surveyed actually in the Healthy
Hubs was ‘1 to 2 hours’ both pre- and post- programme. There was a notable decrease

11
in visits of less than 30 minutes (22% to 14%), and a notable increase in the visit
duration of ‘two to four hours’ (12% to 21%) suggesting that respondents are now staying
in the Hubs for longer periods of time post-programme. The increase in visit duration
across all hubs was statistically significant (p=0.000). Statistically significant increased
visit durations were observed in Huntingtree Park (p=0.000), Mary Stevens park
(p=0.024) and Silver Jubilee Park (p=0.003).
The most common visit profile pre- and post- programme for the visitor survey was for
respondents to visit on both weekdays and at weekends.
Visitor surveys identified ‘visiting with children’ as the most common response and this
showed a notable increase from 28% to 44% of respondents from pre- to post-
programme suggesting a more family oriented environment.
The facilities used by the greatest percentages of visitors to the five Healthy Hubs were
the play areas (56% rising to 64%), the outdoor gym (36% rising to 57%), the toilets
(31% rising to 43%), and the footpaths (29% rising to 48%). Of the new
facilities/provision, the organised physical activity sessions (31%), the Hub buildings
(27%), the Hub signage (25%) and the health and wellbeing sessions (22%) were
highest. Increased use of the park staff (12% rising to 22%), the MUGA (5% rising to
17%) and cycle racks (7% rising to 15%) was also observed. The visitor survey data
therefore reflected that given in the Level one evidence relating to the increase use of
play areas and outdoor gyms.
Overall condition of the five Healthy Hubs was identified to have improved in the last 12
months by 89% of the respondents to the post-programme visitor surveys, again in
agreement with the improvement in condition identified from Level one evidence.
Ratings of the facilities overall from the visitor surveys demonstrated a consistent pattern
of improvement from pre- to post- programme with the percentage of respondents rating
the facility as ‘good’ shown in Table 1.4. As validated park visitors, these ratings were
much better for the improvement to the delivery of activities for actual Hub users e.g.
health and wellbeing sessions and organised physical activity sessions, than reflected in
the Level one evidence from the more ‘remote’ responses to the population surveys. To
this end, these data may be reflective of a more informed point of view.
12
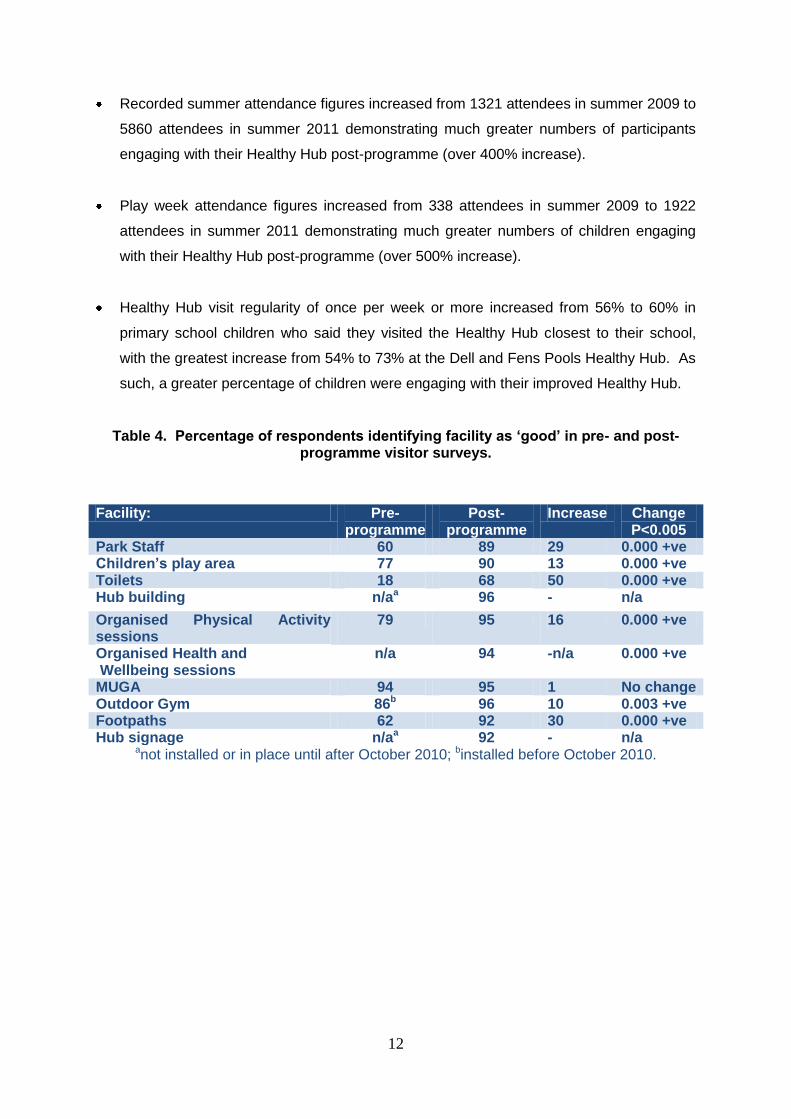
Recorded summer attendance figures increased from 1321 attendees in summer 2009 to
5860 attendees in summer 2011 demonstrating much greater numbers of participants
engaging with their Healthy Hub post-programme (over 400% increase).
Play week attendance figures increased from 338 attendees in summer 2009 to 1922
attendees in summer 2011 demonstrating much greater numbers of children engaging
with their Healthy Hub post-programme (over 500% increase).
Healthy Hub visit regularity of once per week or more increased from 56% to 60% in
primary school children who said they visited the Healthy Hub closest to their school,
with the greatest increase from 54% to 73% at the Dell and Fens Pools Healthy Hub. As
such, a greater percentage of children were engaging with their improved Healthy Hub.
Table 4. Percentage of respondents identifying facility as ‘good’ in pre- and post- programme visitor surveys.
Facility: Pre- programme
Post-programme
Increase Change P<0.005
Park Staff 60 89 29 0.000 +ve Children’s play area 77 90 13 0.000 +ve Toilets 18 68 50 0.000 +ve Hub building n/aa 96 - n/a
Organised Physical Activity sessions
79 95 16 0.000 +ve
Organised Health and Wellbeing sessions
n/a 94 -n/a 0.000 +ve
MUGA 94 95 1 No change Outdoor Gym 86b 96 10 0.003 +ve Footpaths 62 92 30 0.000 +ve Hub signage n/aa 92 - n/a
anot installed or in place until after October 2010; binstalled before October 2010.
13
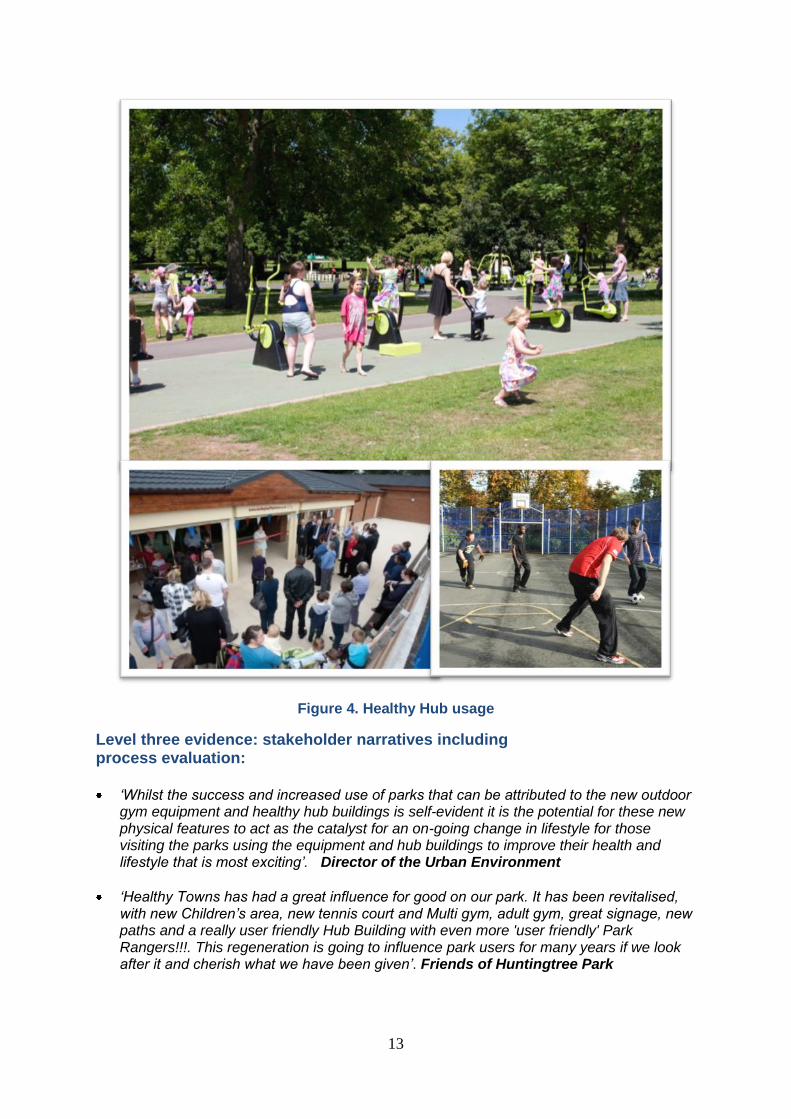
Figure 4. Healthy Hub usage
Level three evidence: stakeholder narratives including process evaluation: ‘Whilst the success and increased use of parks that can be attributed to the new outdoor
gym equipment and healthy hub buildings is self-evident it is the potential for these new physical features to act as the catalyst for an on-going change in lifestyle for those visiting the parks using the equipment and hub buildings to improve their health and lifestyle that is most exciting’. Director of the Urban Environment
‘Healthy Towns has had a great influence for good on our park. It has been revitalised, with new Children’s area, new tennis court and Multi gym, adult gym, great signage, new paths and a really user friendly Hub Building with even more 'user friendly' Park Rangers!!!. This regeneration is going to influence park users for many years if we look after it and cherish what we have been given’. Friends of Huntingtree Park
14
‘It is an excellent opportunity and the majority of the feedback I have received from the public has been brilliant’. Leap over 60
‘I only wish that other local authorities and PCT’s follow the same approach that has been taken in Dudley, and that this can become the benchmark for others to set their standards against. If this initiative was replicated nationwide, the whole nation would be a healthier happier place’. Park Ranger
‘It really feels like a proper park and certainly visitors to the park have increased because of the activities’. Post-programme population survey: Mary Stevens Park
This is making a real difference because we have more families and individuals using these facilities, particularly in our parks, and trying to improve their lifestyle. Chief Executive
Conclusions and Recommendations: Increased levels of Healthy
Hub use and value
Conclusion: Overall, the Healthy Hub improvements have resulted in increased
park use and increased value placed on the parks by those that use
them.
Recommendation: At least maintain the current standard of facilities, provision and
awareness activities to further engage communities with their
new Healthy Hubs.
Conclusion: Accept that some people are less likely to use parks irrespective of
improvements made or attempts made to engage them in the park
user community.
Recommendations: Seek to consult further with these (and indeed all) members of
the local communities to identify what (if any) additional
facility/provision might engage them with their local Healthy Hub
in future or what (if any) alternative opportunities for physical
activity participation might be of more interest to them;
Use the findings from such consultation to more actively target
provision at the specific groups (primary school age; secondary
school age; 16-18 year olds, young adults; families; unemployed;
employed; retired etc.) through, for example greater use of
15
evening and weekend supervised provision and promotion of
alternate use of the Hub building space for social and community
activities and the kitchens as retail outlets for healthy food and
beverages.
Conclusion: Accept that some people will prefer to use other parks due to for
example, closer proximity to home (perceived or otherwise) or
preference for more expansive country parks.
Recommendation: Seek funding to enable promotion of greater urban park use
across the borough per se through investment in similar
improvements in other community-selected park sites to make
these alternate sites even more engaging.
Conclusion: Park users seem to be dichotomous in relation to being very regular or
rather infrequent users.
Recommendation: Continue to support the provision for regular park users and
consult with less frequent park users to identify what facilities
and/or offer may encourage their more frequent use;
Consider greater use of park rangers to go out into the
communities to promote the Healthy Hubs and the provision on
offer through regular attendance at schools, youth groups,
community meetings etc. to enhance the profile of the Hubs
overall.
Conclusion: A common barrier to park use, accentuated potentially due to the older
age range of respondents to most survey instruments, remains as
mobility problems limiting park accessibility.
Recommendations: Encourage community groups and/or council initiatives to
provide transport or assisted access to the Healthy Hubs for
those with access limiting mobility problems;
Further develop activity provision specifically for local
community members with access limiting mobility problems to
make such sessions more salient to them;

16
Further raise awareness in the local communities regarding the
improvements made to active corridors, improvements made to
park access points, and improvements made to within-Hub paths
and toilets.
Figure 5. Healthy Hub notice board
17
Increased levels of physical activity:
Level one evidence: reported park use and perceptions from healthy hub catchment area:
The perception of at least ‘usually’ doing enough physical activity to receive health
benefits increased from 54% pre- to 59% post- programme in the population survey
demonstrating an increase in reported hub catchment physical activity. However, this
change was not statistically significant (p=0.276).
There was an increase in the percentage of respondents reporting completing 30
minutes of moderate intensity physical activity on five days of the week ‘at least often’
from 46% pre- to 51% post- programme in the population surveys, thus identifying a
positive shift in health related physical activity participation. This change was not
statistically significant (p=0.071). However, there was a statistically significant increase in
the number of respondents participating in more than 20 minutes of vigorous physical
activity (p=0.039).
The percentage of respondents to the population surveys who were categorised as park
users and who identified themselves as ‘walking more than once per week’ in the
Healthy Hub increased from 19% pre- to 24% post- programme, demonstrating
increased physical activity within the Healthy Hubs.
Walking remained the most common means for reported park users to commute to the
Healthy Hubs and increases in walking to the Healthy Hubs overall were due to large
increases in walking access to the Dell and Fens Pool and Netherton Park Hubs.
From the population surveys, there was little change in active commuting to work or the
value placed upon active commuting as a contribution to overall levels of physical
activity, with the impact of the Active Corridor improvements. The benefits of this
improvement have yet to be fully realised due to their recent completion.
Overall, cycling within the Healthy Hubs was not often reported by respondents to the
population surveys, with the majority both pre- and post- programme cycling in the Hubs
less than once per week (both 99%). This may in some part be due to the cycling
‘barriers’ within local bye-laws that have now been revised as a result of the Programme
to encourage ‘responsible cycling’ in the Healthy Hubs.

18
The percentage of schoolchildren reporting ‘5 or more days of achieving 60 minutes of
moderate intensity physical activity’ increased from 49% pre-programme to 54% post-
programme. This demonstrates a positive shift in health enhancing levels of physical
activity participation in the children surveyed.
The percentage of school children reporting they cycle around the park ‘at least most
times’ increased from 26% pre- to 30% post- programme. The percentage of school
children reporting they never cycle in the Healthy Hubs dropped from 24% to 18%.
72% of school children stated that the improvements in their Healthy Hubs had made
them more physically active.
School children identified the new facility that was most effective in increasing their level
of physical activity as the outdoor gym equipment (Netherton 73%; Mary Stevens 69%;
Huntingtree 61%) and the children’s play area (Dell and Fens Pools 44%). Again, the
Outdoor gyms were the most popular new facility. This change was statistically
significant (p=0.035).
Level two evidence: actual park use and visitor perceptions
68% of outdoor gym users reported they were more physically active as a result of using
the outdoor gym than they would otherwise have been.
70% of outdoor gym users reported they visited their local park more often as a result of
using the outdoor gym.
63% of outdoor gym users reported they were looking at other ways to be physically
active as a result of using the outdoor gym. Taken in combination, the above three
statistics identify that outdoor gym use directly increased park use, directly increased
levels of physical activity and indirectly encouraged users to consider other ways to
become more physically active also.
Overall, in the visitor surveys there was a reduction in the percentage of respondents
who visited the Healthy Hubs to be physically active (43% to 34%) and an increase in the
percentage who visited to relax and take it easy (42% to 60%) from pre- to post-
programme. Using the Healthy Hubs as commuting routes also declined from 16% pre-
19
to 7% post- programme. Overall, this profile does not support the previous data
regarding increased physical activity. It is still promising however as a greater
percentage of respondents view their Healthy Hub as a place in which they can feel
relaxed.
75% of respondents to the visitor surveys, who identified visiting the Healthy Hubs with
Children aged under 16, identified that their child/children, went to their Healthy Hub to
be physically active. This, in combination with the previous statistic, supports the
contention that the Healthy Hubs are seen as places more for children to be physically
active rather than adults.
Level three evidence: stakeholder narratives:
‘I feel more healthy and fit. I get out more since coming to the gym I've lost over 4 stone which if the gym wasn't here I would not have lost it. I have now become a health freak’
Outdoor gym user: Silver Jubilee Park
‘We all use the equipment daily or twice daily and cycle to the area and then because we feel more active we then cycle for at least half hour afterwards’.
Outdoor gym user: Dell and Fens Pools
‘I feel fitter since using the outdoor gym. I bring my children to the park more often and try to think of other outdoor activities we can do together’.
Outdoor gym user: Huntingtree Park
‘I think it’s a brilliant way of getting people involved in activities free of charge, but the times of organised events suit part time or non-working people’.
Post-programme population survey: Mary Stevens Park
‘My children like riding their bikes down to the park and it is much easier now’. Visitor survey: Dell and Fens Pools
‘For the first time for years I have seen families picnicking on the park and children just enjoying themselves in the open air’.
Friends of Huntingtree Park
‘I have often wished to use gym equipment but the cost of a gym put me off. I like using it in the open air, and without needing to wear special clothes or attend at special times’.
Outdoor gym user: Mary Stevens Park

20
Conclusions and Recommendations: increased levels of physical
activity
Conclusion: Overall, and acknowledging the limitations of only self-report
measures, there is evidence to suggest that local communities have
increased their attainment of guideline levels of physical activity
associated with health benefits.
Recommendation: Continue to promote the facilities and provision in the Healthy
Hubs as a borough–wide, Change4Life branded flagship
programme for raising physical activity and health and wellbeing
awareness through promotion of healthy guidelines;
Consider future evaluation using more objective measures of
physical activity monitoring and assessment in targeted groups.
Conclusion: The majority of adult Park users go to the Healthy Hubs to relax rather
than to be physically active.
Recommendation: Consider the fact that users find the Healthy Hubs safe and
appropriate environments in which to relax as a positive outcome
of the Programme and of potential benefit to their mental health
and wellbeing;
Develop strategies to consult with these users regarding their
physical activity preferences and subliminally promote physical
activity opportunities to these users to encourage their FUTURE
participation in such opportunities.
Conclusion: Walking remains the main physical activity undertaken by the park
users and local community, with cycling rather limited in its
representation.
Recommendations: Continue to promote walking and associated improvements in
led-walks (including Nordic walking), active corridor walking
21
relevant signage, and access and floor improvements within the
Hubs;
Further publicise the active corridor improvements and removal
of complete cycling restrictions within the Hubs to encourage
further cycling participation through use of the safer routes and
more accommodating approach to cycling within the Hubs
themselves.
Conclusion: The improvements do not yet appear to have impacted upon active
transport use or perceived benefits of such use for physical activity
overall.
Recommendation: Remember that these were the last improvements to be made
and maximise publicity of these improvements locally and across
the borough more widely as the interconnecting routes between
Hubs.
Conclusion: School children rate the facilities highly, enjoy using them and stated
that they had increased their levels of physical activity as a result of
the improvements made.
Recommendation: Further develop relationships with all schools within each
Healthy Hub community to build upon the impact that the
facilities are having on this especially important section of the
community.
Conclusion: The installation of the outdoor gyms would appear to be the singular
most appreciated improvement for reported increase in physical
activity and increases in fitness, health and wellbeing.
Recommendations: Provide similar equipment across the borough where possible, in
parks and other school and community settings and further
evaluate its specific impact;
Explore the development/installation of outdoor gym equipment
suitable for children aged under 12.
22
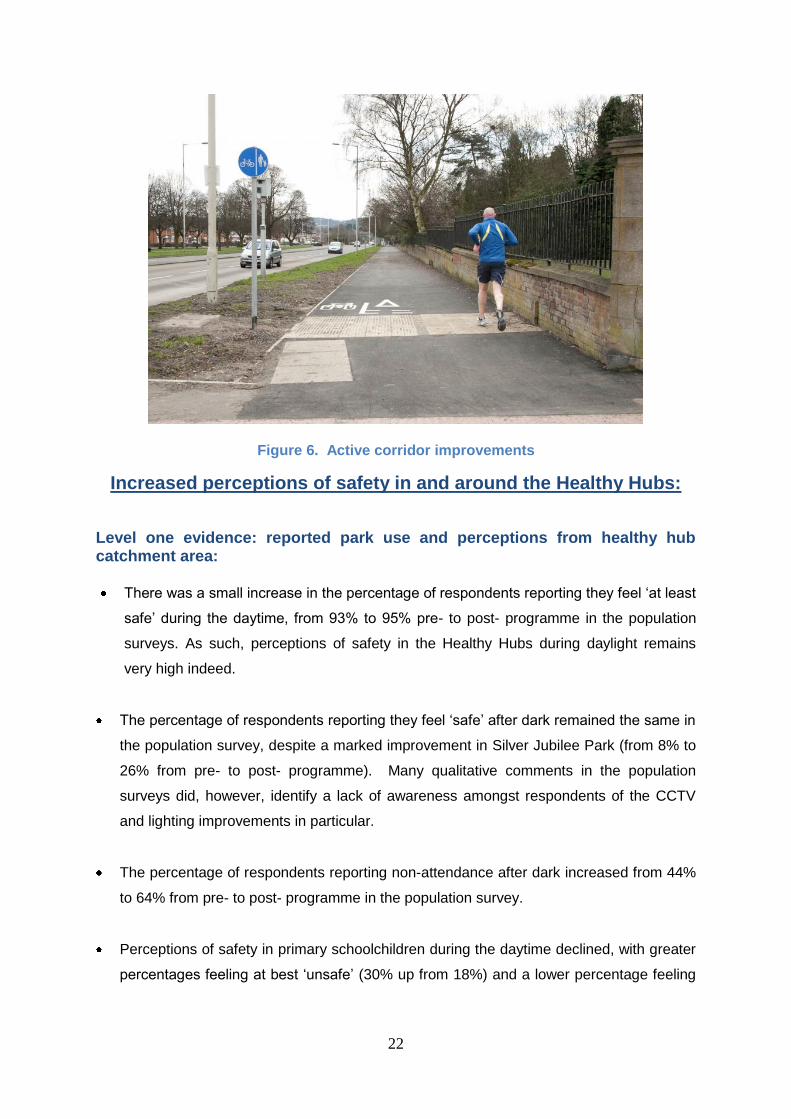
Figure 6. Active corridor improvements
Increased perceptions of safety in and around the Healthy Hubs:
Level one evidence: reported park use and perceptions from healthy hub catchment area:
There was a small increase in the percentage of respondents reporting they feel ‘at least
safe’ during the daytime, from 93% to 95% pre- to post- programme in the population
surveys. As such, perceptions of safety in the Healthy Hubs during daylight remains
very high indeed.
The percentage of respondents reporting they feel ‘safe’ after dark remained the same in
the population survey, despite a marked improvement in Silver Jubilee Park (from 8% to
26% from pre- to post- programme). Many qualitative comments in the population
surveys did, however, identify a lack of awareness amongst respondents of the CCTV
and lighting improvements in particular.
The percentage of respondents reporting non-attendance after dark increased from 44%
to 64% from pre- to post- programme in the population survey.
Perceptions of safety in primary schoolchildren during the daytime declined, with greater
percentages feeling at best ‘unsafe’ (30% up from 18%) and a lower percentage feeling
23
at least ‘safe’ (70% down from 83%). The reduction in perception of safety during the
daytime was statistically significant (p=0.037).
Schoolchildren overall demonstrated an increased desire not to attend the Healthy Hubs
after dark. That identified, the feelings of lack of safety in those who did attend the Hubs
after dark appeared to reduce from 46% to 34% from pre- to post- programme. However,
this was not statistically significant.
Level two evidence: actual park use and visitor perceptions
Visitor perceptions of safety across the five Healthy Hubs were high during the daytime,
with over 90% reporting feeling at ‘safe’ in both pre- and post- programme survey
periods. However, overall there was a statistically significant decrease in the number of
respondents who reported they feel ‘safe’ p=0.000).
The percentage of respondents reporting they feel ‘safe’ after dark remained the same in
the visitor surveys.
Agreement with CCTV as an effective means for increasing safety in the Hubs was
variable, with an average of 27% respondents in agreement across all Hubs. Silver
Jubilee Park (54%) and Huntingtree Park (41%) had by far the greatest positive
responses, whereas the Dell and Fens Pools was very low in comparison (5%).
Qualitative comments did, however, demonstrate a lack of awareness of the new facility
and a lack of understanding in its use for deterring anti-social behaviour.
New lighting was seen by a minority to be effective for increasing safety in the Hubs after
dark (25%) with some qualitative comments suggesting that this was due to the lighting
being located specifically around the Hub buildings and new activity facilities rather than
more liberally throughout the Healthy Hub and it’s pathways.
24
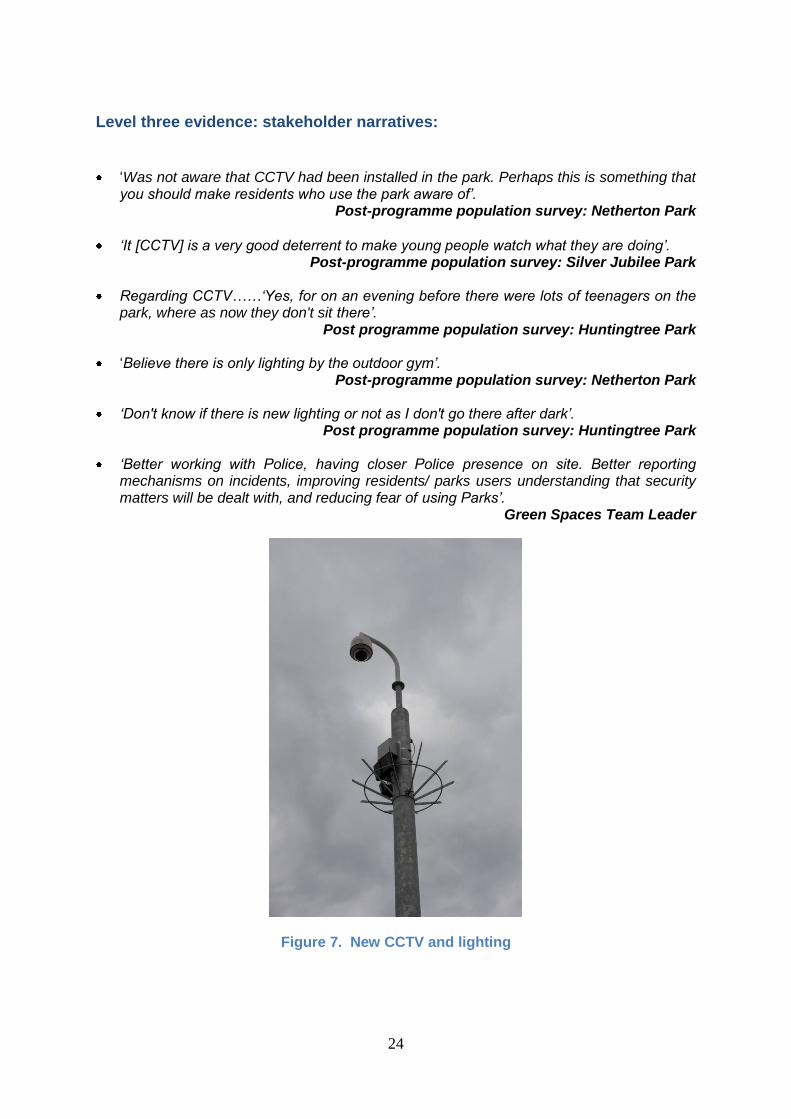
Level three evidence: stakeholder narratives: ‘Was not aware that CCTV had been installed in the park. Perhaps this is something that
you should make residents who use the park aware of’. Post-programme population survey: Netherton Park
‘It [CCTV] is a very good deterrent to make young people watch what they are doing’. Post-programme population survey: Silver Jubilee Park
Regarding CCTV……‘Yes, for on an evening before there were lots of teenagers on the park, where as now they don't sit there’.
Post programme population survey: Huntingtree Park
‘Believe there is only lighting by the outdoor gym’. Post-programme population survey: Netherton Park
‘Don't know if there is new lighting or not as I don't go there after dark’. Post programme population survey: Huntingtree Park
‘Better working with Police, having closer Police presence on site. Better reporting mechanisms on incidents, improving residents/ parks users understanding that security matters will be dealt with, and reducing fear of using Parks’.
Green Spaces Team Leader
Figure 7. New CCTV and lighting

25
Conclusions and Recommendations: Increased perceptions of
safety in and around the Healthy Hubs:
Conclusion: A common and prominent barrier to park use remains as perceived
anti-social behaviour
Recommendation: Continue to work with the Police to commit further to visible
policing of each of the Healthy Hubs and to engage in community
outreach programme to embed ownership of the Hubs within
their local communities.
Conclusion: The local community and even Healthy Hub users were not at all
aware of the presence of the two main park facility improvements
designed to enhance safety: CCTV and lighting.
Recommendations: Raise awareness of the presence of the CCTV and in so doing
identify how it is monitored; commit to using this facility to
reduce anti-social behaviour in the Healthy Hubs and seek as
much publicity as possible with any such positive outcomes for
reductions in anti-social behaviour that come about from it’s use;
Raise awareness of the presence of the new lighting around the
Hub building and outdoor gym equipment, and further
investigate the potential for additional lighting away from the Hub
buildings to light more of the access routes and paths to the
buildings.
Conclusion: The vast majority of people do not go to their Healthy Hub in the dark.
Recommendation: Either accept this as a normal park use profile or enhance
lighting and CCTV throughout each Hub (rather than around the
buildings only) and give members of the local communities
reasons to attend the Hub in the dark e.g. evening led activity
sessions, health and wellbeing workshops.
26
Increased awareness of the Change4Life initiative and messages and
awareness of the Dudley Healthy Towns Programme:
Level one evidence: reported park use and perceptions from healthy hub catchment area:
There was an increase in awareness of the Change4Life initiative overall from the
population surveys with 54% of respondents aware of it post-programme compared to
46% pre-programme, demonstrating a positive shift in awareness of the campaign and
it’s messages.
Post-programme, 95% of all schoolchildren surveyed had heard of the Change4Life
initiative, demonstrating a very high level of awareness
Whilst the most common single means of becoming aware of the Change4Life initiative
was from television adverts both pre- and post- programme (54% and 35% respectively),
there was an increase in local Dudley initiatives as the first point of awareness from 26%
pre- to 41% post- programme, thus exceeding the effectiveness of the national television
campaigns post-programme.
Responses to all Change4Life healthy diet awareness and sedentary behaviour
questions in the population surveys demonstrated an improvement in healthy diet
awareness and reduction in sedentary habits from pre- to post- programme.
Responses to all Change4Life healthy diet awareness questions in the primary school
surveys demonstrated an improvement in healthy diet awareness from pre- to post-
programme.
There was an increase from 83% to 86% in the percentage of respondents to the
population survey, and an increase from 79% to 81% of children surveyed able to
correctly identify the Change4Life slogan as ‘Eat well, move more, live longer’. As such,
people were not just aware of the campaign, they had absorbed its headline message.
Post-programme, 35% of respondents to the population survey identified that they felt
they were able to achieve a healthy lifestyle through the choices they made compared to
31% pre-programme.

27
The percentage of respondents to the population survey who were at least ‘very’
confident in their ability to manage their family’s weight through increasing their level of
physical activity increased from 23% pre-programme to 28% post-programme. This
increase was statistically significant (p=0.007).
The percentage of respondents to the population surveys who were at least ‘very’
confident in their ability to manage their own weight through increasing their level of
physical activity increased from 25% pre-programme to 29% post-programme. This
increase was statistically Significant (p=0.034).
The percentage of respondents to the population surveys who were at least ‘very’
confident in their ability to manage their own weight through eating healthier increased
from 29% pre-programme to 35% post-programme. This increase was statistically
significant (p=0.014).
Overall, 39% of respondents to the population survey post-programme were aware of the
Dudley Healthy Towns Programme. The Dell and Fens Pools Healthy Hub respondents
appeared to be far less aware of the Programme (5%) than the other four Healthy Hub
respondents. Silver Jubilee Park respondents had by far the greatest level of awareness
(65%). This may be due to the visible engagement of the local community with the Silver
Jubilee Healthy Hub in particular, contrasted with a more distant engagement with what
might have been perceived as rather unsupported, less often staffed and therefore less
obviously delivered elements of the programme at the Dell and Fens Pools Healthy Hub.
Awareness of the Dudley Healthy Towns Programme increased from 31% to 53% of
school children from pre- to post- programme. The only Healthy Hub to show reduced
awareness was the Dell and Fens Pools Healthy Hub, with a reduction from 34% to 21%.
Dudley Healthy Town website ‘hits’ are increasing monthly.
28
Level two evidence: actual park use and visitor perceptions
Awareness of the Dudley Healthy Towns Programme increased from 34% to 49% of
visitors to the Healthy Hubs from pre- to post- programme.
Healthy Hub visitors actually being aware of their park being designated as a Healthy
Hub rose from 49% pre-programme (when some Healthy hubs had already received
some of the infrastructure improvements such as the outdoor gyms) to 64% post-
programme when all elements of facility, staffing and provision were being delivered.
Only 16% of Outdoor gym users were made aware of the outdoor gyms by Dudley
Healthy Towns marketing. 75% either came across the gym in their local park (54%) or
heard about it from a friend/word of mouth (21%). This may be due to the fact that the
outdoor gyms were in place and being used before Dudley’s Healthy Towns Programme
was officially launched in October 2010.
Level three evidence: stakeholder narratives:
‘Tying into the national branding of Change 4 Life while giving the project a unique Dudley ‘slant’ has enabled us to tie into a number of key national messages in a language that has resonated with local people’.
Communications and Public Affairs Officer
‘Our area of work has benefited from using the branding across all areas e.g. Sportlink, Activezone. Children and parents can identify with a National Initiative which motivates and supports behavioural change. The use of the Healthy Towns branding and programme has supported partnership working e.g. the Jump on Board is a programme is delivered with Healthy Towns, Dudley Public Health and Dudley Sport and Physical Activity Development Team. The Activezone programme has developed with the use of the branding and the Healthy Towns Rangers feature heavily in the joint approach to marketing the programme. The Healthy Hubs have provided us with attractive bases to provide activities, and signpost participants to, following on from activities provided by the team’.
Sport and Physical Activity Manager

29
Conclusions and Recommendations: Increased awareness of the Change4Life
initiative and messages and awareness of the Dudley Healthy Towns
Programme:
Conclusion: Awareness of the Change4Life initiative and its messages is high
across the borough, with most improvement being reported in the diet-
relevant messages.
Conclusion: Awareness of the Dudley Healthy Towns Programme is increasing
even after such a short period of full programme delivery, and the
branding with Change4Life seems to have raised the awareness of
BOTH programmes synergistically.
Recommendation: Continue to promote the Healthy Towns Programme and other
Dudley Borough health and physical activity initiatives with the
Change4Life and now also recognised as Dudley Healthy Towns
branding.
Conclusion: The Dudley Healthy Towns Programme has involved numerous
agencies to develop and deliver the programme and these links have
led to enhanced working practices, coordinated approaches and far
greater collaborative and potentially cost effective working than were
evident before the programme began.
Recommendation: Continue to embed the Healthy Towns Programme as a flagship
for other borough wide health and physical activity initiatives,
publicise the learning from ‘shared experience’ and coordinated
endeavour and ensure that future initiatives further develop this
area of uniformly identified good practice.

30
Figure 8. Healthy eating programmes
Concluding comments regarding the overall impact of the Dudley Healthy Towns Programme
There would appear to be preliminary short- term evidence to suggest that:
There has been an increase in Healthy Hub usage and value placed upon the
Healthy Hubs since 2009.
There has been an increase in levels of self-report physical activity within the Healthy
Hub catchment populations
There is limited evidence to suggest that perceptions of safety have improved in and
around the Healthy Hubs. This is primarily due to limited awareness of the presence
of CCTV and lighting amongst users and local residents.
There has been a considerable increase in awareness of the Change4Life initiative
and the Dudley Healthy Towns programme amongst Healthy Hub catchment
populations, park users and primary school children.

31
Due to the date of completion of the active corridors this evaluation was unable to
capture robust data relating to these improvements. It is therefore recommended that
baseline evaluation of the impact of this intervention commences at the earliest
opportunity.
Stakeholder narratives to conclude:
…to see the change in perception of Silver Jubilee Park and other parks since the Healthy Town programme was introduced is a major plus for the surrounding communities and borough as a whole’.
Director of the Urban Environment
‘Very good. Facilities for all people of all ages, whether they are overweight or not. I also feel it is a very good way of socialising and bringing communities together’.
Post programme population survey: Dell and Fens Pools
‘I feel that this project in certain areas of the borough has created a whole new community environment. A togetherness that has been described as by members of the public as a War time community, where people do not consider everyone as a stranger, more as a neighbour. The project has created voluntary groups that I feel could continue the service long after funding is no longer available’.
Park Ranger
‘Our healthy towns programme has been fundamental in delivering our aspirations to improve the health enhancing aspects of the environment and basically make it easier for people to make healthier choices. It has acted as a catalyst for change for the people of Dudley borough and also embedded a health ‘mind-set’ within our organisations which will hopefully sustain change into the future’.
Public Health Consultant and Lifestyle/Obesity Lead
‘We may not see the full impact of this investment for a number of years but I am convinced that it will produce long term benefits for our local population’.
Chief Executive