Debt and (not much) deleveraging - World Bank in debt-to-GDP ratio,1 2007 –14 Percentage points...
30
WORKING DRAFT Last Modified 5/19/2015 9:06 AM Malay Peninsula Standard Time Printed 3/12/2015 1:48 PM Eastern Standard Time Debt and (not much) deleveraging
Transcript of Debt and (not much) deleveraging - World Bank in debt-to-GDP ratio,1 2007 –14 Percentage points...

WORKING DRAFT
Last Modified 5/19/2015 9:06 AM Malay Peninsula Standard Time
Printed 3/12/2015 1:48 PM Eastern Standard Time
Debt and (not much)
deleveraging
11
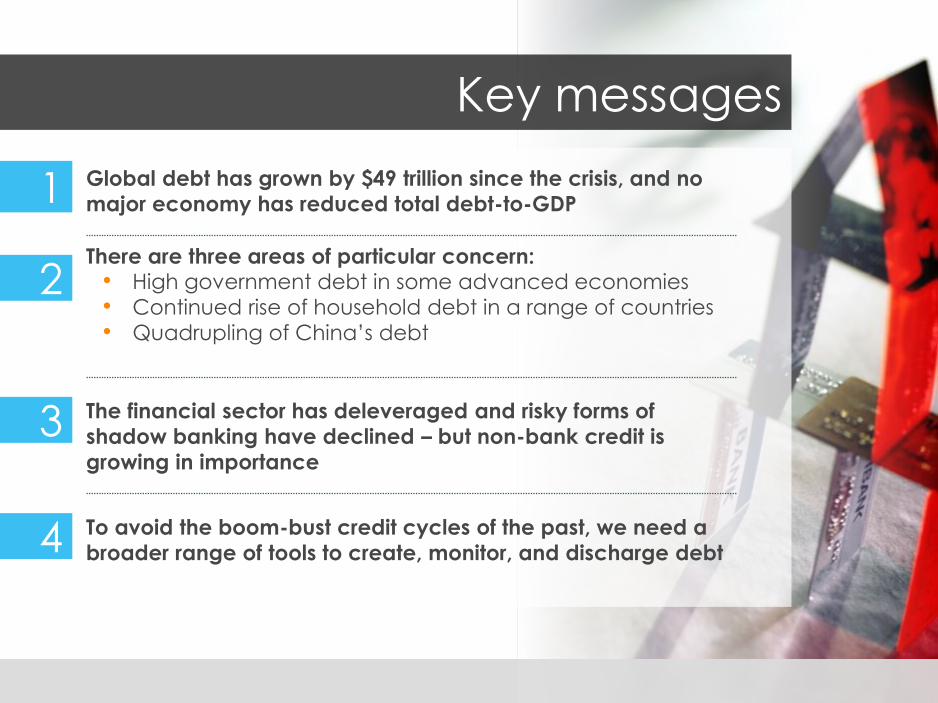
Global debt has grown by $49 trillion since the crisis, and no
major economy has reduced total debt-to-GDP
There are three areas of particular concern: • High government debt in some advanced economies
• Continued rise of household debt in a range of countries
• Quadrupling of China’s debt
The financial sector has deleveraged and risky forms of
shadow banking have declined – but non-bank credit is
growing in importance
1
2
3
To avoid the boom-bust credit cycles of the past, we need a
broader range of tools to create, monitor, and discharge debt4
Key messages

22
What happened to deleveraging?
33
2037 45 Financial
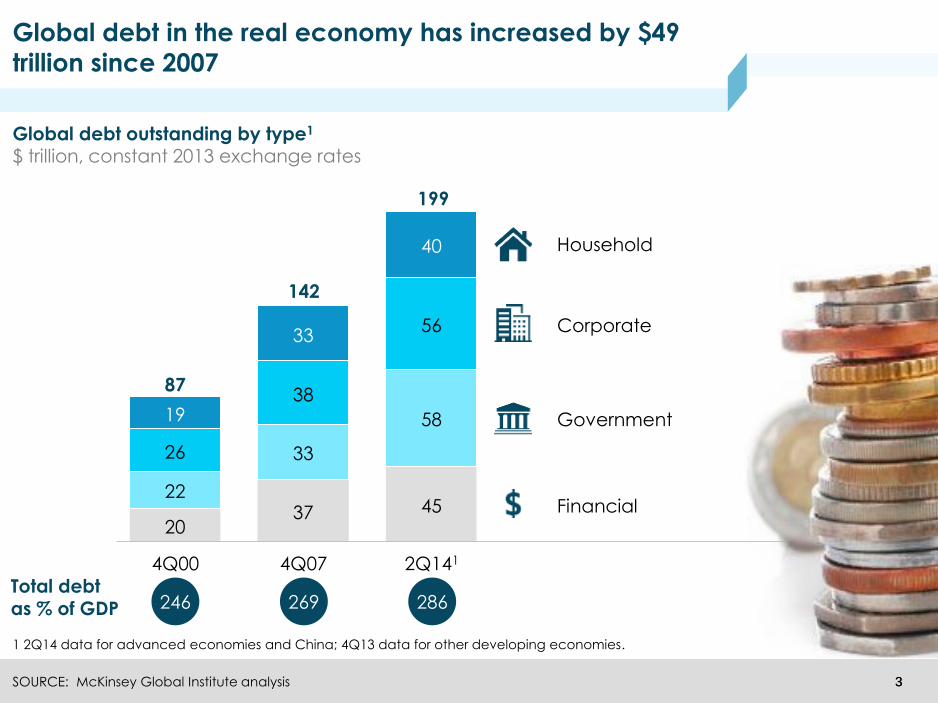
Global debt outstanding by type1
$ trillion, constant 2013 exchange rates
SOURCE: McKinsey Global Institute analysis
1 2Q14 data for advanced economies and China; 4Q13 data for other developing economies.
199
87
142
4Q00 4Q07 2Q141
Global debt in the real economy has increased by $49
trillion since 2007
26
38
56 Corporate
22
33
58 Government19
33
40 Household
269246 286
87
142
199
Total debt as % of GDP
44
0 30 60 90 120 150 180 210 240 270 300 330 360 390 420
-30
-40
-10
0
10
180
-20
100
80
50
40
70
20
30
120
60
110
90
130
France
CanadaAustralia
Germany
Greece
Finland
DenmarkAustria
Belgium
Ireland
United States
Sweden
United Kingdom
Spain
Slovakia
Singapore
Portugal
JapanNetherlands
Korea
Italy
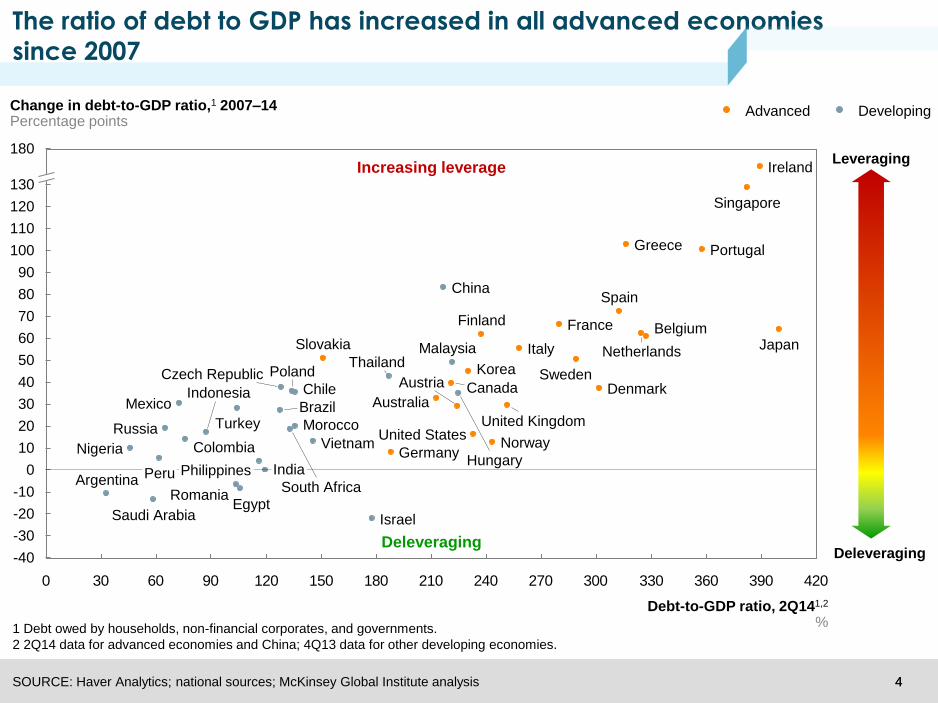
Change in debt-to-GDP ratio,1 2007–14Percentage points
Norway
Debt-to-GDP ratio, 2Q141,2
%
Thailand
Turkey
Vietnam
Saudi Arabia
Russia
South Africa
Morocco
Peru
Nigeria
Romania
Philippines
Poland
Indonesia
Malaysia
Israel
Mexico
ArgentinaIndia
Brazil
Chile
Egypt
Colombia
China
Czech Republic
Hungary
1 Debt owed by households, non-financial corporates, and governments.
2 2Q14 data for advanced economies and China; 4Q13 data for other developing economies.
The ratio of debt to GDP has increased in all advanced economies
since 2007
Increasing leverage
SOURCE: Haver Analytics; national sources; McKinsey Global Institute analysis
Deleveraging
Leveraging
Deleveraging
DevelopingAdvanced

55
Continued risks ahead
Government debt
66
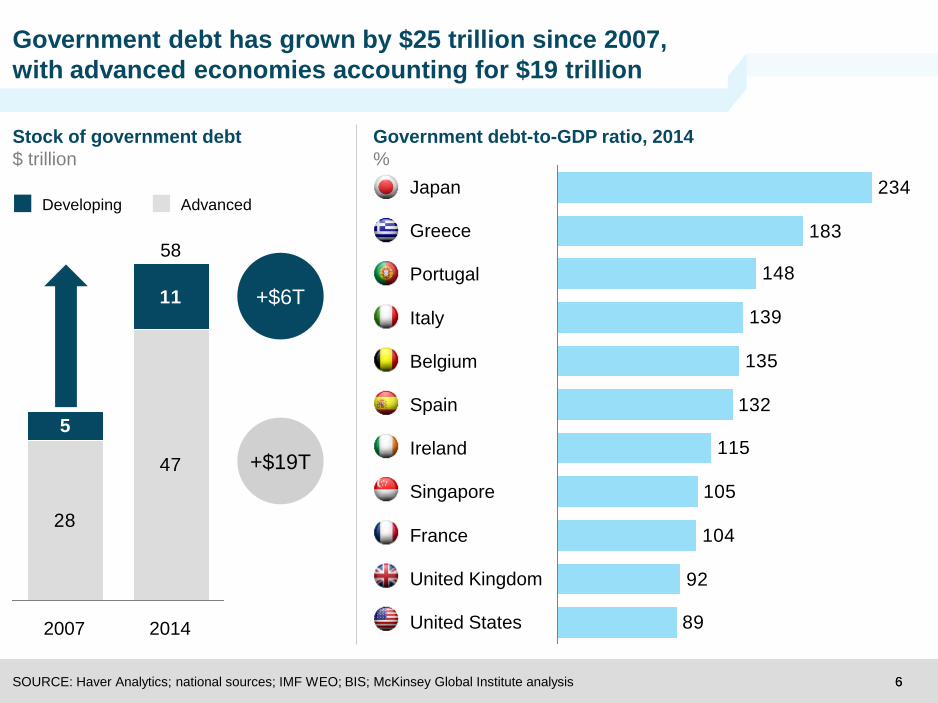
28
47
5
11
58
20142007
33
89
92
104
105
115
132
135
139
148
183
234
France
Spain
Singapore
United Kingdom
Ireland
Belgium
Japan
Italy
Greece
Portugal
United States
Government debt has grown by $25 trillion since 2007,
with advanced economies accounting for $19 trillion
SOURCE: Haver Analytics; national sources; IMF WEO; BIS; McKinsey Global Institute analysis
AdvancedDeveloping
Government debt-to-GDP ratio, 2014
%
Stock of government debt
$ trillion
+$19T
+$6T
77
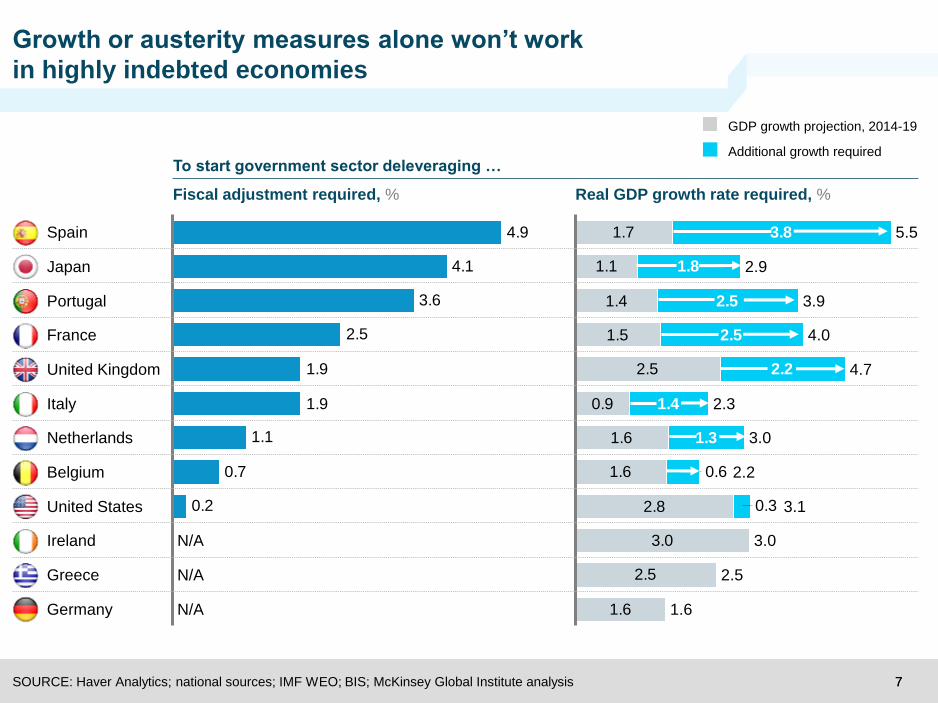
Growth or austerity measures alone won’t work
in highly indebted economies
SOURCE: Haver Analytics; national sources; IMF WEO; BIS; McKinsey Global Institute analysis
To start government sector deleveraging …
Fiscal adjustment required, % Real GDP growth rate required, %
0.2
0.7
1.1
1.9
1.9
2.5
3.6
4.1
4.9
N/A
United States
Belgium
Netherlands
Italy
United Kingdom
Germany N/A
Greece N/A
Ireland
France
Portugal
Japan
Spain 1.7
1.1
1.4
1.5
2.5
0.9
1.6
1.6
2.8
3.0
2.5
1.6
3.8
1.8
2.5
2.5
2.2
1.4
1.3
0.3
0.6
2.5
3.0
3.1
2.2
3.0
2.3
4.7
4.0
3.9
2.9
5.5
1.6
GDP growth projection, 2014-19
Additional growth required
88
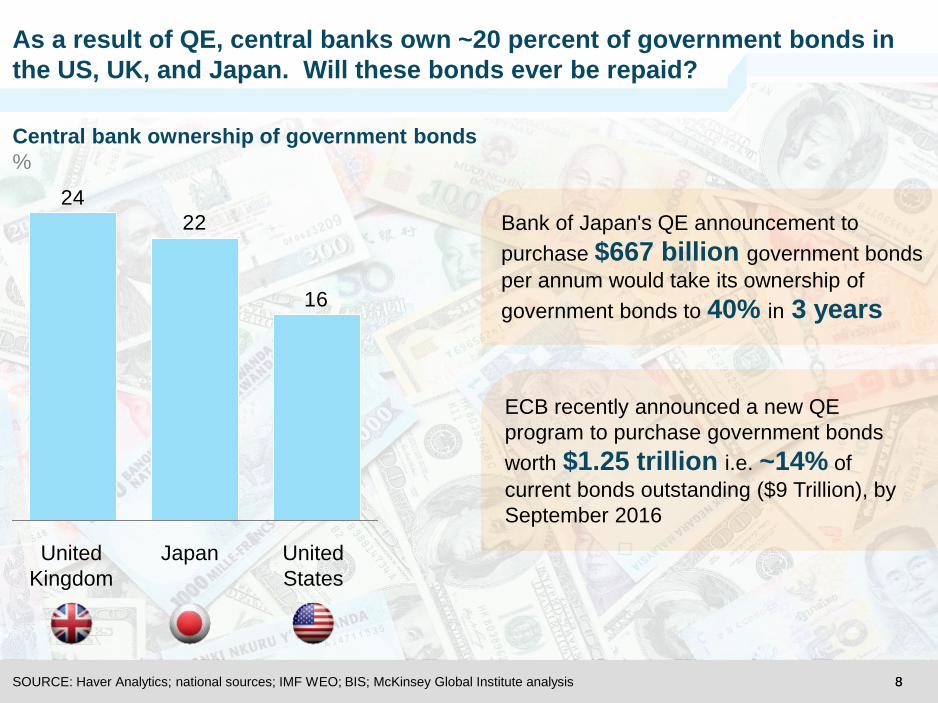
As a result of QE, central banks own ~20 percent of government bonds in
the US, UK, and Japan. Will these bonds ever be repaid?
SOURCE: Haver Analytics; national sources; IMF WEO; BIS; McKinsey Global Institute analysis
Central bank ownership of government bonds
%
ECB recently announced a new QE
program to purchase government bonds
worth $1.25 trillion i.e. ~14% of
current bonds outstanding ($9 Trillion), by
September 2016
United
States
United
Kingdom
Japan
Bank of Japan's QE announcement to
purchase $667 billion government bonds
per annum would take its ownership of
government bonds to 40% in 3 years16
22
24
99
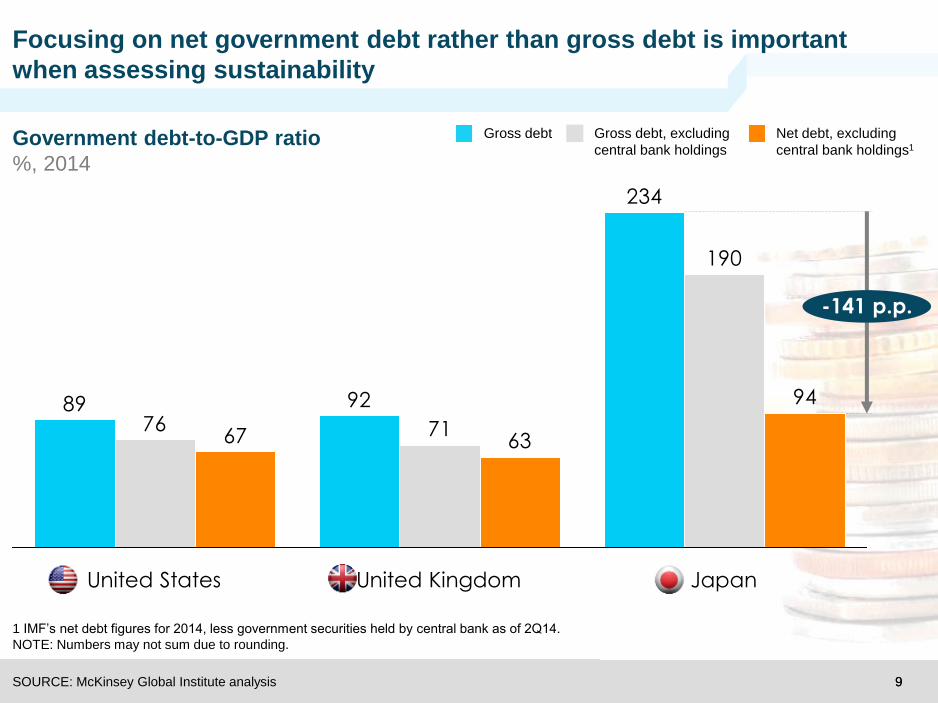
Focusing on net government debt rather than gross debt is important
when assessing sustainability
SOURCE: McKinsey Global Institute analysis
Government debt-to-GDP ratio
%, 2014
1 IMF’s net debt figures for 2014, less government securities held by central bank as of 2Q14.
NOTE: Numbers may not sum due to rounding.
Net debt, excluding
central bank holdings1
Gross debt, excluding
central bank holdings
Gross debt
234
9289
190
7176
94
6367
-141 p.p.
JapanUnited KingdomUnited States

1010
Hidden time bomb?
Household debt
1111
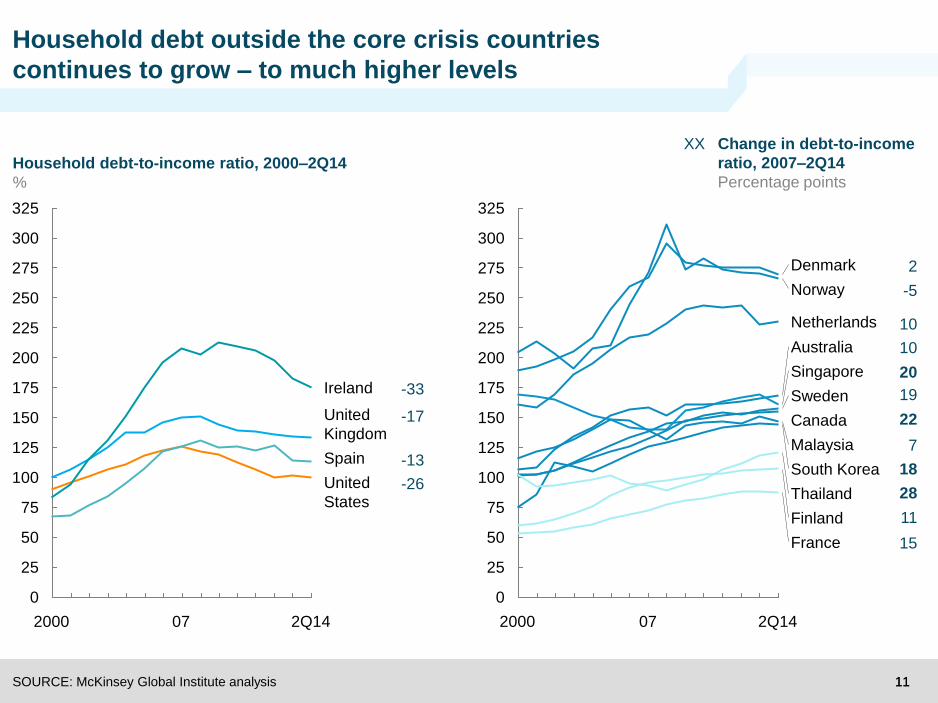
Household debt outside the core crisis countries
continues to grow – to much higher levels
Household debt-to-income ratio, 2000–2Q14
%
SOURCE: McKinsey Global Institute analysis
0
25
50
75
100
125
150
175
200
225
250
275
300
325
Ireland
United
Kingdom
Spain
United
States
2000 07 2Q14
0
25
50
75
100
125
150
175
200
225
250
275
300
325
Singapore
Australia
Finland
Netherlands
Sweden
Canada
Malaysia
South Korea
Thailand
France
Denmark
Norway
2000 07 2Q14
-33
-17
-13
-26
10
19
22
11
10
18
15
2
-5
Change in debt-to-income
ratio, 2007–2Q14
Percentage points
XX
7
28
20
1212
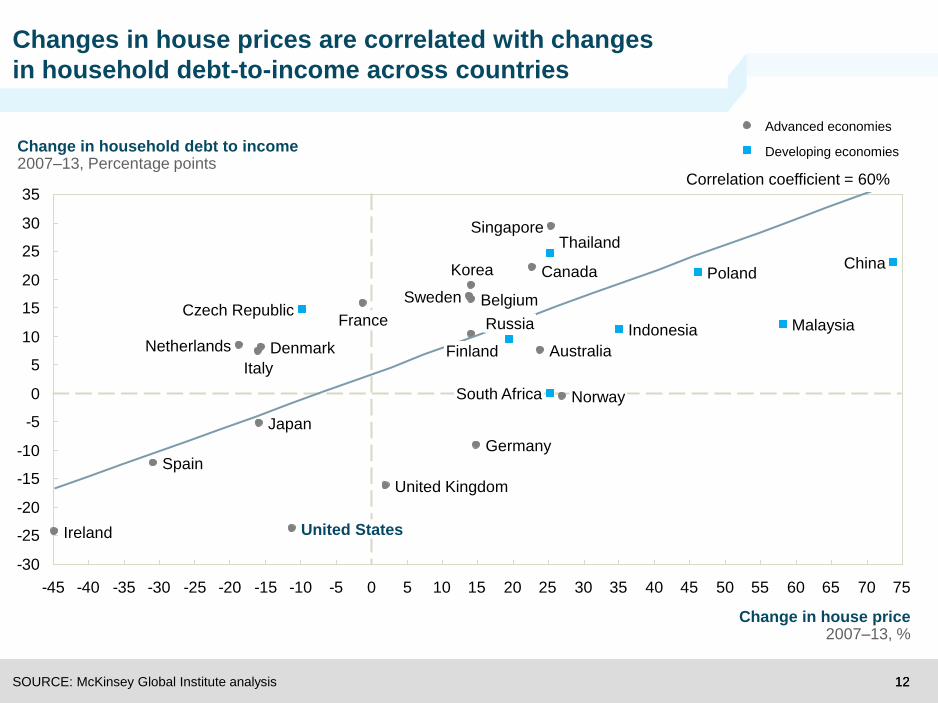
Changes in house prices are correlated with changes
in household debt-to-income across countries
SOURCE: McKinsey Global Institute analysis
-30
-25
-20
-15
-10
-5
0
5
10
15
20
25
30
35
-45 -40 -35 -30 -25 -20 -15 -10 -5 0 5 10 15 20 25 30 35 40 45 50 55 60 65 70 75
Change in household debt to income2007–13, Percentage points
Change in house price2007–13, %
ThailandSingapore
Russia
PolandKorea
IndonesiaFrance
Czech Republic
ChinaCanada
Belgium
South Africa
Finland
Malaysia
Sweden
AustraliaNetherlands
Italy
Germany
Japan
United States
Spain
United Kingdom
Ireland
Norway
Denmark
Advanced economies
Developing economies
Correlation coefficient = 60%
1313
138115
135 125 116 104
60–80 80–90
157
194 196
40–60
192
20–40
140
<20
178
55 5280
160
216 23179
117
20–40
74
<20
280
80–90
263
60–80
205
40–60
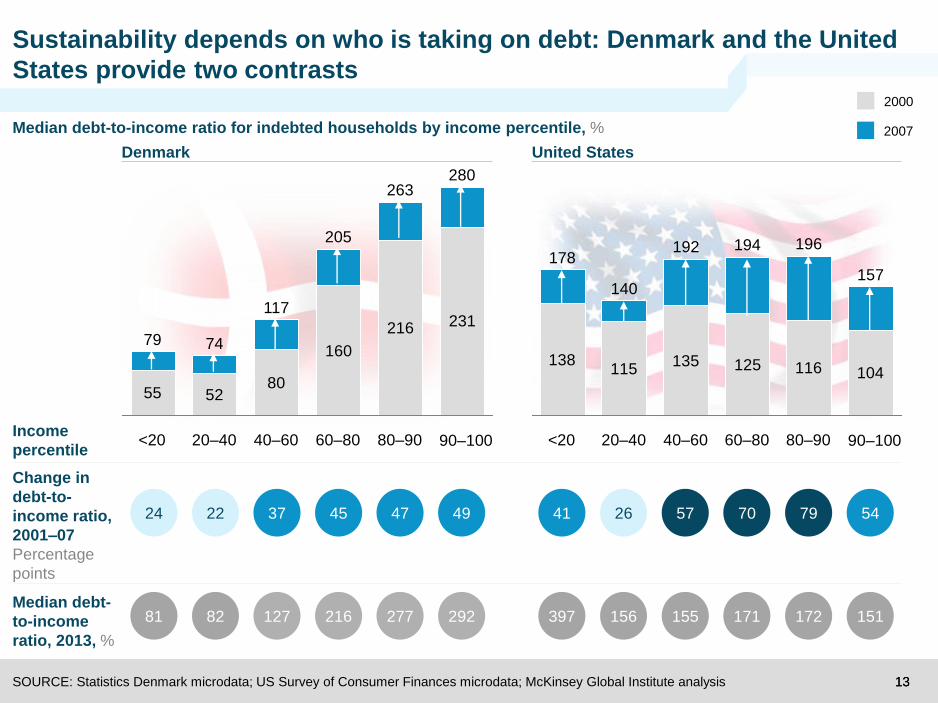
Sustainability depends on who is taking on debt: Denmark and the United
States provide two contrasts
Median debt-to-income ratio for indebted households by income percentile, %
SOURCE: Statistics Denmark microdata; US Survey of Consumer Finances microdata; McKinsey Global Institute analysis
Change in
debt-to-
income ratio,
2001–07
Percentage
points
2224 37 45 47 26 57 797041 5449
90–100
Denmark United States
Median debt-
to-income
ratio, 2013, %
8281 127 216 277 156 155 172171397 151292
2000
2007
90–100Income
percentile
1414SOURCE: McKinsey Global Institute analysis
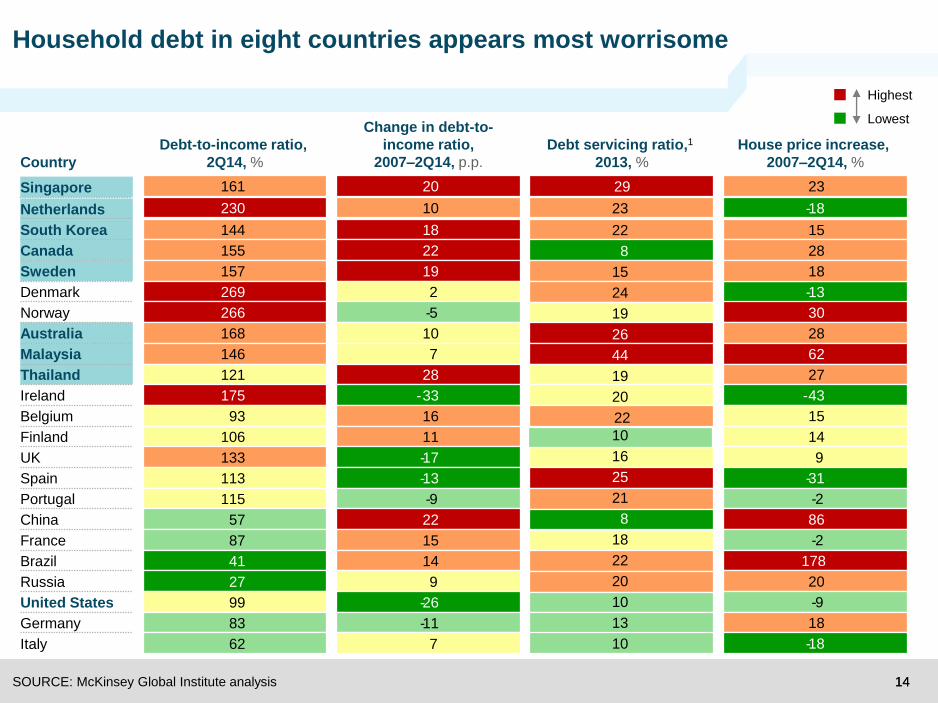
Highest
Lowest
Country
Netherlands
South Korea
Canada
Sweden
Denmark
Norway
Australia
Malaysia
Thailand
Ireland
Belgium
Finland
UK
Spain
Portugal
China
France
Brazil
Russia
United States
Germany
Italy
Debt-to-income ratio,
2Q14, %
230
144
155
157
269
266
168
146
121
175
93
106
133
113
115
57
87
41
27
99
83
62
10
18
22
19
2
-5
10
7
28
-33
16
11
-17
-13
-9
22
15
14
9
-26
-11
7
Debt servicing ratio,1
2013, %
-18
15
28
18
-13
30
28
62
27
-43
15
14
9
-31
-2
86
-2
178
20
-9
18
-18
House price increase,
2007–2Q14, %
Change in debt-to-
income ratio,
2007–2Q14, p.p.
23
22
8
15
24
19
26
44
19
20
22
10
16
25
21
8
18
22
20
10
13
10
Singapore 161 20 2329
Household debt in eight countries appears most worrisome

1515
Three risks to watch
China’s soaring
debt
1616
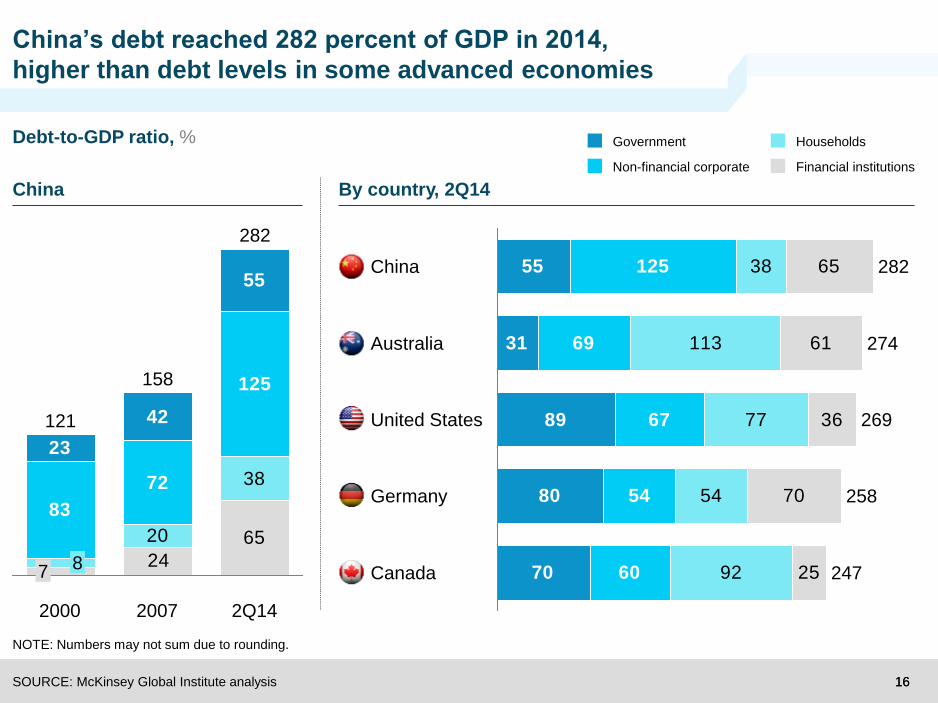
55
31
89
80
70
125
69
67
54
60
38
113
77
54
92
65
61
36
70
25
China 282
Australia
United States
274
Germany 258
269
247Canada
China’s debt reached 282 percent of GDP in 2014,
higher than debt levels in some advanced economies
SOURCE: McKinsey Global Institute analysis
NOTE: Numbers may not sum due to rounding.
Debt-to-GDP ratio, %
China By country, 2Q14
6520
38
83
72
125
23
42
24
55
8
2000
7
2007
158
282
2Q14
121
Financial institutions
Government Households
Non-financial corporate
1717
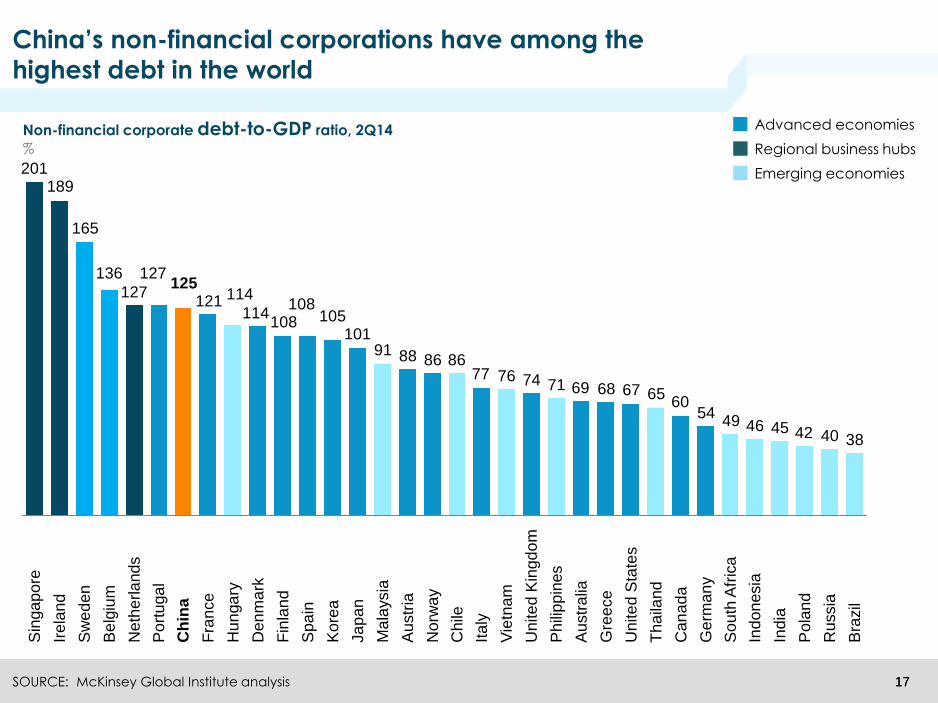
China’s non-financial corporations have among the
highest debt in the world
Non-financial corporate debt-to-GDP ratio, 2Q14
%
38404245464954
606567686971747677
86868891101
105108
108114
114121125
127
127
136
165
189201
Ru
ssia
Po
lan
d
Bra
zil
Un
ite
d S
tate
s
Au
str
alia
Ind
ia
Ph
ilipp
ines
Ca
na
da
So
uth
Afr
ica
Ind
on
esia
Ge
rma
ny
Th
aila
nd
Gre
ece
Fra
nce
Sp
ain
Au
str
ia
Ja
pa
n
Hu
nga
ry
Ita
ly
Ch
ile
De
nm
ark
Ma
laysia
Ko
rea
Un
ite
d K
ingd
om
Vie
tna
m
No
rwa
y
Fin
lan
d
Ch
ina
Po
rtu
ga
l
Sw
ed
en
Ne
the
rla
nds
Sin
ga
po
re
Be
lgiu
m
Ire
lan
d
Advanced economies
Regional business hubs
Emerging economies
SOURCE: McKinsey Global Institute analysis
1818
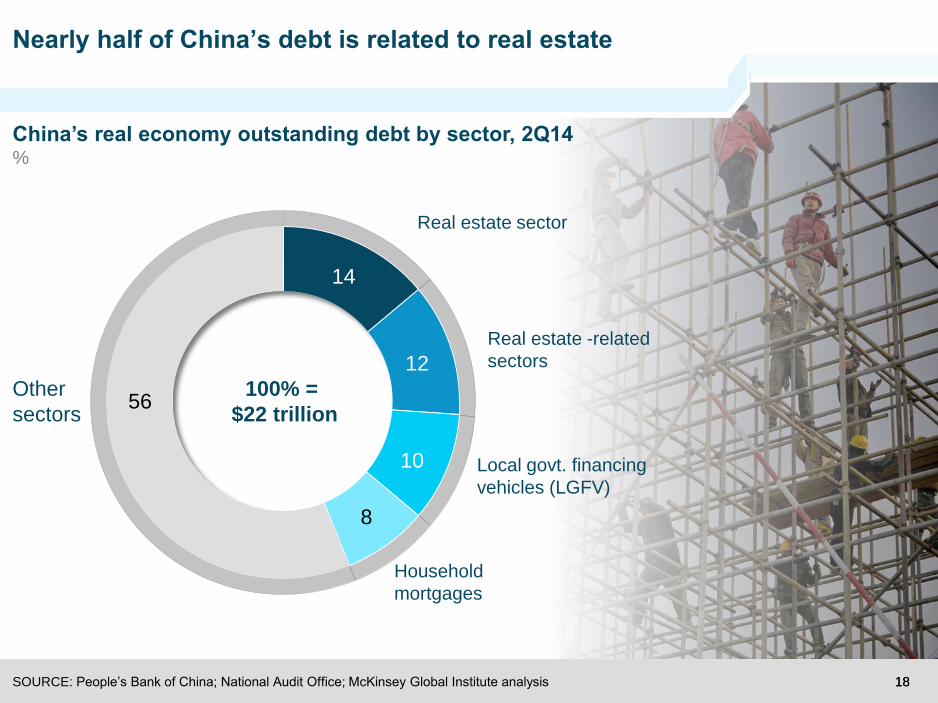
Nearly half of China’s debt is related to real estate
SOURCE: People’s Bank of China; National Audit Office; McKinsey Global Institute analysis
China’s real economy outstanding debt by sector, 2Q14%
Real estate sector
Real estate -related
sectors
Local govt. financing
vehicles (LGFV)
Household
mortgages
14
12
10
8
56100% =
$22 trillion
Other
sectors
1919
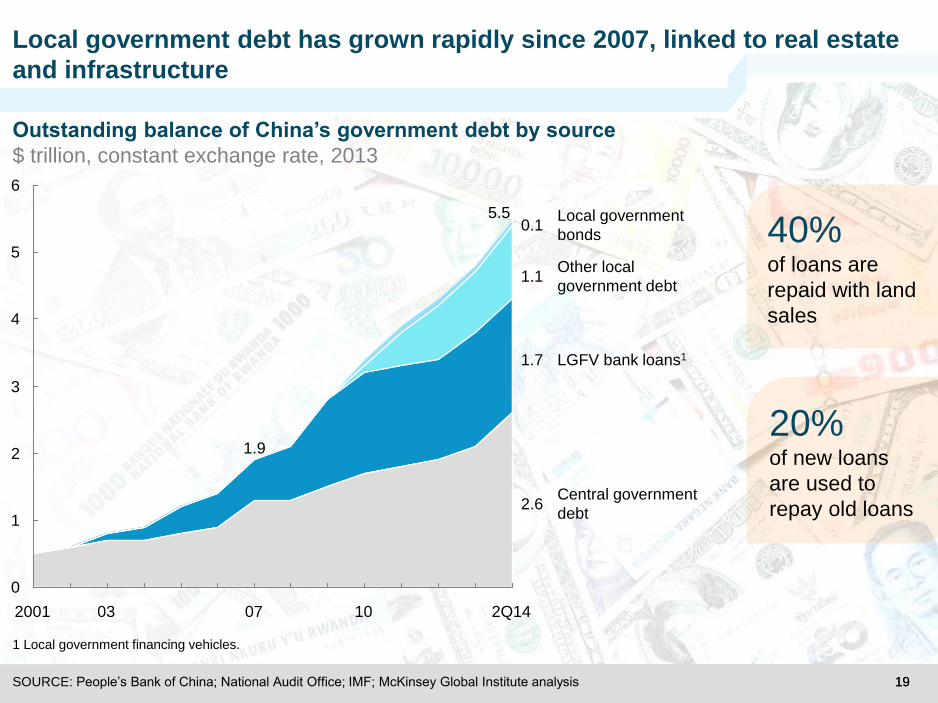
Local government debt has grown rapidly since 2007, linked to real estate
and infrastructure
SOURCE: People’s Bank of China; National Audit Office; IMF; McKinsey Global Institute analysis
Outstanding balance of China’s government debt by source
$ trillion, constant exchange rate, 2013
1 Local government financing vehicles.
0.1Local government
bonds
1.1Other local
government debt
1.7 LGFV bank loans1
2.6Central government
debt
20% of new loans
are used to
repay old loans
40%of loans are
repaid with land
sales
0
1
2
3
4
5
6
2Q14
5.5
1007
1.9
032001
2020
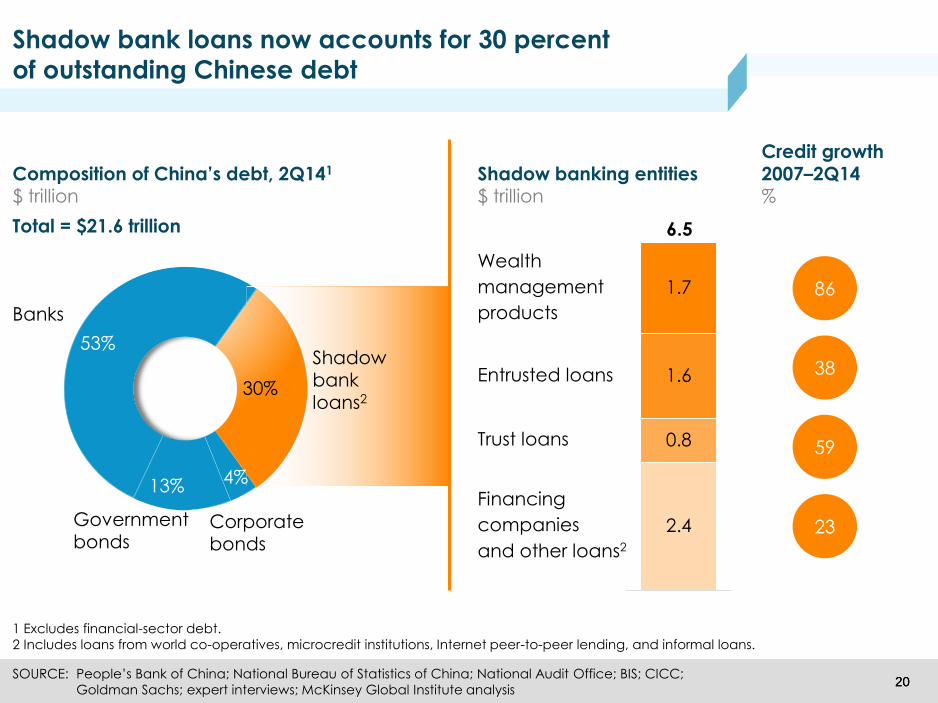
53%
13%
30.0%
Shadow bank loans now accounts for 30 percent
of outstanding Chinese debt
1 Excludes financial-sector debt.
2 Includes loans from world co-operatives, microcredit institutions, Internet peer-to-peer lending, and informal loans.
SOURCE: People’s Bank of China; National Bureau of Statistics of China; National Audit Office; BIS; CICC;
Goldman Sachs; expert interviews; McKinsey Global Institute analysis
Banks
Corporatebonds
Governmentbonds
Total = $21.6 trillion
Composition of China’s debt, 2Q141
$ trillion
86
38
59
23
Credit growth 2007–2Q14%
Shadow banking entities$ trillion
Entrusted loans
Wealth
management
products
2.4
0.8
1.6
1.7
Financing
companies
and other loans2
Trust loans
6.5
Shadowbankloans2
30%
4%
2121SOURCE: People’s Bank of China; expert interviews; McKinsey Global Institute analysis
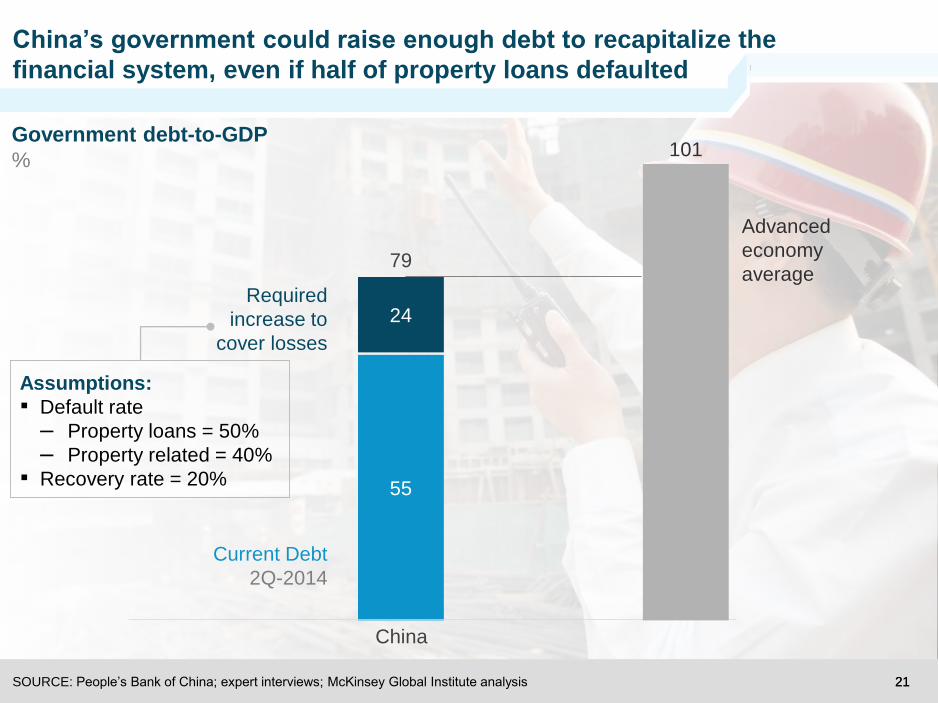
55
24
79
Current Debt
2Q-2014
Required
increase to
cover losses
China
Government debt-to-GDP
%101
Advanced
economy
average
Assumptions:
▪ Default rate
– Property loans = 50%
– Property related = 40%
▪ Recovery rate = 20%
China’s government could raise enough debt to recapitalize the
financial system, even if half of property loans defaulted

2222
Out of the shadows
Shadow banking
2323
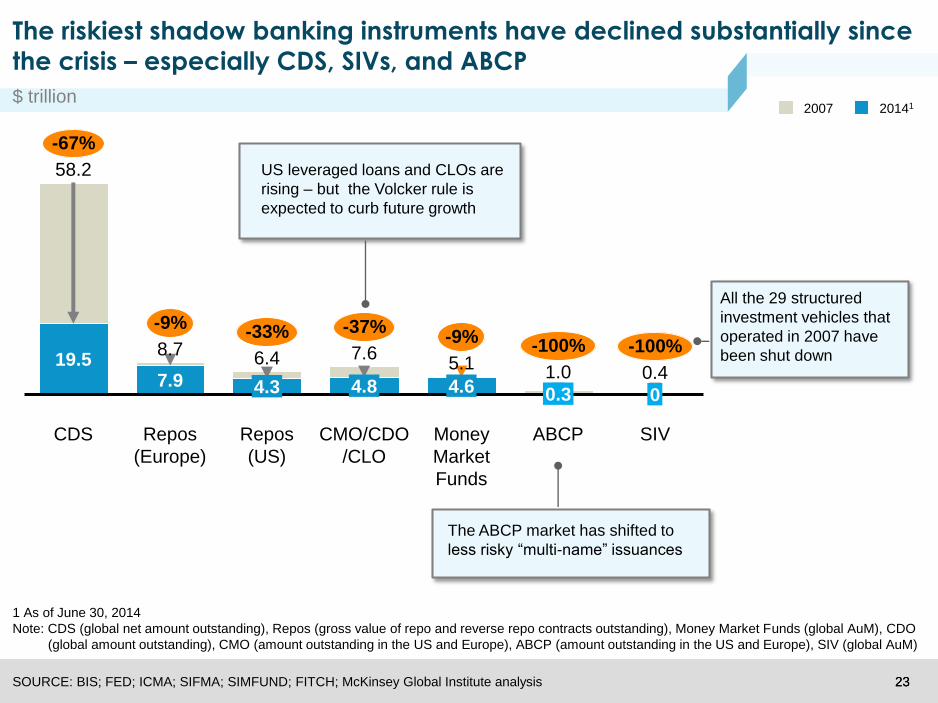
The riskiest shadow banking instruments have declined substantially since
the crisis – especially CDS, SIVs, and ABCP
5.11.0 0.4
-100%-9%
-100%
ABCPMoney
Market
Funds
-37%
6.4
-33%7.6
58.2
SIV
-9%
8.7
00.3
-67%
Repos
(US)
CDS
19.5
4.8 4.6
Repos
(Europe)
7.9
CMO/CDO
/CLO
4.3
2007 20141
All the 29 structured
investment vehicles that
operated in 2007 have
been shut down
US leveraged loans and CLOs are
rising – but the Volcker rule is
expected to curb future growth
The ABCP market has shifted to
less risky “multi-name” issuances
1 As of June 30, 2014
Note: CDS (global net amount outstanding), Repos (gross value of repo and reverse repo contracts outstanding), Money Market Funds (global AuM), CDO
(global amount outstanding), CMO (amount outstanding in the US and Europe), ABCP (amount outstanding in the US and Europe), SIV (global AuM)
SOURCE: BIS; FED; ICMA; SIFMA; SIMFUND; FITCH; McKinsey Global Institute analysis
$ trillion
2424
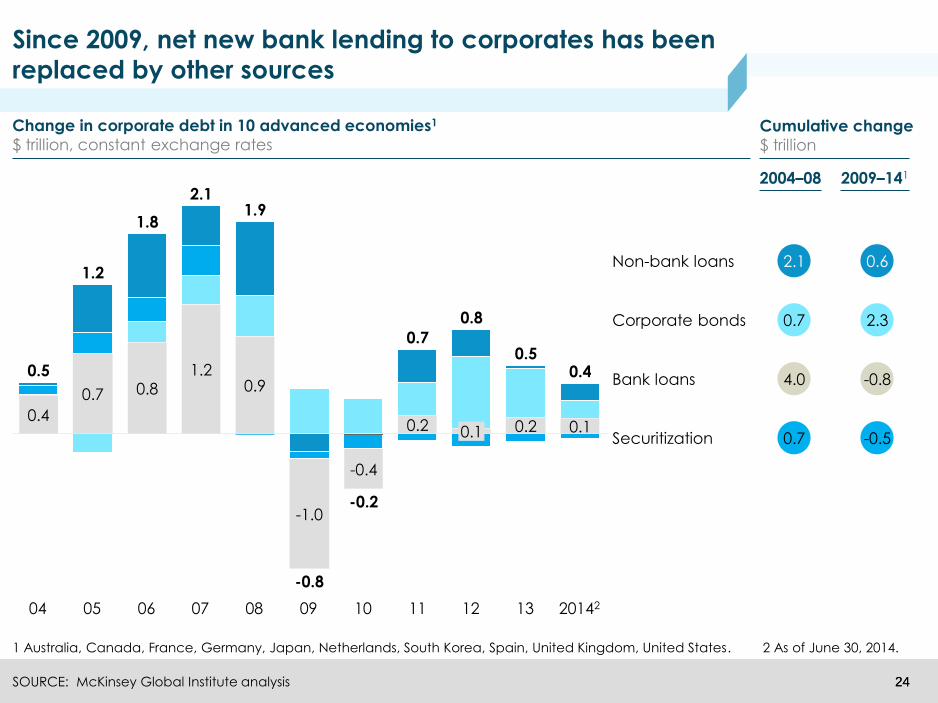
1 Australia, Canada, France, Germany, Japan, Netherlands, South Korea, Spain, United Kingdom, United States. 2 As of June 30, 2014.
SOURCE: McKinsey Global Institute analysis
Since 2009, net new bank lending to corporates has been
replaced by other sources
0.7 -0.5Securitization
2.1 0.6Non-bank loans
Change in corporate debt in 10 advanced economies1
$ trillion, constant exchange rates
20142
0.4
13
0.5
12
0.8
11
0.7
10
-0.2
09
-0.8
08
1.9
07
2.1
06
1.8
05
1.2
04
0.5
2004–08
Cumulative change
$ trillion
2009–141
0.7 2.3Corporate bonds
4.0 -0.8Bank loans
0.2 0.10.2
-0.4
-1.0
0.91.2
0.80.7
0.40.1
2525
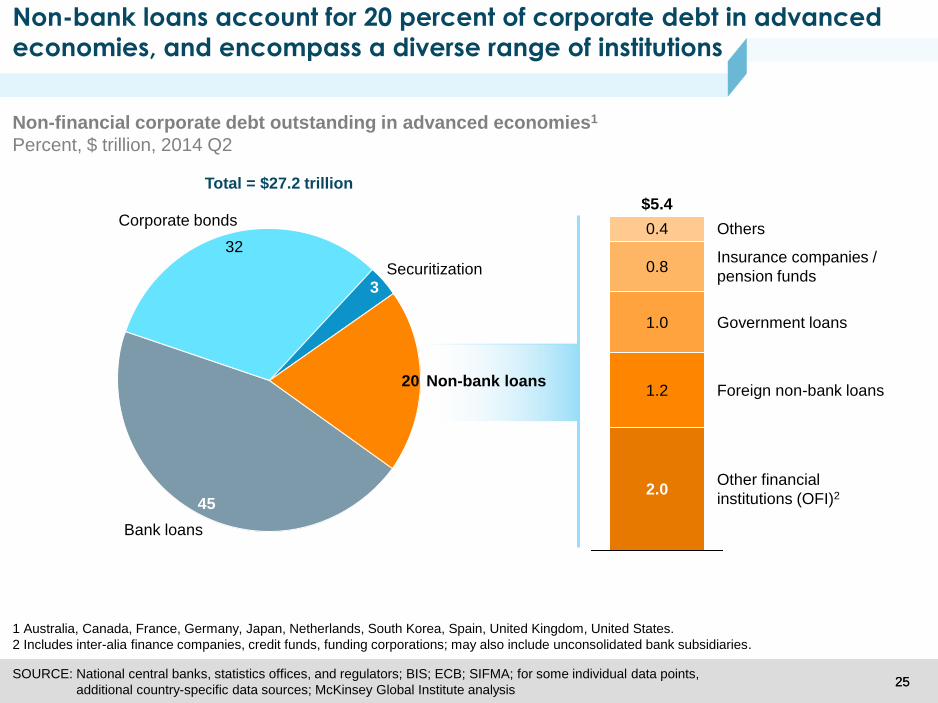
Non-bank loans account for 20 percent of corporate debt in advanced
economies, and encompass a diverse range of institutions
SOURCE: National central banks, statistics offices, and regulators; BIS; ECB; SIFMA; for some individual data points,
additional country-specific data sources; McKinsey Global Institute analysis
1 Australia, Canada, France, Germany, Japan, Netherlands, South Korea, Spain, United Kingdom, United States.
2 Includes inter-alia finance companies, credit funds, funding corporations; may also include unconsolidated bank subsidiaries.
Non-financial corporate debt outstanding in advanced economies1
Percent, $ trillion, 2014 Q2
32
45
Corporate bonds
Securitization3
20 Non-bank loans
Bank loans
Total = $27.2 trillion
Other financial
institutions (OFI)2
Foreign non-bank loans
Government loans
Insurance companies /
pension funds
$5.4
1.2
Others
2.0
1.0
0.8
0.4
2626
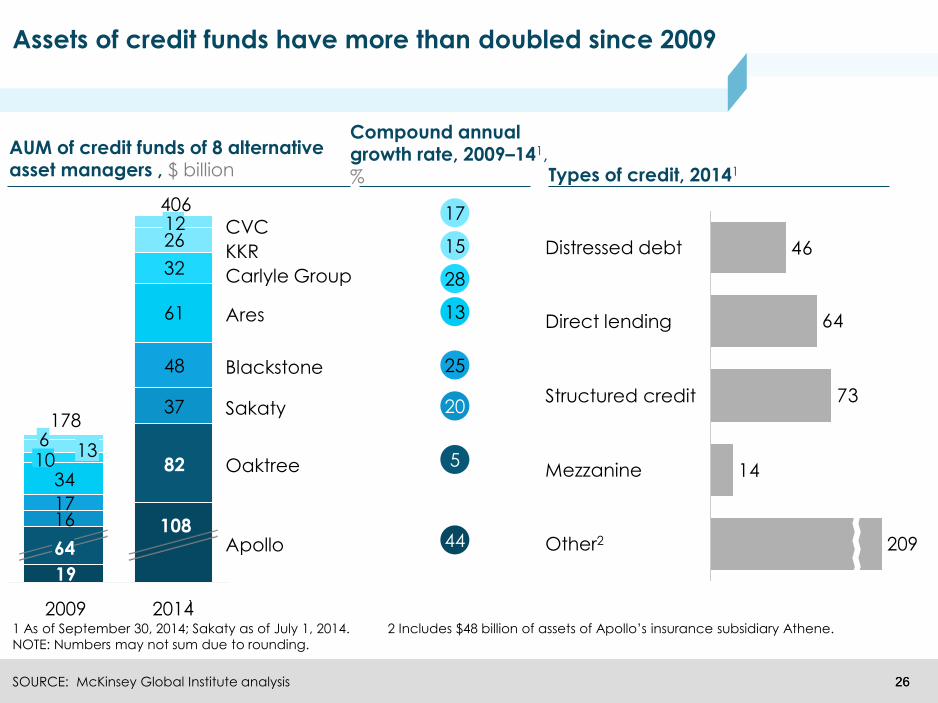
Assets of credit funds have more than doubled since 2009
SOURCE: McKinsey Global Institute analysis
1 As of September 30, 2014; Sakaty as of July 1, 2014. 2 Includes $48 billion of assets of Apollo’s insurance subsidiary Athene.
NOTE: Numbers may not sum due to rounding.
14
73
64
46
Structured credit
Direct lending
Distressed debt
209Other2
Mezzanine
AUM of credit funds of 8 alternative asset managers , $ billion
17
15
28
13
25
20
5
44
Compound annual growth rate, 2009–141, % Types of credit, 20141
82
48
61
19
37
1617
34
32
26
Ares
Carlyle Group
KKR
CVC
20141
406
108Apollo
Oaktree
Sakaty
Blackstone
12
2009
178
64
1013
6

2727
Finding stability in an indebted world
2828
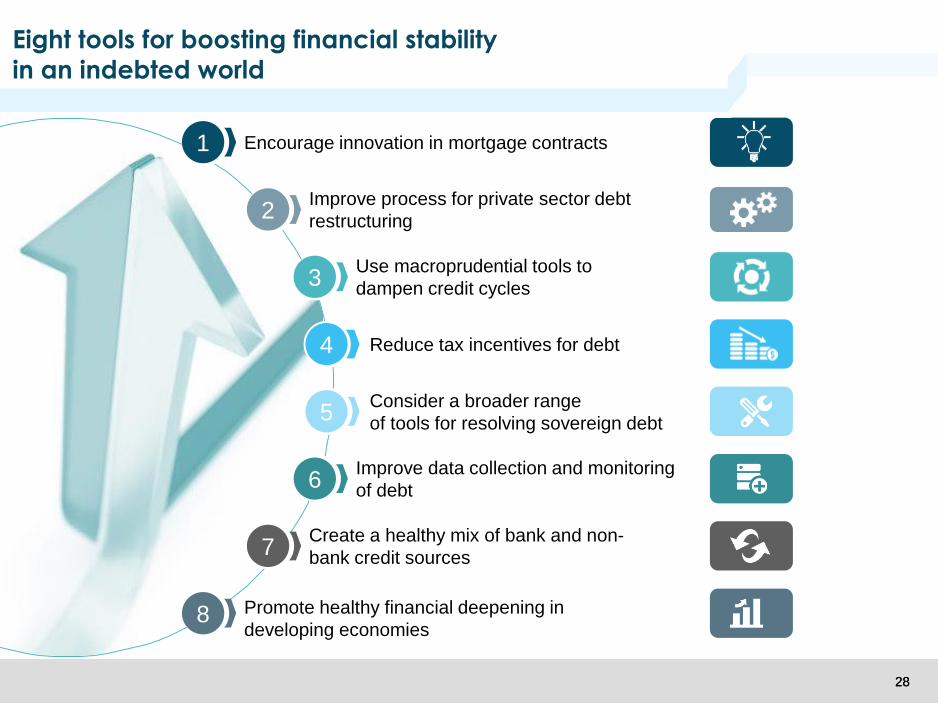
Eight tools for boosting financial stability
in an indebted world
Improve data collection and monitoring
of debt6
Create a healthy mix of bank and non-
bank credit sources7
Consider a broader range
of tools for resolving sovereign debt5
Promote healthy financial deepening in
developing economies8
Improve process for private sector debt
restructuring2
Use macroprudential tools to
dampen credit cycles3
Encourage innovation in mortgage contracts1
Reduce tax incentives for debt4
2929
Thank you
Follow us on Twitter:
www.mckinsey.com/mgi
Download McKinsey Global Institute reports:
@mckinsey_mgi