technoloTwo dimensional numerical simulation of the combined heat transfer in channel flow
<www.excelunusual.com>
Building a Dynamic Two Dimensional Heat Transfer Model
– part #2
- This is the second half of a tutorial which shows how to build a basic dynamic heat conduction model of a square plate. The same principle could be used to model different shapes 2D objects.
- The previous presentation explained how to partition the plate into elementary square sections each having four neighboring elements and how the heat transfer occurs between the elements by following the two rules of heat transfer: the storage and the transport equation.
- This section explains the general idea about the worksheet layout and the principle of matrix padding done in order to allow a consistent formula use across the whole calculation matrix. This consistent formula application makes for an easy and error proof model creation.
- This section also explains the implementation of the spreadsheet formulas within the worksheet and the two macros used to animate the model.
by George Lungu
<www.excelunusual.com> 2
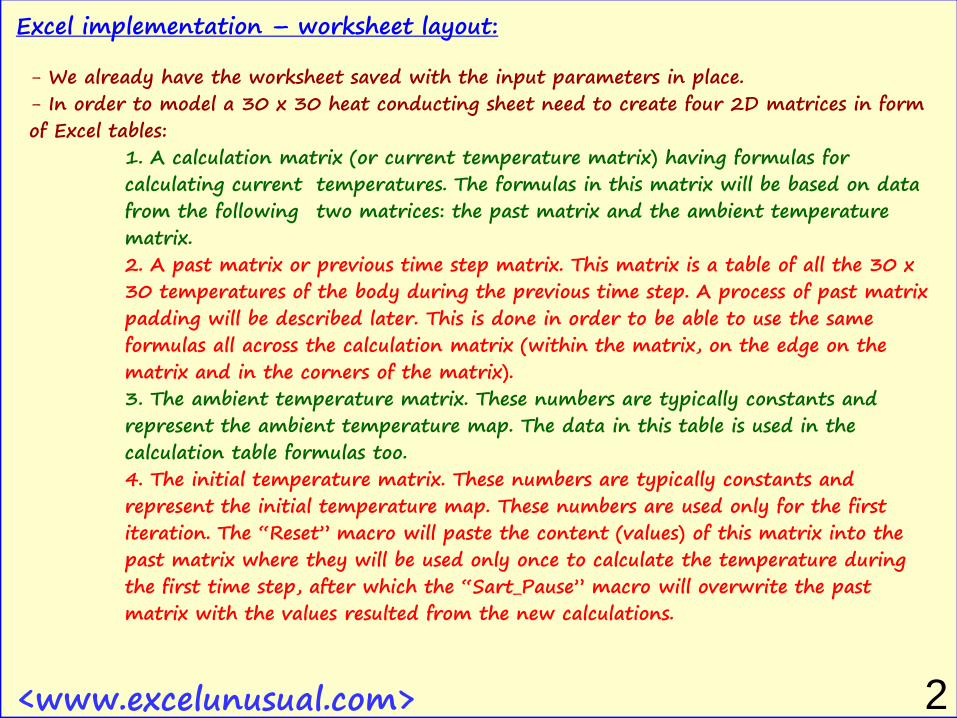
Excel implementation – worksheet layout:
- We already have the worksheet saved with the input parameters in place.- In order to model a 30 x 30 heat conducting sheet need to create four 2D matrices in form of Excel tables:
1. A calculation matrix (or current temperature matrix) having formulas for calculating current temperatures. The formulas in this matrix will be based on data from the following two matrices: the past matrix and the ambient temperature matrix.2. A past matrix or previous time step matrix. This matrix is a table of all the 30 x 30 temperatures of the body during the previous time step. A process of past matrix padding will be described later. This is done in order to be able to use the same formulas all across the calculation matrix (within the matrix, on the edge on the matrix and in the corners of the matrix).3. The ambient temperature matrix. These numbers are typically constants and represent the ambient temperature map. The data in this table is used in the calculation table formulas too.4. The initial temperature matrix. These numbers are typically constants and represent the initial temperature map. These numbers are used only for the first iteration. The “Reset” macro will paste the content (values) of this matrix into the past matrix where they will be used only once to calculate the temperature during the first time step, after which the “Sart_Pause” macro will overwrite the past matrix with the values resulted from the new calculations.

<www.excelunusual.com> 3
A worksheet layout and operation diagram:
Current Calculation
Matrix
Past Matrix
Ambient Matrix
Initial Temperature
Matrix
Input
Parameters
and Buttons
The “Reset” macro
will copy the initial
temperatures into
the “Past Matrix”
The formulas in the “Current
Calculation Matrix” have input
data (arguments) from the “Past
Matrix” and the “Ambient Matrix”
These are matrices of fixed content
(frozen constants), you can fill them
with data to your preference
This matrix has constant data (not
formulas) but the data is frequently
changed (every cycle of simulation).
This is a data dump for the “Current
Calculation Matrix”.
The “Start_Pause” macro will copy the current
temperature data into the “Past Matrix” during
every cycle of the internal “Do” loop. This allows
for rolling of the simulation time since the array of
temperatures are calculated iteratively from past
values. So as long as we the newly calculated
values are being constantly pasted in the past the
simulation can go on indefinitely.co
py =
>p
aste
These are parameters used by the “Current
Calculation Matrix”. We use buttons with
macros so that we can change the
parameters in real time while the simulation
is running to make the model interactive.
C
hTTGTTTTTGTT pastnnambambpastnpastbackpastleftpastfrontpastrightpastncurrentn _______int__ 4
- We can see that the temperature calculations are recursive namely they are calculated from the previous temperatures
- We can also see that once all the present temperatures are calculated, they can be used to calculate the future temperatures (one time step ahead of present). This process can be automated in a “copy-present-paste-in-the-past” loop which creates an advancing simulation time.
1
6
11
16
21
26
S1 S4 S7
S1
0
S1
3
S1
6
S1
9
S2
2
S2
5
S2
8
0
50
100
150
200
250
300
350
400
<www.excelunusual.com> 4
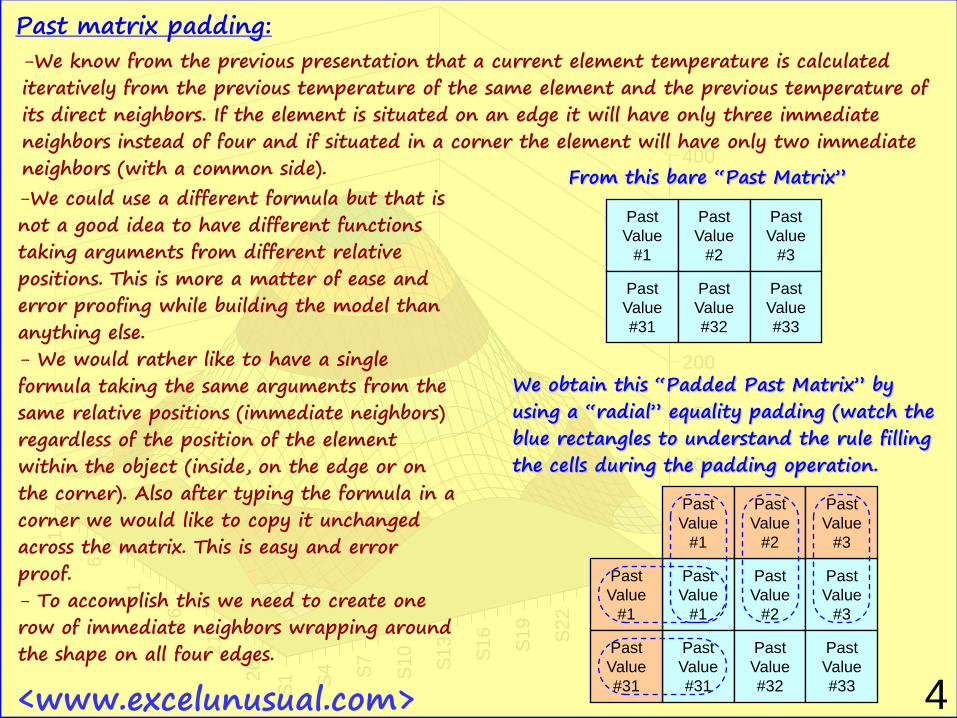
Past matrix padding:
-We could use a different formula but that is not a good idea to have different functions taking arguments from different relative positions. This is more a matter of ease and error proofing while building the model than anything else.- We would rather like to have a single formula taking the same arguments from the same relative positions (immediate neighbors) regardless of the position of the element within the object (inside, on the edge or on the corner). Also after typing the formula in a corner we would like to copy it unchanged across the matrix. This is easy and error proof.- To accomplish this we need to create one row of immediate neighbors wrapping around the shape on all four edges.
-We know from the previous presentation that a current element temperature is calculated iteratively from the previous temperature of the same element and the previous temperature of its direct neighbors. If the element is situated on an edge it will have only three immediate neighbors instead of four and if situated in a corner the element will have only two immediate neighbors (with a common side).
Past
Value
#1
Past
Value
#2
Past
Value
#31
Past
Value
#32
Past
Value
#3
Past
Value
#33
Past
Value
#1
Past
Value
#2
Past
Value
#31
Past
Value
#32
Past
Value
#3
Past
Value
#33
Past
Value
#1
Past
Value
#2
Past
Value
#3
Past
Value
#1
Past
Value
#31
From this bare “Past Matrix”
We obtain this “Padded Past Matrix” by using a “radial” equality padding (watch the blue rectangles to understand the rule filling the cells during the padding operation.
<www.excelunusual.com> 5
C
hTTGTTTTTGTT pastnnambambpastnpastbackpastleftpastfrontpastrightpastncurrentn _______int__ 4
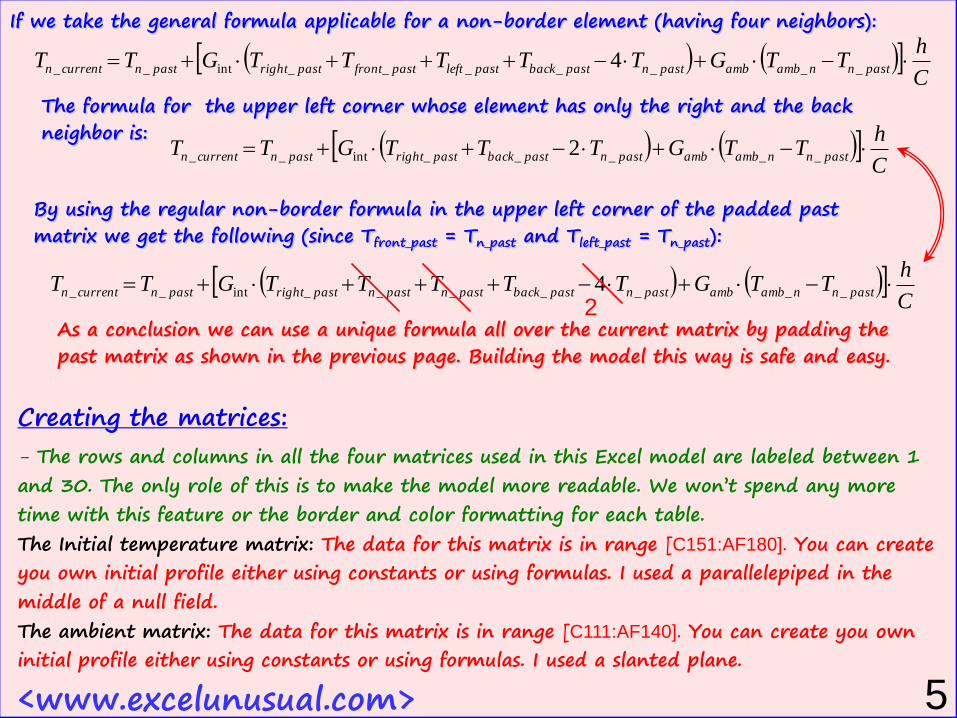
If we take the general formula applicable for a non-border element (having four neighbors):
C
hTTGTTTTTGTT pastnnambambpastnpastbackpastnpastnpastrightpastncurrentn _______int__ 4
The formula for the upper left corner whose element has only the right and the back neighbor is:
C
hTTGTTTGTT pastnnambambpastnpastbackpastrightpastncurrentn _____int__ 2
By using the regular non-border formula in the upper left corner of the padded past matrix we get the following (since Tfront_past = Tn_past and Tleft_past = Tn_past):
2As a conclusion we can use a unique formula all over the current matrix by padding the past matrix as shown in the previous page. Building the model this way is safe and easy.
Creating the matrices:
- The rows and columns in all the four matrices used in this Excel model are labeled between 1
and 30. The only role of this is to make the model more readable. We won’t spend any more
time with this feature or the border and color formatting for each table.
The Initial temperature matrix: The data for this matrix is in range [C151:AF180]. You can create
you own initial profile either using constants or using formulas. I used a parallelepiped in the
middle of a null field.
The ambient matrix: The data for this matrix is in range [C111:AF140]. You can create you own
initial profile either using constants or using formulas. I used a slanted plane.
<www.excelunusual.com> 6The end.
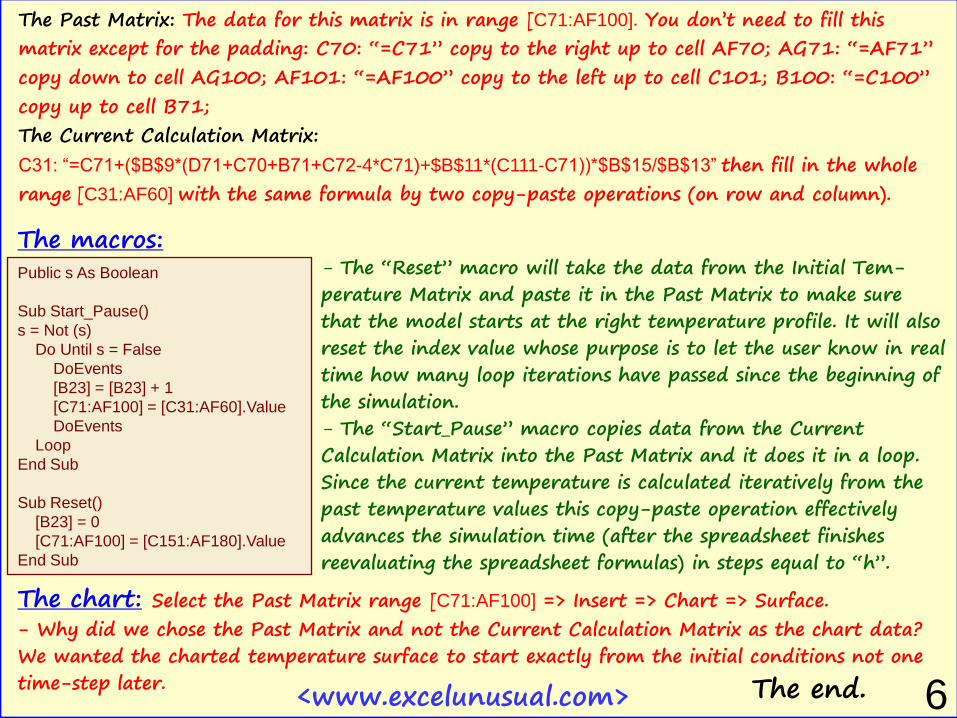
The Past Matrix: The data for this matrix is in range [C71:AF100]. You don’t need to fill this
matrix except for the padding: C70: “=C71” copy to the right up to cell AF70; AG71: “=AF71”
copy down to cell AG100; AF101: “=AF100” copy to the left up to cell C101; B100: “=C100”
copy up to cell B71;
The Current Calculation Matrix:
C31: “=C71+($B$9*(D71+C70+B71+C72-4*C71)+$B$11*(C111-C71))*$B$15/$B$13” then fill in the whole
range [C31:AF60] with the same formula by two copy-paste operations (on row and column).
The macros:- The “Reset” macro will take the data from the Initial Tem-perature Matrix and paste it in the Past Matrix to make sure that the model starts at the right temperature profile. It will also reset the index value whose purpose is to let the user know in real time how many loop iterations have passed since the beginning of the simulation. - The “Start_Pause” macro copies data from the Current Calculation Matrix into the Past Matrix and it does it in a loop. Since the current temperature is calculated iteratively from the past temperature values this copy-paste operation effectively advances the simulation time (after the spreadsheet finishes reevaluating the spreadsheet formulas) in steps equal to “h”.
Public s As Boolean
Sub Start_Pause()
s = Not (s)
Do Until s = False
DoEvents
[B23] = [B23] + 1
[C71:AF100] = [C31:AF60].Value
DoEvents
Loop
End Sub
Sub Reset()
[B23] = 0
[C71:AF100] = [C151:AF180].Value
End Sub
The chart: Select the Past Matrix range [C71:AF100] => Insert => Chart => Surface.
- Why did we chose the Past Matrix and not the Current Calculation Matrix as the chart data? We wanted the charted temperature surface to start exactly from the initial conditions not one time-step later.