
Benchmarking and evaluation of railway - Chiba...
38
Benchmarking and evaluation of railway operations performance Gemma Nicholson, David Kirkwood, Felix Schmid, Clive Roberts Birmingham Centre for Railway Research and Education, UK 25 March 2015
Transcript of Benchmarking and evaluation of railway - Chiba...
Benchmarking and
evaluation of railway
operations performance
Gemma Nicholson, David Kirkwood, Felix Schmid, Clive Roberts
Birmingham Centre for Railway Research and Education, UK
25 March 2015
Outline
Motivation
Quality of Service (QoS) framework
QoS quantitative evaluation
Example of application – ON-TIME project
Conclusions and future work
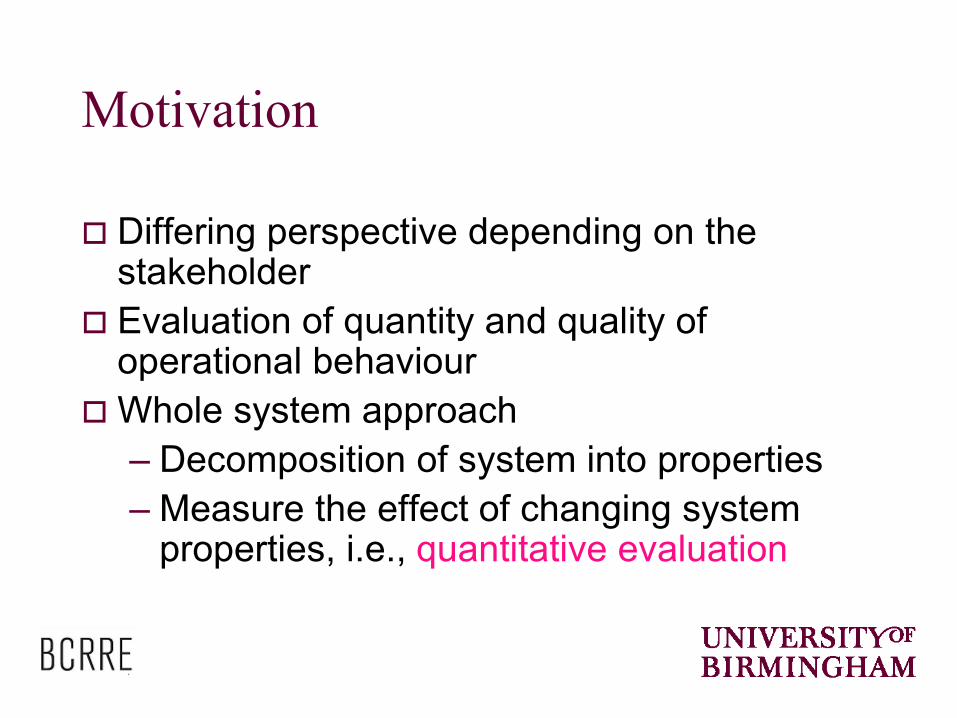
Motivation
Differing perspective depending on the stakeholder
Evaluation of quantity and quality of operational behaviour
Whole system approach
– Decomposition of system into properties
– Measure the effect of changing system properties, i.e., quantitative evaluation
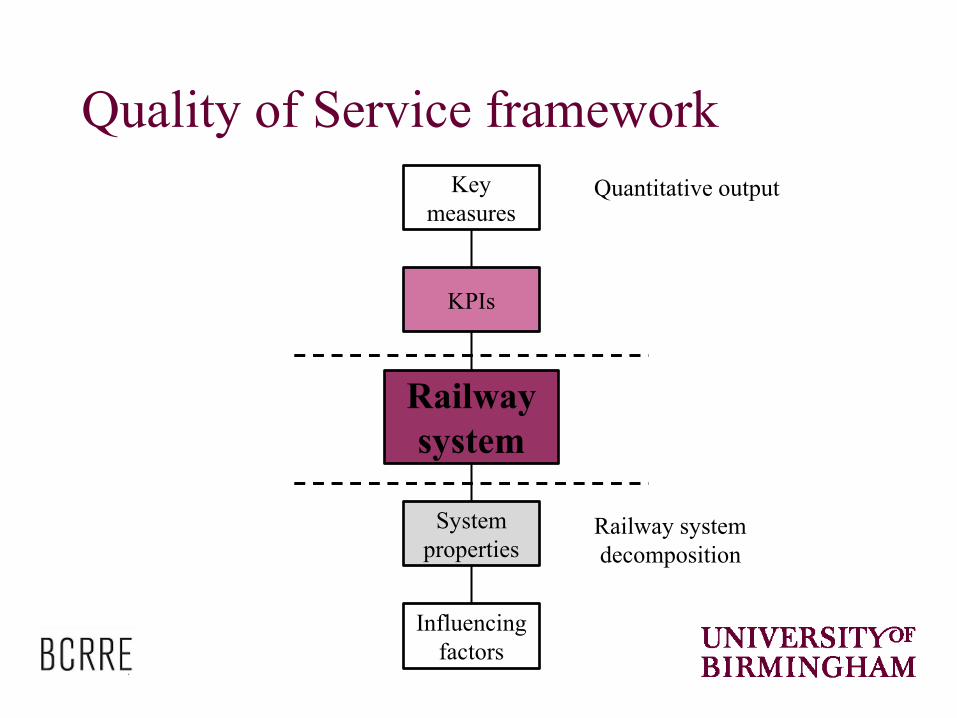
Quality of Service framework
Railway
system
KPIs
Key
measures
System
properties
Influencing
factors
Railway system
decomposition
Quantitative output
QoS framework applications
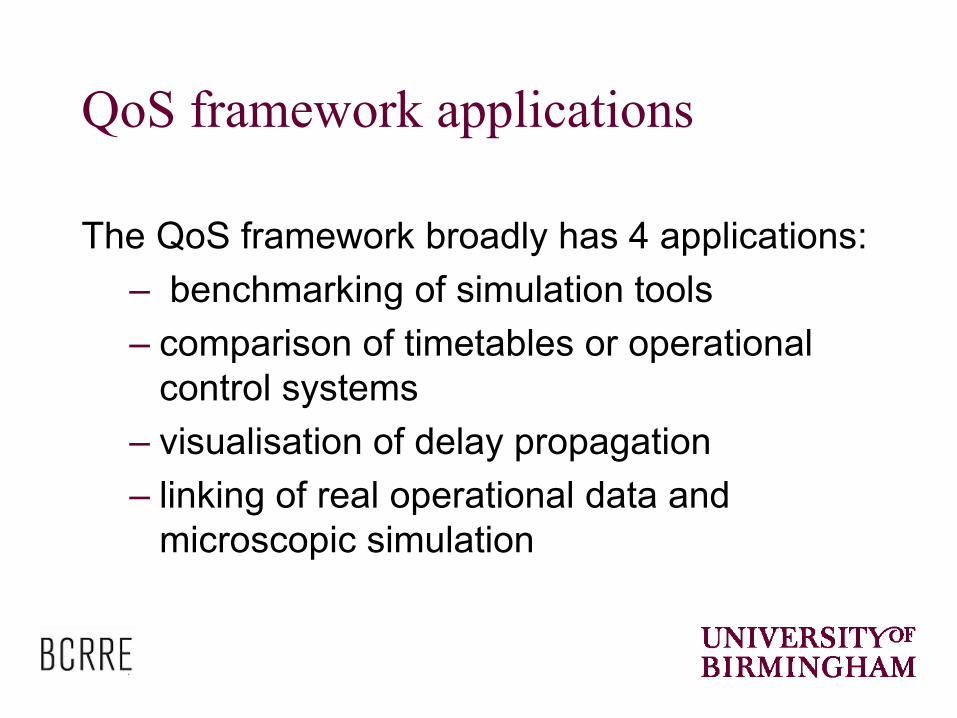
The QoS framework broadly has 4 applications:
– benchmarking of simulation tools
– comparison of timetables or operational
control systems
– visualisation of delay propagation
– linking of real operational data and
microscopic simulation
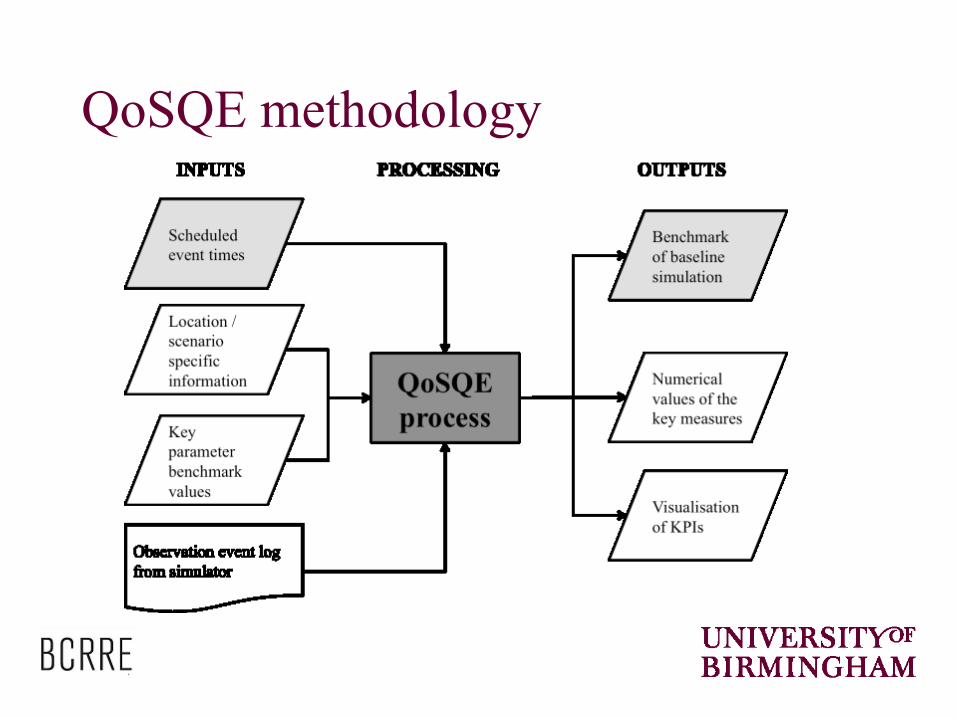
QoSQE methodology

The full Quality of Service framework…

Railway
system
KPIs
Key
measures
System
properties
Influencing
factors
QoS
framework
outline
The full framework
Transport volume
Passenger comfort
Journey time
Connectivity Resilience Punctuality Energy Resource
usage
passenger km
freight tonne km
journey time no transfer
interchange time crowding
maximum deviation
deviation area
time to recover
delays at destination
station arrival delays
energy consumption
crew usage
track usage
rolling stock usage
Railway system
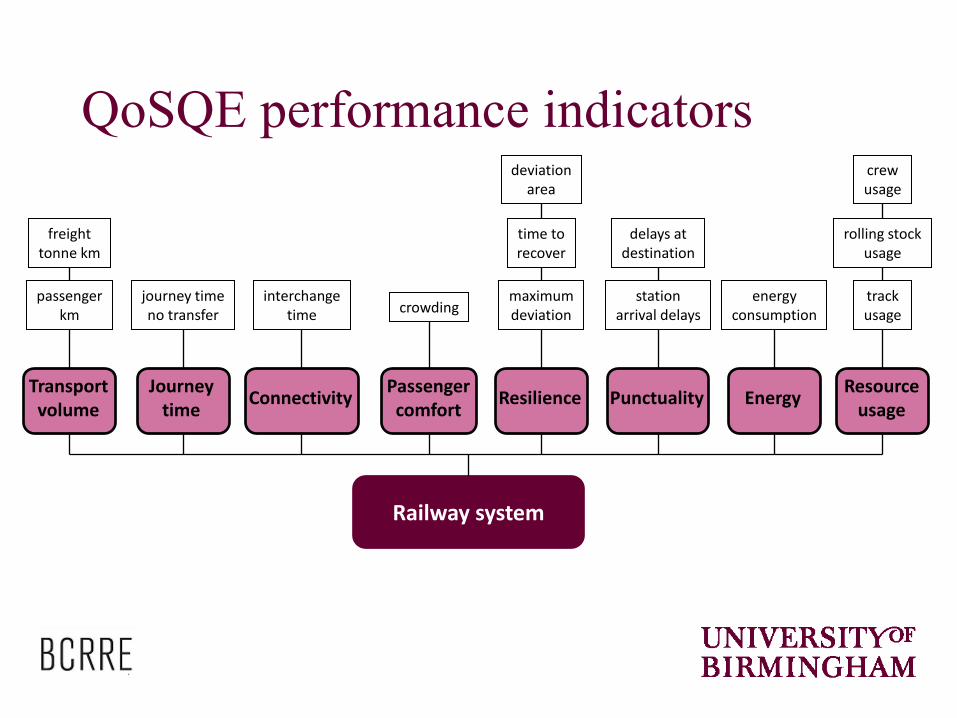
QoSQE performance indicators
Transport volume
Passenger comfort
Journey time
Connectivity Resilience Punctuality Energy Resource
usage
passenger km
freight tonne km
journey time no transfer
interchange time crowding
maximum deviation
deviation area
time to recover
delays at destination
station arrival delays
energy consumption
crew usage
track usage
rolling stock usage
Railway system
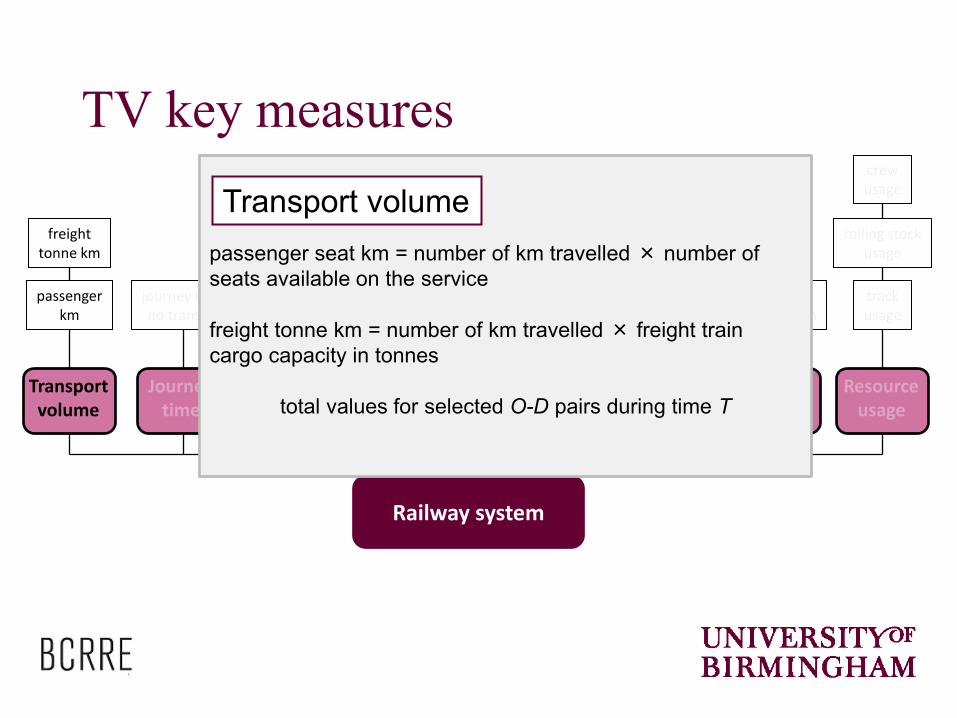
TV key measures
passenger seat km = number of km travelled × number of
seats available on the service
freight tonne km = number of km travelled × freight train
cargo capacity in tonnes
total values for selected O-D pairs during time T
Transport volume
Transport volume
Passenger comfort
Journey time
Connectivity Resilience Punctuality Energy Resource
usage
passenger km
freight tonne km
journey time no transfer
interchange time crowding
maximum deviation
deviation area
time to recover
delays at destination
station arrival delays
energy consumption
crew usage
track usage
rolling stock usage
Railway system
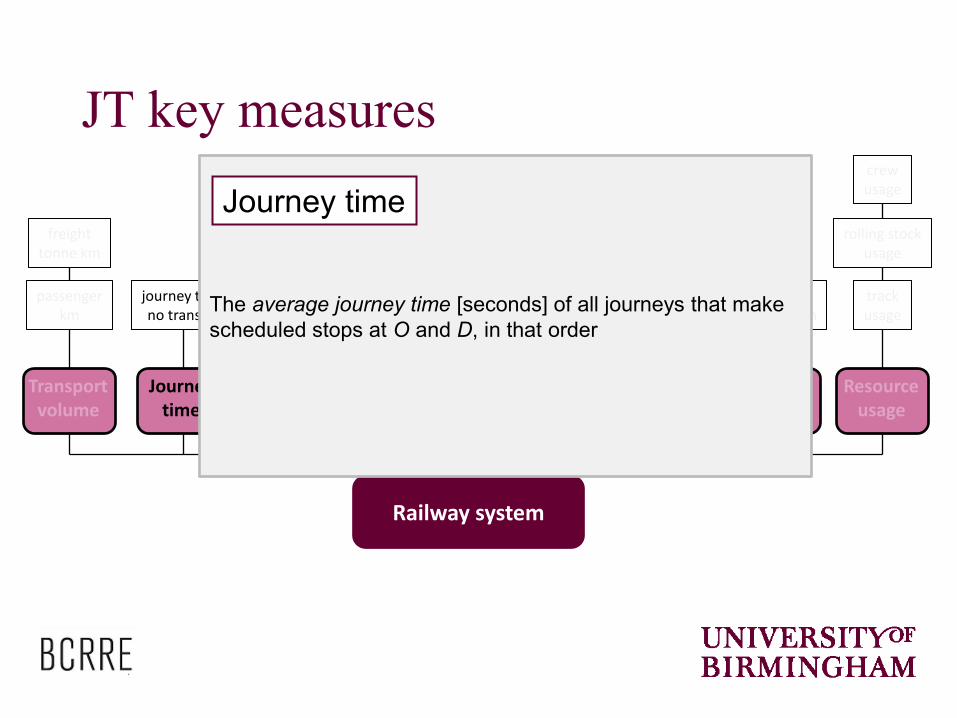
JT key measures
The average journey time [seconds] of all journeys that make
scheduled stops at O and D, in that order
Journey time

Transport volume
Passenger comfort
Journey time
Connectivity Resilience Punctuality Energy Resource
usage
passenger km
freight tonne km
journey time no transfer
interchange time crowding
maximum deviation
deviation area
time to recover
delays at destination
station arrival delays
energy consumption
crew usage
track usage
rolling stock usage
Railway system
CN key measures
The average interchange time of all interchanges at I for
journeys that both depart O and arrive at D during the
simulation time T
Connectivity
Transport volume
Passenger comfort
Journey time
Connectivity Resilience Punctuality Energy Resource
usage
passenger km
freight tonne km
journey time no transfer
interchange time crowding
maximum deviation
deviation area
time to recover
delays at destination
station arrival delays
energy consumption
crew usage
track usage
rolling stock usage
Railway system
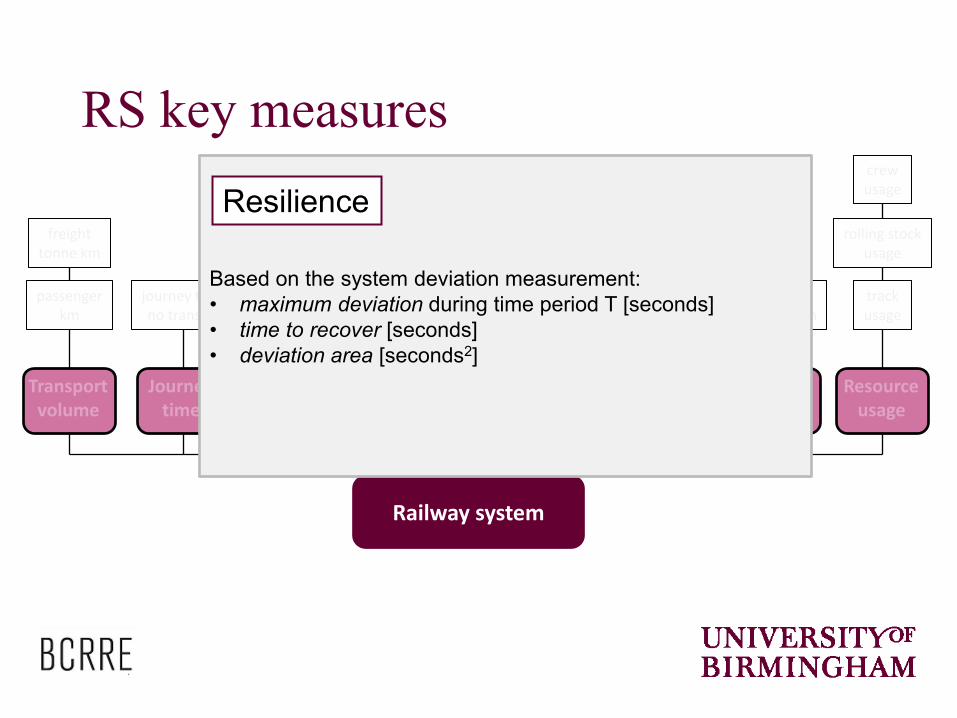
RS key measures
Based on the system deviation measurement:
• maximum deviation during time period T [seconds]
• time to recover [seconds]
• deviation area [seconds2]
Resilience
Transport volume
Passenger comfort
Journey time
Connectivity Resilience Punctuality Energy Resource
usage
passenger km
freight tonne km
journey time no transfer
interchange time crowding
maximum deviation
deviation area
time to recover
delays at destination
station arrival delays
energy consumption
crew usage
track usage
rolling stock usage
Railway system
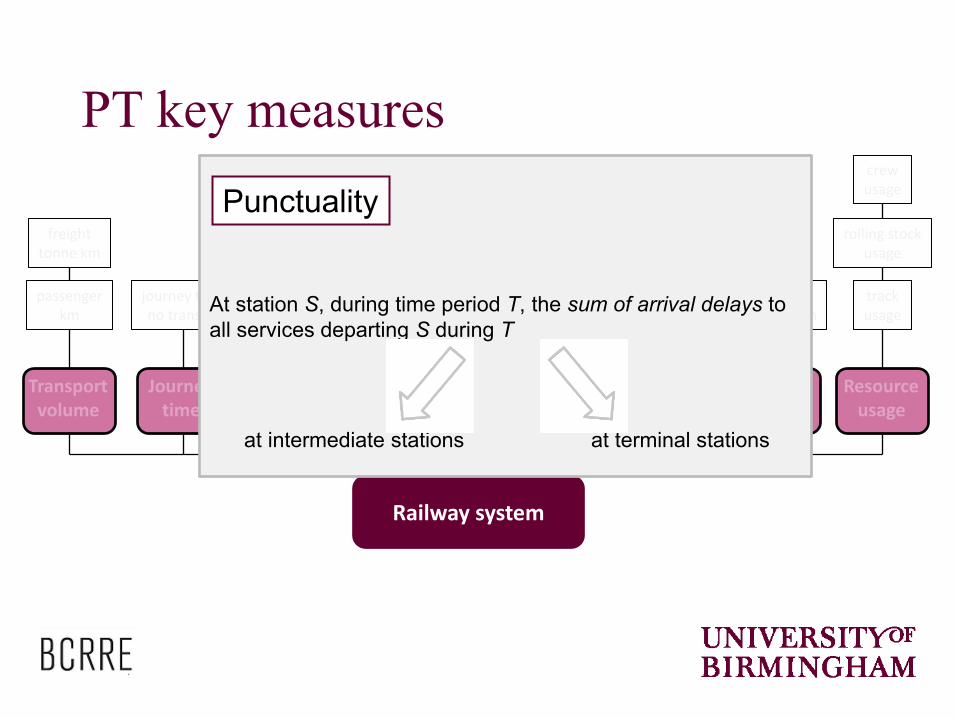
PT key measures
At station S, during time period T, the sum of arrival delays to
all services departing S during T
at intermediate stations at terminal stations
Punctuality
Transport volume
Passenger comfort
Journey time
Connectivity Resilience Punctuality Energy Resource
usage
passenger km
freight tonne km
journey time no transfer
interchange time crowding
maximum deviation
deviation area
time to recover
delays at destination
station arrival delays
energy consumption
crew usage
track usage
rolling stock usage
Railway system
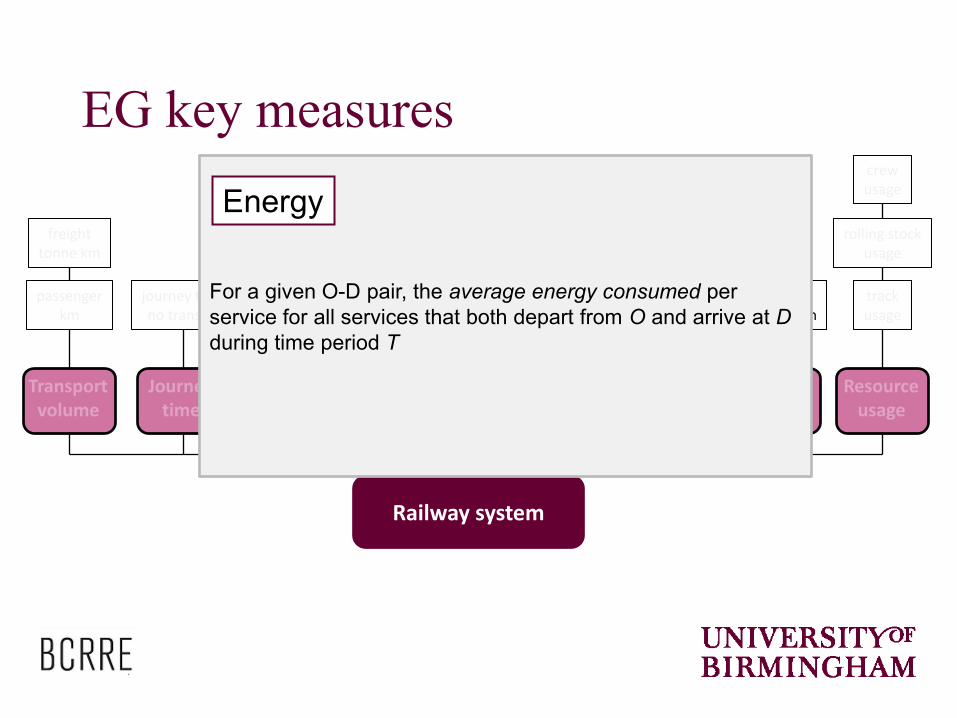
EG key measures
For a given O-D pair, the average energy consumed per
service for all services that both depart from O and arrive at D
during time period T
Energy
Transport volume
Passenger comfort
Journey time
Connectivity Resilience Punctuality Energy Resource
usage
passenger km
freight tonne km
journey time no transfer
interchange time crowding
maximum deviation
deviation area
time to recover
delays at destination
station arrival delays
energy consumption
crew usage
track usage
rolling stock usage
Railway system
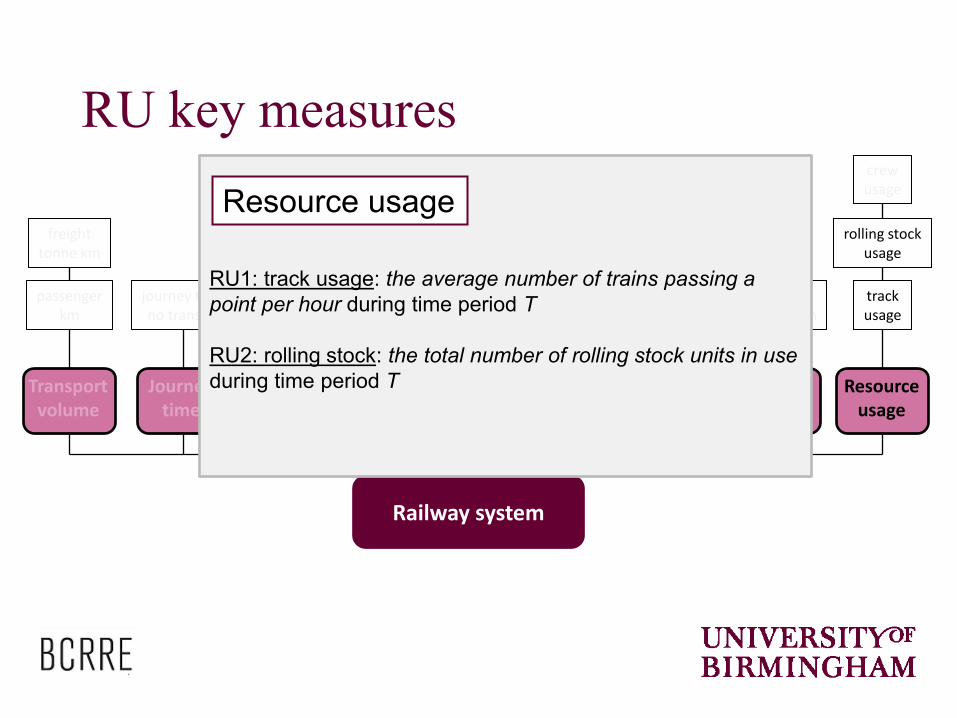
RU key measures
RU1: track usage: the average number of trains passing a
point per hour during time period T
RU2: rolling stock: the total number of rolling stock units in use
during time period T
Resource usage
Example: ONTIME project
Project aim: an improvement in capacity by
reducing delays and improving traffic fluidity
Evaluation and comparison of traffic
management approaches
– For minor perturbations
– For major perturbations
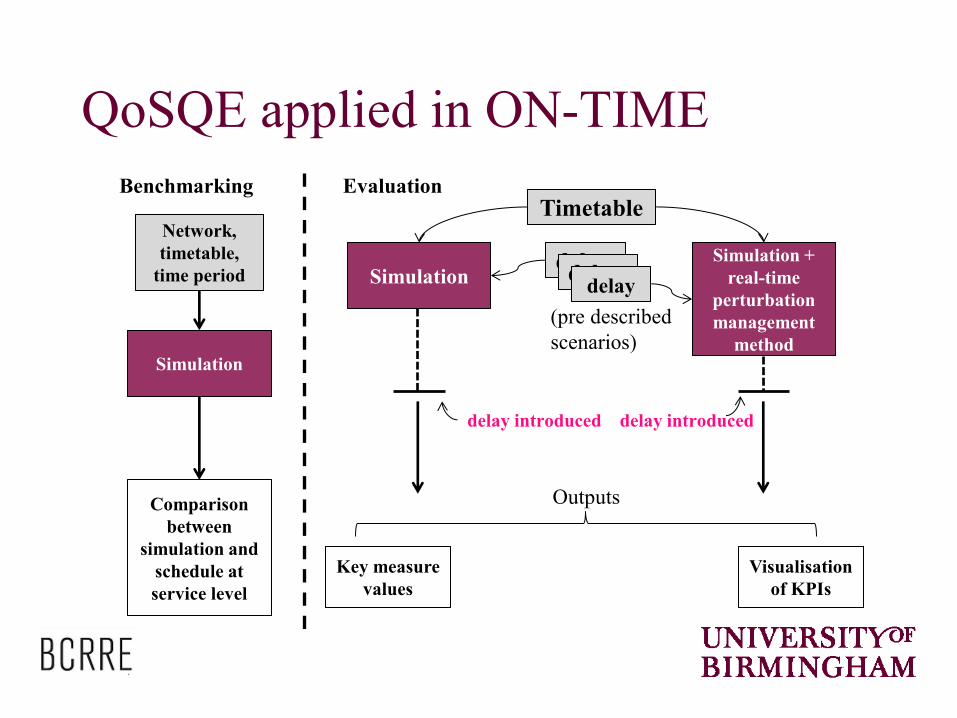
QoSQE applied in ON-TIME
Key measure
values
Timetable
Outputs
Simulation +
real-time
perturbation
management
method
Simulation delay
delay delay
(pre described
scenarios)
delay introduced delay introduced
Visualisation
of KPIs
Network,
timetable,
time period
Simulation
Comparison
between
simulation and
schedule at
service level
Benchmarking Evaluation
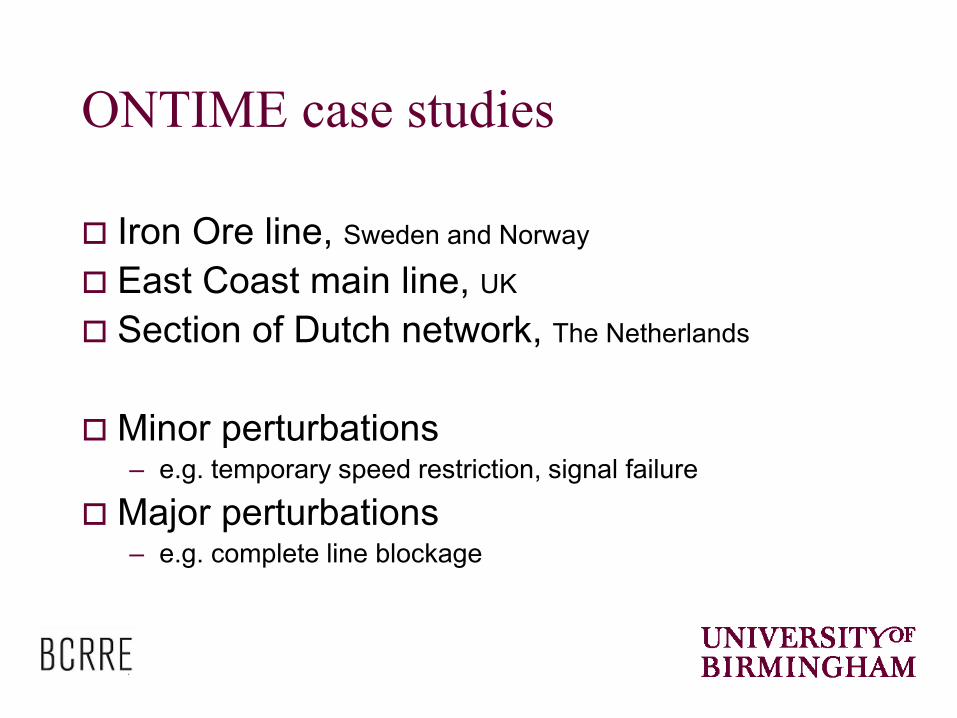
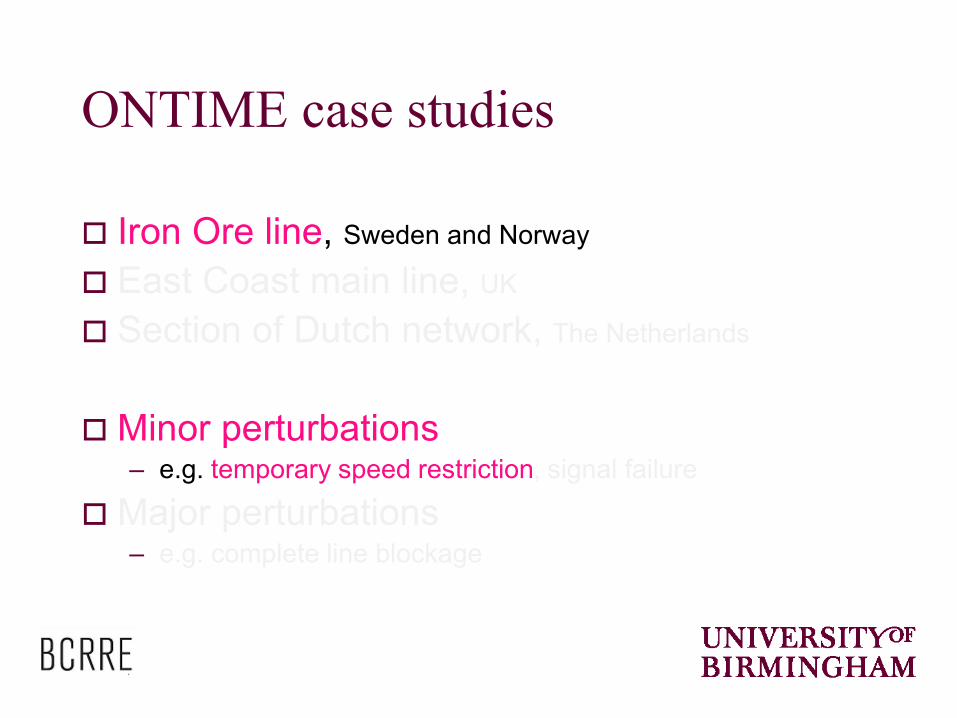
ONTIME case studies
Iron Ore line, Sweden and Norway
East Coast main line, UK
Section of Dutch network, The Netherlands
Minor perturbations – e.g. temporary speed restriction, signal failure
Major perturbations – e.g. complete line blockage
ONTIME case studies
Iron Ore line, Sweden and Norway
East Coast main line, UK
Section of Dutch network, The Netherlands
Minor perturbations – e.g. temporary speed restriction, signal failure
Major perturbations – e.g. complete line blockage
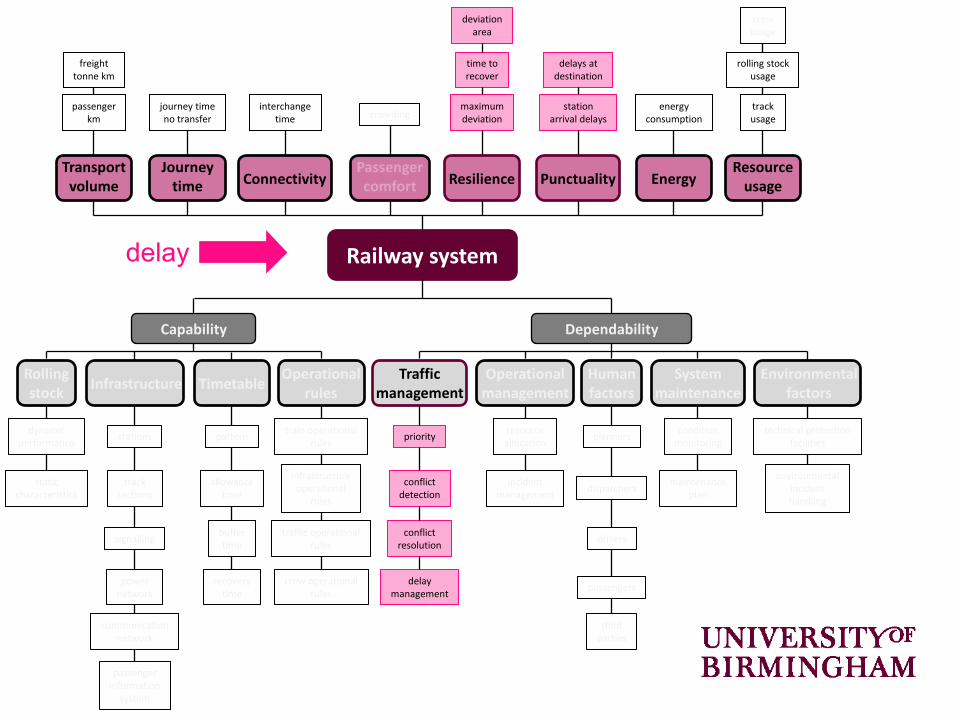
Transport volume
Passenger comfort
Journey time Connectivity Resilience Punctuality Energy
Resource usage
Rolling stock
Infrastructure Timetable Operational
rules Traffic
management Operational
management Human factors
System maintenance
Environmental factors
passenger km
freight tonne km
journey time no transfer
interchange time crowding
maximum deviation
deviation area
time to recover
delays at destination
station arrival delays
energy consumption
crew usage
track usage
rolling stock usage
dynamic performance
static characteristics
stations
track sections
signalling
power network
communication network
passenger information
system
pattern
allowance time
buffer time
recovery time
train operational rules
infrastructure operational
rules
traffic operational rules
crew operational rules
Railway system
Capability Dependability
priority
conflict detection
conflict resolution
delay management
resource allocation
incident management
planners
dispatchers
drivers
passengers
third parties
condition monitoring
maintenance plan
technical protection facilities
environmental incident handling
delay

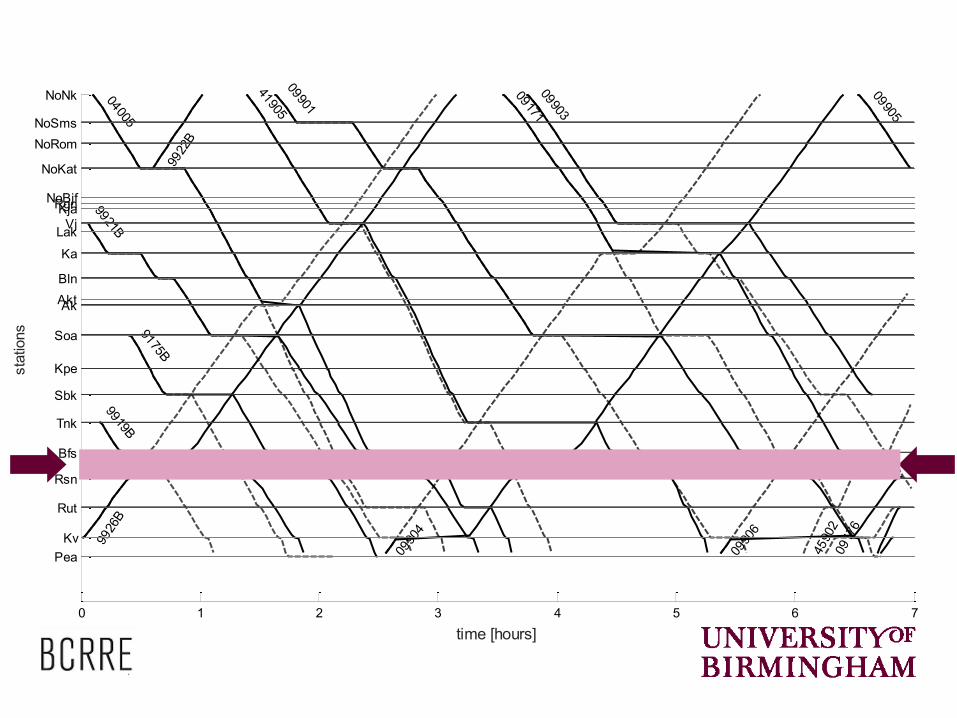
IOL simulator benchmarking
Comparison between timetabled and simulated
event times for IOL simulation…

IOL simulator benchmarking
0 5 10 15 20 25 30 35
Kra
Kmb
Svv
Apt
Rsi
Kia
Pea
Kv
Rut
Rsn
Bfs
Tnk
Sbk
Kpe
Soa
Ak
Akt
Bln
Ka
Lak
Vj
Kja
Rgn
NoBjf
NoKat
NoRom
NoSms
NoNk
timetabled train service indices
sta
tion
s
Diff
ere
nce
be
twe
en
tim
eta
ble
d a
nd
sim
ula
ted
de
pa
rtu
re tim
e [se
co
nd
s]
1
10
50
100
500
1000
1600
timetabled but not logged in simulation timetable matches simulation
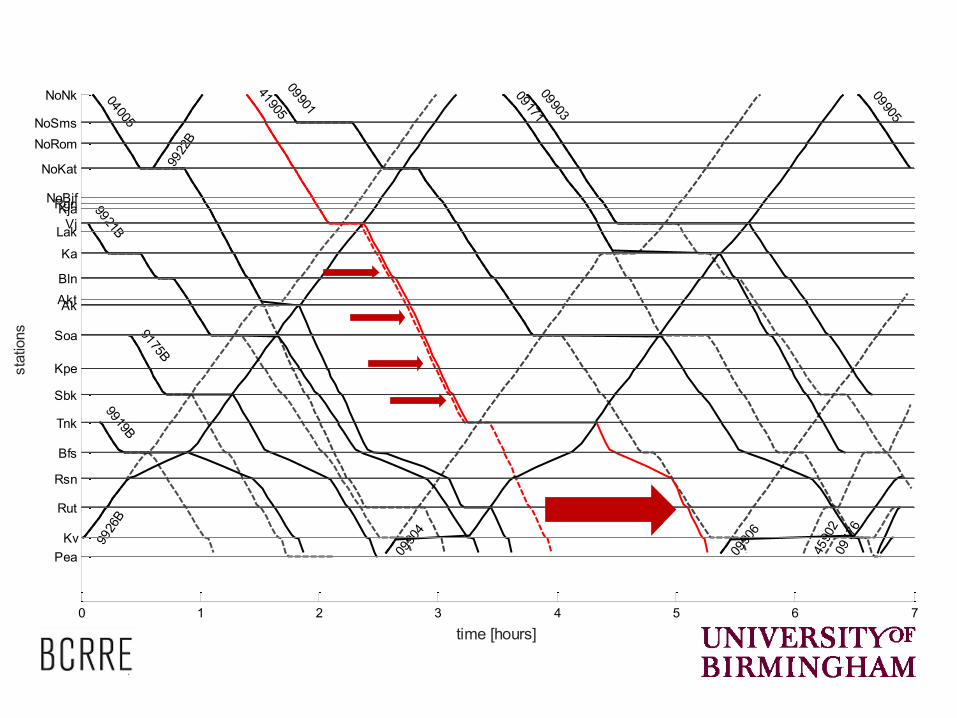
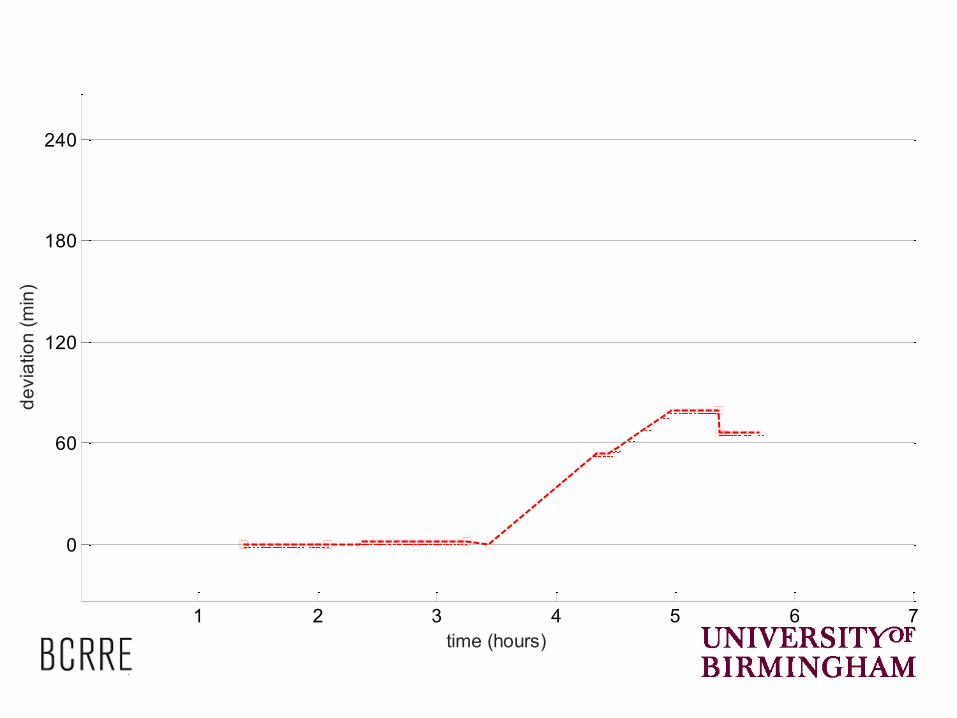
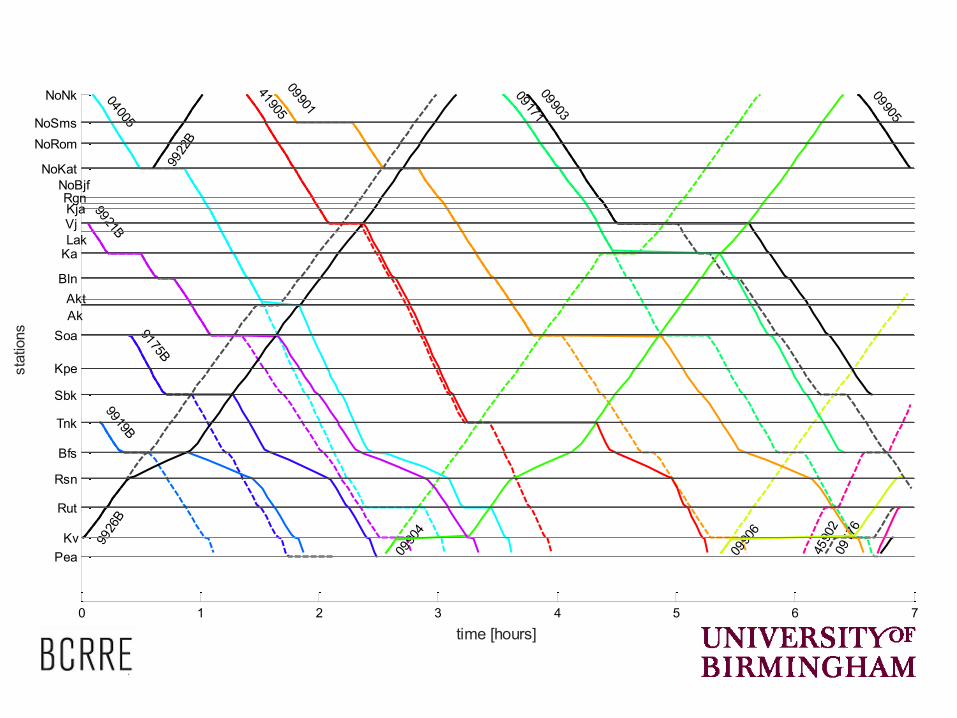
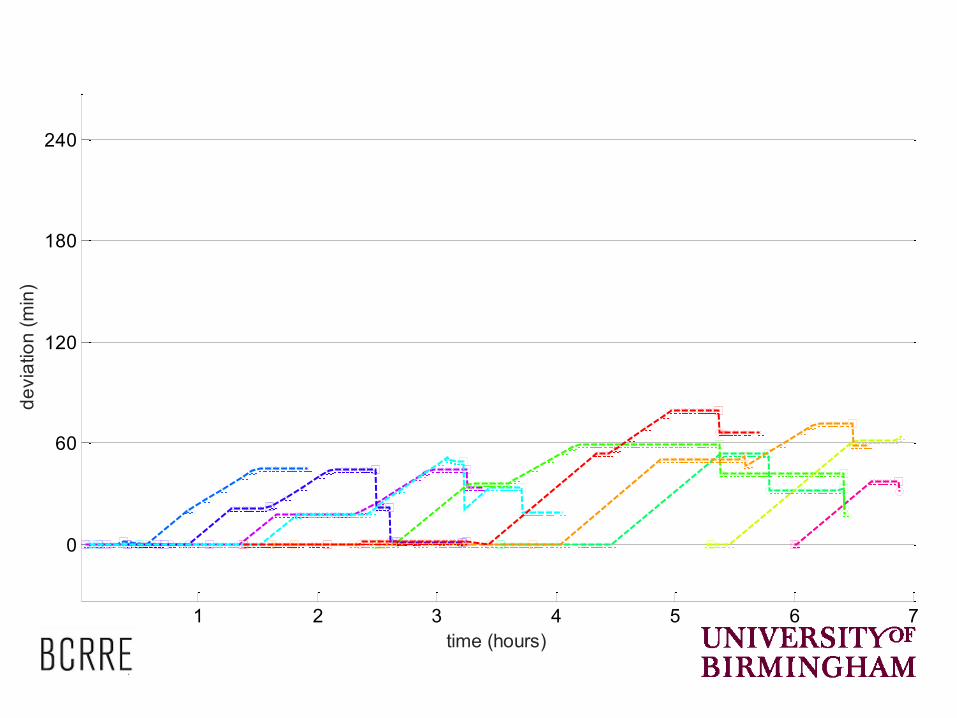
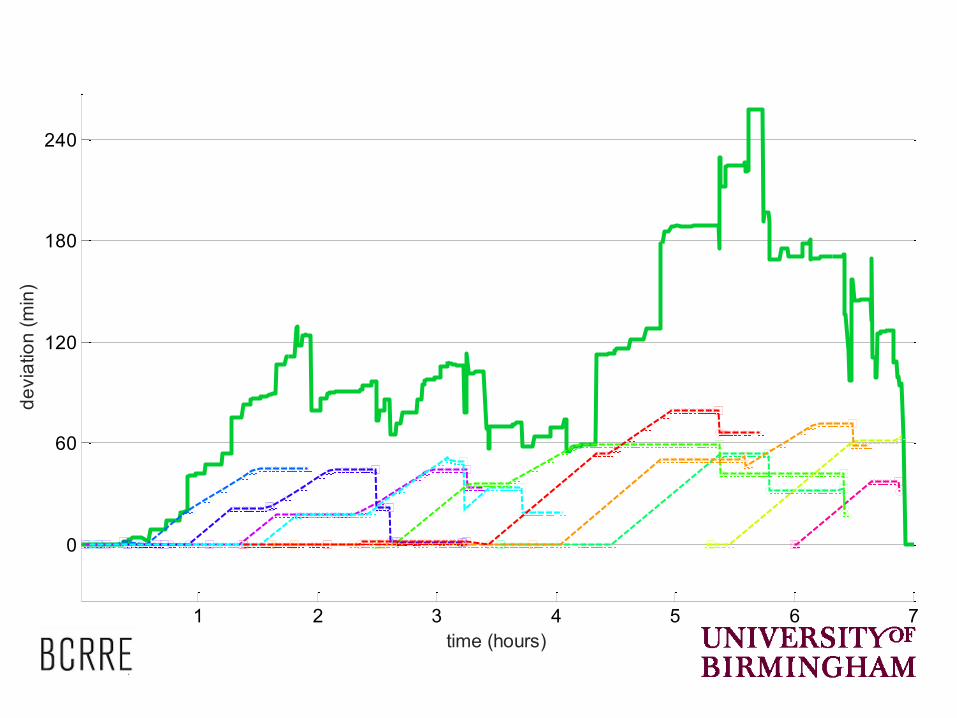
IOL quantitative evaluation
Quantification of key measures…
1. Demonstration of resilience KPI using in-built simulator logic only
2. Key measure results using perturbation management algorithms
0 1 2 3 4 5 6 7
NoNk
NoSms
NoRom
NoKat
NoBjfRgnKjaVj
Lak
Ka
Bln
AktAk
Soa
Kpe
Sbk
Tnk
Bfs
Rsn
Rut
Kv
Pea
04005
09171
9175B
0917
6
09901
09903
0990
4
09905
0990
6
9919B
9921B
9922
B
9926
B
41905
4590
2
time [hours]
sta
tions
0 1 2 3 4 5 6 7
NoNk
NoSms
NoRom
NoKat
NoBjfRgnKjaVj
Lak
Ka
Bln
AktAk
Soa
Kpe
Sbk
Tnk
Bfs
Rsn
Rut
Kv
Pea
04005
09171
9175B
0917
6
09901
09903
0990
4
09905
0990
6
9919B
9921B
9922
B
9926
B
41905
4590
2
time [hours]
sta
tions
1 2 3 4 5 6 7
0
60
120
180
240
time (hours)
de
via
tio
n (
min
)
0 1 2 3 4 5 6 7
NoNk
NoSms
NoRom
NoKat
Vj
Ka
Bln
Soa
Kpe
Sbk
Tnk
Bfs
Rsn
Rut
Kv
Pea
04005
09171
9175B
0917
6
09901
09903
0990
4
09905
0990
6
9919B
9921B
9922
B
9926
B
41905
4590
2
time [hours]
sta
tions
Kja
NoBjfRgn
Lak
Akt
Ak
1 2 3 4 5 6 7
0
60
120
180
240
time (hours)
de
via
tio
n (
min
)
1 2 3 4 5 6 7
0
60
120
180
240
time (hours)
de
via
tio
n (
min
)

1 2 3 4 5 6 7
0
60
120
180
240
time (hours)
de
via
tio
n (
min
)
time to recover
maximumdeviation
deviation area
Resilience KPI
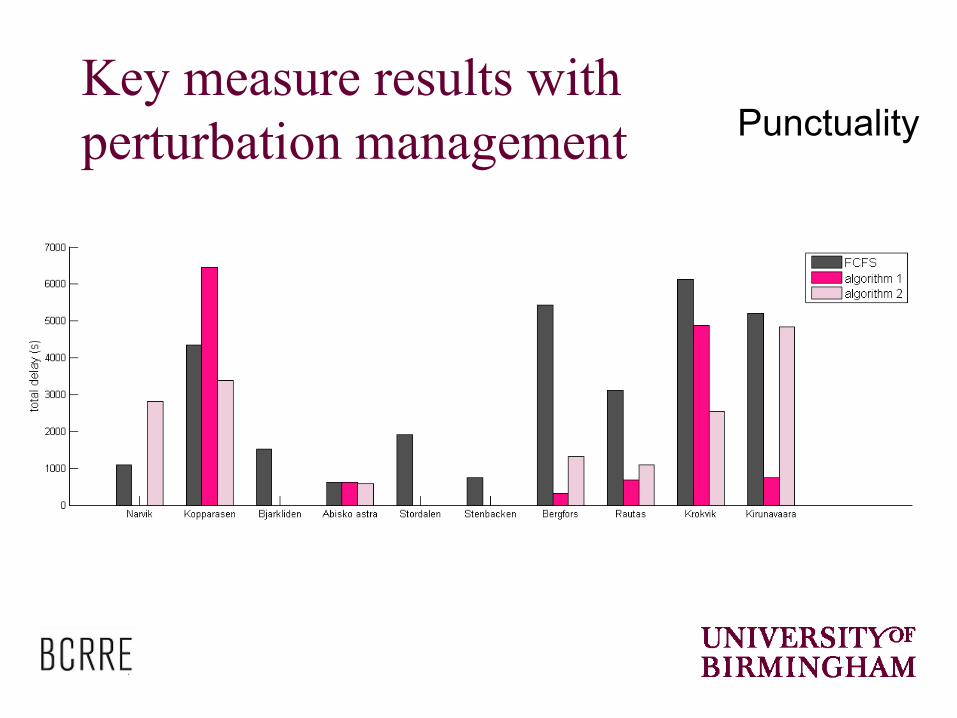
Key measure results with
perturbation management Punctuality
1 2 3 4 5 6 7-2000
0
2000
4000
6000
8000
10000
12000
14000
16000
time (hours)
de
via
tio
n (
s)
1 2 3 4 5 6 7-2000
0
2000
4000
6000
8000
10000
12000
14000
16000
time (hours)
de
via
tio
n (
s)
1 2 3 4 5 6 7-2000
0
2000
4000
6000
8000
10000
12000
14000
16000
time (hours)
de
via
tio
n (
s)
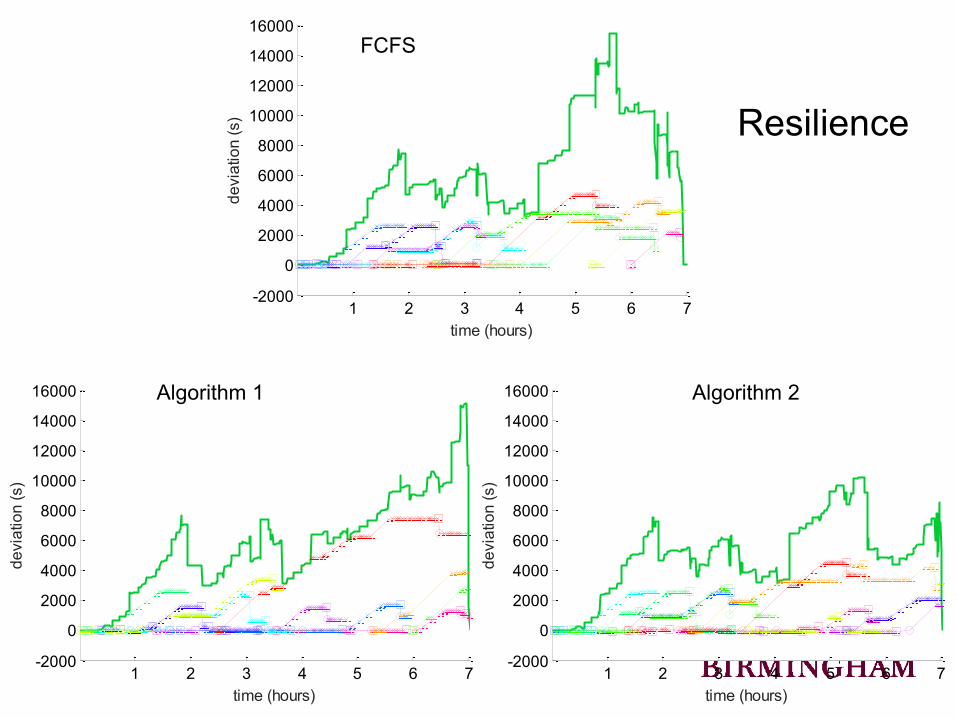
Algorithm 1 Algorithm 2
FCFS
Resilience
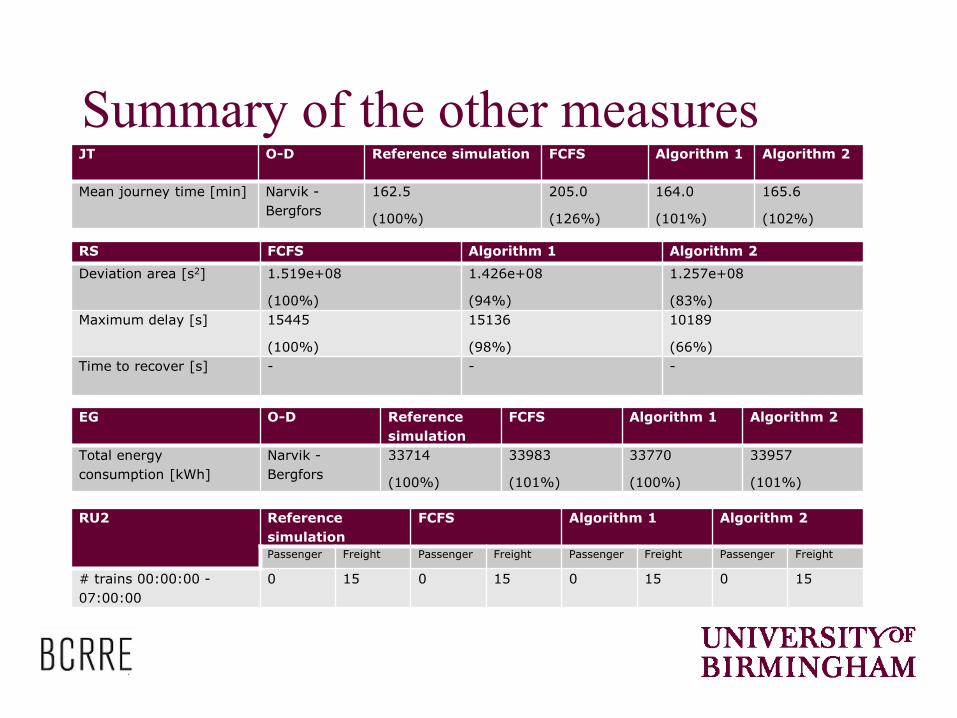
Summary of the other measures JT O-D Reference simulation FCFS Algorithm 1 Algorithm 2
Mean journey time [min] Narvik -
Bergfors
162.5
(100%)
205.0
(126%)
164.0
(101%)
165.6
(102%)
RS FCFS Algorithm 1 Algorithm 2
Deviation area [s2] 1.519e+08
(100%)
1.426e+08
(94%)
1.257e+08
(83%)
Maximum delay [s] 15445
(100%)
15136
(98%)
10189
(66%)
Time to recover [s] - - -
EG O-D Reference
simulation
FCFS Algorithm 1 Algorithm 2
Total energy
consumption [kWh]
Narvik -
Bergfors
33714
(100%)
33983
(101%)
33770
(100%)
33957
(101%)
RU2 Reference
simulation
FCFS Algorithm 1 Algorithm 2
Passenger Freight Passenger Freight Passenger Freight Passenger Freight
# trains 00:00:00 -
07:00:00
0 15 0 15 0 15 0 15
Conclusions
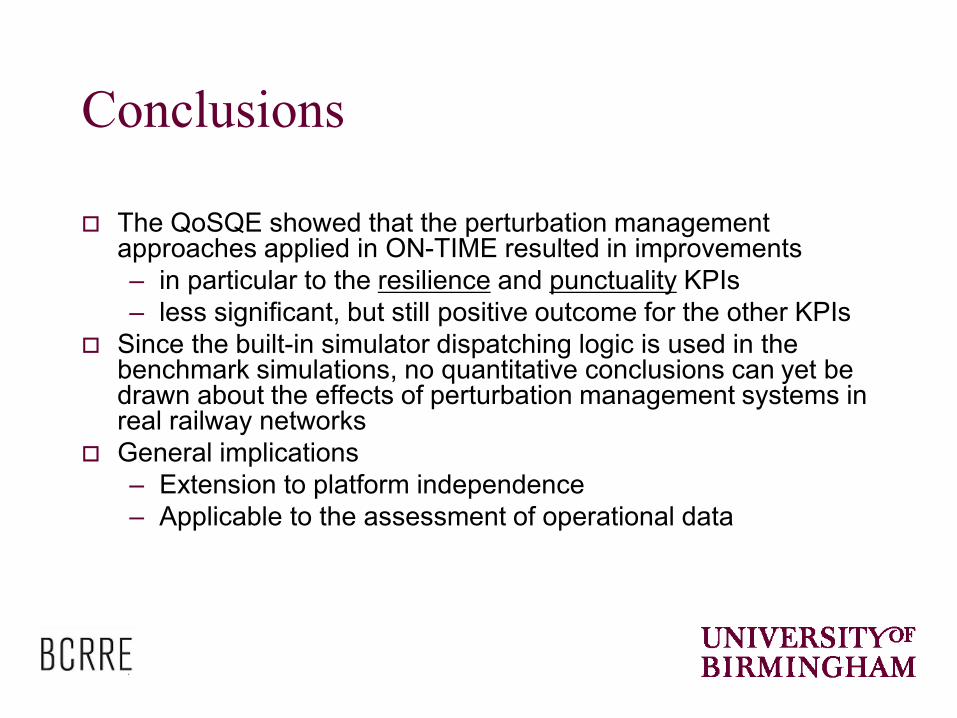
The QoSQE showed that the perturbation management approaches applied in ON-TIME resulted in improvements
– in particular to the resilience and punctuality KPIs
– less significant, but still positive outcome for the other KPIs
Since the built-in simulator dispatching logic is used in the benchmark simulations, no quantitative conclusions can yet be drawn about the effects of perturbation management systems in real railway networks
General implications
– Extension to platform independence
– Applicable to the assessment of operational data

Further work
Formalisation of the key measures
Application in other situations
– future projects
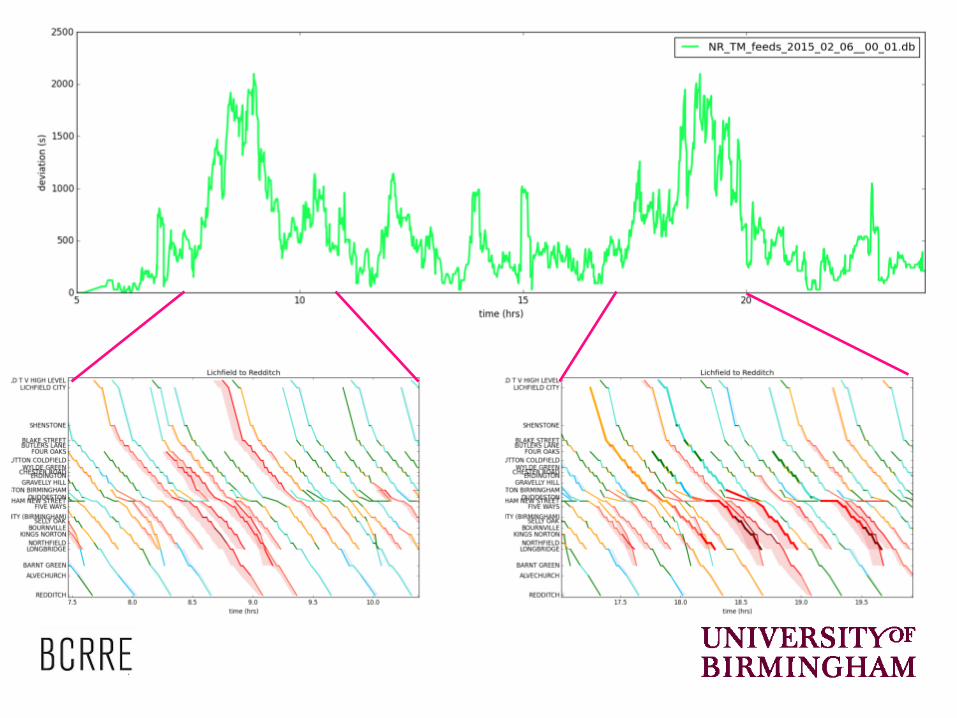
– using real operational data e.g. evaluation of traffic on the Birmingham Cross City line
Thank you
Benchmarking and evaluation of railway
operations performance
Gemma Nicholson, David Kirkwood, Felix Schmid, Clive Roberts
Birmingham Centre for Railway Research and Education, UK
![Lei Kong, 1 2 Hua Zhang, arXiv:1508.06183v1 [cs.IT] 25 Aug ...](https://static.fdocuments.in/doc/165x107/61bd387e61276e740b108e39/lei-kong-1-2-hua-zhang-arxiv150806183v1-csit-25-aug-.jpg)


![arXiv:1809.06522v3 [cs.IT] 19 Oct 2019](https://static.fdocuments.in/doc/165x107/624f57b00d490219c6685d60/arxiv180906522v3-csit-19-oct-2019.jpg)

![arXiv:1603.02018v1 [cs.IT] 7 Mar 2016arXiv:1603.02018v1 [cs.IT] 7 Mar 2016 Linear Codes over Galois Ring GR(p2,r) Related to Gauss sums ∗ Aixian Zhang, Jin Li, Keqin Feng Abstract:](https://static.fdocuments.in/doc/165x107/6033b6815315795fcf7f7175/arxiv160302018v1-csit-7-mar-2016-arxiv160302018v1-csit-7-mar-2016-linear.jpg)
![arXiv:2012.00235v2 [cs.IT] 30 May 2021](https://static.fdocuments.in/doc/165x107/62602f10f2f4b83da561c4e4/arxiv201200235v2-csit-30-may-2021.jpg)


![arXiv:1403.2912v2 [cs.IT] 14 Mar 2014](https://static.fdocuments.in/doc/165x107/623a1c2bc8851d498d0f69fe/arxiv14032912v2-csit-14-mar-2014.jpg)

![arXiv:1702.01203v1 [cs.IT] 3 Feb 2017arXiv:1702.01203v1 [cs.IT] 3 Feb 2017 Intrinsic entropies of log-concave distributions VarunJog VenkatAnantharam vjog@wisc.edu ananth@eecs.berkeley.edu](https://static.fdocuments.in/doc/165x107/5e7de4beff93f835016d2e31/arxiv170201203v1-csit-3-feb-2017-arxiv170201203v1-csit-3-feb-2017-intrinsic.jpg)