Auto LoAns LoAns. 62 The State of ... or, more likely, use it as a negotiating tool for dealer...
25
Center for Responsible Lending 61 www.responsiblelending.org The State of Lending in America & its Impact on U.S. Households Delvin Davis December 2012 AUTO LOANS
Transcript of Auto LoAns LoAns. 62 The State of ... or, more likely, use it as a negotiating tool for dealer...
Center for Responsible Lending 61www.responsiblelending.org
The State of Lending in America & its Impact on U.S. Households
Delvin Davis
December 2012
Auto LoAns
The State of Lending in America and its Impact on U.S. Households62
Auto Loans
An IntroductIon to Auto loAns
A utomobiles are one of the largest purchases American households will make, only behind the purchase of a home. For most households car ownership is not a luxury but a prerequisite to
economic opportunity. Car ownership affects where people can live and significantly expands Americans’ options for jobs. As a result, both the affordability and sustainability of auto financing are central concerns for most American families. As noted in America’s Household Balance Sheet, in the last decade deleveraging of auto loans began as early as 2005. Many households relied on home equity to finance car purchases, and as that market disappeared, those families chose not to purchase a car at all or purchased cheaper vehicles. Households responded to deteriorating income situations by buying used cars instead of new ones and holding onto their cars for longer periods of time. These choices, however, have made families who did enter the market even more vulnerable to abusive auto lending practices as the pressure to increase revenue per sale grew.
Purchasing a car is a complicated endeavor with several moving parts. The sales price, the value of a trade-in, and financing are all separate and negotiable transactions. Any of these elements can have a significant impact on the vehicle’s overall cost. When financing a vehicle, consumers have the option to either secure financing directly from a lender, or finance the car at the dealership. If a dealership finances the car purchase, the dealer earns revenue on the sale of the car itself (known as the “front end” of the transaction) and also on the financing and the related sale of add-on products such as extended warranties (known as the “back end” of the transaction).
The explosion of information about car prices on the internet has provided consumers with the ability to more effectively negotiate the sales price of the car. This, in turn, has caused a significant reduction in the profit margin dealers receive on the sale of cars. As such, dealers have come to rely heavily on profits generated after the sale of the car—most significantly from the finance and insurance (F&I) office. The F&I office is where the paperwork for the deal is generated, where the financing terms are offered, and where the sale of additional products such as extended warranties, credit insurance, guaranteed asset protection (GAP) insurance, vehicle service contracts, and the like are sold.
The same level of easily accessible information does not exist for financing options as it does for vehicle price information. Because loan pricing is based on individual risk, the only way for a con-sumer to compare prices on loans is to go through the loan application process. In the case of dealer financing, the consumer must virtually complete the sales and financing process—the consumer has to pick a car, negotiate the sales price, negotiate the value of a trade-in vehicle, and only then submit an application for financing. The complicated process often times suppresses a consumer’s willingness to apply in several places to compare offers.
Access to credit is also a significant issue, and the risk of predatory lending is more acute for consum-ers with subprime credit scores. Consumers with high credit scores have multiple lenders in their communities offering to make loans to them. However, there are very few lenders with brick and mortar operations willing to make loans available to consumers with subprime credit scores. The auto finance community has admitted as much, stating that subprime consumers’ access to credit is largely
Center for Responsible Lending 63
online or through the dealer. This leaves subprime consum-ers to decide between applying for a loan over the internet with a lender the consumer has never heard of, or finance through the dealer.1 In most cases, the consumer will choose the dealer. Our research and previous lawsuits have shown that subprime consumers often pay a hefty and unwarranted premium due to this dynamic.
The lack of transparency and regulation in auto finance has allowed different predatory practices to thrive throughout the years, creating more expensive and unsustainable loans for consumers. This is especially burdensome on those with subprime credit that have fewer financing options.
1 Quote by Randy Henrick of Dealertrack, Inc., at The road ahead: selling financing & leasing motor vehicles, Federal Trade Commis-sion (Roundtable 1, Session 2): “There’s hundreds of lenders online who are looking for subprime customers and make direct loans to customers. And it’s up to the consumer—if they want to do an internet search, they can find them.” See http://www.ftc.gov/bcp/workshops/motorvehicles/
the lack of transparency
and regulation in auto
finance has allowed different
predatory practices to
thrive throughout the years,
creating more expensive
and unsustainable loans
for consumers.
The State of Lending in America and its Impact on U.S. Households64
MArket And Industry overvIew
TypesofAutoDealers
There are three main types of auto dealers: franchise, independent, and buy here pay here (BHPH).
Franchise Dealers
A franchise dealer has an exclusive franchise to sell or lease a particular brand or brands of cars and trucks. These dealers often have a used car department as well, along with a full-service department (which the manufacturer requires in order for the dealer to perform warranty and recall service), parts department, and F&I office. As it relates to auto financing, franchise dealers typically enter into credit contracts that they sell to banks, finance companies, and credit unions within days of the transactions. Increasingly, franchise dealers are operating affiliated, but separate, Buy Here Pay Here dealerships.
Independent Dealers
Independent dealers are not affiliated with individual manufacturers, and thus are limited to selling used cars. Some larger independent dealers have service departments. Financing at independent dealers usually operates similarly to that at franchise dealers, although there are some dealers that are a hybrid of used-car dealer and Buy Here Pay Here dealer.
Buy Here Pay Here Dealerships
Buy Here Pay Here (BHPH) dealerships specialize in selling older, high-mileage cars to customers with weak or no credit standing. BHPH dealers don’t typically sell their credit contracts, but rather retain them either in-house or in an affiliated finance company. BHPH transactions typically last less than two years, and the repossession rate is high—25 to 30% of BHPH deals end in repossession. 82% of BHPH customers have subprime credit scores (Zabritski, 2012c).2
This sector of the industry has seen an increase in market share due to declining credit scores and restricted access to credit. However, the financing is expensive, particularly considering that BHPH dealer vehicles typically are older, high-mileage cars with substantial retail markups. Most BHPH dealers do business as small independent operations. However, some larger chains, such as JD Byrider and DriveTime, have a multi-state presence.
2 The used-car buyer at a BHPH dealer has an average 543 credit score, compared to 668 for used-car buyers overall.
Center for Responsible Lending 65
TypesofAutoFinancing
Direct Loans
In a “direct” auto loan, the consumer applies for a loan directly with a lender. Ideally, if the consumer receives preapproval for a loan before shopping for a car, the consumer can take it to their dealer and use it as a guide for what cars might be options price-wise, or, more likely, use it as a negotiating tool for dealer financing.
Dealers would rather handle financing for their customers. If the dealer controls the financing and has the ability to adjust the terms of that financing, then the dealer has more opportunity to sell and finance additional insurance or warranty products. As such, even if a consumer has financing in hand, the dealer will try to find a way to convince the consumer to opt for dealer financing, which increases the profit potential in the deal.
Indirect Loans
Auto financing through the dealer is commonly referred to as “indirect financing,” but is actually a credit transaction directly financed by the dealer. Auto dealers describe their role in the transaction as merely an arranger, but that depiction vastly understates the dealers’ role and responsibility. Unlike loan brokers in other contexts who are not considered creditors, the dealer is the creditor in virtually all car-lending transactions. While the dealer plans to sell the finance contract quickly after the deal is final, the dealer is party to the finance contract.
The dealer does not want to retain ownership of the retail installment sales contract and collect payments into the future. Dealers have to borrow money to pay for the cars they keep on their lot (known in the industry as “floorplan financing”). Since the dealer must pay back the floorplan lender when a car is sold, the vast majority of dealers elects to sell the retail installment sales contract to a third party, such as a finance company, bank, credit union, or other investor.
A borrower purchasing and financing a car through the dealership will first meet the salesperson. The salesperson is the dealership employee who negotiates with the consumer on the price of the car and optional equipment on the car, along with the value of any vehicle to be traded in. Then, the consumer is sent to the F&I office (which can also be referred to as the business office) to complete the paperwork, negotiate the terms of the financing and discuss any additional insurance and protection products.
To facilitate the process, the salesperson will often collect the information needed to determine financing terms before the consumer actually talks to the F&I office. While the consumer is negoti-ating with the salesperson, the F&I employee communicates with lenders who may be interested in buying the loan. When a consumer applies for credit with the dealer, the dealer sends the consumer’s financial information to one or several potential lenders. Interested lenders then respond to the dealer with offers to purchase that contract, specifying the minimum interest rate and the specific conditions and terms that the lender will require to purchase the loan.
As mentioned earlier, there are many different elements involved in a car purchase transaction, and most of them are presented in the F&I office after the consumer has already been through a lengthy sales process. The length of the loan, the amount of the down payment, whether to include add-on products and the cost of those products, along with the interest rate, are all subject to negotiation.
The State of Lending in America and its Impact on U.S. Households66
A common mantra for F&I managers is that all customers should be presented with every product for which they qualify (Eleazer, 2011). What that means for the consumer is that the F&I representa-tive will likely present the consumer with dozens of insurance, extended warranty, and “protection” products, about most of which the consumer is uninformed. For instance, an extended warranty alone has pages of disclosures detailing which components of the car are covered and under what circum-stances, along with different deductible levels and length of coverage. A consumer is pressured to decide whether the product is worthwhile in a matter of minutes and what options to take, and then is presented with several other products for consideration.
This magnifies the impact of the consumer’s level of financial savvy on the cost of the overall transac-tion. Data show that customers acquiring financing outside the dealership are more likely to negotiate the price of a new car and the value of the trade-in vehicle.3 Consumers without the ability to negoti-ate, especially subprime customers with few, if any, other financing options, often are at the mercy of the dealer (Apgar & Calder, 2005). We found that consumers who indicated that they trusted their dealer gave them the best rate available paid between 1.9 and 2.1 percentage points more in APR, after controlling for credit risk, than those with a more skeptical outlook (Davis & Frank, 2009).
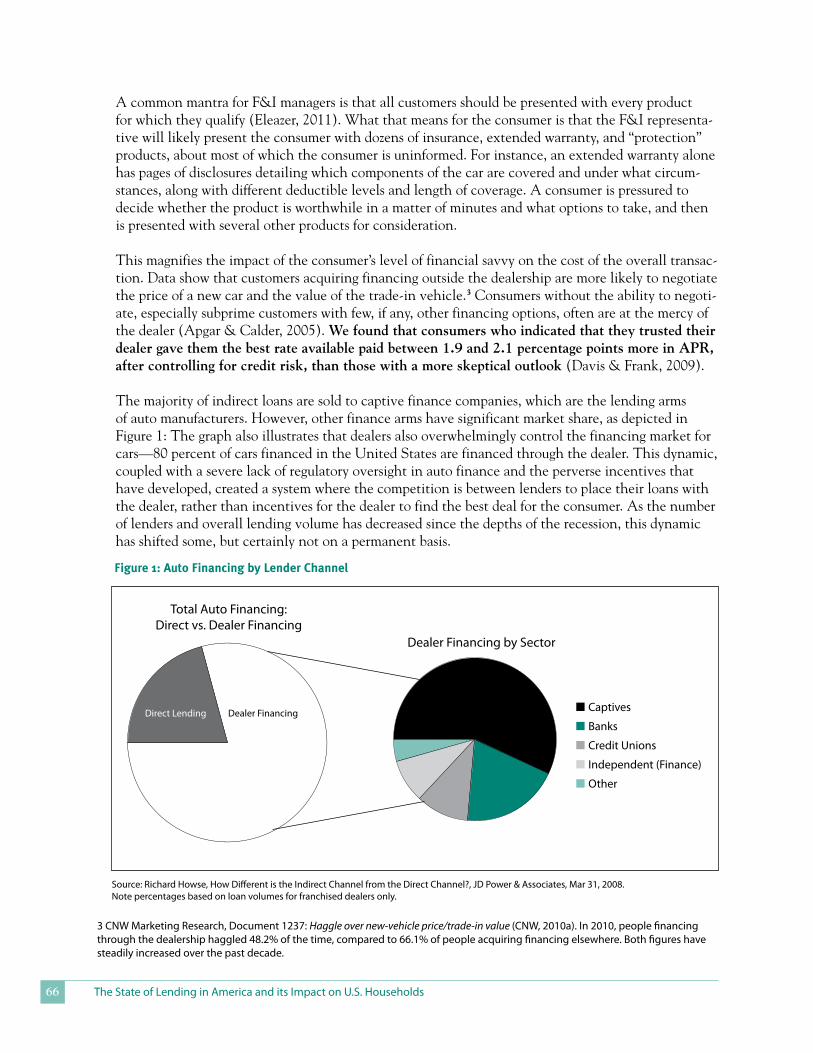
The majority of indirect loans are sold to captive finance companies, which are the lending arms of auto manufacturers. However, other finance arms have significant market share, as depicted in Figure 1: The graph also illustrates that dealers also overwhelmingly control the financing market for cars—80 percent of cars financed in the United States are financed through the dealer. This dynamic, coupled with a severe lack of regulatory oversight in auto finance and the perverse incentives that have developed, created a system where the competition is between lenders to place their loans with the dealer, rather than incentives for the dealer to find the best deal for the consumer. As the number of lenders and overall lending volume has decreased since the depths of the recession, this dynamic has shifted some, but certainly not on a permanent basis.
Figure1:AutoFinancingbyLenderChannel
3 CNW Marketing Research, Document 1237: Haggle over new-vehicle price/trade-in value (CNW, 2010a). In 2010, people financing through the dealership haggled 48.2% of the time, compared to 66.1% of people acquiring financing elsewhere. Both figures have steadily increased over the past decade.
Source: Richard Howse, How Different is the Indirect Channel from the Direct Channel?, JD Power & Associates, Mar 31, 2008. Note percentages based on loan volumes for franchised dealers only.
Direct Lending Dealer Financing n Captives
n Banks
n Credit Unions
n Independent (Finance)
n Other
Total Auto Financing: Direct vs. Dealer Financing
Dealer Financing by Sector
Center for Responsible Lending 67
Buy Here Pay Here Dealerships
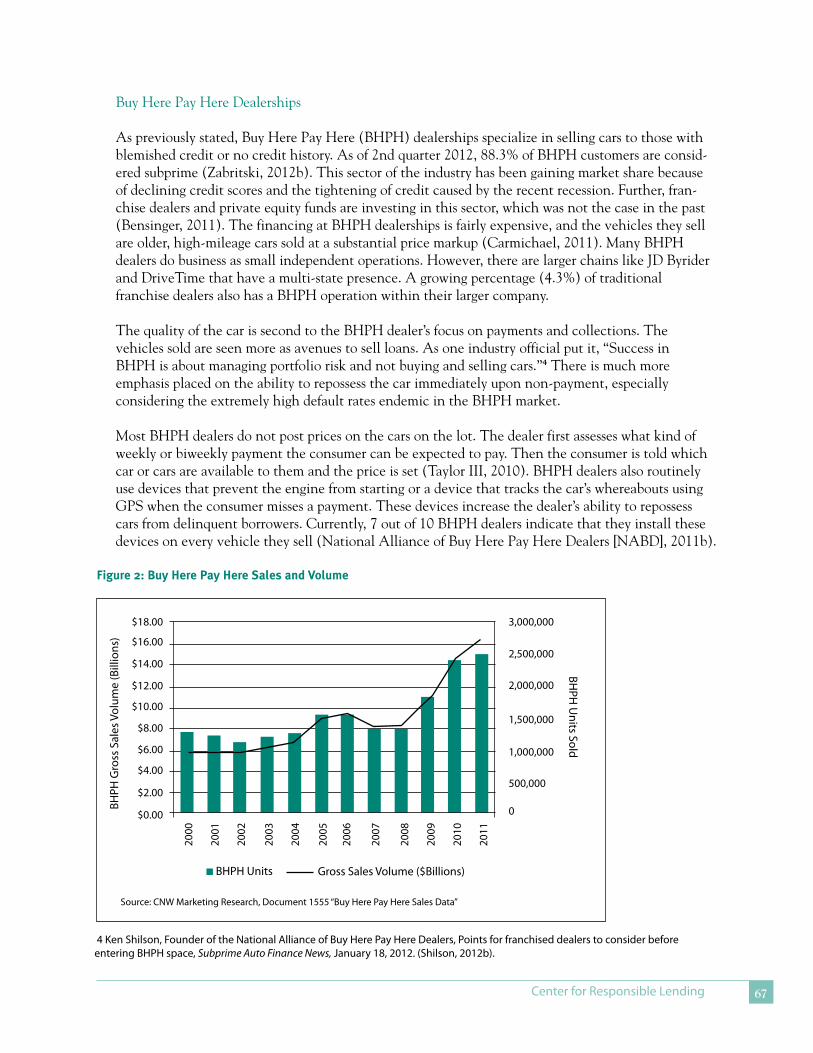
As previously stated, Buy Here Pay Here (BHPH) dealerships specialize in selling cars to those with blemished credit or no credit history. As of 2nd quarter 2012, 88.3% of BHPH customers are consid-ered subprime (Zabritski, 2012b). This sector of the industry has been gaining market share because of declining credit scores and the tightening of credit caused by the recent recession. Further, fran-chise dealers and private equity funds are investing in this sector, which was not the case in the past (Bensinger, 2011). The financing at BHPH dealerships is fairly expensive, and the vehicles they sell are older, high-mileage cars sold at a substantial price markup (Carmichael, 2011). Many BHPH dealers do business as small independent operations. However, there are larger chains like JD Byrider and DriveTime that have a multi-state presence. A growing percentage (4.3%) of traditional franchise dealers also has a BHPH operation within their larger company.
The quality of the car is second to the BHPH dealer’s focus on payments and collections. The vehicles sold are seen more as avenues to sell loans. As one industry official put it, “Success in BHPH is about managing portfolio risk and not buying and selling cars.”4 There is much more emphasis placed on the ability to repossess the car immediately upon non-payment, especially considering the extremely high default rates endemic in the BHPH market.
Most BHPH dealers do not post prices on the cars on the lot. The dealer first assesses what kind of weekly or biweekly payment the consumer can be expected to pay. Then the consumer is told which car or cars are available to them and the price is set (Taylor III, 2010). BHPH dealers also routinely use devices that prevent the engine from starting or a device that tracks the car’s whereabouts using GPS when the consumer misses a payment. These devices increase the dealer’s ability to repossess cars from delinquent borrowers. Currently, 7 out of 10 BHPH dealers indicate that they install these devices on every vehicle they sell (National Alliance of Buy Here Pay Here Dealers [NABD], 2011b).
Figure2:BuyHerePayHereSalesandVolume
$18.00 3,000,000
$16.002,500,000
$14.00
2,000,000$12.00
1,500,000$10.00
1,000,000
500,000
$8.00
0
$6.00
$4.00
$2.00
$0.00
2000
2001
2002
2003
2004
2005
2006
2007
2008
2009
2010
2011
n BHPH Units
BHPH
Gro
ss S
ales
Vol
ume
(Bill
ions
)
Gross Sales Volume ($Billions)
Source: CNW Marketing Research, Document 1555 “Buy Here Pay Here Sales Data”
BHPH
Units Sold
4 Ken Shilson, Founder of the National Alliance of Buy Here Pay Here Dealers, Points for franchised dealers to consider before entering BHPH space, Subprime Auto Finance News, January 18, 2012. (Shilson, 2012b).
The State of Lending in America and its Impact on U.S. Households68
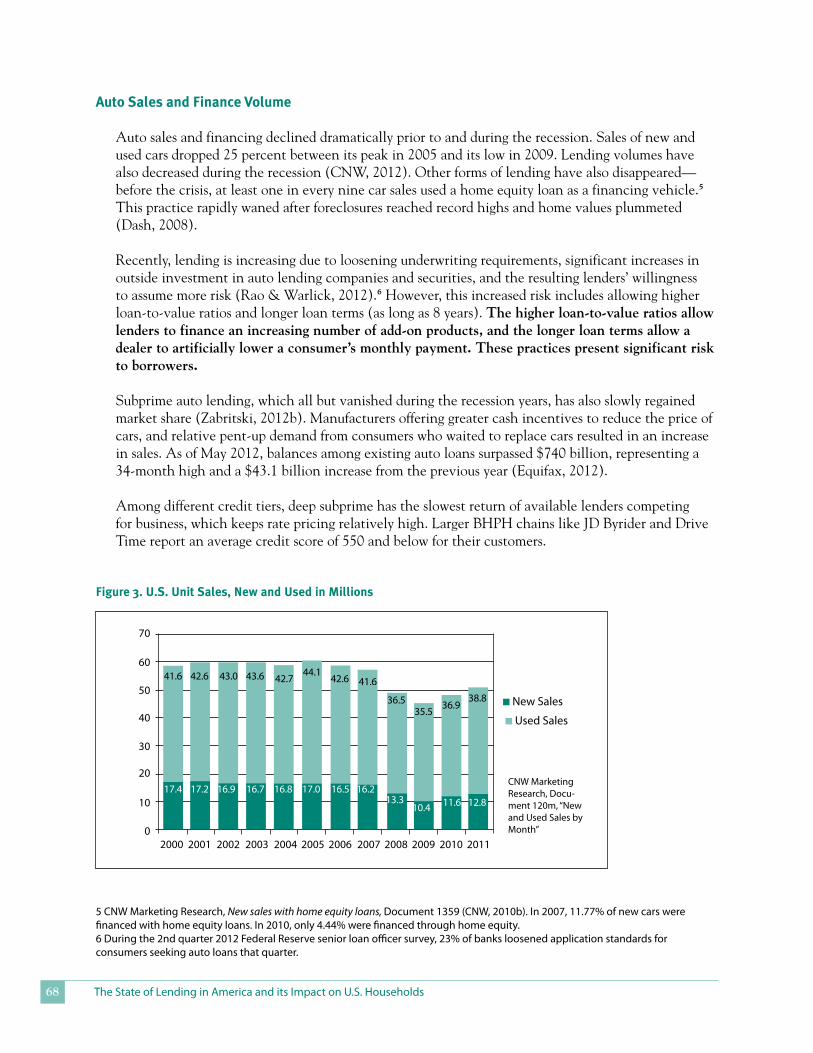
AutoSalesandFinanceVolume
Auto sales and financing declined dramatically prior to and during the recession. Sales of new and used cars dropped 25 percent between its peak in 2005 and its low in 2009. Lending volumes have also decreased during the recession (CNW, 2012). Other forms of lending have also disappeared— before the crisis, at least one in every nine car sales used a home equity loan as a financing vehicle.5 This practice rapidly waned after foreclosures reached record highs and home values plummeted (Dash, 2008).
Recently, lending is increasing due to loosening underwriting requirements, significant increases in outside investment in auto lending companies and securities, and the resulting lenders’ willingness to assume more risk (Rao & Warlick, 2012).6 However, this increased risk includes allowing higher loan-to-value ratios and longer loan terms (as long as 8 years). the higher loan-to-value ratios allow lenders to finance an increasing number of add-on products, and the longer loan terms allow a dealer to artificially lower a consumer’s monthly payment. these practices present significant risk to borrowers.
Subprime auto lending, which all but vanished during the recession years, has also slowly regained market share (Zabritski, 2012b). Manufacturers offering greater cash incentives to reduce the price of cars, and relative pent-up demand from consumers who waited to replace cars resulted in an increase in sales. As of May 2012, balances among existing auto loans surpassed $740 billion, representing a 34-month high and a $43.1 billion increase from the previous year (Equifax, 2012).
Among different credit tiers, deep subprime has the slowest return of available lenders competing for business, which keeps rate pricing relatively high. Larger BHPH chains like JD Byrider and Drive Time report an average credit score of 550 and below for their customers.
n New Sales
n Used Sales
Figure3.U.S.UnitSales,NewandUsedinMillions
CNW Marketing Research, Docu-ment 120m, “New and Used Sales by Month”
70
60
50
40
30
20
10
02000
41.6
17.4 17.2 16.9 16.7 16.8 17.0 16.5 16.2
10.4 11.6 12.8
42.6 43.0 43.6 42.744.1
42.6 41.6
36.535.5
36.9
2001 2002 2003 2004 2005 2006 2007 2008 2009 2010 2011
13.3
38.8
5 CNW Marketing Research, New sales with home equity loans, Document 1359 (CNW, 2010b). In 2007, 11.77% of new cars were financed with home equity loans. In 2010, only 4.44% were financed through home equity.6 During the 2nd quarter 2012 Federal Reserve senior loan officer survey, 23% of banks loosened application standards for consumers seeking auto loans that quarter.
Center for Responsible Lending 69
2011
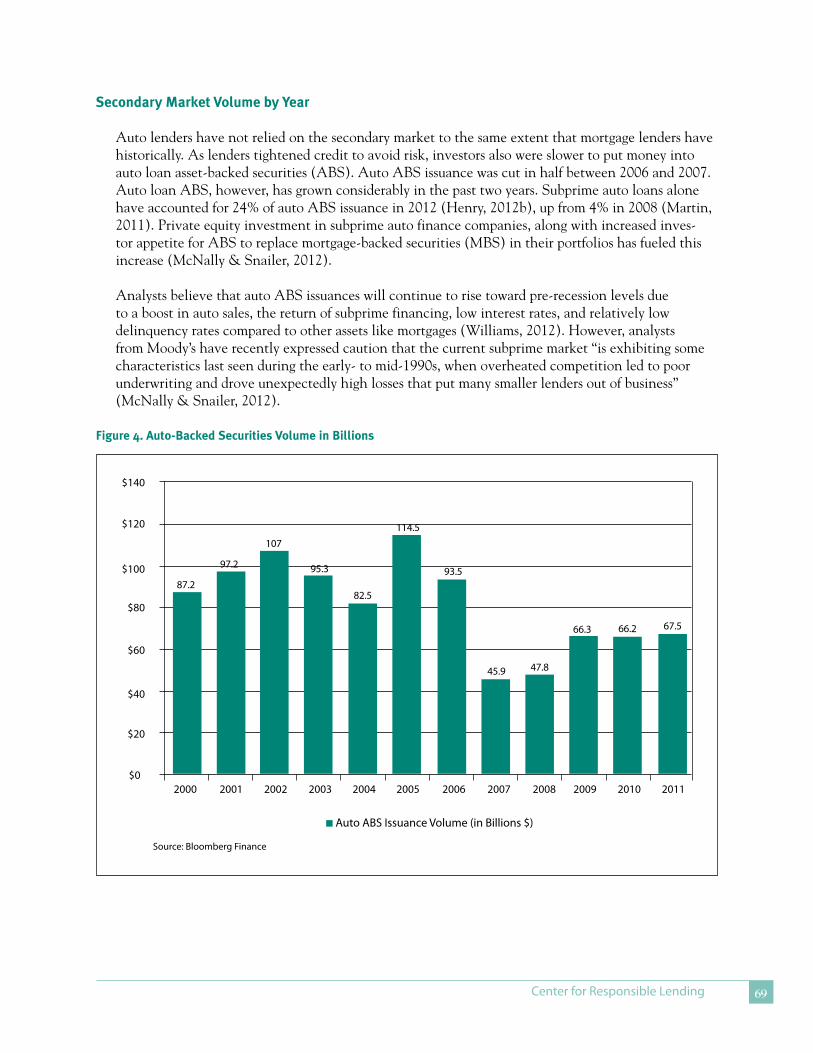
SecondaryMarketVolumebyYear
Auto lenders have not relied on the secondary market to the same extent that mortgage lenders have historically. As lenders tightened credit to avoid risk, investors also were slower to put money into auto loan asset-backed securities (ABS). Auto ABS issuance was cut in half between 2006 and 2007. Auto loan ABS, however, has grown considerably in the past two years. Subprime auto loans alone have accounted for 24% of auto ABS issuance in 2012 (Henry, 2012b), up from 4% in 2008 (Martin, 2011). Private equity investment in subprime auto finance companies, along with increased inves-tor appetite for ABS to replace mortgage-backed securities (MBS) in their portfolios has fueled this increase (McNally & Snailer, 2012).
Analysts believe that auto ABS issuances will continue to rise toward pre-recession levels due to a boost in auto sales, the return of subprime financing, low interest rates, and relatively low delinquency rates compared to other assets like mortgages (Williams, 2012). However, analysts from Moody’s have recently expressed caution that the current subprime market “is exhibiting some characteristics last seen during the early- to mid-1990s, when overheated competition led to poor underwriting and drove unexpectedly high losses that put many smaller lenders out of business” (McNally & Snailer, 2012).
$140
$120
$100
$80
$60
$40
$20
$0
n Auto ABS Issuance Volume (in Billions $)
Source: Bloomberg Finance
87.2
97.2
107
95.3
82.5
114.5
93.5
45.9 47.8
66.3 66.2 67.5
Figure4.Auto-BackedSecuritiesVolumeinBillions
2000 2001 2002 2003 2004 2005 2006 2007 2008 2009 2010
The State of Lending in America and its Impact on U.S. Households70
70.0%
60.0%
50.0%
40.0%
30.0%
20.0%
10.0%
0.0%
Perc
enta
ge o
f Dea
lers
hips
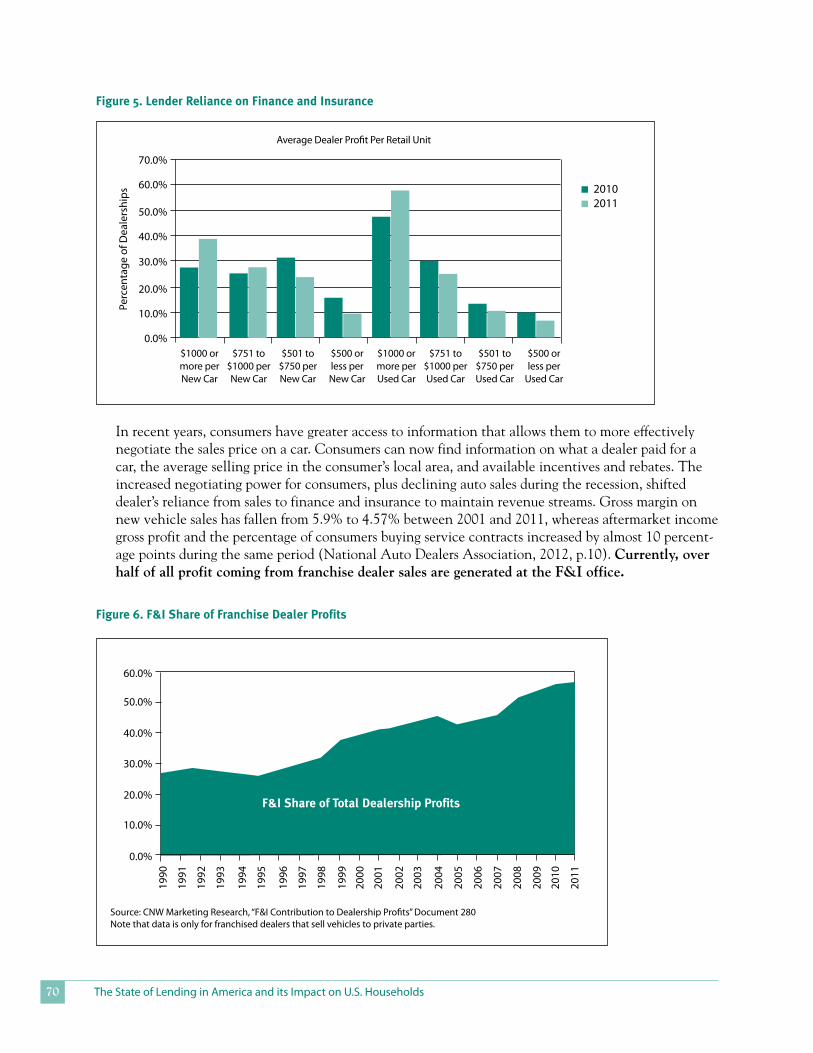
Average Dealer Profit Per Retail Unit
Figure5.LenderRelianceonFinanceandInsurance
$1000 or more per New Car
$751 to $1000 per New Car
$501 to $750 per New Car
$500 or less per New Car
$1000 or more per Used Car
$751 to $1000 per Used Car
$501 to $750 per Used Car
$500 or less per
Used Car
In recent years, consumers have greater access to information that allows them to more effectively negotiate the sales price on a car. Consumers can now find information on what a dealer paid for a car, the average selling price in the consumer’s local area, and available incentives and rebates. The increased negotiating power for consumers, plus declining auto sales during the recession, shifted dealer’s reliance from sales to finance and insurance to maintain revenue streams. Gross margin on new vehicle sales has fallen from 5.9% to 4.57% between 2001 and 2011, whereas aftermarket income gross profit and the percentage of consumers buying service contracts increased by almost 10 percent-age points during the same period (National Auto Dealers Association, 2012, p.10). Currently, over half of all profit coming from franchise dealer sales are generated at the F&I office.
60.0%
50.0%
40.0%
30.0%
20.0%
10.0%
0.0%
1990
1991
1992
1993
1994
1995
1996
1997
1998
1999
2000
2001
2002
2003
2004
2005
2006
2007
2008
2009
2010
2011
Source: CNW Marketing Research, “F&I Contribution to Dealership Profits” Document 280Note that data is only for franchised dealers that sell vehicles to private parties.
Figure6.F&IShareofFranchiseDealerProfits
F&IShareofTotalDealershipProfits
n 2010n 2011
Center for Responsible Lending 71
lendIng Abuse And predAtory prActIces
Nearly eighty percent of financed auto sales are financed through the dealer, which effectively gives dealers control over lenders’ access to this market (Howse, 2008). The decline in sales over the past five years, coupled with decreasing profit margins on the sale of the cars themselves creates increased pressure on dealers to make up revenue through selling financing and add-on products.
DealerRateMarkups
In indirect loans, the interest rate that the lender interested in purchasing the loan is willing to accept is called the “buy rate.” Lenders also typically allow the dealer to increase the interest rate and keep some or all of the difference between the buy rate and the rate ultimately offered to the consumer. This practice is referred to as “dealer reserve” or “dealer participation.” Some lenders offer a flat fee for compensation, particularly in zero-percent incentive promotions. Some lenders cap the amount of dealer interest rate markup, while others allow unlimited markups.
The dealer’s ability to mark up the interest rate for its own gain creates a perverse incentive for the dealer to push the consumer into the most favorable loan for the dealer, rather than one that provides the lowest cost for the consumer. The dealer’s incentive to create profit through higher interest rates creates an environment of “reverse competition” where lenders are competing for the business of the dealer, not the consumer. It also tilts the playing field against certain lenders (such as credit unions and smaller community banks) that are not willing or able to be aggressive in providing dealer discre-tion on interest rates. Lenders must compete for a dealer’s business by offering larger interest rate kickbacks and incentives, or be willing to be more flexible on underwriting to approve deals faster.
nationwide, consumers who purchased cars in 2009 paid $25.8 billion in additional interest due to the dealer’s markup of the rate. The average rate markup was 1.01 and 2.91 percentage points for new and used cars, respectively. Data also show that rate markups are significantly corre-lated with subprime lenders and with higher odds of default and repossession (Davis & Frank, 2011). For example, borrowers with a loan from a subprime finance company that includes an interest rate markup are 33% more likely to lose their cars to repossession. And, consumers are largely unaware of this practice, as 79% of consumers surveyed in North Carolina were not aware dealers could mark up rates without their consent.7
Yo-YoScams
The yo-yo scam occurs when a consumer is led to believe that their financing arrangement is final or as good as final. The yo-yo scam occurs when, days, weeks, or months later, the dealer asserts the ability to cancel the deal because the dealer decides that none of the offers from lenders to purchase the finance contract are acceptable. Yo-yo scams are possible because of the pervasive “spot delivery” practice where dealers allow consumers to take possession of the car even when the financing is not final. Then, if the dealer cannot meet the lender’s terms to purchase the loan, or if the dealer decides that the offer to purchase the loan is insufficient, the dealer asserts the ability to cancel the deal and force the consumer to sign a new loan contract.
7 Public Policy Polling survey administered January 15-18, 2010. Findings state that 79% of 494 surveyed respondents, all located in two North Carolina counties, were not aware that dealers have the ability to mark up interest rates.
The State of Lending in America and its Impact on U.S. Households72
Frequently, the dealer states that “the lender” has changed its mind and will not finance at the rate or with other terms promised. What has really happened is the dealer has chosen to ignore that it is the creditor and that there is a signed contract with the consumer. Instead, the dealer is shifting the risk of a bad deal completely on the consumer, even though the dealer is in the best position to know whether the risk is too great to allow the consumer to leave the lot with the car.
When the dealer asserts the ability to unilaterally cancel the transaction, this allows the dealer to engage in riskier or deceptive behavior. For instance, the dealer can offer an interest rate that the dealer knows it may not be willing or able to actually provide without the risk of suffering a signifi-cant penalty. Instead, the dealer forces the consumer to either agree to a different interest rate or loan terms or return the car to the dealer.
Further, this practice reduces competition and violates the spirit of the Truth in Lending Act (TILA). TILA requires that lenders provide borrowers with the terms of a credit offer so that the borrower may shop effectively between lenders. When a dealer promises a certain interest rate, the consumer relies on that interest rate when deciding whether to shop for additional credit offers. As an industry insider stated recently, “Many stores spot-deliver vehicles based on credit scores and deal structure for the sake of time. The goal is to take the customer out of the market as soon as possible to seal the deal, so the customer is asked to sign an immediate delivery agreement form outlining the deal. We can always re-contract if needed, right?” (Eleazer, 2012)
The dealer may also refuse to return the consumer’s trade-in or down payment, which increases leverage against the consumer. The dealer may also threaten to charge the consumer fees for use, wear and tear, or other items on the new car purchase. In some cases, the dealer may threaten the consumer with prosecution for auto theft if the consumer does not immediately return the car to the dealer. Under this significant pressure, many consumers agree to the new terms.
Research has shown that low-income (Davis & Frank, 2009) and poor-credit (Davis, 2012) borrowers are much more subject to yo-yo sales. Consumers involved in yo-yo scams receive interest rates 5 percentage points higher than those that are not. Those caught in a yo-yo have a difficult time reclaiming their down payment or trade-in, and end up settling for a more expensive deal than the original one they agreed to (Davis, 2012).
LoanPacking
Outside of the sale of the car itself, F&I staff routinely market a litany of add-on products. Products such as vehicle service contracts, GAP insurance (insurance that covers the period when the car is worth less than the amount owed under the loan), credit life and disability insurance, theft deterrent systems, and vehicle upgrades and accessories are often sold bundled as packages advertised in terms of their impact on the monthly payment rather than the overall cost of the car. Marketing add-on products based on their monthly payment versus its overall cost makes expensive products seem less so and are effective in drawing the consumer's attention away from the total cost of the deal. In addition, the prices of add-on products are significantly marked up from their wholesale cost. According to several franchise executives, add-on product sales are more popular revenue streams since the profit margins on car sales are declining and interest rate markups are under higher regulatory scrutiny (Henry, 2012a).
Center for Responsible Lending 73
Service contracts, typically the most commonly sold product, can be marked up at by at least 100% or more,8 and cost consumers on average $1,790 per sale (Ly, 2009). Third-party lenders may develop their own add-on products, and create incentives for dealers to pack them into financing. For instance, some lenders will allow a higher loan-to-value ratio if the loan includes that lender’s GAP insurance, but will limit the loan-to-value ratio if another vendor’s GAP insurance is sold. In more egregious cases, the purchase of some add-on products is falsely represented as required by the lender in order for the loan to be approved.
The average penetration rate during the first three quarters of 2011 was 46% for vehicle service contracts and 34.9% for GAP insurance. Both are increases from the same period in 2010, where the rates were 35% and 32%, respectively (Arroyo, 2012). African-Americans and low-income buyers disproportionately receive overpriced add-on products (Davis & Frank, 2009).
Rolling Negative Equity
“Underwater” consumers owing more on their car than what it is worth are often tempted to roll in their current car’s unpaid loan or lease balance into the financing of a new car. Currently, 28.9% of consumers are underwater in their vehicles, and have on average $4,250 of negative equity in their trade-in (Apicella & Halloran, 2008), putting them in a weaker negotiating position with the dealer. A dealer may promise to pay off the trade-in vehicle’s loan while only rolling that balance into the new car loan (Howard, 2008). Just recently, the FTC took enforcement action against four dealer-ships falsely advertising they would pay off negative equity from a trade-in toward a new car purchase, while actually rolling it into the new car payment (Federal Trade Commission, 2012).
Dealers have several methods to roll negative equity into the financing of a new deal while still keeping monthly payments manageable, including increasing the length of the loan term, or using a manufacturer's rebate to mask the negative equity. Prior study has found that consumers tend to be “myopic” with their car purchases, preferring loans with lower monthly payments even if it means higher total costs (Dasgupta, Siddarth, & Silva-Risso, 2007). As a result, in March 2012, 30.1% of retail sales included loan terms of at least 72 months, up from 24.6% at the same time in 2011, which increases the likelihood of owing more on the loan than the car’s value is worth (Overby, 2012).
BuyHerePayHereDealerships
Buy Here Pay Here dealerships cater to the subprime borrower that cannot secure financing from traditional lending sources. Traditionally, BHPH dealers make, hold and service all of the loans they finance in-house, and require their customers to pay in-person at the dealership. BHPH deal-ers typically sell older used cars with APRs around 25%. The cars themselves may be sold at a sales price nearly double what the dealer paid for it wholesale (NABD, 2011a). The dealer usually requires a large down-payment from the consumer and a weekly payment. The dealer’s initial investment in the car is recouped within the first year. However, BHPH dealers are known for quick repossessions to recover their collateral at the first sign of delinquency. As one BHPH advisor put it, “collections is the single most important process with the most direct effect and instant impact on whether you are successful or not as a BHPH dealer” (Heasley, 2012). Market data shows that 1 in every 5 BHPH car loans will default, and over 50% of all BHPH loans do not pay out to maturity (Shilson, 2012a).
8 Quote by Phil Reed, editor at Edmunds.com. Interview by Lucy Lazarony, Beware of the extended warranty add-on, Bankrate.com, January 11, 2005 (Lazarony, 2005).
The State of Lending in America and its Impact on U.S. Households74
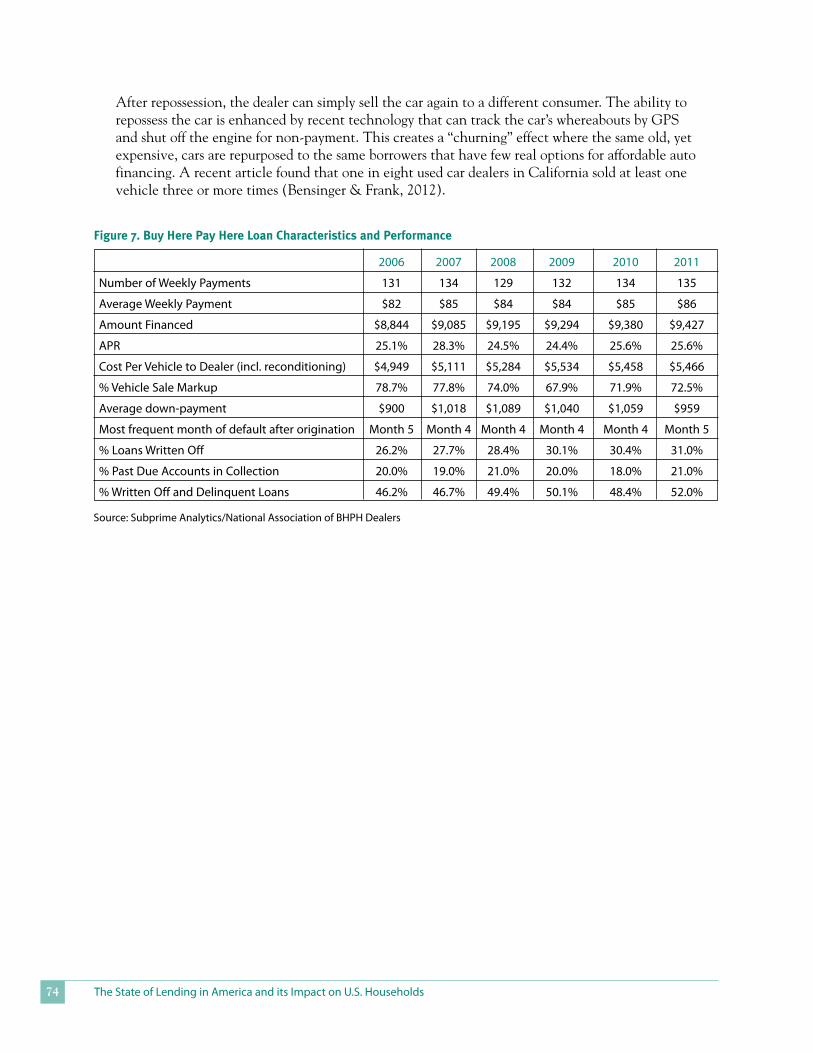
After repossession, the dealer can simply sell the car again to a different consumer. The ability to repossess the car is enhanced by recent technology that can track the car’s whereabouts by GPS and shut off the engine for non-payment. This creates a “churning” effect where the same old, yet expensive, cars are repurposed to the same borrowers that have few real options for affordable auto financing. A recent article found that one in eight used car dealers in California sold at least one vehicle three or more times (Bensinger & Frank, 2012).
2006 2007 2008 2009 2010 2011
Number of Weekly Payments 131 134 129 132 134 135
Average Weekly Payment $82 $85 $84 $84 $85 $86
Amount Financed $8,844 $9,085 $9,195 $9,294 $9,380 $9,427
APR 25.1% 28.3% 24.5% 24.4% 25.6% 25.6%
Cost Per Vehicle to Dealer (incl. reconditioning) $4,949 $5,111 $5,284 $5,534 $5,458 $5,466
% Vehicle Sale Markup 78.7% 77.8% 74.0% 67.9% 71.9% 72.5%
Average down-payment $900 $1,018 $1,089 $1,040 $1,059 $959
Most frequent month of default after origination Month 5 Month 4 Month 4 Month 4 Month 4 Month 5
% Loans Written Off 26.2% 27.7% 28.4% 30.1% 30.4% 31.0%
% Past Due Accounts in Collection 20.0% 19.0% 21.0% 20.0% 18.0% 21.0%
% Written Off and Delinquent Loans 46.2% 46.7% 49.4% 50.1% 48.4% 52.0%
Figure7.BuyHerePayHereLoanCharacteristicsandPerformance
Source: Subprime Analytics/National Association of BHPH Dealers
Center for Responsible Lending 75
IMpAct on us households And reMAInIng chAllenges
CostofAbusivePractices
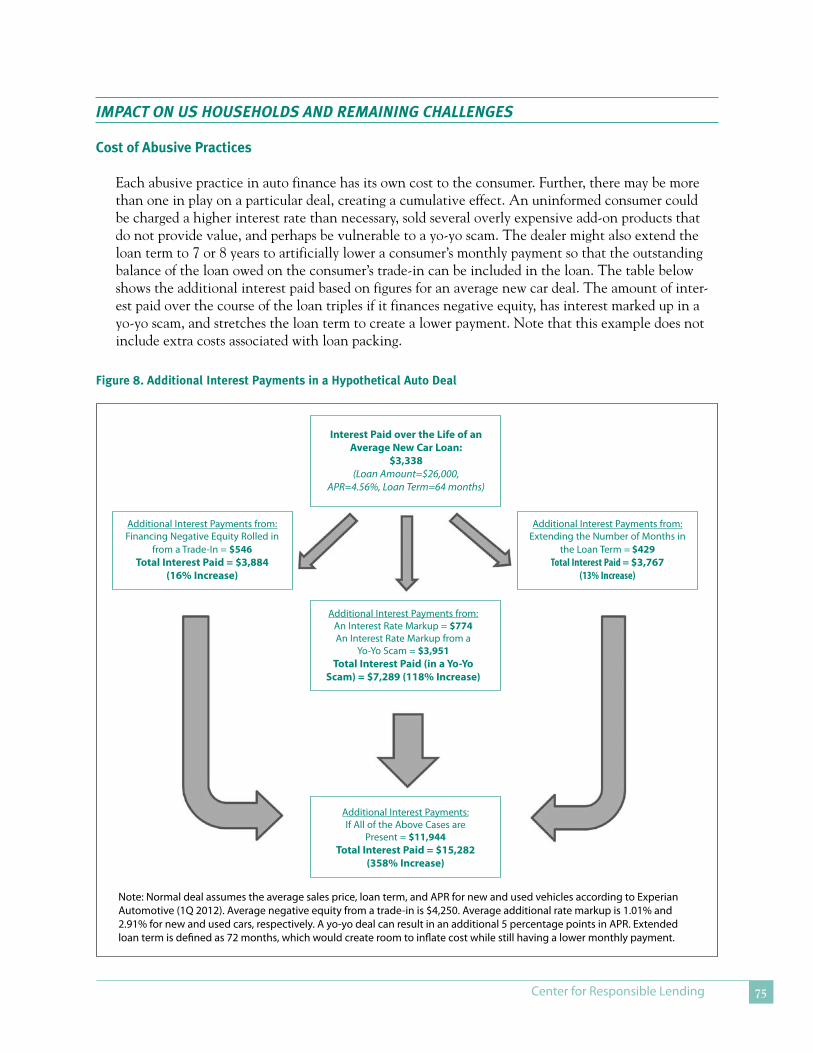
Each abusive practice in auto finance has its own cost to the consumer. Further, there may be more than one in play on a particular deal, creating a cumulative effect. An uninformed consumer could be charged a higher interest rate than necessary, sold several overly expensive add-on products that do not provide value, and perhaps be vulnerable to a yo-yo scam. The dealer might also extend the loan term to 7 or 8 years to artificially lower a consumer’s monthly payment so that the outstanding balance of the loan owed on the consumer’s trade-in can be included in the loan. The table below shows the additional interest paid based on figures for an average new car deal. The amount of inter-est paid over the course of the loan triples if it finances negative equity, has interest marked up in a yo-yo scam, and stretches the loan term to create a lower payment. Note that this example does not include extra costs associated with loan packing.
Interest Paid over the Life of an Average New Car Loan:
$3,338(Loan Amount=$26,000,
APR=4.56%, Loan Term=64 months)
Additional Interest Payments from:Financing Negative Equity Rolled in
from a Trade-In = $546Total Interest Paid = $3,884
(16% Increase)
Additional Interest Payments from:Extending the Number of Months in
the Loan Term = $429Total Interest Paid = $3,767
(13% Increase)
Additional Interest Payments from:An Interest Rate Markup = $774An Interest Rate Markup from a
Yo-Yo Scam = $3,951Total Interest Paid (in a Yo-Yo
Scam) = $7,289 (118% Increase)
Additional Interest Payments:If All of the Above Cases are
Present = $11,944Total Interest Paid = $15,282
(358% Increase)
Figure8.AdditionalInterestPaymentsinaHypotheticalAutoDeal
Note: Normal deal assumes the average sales price, loan term, and APR for new and used vehicles according to Experian Automotive (1Q 2012). Average negative equity from a trade-in is $4,250. Average additional rate markup is 1.01% and 2.91% for new and used cars, respectively. A yo-yo deal can result in an additional 5 percentage points in APR. Extended loan term is defined as 72 months, which would create room to inflate cost while still having a lower monthly payment.
The State of Lending in America and its Impact on U.S. Households76
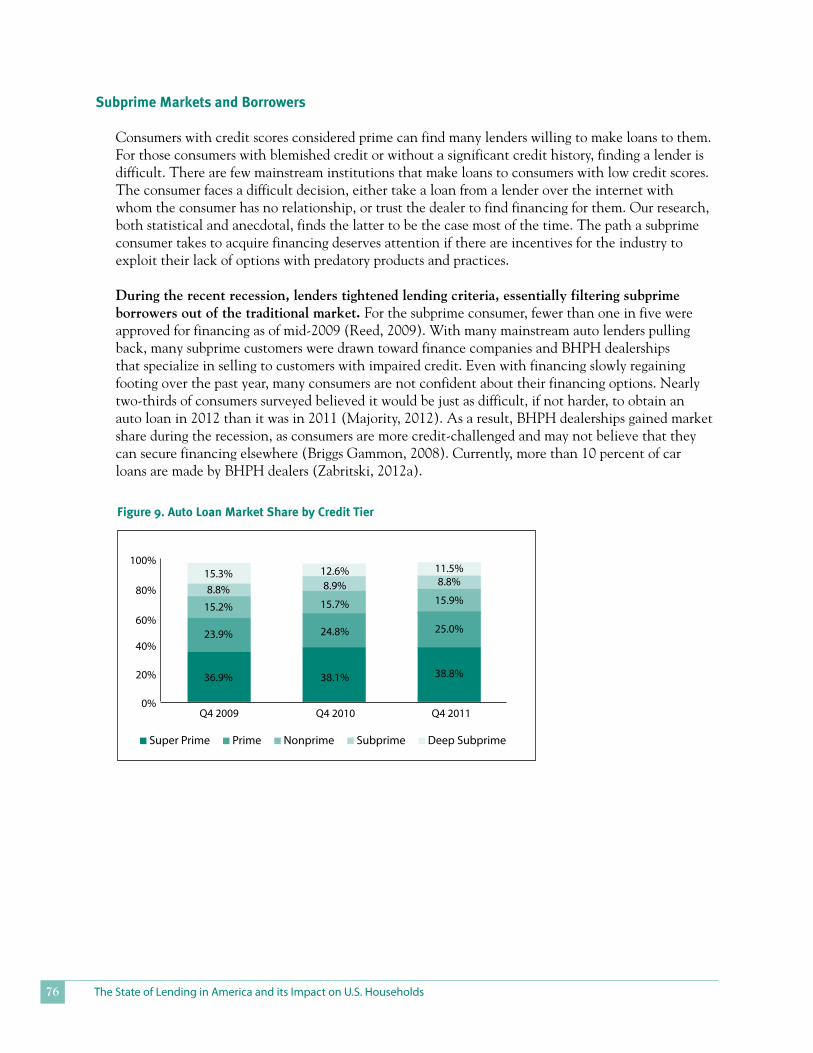
SubprimeMarketsandBorrowers
Consumers with credit scores considered prime can find many lenders willing to make loans to them. For those consumers with blemished credit or without a significant credit history, finding a lender is difficult. There are few mainstream institutions that make loans to consumers with low credit scores. The consumer faces a difficult decision, either take a loan from a lender over the internet with whom the consumer has no relationship, or trust the dealer to find financing for them. Our research, both statistical and anecdotal, finds the latter to be the case most of the time. The path a subprime consumer takes to acquire financing deserves attention if there are incentives for the industry to exploit their lack of options with predatory products and practices.
During the recent recession, lenders tightened lending criteria, essentially filtering subprime borrowers out of the traditional market. For the subprime consumer, fewer than one in five were approved for financing as of mid-2009 (Reed, 2009). With many mainstream auto lenders pulling back, many subprime customers were drawn toward finance companies and BHPH dealerships that specialize in selling to customers with impaired credit. Even with financing slowly regaining footing over the past year, many consumers are not confident about their financing options. Nearly two-thirds of consumers surveyed believed it would be just as difficult, if not harder, to obtain an auto loan in 2012 than it was in 2011 (Majority, 2012). As a result, BHPH dealerships gained market share during the recession, as consumers are more credit-challenged and may not believe that they can secure financing elsewhere (Briggs Gammon, 2008). Currently, more than 10 percent of car loans are made by BHPH dealers (Zabritski, 2012a).
Figure9.AutoLoanMarketSharebyCreditTier
100%
80%
60%
40%
20%
0%Q4 2009 Q4 2010 Q4 2011
n Super Prime n Prime n Nonprime n Subprime n Deep Subprime
15.3%8.8%
15.2%
23.9%
36.9%
12.6%8.9%
15.7%
24.8%
38.1%
11.5%8.8%
15.9%
25.0%
38.8%
Center for Responsible Lending 77
DelinquencyandRepossessions
Like most installment debt, delinquency and repossession rates for auto loans had reached record highs during the recession. Since then, default rates have stabilized more for auto loans than for mortgages and credit cards. A recent study found that consumers are now more likely to pay their car payment before they pay their mortgage or credit card (Blumberg, 2012). However, delinquency rates for auto loans should be viewed very differently from mortgage delinquencies. Many consumers have placed a higher importance on their car for access to their community and employment. Addition-ally, the foreclosure process allows more time to work with servicers to retain a home than a car if the consumer becomes delinquent.
The auto repossession process is much faster than a home foreclosure process. Most lenders start the repossession process once the consumer is 60 or 90 days past due, and then take between five or six weeks to reclaim the car. In contrast, the foreclosure process can take more than a year on average. This means that delinquent mortgage loans stay on the books far longer, while delinquent auto loans are out of the portfolio fairly quickly. If the auto repossession process were more like the foreclosure process, the equivalent repossession rate would likely be much higher. As such, a skeptical view of the performance of auto loans compared to mortgage loans is warranted.
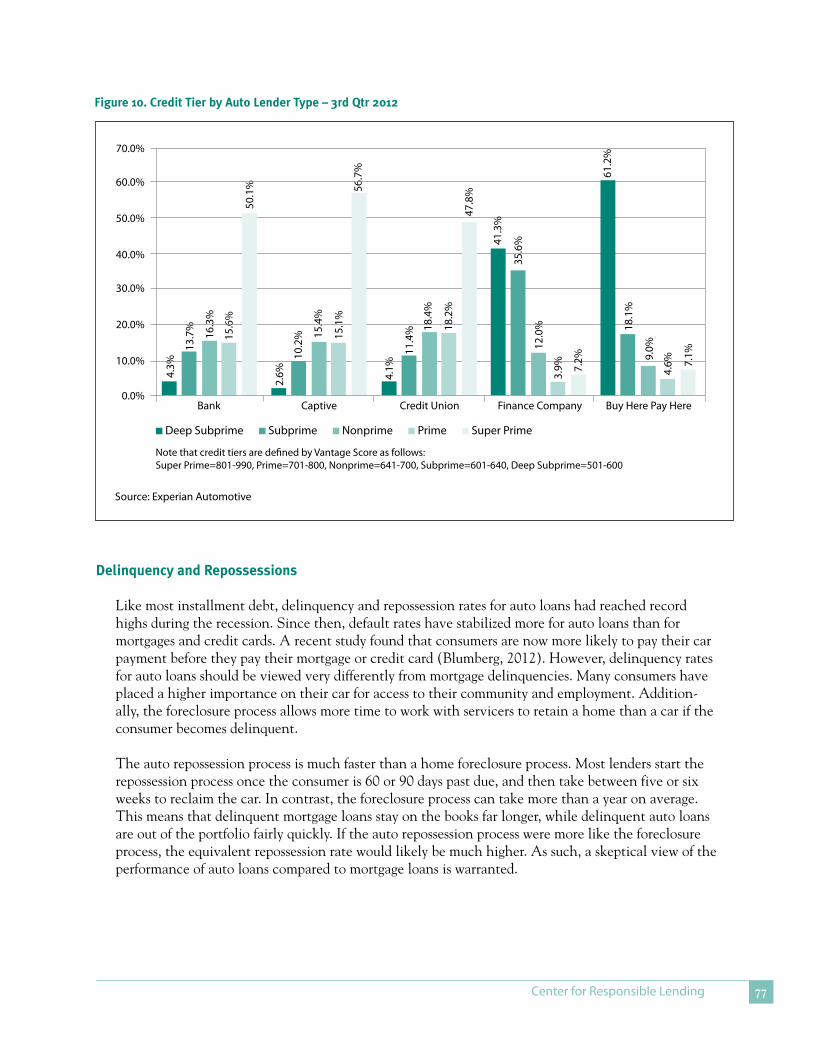
Figure10.CreditTierbyAutoLenderType–3rdQtr2012
n Deep Subprime n Subprime n Nonprime n Prime n Super Prime
Source: Experian Automotive
70.0%
4.3%
2.6% 4.
1%
13.7
%
10.2
%
11.4
%16.3
%
15.4
%
18.4
%
15.6
%
15.1
%
18.2
%
50.1
% 56.7
%
47.8
%
61.2
%
Bank Captive Credit Union Finance Company Buy Here Pay Here
60.0%
50.0%
40.0%
30.0%
20.0%
10.0%
0.0%
41.3
%
18.1
%
35.6
%
9.0%12
.0%
4.6%
3.9% 7.
1%
7.2%
Note that credit tiers are defined by Vantage Score as follows: Super Prime=801-990, Prime=701-800, Nonprime=641-700, Subprime=601-640, Deep Subprime=501-600
The State of Lending in America and its Impact on U.S. Households78
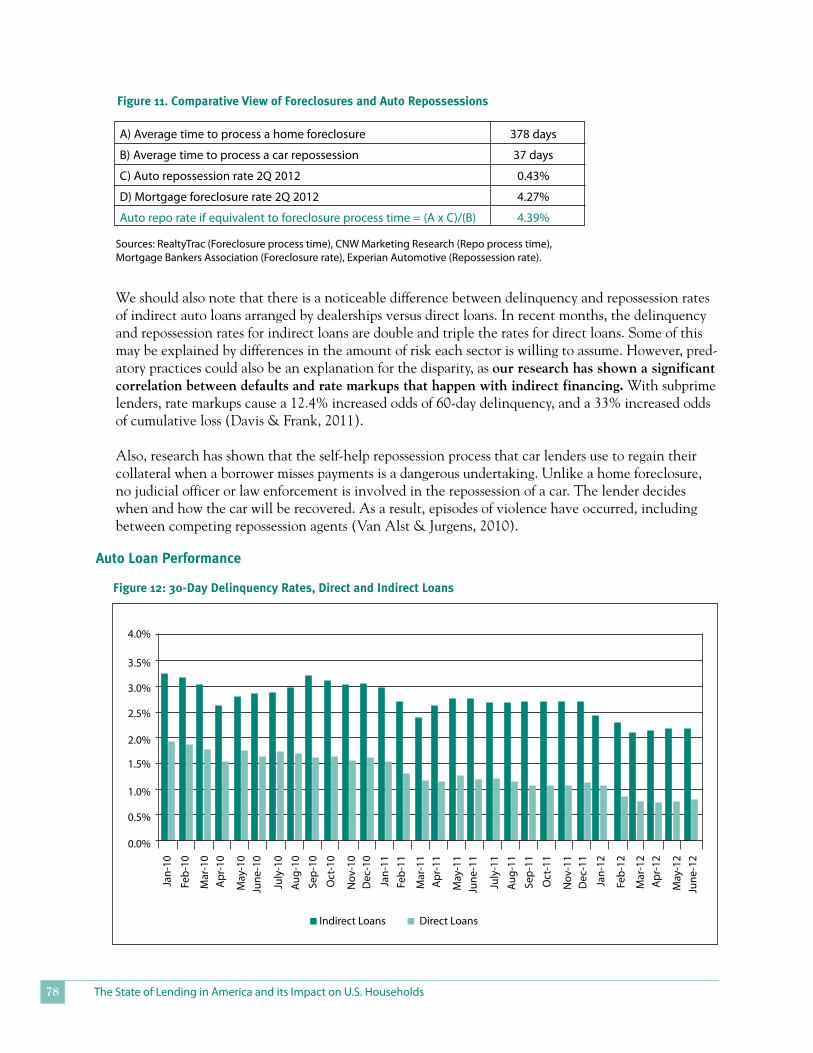
Figure11.ComparativeViewofForeclosuresandAutoRepossessions
A) Average time to process a home foreclosure 378 days
B) Average time to process a car repossession 37 days
C) Auto repossession rate 2Q 2012 0.43%
D) Mortgage foreclosure rate 2Q 2012 4.27%
Auto repo rate if equivalent to foreclosure process time = (A x C)/(B) 4.39%
Sources: RealtyTrac (Foreclosure process time), CNW Marketing Research (Repo process time), Mortgage Bankers Association (Foreclosure rate), Experian Automotive (Repossession rate).
We should also note that there is a noticeable difference between delinquency and repossession rates of indirect auto loans arranged by dealerships versus direct loans. In recent months, the delinquency and repossession rates for indirect loans are double and triple the rates for direct loans. Some of this may be explained by differences in the amount of risk each sector is willing to assume. However, pred-atory practices could also be an explanation for the disparity, as our research has shown a significant correlation between defaults and rate markups that happen with indirect financing. With subprime lenders, rate markups cause a 12.4% increased odds of 60-day delinquency, and a 33% increased odds of cumulative loss (Davis & Frank, 2011).
Also, research has shown that the self-help repossession process that car lenders use to regain their collateral when a borrower misses payments is a dangerous undertaking. Unlike a home foreclosure, no judicial officer or law enforcement is involved in the repossession of a car. The lender decides when and how the car will be recovered. As a result, episodes of violence have occurred, including between competing repossession agents (Van Alst & Jurgens, 2010).
Figure12:30-DayDelinquencyRates,DirectandIndirectLoans
AutoLoanPerformance
4.0%
Jan-
10
Feb-
10
Feb-
11
Feb-
12
Mar
-10
Mar
-11
Mar
-12
Apr
-10
Apr
-11
Apr
-12
May
-10
May
-11
May
-12
June
-10
June
-11
June
-12
July
-10
July
-11
Sep-
10
Sep-
11
Oct
-10
Oct
-11
Aug-
10
Aug-
11
Nov
-10
Nov
-11
Dec
-10
Dec
-11
Jan-
11
Jan-
12
3.5%
3.0%
2.5%
2.0%
1.5%
1.0%
0.5%
0.0%
n Indirect Loans n Direct Loans
Center for Responsible Lending 79
$2.0
$1.8
$1.6
$1.4
$1.2
$1.0
$0.8
$0.6
$0.4
$0.2
$0.0
Repo
sses
sion
s (m
illio
ns o
f uni
ts)
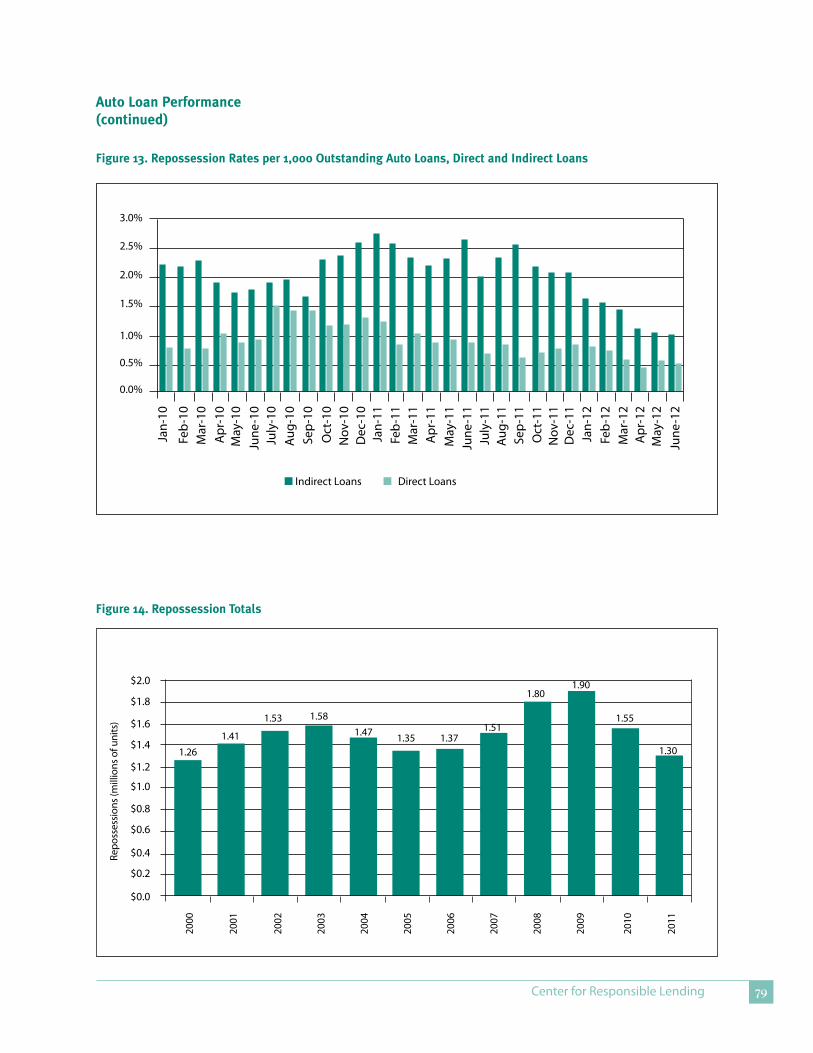
AutoLoanPerformance(continued)
1.30
1.55
1.901.80
1.511.371.351.47
1.581.53
1.411.26
2000
2001
2002
2003
2004
2005
2006
2007
2008
2009
2010
2011
Figure14.RepossessionTotals
Figure13.RepossessionRatesper1,000OutstandingAutoLoans,DirectandIndirectLoans
n Indirect Loans n Direct Loans
3.0%
2.5%
2.0%
1.5%
1.0%
0.5%
0.0%
Jan-
10
Feb-
10
Feb-
11
Feb-
12
Mar
-10
Mar
-11
Mar
-12
Apr
-10
Apr
-11
Apr
-12
May
-10
May
-11
May
-12
June
-10
June
-11
June
-12
July
-10
July
-11
Sep-
10
Sep-
11
Oct
-10
Oct
-11
Aug-
10
Aug-
11
Nov
-10
Nov
-11
Dec
-10
Dec
-11
Jan-
11
Jan-
12
The State of Lending in America and its Impact on U.S. Households80
legIslAtIon And regulAtIon
In 2010, the Dodd-Frank Wall Street Reform and Consumer Protection Act created the Consumer Financial Protection Bureau (CFPB) to oversee financial institutions and practices, including some aspects of car lending. This Act streamlined consumer protection authority that before was spread among several federal agencies. The Dodd-Frank Act created a bifurcated regulatory system, largely due to the lobbying efforts of the franchise car dealers. The Act exempts dealers that routinely sell or lease cars, sell that financing to unaffiliated third-parties, and that have a service department, from CFPB enforcement or supervisory authority. The practical effect of this carve-out is that franchise car dealers and large independent car dealers with service departments will not be subject to direct CFPB oversight, while smaller independents and BHPH dealers will remain under CFPB’s direct jurisdic-tion. CFPB also has jurisdiction over the lenders who buy car lending contracts from auto dealers.
The Federal Trade Commission (FTC), meanwhile, has been charged with regulating auto dealers since its creation. However, the FTC regulatory process was cumbersome and difficult, and as such the agency had not taken much action on car lending issues. The Dodd-Frank Act streamlined the FTC’s regulatory authority for issues related to auto dealers, and the Senate Banking Committee called on the FTC and CFPB to investigate abusive car lending practices (Dodd-Frank, 2010).
During 2011, the FTC conducted listening forum sessions in three cities soliciting input from both consumer advocates and the auto industry to better understand the sales and finance process and to gather data on predatory practices in the industry. Extensive comments have been submitted to the FTC on a number of issues, including rate markups and yo-yo scams. On the heels of the roundtables, the FTC took action on a number of abusive practices and has asked dealers for information about particular practices. Enforcement actions from the FTC include:
• Actions against four dealers for advertising that the dealer would pay off the balance owed on a consumer’s trade-in when, in fact, the dealer was rolling the balance owed into the loan used to purchase a new car. Those dealers were required to change their advertising and pay fines.
• An action to prohibit advertisements for companies promising to refinance or modify car loans to lower interest rates for a fee, when in fact those companies did not.
The FTC has also asked for detailed information about “recontracted” finance deals, which are the new contracts signed in the wake of a yo-yo scam. Meanwhile, the CFPB has issued civil investigative demands asking for data about dealer interest rate markups and BHPH lending practices.
States have not taken large steps on these issues. States like California cap the amount of interest rate markups, but our research shows that these caps do little to reduce the financial harm to consumers. Other states have different statutory and/or regulatory provisions designed to curb yo-yo scams. How-ever, despite these laws and regulations yo-yo scams happen often. Most financing contracts include mandatory arbitration clauses, meaning that consumers cannot bring actions against the dealer or the finance company in court. Rather, the consumer must bring their case before an arbitrator picked by the dealer or finance company. This makes it difficult for a consumer to find an attorney willing to take a case to arbitration, and have their grievances heard by an objective body.
Center for Responsible Lending 81
Meanwhile, California recently passed legislation designed to protect consumers in BHPH transac-tions. These new laws require BHPH dealers to offer a 30-day/1000-mile warranty and require that BHPH dealers post the price of the car on the lot. The Governor decided to veto a bill that would have imposed a 17% APR cap on BHPH transactions and would have required BHPH dealers to register as lenders. In his veto message, Governor Brown indicated that he had some concern about the registration requirement and would be open to reconsidering this issue later.
The State of Lending in America and its Impact on U.S. Households82
Auto loAns polIcy recoMMendAtIons
DealerRateMarkups
Completely divorce dealer compensation from the interest rate borrowers pay on all vehicle loans. Otherwise, dealers are compensated through discretionary pricing where the dealer is incented to make more expensive loans than that for which the borrower qualifies. The Federal Reserve and the Dodd-Frank Act prohibited similar compensation schemes in mortgage lending—compensation cannot be based on the terms of the loan outside of its principal balance. The same standard should be applied with cars. Car dealers can be compensated for their services, but the incentive should be to find the best deal for the consumer, rather than the loan with the most return to the dealer.
Yo-YoScams
The FTC, CFPB, and state enforcement officials should prohibit the yo-yo practice, by deeming it an unfair and deceptive act. The use of spot delivery agreements should only be permitted if the condition is related to something other than assignment of the finance contract, or anything in the sole discretion of the dealer. This keeps the dealer from creating an unfair bargaining advantage over the consumer, where the dealer can pressure the consumer into a more expensive deal later on.
LoanPacking
The FTC, CFPB, and state enforcement officials should take action to curb abusive practices related to add-on products, including sales tactics that mislead consumers about the true cost and value of add-on products. Dealers should also be prohibited from representing that the purchase of any ancillary product is a requirement for obtaining financing.
Center for Responsible Lending 83
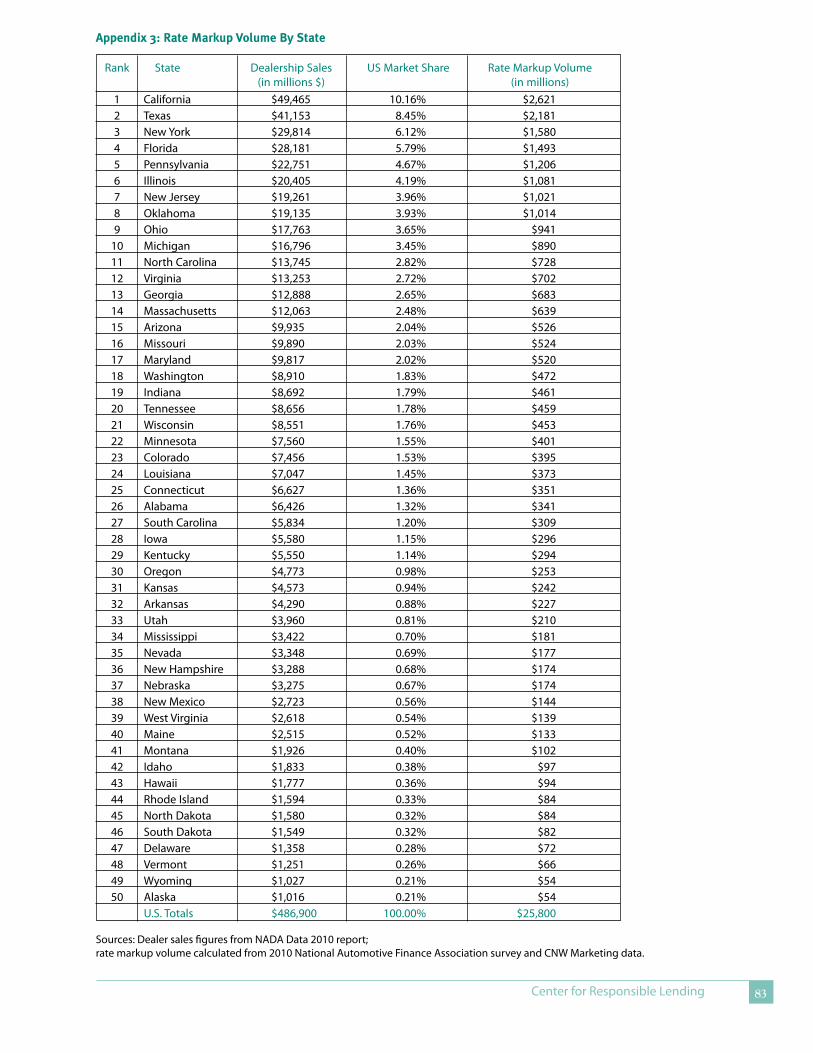
Appendix3:RateMarkupVolumeByState
Sources: Dealer sales figures from NADA Data 2010 report; rate markup volume calculated from 2010 National Automotive Finance Association survey and CNW Marketing data.
Rank State Dealership Sales US Market Share Rate Markup Volume (in millions $) (in millions) 1 California $49,465 10.16% $2,621 2 Texas $41,153 8.45% $2,181 3 New York $29,814 6.12% $1,580 4 Florida $28,181 5.79% $1,493 5 Pennsylvania $22,751 4.67% $1,206 6 Illinois $20,405 4.19% $1,081 7 New Jersey $19,261 3.96% $1,021 8 Oklahoma $19,135 3.93% $1,014 9 Ohio $17,763 3.65% $941 10 Michigan $16,796 3.45% $890 11 North Carolina $13,745 2.82% $728 12 Virginia $13,253 2.72% $702 13 Georgia $12,888 2.65% $683 14 Massachusetts $12,063 2.48% $639 15 Arizona $9,935 2.04% $526 16 Missouri $9,890 2.03% $524 17 Maryland $9,817 2.02% $520 18 Washington $8,910 1.83% $472 19 Indiana $8,692 1.79% $461 20 Tennessee $8,656 1.78% $459 21 Wisconsin $8,551 1.76% $453 22 Minnesota $7,560 1.55% $401 23 Colorado $7,456 1.53% $395 24 Louisiana $7,047 1.45% $373 25 Connecticut $6,627 1.36% $351 26 Alabama $6,426 1.32% $341 27 South Carolina $5,834 1.20% $309 28 Iowa $5,580 1.15% $296 29 Kentucky $5,550 1.14% $294 30 Oregon $4,773 0.98% $253 31 Kansas $4,573 0.94% $242 32 Arkansas $4,290 0.88% $227 33 Utah $3,960 0.81% $210 34 Mississippi $3,422 0.70% $181 35 Nevada $3,348 0.69% $177 36 New Hampshire $3,288 0.68% $174 37 Nebraska $3,275 0.67% $174 38 New Mexico $2,723 0.56% $144 39 West Virginia $2,618 0.54% $139 40 Maine $2,515 0.52% $133 41 Montana $1,926 0.40% $102 42 Idaho $1,833 0.38% $97 43 Hawaii $1,777 0.36% $94 44 Rhode Island $1,594 0.33% $84 45 North Dakota $1,580 0.32% $84 46 South Dakota $1,549 0.32% $82 47 Delaware $1,358 0.28% $72 48 Vermont $1,251 0.26% $66 49 Wyoming $1,027 0.21% $54 50 Alaska $1,016 0.21% $54 U.S. Totals $486,900 100.00% $25,800
The State of Lending in America and its Impact on U.S. Households84
references
Apgar, W.C., & Calder, A. (2005). The dual mortgage market: The persistence of discrimination in mortgage lending. In The geography of opportunity: Race and housing choice in metropolitan America.
Apicella, R., & Halloran, G. (2008). The rising repossession tide. Benchmark Consulting International.
Arroyo, G. (2012). Tracking F&I performance. F&I Management and Technology Magazine.
Bensinger, K. (November 1, 2011). Wheels of fortune: Investors place big bets on Buy Here Pay Here used-car dealers. Los Angeles Times.
Bensinger, K., & Frank, E. (August 15, 2012). Dealers’ repeat sales of same used car surprisingly common. Los Angeles Times.
Blumberg, D. (March 29, 2012). TransUnion payment hierarchy study finds consumers paying auto loans before credit cards and mortgages. Retrieved from http://www.marketwire.com/press-release/TransUnion-Payment-Hierarchy-Study-Finds-Consumers-Paying-Auto-Loans-Before-Credit-1637567.htm
Briggs Gammon, R. (February 11, 2008). Buy-Here, Pay-Here plans may attract more dealers; Growing consumer base, higher standards may outweigh risk. Automotive News. Retrieved from http://www.autonews.com
Carmichael, B. (2011). Understanding the Buy Here, Pay Here business model. NCM Associates.
CNW Marketing Research. Haggle over new-vehicle price/trade-in value (Document 1237). (2010a).
CNW Marketing Research. New sales with home equity loans (Document 1359). (2010b).
CNW Marketing Research. New and used sales by month (Document 120m). (2012).
Dasgupta, S., Siddarth, S., & Silva-Risso, J. (2007). To lease or buy? A structural model of a consumer's vehicle and contract choice decisions. American Marketing Association, Journal of Marketing Research, Vol. XLIV.
Dash, E. (May 27, 2008). Auto industry feels the pain of tight credit. The New York Times. Retrieved from http://www.nytimes.com
Davis, D. (2012). Deal or no deal: How yo-yo scams rig the game against car buyers. Retrieved from Center for Responsible Lending website: http://www.responsiblelending.org/other-consumer-loans/auto-financing/research-analysis/deal-or-no-deal-how-yoyo-scams-rig-the-game.html
Davis, D., & Frank, J.M. (2009). Car trouble: Predatory auto loans burden North Carolina consumers. Retrieved from Center for Responsible Lending website: http://www.responsiblelending.org/other-consumer-loans/auto-financing/research-analysis/car-trouble-predatory-auto-loans-burden-north-carolina-consumers.html
Davis, D., & Frank, J.M. (2011). Under the hood: Auto loan interest rate hikes inflate consumer costs and loan losses. Retrieved from Center for Responsible Lending website: http://www.responsiblelending.org/other-consumer-loans/auto-financing/research-analysis/under-the-hood-dealer-rate-markups.html
Dodd-Frank Wall Street Reform and Consumer Protection Act (Pub.L. 111-203, H.R. 4173). (2010).
Eleazer, M. (August 5, 2011). Call on ‘Line 5’. F&I Management and Technology Magazine.
Eleazer, M. (August 7, 2012). Unwinding a Deal. F&I Showroom.
Equifax: Q1 auto loan volume increases significantly from recession low. (July 2, 2012). Subprime Auto Finance News. Retrieved from http://www.subprimenews.com/spn/news/story.html?id=2427
Heasley, R.A. (April 13, 2012). BHPH success–Sales vs. collection. BHPH E-Magazine. Retrieved from http://bhph-emaga-zine.com
Henry, J. (2012a). Public retailers’ F&I revenues rise; Service contracts still the workhorse. Automotive News. Retrieved from http://www.autonews.com/article/20120502/FINANCE_AND_INSURANCE/120509964
Henry, J. (2012b). Why the subprime pool is growing. Automotive News. Retrieved from http://www.autonews.com/ar-ticle/20120314/FINANCE_AND_INSURANCE/120319953
Center for Responsible Lending 85
Howard, D. (2008). Drivers left on the hook after car dealers fail to pay off trade-ins. ABC News 10-KXTV, Sacramento, CA.
Howse, R. (March 31, 2008). How different is the Indirect Channel from the Direct Channel? JD Power & Associates.
Lazarony, L. (January 11, 2005). Beware of the extended warranty add-on. Retrieved from http://www.bankrate.com/brm/news/auto/car-guide/extendwarrnty.asp
Ly, J. (June 2009). Pressure cooker. F&I Management and Technology Magazine.
McNally, P., & Snailer, J. (July 17, 2012). US subprime auto lending market harkens back to 1990s. Moody’s Auto Navigator.
Majority of consumers uncertain of loan approval potential. (March 23, 2012). Subprime Auto Finance News. Retrieved from http://www.subprimenews.com/spn/news/story.html?id=2248
Martin, A. (2011). Auto loan ABS update and Standard & Poor’s approach to rating auto loan ABS. (Standard & Poor’s, presentation at National Automotive Finance Association Annual Conference).
National Alliance of Buy Here Pay Here Dealers (2011a). Buy Here, Pay Here industry benchmarks/trends.
National Alliance of Buy Here Pay Here Dealers. (2011b). Payment device study. Retrieved from: www.bhphinfo.com/news-detail.php?MediaID=82&NewID=86
National Auto Dealers Association. (2012). NADA Data: State of the Industry Report 2012. Retrieved from http://www.nada.org/NR/rdonlyres/C1C58F5A-BE0E-4E1A-9B56-1C3025B5B452/0/NADADATA2012Final.pdf
Overby, J. (April 13, 2012). J.D. Power: Long-term loans hit record penetration. Subprime Auto Finance News. Retrieved from http://www.subprimenews.com
Rao, M., & Warlick, B. (2012). U.S. auto loan losses down again, origination strong. Fitch Ratings.
Reed, J. (July 21, 2009). Spinella: Subprime continues to take it on the chin. Subprime Auto Finance News. Retrieved from http://www.subprimenews.com
Shilson, K. (2012a). Buy here, pay here industry benchmarks/trends 2011. Subprime Analytics.
Shilson, K. (2012b). Points for franchised dealers to consider before entering BHPH space. Subprime Auto Finance News.
Taylor III, A. (November 29, 2010). Buy Here, Pay Here: Bottom-feeding for used car buyers in a recession, CNN Money.
U.S. Federal Trade Commission. (2012). FTC takes action to stop deceptive car dealership ads. Retrieved from www.ftc.gov/opa/2012/03/autoloans.shtm
Van Alst, J.W., & Jurgens, R. (2010). Repo madness: How automobile repossessions endanger owners, agents and the public. National Consumer Law Center.
Williams, C. (April 26, 2012). US auto-loan bond issuance seen nearing pre-crisis levels. Reuters. Retrieved from www.reuters.com
Zabritski, M. (2012a). State of the automotive finance market, First Quarter 2012. Experian Automotive. Retrieved from www.experian.com/automotive
Zabritski, M. (2012b). State of the automotive finance market, Second Quarter 2012. Experian Automotive. Retrieved from www.experian.com/automotive
Zabritski, M. (2012c). State of the Buy Here/Pay Here market. Experian Automotive. Retrieved from www.experian.com/automotive