AP42 chapter 8 reference - United States Environmental ... 5.16 ' Reference #28 TO: THROUGH: FROM:...
15
-
Upload
vuongduong -
Category
Documents
-
view
223 -
download
0
Transcript of AP42 chapter 8 reference - United States Environmental ... 5.16 ' Reference #28 TO: THROUGH: FROM:...

EPA
Text Box
Note: This is a reference cited in AP 42, Compilation of Air Pollutant Emission Factors, Volume I Stationary Point and Area Sources. AP42 is located on the EPA web site at www.epa.gov/ttn/chief/ap42/ The file name refers to the reference number, the AP42 chapter and section. The file name "ref02_c01s02.pdf" would mean the reference is from AP42 chapter 1 section 2. The reference may be from a previous version of the section and no longer cited. The primary source should always be checked.

MEMORANDUM
Section 5.16 ' Reference #28
TO:
THROUGH:
FROM:
SUBJECT:
DATED:
Texasgulf Soda Ash (Granger) Compliance File
Chuck Collins, Air Quality Administrator Bernie Dailey, Air Quality Supervisor
Lee Gribovicz, District Air Quality Engineer if+-
Test Reviews, Sources #3 and #16
December 21, 1987
During the FY '87 Annual Inspection of this plant, it was discovered that the latest test data on two plant sources indicated that these sources were not complying with their allowable particulate emission rates. In the inspection transmittal letter of October 16, 1987, Texasgulf was requested to supply a schedule to test the current emission rate from these stacks. The testing was promptly scheduled for the week of November 9, 1987 as confirmed by Texasgulf's October 28, 1987 letter. I was on plant November 9-10 to observe portions of this testing and my memo of November 16, 1987 describes my observations of this test work.
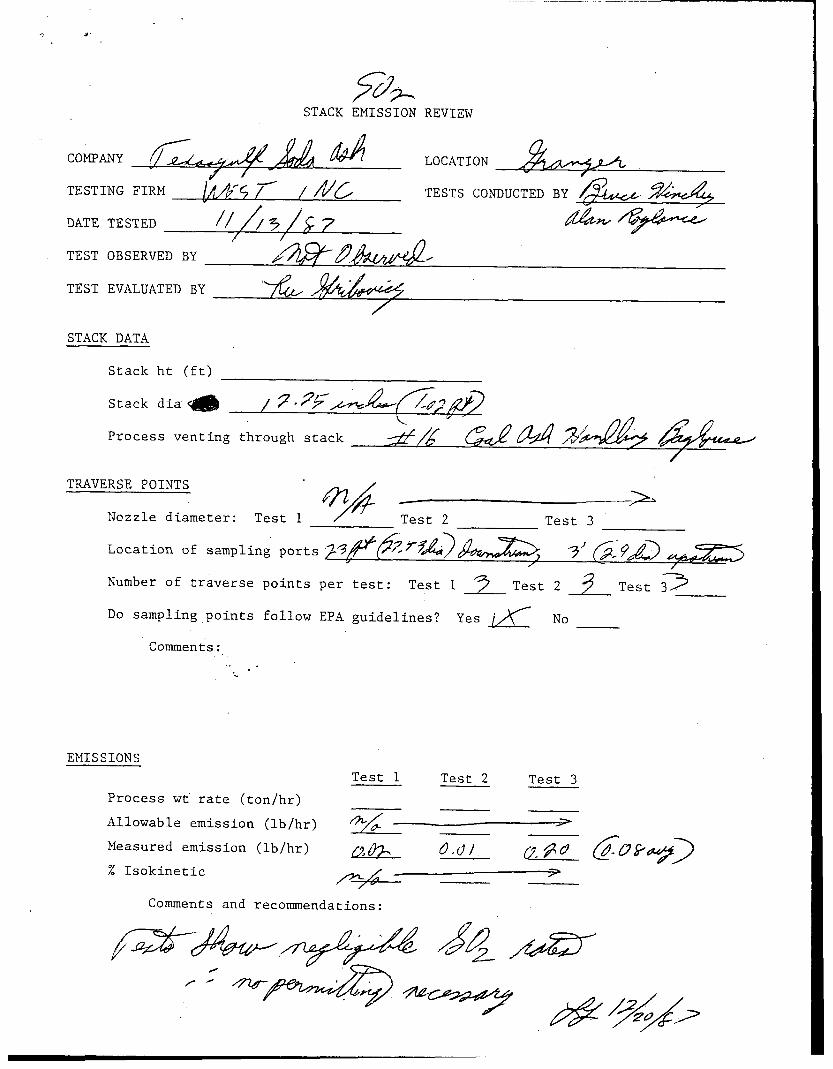
Texasgulf submitted their test report under cover of their December 14, 1987 letter. Testing was conducted for total particulate (back-half included) on two stacks; source #3, the ore crushing area housekeeping baghouse, and on source #16, the plant coal ash handling baghouse. Additionally, it was discovered that the coal ash handling system picked up an undetermined amount of SO2 which is exhausted from the source #16 stack,and in order to quantify this emission, Texasgulf agreed to conduct reference method testing for this pollutant as well. A summary of results of this test work is shown below. My test review worksheets are attached as appendices to this memo.
Test #l Test #2 Test #3 Ore Crushing Baghouse
Avg.
Calciner Design Process Rate (TPH) 127 #l Actual Process Rate (TPH) (11/10/87 avg) 129 #2 Actual Process Rate (TPH) (11/10/87 avg) 132
Allowable Emission Rate (pph) 2.14 2.14 2.14 2.14 Tested Emission Rate (pph) 1.07 0.74 0.46 0.76
Ash Handling Baghouse Calciner Design Process Rate (TPH) 127 #l Actual Process Rate (TPH) (11/13/87 avg) 127 #2 Actual Process Rate (TPH) (11/13/87 avg) 129
Boiler Design Steam Rate (pph) 330,000 #l Actual Steam Rate (X) 75% #2 Actual Steam Rate (X)
(11/13/87 avg) (11/13/87 avg) 70%

Memorandum , Page Two
(Particulate) Allowable Emission Rate (pph) Tested Emission Rate (pph)
0.43 0.43 0.43 0.43 0.25 0.14 0.19 0.19
(Sulfur Dioxide) Allowable Emission Rate (pph) Tested Emission Rate (pph)
-------------Not Regulated-------------- 0.02 0.01 0.20 0.08
As can be seen from the table both sources tested well within their allowable emission rates for particulate, #3 @ 36% of the allowable and #16 @ 44% of the allowable, while the process units were run at or near full load. I recommend that the Division accept these tests as proof of compliance for these two emission points.
The emission of sulfur dioxide from the ash handling system has been acceptably quantified and it appears this stack is a relatively insignificant source of the pollutant.
LG/jw

STACK EMISSION REVIEW
COMPANY LOCATION
TESTING FIRM TESTS CONDUCTED BY
DATE TESTED /h/k7
TEST OBSERVED BY
TEST EVALUATED BY
STACK DATA
Stack
Stack
ht (ft)
dia ,$&$ . &o '
Process venting through stack
TRAVERSE POINTS // /l
Nozzle diameter: Test 1 G.JTq /! Test 2 c .pyf
Test 3 6,z??
Location of sampling ports y*'y" 7.i M 7 /
/& ($;A)- / ,
Number of traverse points per test: Test 1 h Test 2 6 Test 3 6
Do sampling points follow EPA guidelines? Yes tK No
Comments:
EMISSIONS
Process wt rate (ton/hr)
Allowable emission (lb/hr
Measured emission (lb/hr)
% Isokinetic
Test 1 Test 2 Test 3 ,73g?Igz

. I
TSP DATA SHEET
P bar
pS
TS
Tm
v ic
"m
AH
C P
P std = 29.92 in Hg
T std = 528"~
= barometric pressure at site (in Hg)
= absolute stack gas pressure (in Hg)
= absolute average stack gas temp. (OR)
= absolute average dry gas meter temp. (OR)
= total volume of water collected (ml)
= volume of gas through dry gas meter (ft3)
= average pressure drop across orifice (in H20) 2,?7/ &q/r ./-qg
= pitot tube coefficient 0. Lv- 1 -
(VT) ave = average velocity head of stack gas (in H20) & W6 0. %T7 &L B-7
AS = cross-sectional area of stack (ft2) p-3
k. -
Mn = total amount of particulate collected (g) dw7,5 0, o/i Y I?. 03 74
8 = total sampling time (min.) ($9 -7
An = cross-sectional area of nozzle (ft2) 3. //fr ,i+ ,------+
ORSAT ANALYSIS
Test 1 Test 2 Test 3
% co*
% o2
% co
% N2

. l
CALCULATIONS
1’. v w std = volume of water vapor in gas @ STP (ft3)
V w std = 0.0474 ft3/m1 * V ic
V w std = 1-n , MS' , lI 8 ft3
2- 'mstd= volume of gas sample through dry gas meter @ STP (ft3)
3. B wo = proportion by volume of water vapor in gas stream (dimensionless)
B = V wo w std V
W std + 'm std
B = wo
4. Molecular weight (lb/lb mole)
Md = 0.44 (% CO21 + .32 (% 02) + .28 (% N2 + % CO)
Md = axPJ., '?Eby- ,pKk' lb/lb mole
MS = Md (1 - Bwo) + 18 Bwo
MS = 2x9, ygF4, Jj,@ lb/lb mole
5. v S
= stack gas velocity (ft/sec)
vS = 85.48 CP (Kp)ave
v =$$s’3 , yv-2 ) S
6. Q S
= volumetric flow
9, = 60 (1 - By,) v S
570 ftlsec
rate, dry basis, @ STP (ft3/min)
.

. .
PARTICULATE CALCULATIONS (CONTINUED)
7. cs = concentration (lb/ft3)
cS = 2.205 x low3 Mn
V m std
8. E = emission rate lb/hr
9. % Isokinetic
I = 1.667 Ts 0.00267 V. + Vm [Pbar + AH 1C -3
" 13.6

. ,
STACK EMISSION REVIEW
COMPANY
TESTING FIRM TESTS CONDUCTED BY
DATE TESTED
TEST OBSERVED BY
TEST EVALUATED BY
STACK DATA
Stack ht (ft)
Stack dia
Process venting through stack
TRAVERSE POINTS
Nozzle diameter: Test 1
Location of sampling ports p/+@ (&g, 5-3&!Jm fl \
Number of traverse points per test: Test 1 6 Test 2 6 Test 3 6
Do sampling points follow EPA guidelines? Yes H No
944 EMISSIONS h-w &+I
&2Zcess wt ra:e (tons hr
Allowable emission (lb/hr)
- ._.._ - __--
'est 3
Measured emission (lb/hr) d..gq~ a-w U./Y 6. i 9 1urgy/ % Isokinetic
Comme ts and recommendations:
Fd& + @ m&a ~rhu%f~

I . l
TSP DATA SHEET
P bar
pS
TS
Tm
V ic
'rn
AH
C P
P std = 29.92
T std = 528"R
in Hg
= barometric pressure at site (in Hg)
= absolute stack gas pressure (in Hg)
= absolute average stack gas temp. (OR)
= absolute average dry gas meter temp. (OR)
= total volume of water collected (ml)
= volume of gas through dry gas meter (ft3)
= average pressure drop across orifice (in H,O) 0.6 77
= pitot tube coefficient L
(anave = average velocity head of stack gas (in H20)
AS = cross-sectional area of stack (ft2)
Mn = total amount of particulate collected (g)
0 = total sampling time (min.)
An = cross-sectional area of nozzle (ft2 >
ORSAT ANALYSIS
% co2
% o2
% co
% N2
Test 1 Test 2
c3 u
& 2)
c3 0
7y 77
Test 3
$4 / 84 c7
75

. .
CALCULATIONS
I. vw std = volume of water vapor in gas @ STP (ft3)
v w std = 0.0474 ft3/ml ' V ic
V w std
2. vm std = volume of gas sample through dry gas meter @ STP (ft3)
V m std = 17.65
3. B wo = proportion by volume of water vapor in gas stream (dimensionless)
B = V wo w std V
w std "m std
4. Molecular weight (lb/lb mole)
Md,= 0.44 (X CO2) + .32 (X 02) + .28 (X N2 + % CO)
MS = Md (1 - Bwo) f 18 Bwo
MS =$y,%g , $f,@ , gr;r7 lb/lb mole
5. vs = stack gas velocity (ft/sec)
vS = 85.48 Cp (Kp)ave
6. Q S
= volumetric flow rate, dry basis, @ STP (ft3/min)
Q, = 60 (1 - By,) v
Q,=' , $0/o
4 - 17 1’37 Y'W mr p'.-.---- -

PARTICULATE CALCULATIONS (CONTINUED)
7. cs = concentration (lb/ft3)
Cs = 2:205 x 10v3 Mn V
m std
8. E = emission rate lb/hr
E = Cs - Q, . 60
9. % Isokinetic
I = 1.667 Ts 0.00267 V. + V 1C m IPbar +AH
Tm -1 13.6
9 ,3- STACK EMISSION REVIEW
COMPANY LOCATION $&,x-y&
TESTING FIRM c -
!/x$5 / //z/L TESTS CONDUCTED BY f& 5i?cL&&
DATE TESTED 0 /4 5 i$ 7
TEST OBSERVED BY
TEST EVALUATED BY
STACK DATA
Stack ht (ft)
Stack dia a
Process venting through stack --&g ~~~~~* /
TRAVERSE POINTS ->
Nozzle diameter: Test 1 Test 2 Test 3
Location of sampling ports 3
Number of traverse points per test: Test 1 7 Test 2 9 Test 33
Do sampling points follow EPA guidelines? Yes jx No
Comments: . . .
EMISSIONS Test 1 Test 2 Test 3
Process wt rate (ton/hr)
Allowable emission (lb/hr) hz&l--~ 7
Measured emission (lb/hr) LQ2L O.ill
% Isokinetic
Comments and recommendations:

INPUT DATA FOR SO2 TEST PROGRAM TZST 1 T'ZST 2 TEST 3
AFlBIENT PRESSURE (in Hg) f I I ? AAH / v,-- 1 1
ABS. STACK GAS PRESSURE (in Hg) G
ABS. AVG. STACK GAS TEMP (in Hg) G
ABS. AVG. DGM TEMP ('IR) 6
TOT VOL H20 COLLECTED % SO2 (ml) Cc
VOL. T1IRU DGM: Y ADJUSTED (FT3) \/hX Y
AVG DEL P ACROSS ORIFICE (in 1120) A/
PITOT TUBE COEFFICIENT G-
AVG SQRT VEL HEAD STACK GAS (in H20)s a S-SECT AREA OF STACK (FT2) 4
AVG VQL TITRANT USED IMPINGER 2 (ml) $
XVG VOL TITRANT USED IMPINGER 3 (ml)
VOL TITRANT USED FOR BLANK (ml) &
VOL IMP2 SOLUTION CONTAINING SO2 (ml)
VOL IMP3 SOLUTION CONTAINING SO2 (ml)
VOL SAMPLE ALIQUOT TITRATED (ml) vh
NORMALITY OF TITRANT (meq/ml) N
ORSAT ANALYSIS
z co2
% 02
% co
% N2
NOTE IF ALIQUOT FACTOR IS GREATER THAN 1.0 DIVIDE THE APPROPRIATE IMPINGER SOLUTION BY THE ALIQUOT FACTOR AND USE TIIAT VALUE FOR THE IMPINGER SOLUTION AND USE 1

CALCULATIONS
la 'w std = volume of water 'vapor in gas @ STP (ft3)
v w std = 0.0474 ft3/ml * vie
V w std
2- 'rn std = volume of gas sample through dry gas me :ter @ STP (ft3)
3. B wo = proportion by volume of water vapor in gas st
B = V wo w std V w std + 'rn std
B'wo = o.ol , 0.0x , a.oa
4. Molecular weight (lb/lb mole)
Md = 0.44 (% C02) + .32 (% 02) + .28 (X N2 + % CO)
Md =$yq ,a%,al, , $?./T lb/lb mole
MS = Md (1 - Bwo) + 18 Bwo
MS =$!-r,@ ,$X,60 , 9r$7 lb/lb mole
5. v S
= stack gas velocity (ft/sec)
vS = 85.48 Cp (Gp)ave
TS
J- ps Ms
vs = 3 , ?I.C"i ftlsec
6. Q, = volumetric flow rate, dry basis, @ STP (ft3/min)
Q, = 60 (1 - Bwo) v
ream (dimensionless)

r a L.
SO2 Calculations (Continued)
7. c,,2 = a 1$/3%7
concentration of SO2 at STP, dry basis (lb/ftj) /
t - Vtb)
Vm std - &,++,“’ ‘so2 = -p.; j&%X/o: gour,~’ lb/@
,. t
.’
.‘,
‘. .; \ ., .’
‘. .. .
. I :.
.‘. .
), :
.: .
1 ,.‘: -’ ‘. .: ’
~_
,‘..’ ‘. . : .,
,: 1 . . . . 3
._, ,. . ‘.’
I .
,I . .’
.: . . . ..;. .. :
. . . :
. . - _, i
_‘_ :: _. ‘1:
,. . : . . ._
_. .-_ . ._‘_ .’ ,
. ;’ ‘.
\
. .
: _’
.