Aeroelastic Deformation Measurements Of Flap, …mln/ltrs-pdfs/NASA-2001-joa-awb2.pdfAeroelastic...
30
Aeroelastic Deformation Measurements Of Flap, Gap, And Overhang On A Semispan Model A. W. Burner * and Tianshu Liu † NASA Langley Research Center Hampton, VA 23681-2199 Sanjay.Garg ‡ High Technology Corporation Hampton, VA 23666 Terence A. Ghee ϑ NAVAIR Patuxent River, MD 20670-1906 Nigel J. Taylor ¶ DERA Farnborough Farnborough Hampshire GU 14 OLX, UK * Research Scientist, Senior Member AIAA, Corresponding author NASA Langley Research Center Instrumentation Systems Development Branch MS 236 Hampton, VA 23681-2199 [email protected] † Research Scientist, Member AIAA NASA Langley Research Center Model Systems Branch MS 238 Hampton, VA 23681-2199 [email protected] ‡ Research Scientist (Currently with) Hypertherm, Inc. Advanced Systems Department Etna Road Hanover, NH 03755 [email protected] ϑ Aerodynamicist, Senior Member AIAA NAVAIR, Code 4321 Advanced Aerodynamics Branch Bldg. 2187, Suite 1320B Patuxent River, MD 20670-1906 [email protected]
Transcript of Aeroelastic Deformation Measurements Of Flap, …mln/ltrs-pdfs/NASA-2001-joa-awb2.pdfAeroelastic...

Aeroelastic Deformation Measurements Of Flap,Gap, And Overhang On A Semispan Model
A. W. Burner* and Tianshu Liu†
NASA Langley Research CenterHampton, VA 23681-2199
Sanjay.Garg‡
High Technology CorporationHampton, VA 23666
Terence A. Gheeϑ
NAVAIRPatuxent River, MD 20670-1906
Nigel J. Taylor¶
DERA FarnboroughFarnborough Hampshire GU 14 OLX, UK
* Research Scientist, Senior Member AIAA, Corresponding authorNASA Langley Research Center
Instrumentation Systems Development BranchMS 236
Hampton, VA [email protected]
† Research Scientist, Member AIAANASA Langley Research Center
Model Systems BranchMS 238
Hampton, VA [email protected]
‡ Research Scientist(Currently with)
Hypertherm, Inc.Advanced Systems Department
Etna RoadHanover, NH 03755
ϑϑϑϑ Aerodynamicist, Senior Member AIAANAVAIR, Code 4321
Advanced Aerodynamics BranchBldg. 2187, Suite 1320B
Patuxent River, MD [email protected]

¶ Principal Aerodynamicist, member AIAA(Currently with)
Matra BAe Dynamics(UK) Ltd.FPC 460, PO Box 5
Filton, Bristol, UK Zip or Postal Code: BS34 [email protected]
ABSTRACTSingle-camera, single-view videogrammetry has been used for the first time to determinestatic aeroelastic deformation of a slotted flap configuration on a semispan model at theNational Transonic Facility (NTF). Deformation was determined by comparing wind-off towind-on spatial data from targets placed on the main element, shroud, and flap of the model.Digitized video images from a camera were recorded and processed to automaticallydetermine target image plane locations that were then corrected for sensor, lens, and framegrabber spatial errors. The videogrammetric technique used for the measurements presentedhere has been established at NASA facilities as the technique of choice when high-volumestatic aeroelastic data with minimum impact on data taking is required. However, theprimary measurement at the NTF with this technique in the past has been the measurementof the static aeroelastic wing twist of the main wing element on full span models rather thanfor the measurement of component deformation. Considerations for using thevideogrammetric technique for semispan component deformation measurements as well asrepresentative results are presented.
NOMENCLATURE∆gap = change in gap spacing due to aerodynamic loadingL = displacement magnitude inX, ZplaneLEF = leading edge flap∆OH = change in overhang spacing due to aerodynamic loadingQ = dynamic pressureTEF = trailing edge flapX = streamwise coordinate in object spaceY = crossflow coordinate in object spaceZ = vertical coordinate in object space∆X = displacement magnitude of streamwise coordinate∆Y = displacement magnitude of crossflow coordinate∆Z = displacement magnitude of vertical coordinateα = geometrical angle0of-attackφ = angle of displacement vectorη = normalized semispanθ = change in wing twist due to aerodynamic loading
Subscripts
n = target number, 1,2 (inboard reference), 3 (shroud), 4 (fore TEF), 5 (aft TEF)o = interpolated wind-offX-value

INTRODUCTIONOn modern military air vehicles, high-lift systems are used to improve take-off and landingperformance. For naval air vehicles, an improvement in the lift coefficient in a landing orapproach configuration allows for arrested landings at reduced speeds and/or increasedpayloads. In addition, reduced landing speeds reduce stress on the airframe. Forconventional take-off or landing (CTOL), improved lift-to-drag ratios allow for shorter take-off runs and/or greater payload capacity. For these reasons, it is imperative to quantify andimprove the performance of high-lift systems including trailing edge flap (TEF), gap, andshroud geometry.
An effort has been initiated to develop procedures using the videogrammetric modeldeformation (VMD) measurement technique to measure TEF gap and flap and shroudgeometry changes induced by aerodynamic loading. VMD measurement techniquedevelopment with multiple cameras was initiated in the 1980s1, based on earlier successfulwind tunnel tests conducted in the 1970s using film cameras2. The introduction of imageprocessing routines coupled with the development of a simplified single-camera, single-viewphotogrammetric technique permitted automated data acquisition and reduction. Thesedevelopments facilitated use of the technique in production wind tunnels with very littlenegative impact on test schedule3. The target-tracking version of VMD developed underNASA contract and used for this test is discussed in reference 4. A review of the VMDmeasurement technique can be found in reference 5.
Component deformation measurements are especially troublesome due to difficulty inimaging the area of interest, limited target placement options, and the need to measure smalldeformation levels that are very sensitive to small errors in pitch angle (dependent on theradius from the center of rotation of the model). Although a few preliminary tests have beenconducted during which flap angle changes with flow were measured at other non-cryogenicfacilities6, this paper will address the first application of the technique at the NTF for thecombined measurement of trailing edge flap and shroud geometry changes underaerodynamic loading. In addition, this was the first application of the technique at the NTFwith a semispan model and the first optical measurements of component deformation at thefacility. Deformation measurements, including the deformation of control surfaces andassociated components, are of particular importance in high Reynolds number facilities suchas the NTF since high dynamic pressures (Q), with accompanying deformation, are typicallyassociated with high Reynolds number testing. For CFD evaluation, it is important toquantify the gap and overhang differences from the static condition due to shroud and/ortrailing edge flap deflections under load.
Since the intent of this paper is not to present extensive data on gap and flap deformation,only representative data will be presented. Rather, this paper relates experiences usingvideogrammetry in a large production wind tunnel for such measurements in order to aidpotential users of the technique at the NTF and other facilities. Issues related to targetingsuch as location, application, contrast, surface quality and target thickness will be addressed.Camera installation will be described along with initial camera calibration to establishcamera calibration coefficients and camera location in the test section coordinate system. Amajor concern for high-productivity facilities is that calibration time be kept to a minimum

so as not to negatively impact productivity. Techniques employed to significantly reducetunnel downtime for calibration will be described. The data acquisition procedure andinteraction with the facility data acquisition system will be described. The advantages anddisadvantages of a commercial prototype target-tracking image acquisition system will bediscussed. The data reduction procedure to determine gap and flap deformation due toaerodynamic loading will also be described. The relation of centroid repeatability to theprecision of the measurements will be addressed along with estimates of uncertainty.
TECHNIQUEThe VMD measurement technique consists of a single-camera, single-view,photogrammetric solution from digital images of targets placed on the wing at knownsemispan locations. Since only one camera is required, lighting requirements are reduced,which is especially advantageous when using existing test section illumination. Thetechnique is non-intrusive except for the targets, which may have some minor local effectson the aerodynamic data3. The basic hardware consists of a standard video-rate chargecoupled device (CCD) video camera, a frame grabber board, and a computer with imageacquisition and reduction software. A light source is usually located as close to the cameraas possible to take advantage of retroreflective targets at all facilities where the technique isused except for the NTF. At the NTF, where stringent model surface finish requirementspreclude the use of retroreflective targets, test section lights are used for diffuse illuminationof polished paint targets. For measurements at the NTF, the camera is positioned to the sideand somewhat above the model, resulting in an oblique view of the model. A target row istypically placed on or near the fuselage to serve as control, with additional target rowslocated at known semispan locations along the wing. Image processing is used toautomatically locate and compute corrected image plane coordinates for each of the targets.Single-view photogrammetry is then used to determine theX (streamwise) andZ (vertical)coordinates in object space, given the knownY (crossflow) coordinates. Verticaldisplacements at specified chordwise locations and slope angles are computed by linear leastsquares for each semispan station along the wing5.
FACILITYThe National Transonic Facility (NTF) is a fan-driven, closed circuit, continuous-flow,pressurized wind tunnel7. The 8.2 x 8.2 x 25-ft long test-section has a slotted-wallconfiguration. However, for the test described here the slots were covered. The wind tunnelcan operate in an elevated temperature mode up to T = 140° F, normally using air, and in acryogenic mode, using liquid nitrogen as a coolant, to obtain a test temperature range downto about -250° F. (However, note that for the test described here the NTF was operated inair mode only at 95° F.) Thermal insulation inside the pressure shell minimizes energyconsumption. The design total pressure range for the NTF is from 15 psia to 130 psia. Thecombination of pressure and cold test gas can provide a maximum Reynolds number of120,000,000 at Mach 1.0, based on a chord length of 0.82 feet. These characteristics affordfull-scale Reynolds number testing for a wide range of aircraft. Three types ofinvestigations are possible: Reynolds number effects at constant Mach number and dynamicpressure; model aeroelastic effects at constant Reynolds number and Mach number; andMach number effects at constant dynamic pressure and Reynolds number.
The constraints imposed by operation in a high-pressure environment over such a widerange of temperatures have had a significant impact on the continuing development,

improvement, and optimization of instrumentation at the facility. A major instrumentationchallenge at the National Transonic Facility is the requirement to make measurements overthe wide range of temperature from 140° F down to -250° F. Aeroelastic deformationmeasurements have been made at the NTF for both High Speed Research (HSR) andAdvanced Subsonic Technology (AST) full span models. In all cases before the testdescribed here, the emphasis of the aeroelastic measurements at the NTF was for thedetermination of the change in main element wing twist due to aerodynamic loading5. Theresults presented here represent the first attempt at the NTF to make aeroelasticmeasurements on a semispan model and the first attempt to measure the aeroelastics ofcomponents in addition to the main wing element.
WIND TUNNEL TESTThe first test involving the measurements of trailing edge flap and shroud geometry at theNTF was conducted on a large representative military semispan steel wing during an airmode test at constant Mach number and varying dynamic pressures. Figure 1 illustrates thedefinition of gap as the distance from the trailing edge of the shroud to a tangent point on thetrailing edge flap. Overhang is defined as the distance parallel to the model chordline fromthe trailing edge of the shroud to the leading edge of the TEF. The gap and overhang wereadjusted using shim plates and serrated teeth, respectively, during model configurationchanges. The gap was variable from 0.5 to 2.5%c and overhang was variable from –1.0 to5.0%c in increments of 0.5%c.
Figure 2 depicts the entire semispan model with leading-edge-flap (LEF), shroud, TEF, andstandoff with labyrinth seal. The labyrinth seal and standoff plate were used to mitigate theeffect of the wind tunnel boundary layer on the aerodynamic performance. Uniformlydistributed static loads applied pre-test to the wing and shroud indicated relatively stiff wingcomponents with little expected deformation. The air mode test served as an effectivemeans to investigate implementation issues associated with the aeroelastic measurementtechnique and to evaluate the resolution of the measurement technique, while avoiding thecomplications that cryogenic operations introduce for optical instrumentation. The semispanwing was tested under the auspices of The Technical Co-operation Program (TTCP), amulti-national test program that includes NASA, DERA (UK), and US Navy. For this testthe angle-of-attack range was –5 to 24 degrees, the Mach number fixed at 0.2 for the VMDruns, and the dynamic pressure range was 60 to 350 psf (Reynolds numbers from 1.4million/foot to 7.7 million/foot). Parametric studies were conducted on gap and overhang todetermine the optimum settings for a configuration with specific angle settings for theshroud and trailing-edge-flap. In addition to studying the basic flow physics of militaryhigh-lift configurations, the test was also conducted for CFD validation8. Results from thetest will be used as a benchmark for future CFD studies to predict high lift systemperformance and, ultimately, high lift system design. As such, it is critical to gage the extentof deflection of the high lift system under load. The components of the high lift system(trailing edge flap and shroud) act as cantilever beams, which under aerodynamic loadingmay deflect. Since the gap between the trailing edge flap and the shroud was crucial to theparametric study during the test and is a main parameter for CFD studies, knowledge of thedeformation is crucial.

PRE-TEST LOADING OF COMPONENTSTo estimate the potential deflection due to aerodynamic loading prior to testing, staticloading tests were conducted. The shroud was uniformly loaded using weighted bags whilethe trailing edge flap was loaded with point loads attached to the flap ends near the ¼ chord.With the shroud set to a deflection angle of 23° and the trailing edge flap set to 35° (23/35configuration) a load of 420 pounds applied to the trailing edge flap was found to decreasegap a maximum of 0.008 inches measured at the bracket location. The shroud, loaded to 20pounds was found to increase gap 0.0045 inches. Therefore, a pre-test estimate of themaximum change in gap was established as the difference between these readings to be onthe order of 0.0035 inches. In the worse case, with zero shims corresponding to a gap of0.196 inches (or 0.5% of the undeflected wing chord located at the mid-span of the flap),this estimated deflection would be 1.8% of the unloaded gap.
OPTICAL TARGET LAYOUT & APPLICATIONThe special illumination technique developed for full-span models at the NTF involves theimaging of a black test-section wall as seen in reflection from the mirror-like wing surface5.In such cases good contrast targets are possible with an application of polished-paint whitedots on the wing and fuselage without any additional background painting required. Asimilar illumination technique has not yet been perfected for semi-span testing. Thus toensure reasonable contrast targets, white dots on a black background were used for this firstsemi-span test. The targets consisted of polished paint white dots of 0.5-inch diameter on ablack background several diameters wide. The locations of the targets were chosen tominimize interference with pressure taps and generally located away from taps or centeredbetween pressure tap rows. The targets were positioned with aid of precision metal-foiltemplates that facilitated the target application to model parts that would be used later in thetest, especially in one case in which half of two targets would be replaced during aconfiguration change. The use of precision templates to locate the targets was especiallyuseful since over 90 configuration changes were anticipated for the test. The templates alsofacilitated the determination of the semi-span (Y-coordinate) of each target for entry intodata reduction setup files. All layout, painting, and polishing of the targets wasaccomplished in a ready bay preparation site before the model was moved to the test section.
The application procedure began with a chemical cleaning of the model to remove anyresidual oil or film that might hamper adhesion of the paint, which was the standard base-coat typically used for PSP applications. The circular targets were then masked at theproper locations and painted with an air gun. The masking was removed after an hour or soof drying under IR illumination (used to decrease paint drying time). The masks for theblack background were then applied and the black paint applied over the white targets.After drying, the targets and backgrounds were polished with 2000 grit paper and water toyield a final typical thickness of 0.0005 inch and a surface roughness of less than 10µinchas verified by measurements with thickness and roughness gauges. The height of the paintwas estimated to have no aerodynamic effect based on estimates of detrimental aerodynamicstep height given in Reference 9.
Two targets were located near the wing root where deformation was expected to beminimized. The wing-root targets were used as reference for computation of the

deformation due to aerodynamic loading. Two targets were also placed in a row at anormalized semispan,η, equal to 0.75 in order to determine the change in twist of the mainwing element. Targets were placed on the shroud and near the leading and trailing edges ofthe trailing edge flap. The painted targets with black background can be seen in figure 3 onthe trailing edge flap and shroud. The root reference target row can be seen at the top of thefigure. This image is from the camera used to make the model deformation measurementswith targets and coordinate system labeled.
CAMERA SETUP & LIGHTINGThe CCD video camera must be protected from extremes in the operating environment.Temperature and humidity operating requirements for the camera are 0 to 40° C with arelative humidity of 50 to 70%. Environmentally protected pressure housings that cansupply heating or cooling are used at the NTF for the VMD cameras due to the largetemperature and pressure excursions at the facility. Tests at the NTF have shown that, whenpossible, it is generally advantageous to mount the camera with a fixed-mount rather thanwith a pan-tilt unit that may be subject to movement under flow conditions. The interlinetransfer CCD camera used for this test was an instrumentation grade video-rate camera witha resolution in interlaced mode of 768 pixels horizontal by 493 pixels vertical. Thehorizontal and vertical pixel spacings are 11.0µm and 13.0µm respectively. The target-tracking VMD measurement system digitizes the video image to a resolution of 640 by 480pixels. A zoom lens was used at a focal setting selected to properly capture the targets ofinterest throughout the expected pitch range of the test. Standard test-section lighting, alsoused for surveillance while testing, was used to illuminate the targets. The search for acombination of test-section lights to yield suitable contrast over the entire pitch range wasthe most time-consuming activity during setup. Often the lighting settings sufficient forreasonable contrast at a given pitch angle would be unsuitable for other pitch angles. Acompromise in the lighting was finally found that could work over the entire pitch rangewhile still allowing sufficient illumination for the test-section surveillance cameras that arerequired to be operational during testing.
DATA ACQUISITION SYSTEMThis was the first test at the NTF in which the target-tracking system developed by the HighTechnology Corporation (HTC) under NASA contract4 was used as the primary dataacquisition system for model deformation measurements. For previous tests at the NTF, allof which were full–span models, an in-house developed automated image acquisition andreduction system had been used5. The in-house developed system works well for scenes inwhich the targets stand out from the background significantly, such as occurs with thespecial illumination and targeting technique developed for the NTF discussed earlier. Incases where additional glints or spots on the model might be interpreted as false targets, thein-house system may fail. Since the HTC tracking system tracks individually designatedtargets (by mouse or by selection of a previous centroid file) continuously at a 15 HZ rate,any glints or “false targets” that are more than a few target diameters away from the truetargets will not perturb the data acquisition. Since the quality of the images was expected tobe significantly degraded from that possible with full-span models, the HTC system wasselected for primary data acquisition for the model deformation measurements. A numberof potential false targets and glints can be seen in figure 3 that would have been verytroublesome for the in-house developed system.

A major difference between the HTC tracking system and the in-house developed system isthat the HTC system tracks targets and outputs centroid files upon trigger while theacquisition program is running, but does not do any additional reduction except for a limitedquick look capability. On the other hand, the in-house developed system automatically findstargets, locates centroids, sorts targets, correlates data with facility point number, determinesthe change in wing twist as each data point is taken, and outputs the reduced data to files.Since the final reduction can not be accomplished until the end of a set of runs for the HTCsystem, the data turnaround time is increased from that experienced for full-span modelswhen using the in-house developed deformation measurement system. Thus the modeldeformation data may be transferred to the customer as a separate data file, instead of beingmerged with the rest of the data shortly after a run series as for full-span testing. However,the improved robustness of the HTC tracking system for this semispan model proved worththis tradeoff.
SYSTEM CALIBRATIONThe measurement system was calibrated with a three-step process. First the camera wascalibrated for lens distortion. The location and pointing angles of the camera were thendetermined in the test section coordinate system. Finally angles andX, Z-coordinates werereferenced to a wind-off polar (an alpha sweep over the same pitch range as for a wind-onpolar)5. Figure 4 shows an image from the data camera during the first step. During thisphase a calibration fixture consisting of a 3-stepped plate with targets at known locations ispositioned to occupy as much of the field-of-view as possible. A centroid file is thenrecorded from which several camera parameters associated with imaging and needed for thephotogrammetric reduction are recovered. The new camera parameters are then used in thesubsequent step of the calibration. For the second calibration step, the 3-step calibrationplate is aligned to the test section coordinate system so thatX is in the flow direction,Z isup, andY is along the span direction defined by the right-hand-rule (figure 5). It is theY-value that serves as the known input to enable computations ofX and Z with a singlecamera. A row of pressure taps near the root was used to align the calibration plate in thestreamwise direction. A precision bubble level was used to establish parallelism to the Y-axis, which is assumed to be horizontal. It is not necessary to level the plate in the pitchdirection (rotation about the Y-axis) since the offset in pitch is determined by wind-offpolars used for final system calibration. The orientation parameters in the test-sectioncoordinate system were then input into a data reduction setup file. As a check of the firsttwo steps in calibration and to ensure that the system and setup files are establishedcorrectly, the difference in the computedX-coordinates of targets at the inboard row andoutboard row were compared to ensure agreement to their known values based onmeasurements during target layout.
The third calibration step begins with a wind-off polar at, or near, the total temperature andpressure that flow data will be taken. A third- to fifth-order polynomial least-squares fit isused to establish correction coefficients based on the onboard accelerometer used todetermine the pitch angle of the model. The correction coefficients force the anglesmeasured by the VMD measurement system to agree with the onboard accelerometer andaccount for slight zero-shifts and changes in system response as a function of time or tunnelconditions. The use of wind-off polars may not be as crucial when conducting tests in airmode such as for this test, but is especially critical when in cryogenic mode due to the largertemperature excursions that are possible, with associated mounting structure movement. For

this test the wind-off polars were also used to establish the motion in theX-Z plane underwind-off conditions. TheX-Z wind-off value at a given alpha (based on the polynomialcurve fit) can then be interpolated and subtracted from the flow data to yield differencesfrom wind-off to wind-on.
DATA ACQUISITION & REDUCTIONA transistor-transistor-logic (TTL) trigger from the facility data acquisition system (DAS)automatically initiated data acquisition. Upon trigger, the centroids of the next 75 images(representing 5 seconds of image acquisition) were recorded to a data file with a sequentialvmdpoint number that was independent of the DAS point number. After the centroid file isstored, a file prepared by DAS containing point number, run number, Mach, alpha, andseveral other tunnel parameters is retrieved from a shared drive to create a log file with DASdata correlated withvmdpoint numbers for later reductions.
At the conclusion of a set of runs, data reduction is initiated by selecting inclusivevmdpointnumbers for the runs that need to be reduced, with the wind-off run(s) and wind-on runsdiscriminated. MATLAB scripts are then used for further reductions. The data reductionoperations include the following. Centroid coordinates in pixel units are converted to mmunits based on horizontal and vertical pixel spacings. The distortion correction parametersfound in step 1 of the calibration procedure are then applied for use in the single-camera,single-view photogrammetric determinations ofX and Z target coordinates based uponknown Y coordinates from setup files. Angle computations in anX, Z-coordinate plane arethen made for targets identified as constituting a given row. Polynomial coefficients aredetermined based upon the wind-off polar(s) for application to the wind-on data todetermine the difference between wind-off and wind-on for angles andX andZ-coordinates.For the aeroelastic twist computation atη = 0.75 the angle of the inboard row of targets nearthe root of the main wing element was used as reference and subtracted.
In full-span testing, sting bending causes a displacement of the model during flow. Thus ata given alpha, the model position with and without flow may differ, requiring the use of atarget row on the body as reference to remove any apparent twist of the body. For semispantesting it was assumed originally that a direct subtraction of interpolatedX and Z valuesfrom the wind-off reference polar would be the best procedure. However, it was found thatin some cases displacements (real or apparent) between wind-off and wind-on data wereactually larger than the relatively small deformation due to aerodynamic loading. Vectordisplacements from wind-off to wind-on for one of the high-Q runs are presented in figure 6for targets 1 through 5, with the target numbers indicated above each arc (caused by thealpha sweep during the polar from –5° to 24°). The similarity of the displacement vectorsfor the 5 targets indicates rigid body motion. Targets 1 and 2 were located on the very rigidinboard portion of the main wing element where it is reasonable to assume no deformationbetween wind-off and wind-on. However significant displacements were recorded (eitherreal rigid-body displacements or an artifact of the measurement process) that must beremoved to properly determine the deformation of the shroud and TEF.
Several methods were investigated to eliminate or reduce the apparent displacement of theinboard targets from wind-off to wind-on. These methods included the subtraction ofinterpolated (from polynomial fits)X andZ values of just target 2. (Interpolation of wind-off data is necessary since the wind-on data may not be at the precise settings used for the

wind-off polar). A second method involved the use of a conformal transformation vianonlinear least squares using targets 1 and 2 from the wind-off polar (again from polynomialfits) as reference to yield a pitch correction angle and translations inX andZ. However, theangle computed using the conformal transformation was found to have errors in alpha thatwere 2 to 5 times larger than the estimated uncertainty of the precision servo accelerometerused to measure alpha. Thus a compromise was made and the means of the interpolateddisplacements inX and Z of targets 1 and 2 determined from the corresponding wind-offpolar were subtracted from the wind-on polar to arrive at the final displacement.
Displacement vectors for the run of figure 6 reduced in this manner are plotted in figure 7 atthe same scale as figure 6 for comparison. For figure 7, most of the apparent rigid body biasis removed, leaving the wind-off to wind-on deformation. The displacement vectors fortargets 1 and 2 on the inboard portion of the main element of the wing serve as a measure ofthe noise of the measurement process.
The displacement magnitude∆X was computed as
( ) ( ) ( )2
XXXXXXX 2o1o
non
−+−−−=∆ (1)
where n = 3,4 or 5 represents the target number on the shroud, fore TEF, and aft TEFrespectively,o represents interpolated wind-offX-values from the polynomial fit as afunction of model alpha, andX without a subscript representsX-data from the wind-onpolar. A similar expression applied for∆Z.
( ) ( ) ( )2
21 oonon
ZZZZZZZ
−+−−−=∆ (2)
The displacement magnitude inX andZ, denoted byLn, was then found from
( ) ( )22nnn ZXL ∆+∆= (3)
The angle,φn of the displacement vector was also computed as
∆∆= −
n
nn X
Z1tanφ (4)
The order of the signs of the∆X and the∆Z terms was used to determine the four quadrantinverse tangent with a range of± 180° (atan2[∆Z,∆X] function in MATLAB). With this signconvention, positive angles are found for displacements in the positiveZ-direction andnegative angles are found for displacements in the negativeZ-direction.
The change in gap, denoted by∆gap, due to aerodynamic loading is approximated by
( )αcos
43 ZZgap
∆−∆=∆ (5)

whereα is the geometric angle-of-attack of the semispan model. The approximation to thechange in gap can also be described in terms of the displacement magnitude and vectorangle as
( )α
φφcos
sinsin 4433 LLgap
−=∆ (6)
Likewise the change in overhang,∆OH, due to aerodynamic loading is approximated by
( )αcos
34 XXOH
∆−∆=∆ (7)
The corresponding relation in terms of the magnitude and angle of the displacement vectorfor the change in overhang is given by
( )α
φφcos
coscos 3344 LLOH
−=∆ (8)
REPRESENTATIVE DATAModel deformation measurements were not made throughout the test, but rather for selecteddata sets (~110 runs). All data were taken at Mach 0.2 in air mode at three dynamicpressures of 63.5, 170.9, and 347.5 psf, corresponding to total pressures of 16.2, 43.5, and88.2 psf. The total temperature was 95° F for all runs. The angle-of-attack range was from–5° to 24°. Wind-off reference polars were generally made at pressures of 16.2 and 88.2 psfat the beginning and end of a run series with the 16.2 psf pressure polar used to reduce the43.5 psf runs. The 43.5 psi runs are thus subject to more error compared to the otherpressures.
Displacement vectors for low-Q (63.5 psf) and high-Q (347.5 psf) runs are presented infigures 8 and 9 respectively. (The run presented in figure 9 is the same run used to illustratethe data reduction procedures in figures 6 and 7, but with an increased scale factor of 3.3×for the displacement.) For both figures the displacement vectors of targets 1 and 2 serve as ameasure of the noise level for the measurement process. For the low-Q run of figure 8 thedeformation (except for target 5 on the aft-TEF) is generally within the noise level of targets1 and 2. The increased displacements for the high-Q run are obvious, as well as an increasein the noise level. The aft-TEF is seen to generally deflect in a direction influenced by thedirection of the aerodynamic loading, with a net reduction in the flap angle. The shroudexperiences similar behavior, but with less magnitude and more relative data scatter. Thefore-TEF target number 4 actually appears to deflect toward the shroud, which would beconsistent with a rotation of the TEF in an upwards sense (+Z-direction) with the hinge linelocated below target 4.
The change in twist,θ2, (in degrees) due to aerodynamic loading at a normalized semispanof η = 0.75 is plotted versus alpha in figure 10 for each of three dynamic pressures. Thelow- and high-Q runs are the same runs as plotted in figures 8 and 9. Little directdependence on Q is noted and a relatively small amount of twist is indicated. Hence, it isassumed that the values shown in figure 10 are more indicative of the noise level for thetwist measurement and serve as an upper bound of the twist likely experienced at theη =

0.75 semispan station. Note that 0.05° scatter in the twist data corresponds to 0.0035-inchscatter in displacement for the targets, which are separated by 4 inches.
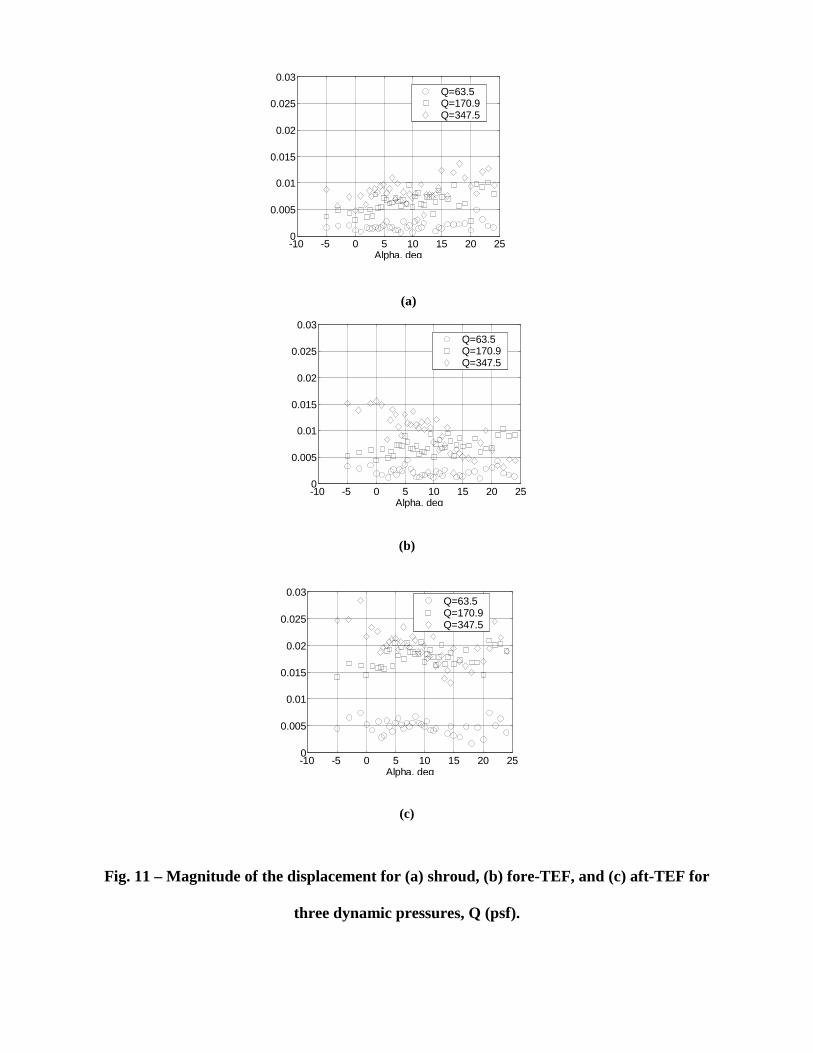
The magnitudes of the displacements,Ln, are plotted versus alpha in figure 11 for low,medium, and high-Q runs. The shroud displacement,L3, with the least magnitude of thedata plotted, has a definite dependence on the dynamic pressure. At the lowest Q (63.5 psf)the magnitude of the displacement of the shroud, figure 11 (a), is generally less than 0.003inch and probably represents the noise level of the measurement system for suchmeasurements. At the highest Q (347.5 psf), the magnitude of the displacement is generallyless than 0.01 inch except at high alpha. A similar behavior is noted for the fore-TEF target,figure 11 (b), except that the high-Q data tends to decrease with alpha. The aft-TEF data,figure 11 (c), exceeds considerably the shroud and fore-TEF data and shows littledependence on alpha. The magnitude of the displacement of the aft-TEF approaches 0.03inch for the high-Q run. The corresponding changes in gap and overhang are plotted versusalpha in figures 12 and 13 for the same low and high Q runs of figure 11.
Data for 15 configurations, during which model deformation measurements were made, aresummarized in figures 14 and 15. Mean values for all alphas are plotted versusconfiguration number, to yield a sense of the deformation for a large block of the data set.Data are presented for low, medium, and high-Q runs. The change in twist data,θ2, plottedin figure 14 indicates a noise level for aerodynamically induced twist of about 0.05°,showing little dependence on configuration. The displacement magnitude plots of figure 15show a clear dependence on Q, but little dependence on configuration.
UNCERTAINTYThe VMD measurement system resolution depends on the fraction of the image field that thetargets occupy. For cases in which the row of targets span nearly the entire image plane,resolution better than 0.01° is possible in the laboratory. Wind tunnel angle-of-attack testsusing body targets indicate that 0.01° resolution can be achieved during wind-off tests andmay be possible for wind-on tests, provided that the target row(s) occupy nearly the entireimage plane and if model translations while changing pitch are not excessive. However, thefraction of the image plane occupied by targets for the test described here is closer to 30% inorder to image all segments simultaneously, reducing the resolution considerably from whatis possible in a controlled laboratory situation. The targets are also displaced from thecenter of rotation, especially the aft TEF target, producing relatively large translations in theimage plane when pitching the model. The large translations and being located near theedge of the image plane make the measured target locations more susceptible to residualimage plane distortion. For similar reasons the displacement measurement precision for thistest is of the order of 0.003 inch compared to the 0.0001-inch precision that can be achievedduring controlled laboratory experiments.
A change from the standard procedures used for full-span models was implemented in whichthe tunnel alpha was used to determine the correction data from the wind-off curve fit ratherthan the reference inboard pitch angle determined from VMD measurements. For full-spanmodels, where the change in twist is the primary measurement and model dynamics cancorrupt the onboard accelerometer readings, it has been determined as best practice to usethe VMD measured reference angle (usually from targets on the fuselage) instead of tunnelalpha. However, for semispan testing the accelerometer is generally subjected to less

dynamic oscillations, reducing that potential error source. In addition, for situations inwhich spatial as well as angular data is required, it is advantageous to use the tunnel alpha asreference when the targets are displaced from the center of rotation of the model. In suchcases small errors in the reference angle may lead to errors in displacement that arecomparable to those due to deformation. For instance, for a target that is displaced from thecenter-of-rotation by 30 inches, an error of 0.01° causes as error of approximately 30 inches× 0.17 milliradians, or 0.005 inch in the displacement.
CONCLUDING REMARKSDuring this first use of the videogrammetric deformation measurement technique forsemispan component testing at the NTF, apparent rigid body motion between the wind-offand wind-on polars was larger than expected. Of the several methods investigated toalleviate this problem, a simple method of removing the mean displacement of the inboardmain-wing-element targets was adopted. As an overall summary, the deformation data werefound to be somewhat independent of configuration with little alpha dependence except forthe aft-TEF. The aerodynamically induced twist was found to be less than 0.1° overall,which is considered to be the noise floor of the optical measurements for the setup for thistest. The noise floor for displacement measurements was found to be about 0.003 inch. Thevideogrammetric model deformation measurement technique was determined to be aneffective way of determining component deformation, or at least to establish limits of thedeformation during semispan testing.
ACKOWLEDGEMENTSLuke A. Catella is acknowledged for his innovations in target layout and polished paintapplication. Harriett Dismond and Kenneth Cate are acknowledged for continuing supportin VMD installations, calibration, and operations. The operations and research staff at theNASA Langley NTF are acknowledged for assistance and support in the aeroelasticmeasurements phase of this test.
REFERENCES1) Burner, A. W., Snow, W. L., and Goad, W. K., “Model Deformation Measurements at aCryogenic Wind Tunnel Using Photogrammetry,” Instrumentation in the Aerospace Industry- vol. 31, 31st Instrumentation Society of America Symposium, San Diego, CA, May 1985,pp. 615-622.
2) Brooks, J. D. and Beamish, J. K., “Measurement of Model Aeroelastic Deformations inthe Wind Tunnel at Transonic Speeds Using Stereophotogrammetry”, NASA TP 1010, Oct.1977.
3) Burner, A. W. and Martinson, S. D., “Automated Wing Twist and Bending MeasurementsUnder Aerodynamic Load (Invited)”, AIAA Paper 96-2253, June 1996.
4) Liu, T., Radeztsky, R., Garg, S., and Cattafesta, L., “A Videogrametric ModelDeformation System and its Integration with Pressure Paint”, AIAA Paper 99-0568, Jan.1999.

5) Burner, A. W., “Model Deformation Measurements at NASA Langley Research Center”.AGARD CP-601 Symposium on Advanced Aerodynamic Measurement Technology, NATO,September 1997, Seattle, Washington, May, 1998, pp. 34-1 to 34-9.
6) Burner, A. W., Liu, T., Garg, S., Bell, J. H., Morgan, D. G., “Unified Model Deformationand Flow Transition Measurements”,Journal of Aircraft, Vol.36, No.5, Sept-Oct 1999, pp.898-901.
7) Hill, J. S., “National Transonic Facility”,Research and Technology Highlights,NASATM-4708, Dec 1995, pp. 122-123.
8) Ghee, T.A., Taylor, N.J., “Low Speed Wind Tunnel Tests on a Diamond Wing High-LiftConfiguration”, AIAA-2000-4507, August 2000.
9) Williams, Louis J., “Laminar Flow Aircraft Certification”, NASA CP-2413, May 1986.

FIGURE CAPTIONS
Fig. 1. Sketch illustrating shroud, trailing-edge-flap (TEF), gap, and overhang (OH).
Fig. 2 - Sketch of Diamond Wing High Lift Model (top view)
Fig. 3 – Model and targets viewed from camera.
Fig. 4 – View from data camera with 3-stepped plate positioned for determiningcamera calibration parameters.
Fig. 5 – View from data camera with 3-stepped plate positioned for determiningcamera orientation in test section coordinate system.
Fig. 6 - Vector displacements from wind-off to wind-on for a high-Q run withoutcompensation. Target numbers are indicated.
Fig. 7 - Vector displacements from wind-off to wind-on for a high-Q run withcompensation. Target numbers are indicated.
Fig. 8 - Vector displacements from wind-off to wind-on for a low-Q run (63.5 psf).Target numbers are indicated.
Fig. 9 - Vector displacements from wind-off to wind-on for a high-Q run (347.5 psf).Target numbers are indicated.
Fig. 10 Aerodynamically induced twist,θθθθ2, for three dynamic pressures, Q (psf).
Fig. 11 – Magnitude of the displacement for (a) shroud, (b) fore-TEF, and (c) aft-TEFfor three dynamic pressures, Q (psf).
Fig. 12 Change in gap induced by Aerodynamic loading for low and high dynamicpressure, Q (psf), versus alpha.
Fig. 13 Change in overhang induced by Aerodynamic loading for low and highdynamic pressure, Q (psf), versus alpha.
Fig. 14 Aerodynamically induced twist,θθθθ2, for three dynamic pressures, Q (psf), versusconfiguration number.
Fig. 15 – Magnitude of the displacement for (a) shroud, (b) fore-TEF, and (c) aft-TEFfor three dynamic pressures, Q (psf) versus configuration number.
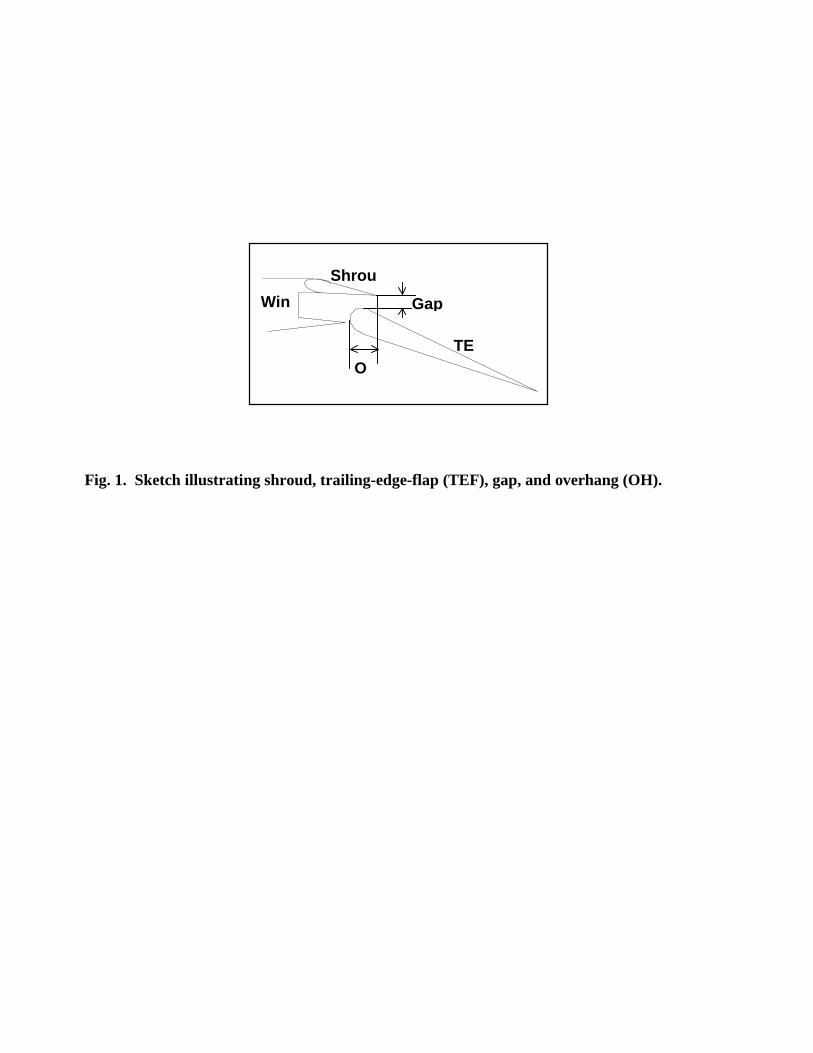
Fig. 1. Sketch illustrating shroud, trailing-edge-flap (TEF), gap, and overhang (OH).
Gap
O
Win
Shrou
TE

Fig. 2 - Sketch of Diamond Wing High Lift Model (top view)
TEF
ShrouFuselage
Stand off with labyrinth
LE

Fig. 3 – Model and targets viewed from camera.
1 2 3 45
6 7
X
Z
Flow
aft-TEF
fore-TEF
shroud
ηηηη = 0.75
Inboard reference

Fig. 4 – View from data camera with 3-stepped plate positioned for determining
camera calibration parameters.

Fig. 5 – View from data camera with 3-stepped plate positioned for determining
camera orientation in test section coordinate system.

Fig. 6 - Vector displacements from wind-off to wind-on for a high-Q run without
compensation. Target numbers are indicated.
-15 -10 -5 0 5 10-20
-15
-10
-5
0
5
0.1 inch
1 2 3 4 5
X, inch
Z,inch

Fig. 7 - Vector displacements from wind-off to wind-on for a high-Q run with
compensation. Target numbers are indicated.
-15 -10 -5 0 5 10-20
-15
-10
-5
0
5
0.1 inch
1 2 3 4 5
X, inch
Z,inch

Fig. 8 - Vector displacements from wind-off to wind-on for a low-Q run (63.5 psf).
Target numbers are indicated.
-15 -10 -5 0 5 10-20
-15
-10
-5
0
5
0.03 inch
1 2 3 4 5
X, inch
Z,inch

Fig. 9 - Vector displacements from wind-off to wind-on for a high-Q run (347.5 psf).
Target numbers are indicated.
-15 -10 -5 0 5 10-20
-15
-10
-5
0
5
0.03 inch
1 2 3 4 5
X, inch
Z,inch

Fig. 10 Aerodynamically induced twist,θθθθ2, for three dynamic pressures, Q (psf).
-10 0 10 20 30-0.2
-0.15
-0.1
-0.05
0
0.05
0.1
0.15
Alpha, deg
2
Q=63.5Q=170.9Q=347.5
(a)
(b)
(c)
Fig. 11 – Magnitude of the displacement for (a) shroud, (b) fore-TEF, and (c) aft-TEF for
three dynamic pressures, Q (psf).
-10 -5 0 5 10 15 20 250
0.005
0.01
0.015
0.02
0.025
0.03
Alpha, deg
Q=63.5Q=170.9Q=347.5
-10 -5 0 5 10 15 20 250
0.005
0.01
0.015
0.02
0.025
0.03
Alpha, deg
Q=63.5Q=170.9Q=347.5
-10 -5 0 5 10 15 20 250
0.005
0.01
0.015
0.02
0.025
0.03
Alpha, deg
Q=63.5Q=170.9Q=347.5

27
Fig. 12 Change in gap induced by Aerodynamic loading for low and high dynamic
pressure, Q (psf), versus alpha.
-5 0 5 10 15 20 25-0.01
-0.005
0
0.005
0.01
0.015
Alpha, deg
Q=63.5Q=347.5

28
Fig. 13 Change in overhang induced by Aerodynamic loading for low and high dynamic
pressure, Q (psf), versus alpha.
-5 0 5 10 15 20 25-0.01
-0.005
0
0.005
0.01
0.015
Alpha, deg
Q=63.5Q=347.5

29
Fig. 14 Aerodynamically induced twist,θθθθ2, for three dynamic pressures, Q (psf), versus
configuration number.
0 5 10 15-0.2
-0.1
0
0.1
0.2
Configuration
Theta
2,deg
Q=63.5Q=170.9Q=347.5

30
(a)
(b)
(c)
Fig. 15 – Magnitude of the displacement for (a) shroud, (b) fore-TEF, and (c) aft-TEF for
three dynamic pressures, Q (psf) versus configuration number.
0 5 10 150
0.005
0.01
0.015
0.02
0.025
0.03
Configuration
Q=63.5Q=170.9Q=347.5
0 5 10 150
0.005
0.01
0.015
0.02
0.025
0.03
Configuration
Q=63.5Q=170.9Q=347.5
0 5 10 150
0.005
0.01
0.015
0.02
0.025
0.03
Configuration