Fatigue & Damage Tolerance Composite Material Evaluation of structures


iii
CONVERSION FACTORS(Approximate conversions to metric
measures)To convert from to Function Value
LENGTHinches meters divide 39.3701inches millimeters multiply by 25.4000feet meters divide by 3.2808VOLUMEcubic feet cubic meters divide by 35.3149cubic inches cubic meters divide by 61,024SECTION MODULUSinches2 feet centimeters2 meters multiply by 1.9665inches2 feet centimeters3 multiply by 196.6448inches3 centimeters3 multiply by 16.3871MOMENT OF INERTIAinches2 feet2 centimeters2 meters divide by 1.6684inches2 feet2 centimeters4 multiply by 5993.73inches4 centimeters4 multiply by 41.623FORCE OR MASSlong tons tonne multiply by 1.0160long tons kilograms multiply by 1016.047pounds tonnes divide by 2204.62pounds kilograms divide by 2.2046pounds Newtons multiply by 4.4482PRESSURE OR STRESSpounds/inch2 Newtons/meter2 (Pascals) multiply by 6894.757kilo pounds/inch2 mega Newtons/meter2 multiply by 6.8947
(mega Pascals)BENDING OR TORQUEfoot tons meter tonnes divide by 3.2291foot pounds kilogram meters divide by 7.23285foot pounds Newton meters multiply by 1.35582ENERGYfoot pounds Joules multiply by 1.355826STRESS INTENSITYkilo pound/inch2 in√in) mega Newton MNm3/2 multiply by 1.0998J-INTEGRALkilo pound/inch Joules/mm2 multiply by 0.1753kilo pound/inch kilo Joules/m2 multiply by 175.3

v
Table of Contents
1. Introduction ............................................................................................................................. 31.1 Fatigue and Damage Tolerance Analysis Background ....................................................... 31.2 Objectives............................................................................................................................ 61.3 Why Aluminum?................................................................................................................. 71.4 Welding of Aluminum ........................................................................................................ 81.5 Summary of Report ............................................................................................................. 91.6 Conclusions ....................................................................................................................... 111.7 References ......................................................................................................................... 12
2. Prediction of Loads on High Speed Craft ............................................................................. 152.1 Introduction ....................................................................................................................... 152.2 Definition of High Speed for High-Speed Craft ............................................................... 152.3 Definition of Primary and Secondary Loads..................................................................... 162.4 Loads Acting on High-Speed vice Displacement Vessels ................................................ 17
2.4.1 Increasing Length of High-Speed Craft .................................................................... 192.5 Loading for Fatigue and Damage Tolerance..................................................................... 202.6 Loads and Stresses ............................................................................................................ 202.7 Load Development Procedures in DNV High-Speed Craft Rules .................................... 212.8 General Comment on Loads.............................................................................................. 222.9 Global Load & Stress Prediction Methodology ................................................................ 232.10 Derivation of the Load and Stress Transfer Functions...................................................... 27
2.10.1 Spectral Method Load and Stress Transfer Functions .............................................. 282.10.2 Hydrodynamic Model to Develop Load Transfer Functions .................................... 292.10.3 Structural Model to Develop Stress Coefficients...................................................... 302.10.4 Calculation of Short Term Response ........................................................................ 32
2.10.4.1 Sea/Wave Spectrum .......................................................................................... 332.10.4.2 Scatter Diagrams ............................................................................................... 342.10.4.3 Transform from Stationary to Moving Reference............................................. 352.10.4.4 Calculation of Short-term Stress Range Distribution........................................ 362.10.4.5 Long Term Response ........................................................................................ 37
2.10.5 Extreme Loads, Long-term Response and Damage Tolerance ................................. 382.11 The Alternative Method – Fatigue Assessment Using Measured Loads .......................... 382.12 References ......................................................................................................................... 39
3. Fatigue................................................................................................................................... 413.1 Development of the Fatigue Database .............................................................................. 413.2 Brief History of Fatigue .................................................................................................... 433.3 The Fatigue Environment.................................................................................................. 44
3.3.1 Effects of Seawater on Fatigue of Aluminum........................................................... 473.4 Fatigue Aspects of Aluminum........................................................................................... 48
3.4.1 Mean Stress Effect and Stress Ratio in Steel and Aluminum ................................... 483.4.2 The Effect of Alloy on Aluminum Fatigue Behavior ............................................... 513.4.3 The Strength of Welded and Unwelded Aluminum Specimens ............................... 54
3.5 Defining the Fatigue Related Problem for High-Speed Craft ........................................... 553.6 The Fatigue Crack ............................................................................................................. 56
3.6.1 Crack Initiation.......................................................................................................... 58

vi
3.6.2 Crack Propagation ..................................................................................................... 593.6.3 Critical Crack Length or Failure ............................................................................... 61
3.7 Safe-Life and Fail-Safe Definitions and Design Philosophies.......................................... 623.7.1 The Safe-Life Design ................................................................................................ 633.7.2 Fail-Safe Design and Damage Tolerance Analysis................................................... 64
3.7.2.1 Brief Example of Safe-Life & Fail-Safe Designs ................................................. 643.8 Welding and the Introduction of Crack Initiation Sites .................................................... 66
3.8.1 Residual Stresses ....................................................................................................... 673.8.2 Welding Imperfections.............................................................................................. 683.8.3 Stress Concentrations ................................................................................................ 683.8.4 Crack Initiation Sites in Steel and Aluminum........................................................... 693.8.5 Repair Welds in Aluminum Details .......................................................................... 70
3.9 New Aluminum Alloys and Welding Techniques for High-Speed Craft ......................... 703.9.1 New Marine Grade Aluminum Alloy, Grade 5383................................................... 70
3.9.1.1 Fatigue Strength of 5383 ....................................................................................... 723.9.2 New Marine Grade Aluminum Alloy, Grade RA7108 ............................................. 743.9.3 New Marine Grade Aluminum Alloy 5059............................................................... 763.9.4 Friction Stir Welding................................................................................................. 77
3.10 References ......................................................................................................................... 794. Fatigue Design of High Speed Aluminum Craft ................................................................... 81
4.1 Palmgren-Miner Cumulative Damage Fatigue Assessment.............................................. 824.2 Determine the Details to be Analyzed............................................................................... 844.3 Development of the Loading History................................................................................ 86
4.3.1 Effect of Vessel Length and Speed on Loading History of High-Speed Craft ......... 874.3.2 Probability Distributions used for Vessel Loading History ...................................... 894.3.3 Rainflow and Reservoir Cycle Counting Methods ................................................... 904.3.4 Rainflow Cycle Counting Method ............................................................................ 914.3.5 Reservoir Cycle Counting Method............................................................................ 91
4.4 Development of the Stress Histogram............................................................................... 924.4.1 Stress Histogram Development using the Spectral Analysis Method....................... 93
4.5 Stress Calculations & Stress Concentrations .................................................................... 954.5.1 Design Stress in the Industry Codes.......................................................................... 954.5.2 Further Discussion on Stresses.................................................................................. 96
4.5.2.1 Nominal Stresses Acting in a Structure................................................................. 974.5.2.2 Structural Stresses ................................................................................................. 984.5.2.3 Hot-Spot Stresses ................................................................................................ 1004.5.2.4 Notch Stresses ..................................................................................................... 1004.5.2.5 The Effects of Welding on Stress........................................................................ 1014.5.2.6 Fabrication Flaws and Their Impact to Nominal Stresses................................... 102
4.6 Determine the Appropriate S/N Curve............................................................................ 1034.6.1 Procedure................................................................................................................. 104
4.7 The Alternative Stress Histogram Method...................................................................... 1124.8 References ....................................................................................................................... 113
5. DNV and Other Industry Fatigue Analysis Standards ........................................................ 1155.1 DNV Fatigue Analysis of High-Speed Craft, Classification Notes 30.9 ........................ 1165.2 Other Industry Standards to Assist the Maritime Designer............................................. 118

vii
5.2.1 Release From Liability ............................................................................................ 1195.3 The Aluminum Association ............................................................................................ 119
5.3.1 Constant Amplitude Loading in the Aluminum Design Manual ............................ 1215.3.2 Variable Amplitude Loading in Aluminum Design Manual................................... 121
5.4 European Committee for Standardization (CEN) ........................................................... 1245.4.1 Fatigue Design Philosophy in EuroCode 9 ............................................................. 1255.4.2 Damage Tolerance Data and EuroCode 9 ............................................................... 126
5.5 Association of American Railroads................................................................................. 1265.5.1 Modified Goodman Diagram .................................................................................. 1285.5.2 Stress Analysis Using AAR Design Manual........................................................... 128
5.6 Other Industry Design Codes .......................................................................................... 1295.7 References ....................................................................................................................... 129
6. Fatigue Cracking and Damage Tolerance Analysis ............................................................ 1316.1 Damage Tolerance Analysis............................................................................................ 1316.2 Fatigue Crack Growth Rate Analysis.............................................................................. 131
6.2.1 Fatigue Crack Growth Rate and Aluminum High-Speed Craft .............................. 1356.3 Fracture Mechanics and Critical Crack Size ................................................................... 1376.4 Failure Modes Associated with Fracture Mechanics ...................................................... 1416.5 Fatigue Crack Growth Rate and Fracture Data ............................................................... 1436.6 Fatigue and Fracture Software ........................................................................................ 1446.7 Conclusions ..................................................................................................................... 1466.8 References ....................................................................................................................... 151
7. Recommendations for Continued Research ........................................................................ 1537.1 Environmental Loading for Fatigue Analysis ................................................................. 1557.2 S/N Curves for Fatigue Analysis..................................................................................... 1557.3 Crack Growth Rate Data for Aluminum Alloys.............................................................. 156
7.3.1 Loading and Strain Rate Data for Damage Tolerance Analysis ............................. 1577.4 Fracture Toughness Criteria ............................................................................................ 1577.5 Fatigue and Fracture Software for Damage Tolerance Analysis .................................... 1577.6 Program to Gather the Necessary Data to Fill Gaps Identified Above ........................... 1587.7 Detail Improvement Techniques ..................................................................................... 1607.8 Variation on the Safe-Life Design Philosophy ............................................................... 1627.9 Conclusion....................................................................................................................... 1637.10 References ....................................................................................................................... 163
List of AppendicesAppendix A Fatigue and Damage Tolerance Database
Appendix B Excerpts from Aluminum Design Manual
Appendix C Excerpts from EuroCode 9
Appendix D Excerpts from Standards and Recommended Practices Section C – Part II
from the Association of American Railroads
Appendix E S/N curves for selected fatigue specimens.
Appendix F List of Contacts

viii
List of FiguresFigure 1-1 S/N curve for welded 6061-T6 Aluminum beam in bending ........................................ 5Figure 1-2 Annual Cost of Aluminum ........................................................................................... 9Figure 2-1 Flow Chart For Load Prediction................................................................................. 24Figure 2-2 Critical areas for fatigue consideration of high-speed catamarans.............................. 27Figure 2-3 Speed/Wave Height Restriction Curve for High-Speed Craft..................................... 29Figure 2-4. A schematic description of a sea spectrum................................................................ 34Figure 3-1 Typical Small Specimen Geometry............................................................................ 43Figure 3-2 Range of Variations in the Stress Ratio, R. ................................................................ 45Figure 3-3 Typical S/N Diagram For Steel .................................................................................. 46Figure 3-4 Long Life Fatigue for Aluminum............................................................................... 46Figure 3-5 Effect of Seawater on Aluminum Fatigue Tests......................................................... 47Figure 3-6 Effect of Stress Ratio on Fatigue Life of Aluminum ................................................. 50Figure 3-7 Effects of Stress Ratio on 5154-H34 Aluminum........................................................ 51Figure 3-8 Axially Loaded, Transverse Butt-Welded 3/8 inch Aluminum Plate.......................... 52Figure 3-9 Axially Loaded, Transverse Butt-Welded 3/8 inch Aluminum Plate.......................... 52Figure 3-10 The Effect of Alloy on the Fatigue Life of Aluminum ............................................ 53Figure 3-11 Typical Crack Initiation Sites................................................................................... 57Figure 3-12 Fatigue Crack at Cover Plate Detail ......................................................................... 58Figure 3-13 Schematic of crack-tip plasticity in test specimen and structure.............................. 59Figure 3-14 Typical Fatigue Crack Growth Rate, FCGR Curve.................................................. 60Figure 3-15 Actual FCGR data for various aluminum alloys in a benign environment. ............. 61Figure 3-16 Schematic Representation of Fatigue Life to Service Life....................................... 66Figure 3-17 Residual Stresses For Butt-Welded Plate ................................................................. 67Figure 3-18 Potential WeldFlaws as a Result of Improper Welding ........................................... 68Figure 3-19 Stress Concentration Locations In Typical Welded Joints....................................... 69Figure 3-20 Small Specimen for 5383 Fatigue Tests................................................................... 73Figure 3-21 Fatigue Tests on 5083 and 5383 conducted at laboratory ........................................ 73Figure 3-22 Fatigue Tests on 5083 and 5383 details built at shipyard ........................................ 74Figure 3-23 Comparison of Material Strength for 5083, 5383 and 5059...................................... 76Figure 3-24 Comparison of 5083 and 5059 S/N Curves.............................................................. 77Figure 3-25 Schematic of Friction Stir Welding Operation.......................................................... 78Figure 4-1 Stress histogram reproduced from Figure 6.7 of SSC 318......................................... 83Figure 4-2 Typical Problem Areas On A SWATH...................................................................... 85Figure 4-3 Constant Amplitude Curve ......................................................................................... 87Figure 4-4 Rainflow Cycle Counting ........................................................................................... 91Figure 4-5 Procedure for Conducting The Reservoir Cycle Counting Method ........................... 92Figure 4-6 Geometric Stress Concentration Profiles.................................................................... 99Figure 4-7 Local Stress Concentrations Due to Service and Residual Stresses.......................... 100Figure 4-8 Local Stress Concentrations in Fillet Weld .............................................................. 102Figure 4-9 Typical Misalignment Problems During Fabrication ............................................... 103Figure 4-10 Typical Construction Details .................................................................................. 106Figure 4-11 Typical Small Specimen Fatigue Samples ............................................................. 108Figure 4-12 Detail 26 – Bulb Stiffener/Deep Frame Connection – Bending In Air. ................. 109Figure 4-13 Detail 27 – Box Stiffener/Deep Frame Connection – Bending In Air. .................. 109Figure 4-14 Detail 28 Box Stiffener/Deep Frame Connection – Bending In Air. ..................... 110

ix
Figure 5-1 Copy of Figure 4.8.1-1 From the Aluminum Design Manual.................................. 123Figure 5-2 Copy of Modified Goodman Diagram from AAR ................................................... 128Figure 6-1 Relative Size of Plastic Zone at Crack Tip............................................................... 132Figure 6-2 Typical FCGR Curve................................................................................................ 133Figure 6-3 Schematic Diagram of Multi-Linear Segments of da/dN for Aluminum.................. 134Figure 6-4 Polygonal da/dN curve for aluminum ....................................................................... 135Figure 6-5 Peak Overload in Constant Amplitude Field............................................................ 136Figure 6-6 Crack Retardation as a Result of Peak Overload...................................................... 136Figure 6-7 Crack Length and Thickness in Typical Specimen ................................................... 138Figure 6-8 Typical Failure Assessment Diagram, FAD............................................................. 140Figure 6-9 Material Specific FAD ............................................................................................. 141Figure 6-10 Three Modes of Loading for Crack Propagation.................................................... 142

x
List of TablesTable 1–1 Commonly used Marine Grade Alloys .......................................................................... 4Table 1–2 Composition of Aluminum Alloys and Their Heat Treatment ..................................... 8Table 2–1 DNV Service Restrictions for High-speed Craft......................................................... 29Table 2–2 Typical Scatter Diagram From DNV HSLC Rules..................................................... 35Table 3–1 Strength of Aluminum Alloys from US Navy Structural Design Manual .................. 55Table 3–2 Mechanical Properties of 5083 and 5383 Alloys ........................................................ 71Table 3–3 Welded Properties for Alloys 5083 and 5383 ............................................................. 72Table 3–4 Design Properties for DNV Aluminum Alloys........................................................... 74Table 3–5 Allowable Stresses for DNV Alloys ........................................................................... 75Table 3–6 Weld Strengths of Aluminum Alloys.......................................................................... 75Table 4–1 Information for use in the fatigue analysis. S/N diagrams are in Appendix E......... 111Table 5–1 Copy of Table 4.8.1-1 From the Aluminum Design Manual. ................................... 123Table 6–1 Summary of Design and Material Property Data Required for Crack Growth and
Fracture Mechanics Analyses.............................................................................................. 148Table 6–2 Number of Data Points From Published Literature for Material Properties Necessary
to Conduct Aluminum Damage Tolerance Analyses (1) .................................................... 149Table 6–3 Preliminary Summary of Fatigue and Fracture Software ......................................... 150
List of Acronyms and Definitions
AA Aluminum Association
AAR Association of American Railroads
ABS American Bureau of Shipping
CEN Comit Europ en De Normalisation (European Committee For Standardization)
DNV Det Norske Veritas
HAZ Heat Affected Zone
∆ Displacement of vessel
∆σ Stress range
η Fatigue usage factor for Palmgren-Miner summation
σa Stress amplitude
σm Mean stress or membrane stress
σmin The minimum stress occurring in a stress range
σmax The maximum stress occurring in a stress range
υ Zero crossing frequency or Poisson’s ratio
ω Wave frequency

xi
ωe Wave encounter frequency
θ Angle of attack between ship and wave
a crack length or one-half crack length depending on definition
da/dN Crack growth rate per cycle of loading
f(σa) Long term response of the stress amplitude
f* Probability density function for short term stress response
g acceleration due to gravity
k Number of stress blocks or ranges for use in the Palmgren-Miner summation
m Experimentally determined material constant for linear region of da/dN vice ∆K crack
growth curve
m moment associated with a sea state spectrum
n* Average number of responses per unit time for short term response
ni number of stress cycles in block i for Palmgren-Miner summation
px weighting factors for various sea states
rx weighting function for crossing rates
ry Crack tip plastic zone size
Ax Stress function per unit load application for spectral analysis
B Specimen thickness
C Experimentally determined material constant for linear region of da/dN vice ∆K crack
growth curve
CTOD Crack Tip Opening Dimension used in fracture mechanics
D Accumulated fatigue damage in Palmgren-Miner summation
Fb Allowable working stress
Fm Ultimate tensile strength of the material
Fy Yield strength of the material
F∆σ Short term and long term stress range distribution
Hs Significant wave height
Hx Transfer functions for spectral analysis
K Crack tip stress intensity
KI Crack tip stress intensity for Mode I failure
∆K Range of crack tip stress intensity experienced during fatigue cycling

xii
Kx Stress concentration or notch factors
L Length of vessel
N The number of cycles associated with a fatigue spectrum
Ni Number of cycles to failure in stress block i for Palmgren-Miner summation
R Stress ratio of σmin/σmax
S The stress associated with a fatigue spectrum
Sη Sea state
Sσ Stress spectrum associated with a given sea state
Tz Zero crossing period
V Speed of vessel
Y Geometric factor used to calculate the crack tip stress intensity factor, K
1
Executive SummaryThis report provides an initial data gathering effort for the fatigue and damage tolerance
analyses of aluminum weldments in high-speed craft. It has confirmed that there are gaps in the
data required to perform these analyses and recommends actions to help alleviate these gaps,
including further research and testing.
To help designers of high-speed craft, this report also presents a number of fatigue design
standards. This includes a proposed standard to be released later this year by DNV as well as
three standards from other industries. Although not consistent with the maritime industry, these
other standards provide good insight to the problem of fatigue and how to account for its action
during the initial design stages.
For the damage tolerance analysis, this report recommends material testing to generate
the necessary fatigue crack growth rate and other data. Testing is also recommended to
determine the most suitable fracture-toughness criteria for the marine grade aluminum alloys. In
addition, this report provides a preliminary comparison of available fatigue/fracture software
packages and proposes a program to evaluate the packages and identify those most suitable for
the subject application.
3
1. Introduction
1.1 Fatigue and Damage Tolerance Analysis Background
This report addresses fatigue and damage tolerance analysis requirements for weldments
in high-speed aluminum vessels. Specifically, it discusses the availability of design information
and material property data required for these analyses. These issues have been addressed at
length for the steels used in traditional monohulls and for high-strength aerospace aluminum
alloys, but not to the same degree for the marine grade aluminum alloys being used in high-speed
vessels. Some of the typical alloys used by the subject industry are listed in Table 1–1, [1-1].
The term "fatigue design" in this report refers to the evaluations conducted during ship
design to prevent fatigue crack initiation in structural members. Such cracks typically initiate
under normal cyclic loads at stress concentrations such as changes in geometry (e.g., notches,
corners, weld toes, brackets, cutouts, etc.) or weld discontinuities (e.g., porosity, slag inclusions,
microcracks). Determination of allowable fatigue stresses is accomplished through use of
design fatigue curves (S/N curves) an example of which is shown in Figure 1-1, [1-2]. This
figure illustrates the point that the S/N region of primary concern covers moderate to high
number of cycles. The nominal stresses associated with these cycles are governed by the
allowable design stresses, i.e., the long-term damaging fatigue cycles occur under the action of
nominal stresses that satisfy the allowable stress design algorithms associated with most design
codes. Although the nominal stresses are elastic, fatigue damage results from cyclic plastic
deformation at the roots of stress concentrations or crack tips. This plasticity is not specifically
considered in S-N or nominal stress fatigue analysis, but must be addressed in certain cases for
damage tolerance analysis as discussed below. The S-N curves should be based on axial or
bending fatigue tests of welded details rather than rotating beam tests of smooth or notched
specimens. The axial or bending tests better simulate actual loading, and testing of a welded
detail includes the base metal, weld metal, weld defects, and base metal heat-affected-zone
(HAZ) as well as geometrical stress concentration and residual stress effects. Primary test
variables are the R ratio (ratio of minimum to maximum fatigue stress), test frequency (Hz), and
environment (air, seawater spray, seawater immersion or temperature).

4
If the design shows that fatigue cracks may initiate at certain details and it is not
practicable to modify the detail, damage tolerance analysis, using fracture mechanics techniques,
is used to determine the time for first inspection of the detail. This will allow corrective action
(removal from service or weld repair) to be taken before the crack reaches a critical size. Growth
of the crack to critical size could cause brittle fracture, ductile tearing, large-scale
yielding/overload failure, or buckling. Discussion is presented regarding the determination of
critical crack size and failure criterion and its dependence on the specific detail and application
being evaluated. If structural cracks are found during service, these same techniques can be used
to assess the suitability of the cracked structure for continued service and the interval for the next
inspection. It should be noted that field weld repair of cracks may not necessarily extend service
life because new fatigue cracks may initiate from weld defects, and crack growth rates may
increase from the presence of weld residual stresses [1-3]. Thus, damage tolerance analysis will
be beneficial if it shows a cracked detail is suitable for continued service in which case repairs
can be delayed until they can be made under more controlled conditions.
Form Grade and Temper Typical YieldStrength (ksi)
Typical TensileStrength (ksi)
Plate 5083-H116 33.4 45.7
5086-H116 29.7 42.1
5454-H34 34.8 44.2
5456-H116 37.0 50.8
6061-T6, T651(also shapes and tube)
39.9 45.0
Extrudedshapes
5086-H111 or H112(also tube)
18.9(H112)
39.2(H112)
5454-H111 - H112
26.118.1
37.736.3
5456-H111 or H112 23.9(H112)
45.0(H112)
Tubing 5086-H34 37.0
Table 1–1 Commonly used Marine Grade Alloys
5
Figure 1-1 S/N curve for welded 6061-T6 Aluminum beam in bending
Example of design allowable curveconstructed by applying appropriate safetyfactors to fatigue test data.Each combination of stress range andnumber of cycles m7ust be below this curve.
Base metalyield
strength 285N/mm2
Estimatedminimumweld metaland HAZ
yieldstrength 150
N/mm2

6
1.2 Objectives
In accordance with the Statement of Work for this task, the objectives of this report are
threefold:
1. Assist the designers and fabricators of high-speed vessels by providing information on the
fatigue of commercial aluminum structural details.
2. Develop database fatigue design criteria for both the design and damage tolerance analysis of
welded aluminum ship structures.
3. Enhance the durability, reliability, efficiency and safety of aluminum structures. Assist in the
growth of the high-speed ship industry in North America, helping to produce ships that will
be structurally reliable but have low hull weight.
The authors of this report also felt that it is a good platform for the dissemination of some
fundamental information regarding the concepts of fatigue, fracture mechanics and damage
tolerance. Fatigue cracks have typically been viewed as a maintenance problem and the issue of
fatigue was not addressed during the design cycle. It is only during recent history that the
concepts of fatigue and fatigue avoidance have entered the design phase of surface ships. This
has been promulgated by the increasing number of structural fatigue cracks in large displacement
monohull vessels classed for open-ocean, unrestricted service. As a result the designers of these
vessels have begun to develop fluency with the concepts of fatigue, fatigue avoidance, damage
tolerance and related issues. As these problems continue to escalate in the high-speed
community the authors thought it would be important to introduce the concepts behind fatigue as
well as the desire to address this problem during the design phase of these vessels.
A literature survey was conducted to help determine the state-of-the-art of information
regarding both fatigue and damage tolerance analysis of aluminum. As a result of this survey
and other information gathered during the task, it became apparent that there are gaps in the
information required to perform these analyses. Identifying these gaps and a program to gather
or develop the necessary data is also included in this report. The gaps in the data required to
perform the fatigue and damage tolerance analyses preclude the development of a meaningful
database for use in these analyses. Therefore, discussion and samples are provided of similar
data and procedures used by other industries. It is suggested that a true database for aluminum
high-speed craft can be developed after the appropriate data has been developed for this specific
application.

7
In addition to the information provided for the designers to assist in the fatigue and
damage tolerance analysis this report also presents a variety of ideas for use by fabricators to
help extend or improve the fatigue life of a detail thereby enhancing the service life of the vessel.
These suggestions include the investigation of new aluminum alloys specifically developed for
the marine environment.
As discussed in the third objective, it was the intention of this project to assist in the
growth of the high-speed craft industry. Much of the research focused on high-speed ferries due
to their emergence in the market place and the fatigue related problems that these craft have been
experiencing. Regardless, the information presented herein is of a general nature and should be
adaptable to a wide range of applications. This information should provide designers insight into
the fatigue problem and allow them a variety of alternatives for fatigue and damage tolerance
analysis associated with aluminum high-speed craft.
It is also worth recognizing that the focus of this document is towards the designer and
fabricator, i.e., the primary objective is for implementation of fatigue and damage tolerance into
the design and build processes. This helped to streamline the report in a direction that would
satisfy this goal without extraneous technical derivation which, it was felt, often hinders the use
of such a document intended for use during the design process.
1.3 Why Aluminum?
In terms of tonnage, steel is used for a far greater percentage of the maritime vessels than
aluminum. Steel is cheaper than aluminum, more forgiving to production, fabrication and
welding induced flaws and more tolerant to damage. In addition, steel is stronger than aluminum
and does not lose any of its strength in the Heat Affected Zone of the weldment, as does
aluminum. The interest in aluminum is directly related to the marketplace addressed by this
report, i.e., the high-speed craft market.
To satisfy the “need for speed” in this market owners seek every advantage to minimize a
vessel’s weight which is precisely the advantage that aluminum brings to the high-speed craft
industry, reduced weight. Aluminum has approximately one-third the density of steel and 70%
of its tensile strength. This allows for the production of aluminum high-speed craft with a lower
structural weight than a similar vessel constructed from steel. For a given displacement, the

8
reduction of hull structural weight allows for increased payload, typically fare-paying passengers
in the high-speed ferry industry.
Aluminum has been used in the shipbuilding and marine industries for over 40 years and
in recent history its use for high-speed ferries has been on the rise. As the speed and
displacement of these vessels continues to grow, so too do the fatigue problems related to the
aluminum details.
In accordance with Figure 1-2 [1-4] it can also be seen that the cost of aluminum has
come down significantly from the late 1980’s and early 1990’s when there was a sharp spike in
its cost to approximately $1.10 per pound. In 1998, the latest year for available data, the price of
aluminum was approximately $0.63 per pound. This reduction in price for aluminum makes a
more attractive hull girder material when combined with the market forces for “higher speeds,
larger vessels and decreased hull structural weight.”
1.4 Welding of Aluminum
Wrought aluminum alloys, as shown in Table 1–2 [1-5], are either non-heat-treatable or
heat-treatable. The non-heat-treatable alloys are solution-strengthened, primarily, by
magnesium. These alloys are work-hardenable but can be annealed. The weld heat-affected
zone (HAZ) will have the strength of the annealed alloy.
The heat-treatable alloys are strengthened through solution heat-treating, i.e.;
precipitation hardening followed by either natural or artificial aging. The solution-strengthening
agent may be magnesium, copper, zinc, or silicon. Welding will overage the heat-treated
material in the HAZ and the HAZ will be softened significantly.
Table 1–2 Composition of Aluminum Alloys and Their Heat Treatment
SeriesWrought AluminumAlloy Group Non-heat-treatable Heat-treatable
Aluminum 1xxxAluminum + Copper 2xxxAluminum + Manganese 3xxxAluminum + Silicon (Si) 4xxxAluminum + Magnesium (Mg) 5xxxAluminum + Mg + Si 6xxxAluminum + Zinc 7xxx

9
The acceptable fusion welding processes for wrought aluminum alloys include gas metal
arc, gas tungsten arc, and resistance (spot and seam). Shielded metal arc and gas welding are
used only when quality is not essential. Submerged arc welding is never used. High welding
speeds are preferred to restrict heat input and reduce the width of the HAZ. Effect of heat
increases with thickness. Oxidation of aluminum is one of the major problems in obtaining a
sound weld. Aluminum-oxide films must be removed before welding.
Figure 1-2 Annual Cost of Aluminum
1.5 Summary of Report
This report is organized to follow the same progression as typically envisioned for the
fatigue and damage tolerance phenomenon, i.e., discussion on loading, which is a central issue
for both, precedes fatigue which is followed by damage tolerance.
Section 2 presents discussion on the loads acting upon a high-speed craft. The loads
experienced by a vessel are central to the entire discussion of fatigue and damage tolerance and

10
led to the decision to present this information up front. Global loads resulting from the
environment as well as secondary loads resulting from the environment and mission or payload
of the vessel are both discussed. Section 2 also presents discussion regarding the relative
influence of the primary and secondary loads on high-speed craft and the manner in which they
differ from the typical applications associated with large monohulls classed for unrestricted,
open ocean service. Section 2 also recognizes that most of the existing fatigue failures are a
result of local excitation from machinery or other mechanical systems but suggests the increasing
role of primary structural response as vessel lengths continue to increase.
Section 3 presents discussion on fatigue beginning with a brief review of this subject and
some of the concepts central to a basic understanding of the causes of fatigue induced cracking.
Discussion is presented on the effects of mean stress, stress ratio and stress range on the fatigue
behavior of aluminum along with the effects of alloy composition on fatigue behavior. An
introduction to the mechanics associated with crack initiation, propagation and failure is also
presented. Discussion on Safe-Life and Fail-Safe design philosophies is presented along with a
summary of current experience gained with a variety of new aluminum alloys developed
specifically for the marine environment and shipbuilding. Finally, Section 3 introduces the work
being developed for the friction stir welding of aluminum alloys for use in the marine industry.
Section 4 continues with methodologies used to develop the necessary input for a fatigue
analysis. This includes cycle counting methods and the use of probability distribution functions
for load or stress histogram development, stress calculation techniques and the importance of
nominal stress and hot-spot stress calculations.
Section 5 introduces design standards used by a variety of industries for the fatigue
design of aluminum. These include the DNV Fatigue Analysis of High-Speed Craft scheduled
for release later this year as well as three other design codes from outside of the marine industry.
At this time, DNV is the only maritime classification society with a set of rules developed to
specifically address the concerns of aluminum fatigue in high-speed vessels.
Section 6 of this report discusses damage tolerance analysis and the techniques available
to determine the time to failure for a crack in a given detail. It also discusses some of the
differences between steel and aluminum and the reason for different damage tolerance
assessment techniques for the two materials. Of the design codes reviewed for this task only
one, EuroCode 9, contains any information concerning crack growth rate and actual calculation

11
procedures for this aspect of the problem. Discussion is presented regarding EuroCode 9 along
with information in Appendix C. Section 6 also provides preliminary discussion on a variety of
software packages developed to analyze fatigue and fracture mechanics.
Section 7 concludes this report with recommendations for continued research and future
development tasks. It introduces the concept of Service-Life, an extension of the Safe-Life and
Fail-Safe design philosophies already used for damage tolerance analysis.
1.6 Conclusions
As with any introductory task it is impossible to conduct a complete screening of all
possible sources and resources of relevant information. Additional information may still be
gained through research of the auto and aerospace industries. However, with environments so
divergent from the marine industry it is not likely that any data would be completely consistent
with the maritime requirements. Similar to the information uncovered from other outside
industries it would require interpretation for application to the current concern. Additional
investigation of research and development being undertaken around the world is also suggested
as this did prove to be a valuable source of information and current studies. Regardless, this
report presents good, representative data for the state of affairs regarding the fatigue design of
aluminum weldments in high-speed craft. It also presents good information for the designers of
such craft to help avoid the problems associated with fatigue during the early design stages.
In order to help the designer with the development of fatigue analyses for aluminum
weldments, this report presents basic discussion concerning the issue along with guidelines from
other design standards. Included in these standards are:
• DNV Fatigue Analysis of High-Speed Craft.
• Aluminum Design Manual from the Aluminum Association. See Appendix B.
• EuroCode 9: Design of Aluminum Structures – Part 2: Structures Susceptible
to Fatigue from the European Committee for Standardization. See Appendix
C.
• Manual of Standards and Recommended Practices, Section C – Part II from
the Association of American Railroads. See Appendix D.
The DNV document is scheduled for release later in 2000 and is not available for general
usage at the time this report was written. None of these design codes presents complete

12
information required for the fatigue design of aluminum weldments in the marine environment.
Each of them presents good and useful information that may be of assistance for a specific
design. The user needs to recognize the application of the respective standards compared to the
chosen use in the marine environment and select factors of safety accordingly.
Another consideration for designers is the use of new aluminum alloys developed
specifically for the marine environment. This report discusses three such alloys:
• AA5383 [1-6]
• RA7108 [1-7]
• AluStar5059 [1-8]
All three have been developed in recent years and have been certified for use by DNV
and various other classification societies such as Bureau Veritas, Lloyd’s Register, Germanischer
Lloyd’s and the Korean Register. ABS is also investigating some of these new materials for
certification in accordance with their rules.
Research undertaken for this report has discovered that not all the information required to
perform fatigue and damage tolerance analyses exists for aluminum weldments in the high-speed
craft industry. These “gaps” in the data have been identified and recommendations suggested to
alleviate these shortcomings.
1.7 References
[1-1] Aluminum: Properties and Physical Metallurgy, American Society for Metals, 1984
[1-2] Maddox, S. J., Scale Effects in Fatigue of Fillet Welded Aluminum Alloys, Proceedings,
Sixth International Conference on Aluminum Weldments, April 1995, American Welding
Society, p. 77.
[1-3] Nordmark, G. E., Herbein, W. C., et. al. Effect of Weld Discontinuities on Fatigue of
Aluminum Butt Joints, Welding Journal, Welding Research Supplement, June 1987.
[1-4] U. S. Geological Survey, website at www.usgs.com, Jan. 2000.
[1-5] Reemsnyder, H. S., Correspondence received for inclusion with the subject report.

13
[1-6] Raynaud, G. M., and Gomiero, Ph., The Potential of 5383 Alloy in Marine Applications.
Collection of articles presented by the Aluminum Association, Nov., 1997.
[1-7] Hval, M., and Raufoss, V. S., A New High Strength Aluminum Alloy for Marine
Applications, Collection of articles presented by the Aluminum Association, Nov., 1997.
[1-8] Sampath, D. et. al., Alustar Alloy AA5059: A Better Alternative to AA 5083 Alloy in the
Marine Industry. Presented at 4th International Forum of Aluminum Ships, New Orleans, May
2000.

15
2. Prediction of Loads on High Speed Craft
2.1 Introduction
Before proceeding to the fatigue or damage tolerance analysis addressed by this report,
discussion is presented regarding the loads and load spectra acting on high-speed craft.
Definition of the loading environment is required for both fatigue and damage tolerance
analysis. In general, the loading data required to perform the fatigue and damage tolerance
analyses for high-speed craft was found to be lacking. Research conducted for this report
revealed very little long-term loading information collected on high-speed craft. General
methodologies do exist for the determination of global loads acting on a vessel but most of this
has been developed for larger, displacement monohulls. Very little information was discovered
to quantify the various secondary loads, their phasing with primary loads and the number of
cycles associated with each. For shorter craft with relatively smaller primary loads and stresses
it will be necessary to gather more information regarding secondary loads as they can form the
major component of the stresses acting throughout the vessel. Some loading information
reflecting short-term data was discovered for a number of high-speed craft operating in the
waters off the Scandinavian countries however, there was not enough data collected in this
sample to be of any use for this task.
In order to fully develop all the loading information required for high-speed vessels, it is
necessary to instrument various craft operating in different regions. This can be augmented with
laboratory testing to measure loads associated with vessel accelerations, payloads, i.e., wheeled
vehicles on ferries, sloshing loads, etc.
2.2 Definition of High Speed for High-Speed Craft
In order for a vessel to be considered high-speed it must satisfy a given condition as
defined by the various classification societies. In accordance with DNV [2-1], a vessel is
considered high speed when it satisfies the following equation:1667.016.7 ∆=V (2.1)
where V is the speed of the vessel in knots and ∆ is the displacement of the vessel, in metric
tonnes corresponding to the design waterline.

16
In accordance with ABS criteria [2-2], a vessel is defined as high speed when it satisfies
the equation:
LV 36.2= (2.2)
Again, V is defined as the design speed of the vessel in knots and is generally the maximum
speed in calm water. L is the length of the vessel in meters and is defined in section 3/1.1 of
reference [2-2]. For L defined in feet the coefficient on the right hand side of equation 2.2 is
1.30, i.e., LV 30.1= .
The rules associated with other societies need to be checked for the relevant definition of
a high-speed vessel.
2.3 Definition of Primary and Secondary Loads
The definitions of primary and secondary loads used throughout this report are the same
as those generally accepted for the design of monohulls and other surface ships. Primary loads
are the bending moments and shear forces acting on the hull girder of the vessel as a result of its
operation in a seaway. They are a result of the buoyancy forces and gravity forces acting along
the length of the ship. The primary loads result in three components of bending moment and
their associated shearing forces. These moments are vertical, transverse and torsional.
Typically, only one component of these moments will govern the design of a vessel. In a
displacement type monohull, the vertical bending moment tends to govern the response of the
vessel whereas transverse moments tend to govern the design of SWATH and catamaran
hullforms. Torsional moments rarely govern the design of any vessel but certainly need to be
considered in SWATH and catamaran hullforms. The effects of torsional moments must also be
considered in the design of monohulls with large cutouts through their strength decks.
As opposed to the globally acting primary loads, secondary loads act locally. They result
from numerous sources but include tank sloshing and overflow loads, inertial loads due to ship
motion, wind, snow, ice and other weather effects, loads resulting from the operation of wheeled
vehicles onboard the ship, aircraft handling decks, hydrostatic and wave slamming loads acting
on the side shell, cargo stowage, mission system and machinery operation loads, etc. The
secondary loads often govern the required scantlings in a given area. Depending on the phasing
of certain secondary loads it is necessary to combine their effects with the primary loads to
develop a complete stress prediction for the ship and its required scantlings.
17
Both primary and secondary loads play a significant role in the development of the
scantlings for a displacement vessel. Similarly, both loading components can have a significant
effect on the fatigue of various details depending upon their location in the ship. Discussion is
presented below regarding the importance of these two loading components relative to the high-
speed craft and the influence they will have on the fatigue and damage tolerance analyses.
2.4 Loads Acting on High-Speed vice Displacement Vessels
For the consideration of fatigue design the loads acting on displacement vessels are fairly
well understood. They consist of primary and secondary load components and procedures exist
for the analysis of such vessels for consideration of fatigue. The same definition of the loads
acting on high-speed vessels and the manner in which they define the fatigue loading
environment is not as well understood.
Displacement vessels are typically designed for open-ocean, unrestricted service. The
implication for design resulting from this classification requires these vessels to be designed for
extreme sea-state conditions. The primary hull girder bending moments are generated to reflect
no less than sea-state 7, often sea-state 8 conditions. For the North Atlantic these are defined as:
Sea-State Significant Wave Height (Meters) Wind Speed (Knots)
7 6 – 9 48 - 55
8 9 – 14 56 – 63
Not only will the high-speed craft never operate in such extreme environments but they
are also significantly shorter in length and would develop smaller primary bending moments
even if subjected to these same conditions. Both ABS and DNV recognize the reduced exposure
of high-speed vessels compared to the displacement monohulls and allow for classifications
considering service area restrictions to account for less severe environments. Table 2.1 in this
report is taken from the DNV Rules for High Speed and Light Craft [2-1]. It shows the manner
in which service areas other than open-ocean, unrestricted are defined for high-speed craft.
Other sections of these rules also allow for the application of reduced primary and secondary
loads consistent with these service area definitions.

18
Therefore, it can be concluded that the magnitude and influence of the primary loads
acting on a high-speed vessel should not be as great as those acting on a displacement vessel.
The two principal factors accounting for this are the reduced length of the high-speed craft and
the less severe operating environments.
The nature and magnitude of the secondary loads acting on high-speed craft also differs
from those acting on displacement vessels. Due to their very size, the tank overflow and
sloshing loads are quite large on most displacement ships and often govern the design of tank
boundaries. Inertial loads on a high-speed craft result more from the high speed of the vessel
than from the sea states in which they operate. Similarly, the secondary hydrostatic loads that act
on a displacement vessel are associated with the extreme sea states and wave heights
encountered throughout the life of the vessel. Local slamming loads are also a function of the
adverse sea state conditions in which the ship must operate. For high-speed craft, the secondary
hydrostatic loads are associated with the high-speed operation of the craft and reflect the
slamming loads due to the increased forward speed. As the operating environment of the high-
speed craft worsens, their forward speed is reduced with an associated change in the slamming
pressures experienced by the craft’s structure. Research needs to be developed to help define the
relationship between the inertial and slamming load spectra associated with the high-speed craft
as a function of its forward speed. In general, the phasing of primary and secondary loads acting
on high-speed craft needs to be addressed to determine the appropriate load cycles and histories.
Not many high-speed craft accommodate flight operations but many ferries experience
wheel loads similar to those on displacement vessels. Altogether, it is seen that the nature of the
secondary loads acting on high-speed craft differs from those on displacement vessels. In
particular, accounting for the different secondary loads acting on the side and bottom shell will
help define a critical area for potential fatigue problems.
It is also suggested that the relative magnitudes of the primary and secondary loads acting
on high-speed craft differ from displacement vessels. With much lower primary load and stress
magnitudes in the high-speed craft, the secondary loads can have a much more significant
influence on the selection of scantlings and the overall stress and fatigue environment existing in
the craft. Work needs to be done to help define the magnitudes and interaction of the primary
and secondary loads acting on the various types of high-speed craft, i.e., the interaction and

19
magnitudes for SWATH or catamaran vessels could be significantly different from those acting
on a monohull.
The discussion presented below is based on current technology and design practices
regarding displacement vessels. It is augmented to highlight the potential differences that will
exist for use with high-speed craft. This discussion is presented herein to provide the designer
with a basic understanding of the procedures currently available to displacement designers and
the direction required for high-speed research for implementation in the design process.
2.4.1 Increasing Length of High-Speed CraftPresentations made at the recently conducted 4th International Forum on Aluminum
Ships, (New Orleans, May 2000), suggest that most of the fatigue failures currently experienced
on aluminum high-speed craft are the result of local vibration problems. This confirms that
primary bending does not play a significant role in the fatigue response of aluminum HSC. The
fatigue induced cracks are treated as a maintenance issue with cracks continually being repaired
as part of the vessel upkeep. There is no effort to address any fatigue issues during the initial
design of the vessel. It is the intent of this report to help address these problems during the
design stage and reduce the maintenance costs and issues resulting from these problems.
Also addressed at this forum were the continuing trend for increased length and the
relatively young age of the aluminum HSC fleet. The average age of an aluminum high-speed
vessel is in the range of six years with few vessels exceeding 10 years in service. This too
demonstrates the potential for an increasing rate of fatigue induced cracks as the vessels continue
to age. The young age of the fleet suggests that while the primary response of the hull girder
should be a less significant contributor to the fatigue environment than for monhulls, more time
is required to confirm this as typical vessels age into maturity and the expected time for the
observance of long-term fatigue related cracking.
The trend toward increasing length of vessels is reflected by DNV which currently
classes high speed monohulls and catamarans from 25 meters up to 120 meters in length [2-3].
This includes the Superseacat ferries which are 88 meters long and have a maximum continuous
speed of 40 knots [2-4].
In addition to the demand for the increased length of high-speed ferries it is also expected
that there will be future investigation of aluminum cargo vessels. The length and displacement
of these cargo vessels will exceed the current expectations for ferries and continue to highlight

20
the significance and increased attention on primary loads and their interaction with secondary
loads.
2.5 Loading for Fatigue and Damage Tolerance
Fatigue is a metallurgical-level damage response mechanism resulting from cyclic
straining. Damage tolerance is the ability of a structure to sustain anticipated loads in the
presence of fatigue, corrosion or other damage.
As related to this report, fatigue and damage tolerance are part of the same loading
history for the vessel. They both represent the response of the vessel’s structure subjected to the
cyclic loading environments inherent throughout a ship or high-speed craft. The loads of
principal interest to this report are the primary and secondary environmental loads and the
secondary loads resulting from the vessel’s payload and operation. These loads are variable in
magnitude and generally random in nature. Except for the loads induced by the presence of any
cracks, all the global and secondary loading spectra experienced by a vessel are independent of
the structural integrity of any details. This implies that the same global loading spectra will
continue to develop as the detail shifts from one that is crack free to one that contains a crack.
The presence of the crack will introduce local secondary loads and stresses not originally acting
on the intact detail and these are generally not considered for the fatigue analysis.
This report is not concerned with the cyclic loads typically generated in way of rotating
or oscillating machinery or mission systems. Such loads are more deterministic in nature with
slight or predictable variation over time. Analysis of structure subjected to these rotational
loading spectra can be analyzed as being subjected to a constant amplitude loading with greater
confidence then regarding the variable loads associated with the environment. Although not
specifically addressed by this report, techniques are presented that will allow the designer to
analyze these scenarios using the straight-forward techniques as presented by the Aluminum
Association [2-5]. See Section 5 and Appendix B for this information.
2.6 Loads and Stresses
Without considering the secondary load effects that may be generated in a detail where a
crack has been initiated, the loading environment acting on a detail is independent of the
structural integrity of the detail. In other words, the hull girder, hydrostatic and other secondary
21
loads acting on a vessel are independent of the cracks in a detail. However, extensive cracking
or structural damage could lead to significant load re-distribution or changes in the load path
provided that there is adequate structural redundancy. This in turn could trigger a chain reaction
of failures or progressive collapse.
The stresses resulting in a detail which is experiencing localized crack growth are a
strong function of its structural integrity and the presence of any cracks. On a local level,
stresses will be introduced into a detail resulting from a crack that would not be present if the
detail were intact. More discussion regarding this aspect of a detail’s behavior is presented
below.
2.7 Load Development Procedures in DNV High-Speed Craft Rules
DNV is scheduled to release a document later this year for the Fatigue Analysis of High-
Speed Craft [2-6]. Similar to other documents that deal with fatigue and damage tolerance
analysis [2-6] suggests that the fatigue information be developed with respect to the most likely
loading scenarios. In addition, damage tolerance analysis needs to account for the extreme loads
because of the large effect they can have on the behavior of the damaged detail.
The DNV document recognizes two procedures for load calculation. The first is a direct
load calculation procedure and the second is a simplified approach. The simplified approach
addresses preliminary or earlier stages of design whereas the former addresses the more detailed
load development associated with the final design stages.
Neither of these approaches contains enough detail on the specific means for developing
such calculations to account for all the possible loading sources defined below. The document
provides the steps that need to be followed for the load development but no details on how to
perform those steps or determine the number of cycles associated with each of the secondary
loads. The DNV report does provide some preliminary guidance on the combination of primary
and secondary loads. It recognizes that further work needs to be done in this area which may be
used as an indicator of the loading information available for high-speed craft.
In a portion of the document dealing with the simplified loading approach, DNV does
recognize that, “In some cases, the combination of global and local stresses must be used.”
Earlier in the document the types of loads to be considered are enumerated as:
• Wave loads.

22
• Pressure variations due to waves.
• Pressure variations in tanks due to acceleration of the craft.
• Acceleration forces due to the movement of the craft.
• Vibration loads from machinery.
• Pressure pulses from propulsion.
• Repeated local loads from moving vehicles.
Indeed, these all represent secondary loads except for primary hull girder loads that
would result from wave loads. With regard to high-speed craft and the plentitude of hull forms
associated therewith, the primary hull girder loads could be longitudinal bending, transverse
bending, torsional bending or a combination of all three. DNV [2-6] does present information
relating to these global loads that would enable the designer the information required to develop
the wave loading information for a fatigue analysis. The document contains exposure time and
scatter diagram information for vessel types and service restrictions. This information can be
used to develop the primary hull girder loads and resulting stresses acting in the vessel or
through a detail of concern in the fatigue analysis.
The types of loads shown above are also consistent with the loads identified in an earlier
DNV document that addresses the Fatigue Assessment of Ship Structures, Classification Notes,
No. 30.7, [2-7]. In that document, DNV presents a more detailed development of the global
loads and transfer functions required to represent the primary, wave induced loads acting on the
hull girder. This procedure is also similar to that presented in SSC 402 [2-8] and it is included
herein for completeness. It will be up to the user to develop the appropriate primary and
secondary loading information for each design. The DNV criteria in [2-7] can be used as a
guideline for the global loads.
2.8 General Comment on Loads
Before proceeding with the general loading algorithms required for the detailed, primary
hull girder load predictions, it is worth making note of the following with regards to loads,
fatigue design and the costs associated with a vessel. Also, the methodology presented below
was developed more specifically for displacement monohulls subjected to unrestricted service. It
reflects the development of loads consistent with the spectral fatigue analysis. It is included in

23
this report to perhaps form the basis of similar techniques that could be developed for high-speed
craft.
The fabrication cost associated with any given structural design will be dominated by the
plate and stiffening weights and number of pieces required for the design. Fatigue cracking
problems tend to be located at the intersection of structural members or perhaps at termination
points. In many instances, good ship building practice will require details wherein stress
concentrations and crack initiation sites can be developed during fabrication. These details will
probably be included in the design and the only variables may be the geometry, thickness or size
associated with the detail’s components. It is recommended that the designer investigate the
influence of various combinations of these variables when developing details in fatigue prone
areas to determine the overall weight and cost impacts to the design. If these impacts are not
significant it might be prudent to assess the loads and their associated cycles in a conservative
manner. With the lack of precise histories for both primary and secondary loads regarding high-
speed craft, it may be a little optimistic and analytically expensive trying to refine this portion of
the calculation to a very fine level. As discussed throughout this report the designer is
encouraged to use conservative factors of safety for the fatigue design.
2.9 Global Load & Stress Prediction Methodology
Figure 2-1 gives a schematic “flow-chart” of the procedures to be used and the steps in
predicting loads on high-speed craft. As seen in this figure, there are two separate methods that
can be used to develop the loads. The Spectral Method is analytic in nature whereas the
Alternative Method requires the collection of significant test and model data.
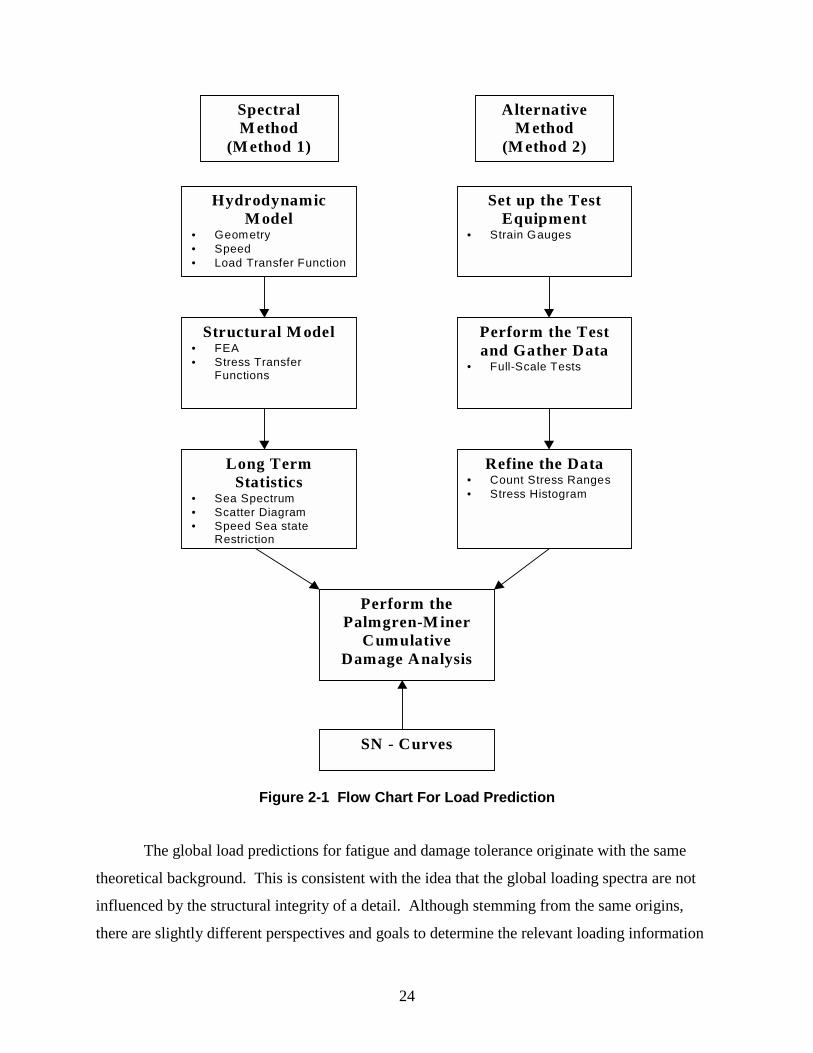
24
HydrodynamicM odel
• Geometry• Speed• Load Transfer Function
Structural M odel• FEA• Stress Transfer
Functions
Long TermStatistics
• Sea Spectrum• Scatter Diagram• Speed Sea state
Restriction
Set up the TestEquipment
• Strain Gauges
Perform the Testand Gather Data
• Full-Scale Tests
Refine the Data• Count Stress Ranges• Stress Histogram
Perform thePalmgren-M iner
CumulativeDamage Analysis
SN - Curves
SpectralM ethod
(M ethod 1)
AlternativeM ethod
(M ethod 2)
Figure 2-1 Flow Chart For Load Prediction
The global load predictions for fatigue and damage tolerance originate with the same
theoretical background. This is consistent with the idea that the global loading spectra are not
influenced by the structural integrity of a detail. Although stemming from the same origins,
there are slightly different perspectives and goals to determine the relevant loading information

25
for the fatigue and damage tolerance aspects of the spectra. For damage tolerance analysis it is
necessary to identify and include the extreme loads that will be acting on a detail after a crack
has been initiated. It is important to capture the extreme loads because of the stress
concentration factors also at work after crack initiation and the effect they have on the
subsequent behavior of the detail. Together, the extreme loads and the stress concentrations
cause extreme stresses within the cracked detail. These extreme load cycles and their associated
stresses have a significant effect on the time to failure of a detail. For fatigue however, it is
generally agreed that the most detrimental loads effecting fatigue life are the high cycle/moderate
load magnitudes. The extreme loads are generally too few in number to add significantly to the
total damage experienced by a detail undergoing fatigue damage, i.e., the extreme loads do not
generally contribute significantly to the crack initiation of a fatigued detail. Tveiten and Moan
(1997) showed that low and moderate stresses could be more detrimental to the fatigue life then
extreme stresses [2-9]. Another difference is the time range for the analysis. While both are
considered long-term, the time associated with damage tolerance is typically in the range of 2-5
years. To develop an adequate long-term fatigue spectrum the typical range is more on the order
of 20 years. Although unwritten, this is approximately the useful design life associated with
many commercial maritime design codes such as the American Bureau of Shipping, ABS.
Until recently, most commercial design codes addressed the effects of fatigue implicitly
within their rules. The general approach was to keep all primary and secondary stresses below
certain allowable limits based on empirical equations and an “allowable stress” approach to
design. The implication inherent within these approaches suggested that if all design operational
stresses are kept below the recommended allowable stresses then fatigue considerations will also
be satisfied. The rules are designed to accommodate a great variety of high-speed craft and must
therefore include a certain degree of conservatism. Using the direct calculation procedures
provided in this report will give a more precise prediction of the loads and stresses in the
structure. This will allow a certain amount of design optimization in way of the details used for
the vessel.
As outlined below the procedure to develop the loads and their resulting stresses can be
quite extensive and requires a lot of time and accurate input data. Depending on the refinement
of the output data desired, it can also demand significant time in finite element model
development and analysis. All this leads to increased analytical costs that need to be justified by

26
the life cycle maintenance and operational savings that will be realized through a more accurate
fatigue analysis. Again it is worth remembering that a lot of the input data required for the
analysis is also in the formative stages. This can aggravate the search for reliable or applicable
data once a design has been undertaken. It can also add to the uncertainty, or risk, associated
with any conclusions developed by the design.
Simplified procedures can be used for quick, preliminary or early stage designs or for
designs that do not demand the sophistication of a detailed analysis. DNV [2-6] and [2-7]
provide guidelines for conducting a simplified prediction of the long-term loads on a ship.
Simple hand calculations can be used to find the nominal stresses acting throughout a
vessel using basic prismatic beam theory. Some special consideration regarding large openings,
unique hull forms and in-plane deformation may need to be addressed for use on high-speed
craft. Unique hull forms, such as SWATHs and catamarans, may experience simultaneous
primary bending due to transverse, longitudinal and torsional response of the hull girder. While
the phasing of these loads will not likely sum the maximum component of each, it is important to
realize that these types of vessels do not behave as typical monhulls where consideration for
longitudinal bending can often satisfy the primary portion of the hull girder structural analysis.
To sum the stresses resulting from the interaction of these three loading components it is
acceptable to use the principle of superposition as all stresses should be below the elastic limit of
the material.
Large window openings or rows of window’s, deck openings or cutouts through the
major transverse bulkheads can also reduce the ability of a vessel to resist certain global loads
and the effects of these large openings need to be considered for the nominal stress calculations.
Similar to monohulls, the global loads acting on high-speed craft increase with ship
length. Fredriksen (1997) [2-10] found that local loads had a significant effect on fatigue and
that global loads are not as critical for short craft. This work needs to be further investigated and
expanded to develop the primary and secondary load relations discussed earlier. This is
consistent with small vessel rules similar to ABS Rules for Building and Classing Steel Vessels
Under 61 Meters (200 Feet) in Length [2-11]. These rules contain only simplified consideration
for the global stresses acting on a small vessel. Many of the high-speed craft and high-speed
ferries experiencing fatigue problems are small vessels of short length. It will be important to
evaluate the magnitude of the primary hull girder loads and stresses associated with these craft

27
since they would not typically be a significant concern for design other than fatigue
considerations.
Figure 2-2 [2-2] shows some of the critical areas for cyclic stress variations that need
special consideration for a catamaran.
Figure 2-2 Critical areas for fatigue consideration of high-speed catamarans.
2.10 Derivation of the Load and Stress Transfer Functions
This Section provides a brief outline for developing the load and stress transfer functions
for the global loads used for the detailed fatigue analysis. Research has been performed at DNV
and NTNU in Trondheim in developing the global loads acting on high-speed craft. The
procedure presented in this report is based partly on that research, [2-12], [2-13], [2-14].
Classic hydrodynamic load prediction for monohulls is based on strip theory. (Salvesen,
Tuck and Faltinsen, 1970), [2-15]. This theory subdivides the hull into infinitesimal transverse
strips and integrates over the length of the ship to determine the overall loads. As applied to
monohulls this theory assumes that there is no interaction of the loads acting upon adjacent
transverse strips. Using strip theory to predict the loads acting on high-speed craft requires
modification of the non-interaction assumption used for monohulls. As the speed of the vessel
increases the correlation between the strips needs be accounted for. Faltinsen and Zhao (1991)
[2-16] extended the theory to account for high forward speed and the equations affected by this
are in the load transfer functions.

28
2.10.1 Spectral Method Load and Stress Transfer FunctionsThe Spectral Method requires both hydrodynamic and structural response input data in
order to establish the loading and stress transfer functions. Some of the typical data required to
develop the spectral analysis are:
• Geometry of the vessel.
• Mass distribution over the vessel length.
• Speed and operational profile of the vessel.
• Oceanographic data.
• Operational restrictions.
• Structural model of the vessel.
Operational restrictions are very specific for high-speed craft and are identified as a separate
line item from operational profile for a specific reason. Most people familiar with the idea of the
operational profile of a ship would expect any restrictions to be included herein. Indeed, most
monohulls are designed for open-ocean, unrestricted service and do not have significant service
restrictions. In their Rules for Classification of High-Speed and Light Craft [2-1], DNV defines
a variety of service restrictions that can be taken to apply to any high-speed craft depending upon
the intended service of the vessel. The service restrictions account for the type of environment to
be encountered by a vessel and range from unrestricted, open-ocean service to sheltered areas.
Table B1 from [2-1] is shown below in Table 2–1. This table defines a series of maximum
distances, in nautical miles, from safe harbor or anchorage that apply to each class of service
restriction and account for the type of environment, location and season of the year. Included
elsewhere in [2-1] are definitions that reduce the loads acting on a vessel as a function of the
service area restrictions. This allows owners to take advantage of the fact that the loads are
smaller in restricted service than they are out in the open-ocean. A typical speed/wave height
restriction curve is shown in Error! Reference source not found.. ABS has a similar
philosophy regarding service restrictions presented in their Guide for Building and Classing
High-Speed Craft [2-2]. The ABS Guide also allows designers/owners the flexibility to design
for the environmental loading scenarios appropriate to the intended service of the vessel.

29
Table 2–1 DNV Service Restrictions for High-speed Craft
Condition Notation Winter Summer Tropical
Ocean None 1) 1) 1)
Ocean R0 300 1) 1)
Ocean R1 100 300 300
Offshore R2 50 100 250
Coastal R3 20 50 100
Inshore R4 5 10 20
Inland R5 1 2 5
Sheltered R6 0.2 0.3 0.5
1) Unrestricted service notation is not applicable to craft falling within the scope of the HSC
Code, i.e., service and type notations Passenger, Car ferry or Cargo.
Figure 2-3 Speed/Wave Height Restriction Curve for High-Speed Craft
2.10.2 Hydrodynamic Model to Develop Load Transfer FunctionsThe hydrodynamic response of the high-speed craft will be provided through a transfer
function, H, as a function of heading, θ, and wave frequency, ω, ( )θω,H . The transfer functions
are complex functions containing both real and imaginary components.
To determine the primary loading response functions or transfer functions the following
data will be required:
• Lines plans and/or offset table – to define the hull form of ship.
• Weights – to define mass distribution of ship.

30
• Operational profiles with service restrictions.
• Vessel loadout information.
• Intended speed profile of the vessel.
• Heading of the vessel relative to the seas.
• Exposure-time during a given year and intended service life of the vessel in years.
The transfer functions define the loading experienced by the vessel in response to waves
of a unit amplitude. Typical transfer functions for global wave-induced loads and secondary
loads are usually defined as:
( )θω,vH = Transfer function for vertical bending moment.
( )θω,hH = Transfer function for horizontal bending moment.
( )θω,tH = Transfer function for torsional bending moment.
( )θω,pH = Transfer function for external pressure.
( )θω,cH = Transfer function for liquid cargo pressure.
Additional transfer functions may be needed to define the transverse and torsional
bending moments associated with SWATH, catamaran or other unique hull-forms. The function
( )θω,vH , developed for vertical bending moment is traditionally referred to the longitudinal
bending moment acting on a monohull. The additional transfer functions may be defined as:
( )θω,trnH = Transfer function for transverse bending moment associated with SWATH or
catamaran vessels.
( )θω,torH = Transfer function for torsional bending moment associated with SWATH or
catamaran vessels.
Transfer functions will also be needed for the loading functions for all the appropriate
secondary loads acting on a given detail. In a similar manner, transfer functions can be defined
for any loading component of interest for a given detail.
2.10.3 Structural Model to Develop Stress CoefficientsThe structural model will take the loading information developed above and be used to
develop the stress coefficients corresponding to the loading transfer functions. For the detailed
analyses typically associated with a spectral analysis the structural modeling will require at least
one, and possibly more levels of finite element modeling. The models are usually developed
31
with increasing definition, i.e., decreasing mesh size, to more closely investigate the local stress
fields associated with a detail. This is typically accomplished starting with a global finite
element model of the entire ship, which is then subjected to the primary and secondary loading
functions of interest. This model will develop global stresses and displacements as part of its
output. The displacements from this analysis will then be used for input to the more localized
and refined models down to the detail level. This process can be developed with as many interim
models as desired, or practicable, to achieve the desired results. The FEA can also be run to
analyze all appropriate loads and load combinations to determine the critical stress coefficients
for various details located in different areas of the craft.
The stress transfer functions, defined below as Ax, express the values of a certain stress
component resulting from a unit load, i.e., hA is the stress coefficient at the location of interest
and for the stress component of interest resulting from the application of a unit horizontal
bending moment. The actual stress can then be determined by increasing hA in the same ratio as
the actual load to the unit load. For calculations associated with a spectral analysis it is not
recommended that the stress coefficients can be determined by hand. The effects of geometric
stress concentrations can best be determined using FEA and this is more consistent with the
overall philosophy of a spectral analysis.
Although hand calculations are not recommended for the final determination of the stress
coefficients, it is possible to get an approximation for the correct stress levels by performing
simple hand calculations. These could be augmented using textbook stress concentration factors,
if appropriate. This can be done for any type of loading.
The stress coefficients are defined in association with the loading transfer functions
defined above and are given as:
vA = Stress per unit vertical bending moment.
hA = Stress per unit horizontal bending moment.
tA = Stress per unit torsional bending moment.
pA = Stress per unit external pressure.
cA = Stress per unit liquid cargo pressure.
In a manner similar to the additional load transfer functions defined above for SWATH
and catamaran hull forms, corresponding additional stress coefficients can also be defined.

32
For each loading, and the corresponding structural response, i.e. vertical bending
moment, there will be at least one transfer function relating the loads to the stresses developed in
the structure. The load and stress transfer functions depend on the conditions acting on the
details to be analyzed. If the entire stress history of a given detail is dominated by a single load
component the stress transfer function will only have to relate information from this one
condition. If, as is usually the case, the stress history of a detail is a function of numerous load
components, then it will be necessary to develop more detailed transfer functions. For this type
of condition the transfer functions are linearly summed to develop a combined stress transfer
function defined as ( )θωσ ,H and computed as.
( ) ( ) ( ) ( ) ( ) ( )θωθωθωθωθωθωσ ,,,,,, ccpptthhvv HAHAHAHAHAH ++++= (2.3)
with additional terms included in the summation depending on the loads acting upon the hull or
the detail. Equation 2.3 develops the transfer function for a single component of stress acting
through the area of interest, i.e., bending stress. Additional transfer functions would be required
for each component of stress required at the same location, i.e., a second relation would have to
be developed for the axial stress acting through the same area. Equation 2.3 represents a
simplified linear summation of the various load components. It does not consider the interaction
between the load components and would result in an approximation of the stress coefficients.
Therefore, the stress coefficients are typically determined through a simplified analytical
approach or finite element analysis. The individual stress coefficients and linear summation are
used in conjunction with the simplified analysis. FEA is usually developed at increasing levels
of detail and mesh refinement to more accurately define the stress coefficients. The stresses and
displacements output from global FEA are used as the input for local FEA at the detail level. In
this manner, Hσ is calculated directly for a specific location and loading conditions.
2.10.4 Calculation of Short Term ResponseEquation 2.3 represents the load and stress transfer functions required to develop the
response of the vessel subjected to unit amplitude loads. It is now necessary to develop the
information to account for the actual load magnitudes, i.e., other than the unit loads currently
assumed. It is also necessary to include spectral information of the waves to account for the load
and stress variations over time. It is assumed that wave scatter diagrams and sea spectra are
available and have been chosen appropriate to the service route of the vessel to be designed.
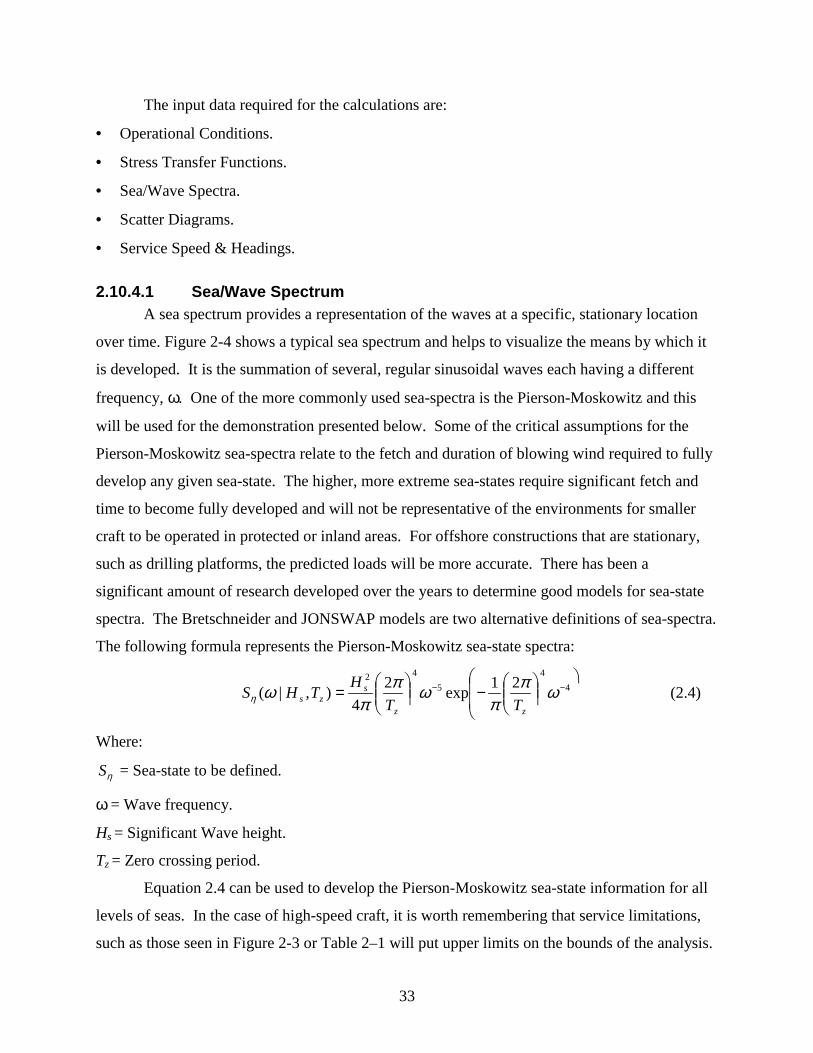
33
The input data required for the calculations are:
• Operational Conditions.
• Stress Transfer Functions.
• Sea/Wave Spectra.
• Scatter Diagrams.
• Service Speed & Headings.
2.10.4.1 Sea/Wave SpectrumA sea spectrum provides a representation of the waves at a specific, stationary location
over time. Figure 2-4 shows a typical sea spectrum and helps to visualize the means by which it
is developed. It is the summation of several, regular sinusoidal waves each having a different
frequency, ω. One of the more commonly used sea-spectra is the Pierson-Moskowitz and this
will be used for the demonstration presented below. Some of the critical assumptions for the
Pierson-Moskowitz sea-spectra relate to the fetch and duration of blowing wind required to fully
develop any given sea-state. The higher, more extreme sea-states require significant fetch and
time to become fully developed and will not be representative of the environments for smaller
craft to be operated in protected or inland areas. For offshore constructions that are stationary,
such as drilling platforms, the predicted loads will be more accurate. There has been a
significant amount of research developed over the years to determine good models for sea-state
spectra. The Bretschneider and JONSWAP models are two alternative definitions of sea-spectra.
The following formula represents the Pierson-Moskowitz sea-state spectra:
�
��
�
�
���
���
�−��
����
�= −− 4
45
42 21exp24
),|( ωππ
ωππ
ωηzz
szs TT
HTHS (2.4)
Where:
ηS = Sea-state to be defined.
ω = Wave frequency.
Hs = Significant Wave height.
Tz = Zero crossing period.
Equation 2.4 can be used to develop the Pierson-Moskowitz sea-state information for all
levels of seas. In the case of high-speed craft, it is worth remembering that service limitations,
such as those seen in Figure 2-3 or Table 2–1 will put upper limits on the bounds of the analysis.
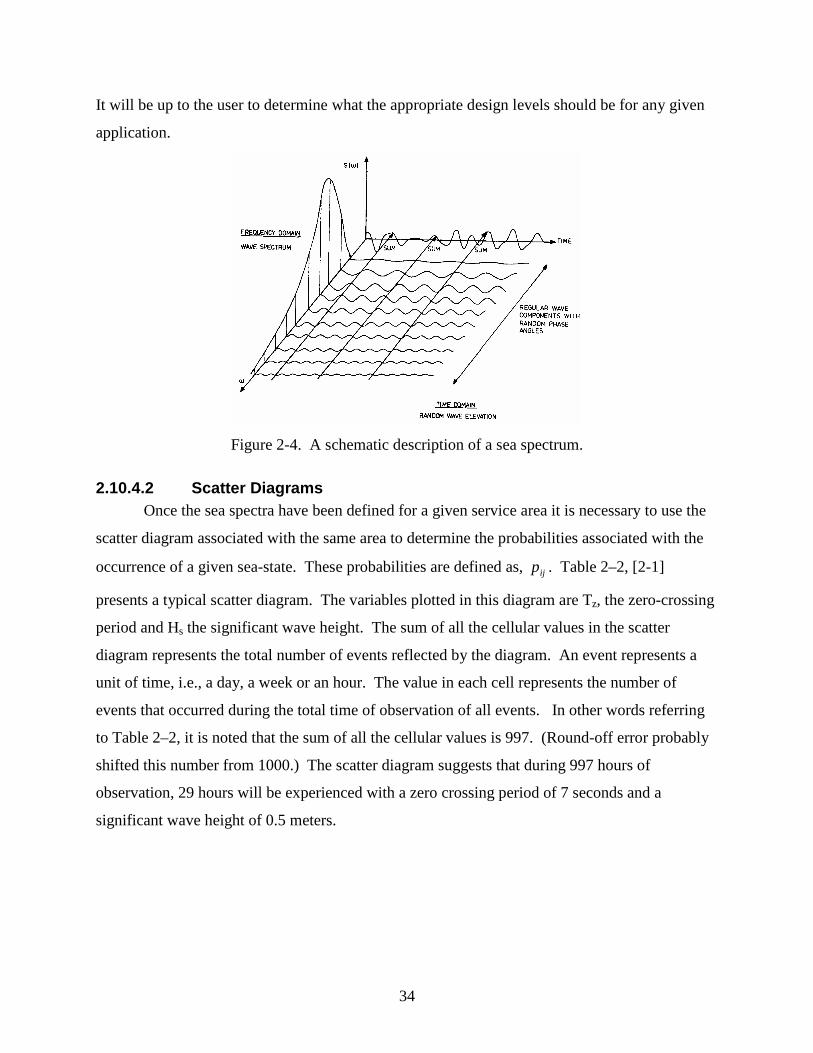
34
It will be up to the user to determine what the appropriate design levels should be for any given
application.
Figure 2-4. A schematic description of a sea spectrum.
2.10.4.2 Scatter DiagramsOnce the sea spectra have been defined for a given service area it is necessary to use the
scatter diagram associated with the same area to determine the probabilities associated with the
occurrence of a given sea-state. These probabilities are defined as, ijp . Table 2–2, [2-1]
presents a typical scatter diagram. The variables plotted in this diagram are Tz, the zero-crossing
period and Hs the significant wave height. The sum of all the cellular values in the scatter
diagram represents the total number of events reflected by the diagram. An event represents a
unit of time, i.e., a day, a week or an hour. The value in each cell represents the number of
events that occurred during the total time of observation of all events. In other words referring
to Table 2–2, it is noted that the sum of all the cellular values is 997. (Round-off error probably
shifted this number from 1000.) The scatter diagram suggests that during 997 hours of
observation, 29 hours will be experienced with a zero crossing period of 7 seconds and a
significant wave height of 0.5 meters.

35
Table 2–2 Typical Scatter Diagram From DNV HSLC Rules
The probability is then derived as the ratio between the amount of a typical wave
combination of Hs and Tz compared with the total amount of waves in the diagram.
Different scatter diagrams will be found for different applications and services. It is
typical practice to develop a composite scatter diagram for the design of vessels whose operation
will cover an area greater than that represented by any single scatter diagram.
2.10.4.3 Transform from Stationary to Moving ReferenceThe wave spectra defined above refer to a stationary point in the ocean. To account for
the fact that a vessel moves forward over time it is necessary to modify the spectrum. As a ship
moves forward, it experiences a wave encounter frequency, ωe, which differs from the frequency
associated with the waves, ω at the stationary point. This is taken into account by the following
equation:
����
�−= θωωω cos1
gV
e (2.5)
In a similar manner, it is also necessary to account for the relative motion experienced by
the vessel compared to the stationary point which undergoes no translations. To transform the
reference axes from the fixed point to a set that is translating with the ship the wave spectrum is
modified in accordance with the following equation:
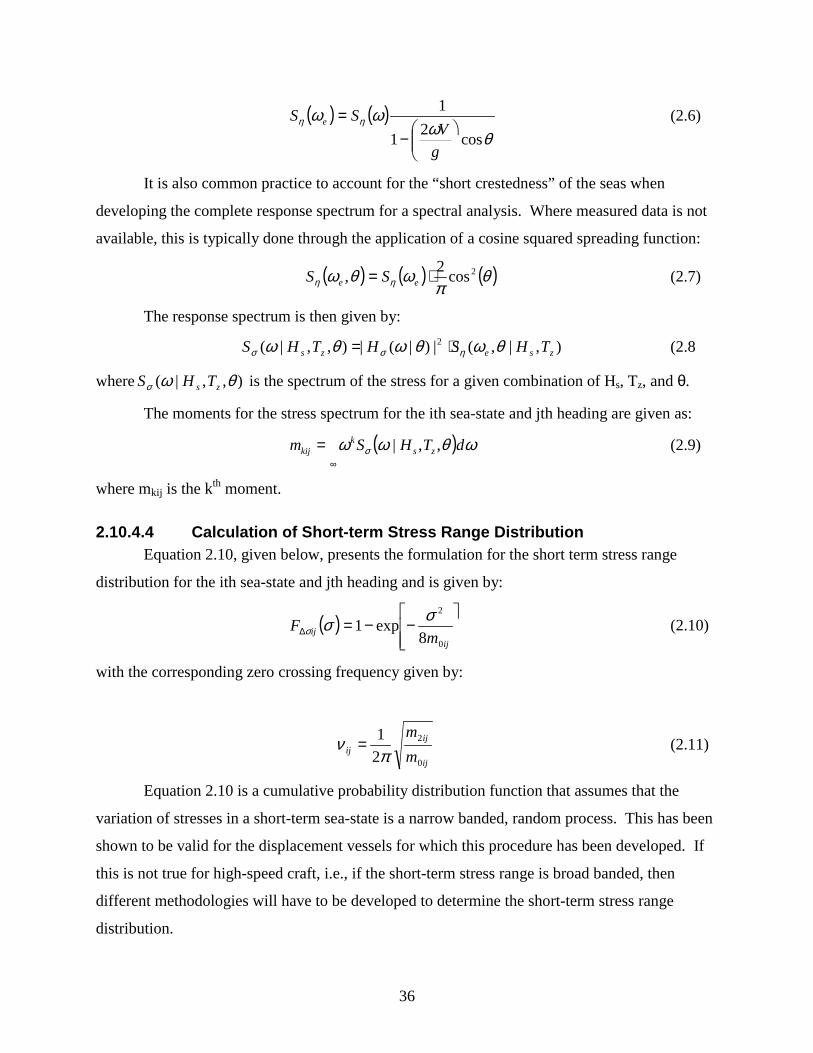
36
( ) ( )θω
ωω ηη
cos21
1�
���
�−
=
gV
SS e (2.6)
It is also common practice to account for the “short crestedness” of the seas when
developing the complete response spectrum for a spectral analysis. Where measured data is not
available, this is typically done through the application of a cosine squared spreading function:
( ) ( ) ( )θπ
ωθω ηη2cos2, ⋅= ee SS (2.7)
The response spectrum is then given by:
),|,(|)|(|),,|( 2zsezs THSHTHS θωθωθω ησσ ⋅= (2.8
where ),,|( θωσ zs THS is the spectrum of the stress for a given combination of Hs, Tz, and θ.
The moments for the stress spectrum for the ith sea-state and jth heading are given as:
( )∞
= ωθωω σ dTHSm zsk
kij ,,| (2.9)
where mkij is the kth moment.
2.10.4.4 Calculation of Short-term Stress Range DistributionEquation 2.10, given below, presents the formulation for the short term stress range
distribution for the ith sea-state and jth heading and is given by:
( ) �
���
�−−=∆
ijij m
F0
2
8exp1 σσσ (2.10)
with the corresponding zero crossing frequency given by:
ij
ijij m
m
0
2
21π
ν = (2.11)
Equation 2.10 is a cumulative probability distribution function that assumes that the
variation of stresses in a short-term sea-state is a narrow banded, random process. This has been
shown to be valid for the displacement vessels for which this procedure has been developed. If
this is not true for high-speed craft, i.e., if the short-term stress range is broad banded, then
different methodologies will have to be developed to determine the short-term stress range
distribution.

37
2.10.4.5 Long Term ResponseIt is recognized that the equations presented above were developed for open-ocean
service and that many high-speed craft will not obey this assumption. Regardless, the
philosophy behind these procedures can also be applied to any of the sea-states or conditions that
would be appropriate for any high-speed vessel.
All the data developed through equation 2.11 represents the short-term loading and
response of a vessel to the global sea-states in which it will operate. As stated previously, both
fatigue and damage tolerance represent long-term events. This makes it necessary to extrapolate
the data to reflect long-term behavior and response. The short-term data developed through
equation 2.11 is considered to be representative of realistic conditions. Therefore, it is only
necessary to extrapolate this behavior to the desired number of load cycles to reflect the long-
term exposure of any given design. For a typical monohull the typical number of long-term
cycles may be as high as N=100 million. The number of cycles required for any given vessel
needs to be determined for the design of that vessel.
The long-term extreme response, presented in equation 2.12 below, is developed from the
Ochi methodology wherein he assumed that the long-term response is merely a summation of the
short-term responses over the duration of interest. This results in a probability density function
for long-term response that is expressed as:
( )( )
=
i jji
i jaji
a ppn
fppnf
*
** σσ (2.12)
Where:
σa = Stress amplitude.
f* = Probability density function for short-term response.
n* = Average number of responses per unit time during the short-term response.
ij
ij
mm
0
2
21π
= where m0ij and m2ij are as defined above.
pi = Weighting factor for the ith sea-state.
pj = Weighting factor for the jth heading.
This leads to the development of the total stress range equation given below for the long-
term stress range distribution:

38
( )==
∆∆ =headings
esallseastat
jiijij pijFrF
1,1
σσσ (2.13)
Where:
ijp = The probability of occurrence of a given sea-state and heading.
0vv
r ijij = The weighted function that consist of the crossing rate in a given sea-state and the
average crossing rate.
= ijij vpv0 The average crossing rate.
2.10.5 Extreme Loads, Long-term Response and Damage ToleranceThe procedures presented above will account for the entire spectrum of loads to be
included in both the fatigue and damage tolerance analyses. With the presence of the extreme
loads that will occur over the long-term exposure of the vessel a complete damage tolerance
analysis can be developed. The phenomenon of extreme loads, or overloads, and damage
tolerance is discussed further in Section 6 of this report. In summary, it is interesting to note that
the time to failure of a detail that experience’s overloads can exceed the time to failure of the
same detail subjected to constant or moderately variable loads. This counter-intuitive behavior
has to do with crack retardation that occurs at the crack-tip as a result of the overload.
2.11 The Alternative Method – Fatigue Assessment Using Measured Loads
Also shown in Figure 2-1 is the Alternative Method for the development of load and
stress information acting on a vessel. This method is not analytic. It relies on the development
of physical models of the ship and measuring or monitoring the response to determine the loads.
The models are subjected to tank testing or other procedures that allow for the instrumentation
and measurement of loading and response information. It is intended that the model will be
operated in a series of environments that reflect the operating environment of the vessel being
deigned. It is necessary to be able to control the environment and the operating parameters of the
vessel such as speed and heading relative to the sea-state. The model will be equipped with
strain gauges and other relevant equipment to measure and record all loads and responses to the
loads. This information can be used to develop stress ranges and stress histograms for use in a
Palmgren-Miner assessment.
39
The model associated with the vessel will be relatively coarse compared to the detail
required for the local investigation concerning the behavior or response of any given detail on
the ship. Therefore, it may be necessary to take the loading information developed during the
tests and use this as input to a finite element analysis. This will allow for a complete
development of the stress transfer functions required for the analysis.
A second option available for gathering measured data is to use existing vessels. These
too can be outfit with the required strain gauges and data gathered over their typical operating
routes. While this has the benefit of using existing craft on routes that may be similar to design
routes for future vessels, it also has the drawback in the control of the environments for which
data can be gathered. Tank tests using models can control the environment to develop a full
spectrum of responses whereas using existing craft may limit the environments due to other
operational constraints experienced by the craft in the more extreme sea-states.
2.12 References
[2-1] DNV Rules for Classification High Speed and Light Craft, January 1998.
[2-2] ABS Guide for Building and Classing High Speed Craft, February 1997
[2-3] Wilhelmsen, O., Hull Structural Damage and Repairs, Det NorskeVeritas May 2000.
[2-4] Ferraris, S., Structural Design, Production and Operational Experience of SuperseacatFast Ferries, Fincantieri C.N.I Naval Vessels Business Unit, May 2000.
[2-5] Aluminum Design Manual published by the Aluminum Association, 1994
[2-6] DNV Fatigue Analysis for High Speed Craft, preliminary release, Dec. 1999.
[2-7] DNV Fatigue Assessment of Ship Structures, Classification Notes No 30.7, Sept. 1998.
[2-8] SSC 402 Guide to Damage Tolerance Analysis of Marine Structures, 1997.

40
[2-9] Tveiten B. W., and Moan T., Fatigue Analysis of High Speed Aluminum Catamarans, 3rd
International Forum on Aluminum Ships, May 1998.
[2-10] Fredricksen A., Fatigue Aspects of High Speed Craft, FAST 1997.
[2-11] ABS Rules for Building and Classing Steel Vessels Under 61 Meters (200 Feet) in
Length
[2-12] Heggelund. S., Tveiten, B. W., Moan, T. Fatigue assessment of Large Catamaran
[2-13] Heggelund, S. E., Tveiten, B.W. and Moan, T. Global Structure Analysis of Large
Catamarans. Fifth Int. Conference on Fast Sea Transportation, Seattle, Aug. 31-Sep. 2, 1999.
[2-14] Pettersen, O and Wiklund, K. M. (1999). Det Norske Veritas Requirements for Direct
Calculation Methods of High Speed and Light Craft. Fifth Int. Conference on Fast Sea
Transportation, Seattle, Aug. 31-Sep. 2, 1999.
[2-15] Salvesen, N., Tuck, E. O. and Faltinsen, O. M. (1970). Shipmotions and Sea Loads.
Transactions, SNAME, Vol.78.
[2-16] Faltinsen, O. M. and Zhao, R. (1991). Numerical Prediction of Ship Motions at High
Forward Speed. Phil. Trans., Royal Soc., Vol. A334, London.

41
3. Fatigue
3.1 Development of the Fatigue Database
To help support the fatigue and damage tolerance analyses conducted in this report, a
database of references has been gathered and is presented in Appendix A. This database
represents a variety of references and industry standards used for the fatigue analysis of
aluminum structures. Some of these references discuss fatigue and damage tolerance analysis in
generic terms, not related to any specific material but provide the user with good information and
understanding. Appendix A also includes reference to the design codes from the maritime and
other industries that address fatigue along with a series of papers presented at the recently
completed 4th International Forum on Aluminum Ships.
Performing the initial research to start the development of the database it was necessary
to inquire about existing work that had already been done regarding the fatigue of aluminum.
Discussion with personnel at NAVSEA (Naval Sea Systems Command) and NSWC-CD (Naval
Surface Warfare Center – Carderock Division) revealed experience that had dealt primarily with
the damage suffered by the FFG 7 class of vessels in the areas of their aluminum superstructures.
It was not felt that this information was relevant to the current effort regarding high-speed
vessels for a number of reasons. This included the different functions and loading environment
being served by the aluminum applications and unknown design, fabrication and repair problems
involved with the FFG 7 problems. Among the information gained from the discussions with the
NAVSEA and NSWCCD personnel was contact with additional personnel in other areas
associated with aluminum craft.
One of the more important contacts resulted from discussion with Jeff Beach (NSWCCD)
[3-1], who provided introduction to Professor Wallace Sanders of the University of Iowa [3-2].
Discussion with Professor Sanders revealed significant work developed on his part in compiling
perhaps the first, large scale aluminum database. During the 1970’s and early 1980’s Professor
Sanders was involved in the development of an aluminum database. In the early 1970’s the
Welding Research Council (WRC) tasked Professor Sanders to prepare a WRC Bulletin on the
state of the art knowledge on fatigue of aluminum weldments. As part of that effort Professor
Sanders studied published works from the United States and around the world. In addition, with

42
the help of the research laboratories of the U.S. and Canadian aluminum industry, unpublished
data from these laboratories was made available. Although the private industry data was
restricted to an internal study by the University, WRC Bulletin 171 was published in 1972,
which covered studies of all of the data. The data available were the basis for the development
of the aluminum fatigue database. Over the next 15 years, Iowa State conducted studies on
fatigue behavior of aluminum weldments for the Welding Research Council, The Aluminum
Association and the U.S. Navy. The efforts continued on the expansion of the database. This
database was considered an industry standard and contained significant information on all
aspects of aluminum behavior including fatigue. Unfortunately, all the information in the
database was based on small specimen testing similar to those shown in Figure 3-1, [3-3]. The
problem with these small specimens is the deviation from actual weldments. Actual details in a
ship’s structure are more complicated containing geometry effects, size and scale effects along
with the base metal, weld metal, the residual stresses in the HAZ, potential imperfections in the
weld area and other factors.
Although the Sanders work represented a powerful database at its time it has since been
updated and expanded. In the early 1980’s, Professor Sanders joined in the data bank efforts
with Professor Dimitris Kosteas of the Technical University of Munich (TUM). Since most of
the research was being conducted in Europe, the focus of the work on the data bank transferred
to Munich being conducted jointly by Professors Sanders and Kosteas. Much of the effort
centered around the work of the Task Committee on Aluminum Structures of the European
Convention on Constructional Steelworks. The continuation of the efforts on the data bank
transferred completely to TUM in the mid 1990’s and the effort shifted to support the European
Community codes. Professor Kosteas inherited the work of Professor Sanders and expanded
upon it to include large specimen testing and the effects of adverse environments. The work
developed under Professor Kosteas forms the basis for the fatigue and damage tolerance
information and design processes contained in EuroCode9, a preliminary release for a new
European design standard for aluminum.
Discussion with other respected individuals in the field of aluminum continually cited
Professor Sanders and Professor Kosteas as the appropriate points of contact for information
regarding aluminum database information.

43
A List of Contacts, Appendix F, was compiled to help document the sources interviewed
for the database development for this report. The list compiled in Appendix F was not intended
to represent each time a given individual was contacted, only the fact that they were contacted
for the report.
Figure 3-1 Typical Small Specimen Geometry
3.2 Brief History of Fatigue
Fatigue induced cracking and failures are commonly recognized occurrences not
unknown to the layperson. It has been responsible for many structural and mechanical failures
causing various accidents throughout history resulting in the loss of human life, property and
unnecessary monetary expenditures. Around the 1840’s the fatigue phenomena was first
identified. During the 1850’s and 1860’s extensive research was conducted by August Wohler
who conducted a number of tests on a variety of specimens that were exposed to cyclic loadings.
He then introduced the S/N Diagram (Wohler curve) which plotted the life of a specimen as a
function of its stress level. These diagrams demonstrated the decreasing life of a specimen for
increased stress levels and conversely, showed that the number of cycles sustainable by a
specimen increased as its stress level decreased. The S/N Diagrams have continued to be a very
useful tool in the fatigue design process ever since.

44
During the 1920’s Palmgren suggested a criterion for fatigue damage on structural details
and Miner formulated a damage summation method called cumulative fatigue damage criterion.
It was based on the Palmgren suggestion and is today referred to as the Palmgren-Miner
cumulative damage analysis.
The combination of these two procedures and the development of the Palmgren-Miner
cumulative damage assessment technique has made it possible for the safe and simplified fatigue
design of numerous structural and mechanical details in a wide variety of applications.
Similarly, the use of the Palmgren-Miner technique will form the foundation of the fatigue
analyses presented for use in the maritime industry for high-speed craft.
3.3 The Fatigue Environment
There is a wide range of factors that contribute to the fatigue environment and they
include:
• Constant or Variable amplitude loading.
• The stress ratio and stress range resulting from the loading.
• The effects of mean stress.
• The size and geometry of the detail.
• The stress concentrations acting through the detail.
• The corrosive or aggressive nature of the environment in which the detail functions.
As stated above, fatigue is the damage resulting from the cyclic loading and unloading of
a structural member with a resultant variation in the stresses. Damage from fatigue only occurs
in the region of a detail that deforms plastically or experiences plastic stresses during the loading
cycle. Since ship structures are typically designed within the elastic range of the material it can
be assumed that stress raisers must be increasing the local stresses to levels above the yield of the
material. After undergoing enough cycles of yielding cracks will develop. In the case of
obvious geometric changes or welding imperfections, the sources for these stress raisers is
obvious and on the macroscopic scale. For smooth specimens with no apparent stress raisers
visible to the naked eye, the stress raisers occur at the microscopic level such as slip bands, grain
boundaries and inclusions or voids.
The stress ratio mentioned above, is the ratio between the minimum and maximum
stresses acting at a point. It is defined as:

45
max
min
σσ
=R (3.1)
Figure 3-2, [3-11], gives a graphic example of the potential fluctuations in R:
Figure 3-2 Range of Variations in the Stress Ratio, R.
A typical S/N diagram for steel is shown in Figure 3-3, [3-11]. This figure shows that a
material, or detail, can withstand a virtually infinite number of load cycles if the maximum stress
never exceeds a certain value, i.e., the so-called fatigue or endurance limit. If the fatigue limit of
a material is exceeded crack initiation will occur. Aluminum, on the other hand, does not display
a well-defined fatigue limit when subjected to random or variable load spectra. For specimens
subjected to variable loading cycles the maximum allowable stress range continues to decrease
as shown in Figure 3-4, [3-11]. This suggests that aluminum details subjected to variable loads
will develop fatigue cracks regardless of their quality although the time to failure can be
significantly greater than the service life to experience the number of cycles required at such low
stress levels. For constant amplitude loading, design codes such as the Aluminum Association
do provide for a bi-linear S/N diagram. Reference [3-4] agrees that the presence of an endurance
limit can be defined for aluminum specimens subjected to constant amplitude loading. The
Aluminum Association suggests a change of slope at N = 5 x 10⁶ cycles for the constant
amplitude load scenario but has a constant, single slope S/N diagram for the variable load
spectra. This would suggest that designers of high-speed craft should follow the same
guidelines. For structural details subjected to constant amplitude loading spectra it would be
acceptable to define a fatigue limit for the material. For variable amplitude loads, the principal

46
subject of this report, no such change in slope should be allowed or expected in the behavior of
the material.
Figure 3-3 Typical S/N Diagram For Steel
Figure 3-4 Long Life Fatigue for Aluminum

47
3.3.1 Effects of Seawater on Fatigue of AluminumAs shown in Figure 3-5, [3-4] fatigue tests were performed on a number of 6061-T4
specimens with R = 0.1. The specimens ranged from smooth to containing stress concentration
factors up to Kt = 12. Two smooth specimens were tested, one in air and the other in seawater.
The figure demonstrates the rapid loss of strength for the seawater specimen as the number of
cycles increases. For cycles greater then N = 107 the strength of the smooth specimen in
seawater is rapidly approaching the strength of the specimens tested in air with a stress
concentration notch factor of Kt = 12. This presents a very graphic demonstration of the
degrading effects of seawater on the long-term fatigue life of aluminum. The smooth specimen
data would rarely be appropriate for actual high-speed craft details and it must be assumed that
stress concentration factors on the order of Kt = 3 would not be unusual as a minimum.
Combining this with the accelerated deterioration experienced with the smooth specimen
suggests the reduced fatigue life available to aluminum details in the marine or seawater
environment.
Figure 3-5 Effect of Seawater on Aluminum Fatigue TestsThere was no available data on the behavior of notched specimens subjected to the
seawater environment. While it might seem that the individually deleterious effects of notches
and seawater would further accelerate the loss of fatigue strength when operating together, it is
recommended that this would be another area requiring further research to establish fatigue
behavior of aluminum under these combined effects.
The data provided in Appendix E also demonstrates the deleterious effects of the marine
environment on the fatigue lives of simple aluminum specimens compared to their behavior in

48
air. The effects of the aggressive marine environment certainly needs to be included in any
design procedures developed in the future or used as a result of this report. Additional research
is required to quantify the magnitude of the corrections that should be included for the design of
such details.
Among the results from the specimens tested in seawater was the beneficial effect of a
paint or coating system applied to the aluminum. Further testing would be required to determine
the increased fatigue life which could be used for design but recommended practice would
suggest the use of painting systems in the areas of a high-speed craft susceptible to fatigue.
3.4 Fatigue Aspects of Aluminum
This section discusses three particular aspects of welded aluminum and compares them
with steel as appropriate. Limited data on aluminum was found for the first two subjects, which
suggests that additional research may be required. The third area is well documented and will
not require any additional research. These three aspects are:
1. The mean stress effect and stress ratio.
2. The effect of alloying elements on the fatigue behavior of aluminum.
3. The strength of welded and unwelded aluminum specimens.
3.4.1 Mean Stress Effect and Stress Ratio in Steel and AluminumThe stress ratio, R, has been previously defined in equation (3.1) as the ratio between σmin
and σmax. Figure 3-2 provides a graphic display for the stress ratio with three separate plots, all
of which are depicted to have the same waveheight or amplitude, i.e., all three plots have the
same stress range where:
minmax σσσ −=∆=eStressRang (3.2)
The mean stress is calculated as:
2minmax σσσ +
== mMeanStress (3.3)
The critical difference between stress range and mean stress is demonstrated in Figure
3-2(b) and (c). Both of these plots demonstrate the same stress range but the loading depicted by
3.2(c) has a greater mean stress than that displayed in 3.2(b).
It is generally accepted that the fatigue life of steel weldments is relatively insensitive to
the stress ratio, R, and the mean stress, σm. This is a result of the tensile residual stresses near

49
the toe of a steel weldment which approach the yield strength of the material. As a result, any
cyclic loading applied to the detail will stress it from yield to some lesser value. Therefore, the
stress range, ∆σ, is usually adequate to determine the fatigue life of a steel detail.
Discussion presented in [3-4] suggests the same behavior for aluminum weldments as
that described above for steel. Tensile residual stresses approach the yield strength of the base
material in the toe of the weldment and the cyclic stress ranges from the yield strength of the
material to some lesser value. Under these circumstances, the stress range acting upon the detail
is critical for design while neither the stress ratio nor the mean stress has a significant influence
on the design.
Meanwhile, data presented in the appendices of [3-4] suggests a potential discrepancy
with the discussion presented above. As shown in Figure 3-6, the effect of stress ratio appears to
have a pronounced effect on fatigue life. This figure was assembled from the data in Appendix
A of reference [3-4], Figures A.2 and A.3.5, and was developed from axially loaded, transverse
butt-welded 3/8 inch aluminum plate test specimens. It suggests a rather strong dependence of
the fatigue life on the stress ratio of the loading environment. The pulsating tension loads, R = 0,
0.5 and 0.75 depict the expected trend for smooth or unwelded specimens with a decrease in
fatigue life resulting from an increase in the positive value of R. Additional investigation of the
experiments conducted for the data in Appendix A of [3-4] needs to be undertaken for a better
understanding of the results before any conclusions can be drawn.

50
10 2 10 3 10 4 10 5 10 6 10 7 10 8
Life,cycles
10
StressRange,
ksi
4
40
R = 0.75
R = 0.5
R = 0
R = -1
R = -0.5
Figure 3-6 Effect of Stress Ratio on Fatigue Life of Aluminum
In addition to the information in Figure 3-6, Figure 3-7 also suggests a dependency of the
fatigue life on the stress ratio of the applied loading. Taken from “Welding Alcoa Aluminum”,
1972, [3-5] the fatigue tests performed on this simple specimen show a pronounced effect of the
stress ratio on the fatigue life as early as 2000 cycles into the loading history.
As a result of the conflicting information gathered during the research for this report, it
must be concluded that the effects of stress ratio cannot yet be determined for aluminum alloys.
This suggests that additional research is required to determine the effects of stress ratio and the
manner to account for this effect during the design process.
For unwelded aluminum alloy specimens or structures, the fatigue strength is influenced
by the mean stress and the stress ratio. This needs to be accounted for in design although no
information was found to suggest the manner in which the fatigue resistance should be reduced
for this situation in the design process. For the unwelded specimen tensile stresses will cause
crack initiation and propagation while portions of the loading cycle that cause compressive

51
stresses will prolong the time to crack initiation and impede propagation. For a given stress
range, the fatigue life decreases as the mean stress is increased.
Figure 3-7 Effects of Stress Ratio on 5154-H34 Aluminum
3.4.2 The Effect of Alloy on Aluminum Fatigue BehaviorSharp, Nordmark and Menzemer, [3-4] report that the fatigue behavior of aluminum is
effected by the alloying elements at low fatigue lives. The differences between the weldments of
different alloys tends to be minimized at longer fatigue lives due to the welding residual stresses
and typical stress concentrations inherent in the fabrication. The same is true of smooth
specimens, i.e., the fatigue life reflects the tensile strength of the alloy at shorter lives but this
difference is minimized for longer lives. This is consistent with the behavior for steel alloys with
different yield strengths, i.e., for long lives the fatigue strengths of steel tend to approach a
common design value.

52
Data taken from [3-4] was manipulated to develop the information in Figure 3-8 and
Figure 3-9. The information in these figures demonstrates the trend in this behavior for the
longer fatigue lives of interest to this report.
102 103 104 105 106 107 108
Life, cycles
10
StressRange,
ksi
4
40
StressRatio, R
0.750.50-0.5-1
5083-H321
5154-H34
7061-T63
6061-T6
Figure 3-8 Axially Loaded, Transverse Butt-Welded 3/8 inch Aluminum Plate
102 103 104 105 106 107 108
Life,cycles
10
StressRange,
ksi
4
40
Heat-Treatable
Non-Heat-Treatable
Figure 3-9 Axially Loaded, Transverse Butt-Welded 3/8 inch Aluminum Plate

53
Further confirmation for the influence of this effect is also demonstrated in Figure 3-10.
This figure was taken from [3-5] and agrees with the conclusions presented by [3-4] that the
effect of alloy is significant early in the fatigue life of a specimen but this dependence tends to
disappear at longer fatigue lives. For consideration in the design of fatigue resistant details in
high-speed aluminum craft, the details would all be considered long life relative to the
information shown in these figures. This would suggest that the effects of alloy should not be a
concern during the design stage of the details.
The conclusion presented above contradicts the findings reported in Sections 3.9.1 and
3.9.3 of this report regarding the comparison between 5083 and the new alloys, 5383 and 5059.
The results presented in [3-6] and [3-7] respectively, and reflected in this report, suggest that the
high-cycle fatigue life of 5383 and 5059 is greater than that of 5083 at 107 cycles, see Figure
3-21 and Figure 3-24. Discussion presented in [3-6] suggests the premature nature of their
findings and the need for additional fatigue testing. The authors of this report agree that in order
to refute the primary findings, which suggest the effect of alloy on long lives is not critical,
additional fatigue testing of both 5383 and 5059 would be required. This testing would have to
be conducted by sources other than the developers of the alloys to confirm the long-term fatigue
behavior of all three alloys.
Figure 3-10 The Effect of Alloy on the Fatigue Life of Aluminum

54
3.4.3 The Strength of Welded and Unwelded Aluminum SpecimensIt is well known that the process of welding aluminum reduces the strength of the parent
metal through the heat-affected zone so that it is not possible to take advantage of the full,
unwelded strength of the material.
This same effect does not occur in steel weldments and the yield strength of the parent
metal is used as the baseline for all design calculations. (Although there is some evidence that
the HAZ of TMCP steels may be softened.) Also, in quenched and tempered (Q&T) structural
steel, a portion of the HAZ may be softened, i.e., of lower strength than the base metal, but the
change may not be as significant as the change in heat-treated aluminum. All factors of safety
are developed relative to the properties of the parent steel in the weldment with no reduction in
strength as a result of material changes through the HAZ. The U.S. Navy has developed an
empirical relationship to define the allowable working stresses of the various steel alloys
typically used for combatant construction. This is shown below as equation 3.4: [3-8]
( ) ( )[ ]26.1/15.2/5.0 ymb FFF += (3.4)
Where: Fb = the allowable working stress.
Fm = the ultimate tensile strength of the material and,
Fy = the yield strength of the material.
This empirical relationship tends to develop allowable working stresses for the lower
grades of steel that are a higher percentage of the material yield strength. This occurs because of
the greater spread between the yield and ultimate tensile strengths for the lower grades of steel
alloys.
Table 3–1 [3-8] shows the acceptable values for the yield strength of welded and
unwelded parent material used for the design of aluminum weldments in accordance with US
Navy practice. As noted by the values in this table, the reductions in the yield strength of the
aluminum weldment are significant compared to the yield strength of the unwelded material.
The allowable working stresses shown in Table 3–1 are developed in accordance with
NAVSHIPSINST 9110.46
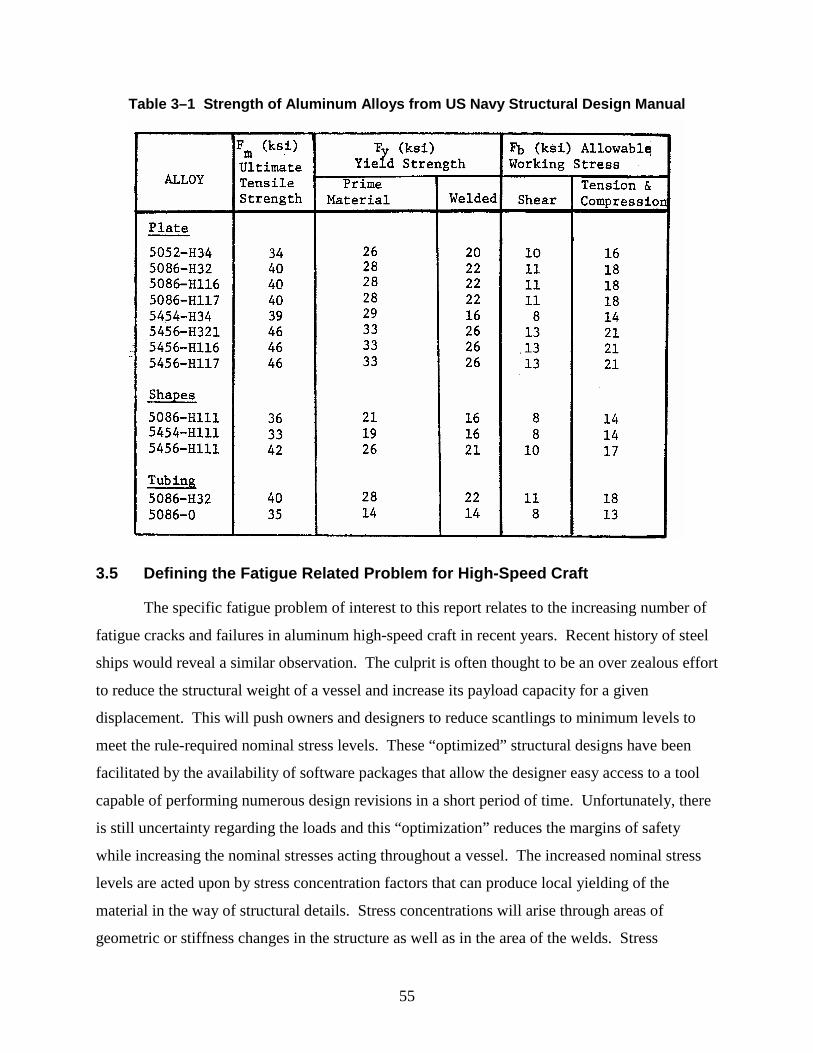
55
Table 3–1 Strength of Aluminum Alloys from US Navy Structural Design Manual
3.5 Defining the Fatigue Related Problem for High-Speed Craft
The specific fatigue problem of interest to this report relates to the increasing number of
fatigue cracks and failures in aluminum high-speed craft in recent years. Recent history of steel
ships would reveal a similar observation. The culprit is often thought to be an over zealous effort
to reduce the structural weight of a vessel and increase its payload capacity for a given
displacement. This will push owners and designers to reduce scantlings to minimum levels to
meet the rule-required nominal stress levels. These “optimized” structural designs have been
facilitated by the availability of software packages that allow the designer easy access to a tool
capable of performing numerous design revisions in a short period of time. Unfortunately, there
is still uncertainty regarding the loads and this “optimization” reduces the margins of safety
while increasing the nominal stresses acting throughout a vessel. The increased nominal stress
levels are acted upon by stress concentration factors that can produce local yielding of the
material in the way of structural details. Stress concentrations will arise through areas of
geometric or stiffness changes in the structure as well as in the area of the welds. Stress

56
concentrations in the way of welds can compound the stress concentrations resulting from
geometric increases. As a result of welding, stress concentrations can arise for numerous
reasons, including voids or inclusions contained within the weld, lack of fusion, cracking or weld
undercut. Further discussion concerning stress concentrations is presented later in this report.
Due to the predominance of steel vessels in the navy and commercial maritime industries,
there is a fairly significant database of fatigue related information for steel ships and techniques
available to reduce the fatigue related problems. Although many of the techniques used to
reduce or control the fatigue of aluminum details would be the same as those used for steel ships,
a similar database of information relative to the fatigue of aluminum weldments in the marine
environment does not currently exist.
3.6 The Fatigue Crack
Brief discussion regarding the fatigue crack is presented in this section. Further detail is
developed in Section 6 of this report.
Cyclic loading is not a problem unless cracks are initiated as a result of its action. It is
generally recognized that all weldments contain microscopic fissures at the crystalline level in
both the parent metal and the weld metal deposited during fabrication.
Basically, there are three phases in the life of a fatigue-induced crack:
1. Crack initiation.
2. Crack propagation.
3. Failure (growth of the crack to its critical crack size.)
Problems only exist when the time until crack initiation is less then the service life of the
vessel. For all such scenarios it is necessary to have inspection schedules that monitor the
condition of a detail and insure that crack propagation is proceeding as predicted by the damage
tolerance analysis. Repair and maintenance are critical to areas determined to be prone to fatigue
cracking. For critical or inaccessible details it is recommended that the design be developed to
insure crack-free service lives greater than the service life of the vessel or application, i.e., a
Safe-Life design philosophy. Appropriate factors of safety need to be included in these analyses
depending on the critical nature of the detail and the consequences of its failure.

57
Figure 3-11, [3-9], provides a schematic representation of two crack initiation sites.
These locations, at a deep bracket in a transverse web frame, indicate the effects of poor detailing
combined with the stress concentrations resulting from the geometry of the bracket.
Figure 3-11 Typical Crack Initiation Sites
Figure 3-12, [3-10], presents a photograph of a fatigue-induced crack not typically
thought of as a problem in ship structural design. The stress concentration effects at the cover
plate detail, along with any stress raisers that may have been introduced when welding the cover
plate, can also cause fatigue problems. Figure 4-6 demonstrates some of the stress concentration
effects associated with various details.

58
Figure 3-12 Fatigue Crack at Cover Plate Detail
3.6.1 Crack InitiationCrack initiation occurs under the cyclic action of plastic deformation at either the macro-
or microscopic level. The critical number of cycles for crack initiation to occur will vary
depending upon the stress levels and stress concentrations experienced through the detail. As the
load magnitude increases the number of cycles required for crack initiation will decrease. It is
important for the designer to recognize the methods for controlling the onset of crack initiation.
In general, it is important to minimize the stress concentrations to the greatest extent practicable.
Most detailing and practices used for improved fatigue behavior in steel also apply to aluminum.
It is important that notch effects are minimized and that welding is performed in accordance with
acceptable and appropriate procedures for the application. Extending the crack-free portion of a
detail’s life is easiest to influence during initial design. Prediction of crack propagation rates and
time to failure is much riskier and requires more inspection during the life of the vessel.
Research conducted for this report also reveals a lack of crack propagation rate information for
aluminum in the marine environment, further complicating this phase of the design.
For use in the marine industry, crack initiation is often defined as the time when a visible
crack length can be seen during routine investigation. It is often assumed that the crack will have
a length between 6 mm (¼”) and 12 mm (½”) at the definition of crack initiation. This

59
represents an arbitrary definition and needs to be more completely defined, perhaps relative to
the function, location or size of the detail in question. Similar to steel ships, it can be difficult to
find cracks of lengths exceeding 150mm (6”) during the routine survey of an aluminum craft. If
future survey experience demonstrates the difficulty in detecting cracks below a certain limit this
can be factored into the design of damage tolerant details. The analysis for such details will have
to insure that the structure is acceptable until this minimum crack size can be assumed to be
readily detectable through a routine survey with a given level of confidence.
3.6.2 Crack PropagationAfter the crack has been initiated it will continue to grow as long as the cyclic loading
continues. The stress concentrations in the area of the crack tip also increase as the crack
propagates. Therefore, nominal stresses that caused minimal or no damage prior to crack
initiation can now become damaging load cycles. Figure 3-13, [3-11], demonstrates the plastic
zone at the crack tip of a test specimen and actual structural element. It indicates that plasticity
will always be present regardless of the load magnitude once the crack has been initiated.
Figure 3-13 Schematic of crack-tip plasticity in test specimen and structure.

60
Damage tolerance analysis addresses crack propagation using fatigue-crack-growth-rate
(FCGR) curves, an example of which is shown in Figure 3-14, [3-11]. These curves plot the
crack extension per cycle (da/dN) vs the difference between maximum and minimum K values
for each cycle (∆K) where K is the crack tip stress-intensity which is a function of applied stress,
crack dimensions, the extent of plasticity at the crack tip, and geometry. For crack propagation
in a linear-elastic material the general formula for K is:
( )aYK πσ= (3.5)
Where: K = Crack tip stress intensity factor. See Section 6.4 of this report for discussion
on the failure modes.
Y = geometric factor.
σ = applied global stress.
a = crack length.
Figure 3-15, [3-12], shows a plot of some actual FCGR curves for various aluminum
alloys in a benign environment. These crack growth rates correspond to regions II and III, the
sections of constant and accelerating crack growth rate, as shown in Figure 3-14.
Figure 3-14 Typical Fatigue Crack Growth Rate, FCGR Curve

61
Figure 3-15 Actual FCGR data for various aluminum alloys in a benign environment.
3.6.3 Critical Crack Length or FailureA crack will continue to propagate in accordance with Figure 3-14 as it progresses
through region II and into region III. Eventually the crack growth rate will accelerate and the
structure, or detail, will exceed the residual strength of the member which will then fail from any
number or combination of damage mechanisms. These include the possibility of fracture,
buckling, tearing or plastic collapse. The length of the crack at fracture is defined as the critical
length and although the fracture toughness is constant for a given material, the critical crack
length varies with the application and operating environment of the detail utilizing a given
material. The critical length will be a function of a number of variables. These include:
• The toughness of the material used for the detail.
• The size and geometry of the detail containing the crack.
• The stress range and stress concentration effects acting through the detail.
After a fracture mechanics analysis has determined the critical length for any given detail, it
will be necessary for the designer to determine an allowable crack length. This would be some

62
reduced percentage of the critical length, i.e., the allowable crack length may be taken as 50% of
its critical length. Various factors for each detail may influence the decision for determining the
allowable crack length. These would include:
• The structural redundancy in way of a particular detail.
• The consequences of failure of the detail.
• The accessibility of the detail for inspection, maintenance and repair.
There may be some detail functions or locations that are not allowed to sustain any crack
damage during their entire service life. These would require details typically termed as “Safe-
Life”. Other details will sustain some crack damage prior to the end of their service lives and
these are termed “Fail-Safe”.
The critical crack length would only be defined for details that are part of the Fail-Safe
category. Typically, this would be a crack length above which there is too great a risk for
complete loss of structural integrity, load carrying capacity or some other catastrophic type of
failure. This could include loss of cargo or payload such as a leak through a tank resulting in
discharge to the environment.
The critical crack length can be determined analytically or empirically depending on the
function of the detail. The concepts of Safe-Life and Fail-Safe design are discussed below.
3.7 Safe-Life and Fail-Safe Definitions and Design Philosophies
The Safe-Life and Fail-Safe design philosophies were developed by the aircraft industry
[3-13]. Along with damage tolerance they are defined as:
• Safe-Life - Safe-Life components are those whose failure would result in the
catastrophic loss of a structure. Safe-Life components must remain crack-free during
their entire service life.
• Fail-Safe – Structure will support load with any single member failed or partial
damage to an extensive portion of the structure. Remaining stiffness is adequate to
prevent excessive vibration or deflection, etc.
• Damage Tolerance – Ability of a structure to sustain anticipated loads in the presence
of fatigue, corrosion or accidental damage until such damage is detected through
inspection or malfunction and repaired.

63
For a Safe-Life design the aircraft industry required a significant margin of safety for the
predicted time to crack initiation compared to its intended service life. This relationship was
established as:
service life life from fatigue analysis or testslife reduction factor
=
where the life reduction factor could range from 2.36 (based on 4 test specimens) to 3 ( based on
1 test specimen) for FAA applications to 4 for the USAF.
The technology associated with fatigue and damage tolerance allows the designer
flexibility when developing the initial design. The flexibility allows development of details with
a service life greater than the service life of its application using fatigue design technology only.
Alternately, the designer can also develop details with fatigue lives less than the service life of
their application. The latter requires the use of fatigue and damage tolerance technology where
the damage tolerance analysis can predict the time to failure using crack growth rate and loading
data to predict the total life of the detail before the critical crack length is developed.
The two design philosophies described above reflect the Safe-Life and Fail-Safe designs.
The preferred method is the Safe-Life design. It is characterized by having a life to fatigue crack
initiation greater than its intended service life. The Fail-Safe design is characterized by details
with fatigue lives that are less than their intended service life.
3.7.1 The Safe-Life DesignA Safe-Life design is one with a life to crack initiation greater than the service life of the
vessel, i.e., there will be no crack initiation in the detail until after the service life of the vessel
has been exceeded. A Safe-Life design will be developed for critical details where the result of
failure, defined as crack initiation, is catastrophic or where there is no load path redundancy after
the detail fails. Similarly, it will be recommended to develop Safe-Life details for applications
that do not permit ready access for inspection, maintenance or repair.
An Owner may also decide to employ the Safe-Life design philosophy if analysis shows a
nominal increase in initial cost compared to the life cycle costs required to inspect, maintain and
repair a detail that is less fatigue resistant developed in accordance with the Fail-Safe approach.
This trade off should be developed for all Fail-Safe details.

64
3.7.2 Fail-Safe Design and Damage Tolerance AnalysisA Fail-Safe design has a life to crack initiation less than the service life of the vessel, i.e.,
it is predicted through calculation that crack initiation will take place in the detail prior to the end
of the service life of the vessel. As part of the Fail-Safe design for use in the high-speed craft
industry, it will also be necessary for the designer to establish an inspection schedule for each of
the Fail-Safe details used in the design. This schedule should include inspections prior to the
expiration of the predicted crack-free life of the detail to insure behavior in accordance with the
calculations predicting the crack free portion of its design life.
A Fail-Safe design may be developed when the consequences of failure are not
catastrophic and when access for inspection, maintenance and repair can be readily achieved.
The designer proposing this approach should perform analysis or otherwise verify that redundant
load paths exist that can carry the loads shed by the detail, should total failure occur, without
becoming overstressed or resulting in other forms of unacceptable behavior, i.e., excessive
displacement. It is understood that the initiation of a crack does not typically define failure for a
Fail-Safe category detail. The critical extent of damage which defines failure, i.e., crack length
and depth, needs to be developed for all Fail-Safe details.
When assessing the adequacy of a structural system for a Fail-Safe design, the designer
needs to consider the effects of aging on that system. Swift and Goranson discuss this effect
relative to aircraft structures in a number of papers. For ship systems, the effects of aging can be
accounted for by assuming certain material wastage toward the end of a vessels life to determine
the stresses that will be acting in the vessel at this time.
3.7.2.1 Brief Example of Safe-Life & Fail-Safe DesignsThe following examples help to explain the relationships between the different design
philosophies for fatigue resistant design. The first example is included to demonstrate an
unacceptable Safe-Life design and emphasizes the factors of safety required for such as
evaluation.
Assume a proposed detail has an analytically predicted fatigue life, i.e., time to crack
initiation life, of 23.2 years while the vessel is designed for a 20-year service life. This may
seem like a Safe-Life detail because its fatigue life is predicted to be greater than the service life
of the vessel. However, upon closer inspection it is determined that this design only has a
margin of safety equal to 23.2/20 = 1.16. This would not be considered acceptable for a Safe-

65
Life design that typically will have a margin of safety on the order of 3 to 4 times the anticipated
service life. These higher margins include the use of conservative load estimates coupled with
conservative S/N curves. If the analysis cited above resulted in a crack free service life for the
detail equal to 77.2 years with a resulting margin of 77.2/20 = 3.86 a Safe-Life design could be
assumed. For the latter situation, it is not necessary to perform a damage tolerance analysis on
this detail because its crack free service life satisfies the Safe-Life design criteria.
The Fail-Safe analysis becomes required for details that are predicted to have crack-free
lives less than the service life of the vessel. For instance, a proposed detail is predicted to have a
fatigue life of 17.2 years for the same 20-year service life assumed above. This means that after
17.2 years of service, a crack will be initiated in the detail and this detail would be categorized as
Fail-Safe. Now it is necessary to perform a damage tolerance analysis if the structure is allowed
to sustain this crack as it grows.
For purposes of this discussion, it is assumed that crack initiation means a crack that is
visible to the naked eye and is taken to be 6mm (¼”) long. A fracture mechanics analysis is then
performed and determines that the critical crack length is 305mm (12”). The number of loading
cycles to reach this crack size will be developed as part of the fracture mechanics analysis. As
seen above, the crack-free life of the detail extends to within 2.8 years of the service life of the
vessel. Therefore, if the time to compile the critical number of load cycles determined by the
fracture mechanics analysis is more than 2.8 years the detail could be considered acceptable. If
the time to failure is less than 2.8 years it will be necessary to perform maintenance on this detail
prior to the end of the service life of the vessel or replace the detail with something predicting a
greater service life. These are all depicted in Figure 3-16.
Regardless of the results of the fracture mechanics analysis and the decisions regarding
the use of the detail, it will be necessary to inspect the detail prior to the predicted end of the
crack-free life. Similarly, inspection will be required during the “crack propagation” phase of
the detail’s service life to insure that the crack is progressing at the rates predicted by the
analyses. Should the crack growth exceed this rate at any time prior to or after the predicted
crack-free life it will be necessary to revise the fracture mechanics predictions and the associated
inspection schedule.

66
Figure 3-16 Schematic Representation of Fatigue Life to Service Life
3.8 Welding and the Introduction of Crack Initiation Sites
The discussion presented in this section represents well-known technology and
phenomena. The discussion presented on this topic along with Figure 3-17, Figure 3-18 and
Figure 3-19 is taken from Barsom and Rolfe [3-12].
The development of welding technology has allowed for the design and construction of
new systems that were not possible using riveted construction. Increased fabrication rates,
automated welding procedures and computer controlled welding have all revolutionized various
aspects of different industries. Similar to any other technology or process improvement, welding
too has introduced certain concerns that need to be addressed to insure optimal utilization of the
process.
When a structure is welded there are three different characteristics that can be introduced
to the weldment. All three are important in the present discussion and can lead to fatigue and
fatigue cracking problems. The welding procedure can introduce residual stresses, stress
concentrations and imperfections to the weldment, all of which can effect the fatigue behavior of
the detail. These are reviewed below to remind the designer of these phenomena and the ability
to control certain aspects during the design and fabrication process.

67
3.8.1 Residual StressesThe welding process introduces residual stresses into the welded joint. A three
dimensional state of residual stress is set-up in the weldment with the maximum tensile stresses
approaching the yield stress of the deposited weld metal. The tensile residual stresses tend to
extend from the toe of the weld to the root or other toe and can compound environmentally
induced tensile stresses helping to aggravate any fatigue problems through this area.
When a weld is produced the molten filler metal sits in a cavity alongside the pieces to be
joined. As the filler metal cools, it contracts along the length of the weld (longitudinally) and at
right angles to the weld (transverse) (as well as through the thickness). This contraction is
resisted by the surrounding base metal which has remained at or near ambient temperature. This
contraction results in residual tensile (+) and compressive (-) stresses as indicated in Figure 3-17.
Figure 3-17 Residual Stresses For Butt-Welded PlateThe heat introduced by the welding process not only introduces residual stresses but also
weakens the aluminum alloys in the 5XXX and 6XXX series. The heat from welding will anneal
the 5000 series alloys and upset the specific heat treatments which were applied during the
precipitation hardening phase of the 6000 series. These two phenomena, the introduction of
residual stresses and the reduction of material strength in the HAZ have a measurable impact on
the strength of the material after welding. This is reflected in design codes with lower allowable

68
stresses for welded aluminum then for the base material. This is reflected in Table 3–1 taken
from the US Navy Structural Design Manual for Surface Ships, [3-8]. Note that the yield
strength and ultimate strength are consistently lower than the values shown in Table 1–1 for the
same alloys. This represents conservative design practice typical of a generic design code.
Similar strength reductions are not required for steel weldments.
Compressive residual stresses have been shown to offset the operational tensile stresses
and thereby relieve the fatigue environment. This is not an important consideration for the
current discussion because most of the compressive stresses are outside of the weld where tensile
stresses and fatigue dominate the scenario of concern.
3.8.2 Welding ImperfectionsCracks, inclusions, porosity, lack of fusion and weld undercut represent a few of the
welding imperfections that may be introduced by the welding process. These all represent
locations of potential crack initiation due to the resulting stress concentrations. Figure 3-18
presents a schematic view of a variety of the welding imperfections typically seen in ship, and
other, welded constructions.
3.8.3 Stress ConcentrationsUtilizing the welding process for construction will invariably result in stress
concentrations from weld imperfections or geometric discontinuities. A variety of stress
concentration cites are shown in Figure 3-19.
Figure 3-18 Potential WeldFlaws as a Result of Improper Welding

69
Figure 3-19 Stress Concentration Locations In Typical Welded Joints
3.8.4 Crack Initiation Sites in Steel and AluminumThe three sources of crack initiation sites discussed above are a product of the welding
process and will occur in welded steel joints and welded aluminum joints with similar
frequencies. Steel is a more tolerant material than aluminum regarding its resistance to crack
initiation as a result of these fabrication-induced problems. Recognition of these problems help
to emphasize the importance of developing welding procedures for aluminum that are correct for
the application and insure the quality control throughout the construction of the vessel.
Employment of qualified aluminum welders is also critical for the fabrication of vessels that will
minimize fabrication induced crack initiation sites.

70
3.8.5 Repair Welds in Aluminum DetailsIt is well known that when a crack appears in a steel structure or detail the quickest and
simplest fix is often employed, especially for a ship at sea. This “quick fix” solution for steel
typically back gouges the material in way of the cracked detail followed by re-welding of the
detail. This “returns” the detail to a “sound” condition and, assuming the continuation of the
same load history, will result in a detail with a somewhat reduced life compared to the original
detail. This same technique is also employed in way of cracked aluminum details.
Unfortunately, the results are not nearly as effective. The heat input from the repair weld can
initiate new fatigue cracks at weld defects and the crack growth rates may increase as a result of
the additional weld residual stresses. (The same flaws may result in steel weldment repairs.)
3.9 New Aluminum Alloys and Welding Techniques for High-Speed Craft
In recent years there has been a continuing increase in the demand for aluminum in high-
speed craft. At the same time, fatigue-cracking problems continue to increase repair and
maintenance costs because of the poor understanding surrounding this problem. One of the
solutions investigated at various facilities is the development of new aluminum alloys designed
for the rigors and demands of the marine environment. In particular this report presents a brief
review of three of these new alloys developed at the companies cited below.
• Pechiney Rhenalu alloy 5383, which is a variant of 5083 [3-6].
• Hydro Aluminum Maritime alloy RA7108, which is a variant of 7108 [3-14].
• AluStar 5059 which is also a derivative of alloy 5083 [3-7].
All three of these new alloys have been developed for the marine industry and
shipbuilding applications. There was no cost information available for any of these new alloys
although the articles citing them also reported that they have each been selected for use on new
ship design programs.
3.9.1 New Marine Grade Aluminum Alloy, Grade 5383One of the aluminum alloys most widely used for the production of high-speed craft is
5083 for plate components [3-6]. The Aluminum Association defined the chemical composition
for alloy 5083 in 1954 and it yields a material with a good combination of strength, formability,
corrosion resistance and weldability. This alloy is also available in a large number of tempers
that allow for broad application to many uses. Although 5083 performs well in its marine

71
applications it is important to realize that it was not developed specifically for this environment
and 5383 was developed to help optimize aluminum behavior in the marine environment.
With the development of new processing techniques it is now commonplace to control
the chemical composition, cleanliness and other parameters of aluminum and other alloys with
far greater precision than previously. Recognition of these controls and the possibility to
develop an alloy that retains the long-term reliability of 5083 led Pechiney Rhenalu to the
development of 5383. This alloy was specifically developed for marine applications and the
considerations of shipyard fabrication, weldability and ease of forming were all evaluated while
developing the new alloy.
In side-by-side corrosion tests, 5383 proved superior to 5083 in regards to both
exfoliation and pitting corrosion. Until recently, 5083 was the only alloy allowed in direct
contact with seawater because of its proven superior resistance to corrosion. It is now possible to
use 5383 for this application.
Table 3–2 presents a comparison of the mechanical properties of the unwelded 5083 and
5383 aluminum alloys. Table 3–3 provides a comparison of the mechanical properties for the
same two alloys after welding. In both instances, it is seen that 5383 has greater strength than
5083. As shown in Table 3–3, 5183 weld wire was used for all 5083 and 5383 test specimens.
Table 3–2 Mechanical Properties of 5083 and 5383 Alloys

72
Table 3–3 Welded Properties for Alloys 5083 and 5383
3.9.1.1 Fatigue Strength of 5383Figure 3-20 shows a sketch of the simple specimen that was used for fatigue tests
comparing 5383 to 5083. All the tests were performed with R = 0.1 on as rolled H116 plates.
Figure 3-21 shows the Wohler curves for the fatigue tests carried out on samples produced and
tested in a laboratory. Neither of the two curves shown in Figure 3-21 are explained in [3-6]
which provided this figure. It is not obvious that either curve correlates to either of the data
samples provided by the figure and seems to imply an optimistic behavior of 5383 by correlating
this alloy with the solid line and 5083 with the dashed line. However, there is no specific
discussion regarding these curves in [3-6] and both seem shifted to the right relative to the shapes
and alloys with which they seem intended to correlate.
Figure 3-22 shows the results for fatigue tests conducted on specimens that were
fabricated at a shipyard. The results of both samples suggest the same trend of increased fatigue
strength for the newer alloy, 5383. Additional fatigue testing is required and it is recommended
that future tests include large specimen details representative of shipbuilding. Regardless, the
preliminary results for both mechanical properties and fatigue behavior are encouraging for this
new alloy.

73
Figure 3-20 Small Specimen for 5383 Fatigue TestsAt the time [3-6] was written the new aluminum alloy, 5383, had been certified for use by
DNV, Bureau Veritas, Lloyd’s Register, Germanischer Lloyd’s and the Korean Register. It was
under review for certification at ABS and Nippon Kaiji Kyokai.
Figure 3-21 Fatigue Tests on 5083 and 5383 conducted at laboratory

74
Figure 3-22 Fatigue Tests on 5083 and 5383 details built at shipyard
3.9.2 New Marine Grade Aluminum Alloy, Grade RA7108Similar to 5383, Grade RA7108 was developed by Hydro Aluminum Maritime for
specific use in the maritime environment [3-14]. It is an AlZnMgZr based variant of the
commonly used alloy, AA7108. The alloy has proven superior weldability compared to
conventional aluminum alloys used in shipbuilding. The new alloy has proven superior
corrosion properties compared to AA6082 which is currently a common alloy for profiles. It has
also proven to be comparable, or sometimes better than, AA6082 for extrudability. The alloy has
potential for numerous structural applications and DNV has approved its use in two catamaran
ferry projects.
Table 3–4 demonstrates the yield and tensile strength properties of the few alloys allowed
by DNV, for use in high-speed, light craft. 7108-T79 refers to the older alloy that was used for
the baseline of RA7108.
Table 3–4 Design Properties for DNV Aluminum Alloys

75
The allowable stresses for the same alloys, in accordance with DNV rules for high-speed,
light craft are shown in Table 3–5. Table 3–6 compares the tensile strengths of alloy 6082 and
RA7108.50-T79 using two different welding procedures. Gas-metal arc, GMA, welding is a
traditional welding procedure used throughout the shipbuilding industry. Friction stir welding,
FSW, produces noticeably improved strength through the weld area. Friction stir welding also
results in improved ductility through the weld area as well as enhanced fatigue properties.
Table 3–5 Allowable Stresses for DNV Alloys
Table 3–6 Weld Strengths of Aluminum AlloysThe new alloy, RA7108.50-T79 shows promise for use in extrusions and profiles. It has
demonstrated extrudability superior to AA6082 and along with higher strength and increased
resistance to corrosion has displayed significant reason for consideration in the marine
environment. Specific fatigue data was not available for this alloy. Reference [3-14] makes a
number of comments inferring improved fatigue behavior relative to 6082 but presents no test
data. Regardless, this would be considered a new alloy and would require an increased test base
for fatigue samples regardless of those demonstrated by small specimen testing to date.

76
3.9.3 New Marine Grade Aluminum Alloy 5059The last of the new aluminum alloys reviewed by this report and developed for the
marine environment is Alustar 5059. Also a derivative of 5083, many of the mechanical, fatigue,
formability, corrosion and weldability properties are reported in [3-7]. Similar to 5083 and 5383,
Alustar 5059 is an aluminum/magnesium alloy that is not heat treatable. Figure 3-23
demonstrates the strength and elongation properties of Alustar 5059 compared to 5083 and 5383.
This figure suggests that the Alustar alloy exceeds the other two alloys in its mechanical
behavior.
Figure 3-23 Comparison of Material Strength for 5083, 5383 and 5059Figure 3-24 also demonstrates that the fatigue strength of the Alustar alloy exceeds that
of 5083. Unfortunately, the information in this figure has significant variation from the data
shown for 5083 by Pechiney Rhenalu in their comparison of 5383 to 5083. One possible
explanation could lie in the type of detail used for the fatigue tests, the information for which is
not provided by Alustar in [3-7]. Other variables reflected by the two tests would have to be
reviewed to establish a complete comparison. Regardless, comparison of these two figures
suggests that it is required that at least one independent test agency would have to test all three
alloys under consistent conditions before complete and meaningful comparisons could be
developed.
This result would also need further testing, along with 5383, to refute contradictory
evidence that suggests the effect of alloy does not have a pronounced effect on the long-term

77
fatigue life aluminum alloys, i.e., the long-term fatigue strength tends to converge to a similar
value independent of the yield strength of the material. Further discussion on this phenomena is
presented in Section 3.4.2 of this report.
Figure 3-24 Comparison of 5083 and 5059 S/N Curves
3.9.4 Friction Stir WeldingFriction stir welding is a relatively new technique to the marine industry although the
technology itself is not new. It can be used to join various materials including aluminum, zinc,
titanium and steel. There is an increasing interest for this welding procedure in the aluminum
marine industry in Europe where significant investment has been made to incorporate this new
procedure.
Friction stir welding does not require any consumables and creates the welded joint at a
temperature below the melting point of the material. This results in lower residual stresses in the
HAZ with better retention of strength through the weld. Figure 3-25 presents a schematic
overview of the setup required to effect the friction stir welded joint. As seen in this figure, a
wear resistant, rotating tool is placed between the two pieces of aluminum to be welded. The
probe at the base of the tool guides it along the weld joint. Vertical pressure is applied through
the tool as it rotates. This produces the friction necessary to generate the required heat, i.e., the

78
fusion temperature of the material, [3-15]. The vertical pressure also forces the two components
into the backing structure which is required to support the two pieces as they are welded. The
requirement for the backing structure is one of the drawbacks of the procedure and can require
extra setup that may become prohibitive for limited production. Elaborate machinery has been
developed in Europe for the production of flat panels used in aluminum maritime construction
and they are currently being used for an ever increasing range of applications.
Figure 3-25 Schematic of Friction Stir Welding OperationFriction stir welding has been successfully used on aluminum plate thicknesses ranging
from 3 mm (1/8 inch) to 51 mm (2.0 inches). It has also been used to join plates of different
thicknesses, the fillets between plates and stiffeners and honeycomb construction.
Three papers were recently presented on friction stir welding at the Fourth International
Forum on Aluminum Ships and they were:
1. Application of Friction Stir Welding for the Manufacture of Aluminum Ferries, Mr.
Stephan Kallee of The Welding Institute.
2. Application of pre-fabricated friction stir welded panels in catamaran building, Mr.
Ole Terje Midling of Hydro Aluminum Maritime.
3. Possibilities with Friction Stir Welded Aluminum Extrusions, Mr. Jan Backlund of
SAPA AB.

79
For a complete listing of all the papers presented at this forum, please see Appendix A.
3.10 References
[3-1] Telephone conference with Jeff Beach, NSWCCD on 3/26/99.
[3-2] Letter of CV provided by Professor Wallace Sanders including brief biographical
summary of database evolution and his role, including transfer to Professor Kosteas.
[3-3] Reemsnyder, H S. Development and Application of Fatigue Data for Structural Steel
Weldments, ASTM Special Technical Publication 648, Philadelphia, PA, 1978.
[3-4] Sharp, M. L., Nordmark, G. E., and Menzemer, C. G., Fatigue Design of Aluminum
Components & Structures, McGraw-Hill, 1996.
[3-5] Aluminum Company of America, (ALCOA), Welding ALCOA Aluminum, 1972.
[3-6] Raynaud, G. M., Gomiero, Ph., The Potential of 5383 Alloy in Marine Applications,
1997.
[3-7] Sampath, D. Dr., Aplications of the ALUSTAR Alloy AA5059 in the Marine Industry,
CORUS RD&T, 2000.
[3-8] NAVSEA 0900-LP-097-4010, Structural Design Manual for Naval Surface Ships, 1976.
[3-9] Sucharski, D., Crude Oil Tanker Hull Structure Fracturing – An Operators Guide, 1995
[3-10] Fisher, J. W., Fatigue and Fracture in Steel Bridges, John Wiley and Sons, 1984
[3-11] Anderson, T. L., Fracture Mechanics Fundamentals and Applications, CRC Press, 1995.
80
[3-12] Barsom, J. M. and Rolfe, S. T, Fracture and Fatigue Control in Structures, Applications
of Fracture Mechanics, Prentice Hall, 1987.
[3-13] Reemsnyder, H., Documentation provided for report for Safe-Life and Fail Safe design
definitions.
[3-14] Hval, M and Sande, V., A New High Strength Aluminum Alloy for Marine Applications,
1997.
[3-15] Metals and How to Weld Them. The James F. Lincoln Arc Welding Foundation,
Cleveland, OH, 1983

81
4. Fatigue Design of High Speed Aluminum Craft
This chapter provides information on the generic fatigue design for application to
aluminum weldments in high-speed craft. It presents a variety of options for stress calculations
including nominal, hot-spot and notch stress calculations. It discusses a variety of techniques to
determine the load distribution for long term exposure for development of the required
load/stress histograms for the fatigue assessment. Most of the techniques are described briefly.
Information regarding the fatigue behavior of various details and alloys is also presented in
Appendix E. The S/N curves provided in this appendix might be applicable to the details under
investigation for certain designs and can be used to help provide the information required for the
complete fatigue analysis.
Section 5 presents the fatigue design procedures used by various other industries. The
information regarding the procedures used by other industries is provided to demonstrate the
manner in which they handle the lack of explicit definition for all loads that may be acting upon
a given detail. The procedures used in other industries are also presented to allow the designer
the freedom of choosing a procedure that might better fit the design of a given detail. It must be
emphasized however, that the designer must incorporate appropriate factors of safety when using
the procedures developed for other industries.
It is worth restating that, regardless of the procedure selected for fatigue design and
analysis, there are many assumptions regarding loading and material behavior. In particular,
with regard to fatigue of high-speed craft, quantifying the primary and secondary loads acting on
the vessel is a new science in the early stages of development. It is suggested that the designer
select an analysis technique consistent with the stage of design, i.e., preliminary or final detail
design, and magnitude of the overall program. It is intended that this report assist the designer
during the design process and not impose burdensome procedures that result in frustration and
analysis that is inconsistent with the rest of the design. The gaps identified in the loading and
material behavior need to be filled with further research. In the meantime, it is still possible to
reduce the fatigue-related problems associated with the operation of aluminum high-speed craft.
This can be done using the knowledge and information that does currently exist and applying
either first principal solutions or the design codes utilized by other industries augmented with
appropriate factors of safety.

82
4.1 Palmgren-Miner Cumulative Damage Fatigue Assessment
The method used for the fatigue analysis is the Palmgren-Miner cumulative damage
fatigue assessment. The Palmgren-Miner assessment is a linear method that provides a
reasonably accurate, cost-effective result that is consistent with the level of available information
in the high-speed craft industry. The methodology assumes that every cycle of loading produces
some finite level of fatigue damage if the stresses generated by that cycle of loading are above
the endurance limit of the material. The Palmgren-Miner methodology sums the damage from
all cycles above the endurance limit to determine whether the cumulative damage has exceeded
the allowable limit. For aluminum alloys subjected to a variable amplitude loading history, it is
generally agreed that there is no endurance limit and all cycles would be considered to produce
damage. The Palmgren-Miner methodology is widely used and also forms the basis for analysis
in the design codes of the other industries presented in Section 5.
The formulation of the Palmgren-Miner linear cumulative damage assessment is given as:
=
≤=k
i i
i
Nn
D1
η (4.1)
Where:
D = Accumulated fatigue damage.
k = Number of stress blocks or stress ranges.
ni = Number of stress cycles in block i.
Ni = Number of cycles to failure in stress block i.
η = Fatigue usage factor usually taken as 1.0.
When assuming linear cumulative damage it is assumed that:
1. Damage is independent of the stress levels acting in the detail, i.e., D = Σn/N is true
regardless of the stress levels.
2. The accumulation of damage is independent of the order of load history, i.e., D = Σn/N is
true regardless of the order of load application to the detail.
It is known that neither of these assumptions is strictly true. Regardless, the Palmgren-
Miner model for damage assessment provides accurate analysis that is not improved upon with
the more rigorous methods that have also been developed.
The number of stress blocks, k, relates to the stress histogram constructed for the
analysis. A typical stress histogram is shown in Figure 4-1, taken from SSC 318 [4-1]. The

83
stress histogram in Figure 4-1 has k = 40 stress blocks although some of them contain zero
occurrences. Again, referring to Figure 4-1, it is seen that the maximum number of occurrences
for a single stress range is 7446 between 1 ksi and 2 ksi. An occurrence is defined as 1920
cycles in Figure 4-1 which means that the total number of load cycles with a stress range
between 1 ksi and 2 ksi is 1920 x 7446 = 14,296,320 or approximately ni = 14.3 x 10⁶ cycles.
The number of cycles to failure, Ni, would be found from the appropriate S/N diagram using the
maximum stress in the stress range, i.e., 2 ksi. This summation would be performed for all 40
stress ranges, assuming it applied to a specific detail, to determine whether it satisfied equation
4.1. If the equation is satisfied, i.e., the summation were less than or equal to 1.0, then the detail
would be assumed satisfactory. If the summation is greater than 1.0 and equation 4.1 is not
satisfied then the detail would have to be modified to reduce the local stresses acting in the
detail. This may be accomplished with heavier scantlings on the same detail or a more fatigue
resistant detail that can sustain an increased number of load cycles.
The fatigue usage factor, η, provides a damage criterion for the detail to be analyzed.
Typically, the value for η is taken equal to 1.0. If a designer wishes to increase the factor of
safety for a given analysis this factor can be taken as less than 1.0, i.e., the value of η could be
taken as 0.85 or any other value less than 1.0. This is one way in which designers using the
design codes from other industries may wish to incorporate increased factors of safety to account
for any analysis data not intended for use in the marine environment.
Figure 4-1 Stress histogram reproduced from Figure 6.7 of SSC 318(Each occurrence is approximately 1920 cycles)

84
4.2 Determine the Details to be Analyzed
In accordance with equation 4.1 it is necessary to develop the stress history acting on a
detail for input to the equation through the variable ni. In order to develop the stress history it is
necessary to determine the location or detail at which the stresses are to be calculated and the
load history acting upon that detail. Therefore, before the load and stress histories can be
developed it is necessary for the designer to select the detail, or details, for which these histories
will be developed.
There are numerous locations that are subjected to repeated, cyclic loading and could be
an initiation site for a crack and crack propagation. Similar to Figure 2-2 for catamarans, Figure
4-2 illustrates some of the areas on a SWATH that will be subjected to critical stresses and cyclic
loading. All of these represent areas that need to be examined for fatigue. Similar areas can be
identified for other hull forms including monohulls. Experience will help determine typical
problem areas associated with the various hull forms.
As stated earlier, this report will not directly address the fatigue analysis of structural
details in way of machinery-induced loads. These represent fatigue scenarios where it should be
easier to quantify the load magnitudes and number of cycles. The analysis should be dominated
by the response to the machinery and should be essentially a constant amplitude type problem.
Procedures are presented in Section 5 and Appendix B that will help the designer analyze these
types of situations.

85
Figure 4-2 Typical Problem Areas On A SWATH
On any high-speed craft, just as with most monohulls, there are a number of fatigue and
crack-prone areas. The weld toes and the weld terminations on the structural details in these
areas are locations where stress concentrations increase the probability of fatigue cracking. To
help reduce the potential problems in these areas the following practices should be avoided:
• Improper design that restricts accessibility and prevents the use of the correct electrode angle.
Improper access can also create maintenance problems that increase the likelihood of fatigue
cracking problems that can be amplified by the effects of corrosion.
• Incorrect selection of a welding process or welding parameters for the material or detail
geometry, such as improper energy input or travel speed.
• Incorrect fabrication procedures, such as incorrect electrode or incorrect positioning of the
detail, i.e., misalignment.
• Improper care of the electrode or flux, entrapping dirt or other impurities within the weld
metal.
If it is known that a design will include some these areas because of poor access it may be
wise to investigate their fatigue environments. Should such an analysis reveal the potential for
Stress concentrationsthrough haunch.
Connections tolower hull.

86
problems it is recommended that the design or structural detailing be modified to help alleviate
or offset these problems.
The following practices should be followed to improve the fatigue resistance of details:
• Minimize geometric stress concentration factors. This is one of the more critical components
to the total stress acting through a detail and should be fairly easy to control during the
design and construction phases.
• Insure proper welding and QA procedures throughout the fabrication process.
• Allow conservative factors of safety for the loading spectra and S/N data used for the fatigue
life calculations.
4.3 Development of the Loading History
Once the specific details and their locations onboard the vessel have been selected,
development of the load and stress histories can begin. To perform the fatigue analysis of the
proposed details it is necessary to have a loading history representative of the long-term exposure
experienced by the detail. The loading history is then translated into a stress history for the
detail.
In order to develop the loading history it is necessary to determine the number of cycles
associated with each load range. The rainflow cycle and reservoir methods for cycle counting
are two popular methods for use with testing scenarios. For the development of the long-term
exposure to environmental and operational loads acting on large displacement monohulls the
loading histories are developed using probability density functions. The use of probability
distribution functions needs to be investigated for application to the loading history and spectra
of high-speed craft.
Before proceeding to these techniques a brief review will be held for the constant
amplitude loading scenario. This is only mentioned for completeness. It does not pertain to
many situations on-board ship’s addressed by this report.
It has long been recognized that the constant amplitude fatigue environment is easier to
analyze than that associated with the variable amplitude loads. With constant amplitude loads
and corresponding stresses, the analysis of structural details in this environment is
straightforward. The Palmgren-Miner assessment can still be used but it will only contain one
ratio in the summation. Therefore, the assessment can be re-stated as an allowable stress

87
problem. Once the number of cycles have been calculated it is only necessary to determine the
allowable stress level from the appropriate S/N diagram. Using the information contained in this
diagram, the designer determines the allowable stress associated with the number of cycles
associated with the life of the detail. Either the allowable stress is satisfied or it isn’t. If not, the
detail must be redesigned. If the actual stress is less than the allowable stress the detail is
satisfactory and the analysis is complete. Figure 4-3 shows the relations that can be completely
defined through the following parameters, which make the situation easy to analyze. (A number
of these definitions are repeated here from earlier in the report for ease of reference.)
Mean Stress2
minmax σσσ +=m
Stress Ratio max
min
σσ
=R
Stress Amplitude,2
minmax σσσ −=a
Stress Range, minmax2 σσσσ −=⋅=∆ a
Figure 4-3 Constant Amplitude CurveFor use with the allowable stress approach it is only necessary to compare the stress
range, ∆σ, to the allowable stress range corresponding to the number of cycles determined for
the service life of the detail.
4.3.1 Effect of Vessel Length and Speed on Loading History of High-Speed CraftThe majority of the work done to date studying the loading histories acting on vessels has
been done for displacement vessels. As used in this report, the term displacement vessel implies
a ship that is long enough such that primary bending is known to be a crucial condition for the
88
structural design of the vessel. The term also implies a vessel with a relatively low forward
speed, i.e., they do not satisfy the definitions for high-speed craft put forward by DNV or ABS as
discussed earlier in Section 2.2 of this report. These ships are typified by tankers, bulk cargo
carriers, container ships, RO/RO vessels and many surface combatants and other large
displacement commercial and naval vessels. A significant amount of work has been developed
regarding the loading histories experienced by these types of vessels. Not nearly the same effort
has been devoted to the loading histories experienced by high-speed craft.
Among the important differences between these two types of vessels are the sea-states in
which they operate and their forward speeds. High-speed craft are significantly shorter than
most displacement vessels, operate in relatively protected waters and operate at higher forward
speeds. The effect of these differences needs to be addressed when establishing the loading
history for high-speed craft.
There are two factors that will help to reduce the relative magnitudes of the primary hull
girder bending moments and stresses acting throughout a high-speed vessel relative to a
displacement hull, i.e., length and sea-state. The structural design of many shorter vessels, such
as high-speed craft, are governed by the secondary loads, i.e., it is not necessary to increase
scantlings based on secondary loads to account for the primary loads and stresses. This trend is
further emphasized for high-speed craft that operate in protected waters and will not experience
the same extreme wave heights and sea-states that generate the higher bending moments in
shorter vessels classed for unrestricted service.
The high forward speed also results in loading conditions and histories not typically
encountered in displacement vessels. The high forward speed results in increased bow and side
slamming loads. These slam loads, which only occur lower in the craft, will contribute to the
secondary load profile and confirm the differences between the loading profiles of high-speed
and displacement craft.
An additional source of fatigue loading is the excitation introduced by the machinery.
Although considered constant amplitude in nature this source of loading may contribute to the
overall loading profile acting in certain areas that are not governed by response to the machinery,
i.e., the variable load profile of certain details may include the constant amplitude component of
the machinery. Due to the shorter lengths of many HSC most of the fatigue failures currently
experienced by these vessels result from the excitation provided by the machinery. As a result,

89
knowledge about the manner in which to deal with this type of failure could be critical to the
design of similar boats in the future. It is suggested that designers review the constant amplitude
loading procedures presented by the Aluminum Association and reprinted in Appendix B of this
report. Displacement vessels tend to be driven by low rpm diesel engines that introduce low
frequency excitation sources into the ship’s structure. High-speed craft are powered by high-
speed, high rpm propulsion systems that can introduce a much wider band of excitation
frequencies into the ship’s structure.
This discussion helps to understand the different composition of the loading spectra
acting on high-speed and displacement vessels. It reinforces the need to investigate these issues
and determine a manner in which the relative amplitudes of the primary and secondary loads can
be assessed for the different types and lengths of high-speed craft.
4.3.2 Probability Distributions used for Vessel Loading HistoryAs discussed above, this is an area that needs more work relative to high-speed craft. Not
only does the future work need to investigate the applicability of probability distributions to
high-speed craft loading profiles, but it will also need to help quantify the relative magnitudes
and importance of the primary and secondary loads on different classes of high-speed craft.
The work discussed below regarding the use of probability distributions for displacement
vessels is concerned only with the primary hull girder loading histories experienced by a vessel.
There is brief discussion in SSC 318 regarding the applicability of probability functions to the
distribution of secondary loads and their conclusion suggest that this too can be successfully
developed.
This information is presented to introduce the concepts of probability functions used to
define loading histories. Further discussion is presented in SSC 318 and SSC 351 [4-2]. SSC
318 discusses six different probability distributions and their applicability to the long-term
loading encountered by monohulls in a random sea. The six different distributions are:
1. Beta distribution.
2. Lognormal distribution.
3. Weibull distribution.
4. Exponential distribution.
5. Rayleigh distribution and,
6. Shifted Exponential distribution.

90
There has been good agreement established between actual loading data and the Weibull
distribution for long term exposure to random seas. DNV Fatigue Assessment of Ship Structures
[4-3] uses the Weibull distribution in conjunction with its spectral analysis. This experience
suggests that the spectral analysis for high-speed craft could benefit from using standard
probability distributions to define their long term loading histories.
4.3.3 Rainflow and Reservoir Cycle Counting MethodsA constant amplitude approach will rarely give the appropriate results for the
environments of concern to this report. The random loading associated with a high-speed vessel
will not behave in a constant manner. More accurate results will have to be obtained using the
variable amplitude approach, which is the more representative of the actual behavior in high-
speed craft. This is consistent with the approaches assumed for both Method 1 and Method 2 as
shown in Figure 2-1.
It has already been proposed that the use of probability distributions needs to be
investigated for the definition of the loading histories that act upon a high-speed vessel. Another
source of loading histories would be the actual loading applied to a test specimen. To replicate
the environment of a high-speed craft it would be necessary to subject such a specimen to
random loading for the generation of its S/N curve. Throughout the duration of the test it is
necessary to record the load magnitudes acting upon the specimen. This loading history would
be turned into a loading histogram after the testing and could easily be converted to a stress
histogram for the specimen in question. There are two procedures that are commonly used for
the recording of the loading histories. These two procedures are the rainflow and reservoir cycle
counting methods. A brief review for each of these procedures is presented below.
Similar and consistent with the linear Palmgren-Miner analysis is the loss of stress
history using either the rainflow or reservoir cycle counting methods. These approaches do not
account for the order in which the stress history was applied to the detail.
In general, the reservoir method is recommended for shorter stress histories with simpler
loading scenarios. The rainflow method is recommended for more complex stress histories such
as those developed for the instrumentation of actual details. Both methods can be adapted to the
computer for automation of the cycle counting process, which augments nicely with the
automated fatigue testing of specimens.

91
4.3.4 Rainflow Cycle Counting MethodThe rainflow cycle counting method is illustrated in Figure 4-4, [4-4]. To understand this
method it is best to visualize the time axis being vertical with Figure 4-4 rotated 900 in the
clockwise direction. The rotated figure is now considered a section through a roof with rain
flowing down from each peak and each valley. The beginning of a half cycle of load is defined
at the start of the peak or valley. The end of the same half cycle of loading is defined where the
rainflow stops. The rainflow is defined to stop when:
• The peak opposite the starting peak is equal to or more positive than the starting peak.
Similarly, the rainflow will stop if the valley opposite the starting valley is equal to or more
negative than the starting valley.
• It runs into rainflow from the roof above.
• The rainflow reaches the end of the stress spectrum.
Figure 4-4 Rainflow Cycle CountingThe rainflow method counts reversals of loading with the number of load cycles equal to
one-half the reversals.
4.3.5 Reservoir Cycle Counting MethodThe reservoir cycle counting method is shown in Figure 4-5, [4-5]. It represents a quick
and easy procedure to convert a load history into a stress histogram for use with the Palmgren-

92
Miner cumulative damage assessment. The procedure for using the reservoir method is
explained in Figure 4-5. For a larger number of cycles it would be convenient to define stress
ranges into which each load or stress cycle would be included. This will help produce a stress
histogram similar to that shown in Figure 4-1 (SSC 318 fig 6-7).
Figure 4-5 Procedure for Conducting The Reservoir Cycle Counting Method
4.4 Development of the Stress Histogram
In accordance with equation 4.1 it is necessary to evaluate ni, the number of stress cycles
in each block of the histogram. Now that the loading histories have been developed using one of
93
the procedures from the previous section it is only necessary to determine the stresses that result
from the load histogram. As shown in Figure 2-1, this report presents two methods to establish
the load and stress histograms:
1. Method 1: The Spectral Method.
2. Method 2: Alternative Method.
Significant discussion was presented in Chapter 2 on the spectral analysis method and the
development of load and stress transfer functions. That information, along with the probability
distribution for loading, is used as the baseline for the development of the stress histogram
associated with a spectral analysis.
The Alternative Method, presented as method 2 in Figure 2-1, was also discussed in
Chapter 2. It requires significant time and expense. It is necessary to develop the physical
models and perform the required testing. The model tests are then followed up by finite element
analysis to develop detailed information on the stress transfer functions. It is also possible to
gather this data on vessels in service.
Neither of these methods may be appropriate to all designs, particularly smaller craft with
minimal hull girder loads. The choice of analysis tool and stress histogram construction is
ultimately up to the designer. The various procedures are presented herein to allow a broader
range in the tools available to he marine industry.
4.4.1 Stress Histogram Development using the Spectral Analysis MethodThe development of the stress histogram requires that the stress transfer functions have
already been developed as indicated by Figure 2-1. Using the procedures defined above it is
assumed that the designer will be able to develop the loading history for the detail or vessel in
question. It may be some time before the probability distributions have been defined to the point
where they can be readily applied to the design of high-speed craft in a manner consistent with
that for displacement vessels. Regardless, it is assumed that the designer can develop a loading
history consistent with the detail under investigation. Then, using the stress transfer functions
this load history is converted into a stress history and the stress history is broken into k stress
blocks, in accordance with equation 4.1, for use in the S/N diagram appropriate to the detail.
Additionally, FEA will be used to develop much of the stress information required for the
analysis.

94
The following summary represents the necessary steps to generate a stress histogram
consistent with the spectral analysis. It summarizes the approach which has been outlined in
Section 4 of the report to this point.
• Determine the details to be analyzed, i.e., find the area where the stresses are likely to be too
high resulting in possible crack initiation or fatigue failure. Figure 2-2 may be a relevant
guide as well as past experience.
• Determine the load history acting on the detail. The load cycles are either constant or variable
amplitude loads. The latter is the dominating behavior in a realistic environment and the
only one considered for a spectral analysis.
• Using the stress transfer functions or FEA results, convert the loads into stresses and stress
histories. Determine the total stress range experienced by the detail.
• Determine an appropriate number of stress ranges or stress blocks based on the total stress
range experienced by the detail. This corresponds to the value of “k” in equation 4.1.
• Determine the total number of cycles associated with each stress range using one of the
cycle-counting methods presented in the report or an appropriate probability distribution
function.
• Combine all the stress range blocks to form a stress histogram similar to the one presented in
Figure 4-1.
After the stress histogram has been developed it will be necessary to select an appropriate
S/N curve that represents the detail being analyzed. This needs to include the material used for
the detail and the environment in which the detail will exist, i.e. will the detail be in clean-air,
seawater, etc. Appendix E presents S/N curves for a variety of structural details some of which
replicate shipboard construction and may be used for limited fatigue assessment.
All the information for the development of the Palmgren-Miner assessment has now been
developed and the final calculation can be performed.
There are many good examples that can be used as guidance to help understand this
procedure which will remain the same regardless of the material used for the construction of the
detail. References in Appendix A provide a source for a number of these examples.

95
4.5 Stress Calculations & Stress Concentrations
One of the critical variables in determining the acceptability of a structural detail is the
stress acting in the detail. The entire fatigue design and assessment process is grounded in being
able to have an accurate assessment of the appropriate stress level and the calculated fatigue life
can vary dramatically with a small change in the stresses taken to be acting in the detail. A
significant difference between the various design codes is the manner in which the magnitude of
the stresses for use in the fatigue assessment is determined.
Before proceeding to the generic discussion, a brief summary will be made of the
approaches used in the other industry design codes.
4.5.1 Design Stress in the Industry CodesIn their Aluminum Design Manual, [4-6], the Aluminum Association uses the nominal
stress for input to the fatigue analysis. Discussion provided in their code, See Appendix B,
suggests that the designer needs to select details similar to those shown in their design manual to
avoid the effects of stress concentrations and other factors that can result in crack initiation.
Both the EuroCode 9, [4-5] and the Association of American Railroads, [4-7] allow for the use of
nominal stresses when certain conditions are satisfied but require the amplification of this stress
to account for stress concentrations when they are not. For further discussion on the EuroCode 9
and AAR design codes appropriate information is provided in Appendices C and D, respectively.
The guide proposed by DNV in their Fatigue Analysis of High Speed Craft, [4.8],
effectively requires the use of nominal stresses modified by a notch stress factor, K, for use in
their S/N diagrams which were all developed from smooth test specimens. There are five Kx
factors defined by DNV that all require evaluation to determine the final value of K and they are
defined as follows:
Kg = Stress concentration factor due to the gross geometry of the detail considered.
Kw = Stress concentration factor due to weld geometry.
Kte = stress concentration factor due to eccentricity tolerance.
Ktα = stress concentration factor due to angular mismatch.
Kt = stress concentration factor for plate thickness exceeding 25mm.
The final notch stress range, ∆σnotch, to be used in the S/N curves for the DNV approach
is then determined as:

96
∆σnotch = K x ∆σnominal (4.2)
Where:
K = The notch factor = Kg x Kw x Kte x Ktα Kt.
∆σnominal = The nominal stress range determined through typical elastic stress calculation
procedures.
The DNV document does provide some guidance for the determination of the Kx values
shown above. Regardless, it is interesting to note that the DNV guide for the Fatigue Analysis of
High Speed Craft has less definition than any of the other three industry codes regarding S/N
curves yet they require the most rigorous load development and stress analysis.
4.5.2 Further Discussion on StressesThis section presents discussion on various different stresses that are defined for fatigue
analysis and used within the field for the consideration of different effects. Their use for input to
the S/N diagrams required for a Palmgren-Miner analysis is also presented. In general, the type
of stress calculation developed for a given design should be consistent with the type of S/N data
available to the designer. If this is not possible it will be necessary to modify the stress
calculations to approximate the type of stress data presented in the S/N diagram. Review of the
DNV [4-8] and industry approaches to this problem in Appendices B, C and D is highly
recommended before the designer proceeds on their own.
The discussion in this section focuses on the stresses that result from the loading and
geometry of a detail. They do not include the effects of fabrication, i.e., there is no consideration
of the effects of residual stresses due welding.
There are four stress categories presented in this discussion:
1. Nominal stresses.
2. Structural stresses.
3. Hot-spot stresses and,
4. Notch stresses.
It should be remembered that there are no absolute definitions for the stresses associated
with the categories listed above. The terminology presented herein introduces the concepts
associated with the different types of stresses and suggests that different terminology may be
used for the same concepts in different applications.

97
In general, the type of stress used for the Palmgren-Miner analysis will depend on the
manner in which the data was collected for the S/N diagrams relevant to the detail under
consideration. The data used to develop the S/N diagram should be consistent with the
application of the detail.
Most of the S/N curves presented in Appendix E were developed on simple welded
specimens with inherent stress raisers. The exact value for the Kx factors is unknown but could
be determined. This means they were developed to reflect structural stresses, as defined below,
and macro-structural behavior of the specimen.
Discussion is presented below on nominal stresses as well as the various sources of stress
amplifiers due to geometric and fabrications factors. It is suggested that the designer review all
the different codes presented in this report along with the discussion below to help suggest the
appropriate approach for a given set of calculations. Generally, if the details selected for use are
similar to details for which S/N diagrams have been generated then it should be possible to use a
nominal stress approach. This is justified because any stress concentrations acting in the selected
detail would have been acting in the tested detail and accounted for as a result of the test. This
would also require the use of S/N diagrams that have been generated for the detail and its
intended application, i.e., the seawater or marine environment needs to be considered in the
fatigue testing.
4.5.2.1 Nominal Stresses Acting in a StructureNominal stresses are the most fundamental stresses calculated for every design. These
are the global field stresses found in a structure using classical elastic stress analysis techniques
without the impact of any stress concentrations, discontinuities or other geometric amplification
effects. They can be determined through simple hand calculations such as axial stress equals P/A
or bending stress equals My/I (See equation 4.3, below). For more complex structures they can
be calculated with finite element models or other procedures that account for load distribution
such as the Hardy-Cross moment distribution technique. All design codes such as ABS, DNV,
Lloyds, American Institute of Steel Construction, AISC, etc. are based upon allowable stress
design approaches that use nominal stresses for their calculations.
Determining the nominal stresses is often fairly simple and straightforward, which makes
it a cost-effective procedure for simplified designs. The following formula can be found in any

98
textbook to find the nominal stress when subjected to the combined effects of axial and bending
loads:
yI
MAFff baN ⋅+=+=σ (4.3)
Where:
Nσ = Total nominal stress resulting from combined axial and bending stress components.
fa = Axial Stress.
fb = Bending Stress.
F = Axial force.
A = Original area of the cross-section.
M = Bending moment.
I = Moment of inertia of the cross-section.
y = Distance from neutral axis to the point of interest.
Equation 4.3 is used for typical hand calculations for simple structural systems. It will
be necessary to use FEA to develop the nominal stresses associated with a structural detail of
even moderate complexity. When nominal stress S/N curves are used for the evaluation of
complex details it is necessary to account for the geometric stress concentration effects not
inherently included in the S/N curves. The local nominal stress in way of the detail must be
increased by the stress concentration factors for the local geometry and these amplified stresses
used in the S/N curves.
4.5.2.2 Structural StressesThe structural stresses acting in the area of a detail reflect the nominal stresses amplified
as a result of the geometry, i.e., discontinuities, of that detail. Stress concentration factors are
developed through discontinuities such as brackets, holes, cover plates, etc. Typical details
illustrating different discontinuities are shown in Figure 4-6, [4-12]. The stress concentration
factors, or the increase to the nominal stress, will be a function of various aspects for each
different type of geometric configuration. For instance, the stress concentration factors acting in
way of a bracket will be a function of:
• The thickness of the bracket.
• The presence of a flange on the bracket.
• The angle between the toe of the bracket and the supported member.
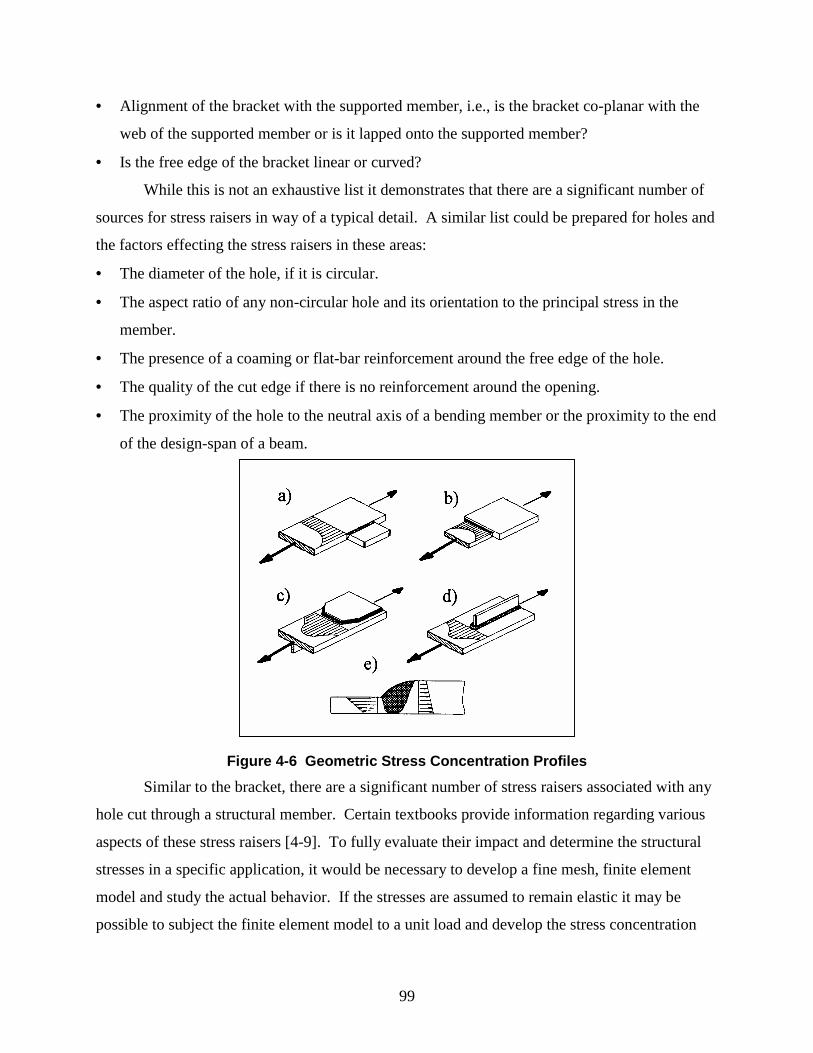
99
• Alignment of the bracket with the supported member, i.e., is the bracket co-planar with the
web of the supported member or is it lapped onto the supported member?
• Is the free edge of the bracket linear or curved?
While this is not an exhaustive list it demonstrates that there are a significant number of
sources for stress raisers in way of a typical detail. A similar list could be prepared for holes and
the factors effecting the stress raisers in these areas:
• The diameter of the hole, if it is circular.
• The aspect ratio of any non-circular hole and its orientation to the principal stress in the
member.
• The presence of a coaming or flat-bar reinforcement around the free edge of the hole.
• The quality of the cut edge if there is no reinforcement around the opening.
• The proximity of the hole to the neutral axis of a bending member or the proximity to the end
of the design-span of a beam.
Figure 4-6 Geometric Stress Concentration ProfilesSimilar to the bracket, there are a significant number of stress raisers associated with any
hole cut through a structural member. Certain textbooks provide information regarding various
aspects of these stress raisers [4-9]. To fully evaluate their impact and determine the structural
stresses in a specific application, it would be necessary to develop a fine mesh, finite element
model and study the actual behavior. If the stresses are assumed to remain elastic it may be
possible to subject the finite element model to a unit load and develop the stress concentration

100
factors based on the resultant nominal and peak stresses. These same factors could then be
applied to the nominal stresses acting through the detail when subjected to the actual loads.
4.5.2.3 Hot-Spot StressesHot spot stresses are the structural stresses located at a hot spot, i.e., the structural
stresses at a likely crack initiation site. The hot spot stresses at a particular location can
generally be determined through the techniques discussed above and the fatigue strength of a
detail is often developed in terms of the range of hot spot stresses. The S/N data for a given
detail will be considered appropriate for a proposed detail if they contain the geometric
configurations that would result in the same hot spot load amplification of the nominal stresses.
Test specimens for such details will report results in terms of stress range (not range in hot spot
stress) but the effects of the hot spot will be included by the geometry of the specimen. For
proposed details that vary slightly from test specimens it may be possible for the designer to
modify the hot spot stress with minor adjustment to account for the differences. This will allow
the use of existing S/N data for details with slight variation from proposed details.
4.5.2.4 Notch StressesAlthough the hot spots identified above generally lie in a local notch of the structure or
detail, i.e., the toe of a weld, they do not include the nonlinear stress peak resulting from that
notch. This is accounted for by the local notch stress that quantifies the total stress acting at the
root of a notch. Figure 4-7, [4-12] demonstrates the various stress components that comprise the
total stress acting in the local notch stress.
Figure 4-7 Local Stress Concentrations Due to Service and Residual StressesThese stress components are defined as:
• σm = Membrane stress. This accounts for the nominal stress acting through the area of the
detail.

101
• σb = Bending stress. This accounts for the discontinuities resulting from the local geometry
of the detail.
• σnlp = Nonlinear stress peak. This accounts for the maximum stress caused by the local notch
created by the detail.
As shown in Figure 4-7 and Figure 4-8, [4-12], the nonlinear stress peak is maximum at the
surface of the structure. This helps explain the increased risk associated with a surface defect at
the root of a notch compared to an embedded flaw which will usually be located at an area of
less than maximum stress.
Determining the value for the notch stress requires detailed analysis using finite element
modeling techniques. Because of the highly localized stress effects generated by the notch it is
necessary to create a finite element model with a very refined mesh to capture the maximum
value of the notch stress and the gradient throughout the area.
Luckily, neither the nominal stress nor the hot spot stress approach to fatigue strength
assessment requires the effects of the notch stress to be included. Along the length of a weld, for
instance, the notch stress varies continuously and this effect is inherently included in the testing
of welded specimens and therefore must not be included on top of the nominal or hotspot stresses
when either of these two are used for fatigue strength assessment.
As discussed above the new design code proposed by DNV [4-8] presents fatigue
calculations using notch stresses that are developed by amplifying the nominal stress using a
series of factors to account for the local geometry of the detail including the weld geometry.
This same type of approach can be used for other S/N curves where the nominal stress are
amplified by appropriate factors before entering the S/N curves to assess fatigue life.
4.5.2.5 The Effects of Welding on StressAll of the geometric effects cited above are independent of the stresses introduced as a
result of the welding process. As previously discussed in Section 3.8 of this report, even
properly executed welds will introduce local effects to the state of stress around any weldment.
Residual stresses, welding imperfections and stress concentrations, Figure 3-17 through
Figure 3-19, introduced by the welding process will all have an effect on the total stress acting in
the area of a structural detail. Of course, not all welds contain imperfections and it is the intent
that properly executed welds will minimize the effects on the overall stress acting in a weldment.

102
As seen in Figure 3-17, the residual stresses due to welding will be both tensile and
compressive. Recognizing that fatigue and crack propagation only occur under the action of a
tensile stress, it has been confirmed that the residual compressive stresses are beneficial to a
detail by reducing the overall tensile stress developed locally. Similarly, the residual tensile
stresses are detrimental to the fatigue life, as they will add to the nominal tensile stresses acting
through the detail.
The information shown in Figure 3-17 and Figure 4-8 agrees with the diminution of the
applied and welding residual stresses as a function of distance from the weld. The highly stressed
areas in way of the weld can reduce the fatigue life of a detail and need to be controlled as much
as possible through the use of proper welding procedures including cleanliness, electrode
selection and heat input.
Figure 4-8 Local Stress Concentrations in Fillet Weld
4.5.2.6 Fabrication Flaws and Their Impact to Nominal StressesCertain types of fabrication flaws can result from the welding process. These were
discussed earlier in Section 3.8 and shown in Figure 3-18. Briefly, they include lack of fusion,
porosity or voids, weld undercut, inclusions and various cracks induced by the welding process.
There are other types of flaws that can result during the fabrication process, but not specifically
associated with welding. These include misalignment of non-continuous components or rotation

103
of a component resulting in angular misalignment not intended for the design. Examples of these
flaws are shown in Figure 4-9. Similar to the discussions presented above, these flaws will also
generate stress concentrations that amplify the nominal stress acting through the area of the detail
and DNV does present factors to account for this misalignment.
Figure 4-9 Typical Misalignment Problems During Fabrication
4.6 Determine the Appropriate S/N Curve
After all the load and stress calculations have been developed for a given detail, it is
necessary to select the appropriate S/N curve to continue with the detail’s evaluation. As stated
above, the designer should review the available S/N data prior to developing the stress
calculations and make every effort to coordinate the stress calculations with the available S/N
data to simplify the use of the S/N curves. Obviously, it is not possible to have S/N curves for
every type of structural detail for all loadings, environments, materials, etc. Therefore, it is up to
the designer to select an S/N curve that most closely approximates the detail under consideration.
The design codes tend to classify details into categories that help designers select an appropriate
category and the corresponding S/N curve. Appendix E in this report presents the S/N curves for
a number of small and large specimen details. These curves represent raw data as measured
during the tests. They do not represent design curves similar to those established by the design
codes reviewed in this report. No large specimen S/N curves were found for this task that
reflected the marine or seawater environments.
Figure 3-5 displays the tremendous effect that the seawater environment can have on the
fatigue life of smooth aluminum specimens compared to those with more realistic service
conditions. The designer needs to consider this during the design phase if it becomes necessary
to use in-air data for the fatigue analysis. It would be necessary to include appropriate factors of

104
safety depending on the desired fatigue life and application of the detail when using such
information. The small specimen S/N data in Appendix E is presented for both air and seawater
environments. Similar to Figure 3-5, the S/N curves in Appendix E confirm the measurable
impact of the seawater environment on the fatigue life of an aluminum weldment.
The data reflected in Table 4–1 and Appendix E demonstrate some of the current work
being undertaken in the research of fatigue on aluminum weldments. Details 20 through 24 are
taken from [4-10] and details 25 through 28 from [4-11]. The latter four details were studied as
part of the research for the doctoral work summarized in [4-11]. Only the small specimens,
details 20 through 24 were subjected to maritime and laboratory air conditions for their tests.
The large specimen details, 26 through 28, were all tested in-air with no accounting for corrosive
or aggressive environments.
This is a good indication of the work currently underway. It is consistent with the small
specimen tests discussed for the new alloys presented in Section 3.9 of this report. All of this
work was performed in Europe, which currently seems to be leading the research and
development efforts for fatigue of aluminum weldments. This has been confirmed by discussion
with numerous sources for this task including Menzemer, Sanders and Kaufman, the latter being
a consultant recommended by the Aluminum Association. All sources agree that the state of the
art resides with Professor Kosteas and the aluminum database he has helped develop over the
past ten to fifteen years. This database forms the basis of the fatigue and damage tolerance
analysis information in the EuroCode 9. It is imperative that, before any further work is
recommended as a result of the gaps identified by this task, collaboration and review of this
database be undertaken.
This report also presents information from the design codes of three other industries in
Appendices B, C and D. This should allow the designer a modest beginning for the selection of
S/N curves for the fatigue design of aluminum weldments with appropriate modification
incorporated to account for the marine environment.
4.6.1 ProcedureThe desired procedure is illustrated through the use of Table 4–1, Figure 4-10 and the
associated S/N curves in Appendix E. Assuming the data were available to provide S/N curves
for all the details in Figure 4-10, it would only be necessary for the designer to select the detail
that mostly closely resembles the detail being designed. An S/N curve is referenced from Table

105
4–1 which is available as part of the design data. The S/N curve could be developed in a number
of ways however, it should not include any factors of safety, which would be selected by the
designer as a function of the application. The S/N curves could either reflect the raw data
measured during the tests or design curves could be fitted to represent the results. Further
discussion on this subject would be required to define the most appropriate tool for the industry.
It is noted that DNV and the other three industry codes all use simplified design curves
developed from the raw data. This helps to simplify the interpretation for the designer and
allows for consistency in the industry. The S/N curve could then be used to assemble the
appropriate data to complete the Palmgren-Miner analysis.
As it currently stands, there are numerous blank spaces in Table 4–1 for reference to the
appropriate S/N curve. This was done intentionally to illustrate the lack of data for use in the
current application. It also suggests the details that may need attention when future testing is
developed. The first nineteen details listed in Table 4–1 and shown in Figure 4-10 are taken
from the Aluminum Design Manual. They are very similar to the details listed in the AISC
manual and demonstrate the more common details used in these two codes.
It would be necessary to re-address this table to the appropriate details used for high-
speed craft construction. It is recommended that future research would survey the exact details
used for high-speed craft and rank their priority of future S/N testing. Included in this ranking
would be a rough assessment of the quality of the detail in its service. Commonly used details
requiring significant or frequent repairs may not be considered a high priority detail for future
S/N testing. Instead, recommendations suggesting the use of more durable details could be
issued.

106
Figure 4-10 Typical Construction Details

107
Figure 4–10 Typical Construction Details (Cont’d)
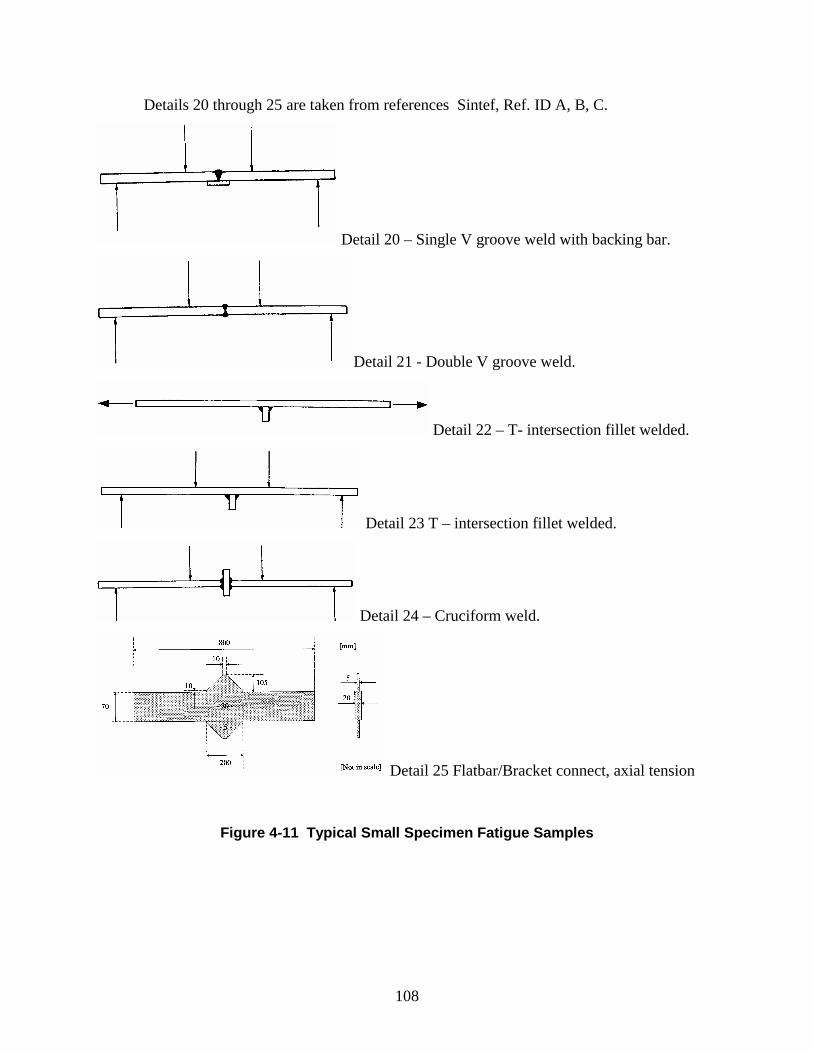
108
Details 20 through 25 are taken from references Sintef, Ref. ID A, B, C.
Detail 20 – Single V groove weld with backing bar.
Detail 21 - Double V groove weld.
Detail 22 – T- intersection fillet welded.
Detail 23 T – intersection fillet welded.
Detail 24 – Cruciform weld.
Detail 25 Flatbar/Bracket connect, axial tension
Figure 4-11 Typical Small Specimen Fatigue Samples

109
Figure 4-12 Detail 26 – Bulb Stiffener/Deep Frame Connection – Bending In Air.
Figure 4-13 Detail 27 – Box Stiffener/Deep Frame Connection – Bending In Air.

110
Figure 4-14 Detail 28 Box Stiffener/Deep Frame Connection – Bending In Air.

111
Table 4–1 Information for use in the fatigue analysis. S/N diagrams are in Appendix E.
JointNo.
Design Detail S/NDiagram
Alloy Environment R-ratio Ref. ID
1 Extruded Bar-Axialtension
2 Extruded I-Beam-bending
3 Longitudinally WeldedBar-axial tension
4 Longitudinally WeldedI-Beam-bending
5 Extruded I-Beam withCover Plate-bending
6 I-Beam with ILS-bending
7 Transversely WeldedBar-axial tension
8 Transversely welded I-Beam-bending
9 Plate change inthickness; Axial tension
10 Plate change in width;Axial tension
11 T-Joint; Bi-axial tension
12 T-Joint; Bi-axial tension
13 Lapped detail-axialtension
14 T-joint; LongitudinalWeld; Axial tension
15 Cruciform Joint
16 Bar-on-plate-bending
17 Cruciform-axial tension
18 Cover plate-Axialtension
19 Asymmetric detail –bending
20 Transversely ButtWelded Plate- w/
backing bar –Single Vgroove -Bending
E-1 thru E-4,E-7, E-12
Various Various Various X
21 Transversely weldedPlate – double V groove
–Bending
E-9, E-10 Various Various 0.1 X
22 T-Joint; Axial E-14, E-15,E-16
Various Various 0.5 X
23 T- joint Bending E-5, E-6,E-8,E-11,E14,
E-15, E-16
Various Various Various X
24 Cruciform Join t-Bending
E-13 AlMg4.5Mn Various 0.1 X

112
JointNo.
Design Detail S/NDiagram
Alloy Environment R-ratio Ref. ID
25 Flatbar/bracket - Axial E-17, E-18 5083 Air X
26 Bulb stiffener/web frame
– bending
E-17, E-18 5083, 6082 Air X
27 Box stiffener/web frame– bending
E-19 7108-T79 Air X
28 Box stiffener/web frame– bending
E-19 7108-T79 Air X
4.7 The Alternative Stress Histogram Method
Method 2 depicted in Figure 2-1 is based upon monitoring the actual behavior of real
vessels in representative operating scenarios. It can also be taken to apply to individual test
specimens set up for fatigue testing. The vessels to be studied are outfitted with strain gauge
measuring and recording equipment throughout the critical areas of the vessel. Of course, it is
necessary to determine the critical areas and these will vary depending on the hull form under
consideration. Strain gauging of SWATH and catamaran vessels to monitor response to
transverse bending will be critical. Figure 2-2 and Figure 4-2 demonstrate the critical locations
for vessels with these hullforms. For other vessels similar determination of the critical areas to
be mapped is required when developing the test plan.
The test plan also needs to include time to insure that exposure to the environment is long
enough to allow for the development of statistically valid data. This may require the outfitting of
different vessels in the same operating area and/or extensive periods of testing.
The test plan to be developed also depends upon the application. Different test plans will
be required if the data is only to be used for a single class of vessels in a predetermined set of
operating scenarios. If broader application is desired, i.e., design of various classes operating in
different environments, then it will be necessary to have data that can be extrapolated to design
for the worst case scenarios.
Regardless, after the strain gauge data has been collected it will be necessary to develop
histogram information similar to that displayed in Figure 4-1 although these histograms can be
developed to record either load or stress histograms. To accommodate future design work the
data should be collected into loading histories that can be applied to new vessels of similar

113
design. The load histories will then be applied to the new designs to develop the stress range
histories required for the fatigue analysis.
After the stress or loading and stress histories have been generated the fatigue analysis
can proceed in a similar manner to Method I in Figure 2-1. The Palmgren-Miner cumulative
damage analysis will be developed to assess the quality of the selected detail.
The following steps summarize Method 2:
• Develop a test plan with applicability to suit the intended function including exposure time to
allow for statistically significant data.
• Set up the test equipment, perform the test and collect the data.
• Convert the data and turn it into a stress histogram as shown in Figure 4-1.
• Perform the Palmgren-Miner cumulative damage assessment for the required details.
Strain gauges are located on the weld and on the surrounding structure of the detail where
it is assumed that a crack may initiate. As discussed above the stresses, and therefore the strains,
acting through the critical areas of the weld will be in excess of the elastic limit of the material
and represent typical locations for crack initiation.
Method 2 was used to outfit the SL-7’s with strain gauges to develop information similar
to that outlined above. These tests and the information obtained are the subject of, or were
included in, many SSC reports. Figure 4-1 is a stress histogram resulting from these studies.
4.8 References
[4-1] Munse, W.H., Wilbur, T. W., Tellalian, M. L., Nicoll, K and Wilson, K. Fatigue
Characterization of Fabricated Ship Details for Design, SSC 318, Ship Structure Committee,
Washington, D.C., August 1982.
[4-2] Mansour, A., An Introduction to Structural Reliability Theory, SSC 351, Ship Structure
Committee, Washington, D.C., January 1989.
[4-3] DNV Fatigue Assessment of Ship Structures, Classification Notes No. 30.7, September
1998.

114
[4-4] Reemsnyder, H., Life Assessment Under Variable Amplitude Loading, Short Course on
Fatigue and Fracture, August 1998.
[4-5] EuroCode 9: Design of Aluminum Structures- Part 2: Structures Susceptible to Fatigue,
Brussels, 1998.
[4-6] The Aluminum Design Manual, The Aluminum Association, Washington, D.C., 1994.
[4-7] Manual of Standards and Recommended Practices Section C – Part II, Association of
American Railroads, Washington, D.C., 1997
[4-8] DNV Fatigue Analysis of High Speed Craft, Report No. 99-0551, 1999
[4-9] Peterson, R. E., Stress Concentration Factors, Wiley Interscience, 1974
[4-10] Paauw, A. J., Fredheim, S., and Engh, B., Konstruksjonsdata for dynamisk belastede
aluminum sveiseforbindelser (Construction data for dynamic testing of aluminum weldments),
SINTEF Report No. STF34 A83042, 1983
[4-11] Tveiten, B. W., Fatigue Assessment of Welded Aluminum Ship Details, Doctoral Thesis,
Department of Marine Structures, Norwegian University of Science and Technology,
Trondheim, 1999.
[4-12] Niemi, E., Stress Determination for Fatigue Analysis of Welded Components. The
International Institute of Welding, Abington Publishing, 1993.

115
5. DNV and Other Industry Fatigue Analysis Standards
This report is among the first of efforts to present fatigue design procedures for aluminum
weldments in high-speed craft. This effort has identified a number of gaps in the available data
that prevent the development of fatigue design procedures using data specifically developed for
the marine application. This is particularly true with regards to crack propagation and the data
required for the damage tolerance analysis. Det Norske Veritas, DNV, is scheduled to release a
new set of rules for the fatigue analysis of High-Speed Craft later this year, [5-1]. It will be their
Classification Notes 30.9 and will utilize some of the same analysis procedures as contained in
their Classification Notes 30.7, Fatigue Assessment of Ship Structures, [5-2].
Along with the generic design approach for the development of fatigue design for
structural details, this report also presents the information in the DNV High-Speed Craft criteria
and other industry standards. This will allow the marine designer future access to information
not readily available for previous designs. The information utilized by the other industry codes
can be used for the marine industry until such time that all the information is available to support
a consistent set of data for use in the marine environment.
In addition to DNV, the three industry and design standards presented in this report are:
• The Aluminum Design Manual from The Aluminum Association, [5-3].
• EuroCode 9: Design of Aluminum Structures – Part 2 Structures Susceptible to Fatigue from
the European Committee for Standardization, [5-4].
• The Manual of Standards and Recommended Practices Section C – Part II form The
Association of American Railroads, [5-5].
It is intended that the information contained in the other codes can be used by the
maritime industry after consideration of appropriate factors of safety and applicability. Even
using factors of safety that may be relatively high should not have a large impact on the overall
design developed for a given vessel. It is worth remembering that the fatigue problem tends to
be very localized with crack initiation often occurring through areas of stress concentration
including fabrication defects. The fatigue analyses developed herein will result in slightly
greater scantlings for details or improved fabrication procedures. It is not expected that this will
have a large impact on the overall weight or cost impacts to the initial design and will hopefully
reduce the lifecycle costs and maintenance with the improved initial design.

116
The three industry standards outside of DNV were selected for the similarity of the basis
of their codes relative to aluminum. It was not possible to perform a complete survey of all
industry codes for this report and the three chosen do not represent an exhaustive collection. The
Aluminum Association was selected because of its obvious involvement with the aluminum
industry. It was also felt that the relationship between the Aluminum Association and the
aluminum high-speed industry will continue to develop into one similar to the relationship
between the American Institute of Steel Construction, AISC, and the steel maritime industry
where many of the design standards have a basis in AISC codes. EuroCode 9, developed by the
European Committee for Standardization, was selected because of its relationship with the
European community and the sizable volume of recent large-specimen fatigue tests performed
under this body for the development of the pre-standard. In addition, it is the only standard that
contains any data on crack growth rates for damage tolerance analysis. While this data was not
developed for the marine environment, the EuroCode 9 does present a well developed and
logical approach to the damage tolerance analysis. The Association of American Railroads was
first selected because of recommendations made during the development of this report. Review
of the AAR standards revealed a slightly different technique for the fatigue analysis which may
accommodate certain designers. The code also presents useful information on the fatigue of
various details similar to those used in ship construction.
Reference [5-6] presents a series of papers regarding aluminum applications in the fast
ferry market. It also recognizes the need for the domestic American market to join with the rest
of the world and pursue the use of aluminum to satisfy the demands of the marketplace. These
papers were assembled as part of a symposium which The Aluminum Association held in 1997
for the high-speed ferry marketplace.
5.1 DNV Fatigue Analysis of High-Speed Craft, Classification Notes 30.9
Still in its preliminary form, these rules are scheduled for release later this year, perhaps
in the July 2000 time frame. A preliminary version of the DNV standard was available to the
authors for the preparation of this report. It was noted by an associate of DNV, Fredricksen [5-
7], in a 1997 FAST paper, that the fatigue of high-speed aluminum craft was an increasing
problem. Reading [5-7] made it obvious that DNV has been investigating this problem area for a
number of years.

117
The DNV guide presents a concise set of rules with specific information for aluminum.
Both primary and secondary loads are considered for the fatigue assessment. Calculation of the
primary loads and the associated cycles is similar to the spectral method described above and in
DNV Fatigue Assessment of Ship Structures [5-2]. The primary load calculation considers the
service restrictions for which the vessel will be classed. Different scatter diagrams are provided
by DNV for primary load development with the different service restriction classifications.
There is no specific definition on the load cycles associated with the various secondary load
components however, the guide does provide a variety of coefficients for the combination of
primary and secondary stresses. DNV seems to recognize the lack of specific data regarding
secondary loads by the use of these coefficients but does provide a positive “first-step” allowing
the designer to combine such effects. In addition, the guide does allow for “simplified” primary
load calculations for early stage design or for designs not requiring the same level of detail. As
noted by commentary at the recent 4th International Forum on Aluminum Ships, many of the
fatigue failures in aluminum craft are the result of secondary loads caused by machinery
vibration. This is particularly true for the shorter high-speed craft and helps justify the
development of simplified primary loading profiles for these vessels.
The stress calculations associated with the DNV guide have been discussed previously in
Section 4.5.1 of this report. Briefly, DNV requires the calculation of the local notch stress range
in way of a structural detail for use with their S/N curves. The notch factor, K, and the
associated notch stress range, ∆σnotch, are determined as:
K = Kg x Kw x Kte x Ktα Kt. (5.1)
Where:
Kg = Stress concentration factor due to the gross geometry of the detail considered.
Kw = Stress concentration factor due to weld geometry.
Kte = stress concentration factor due to eccentricity tolerance.
Ktα = stress concentration factor due to angular mismatch.
Kt = stress concentration factor for plate thickness exceeding 25mm.
And:
∆σnotch = K x ∆σnominal (5.2)
Where:
∆σnotch = The notch stress range for use in the S/N curves.

118
∆σnominal = The nominal stress range determined through typical elastic stress calculation
procedures.
Appendix B of the DNV document provides some guidance on the Kx factors for some
typical structural details used for construction. Due to its preliminary nature [5-1] appears to
have a little confusion between the use of stresses and stress ranges in their S/N curves. It is the
belief of the authors of this report that it is the intent of [5-1] to utilize stress range values in the
fatigue calculation.
To continue the fatigue analysis, DNV presents four S/N curves. They are developed on
log-log paper in accordance with the following formula:
SmaN logloglog ⋅−= (5.3)
Where
N = Predicted number of cycles to failure for stress range S.
S = Stress range (∆σ).
m = The negative inverse slope of the S/N curve.
log a = The intercept of the log N-axis by the S/N curve.
The S/N curves, [5-1], are developed for smooth specimens with K = 1.0. As discussed
above for other specimens the stress range, S, needs to be amplified to account for the notch
stress factors.
Three of the four S/N curves presented in [5-1] account for structural details in air. The
fourth curve is used for details in a corrosive environment, i.e., submerged in seawater without
any corrosion protection. The final assessment of the detail is then performed with a Palmgren-
Miner cumulative damage summation.
5.2 Other Industry Standards to Assist the Maritime Designer
As stated above, the other codes to be presented in this report are:
• The Aluminum Design Manual from The Aluminum Association, See Appendix B.
• EuroCode 9: Design of Aluminum Structures – Part 2 Structures Susceptible to Fatigue from
the European Committee for Standardization., See Appendix C
• The Manual of Standards and Recommended Practices Section C – Part II form The
Association of American Railroads, See Appendix D.
119
Each of these codes provides good information. All three of these standards represent
land-based applications. Only the EuroCode 9 makes any accounting of the degrading effects of
corrosive environments, including seawater and marine, on the fatigue behavior of aluminum.
Neither of the other codes considers the adverse effects of corrosive environments and it is left to
the designer to account for this effect.
The presentation of the industry standards is not made in any particular order or with any
particular preference. It is recommended that the designer review all the standards presented
herein before selecting the most appropriate procedures and data for a given application. Each
standard contains different data that may be applicable to specific situations for the development
of details in high-speed aluminum craft. The standards are straight-forward and easy to
understand and the designer should be familiar with each if it is decided to utilize the information
and approaches suggested by any specific design code.
5.2.1 Release From LiabilityAppendices B, C and D contain information from the design codes of The Aluminum
Association, EuroCode 9 and the Association of American Railroads, respectively. Copyright
release was obtained from each of these organizations to reproduce their material in the various
sections and appendices of this report. Included in the copyright release obtained from each
organization was an agreement to release them from any liability that may result from the
improper application of their codes. The authors of this report were in complete agreement with
the three organizations concerning their release from liability. It is the intent of this report to
disseminate the information currently available to the maritime industry regarding the fatigue
design of aluminum weldments. It is expected that the use of any information reproduced from
these documents would be handled in a manner acceptable to the designers and users of this
information.
5.3 The Aluminum Association
In addition to the discussion presented in the body of this report, the Aluminum Design
Manual present’s additional discussion and explanation for the rules contained in their
specifications. Please see Appendix B for the complete presentation of the fatigue design
information and design philosophy presented by The Aluminum Association.

120
The Aluminum Design Manual presented by the Aluminum Association is similar in
jurisdiction to the aluminum industry as the American Institute of Steel Construction
Specifications is to the steel industry. The Aluminum Design Manual is a comprehensive
specification for the design and fabrication of aluminum structures with typical civil engineering
applications.
Section 4.8 of the Aluminum Design Manual presents the fatigue design approach for
consideration of aluminum structures. There are two separate approaches presented in the
Aluminum Design Manual, one for constant amplitude loading and the second for variable
amplitude loading. Although most ship structures are typically thought to be subjected to
variable amplitude loads, the constant amplitude loading scenario may also be applicable. The
response of foundations or other structural components subjected to the cyclic effects of rotating
or oscillatory machinery or equipment may very well be governed by the effects of loading
spectrum that are effectively constant in magnitude. For such situations, it will be advantageous
to utilize the constant amplitude analysis provided for this scenario.
Regardless of the type of loading, the designer must categorize a prospective detail in one
of six categories ranging from A through F to start the analysis presented by the Aluminum
Design Manual. This is done using the information in Table 4.8-1 and Figure 4.8-1 of the design
manual. After selecting the detail category, the designer constructs the S/N curve corresponding
to that category using the information in Table 4.8.1-1 and Figure 4.8.1-1, presented below in
Table 5–1 and Figure 5-1, respectively.
There is no accounting for the marine environment in the fatigue portion of the
Aluminum Design Manual. Therefore, it will be incumbent upon the designer to select the
factors of safety relevant for a given detail in a specific application. To investigate the
sensitivity of the final result to the factor of safety, it is recommended that the designer perform
the analyses with a variety of different factors. This may reveal relatively small impacts to the
overall cost of a project for increased factor of safety. Also, the designer may want to review the
procedures included in the EuroCode 9 for corrosive environments. Although not exhaustive,
this reference presents a technique whereby the fatigue lives of details are shortened to account
for environments other then air.

121
5.3.1 Constant Amplitude Loading in the Aluminum Design ManualFor constant amplitude loading, the designer performs the following calculation in
accordance with the Aluminum Design Manual:
Sra ≤ Srd (5.4)
where:
Sra = the applied stress range, the algebraic difference between the minimum and
maximum calculated stress in the member or detail.
Srd = the allowable stress range.
Srd = A N-1/m
A, m = constants from Table 4.8.1-1 and shown in Figure 4.8.1-1
N = the number of cycles to failure.
If the applied stress range is less than the constant amplitude fatigue limit as given in
Table 5–1, then no further fatigue calculation shall be needed. If the applied stress range is
greater than the fatigue limit then consideration must be given to the number of cycles
experienced by the detail and satisfactory behavior must be demonstrated through the above
equation.
5.3.2 Variable Amplitude Loading in Aluminum Design ManualFor variable amplitude loading, if the maximum stress range in the spectrum of stresses is
less than the fatigue limit defined in Table 5–1 for the appropriate detail category, then no further
fatigue consideration is needed for the detail.
For all other stress ranges it is necessary to perform the following calculation in
accordance with the Aluminum Design Manual:
Sre ≤ Srd (5.5)
where:
Sre = equivalent stress range
Sre =mN
i
mrii
s
S/1
1
����
�
=α
Srd = the allowable stress range
Srd = A N-1/m

122
iα = number of cycles in the spectrum of the ith stress range divided by the total
number of cycles.
riS = the ith stress range in the spectrum
A, m = constants from Table 4.8.1-1 and shown in Figure 4.8.1-1.
Ns = number of stress ranges in the spectrum.
N = the number of cycles to failure.
The summation developed by the Aluminum Association in equation 5.5 represents a
Palmgren-Miner cumulative damage analysis. Using this procedure it is necessary to determine
the allowable stress range, Srd, from the tables and figures presented in the design manual and
insure that the equivalent stress range, Sre, is below this level.
In order to use either the constant or variable loading approach presented by the
Aluminum Design Manual it is necessary for the designer to determine the number of load cycles
experienced by the detail and the level of stress associated with each of those cycles, i.e., the
loading history. Determination of the number of load cycles and the intensity of the load
associated with each of those cycles was found to be one of the biggest gaps in developing the
fatigue design criteria for this task. It is interesting to note that the Aluminum Design Manual
does not provide any guidance on this subject. Therefore, using the Aluminum Design Manual,
it is incumbent upon the designer to develop the stress histogram without any guidance from the
specifications.
Also, within Section 4.8 of the Aluminum Design Manual it explains that the minimum
and maximum stresses to be used for the analysis are the nominal stresses determined by typical
elastic analysis methods. This makes the method presented by the Aluminum Association a
simple and straightforward stress and fatigue analysis once the loading environment has been
determined.
The Aluminum Design Manual does not present any discussion on damage tolerance
analysis.

123
Table 5–1 Copy of Table 4.8.1-1 From the Aluminum Design Manual.
Figure 5-1 Copy of Figure 4.8.1-1 From the Aluminum Design Manual

124
5.4 European Committee for Standardization (CEN)
On 26 October 1997 the European Committee for Standardization, (Comit Europ en De
Normalisation, CEN) approved the EuroCode 9 Prestandard as a prospective standard for
provisional application. The prestandard has been distributed for preliminary use and is not yet a
ratified Standard. It has been issued for a period of three years. After two years the members of
the Comit are requested to submit their comments regarding the use of the prestandard, in
particular, regarding the conversion of the document to a European Standard. EuroCode 9
addresses the Design of Aluminum Structures. Part 2 of this prestandard addresses Structures
Susceptible to Fatigue.
The CEN is a consortium of European nations working collectively to develop a unified
set of standards and practices regarding various aspects of engineering and engineering design.
The member nations are, Austria, Belgium, Czech Republic, Denmark, Finland, France,
Germany, Greece, Iceland, Italy, Luxembourg, Netherlands, Norway, Portugal, Spain, Sweden,
Switzerland and the United Kingdom.
As mentioned above, the EuroCode 9 is still in a preliminary state of development. After
incorporation of any modifications, it is assumed the code will be issued in its final form as a
European Standard.
In the meantime, there is a lot of good fatigue and damage tolerance design information
contained within this code. The database of aluminum fatigue details initiated by Professor
W.W. Sanders during the 1970’s and 1980’s was taken over by Professor Dimitris Kosteas who
expanded the database greatly with significant large specimen testing since his inheritance.
Professor Kosteas works at the Technical University of Munich and has been instrumental in the
development of the EuroCode 9. The database forms the cornerstone of the fatigue and damage
tolerance data used to develop the S/N curves and other data contained within this volume.
The EuroCode 9 is the only industry standard, identified by this report, that recognizes
the effects of corrosive environments including varying degrees of marine exposure as well as
immersion in seawater or freshwater. Similar to other codes, EuroCode 9 develops detail
categories for the design being developed and recommends an applicable S/N curve based on a
number of parameters.

125
5.4.1 Fatigue Design Philosophy in EuroCode 9EuroCode 9 has two specific fatigue design categories:
1. Safe-Life Design.
2. Damage Tolerant Design.
A third option is included that is called “Design Assisted by Testing.” It is expected that
testing would not be proposed as the only method of solution but rather that test’s would be used
to supplement the analytical aspect of the design.
The Safe-Life and Damage Tolerant designs relate to the design philosophies discussed in
Section 3.7 of this report regarding the crack-free life of the detail compared to the design
service life of an application.
It is expected that most designs will be developed in accordance with the Safe-Life
philosophy that develops a detail with a predicted crack-free life greater then the service life of
the vessel, option 1 in Figure 3-16. Using the damage tolerant approach not only requires the
fatigue analysis but a damage tolerance analysis and inspection plan as well. The plan requires
inspection to be performed before the end of the predicted crack-free life. It also requires
additional inspections to be performed at intervals not exceeding one-half of the predicted time
to failure of the crack. If it is found that the crack is growing at a rate faster than predicted, the
inspection schedule must be altered to account for the increased crack rate. This requires the
crack growth rate calculations to be redone using the new information regarding the actual data
from the detail.
The discussion of fatigue loads in EuroCode9 is very generic, requiring the designer to
account for all sources of loading as well as the superposition of loads. Interesting discussion is
provided regarding the confidence associated with the fatigue loads and associated partial factors
of safety. When certain conditions exist it is not necessary to apply any factor to the loads.
However, when confidence levels are lower, EuroCode9 defines the Partial Safety Factor for
Fatigue Loading, γFf, ranging anywhere from 1.1 to 1.5. These factors will increase the loads and
resulting stress magnitudes acting in a detail with a corresponding decrease in the fatigue life.
The high-speed craft designer should use similar ideas when developing load information or
when using any data from design codes outside of the maritime industry.
EuroCode9 allows for the use of nominal, modified and hot spot stress considerations for
the fatigue analysis. A nominal stress approach can be used for simple structures with details

126
similar to those shown in the design code. Modified and/or hot-spot stress calculations are
required for details that do not satisfy the nominal stress calculation criteria.
When all the stress and cycle data has been developed the designer uses the appropriate
“detail category” and its associated fatigue curve to perform the Palmgren-Miner cumulative
damage assessment of the detail.
5.4.2 Damage Tolerance Data and EuroCode 9To allow the designer the ability to establish the crack growth rates and inspection
schedules required for use with the damage tolerant design the EuroCode 9 also presents
information and data relating to crack propagation rates in its Annex B, (Appendix B).
Information regarding da/dN is presented for various aluminum alloys and load ratios, R. This
represents the only design code uncovered by the research or this task with this type of
information. It also reflects one of the largest gaps found during research for this task. That is,
there is a lack of crack propagation rate information for aluminum alloys in the marine
environment.
Appendix B of the EuroCode 9 presents a complete procedure for the damage tolerance
analysis allowing prediction of time to failure after crack initiation.
More discussion is provided on this data in Section 6 of this report.
Please see Appendix C for complete presentation of certain portions of EuroCode9.
5.5 Association of American Railroads
Please see Appendix D for the complete presentation of the applicable portions of the
AAR fatigue design procedures.
The Association of American Railroads, AAR, presents its fatigue design methodology in
its Manual of Standards and Recommended Practices Section C – Part II. The information is
presented in Chapter VII, Sections 7.1 through 7.5. The last of these sections presents the strain
life method for fatigue analysis and will not be discussed in the main body of this report although
it is reproduced in Appendix D for those interested in this analysis method. Section 7.3 of the
AAR code presents a vast amount of Environmental Load Spectra data. While it is interesting
and this is the only code uncovered for this task with such data, it is not reprinted in Appendix D
due to the shear volume of data and the lack of applicability to the marine environment.

127
It is worth noting that the AAR design manual presents fatigue data for details
constructed from both steel and aluminum. Discussion presented in paragraph 7.2.2.5 of the
AAR design manual suggests the following interesting trend:
“If the data are insufficient to determine the fatigue strength of a member or detail in
aluminum and the fatigue strength is available for the member or detail in steel, then it
can be assumed that the aluminum fatigue strength (MGD y-axis intercept) is about equal
to one-third (1/3) of the steel fatigue strength and the MGD has the same S-N slope, k,
and the same MGD slope, m, with verification or adjustment of these strengths by
comparison with other design codes. The one-third factor assumes that fatigue life
consists of fatigue crack propagation only, which is a function of the modulus of
elasticity.”
This recommendation reflects an observation in [5-8] and [5-9] where data and discussion
are presented for fillet welded details constructed from steel and aluminum. This data also
suggests that the fatigue strength of the aluminum details is about ½ to 1/3 that of the same detail
in steel. Reference [5-8] also suggests that the fatigue life of butt-welded details constructed
from aluminum is approximately 70% that of the same butt-welded detail in steel. These
observations agree that the fillet weld details have fatigue strengths proportional to the modulus
of elasticity while the butt weld details are more proportional to the tensile strengths of the steel
and aluminum materials. Further investigation of these observations is strongly suggested. If
this proves to be a valid assumption, with certain tolerable deviation, then it may be possible to
use information developed for certain steel details when analyzing their aluminum counterparts.
Factors of safety reflecting the use of this type of information could be included in the design.
The procedures outlined by these codes are somewhat more involved than those
developed by either the Aluminum Association or CEN. They are presented here because of the
use of the modified Goodman diagram in assisting with the fatigue calculations. Aside from
using this somewhat different technique the AAR design code also has a lot of useful
information and may assist the marine designer in certain applications.
Similar to the other two industry codes presented herein, the AAR fatigue design and
analysis code is based upon the Palmgren-Miner cumulative damage technique. It utilizes the
modified Goodman diagram to help evaluate the fatigue limit, Se, of a given detail.

128
5.5.1 Modified Goodman DiagramThe modified Goodman diagram, MGD, presented in the AAR code is reprinted below as
Figure 5-2. Used with the information in Section 7.4 of the AAR design manual, the MGD
allows the user to determine the fatigue limit stress, Se, for a given detail. If the maximum stress
experienced by a detail is less then this value, the designer has a good degree of confidence that
the detail will not develop any fatigue cracks during its service life. If the design stresses
resulting from the environmental loads exceed the value of Se then it will be necessary for the
designer to continue with the fatigue analysis as outlined by the AAR design manual.
Figure 5-2 Copy of Modified Goodman Diagram from AAR
5.5.2 Stress Analysis Using AAR Design ManualThe AAR design manual provides for two different approaches to fatigue design and
calculating the associated stresses. The first uses the nominal stress approach. These stresses
and this approach can only be used if the detail being designed is the same, or very similar, to
one of those presented in the AAR design code. The nominal stresses are determined in
accordance with typical elastic stress analysis techniques, including finite element analysis if
required. The obvious limitation on this approach relates to the relatively small number of
details provided by the design code compared to the multitude of applications that can arise.
129
Regardless, this allows for a relatively simple set of calculations and does accommodate a fair
number of details or those closely associated.
The second methodology used for stress calculation involves stress concentration factors
acting upon the nominal stresses. This is used for details for which there is no corresponding
detail provided in the design manual. The AAR design code does not provide any specific stress
concentration factors. It does provide a number of references for the location of appropriate
stress concentration values. These references are “Stress Concentration Design Factors”, R. E.
Peterson, Wiley and Sons, 1974 or “Stress and Strength of Manufactured Parts”, Lipson, Noll,
and Clock, McGraw-Hill Company, 1950. The AAR requires that the maximum stress be
determined by multiplying the nominal stress by the appropriate stress concentration factor,
either Kf or Kt. Peterson [5-10] defines these two factors as:
• Kf = fatigue notch factor for axial or bending load. (Kf is a factor determined by fatigue
tests.)
• Kt = stress concentration factor for normal stress, σmax/σnom. (Kt is a theoretical factor .)
Various expanded subscripts are used, such as Kte for elliptical notch, Kth for hyperbolic
notch, KtA, Kt2, Ktα, etc., for special cases.
Regardless of the stress calculation, the designer uses the MGD as input to determine the
acceptability of a given detail subjected to the loading environment under investigation.
5.6 Other Industry Design Codes
Appendix A provides a listing of various other design codes used around the world. Brief
discussion of these codes, and others, are provided in [5-9].
5.7 References
[5-1] DNV Fatigue Analysis of High Speed Craft, Report No. 99-0551, 1999
[5-2] DNV Fatigue Assessment of Ship Structures, Classification Notes No. 30.7, September
1998.
[5-3] The Aluminum Design Manual, The Aluminum Association, Washington, D.C., 1994.

130
[5-4] EuroCode 9: Design of Aluminum Structures- Part 2: Structures Susceptible to Fatigue,
Brussels, 1998.
[5-5] Manual of Standards and Recommended Practices Section C – Part II, Association of
American Railroads, Washington, D.C., 1997
[5-6] Aluminum in the Marine Industry: Application to Fast Ferries. Collection of papers
collated and presented by the Aluminum Association, Washington, D.C., 1997.
[5-7] Fredricksen, A., Fatigue Aspects of High Speed Craft. Paper presented at the FAST ’97
symposium.
[5-8] Aluminum Company of America, ALCOA, Considerations for the Structural Detailing of
Aluminum Ships, Hyattsville, MD., 1975
[5-9] Sharp, M. L., Nordmark, G. E., and Menzemer, C. G., Fatigue Design of Aluminum
Components & Structures, McGraw-Hill, 1996
[5-10] Peterson, R. E., Stress Concentration Factors, Wiley Interscience, 1974

131
6. Fatigue Cracking and Damage Tolerance Analysis
6.1 Damage Tolerance Analysis
The major aspects of damage tolerance analysis are:
• Fatigue crack growth rate (FCGR) analysis - The methodology by which expected growth of
a crack in a structural member is evaluated.
• Fracture or residual strength analysis –After a structure has begun to experience crack
growth it can fail in one of two ways. First, the crack can grow to its critical size, exceed the
fracture toughness of the material, and the structure will fracture. Second, the uncracked
portion of the structure may lose its structural integrity and not be able to carry the loads to
which it is subjected and it will fail from becoming structurally unstable or overstressed.
Fracture analysis is developed using a methodology, either linear-elastic or elastic-plastic, by
which the maximum allowable (critical) crack size is determined. The residual strength is
determined through typical stress calculation procedures and is also discussed herein.
6.2 Fatigue Crack Growth Rate Analysis
In accordance with Anderson, [6-1], the procedures for analyzing constant amplitude
crack propagation with small scale yielding at the crack tip are fairly well understood, although
certain issues still remain. The procedures required for the study of crack propagation subjected
to variable amplitude loading, large scale crack tip plasticity and short cracks are not as fully
understood and require additional study. The operating scenario for high-speed aluminum craft
generates a variable amplitude loading environment often with large zones of plasticity at the
crack tip in the aluminum weldment. The large zone of plasticity defines the typical behavior of
aluminum and represents an important departure from that of steel, which is characterized by
small zones of plastic yielding at the crack tip. The “large” and “small” zones of crack tip
plasticity are relative to the thickness of the specimen. They are depicted graphically in Figure
6-1, [6-1] and discussed below.

132
Figure 6-1 Relative Size of Plastic Zone at Crack Tip
Many of the well known theories used in the practice of fracture mechanics and crack
growth simplify the analysis by assuming dependency of the event on a single variable, typically
∆K where K is the crack tip stress intensity factor and ∆K is defined as Kmax - Kmin. In fact, it is
known that for various situations the value of ∆K is not sufficient to define crack propagation
and that factors including the stress ratio R, and prior loading history experienced by the detail
also influence the rate of crack growth. Regardless, the relationship first proposed by Paris and
Erdogan depends only on ∆K. Known as the Paris equation and shown below as equation 6.1, it
has gained wide acceptance for representation of the linear portion, region II, of the typical
FCGR curve shown in Figure 6-2, [6-1].
mKCdNda ∆= (6.1)
Regions I and III shown in Figure 6-2, represent non-linear portions of the crack growth
rate. At the beginning of a specimen’s life it is assumed to be effectively intact. The crack
growth rate is zero until the crack has been initiated at the threshold value of the stress intensity
factor, ∆Kth. Near the end of the specimen life, the crack growth rate accelerates until the critical
crack size is reached at which point fracture occurs. As discussed earlier, other damage
mechanisms such as plastic collapse of the structure, tearing or buckling can also occur as the
crack grows and may happen prior to fracture depending on the residual strength of the structure.

133
Figure 6-2 Typical FCGR Curve
Kosteas [6-2] and others [6-3], [6-4], however, note that the Paris equation should not be
used for the marine grade aluminum alloys. These references state that the crack growth
behavior varies with ∆K in Region II as the result of changes in crystallographic modes of crack
propagation, and because crack propagation behavior can be quite different in the weld metal and
HAZ. Thus, the crack growth behavior needs to be defined by polynomial equations, Figure 6-4,
[6-2]. Figure 6-3,[6-4] also demonstrates the multi-linear step function for da/dN vice ∆K for
aluminum in a salt water environment.
Figure 3-15 displays some crack growth rate data for a number of aluminum alloys in a
benign environment where the linear FCGR through region II is shown to be more applicable.
The crack tip stress intensity factor, K, is a function of the applied stress, crack
dimensions, the extent of plasticity at the crack tip and geometry. The general expression for K
for crack growth in a linear-elastic material was presented in equation 3.5. Equation 6.2 presents
the general expression for K as the size of the zone of plasticity at the crack tip increases,
demonstrated in Figure 6-1, and can no longer be ignored (as done by equation 3.5). This applies
as the crack grows through region III of Figure 6-2:
( )yraYK += πσ (6.2)

134
Where Y = geometric factor.
σ = applied global stress
a = crack length
ry = crack tip plastic zone size = 2
61 �
���
�=
YSy
Kr
σπ
The equation for ry was developed by Irwin [6-5] and reflects an effective crack length
that accounts for the higher K values than predicted by the elastic stress distribution in the area
of the crack.
Referring to Figure 6-1, linear elastic conditions apply for high strength, low toughness
materials for which the crack tip plastic zone size is finite but small enough to be ignored in the
above equation. Elastic plastic conditions apply for higher toughness materials for which the
plastic zone size is larger and therefore needs to be considered, as in equation 6.2. Fully plastic
conditions apply to materials with an even greater toughness. As discussed in Section 6.3, the
extent of crack tip plasticity determines the fracture toughness criteria to be used to determine
the critical crack size.
Figure 6-3 Schematic Diagram of Multi-Linear Segments of da/dN for Aluminum.

135
Figure 6-4 Polygonal da/dN curve for aluminum
6.2.1 Fatigue Crack Growth Rate and Aluminum High-Speed CraftFCGR testing is typically performed under constant load (∆K increasing), or constant K
max (∆K decreasing) conditions such that crack tip yielding is minimized. The FCGR curves are
generated from axial or bend testing of base metal specimens, or welded specimens prepared so
that the fatigue crack propagates through the weld metal or HAZ. Loading for high speed
vessels, however, is variable and will include random high magnitude tensile loads that can cause
significant crack tip yielding. Such yielding results in a region of compressive residual stress in
front of the crack that slows subsequent growth until the crack passes through this region. This
temporary reduction in crack growth rate is called retardation and may or may not be significant
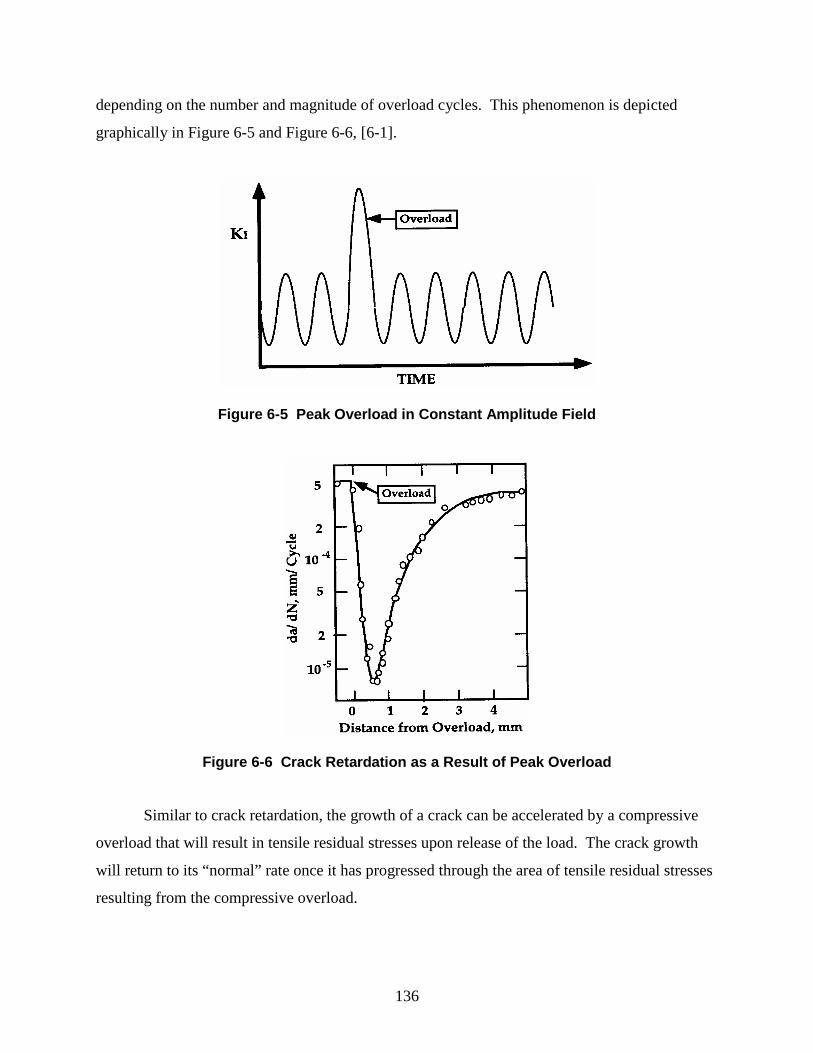
136
depending on the number and magnitude of overload cycles. This phenomenon is depicted
graphically in Figure 6-5 and Figure 6-6, [6-1].
Figure 6-5 Peak Overload in Constant Amplitude Field
Figure 6-6 Crack Retardation as a Result of Peak Overload
Similar to crack retardation, the growth of a crack can be accelerated by a compressive
overload that will result in tensile residual stresses upon release of the load. The crack growth
will return to its “normal” rate once it has progressed through the area of tensile residual stresses
resulting from the compressive overload.

137
Other factors to be considered are the effects of residual stresses, and higher crack growth
rate for short cracks (resulting from reduced effects of crack closure that retard growth of larger
cracks). EuroCode 9 uses a combination of constant load and constant Kmax curves for
conservatism to account for high residual stresses and short fatigue cracks. Specifically, high R
ratio (R=0.8) or constant Kmax curves for welds unless the specific residual stress pattern is
known, and constant Kmax curves for crack lengths less than 2mm, and constant load curves for
crack lengths greater than 2mm.
As discussed below, some of the current fatigue/fracture software packages can
accommodate polynomial crack growth curves and retardation effects.
6.3 Fracture Mechanics and Critical Crack Size
As noted previously, a growing crack will eventually reach a "critical" size that can no
longer be tolerated in the structure. The critical crack size (length and depth) is determined using
fracture mechanics analyses methods by comparison of the crack tip stress intensity (a measure
of the crack driving force) to the materials fracture toughness (a measure of resistance to crack
extension). The value of fracture toughness to be used for this analysis is material dependent, so
the definition of critical crack size differs for different materials as follows:
• For high strength, low toughness materials, the fracture toughness parameter is determined
using liner-elastic fracture mechanics, LEFM. A crack in such materials will propagate
suddenly through a structure with essentially no prior plastic deformation (i.e., brittle fracture
under elastic load) if it has grown (by fatigue or other mechanism) to a size at which the
crack-tip stress intensity equals KIc. Thus, the critical crack size for these materials is the
size at which brittle fracture will occur.
• For low strength, high toughness materials LEFM, cannot be used because the extent of crack
tip plasticity in such materials is relatively large. Thus, brittle fracture without preceding
plastic deformation is not a concern. There is still a "critical" crack size for these materials
because other failure modes exist. These modes are most commonly defined by crack-tip-
opening-displacement (CTOD) or 'J-Integral' values as determined by standard ASTM test
methods. Structural steel and aluminum alloys used in the marine environment typify these
materials which are analyzed using elastic-plastic fracture mechanics techniques, EPFM.

138
In accordance with American Society for Testing and Materials, ASTM, linear elastic
conditions apply when the following relationship between specimen thickness, material fracture
toughness and yield strength is satisfied:2
5.2�
��
�
�≥
y
IcKBσ
(6.3)
Where B = specimen thickness. Typical nomenclature for the crack length and specimen
thickness are shown in Figure 6-7.
Figure 6-7 Crack Length and Thickness in Typical SpecimenFor high strength, low toughness alloys the value of B is on the order of typical section
thickness used in ship, and other, structural members so KIc can be used in conjunction with
equation 6.3 to determine the critical crack size for fracture.
For low strength, high toughness materials, such as marine grade aluminum alloys, the
value of B is relatively large and not representative of the thickness used for high-speed
aluminum construction. For these materials it is necessary to use the CTOD or J integral values
to obtain the critical crack size for fracture.
The values generated for CTOD and the J Integral using the ASTM tests are as follows [6-1]:
CTOD δu - CTOD at the onset of unstable fracture which has been preceded
by more than 0.2 mm of stable crack growth.

139
δi - CTOD near the initiation of stable crack growth.
(analogous to JIc - see below)
δm - CTOD at the first attainment of maximum load plateau.
(crack tip displacement value corresponding to maximum load
reached in specimens that display ductile tearing only)
NOTE The CTOD can also be used for low toughness materials for which
the measured parameter is δc which is the CTOD value at the onset
of unstable fracture with less than 0.2 mm of stable crack growth.
This is analogous for KIc.
J Integral JIc - value of J integral near the initiation of slow, stable crack growth.
In addition to evaluation of the critical crack size, high toughness materials must also be
evaluated for the possibility of plastic collapse of the remaining section as a crack propagates
through a structure. Both criteria are covered by use of a failure-assessment-diagram (FAD) as
illustrated in Figure 6-8, [6-1]. There are several forms of the FAD, and SSC-402, [6-6]
recommends the material specific FAD, an example of which is shown in Figure 6-9, [6-6].
Note from Figure 6-9 that the equation for the material specific FAD curve is determined from
the materials stress-strain behavior. The EuroCode 9 criteria are similar and read as follows:
"The value of lf [final crack length] shall be such that the net section, taking into account the
likely shape of the crack profile through the thickness, shall be able to sustain the maximum
static tensile forces without unstable crack propagation." This failure mode will occur when the
remaining uncracked section is stressed into the plastic region.

140
Figure 6-8 Typical Failure Assessment Diagram, FAD
The Y-axis in Figure 6-8 and Figure 6-9 is Kr which is the ratio of crack-tip stress
intensity KI in the structure being evaluated to KIc. As noted above, use of KIc is not appropriate
for the marine grade aluminum alloys and must be replaced by the CTOD or J-integral criteria.
SSC-402 recommends the CTOD criteria with the following conversion equation to Kmat:
( )216.1
υδσ
−=
EK matf
mat (6.4)
Where:
Kmat = value of fracture toughness to be used in lieu of KIc.
σf = flow stress = average of yield and ultimate tensile strengths.
δmat = critical CTOD value from ASTM test (specific criteria TBD).
E = Young’s modulus.
ν = Poisson’s ratio.

141
Figure 6-9 Material Specific FAD
For information, the conversion of JIc to KIc is as follows:
( )21 υ−=
EJK Ic
Ic (6.5)
Other potential failure criteria that should be evaluated are:
• NASA criteria: [6-9]
- crack-tip-opening-angle (CTOA).
- Gurson-Tvergaard void growth and coalescence.
- cohesive-zone-model.
• Energy dissipation rate. [6-10]
6.4 Failure Modes Associated with Fracture Mechanics
There are three principal modes of load application that can initiate or propagate a crack.
They are illustrated in Figure 6-10, [6-1]. Mode I is a pure tensile load that tends to open the
crack with principal stresses normal to the crack. Mode II is pure shear that tends to slide the
two surfaces of the crack along its length and Mode III is an out of plane shear that extends the
crack by the action of a moment generated at the base of the crack, i.e., at the crack tip. It is also

142
possible to have stress or loading states that represent any combination of these three
fundamental states.
Figure 6-10 Three Modes of Loading for Crack Propagation
There is a critical crack tip stress intensity factor, or critical stress associated with each of
these modes and they are denoted as, KIc, KIIc, and KIIIc, respectively. These stresses are
typically above the yield strength of the material and represent the fracture toughness of the
material for each of the three failure modes. For use with LEFM, they must be constrained to a
small area around the crack tip opening. Generally, for metallic structures KIc is the critical
stress intensity factor, i.e., it is smaller than either KIIc or KIIIc. Therefore, in order to take
advantage of linear-elastic fracture mechanics, it is necessary to have good data for the KIc
values associated with the material of interest and equation 6.2 is rewritten as:
( )yIc raYK += πσ (6.6)
KIc is the fracture toughness of the material. It is constant for the material and
independent of the size or geometry of the specimen. Marine grade aluminum alloys are typified
as high toughness and low strength and, as previously discussed require unrealistically thick
specimens compared to those used for high-speed craft to develop linear-elastic behavior,
equation 6.3. Since the thickness of high-speed craft aluminum structures tend to be small this
invalidates the use of the KIc values for this application and suggests that LEFM is not
appropriate for the damage tolerance analysis of marine grade aluminum alloys. It also implies
the use of the EPFM and CTOD or J Integral procedures as outlined above.

143
6.5 Fatigue Crack Growth Rate and Fracture Data
Table 6–1 summarizes the design information and material property data required for
crack growth and fracture mechanics analyses of aluminum structures. A literature search was
conducted to identify available data for the alloys listed in Table 1–1. The data are summarized
in Table 6–2 which illustrates the fact that there are insufficient data for the analyses. This
assessment is based on two primary factors:
1. There are insufficient data points to show the data spread and allow statistical analysis. That
is, the designer should have sufficient information to permit selection of allowable values
based on the mean, the minimum, or other statistical measure of the raw data depending on
the criticality of the design. As discussed in SSC-402, a minimum of three specimens will be
required for each test to ensure statistically valid results, and additional specimens may be
required if scatter from the initial tests is too large.
2. There is insufficient documentation of data validity. It is often difficult from review of a
technical paper to determine the exact test conditions. If such determination cannot be made
it will be impossible to group data points together to meet the above statistical validity
requirements.
One potential source of valid FCGR data that should be investigated further is EuroCode
9, specifically Appendix B covering damage tolerant design which contains numerous FCGR
curves for aluminum alloys. Grade 5454 is the only grade from Table 1–1 currently included
(see Table 6–2) but it is possible that other grades are being considered.
Material testing will be required if the EuroCode 9 data are not considered sufficient or
would not be available for use by the U.S. Coast Guard. The required data are those listed in
Table 6–2 and standard ASTM test methods are available for all the tests. Details of the test
program, such as number of specimens and filler metal process and filler metal for welded
specimens, will have to be developed. Another major issue will be identification of the most
suitable fracture criteria for the aluminum alloys in question because this will determine which
test method should be used.
A major advantage of a new test program as opposed to using literature data is that new
data can be generated in electronic format and input directly into some of the fatigue and fracture
software packages. Use of existing FCGR and other data in the form of curves will require data
points to be picked-off the curves which can lead to errors. Complete control of the test set-up

144
and execution is another advantage that would be realized by conducting new tests. Details and
environments specific to the high-speed craft would be used for the test procedures instead of
pre-existing tests with set-up parameters that may not correspond to the desirable variables in the
high-speed craft industry. As further research is developed for the loads acting on high-speed
craft it may also become desirable to perform these tests under bending loads rather than axial
loads as the influence of primary and secondary loads on high-speed craft is assessed.
6.6 Fatigue and Fracture Software
Significant material testing will be required to generate the crack growth and fracture
mechanics data listed in Table 6–1. It appears that CTOD data is the preferred property for
fracture mechanics analysis but J Integral tests may have to be performed if meaningful CTOD
results cannot be obtained. R-curve fitting will also be required if ductile tearing analysis needs
to be performed.
Once sufficient material property data are generated, the question will be how best to use
the data for damage tolerance analysis. It is highly recommended that currently available
software packages be evaluated rather than attempt to development of a specific methodology for
this application. Table 6–3 summarizes information on packages investigated for this report
based on information from reference [6-7] and additional review of literature and contacts with
the vendors. Other programs may exist and it is not suggested that the current list is exhaustive.
The primary reason for the recommendation to evaluate these packages is that many can perform
elastic-plastic analyses with consideration for polynomial FCGR curves, crack closure, crack
retardation and other factors. Other programs can be or are being modified to address elastic-
plastic analysis and other factors. In addition, many are Windows based, easy to use and can
accept electronic input of material data. It must be emphasized that crack closure and other
factors may turn out not to be major issues for the marine grade alloys, so any software package
without the capability to address such factors should not be discounted at this stage.
The nSoft package listed in Table 6–3, contains a complete suite of interconnected
software modules that can handle S/N and local strain approaches, includes BS 7608 for
weldments and can handle analysis and synthesis of complex load and strain spectra. The nSoft
package has been used in many fields world-wide and is easily integrated with the
MSC/FATIGUE FEA package.

145
nSoft-E
Pre- and post-processor for measured field data. Range-mean counting algorithm.
Statistical analysis of load amplitudes. Frequency analysis, filters. Randomized reconstruction
of time histories from RainFlow matrices. DOS, WINDOWS, VMS, UNIX. Serves as gateway
to FATIMAS-SN, FATIMAS-EN, KRAKEN, and FATIMAS-EDIT.
FATIMAS-SN
Stress-based life assessment for high-cycle fatigue, complex components, e.g., bearings,
gears, etc. Uses base metal or component-test S-N curves. Weldment analysis follows BS 7608
and BS 8118. Variable amplitude analysis. Includes non-homogeneous materials such as cast
iron.
FATIMAS-EN
Strain-based life assessment for crack initiation in safety-critical, non-welded
components. Variable amplitude, accounts for load-sequence effects on mean and residual
stresses. High-temperature applications. Smith-Topper-Watson and Morrow mean stress
corrections.
FATIMAS-MULTIAXIAL
Strain-based multiaxial life assessment for proportional and non-proportional loading.
FATIMAS-SPECTRAL
Frequency domain life assessment based on power or amplitude spectra. Correction for
surface finish and surface treatment.
KRAKEN
Linear elastic fracture mechanics analysis of crack growth in a component containing an
initial crack-like discontinuity. RainFlow cycle counting. Crack closure, corrosion, material
data and stress intensity factor libraries. Simple power relation of crack growth rate to range of
stress intensity factor. Linear elastic fracture. Combined with FATIMAS-EN to estimate total
life.

146
TESTLAB
Tools for analyzing monotonic tensile tests, strain-controlled fatigue tests, component
fatigue tests, and strain gauge rosette data. Results in format for input to other nSoft modules.
One vendor stated that for an evaluation program they would supply their software to an
independent activity and provide the necessary support. If the other vendors did likewise, a
possible evaluation program would be as follows:
• Select a high use aluminum alloy and conduct testing to generate the necessary fatigue and
fracture data (including welded samples and corrosive conditions).
• Prepare specimens of selected welded structural details in the same manner as is done to
generate S/N data for new design. Prepare finite element models (FEM) for each detail that
should be sufficiently detailed to allow modeling of weld details such as weld reinforcement
angle and any undercut that may be present.
• Perform fatigue tests on these specimens using fatigue loading spectra typical of those that
will be experienced in service in air and corrosive conditions (including seawater immersion
and spray). Run the tests as normal S/N type tests until fatigue cracks initiate then measure
all fatigue cracks in the test specimen and add the necessary details to the FEM model of the
test specimen. Continue the test and monitor crack growth.
• Use the FEM model and material property test data with each software package to predict
crack growth behavior in the test specimen. Accuracy of the packages can be determined by
comparison of the calculated results of the crack extent and orientation to the actual test
results.
• These tests should also be performed on details with simulated weld repairs because in some
cases weld repairs may accelerate fatigue cracking as the result of poor quality and residual
stresses. Such testing may provide guidance as to whether certain repairs should be made as
normal maintenance, or should be delayed until periods of dry-docking when welding can be
performed until more controlled conditions.
6.7 Conclusions
Except perhaps for the data in EuroCode 9, there are insufficient material data to support
damage tolerance analysis of the known aluminum alloys used in high-speed vessels. A

147
thorough review should be conducted to generate an up-to-date list of current aluminum alloy
grades and filler metals. EuroCode 9 and related documents should be reviewed to determine the
extent and validity of the material property data they contain, and testing programs should be
undertaken to generate the necessary fatigue, fracture data, and other data as listed in Table 6.2.
A prerequisite for the test program will be determination of which fracture criteria should be
applied to these alloys.
There are numerous high quality, state-of -the-art fatigue and fracture software packages
available. These should be evaluated to determine which are best suited for the damage
tolerance analysis of the marine grade aluminum alloys used for the construction of high-speed
craft.

148
Table 6–1 Summary of Design and Material Property Data Required for Crack Growth and Fracture Mechanics Analyses
ANALYSIS REQUIRED DESIGNINFORMATION
REQUIRED MATERIALPROPERTY DATA
Crack growth • Finite Element Model (FEM) of thestructural detail
• Stress analysis showing crack tipstress intensity values
• Fatigue loading spectrum
• Fatigue crack growth rate (FCGR) data in the form ofda/dN vs delta K- Paris law or polynomial- air and seawater environment (immersion and
spray)- base metal, weld metal, HAZ- constant amplitude testing
Fracture mechanics • FEM and stress analysis from above • Yield and ultimate tensile strengths• Flow strength (typically average of yield and ultimate
tensile strength)• Stress strain curves• One of all of the following fracture toughness values
(function of material):- Critical crack-tip-opening-displacement value
(CTOD)- Critical J value - JIc- FAD curves- Other

149
Table 6–2 Number of Data Points From Published Literature for Material Properties Necessary to Conduct Aluminum Damage ToleranceAnalyses (1)
ALLOY 6061-T6 5083(2)
5086 5454 5456(2)
5356weldmetal
4043weldmetal
5183weldmetal
PROPERTY
(ASTM TESTMETHOD)
ENVIRONMENT/CONDITION
BaseMetal(BM)
HeatAffected
Zone(HAZ)
BM HAZ BM HAZ BM HAZ BM HAZ
FCGR(E647)
Air 6 2 5 (H116)(3)
1 (H116) 4 (H24):(2 ∆K incr.for R=.1,
.8, 2 K maxfor R=.1,.8) (8)
2 (H321)1 ( H117)1 (H116)
3 1
CorrosiveEnvironment
3 (H116)1 ( H321)
KIc(plane-strain)(E399)
Air 9
Kc(plane-stress)(E399)
Air 1 (H116) 1 (H117)
CTOD(4)
(E1290)(E1820)
Air
JIc(5)
(E1737)(E1820)
Air 4(as rolled)
1 1 1
R Curve(6)
(E561)(E1737)
Air 4
StressStrain
Curves (7)
AirFurther literature searches will be conducted to locate stress strain curves
1. Gray shaded boxes indicate no literature data available so testing will be required to generate the data.2. Material condition is given parentheses.3. The FCGR data points includes one from the NASA NASGRO database. The Kc data point for 5083 is also from this database. [6-11]4. CTOD is crack-tip-opening-displacement5. JIc is the value of J integral near the initiation of slow, stable crack growth. J-integral testing should only be performed is CTOD testing does not produce meaningful results.6. R curves are crack-growth resistance curves. This testing should only be performed if ductile tearing analyses need to be performed.7. Engineering stress strain curves are required to construct the material specific FAD.8. The 5454 FCGR data are from EuroCode 9.
CTOD, JIc or other criteria should be usedin lieu of KIc or Kc

150
Table 6–3 Preliminary Summary of Fatigue and Fracture SoftwarePACKAGE SOURCE LINEAR ELASTIC
OR ELASTIC-PLASTIC
FATIGUECRACK GROWTH MODELS
FRACTURE CRITERIA OTHER
The FractureMechanic
ASM International N/A(no longer available)
N/A N/A N/A
PCFAD(current version 6A)
Babcock and Wilcox Elastic-Plastic N/AFracture only
• Ductile tearing (uses CTOD or J)• Plastic collapse (FAD - CEGB R-6)
• Considers weld residual stresses• Includes 15 internal crack models
BEASY ComputationalMechanics
Linear elastic • Paris• NASGRO with retardation
• KIc Can interface with PATRAN andNASTRAN
NASGRO NASA Both Wide range of crack growth models • Crack tip opening angle (CTOA), -----ENDURE Engineering
Mechanics ResearchCorp.
Both • Paris, Forman, Walker, Elberr,Collpriests
• cycle-by-cycle, closure
• J, CTOD, K • 15 built in crack models• can interface with NASTRAN or
ANSYSSmartCrack Engineering
MechanicsTechnology
Linear elastic • Paris, Walker, modified Forman • KIc, FAD -----
SmartCrack -Non-linear
EngineeringMechanicsTechnology
Elastic-plastic • da/dN vs delta-J • Tearing instability -----
NASCRAC Failure AnalysisAssociates
Both • constant and variable amplitude• retardation
• KIc, J -----
FALANCS LMS N/AS-N crack initiation
analysis only
N/A N/A N/A
MSC/FATIGUE MacNeal-Schwendler Corp
Linear elastic(with corrections -see next column)
• cycle-by-cycle• Paris corrected for closure and
static fracture modes to produceda/DN vs delta K effective which isstraight line over entire range
• KIc, plastic collapse• 35 built-in geometries plus ability to
determine specific compliance functions
Integrated with MSC/PATRAN,MSC.NASTRAN, ABAQUS, ANSYS,and MARC
RPC III ExtendedAnalysis
MTS Systems Corp N/AUsed only for
generation of fatigueand fracture data
N/A N/A N/A
nSoft Ncode International Linear elastic • Paris with crack closure • TBD -----R6-Code Nuclear Electric Ltd Elastic-Plastic • TBD • CEGB R-6 FAD and British Standard PD
6493: 1991-----
LifEst SoMat Corp TBD • Accommodates mean stress, crackclosure, constant and variableloading
• TBD -----
mTABFRACTURES
Structural Analysis,Inc.
TBD • Constant and variable amplitudewith retardation
• TBD -----
pc-CRACK Structural IntegrityAssociates
Both • Paris with crack closure • TBD -----
CRACKWISE The WeldingInstitute
Elastic Plastic • TBD • British Standard PD 6493: 1991 -----
FRACTUREGRAPHICS
Structural ReliabilityTechnology
Linear Eleasticand ductile tearing
• Paris or polynomial• no retardation
• Level 3 FAD• ductile tearing analysis using crack
growth resistance curve
Build in geometric models plus can useFEA Crack with library of K solutions

151
6.8 References
[6-1] Anderson, T. L., Fracture Mechanics Fundamentals and Applications, CRC Press, 1995.
[6-2] Kosteas, D., Graf, U., Data Basis for Fracture Mechanics Analysis of Aluminum
Weldments (Source and date unknown).
[6-3] Sharp, M. L., Nordmark, G. E., and Menzemer, C. G., Fatigue Design of Aluminum
Components & Structures, McGraw-Hill, 1996.
[6-4] Menzemer, C. C., Fatigue Behavior of Welded Aluminum Structures, Doctoral Thesis,
Lehigh University, 1992.
[6-5] Irwin, G. R., Plastic Zone Near a Ceack and Fracture Toughness, Sagamore Research
Conference Proceedings, Vol. 4, 1961.
[6-6] Yee, R. D., Malik, L., Basu, R., Kirkhope, K., Guide to Damage Tolerance Analysis of
Marine Structures, SSC 402, Ship Structure Committee, Washington, D.C., 1997.
[6-7] 1/19/00 FAX, H. Reemsnyder to R. Kramer, JJMA.
[6-8] Nordmark, G.E., Herbein, W. C., et. al., Effect of Weld Discontinuities on Fatigue of
Aluminum Butt Joints, Welding Journal, Welding Research Supplement, June 1987, p. 162-s.
[6-9] 1/5/00 phone conversation, B. Rampolla, JJMA, to R. Hampton, NASA Ames ResearchCenter, and 1/31/00 FAX from H. Dodds, Dept. of Civil Engineering, University of Illinoisat Urbana-Champaign.
[6-10] Sumpter, J. Engineering Fracture Mechanics, Vol. 64, pp. 161-176.

152
[6-11] Maddox, S. J., Scale Effect in Fatigue Of Fillet Welded Aluminum Alloys, Proceedings,Sixth International Conference on Aluminum Weldments, April 3-5, 1995, AmericanWelding Society, p. 77.
[6-12] Aluminum: Properties and Physical Metallurgy, American Society for Metals, 1984.

153
7. Recommendations for Continued Research
The research conducted for this task has revealed a lack of information that is required
for the consistent analysis of fatigue and damage tolerance of marine grade aluminum weldments
in high-speed craft. In this sense, the term consistent means data that has been specifically
developed to accurately reflect the intended analysis application. In particular, this relates to the
loading environments of high-speed craft, the S/N curves for the appropriate aluminum alloys
subjected to the marine environment and crack growth rate data for the same alloys reflecting the
same environments. Information relating to other applications has been found and is reported
herein. It is also reported that the factors of safety required for designs using this information
need to be inflated to account for the differences between the intended and actual application of
the data used for the analysis. Therefore, this report proposes various efforts to be undertaken to
help generate consistent data for high-speed aluminum craft.
Before any of the recommendations put forward by this report are considered, it is
imperative that review of the aluminum database that supports the EuroCode 9 be examined. It
is apparent that this database contains extensive information regarding fatigue and damage
tolerance/crack growth rate information for marine grade aluminum alloys. The applicability of
the information in this database needs to be investigated for relevance to the high-speed craft
industry. This database may have more applicable information than reported herein but it was
not possible to review the database for this task. Discussion with Professor Kosteas conducted as
part of the research for this task indicated a willingness to share the information contained within
the database. Time and funding were not available for inclusion of this effort for the current
report. Part of the effort required to review this database includes definition on the part of
Professor Kosteas as to the proprietary nature of the various data included within the database
and the organizations that funded specific tests. Time and funding should be made available for
the USCG to review and contribute to this database which, through the efforts of Professor
Sanders, had its origins here in the United States.(See Section 3.1 of this report). Also, there
does appear to be an increasing amount of research underway leaving the impression that
maritime organizations, classification societies and owners around the world are aware of the
benefits in using aluminum and are starting to deal with some of the fatigue related obstacles that
accompany its use.

154
Most of the data regarding fatigue in aluminum weldments originates from civil
engineering applications and does not apply directly to the marine environment. Most of the
fatigue tests have been conducted in laboratory air and not in seawater or exposed to the marine
environment. The EuroCode 9 does discuss and present a series of factors to be applied for a
fatigue analysis of aluminum alloys in environments other than air. These environments include
marine and immersion in water and seawater and the factors all reduce the fatigue life compared
to “in-air” behavior. The reduction of life is similar to that demonstrated in Figure 3-5 and
reported in [7-1].
Regarding fatigue and damage tolerance, the particular areas that will require the
development of data to support a consistent fatigue analysis are:
• Environmental loading and the number of loading cycles to be considered for design of High-
Speed Craft. Also, the nature of the loading. Is primary loading the only important variable
or do secondary loads also form a critical load component? How do ship size and length
factor into the balance between primary and secondary loads? The answer to these questions
may vary depending upon longitudinal location within the ship and the operational profile of
a given vessel.
• Appropriate S/N curves for the structural details and aluminum alloys typically used for
high-speed craft. The S/N curves should account for the marine environment and any other
corrosive effects specific to a given application.
• Fatigue crack growth rate data for the appropriate aluminum alloys. The crack growth rate is
also a function of the environment and tests need to reflect the effects of the marine
environment. The crack growth rate tests may be developed in accordance with the fatigue,
S/N tests. It may be possible to continue the S/N testing after crack initiation to determine the
crack growth rate data. Any such tests need to insure the proper rate of loading is applied
during the respective phases of the test. In particular, fatigue tests are often carried out at
fairly high frequencies to reduce the time required to obtain high cycle count associated with
these tests. The crack growth rate data must be obtained at load cycling frequencies that
allow the corrodant of interest time to act upon the cracked detail, i.e., the load application
frequency will be decreased to allow proper interaction between the corrodant and the
aluminum.

155
The work outlined above forms the basis for the most critical data needed for the fatigue and
damage tolerance analyses. Additional work will also be required to assess other factors. These
include the effectiveness of coating systems and cathodic protection systems on the fatigue
behavior and crack growth rate in the marine environment.
7.1 Environmental Loading for Fatigue Analysis
If it were possible to develop generic procedures for the loading environment applicable
to high-speed craft, then this would be the first objective of future research and development in
this area. It is possible that this type of information could be developed at a specific location of
the ship and load factors developed to account for transverse and longitudinal distribution
throughout the vessel. This information could be applied to specific designs to develop the stress
and load cycle histories for the vessel and required for the fatigue analysis.
Alternatively, it may be possible to compile stress histograms through the direct
instrumentation of high-speed craft over a period of time. The stress histograms could be related
to the load profile experienced by the vessel and from this information design loading profiles
could be developed for the design of high-speed craft. This information, although time
consuming and expensive to obtain, provides reliable loading profiles for the design of future
vessels. Of course, it would be necessary to modify this information to account for vessels to be
used on trade routes that differ from those traveled by the instrumented craft.
The environmental load profiles currently available for commercial steel vessels include
loads resulting from the payload carried onboard the vessel. The contribution of payload, such
as vehicles carried upon passenger ferries, still needs to be investigated to evaluate the total
loading environment. In general, the interaction of primary and secondary loads needs to be
considered for high-speed craft. Secondary loads may be of particular importance for shorter
craft as the stresses due to primary loads tend to be smaller for shorter vessels.
7.2 S/N Curves for Fatigue Analysis
Another area lacking information directly applicable to the marine environment are the
S/N curves for the aluminum alloys used in the construction of high-speed craft. The
information in Appendix E along with that shown in Figure 3-5 confirms the effect of seawater
on the fatigue life of aluminum weldments. This data needs to be developed for the aluminum

156
alloys and structural details typically used in this industry. The first priority would be to develop
this information for the 5000 and 6000 series alloys and the details associated with each. It is
expected that the long-term fatigue lives for these two families of alloys would approach the
same value as discussed earlier in this report. Regardless, separate tests may be required for each
series depending on the typical geometry, function and specific environments of the different
details and their alloys. Series 6000 alloys are typically used in different environments than the
5000 series, i.e., the 5000 series alloys are the only alloys that are designed to be in contact with
the seawater. The 6000 series are typically in air and possibly subject to the marine spray. Data
for S/N curves of marine grade aluminum alloys do exist for other environments, typically
laboratory air.
It is anticipated that future R&D programs would be developed to investigate structural
details in a manner similar to that developed in SSC 318 for steel. The development of such an
extensive database would require significant time and funding and it is not expected that this
could be developed in the near term or through the efforts of any single task. Rather, it is
expected that various R&D efforts over the years would address the more critical and commonly
used details to best serve the high-speed industry. It may also be possible that information to this
design database could be augmented from R&D conducted for programs not specifically
connected to the Coast Guard or SSC. This could include research conducted at universities or
other test facilities applicable to the high-speed ferry or high-speed craft industries.
7.3 Crack Growth Rate Data for Aluminum Alloys
It is critical to be able to develop FCGR curves similar to those shown in Figure 3-15 for
the alloys and environments applicable to high-speed aluminum craft. Without this information
it will not be possible to accurately determine the time to failure of damaged aluminum details.
As suggested above, tests may be developed in conjunction with S/N tests or investigation may
reveal that separate tests may produce the desired data more efficiently. One benefit of the
dedicated crack growth rate tests is control of the experiment. If the tests were run as extensions
of the fatigue tests then it is expected that random cracks would develop and require an extra
degree of correlation not required with tests that start with existing cracks designed specifically
to record the behavior of the sample relative to a known flaw. Once again, it is also imperative
that efforts be made with the European Committee for Standardization to investigate the

157
possibility of reviewing the database developed to support the fatigue crack growth rate data in
EuroCode 9. The data used in the code does not reflect the marine environment but other
information for the fatigue calculations suggests that there may be more data available for other
environments. This is further substantiated because the EuroCode 9 is primarily developed for
civil engineering applications but reference to other environments is made in various portions of
the document.
7.3.1 Loading and Strain Rate Data for Damage Tolerance AnalysisInitially, it was expected that strain rate or loading rate would be an important variable in
the damage tolerance analysis of aluminum weldments. Discussion with H. S. Reemsnyder
confirmed that aluminum is not sensitive to strain-rate under 10,000 in/in/sec which exceeds any
strain-rates to be experienced by high-speed craft and suggests that this variable is not critical for
the damage tolerance assessment of marine grade aluminum alloys.
7.4 Fracture Toughness Criteria
It is clear that KIc is not suitable for the marine grade aluminum alloys, but it is not clear
which of the other criteria identified in Section 6.3 should be used. Further literature searches
and discussion with industry experts should be conducted to address this issue. Appropriate
testing will then be required to generate the necessary data. Preliminary findings suggest that
CTOD is the preferred method for elastic-plastic materials due to the simpler measurement
techniques but additional research is still needed to confirm this conclusion.
7.5 Fatigue and Fracture Software for Damage Tolerance Analysis
It appears that many of the commercially available packages have the necessary
sophistication to perform the elastic-plastic analysis required for the marine grade aluminum
alloys considering such factors as crack retardation from periodic overloads. However, it is
likely that some of the packages will produce results that may tend toward conservative or non-
conservative estimates. This type of information must be evaluated before ship owners are
required to perform damage tolerance analysis otherwise the results will not be meaningful. As
such, a program is recommended to evaluate the software packages using welded specimens
representative of actual structures and fatigue loading spectrums representative of actual service
conditions.

158
7.6 Program to Gather the Necessary Data to Fill Gaps Identified Above
Before any program is addressed for future projects it is recommended that a survey of
existing fatigue damage to aluminum structural details in high-speed craft be conducted. This
will allow for the collection of a variety of information that should be obtained prior to further
research. Resulting from this survey it should be possible to determine what type of information
needs to be gathered by future research and the priorities associated with each. Among the
information sought by preliminary surveys are:
• The type of details used in the construction of aluminum high-speed craft.
• The aluminum alloys, weld metals and welding procedures used for construction.
• Quality control procedures used during the construction of the vessel and the likelihood
of introducing stress concentrations during construction. The quality of welding in
aluminum fabrication is extremely important. Aluminum is not as forgiving as steel with
regard to weld imperfections and fatigue/damage tolerance behavior. It would be
important to know whether increased QA could help relieve some of the fatigue problems
currently occurring throughout the high-speed craft industry.
• The type and location, i.e., longitudinal and transverse distribution of fatigue failures
grouped according to the type of detail.
• Survey of the details that have experienced none or limited fatigue failures for
comparison to those that seem more likely to crack.
• Preliminary calculations to determine whether analytic fatigue predictions would support
the results of the surveys, i.e., are the analyses able to predict that some details will be
more susceptible to fatigue cracking than others and do the analyses agree with the results
of the surveys?
This type of information should be combined with the gaps in the data determined from
this task in order to develop R&D tasks that could more fully support the industry. It does not
appear that any survey of this type of information exists for aluminum high-speed craft. Typical
repair practice for an aluminum boat appears to be very local and immediate, i.e., if a crack
develops go repair it and be done with it. It appears that there are very little formal records and
certainly no industry-wide database detailing this type of information.
The program to gather the necessary data would include work with one or more testing
facilities capable of performing the fatigue tests and the crack growth rate tests. These two series
159
of tests would develop the S/N curves and the da/dN vice ∆K curves typically used for these
calculations. Including the appropriate environmental effects would be required of the test
facilities. The work would have to include the notch effects to help quantify this aspect of the
fatigue design problem and the reduction in life associated with such defects.
As suggested earlier, this work should also be integrated with the program to test the
various software packages to determine how well they track with the results developed during
the actual tests. An independent agent would be required to assess the quality of the software
predictions to insure consistent modeling and use of the capabilities within each software
package.
Additional work to help complete the program for gathering the necessary data would
center on the loading environments and load histories appropriate to the high-speed craft. It is
suggested that the definition of the loading spectra could be developed separately with model test
facilities and through the use of loading algorithms such as those discussed for the spectral
fatigue analysis in Section 2 of this report. Both procedures would need to account for the
effects of speed and length on the loading histories and would have to assess the specific
importance of the primary and secondary load components typically associated with ship design.
The results of the two procedures would be compared to help determine the inaccuracies
associated with load prediction methodologies and associated corrections for future design
practice.
Along with the load spectra development would be the investigation of the applicability
of using probability distribution functions to represent the long-term distribution of various load
components on the high-speed craft.
As a summary, the program to gather the necessary data to fill the gaps is:
1. Conduct survey of existing details used in the construction of high-speed craft.
Identify shipyards, boat builders and owners that would be willing to cooperate with
the spirit of this program and offer access to their records and/or vessels.
2. Quantify and catalog the details and note fatigue resistant details as well as those with
failure histories. Record the material, design and welding procedures used to develop
the details.
3. Perform preliminary calculations to determine the capability of existing
methodologies for prediction of fatigue failures.

160
4. Investigate the database compiled for the development of EuroCode 9 and determine
its applicability to the current subject matter. If access to this database becomes
available then the steps outlined below will probably need to be redefined.
5. Define the fatigue, fracture and crack growth tests that need to be developed. This
includes the aluminum alloys that need to be investigated and the corresponding
environments and protection or coating, i.e., painting systems. Also included in these
tests will be notched specimens to help quantify the effects of such notches and
explicit stress concentrations on aluminum in the marine environment.
6. Identify test facilities capable of performing the fatigue and crack growth experiments
required for the data collection identified in this report. Investigate their capability to
simulate the marine environment during the testing procedures. Also obtain cost
estimates to perform the various tests.
7. Assess and compare the various software packages available for the fatigue and
damage tolerance analyses. Work with the software vendors to determine the limits
of each package’s applicability and the willingness of the vendor to contribute to the
comparison effort.
8. Identify resources capable of developing the loading histories for the various classes
of high-speed craft. Investigate the analytical and testing methodologies available to
develop this data. Also need the ability to assess the relative magnitude and phasing
of the primary and secondary loading components and account for the length and
speed effects of the high-speed craft.
9. Identify resources capable of working with the loading histories and investigating the
applicability of probability distribution functions to define long-term loading profiles.
This needs to address both primary and secondary loads.
10. Identify new alloys and fabrication processes such as and friction stir welding which
are currently undergoing significant study for application to high-speed craft.
7.7 Detail Improvement Techniques
Along with the information presented in this report and the prospect for the development
of fatigue design procedures for aluminum high-speed craft it is also recommended that
designers of such craft review some of the fundamental techniques currently available to reduce

161
fatigue induced cracking. These include the design philosophies associated with the selection of
details inherently more fatigue resistant and utilization of appropriate welding procedures during
fabrication. Designers of high-speed aluminum craft should remember the basic guideline that
procedures used to improve the fatigue resistance of a steel detail will also work to improve the
resistance of an aluminum detail. Minimize stress concentrations and simplify the geometry of
details. These are two of the primary causes of fatigue crack initiation.
This section lists a number of references dealing with the concept of improved detailing
to help minimize or reduce fatigue problems. By no means is this intended to be an exhaustive
collection, merely a number of references to help the designer with this aspect of the design. The
SSC reports listed in this section were primarily developed for application to steel vessels.
Regardless, the concepts put forward by these reports establish good techniques for the reduction
of stress concentration or crack initiation cites. Many of the same philosophies apply to both
steel and aluminum and it may benefit the designer to see some of the improved details
recommended by previous efforts. As suggested in Appendix A, further information regarding
these and other SSC reports may be obtained from their site at www.shipstructure.org.
• SSC 405 “Fatigue Resistant Detail Design Guide for Ship Structures.”
• SSC 400 “Weld Detail Fatigue Life Improvement.”
• SSC 379 “Improved Ship Hull Structural Details Relative to Fatigue.”
• SSC 372 “Maintenance of Marine Structures; A State of the Art Summary.”
• SSC 367 “Fatigue Technology Assessment and Strategies for Fatigue Avoidance in Marine
Structures.”
• SSC 318 “Fatigue Characterization of Fabricated Ship Details for Design.”
• Lloyd’s Register “Guidance Notes for the Classification of Special Service Craft” Version
1.0 Design Details.
• ALCOA Report for Project Serial No. S4633 Task 18126 “Considerations for the Structural
Detailing of Aluminum Ships” November 1974
In addition to these references, it is also suggested that the designer investigates
techniques for fatigue improvement using stress-relieving techniques. These could include
thermal treatment, peening, grinding or other applicable techniques. Appropriate maintenance
schedules and plans for aluminum vessels also need to be developed and administered.

162
Together, these practices can lead to the development of more fatigue resistant aluminum
weldments in high-speed craft.
7.8 Variation on the Safe-Life Design Philosophy
As discussed earlier in this report the factors of safety typically associated with a Safe-
Life design are in the range of 3 to 4. These factors also include the use of conservative loading
and S/N data for the fatigue analysis. These factors represent practice developed by the aircraft
industry to insure crack-free service lives of details whose failure would result in the catastrophic
collapse of the structure. The failure of one of these details could result in the crash of an aircraft
and the associated loss of life and property.
While the structural integrity of a ship is certainly critical, it is also recognized that there
is significant redundancy within the structure of most ships. It is anticipated that most details
that experience fatigue cracking could lose their entire load carrying capacity without threatening
the structural integrity of the hull or endangering the vessel, its crew, passengers or payload.
Therefore, this report would like to suggest the possibility of a third design option
associated with the Safe-Life and Fail-Safe designs. These structural components would be
addressed as Service-Life components and would be part of the structurally redundant envelope
that forms the basic structure for so many vessels. A Service –Life component would be defined
as:
• Service-Life – An individual structural component that forms a portion of a more
complex, redundant structural system such as the hull girder or supporting systems of
a ship. The loss of load carrying capacity of the individual component will not
threaten the global capacity of the system or its contents.
It is intended that Service-Life components have crack free service lives at least 50%
greater than the service life of the vessel.
These components would be typified as longitudinal stiffeners on decks, shell or
longitudinal bulkheads, vertical stiffeners on transverse bulkheads and the brackets or details
associated with their fabrication.
The reason for developing this classification is to allow for the design of details that have
a time to crack initiation that exceeds the service life of the vessel but does not have the same
large factor of safety associated with the typical Safe-Life design. This is justified by the
163
consequences of failure associated with the component and the inherent redundancy of ship
structural systems. Indeed, there may be details that should be designed in accordance with the
strict interpretation of the Safe-Life design and it is not intended that this new classification
interfere with those details. It is also intended that the use of the Service–Life classification be
developed with appropriately conservative load and S/N data similar to the conservative nature
of data used for Safe-Life classification.
7.9 Conclusion
This report has identified numerous gaps in the data that need to be filled before a
complete and consistent fatigue analysis can be developed for high-speed aluminum craft. It has
also defined techniques that can be used until such time that all this data has been developed.
These techniques include the use of aluminum fatigue design procedures developed by DNV and
other industries. The conservative application of the information in these codes to account for
the marine environment and its particular demands will allow the designers of high-speed craft
the flexibility of including the fatigue design problem during the early stages of development.
This will change the attitude of fatigue in aluminum weldments to “solution during design”
rather than the constant “repair and maintenance” problem throughout the life of the craft.
Market demands and increasing fatigue problems will continue to focus attention on the
concerns addressed by this report. Significant and interesting efforts should be undertaken to
help support this industry and provide for safer passage of all fare paying customers enjoying the
use of these aluminum high-speed vessels while simultaneously reducing the operating expenses
of Owners.
7.10 References
[7-1] Sharp, M. L., Nordmark, G. E., and Menzemer, C. G., Fatigue Design of Aluminum
Components & Structures, McGraw-Hill, 1996.

A-1
APPENDIX A
1.0 Introduction
This appendix includes numerous references for fatigue and damage tolerance analysis.They have been segregated into categories that roughly address each of these two topics.Obviously, these two subjects are closely related and many of the references cited below containinformation regarding both.
During the research for this database a scan of all previous SSC reports was conductedthrough their web site at www.shipstructure.org. Once inside the home page for this site, twoseparate searches were performed using the “Search the database by Subject” option. The firstsearch was performed on “fatigue” and the second on “fracture”. A search of the databaseutilizing “damage tolerance” only hit upon two SSC reports, one of which had been captured byeach of the other searches. The SSC database includes numerous reports that were identified bythe search with these two keywords. It appeared that only one of these reports dealt withaluminum, SSC 218 “Design Considerations for Aluminum Hull Structures Study of AluminumBulk Carrier” and the summary of this report is included in the present database. It appeared thatall the other previous SSC reports dealt with steel and it was decided not to include them in thecurrent database. However, the reader is invited to review all these earlier reports to investigatethe magnitude of the work done with marine grade steel compared to that developed foraluminum.
It is also suggested that many of these earlier SSC reports contain information regardinggood practices for the development of fatigue resistant structures. Although written forapplication to steel, many of these practices also relate to good detailing for aluminum and willbenefit the designer of high-speed aluminum craft.
2.0 Adequacy of the Database for Fatigue Design Criteria
The philosophy behind the development of fatigue design criteria is well established andreflected in many of the references cited in the present database. This philosophy is alsoreflected in the body of the report. However, as discussed in the report, there are a number ofgaps in the data required to perform a consistent fatigue for aluminum weldments in the marineenvironment. These gaps apply to the loading cycles and magnitudes of secondary loads as wellas the primary loads acting on high-speed craft. In addition, it will be necessary to establishphasing between the different types of loads to establish the overall stresses acting in the vessel’sstructure. Data on the crack growth rate of marine grade aluminum that is required for thedamage tolerance analysis has also not been found for the current project and reflects anotherarea that requires additional test and evaluation.
The database does present a lot of good references for classical fatigue analysis. Thedatabase also cites various references that have recently been developed in the area of fatigue of
A-2
aluminum weldments in the marine environment. It allows the reader to realize that there is agrowing recognition of this problem and that various organizations have begun to address it.These organizations include classification societies, educational institutions and private industry.
Before proceeding to the general database developed for this task, a few specificreferences are listed separately. These references were selected from the rest because of thecurrent, broad-based information they contain. In addition to the design codes cited in this reporta number of others are listed below to help the designer recognize other potential sources ofinformation.
General References
Anderson, T. L., Fracture Mechanics, CRC Press 1995.
Barsom, J. M., and Rolfe, S.T. Fracture & Fatigue Control in Structures, Prentice-Hall,Englewood Cliffs, New Jersey, 1987.
Sharp, M. L., Nordmark, G. E., and Menzemer, C. G., Fatigue Design of Aluminum Components& Structures, McGraw-Hill, 1996.
Maritime Design Codes
DNV Fatigue Analysis of High Speed Craft, December, 1999 (Proposal)
DNV Fatigue Assessment of Ship Structures, Classification Notes, No. 30.7, September, 1998.
Lloyd’s Register Rules and Regulations for the Classification of Special Service Craft, Volume5, Part 7, Hull Construction in Aluminum, 1996.
Lloyd’s Register Guidance Notes for the Classification of Special Service Craft, Version 1.0,Design Details. 1996.
Other Industry Design Codes
Aluminum Design Manual from the Aluminum Association, Washington, D.C., 1994.
EuroCode 9: Design of Aluminum Structures – Part 2: Structures Susceptible to Fatigue, fromthe European Committee for Standardization, revision 2, 1999.

A-3
Manual of Standards and Recommended Practices Section C – Part II, from the Association ofAmerican Railroads, Washington, D.C., 1998.
AASHTO Guide Specification for Aluminum Highway Bridges, from the American Associationof State Highway Transportation Officials, Washington, D.C., 1991.
BS 8118, from the British Standards Institution, 1992. Section 7 of Part I provides informationon fatigue design of aluminum components.
European Recommendations for Aluminum Alloy Structures Fatigue Design, from the EuropeanConvention for Constructional Steelworkers (ECCS).
Papers Presented at the 4th International Forum onAluminum Ships, May 2000
In addition to the papers referenced below, further information may be available on the websiteof the forum organizers at www.quantic.co.uk. The individual listed with each of the papers was thepresenter at the conference. Additional contributors were often cited for complete authorship.Readers may also wish to access the website referenced above to review the titles presented atthe 3rd International Forum on Aluminum Ships held in 1998.
Effects of Impact on Aluminum Shell Plating, Professor Bart Boon, Delft University ofTechnology.
Hull Structural Damage and Repairs, Mr. Oyvind Wilhelmsen, Det Norske Veritas.
Structural Design, Production and Operational Experience of Superseacat Fast Ferries, Mr.Stefano Ferraris, Fincantieri C.N.I Naval Vessels Business Unit.
Aluminum SWATH Pilot Tender for the German Bight, Mr. Victor Beltran, GermanischerLloyd.
ABS Developments Related to the Requirements for Aluminum Vessels, Mr. Derek Novak,American Bureau of Shipping.
Practical Considerations for Aluminum Ship Construction, Mr. J. Polderman, Lloyd’s Register ofShipping.
Aplications of the ALUSTAR Alloy AA5059 in the Marine Industry, Dr. Desikan Sampath,CORUS RD&T.
A-4
Application of Friction Stir Welding for the Manufacture of Aluminum Ferries, Mr. StephanKallee, The Welding Institute.
Influence of Welding Conditions and Configurations on Microstructure and Static Properties ofAA5383 Weldments, Mr. R. Dif, Pechiney Centre de Recherches de Voreppe.
Proof Strength of Aluminum Alloy 6N01/6005A-T5 Extrusion Butt-Welded Joint, Dr.Kazuyoshi Matsuoka, Toshiaki Iwata Ship Research Institue.
Fatigue Behavior of 5383 Aluminum Alloy Weldments, Mr. R. Dif, Pechiney Centre deRecherches de Voreppe.
Fatigue Life of a Typical Construction Detail for Aluminum High-Speed Ships, Mr. J. Vink,Delft University of Technology.
Application of Pre-Fabricated Friction Stir Welded Panels in Catamaran Building, Mr. Ole TerjeMidling, Hydro Aluminum Maritime.
Development of Valu Added Aluminum Extrusions for the Marine Market, Mr. JohannesG nner, CORUS Aluminum Extrusions
Possibilities with Aluminum Extrusions Joined by Friction Stir Welding, Mr. Jan Backlund, SapaProfiler AB
Fatigue Database
Ref ID 1Author Tveiten, Bard Wathne
Title Fatigue Assessment of Welded Aluminum Ship Details
Source NTNU, Trondheim
Volume NA
Summary The purpose of this work has been to improve methods for the fatiguestrength assessment of welded aluminum ship details. Three main areas wereinvestigated: 1) Verify and improve the design principles and design approaches for thefatigue assessment of welded aluminum ship details. 2) Investigate the affect of local
A-5
weld treatment as a means for improving the fatigue strength of existing aluminum shipdetails. 3) Investigate the affect of low stress levels on the prediction of fatigue lives ofwelded aluminum ship details subjected to variable amplitude loading. Nominal,structural and a notch stresses were used for this evaluation.
Ref ID 2Author Menzemer, C.C.
Title Fatigue Behavior of Welded Aluminum Structures
Source Alcoa Technical University
Volume NA
Summary A study was undertaken to extend the full scale fatigue database foraluminum weldments, examine differences in behavior of small specimens and largebeams, investigate various life prediction techniques, quantify the fracture resistance oftypical structural alloys, and propose design rules.
Ref ID 3Author Paauw, A.J., Fredheim, S., Engh, B.
Title Konstruksjonsdata for dynamisk belastade aluminium sveiseforbindelser
Source Norges Tekniske Naturvitenskaplige Forskningsrad
Volume 82-595-3082-1
Summary As aluminum becomes more important it is highly relevant to find outmore about it's fatigue properties. This paper addresses this problem and provides testdata for aluminum weldments and alloys such as AlMg2.5, AlMg4.5, AlMgSi1 andAlZn4.5Mg. The tests are conducted on butt-, T-, K- and on reinforced V weldmentsand these specimens are exposed to air, vapor and seawater.
Ref ID 4Author Beach, J.E., Johnson, R. E., Kohler, F.S.
Title Fatigue of 5086 Aluminum Weldments
Source Second International Conference on Aluminum Weldments, Munich, F.R.G., 24 to 26 May 1982
Volume NA
Summary Full size welded 5086 aluminum details were fatigue tested to study thegeometric effects on fatigue life. They were comprised of an extruded tee fillet welded toa bottom plate (shell plate with longitudinal stiffener) with a centrally located intersectingor passing plate and tee stiffener (transverse bulkhead with vertical stiffener). A total of

A-6
46 specimens were laboratory tested under constant amplitude axial loads, variableamplitude axial loads and variable amplitude bending loads.
Ref ID 5Author Sanders, W.W. and McDowell, K. A.
Title Fatigue Behavior of 5000 Series Aluminum Alloy Weldments in Marine Environment
Source NA
Volume NA
Summary This report presents the results of a study of the fatigue behavior of 5086-H116, 5456-H116 and 5456-H117 aluminum alloys. The weldments are analyzed bothin air and submerged in seawater for 30 days before and during the tests (ASTMD1141-52.) The specimens are full thickness plates (3/4 in. and 1 in. thick) axiallyfatigued under a zero-to-tension stress cycle. Sixty fatigue tests are conducted includingthirty-nine tests on specimens in marine environment with the remainder in air. Resultsare presented in both tabular and graphical form. S-N diagrams show the significantreduction in fatigue life for both plain plates and weldments at all stress levels as aresult of submergence in seawater.
Ref ID 6Author James, M.N., Paterson, A.E. and Sutcliffe, N.
Title Constant and variable amplitude loading of 6261 aluminum alloy -beamswith welded
Source Sixth International Conference of Welded Structures
Volume NASummary A study of the constant and variable amplitude fatigue performance of
6261-T6 aluminum I-beams with a welded rectangular cover plate is conducted. Thetest involved over 100 specimens and considered the effect of weld 'quality' (in terms oftoe angle, leg length and heat input), and thermal and vibratory stress relief on stresslife curves under simple repeated two level block loading.
Ref ID 7Author Reemsnyder, H. S.
Title Development and Application of Fatigue Data for Structural SteelWeldments.
Source ASTM, Special Technical Publication 648, 1978
Volume N/A

A-7
Summary Presents a good overview for many of the basic parameters effecting thefatigue environment. Discussion on testing and test set-up, notches residual stressesand the welding process all provide good information for the introduction to the subjectmatter. Additional discussion on mean stress and stress range introduce the effects ofthese variables. Also presents introductory discussion on crack initiation andpropagation.
Ref ID 8Author Wolfgang, F., and Petershagen, H.
Title Detail design of welded ship structures based on hot-spot stresses
Source Germanischer Lloyd, Institute fur Schiffbau der Universitat Hamburg
Volume N/A
Summary Details of ship structures are characterized by a relatively complexgeometry, showing a large variety in shape and plate thickness. The paper can assistthe designer in determining the stress concentrations at different details.
Ref ID 9Author Orjasaeter, O.
Title Environmental Behavior of Aluminum and new Design Rules
Source Stahlbau Spezial-Aluminum in Practice/Dimitris Kosteas
Volume memo..!
Summary
Ref ID 10Author Atzori, B., and Tovo, R.
Title Comparison of fatigue strength in light alloy welded joints
Source Welding International 1998
Volume p. 884-889Summary This paper deals with the experimental investigation of fatigue strength of
AA 5083 and AA 6009 aluminum alloy welded joints. Test pieces consist of 3 mm plateswith different welded joints: butt welds and lap fillet joints, both MIG welded. Fatiguetests under constant amplitude loading, as well as tension tests and reverse bend testswere conducted.
Ref ID 11

A-8
Author Orjaset, O.
Title Variable amplitude loading of aluminum weldments
Source SINTEF, Norway. Report number: STF20 A90099
Volume NA
Summary A series of butt welds and fillet welds of AlMgSi1 and AlMg4.5Mn, weresubjected to tests carried out under two types of random loading spectra. Both air andseawater environments were investigated. The test results were re-calculated usingMiner sum of 0.6 and that proved to give a satisfactory safety level.
Ref ID 12Author Aabo, S., Paauw, A.J., Engh, B., Solli, O.
Title Utmattning av sveiste aluminiumforbindelser
Source SINTEF, Norway. Report number: STF34 A85024
Volume NA
Summary A test series of butt welds and fillet welds of AlMgSi1 and AlMg4.5Mn,were performed. Different weld procedures were compared in relation to fatigue. Alsodifferences in R-value have been investigated subjected to bending loads. The report iswritten in Norwegian.
Ref ID 13Author Paauw, A.J., Fredheim, S., Engh, B.
Title Konstruksjonsdata for dynamisk belastade aluminium sveiseforbindelser
Source SINTEF, Norway; Report number: STF34 A83042
Volume NA
Summary A test series of butt welds and fillet welds of AlMgSi1, AlMg4.5Mn,AlMg2.5 and AlZn4.5Mg have been performed in considering dynamic loading. Thetests have also been conducted in air, sea water and sea water vapor. The report iswritten in Norwegian.
Ref ID 14Author Atzori, B., and Tovo, R.
Title Comparison of fatigue strength in light alloy welded joints
Source Welding International

A-9
Volume 1998-12, p.884-889Summary Experimental investigation of fatigue strength of AA 5083 and AA 6009
welded joints. Butt welds and fillet welds considered. Tension tests and reverse bendtests, taking into account both as-welded bead and the leveling of the weld bead.
Ref ID 15Author Cottignies, L., Ehrstrom, J. C., Pillet, G., Cialti, F.
Title Fatigue behavior of sub-scaled specimens and full size welded and non-welded AA6082
Source Int. Conference on fatigue of welded components and structures
Volume Seventh International Spring Meeting
Summary Fatigue tests on full size AA6082 profiles in welded and non weldedcondition. Results compared.
Ref ID 16Author Partanen, T., and Niemi, E.
Title Hot spot S-N curves based on fatigue tests of small mig welded aluminumspecimens
Source IIW, International Institute of Welding
Volume No: XIII-1636-96
Summary Fatigue tests of MIG welded aluminum joints based on the hot spotapproach. 87 aluminum specimens included. This reference consist of 4 differentpapers that have been incorporated and put together into one document.
Ref ID 17Author Sanders, W.W., and McDowell, K. A.
Title Fatigue behavior of 5000 series aluminum alloy weldments in marine environment
Source Welding Research Council
Volume NA
Summary Tests studying small-specimen fatigue behavior. The weldments areanalyzed both in air and in sea-water. Specimens are full thickness plates. Axial tensiontests with 39 specimens in the marine environment. R = 0.
Ref ID 18

A-10
Author Raynaud, G. M., and Gomiero, Ph.
Title The Potential of 5383 Alloy in Marine Applications
Source Pechiney Rhenalu
Volume NASummary Discusses the potential fatigue and other properties of this new alloy
recently developed for specific application to the marine environment.
Ref ID 19Author Wohlfahrt, H., Th Nitschke-Pagel, Zinn, W.
Title Improvement of the fatigue strength of welded joints by post-weld treatment
Source IIW, International Institute of Welding
Volume NA
Summary A comparison between steel and aluminum. Improvement of the materialshave been made by, shot penning and/or improvement of the weld seam profile by TIGwelding of the last passes or TIG dressing.
Ref ID 20Author Berge, S.,
Title The Plate Thickness Effect in Fatigue Design – Again.
Source Norwegian Institute of Technology
Volume
Summary Paper discusses the effects of specimen thickness on fatigue behaviorand way in which this needs to be modeled using finite element analysis.
Ref ID 21Author Heggelund, S. E., Tveiten, B. W., and Moan, T.
Title Fatigue analysis of high speed catamarans
Source Norwegian University of Science and Technology
Volume NA
Summary It is shown that fatigue is governing the design of the investigated midshipstiffener/web frame connections at the top and bottom of a high speed craft aluminumcatamaran. A direct computation method for estimating the fatigue damage on structuraldetails in a high-speed large catamaran is established.

A-11
Ref ID 22Author Heggelung, S. E., Moan, T., and Oma, S.
Title Global structural analysis of large catamarans
Source Norwegian University of Science and Technology
Volume NASummary Simple methods for determining global loads and load effects in
catamarans are compared with direct calculation procedures, with particular referencesto a 60 m catamaran.
Ref ID 23Author Berstad, A. J., Larsen, C. M.
Title Fatigue crack growth in the hull structure of high-speed vessels
Source Norwegian University of Science and Technology
Volume NA
Summary Fatigue crack growth in the hull structure is considered. The proceduretakes global as well as local effects into account. A case study on a realistic shipstructure is also carried out. Procedure for calculating accumulated damage on a high-speed craft is outlined.
Ref ID 24Author Mikkola, T. P. J.
Title Hot spot approach for fatigue analysis of ship structures
Source TT Manufacturing Technology, Espoo, Finland
Volume NA
Summary Fatigue analysis of ship structures hot spot stresses is described. Toolsdeveloped for effective finite element modeling for hot spot stresses are also discussed.
Ref ID 25Author Reemsnyder, H. S.
Title Constant Amplitude Fatigue Life Assessment Models
Source SAE Transactions, Volume 91, 1983
Volume
Summary
A-12
Ref ID 26Author Fayard, J. L., Bigonnet, A., Dang Van, K.
Title Fatigue design criterion for welded structures
Source Fatigue Fracture of Engineering Meterials Structures Ltd
Volume Vol. 19, No. 6, pp. 723-729, 1996Summary This work presents a fatigue design criterion for continuously welded thin
sheet structures based on a unique S-N curve. In practice, the geometrical stress stateis calculated by means of the finite element method (FEA) using thin shell theory.
Ref ID 27Author Di, S., Kelly, D., Kastak, D., Chwdhury, M., Goss, P Berkovitz, A.
Title Development of a generic ship model for the study of fatigue in welded aluminum
Source Australian Marine Design, Australia
Volume NA
Summary This paper proposes a general procedure to determine the effects offatigue cracks in welded aluminum ship structures. A 68 meter aluminum catamaranhas been modeled and is capable of determining the overall response of the vesselincluding the stress intensity factors.
Ref ID 28Author Hughes, O.
Title Two First Principles Structural Designs Of A Fast Ferry - All-Aluminum and All-Composite
Source Virginia Polytechnical Institute and State University, FAST 97
Volume NA
Summary Presents a strategy for a first structural design using modern computertools. Example provided for a 100 meter fast monohull ferry. Both aluminum andcomposite materials are investigated.
Ref ID 29Author Russel, J. D., Jones, R. L.
Title Developments in Welding Techniques for Aluminium Alloys
Source TWI, The Welding Institute UK, FAST97

A-13
Volume NA
Summary The increased use of aluminum alloys in high-speed craft has led to areappraisal of welding techniques. New methods, such as laser welding are reviewed inthis article.
Ref ID 30Author Ranes, M., Kluken, A. O., Midling, O. T.
Title Fatigue Properties of AS-Welded AA6005 and AA6082 Aluminum Alloys in T1 and T5
Source The 4 Int. Conference on Trends in Welding. Tenn., USA, 5-8 June 1995
Volume NASummary An investigation to determine the fatigue properties of as-welded AA6005
and AA6082 aluminum alloys in T1 and T5 temper conditions is presented. Extruded flatbars were welded with MIG, friction stir and plasma key hole techniques.
Ref ID 31Author Fredriksen, A.
Title Fatigue Aspect of High Speed Craft
Source Det Norske Veritas, FAST 97-Intenational Conference on fast sea transportation
Volume NA
Summary Investigates and reports upon the experience, design philosophy andexamples of fatigue on high-speed craft. DNV's in-service experience with respect tohull, waterjet and machinery are presented. Important factors that affect fatigue on high-speed craft are also presented. Also presents and outline of DNV's fatigue procedure forHSC. Fredricksen is the author of the DNV Fatigue Analysis of High Speed Craft listedunder the Maritime Design Codes of this appensix.
Ref ID 32Author Fyfe, A., Hawkins, G. L., Shenoi, R. A., Price, W. G., Temarel, P.,P.J.C.L.
Read, Kescmar, J.
Title Fatigue Performance of Welded Aluminum Tee Connections
Source FAST'97- International Conference on fast sea transportation
Volume NA
Summary Addresses fatigue performance of aluminum structures subjected toproduction variability. The particular focus is on tee connections. Specimens have been
A-14
produced. Tested in a 45-degree pull-off configuration. This occurs when the bulkhead,floor or web frame is vibrating.
Ref ID 33Author Niemi, E.
Title Random Loading Behavior of Welded Components
Source Lappeenranta University of Technology, Finland;IIW- International Institute of welding
Volume NA
Summary Random loading fatigue testing and design of welded components arebriefly discussed in this paper. Focus is put on the damage caused by the small stress-cycles below the constant amplitude fatigue limit. Damage distributions are calculatedand compared, using both the S-N curve approach and fracture mechanics.
Ref ID 34Author Bannantine, J. A., Comer, J. J., Handrock, J. L.
Title Fundamentals of metal fatigue analysis
Source Prentice Hall Englewood Cliffs, New Jersey 07632
Volume NASummary This book presents basic theory and information for fatigue analysis. It
addresses the fundamentals of stress-life and strain-life approaches and fracturemechanics. It also addresses notches, variable amplitude and multi-axiai fatigue.
Ref ID 35Author Niemi, E.
Title Stress determination for fatigue analysis of welded components
Source IIW-International Institute of welded components
Volume IIW-1221-93
Summary This document introduces definitions of the terminology relevant to stressdetermination for fatigue analysis of welded components. The various stressconcentrations, stress categories and fracture mechanics approaches are defined.
Ref ID 36Author Lyngstad, O. A.
Title Strength reduction in heat affected zone (Technical report)

A-15
Source Det Norske Veritas
Volume Rep. No. 96-0251
Summary This report give some background for the allowable static stresses forwelds in aluminum according to DNV's present rules. The extent and the severity of theHAZ is reviewed.
Ref ID 37Author Berge, S.
Title The plate thickness effect in fatigue design-again
Source Norwegian University of Science and Technology
Volume Vol.3, 1990
Summary The scientific background for the plate thickness effect in fatigue ofwelded joints is reviewed. Effects of post welded treatment and weld profiling aresummarized.
Ref ID 38Author Mikkola, T. P. J.
Title Calculation of the hot spot stresses by thick shell elements for longitudinalstiffener
Source Technical Research Centre of Finland (VTT).
Volume NASummary Thick shell elements were used to derive the structural stress
concentration at critical locations of welded plate structures. The program HOREX wasdeveloped for the stress extrapolation. The P/Fatigue program was applied for thenumerical fatigue analysis.
Ref ID 39Author Blom, A. F.
Title Welded high-strength steel structures
Source North European Engineering and Conference Series
Volume NA
Summary FEM calculations of the stress concentration factor K using shell and solidelements are presented. Two cases are studied: a non-load carrying fillet weldedspecimen and rectangular tube-to-plate joint.

A-16
Ref ID 40Author Jordan, C. R., and Krumpen, Jr, P.
Title Performance of ship structural details
Source AWS-American Welding Society
Volume Vol. 63
Summary Data on the observed performance of ship structural details are presentedand evaluated, with emphasis on design, fabrication, welding, maintenance and service.
Ref ID 41Author Sharp, M. L., Nordmark, G. E., Menzemer, C. C.
Title Hot-spot fatigue design of aluminum Joints
Source ASCE
Volume NA
Summary This paper shows that the hot-spot design method is applicable foraluminum structures. Included are definitions of general fatigue curves applicable to alltypes and procedures for establishing the local stress (Hot spot stress) consistent withthese curves.
Ref ID 42Author Menzemer, C. C.
Title Fatigue behavior and design of aluminum structures
Source University of Akron, USA
Volume NASummary Basic aspects of the fatigue behavior of aluminum components and
structures are discussed, beginning with an examination of material coupons andprogressing to full-scale structural systems.
Ref ID 43Author Menzemer, C. C.
Title Fatigue design of aluminum structures
Source University of Akron, USA
Volume NA
Summary This paper examines some of the items which should be considered inthe fatigue design process and the trends in behavior for various types of joint details.

A-17
Ref ID 44Author Menzemer, C. C., Fisher, J. W.
Title Revisions to the Aluminum Association fatigue design specifications
Source Alcoa Technical Center, USA
Volume NA
Summary Discussion of pertinent test and analytical results that necessitated someof the changes are included. Comparisons to other aluminum fatigue design codes aremade.
Ref ID 45Author Pettersen, O., Wiklund, K. M.
Title Det Norske Veritas requirements for direct calculation methods of high speed and light craft
Source Det Norske Veritas
Volume NA
Summary This paper presents background information, and aims at giving anoverview of the new rules for direct calculation of loads on a high speed light craft. Thedifferent levels of direct calculations applicable for various sizes and types of craft areexplained.
Ref ID 46Author Kosteas, D., Editor
Title Aluminum in practice
Source University of Munich, Germany (Stahlbau)
Volume NASummary This reference is a collection of papers and articles about various
subjects, all related to aluminum. The topics in this reference include: fatigue,environmental impacts, structural design, buckling and bolted connections, etc. Anumber of the articles are written in German, the remaining are written in English.
Ref ID 47Author Petersen, R. I., Agerskov, H., Askegaard, V., Martinez, L. L.
Title Fatigue life of high-strength steel plate elements with welded attachment
Source SSAB, Sweden; technical University of Denmark

A-18
Volume NA
Summary The primary purpose of this project is to study the fatigue life of off-shoresteel structures under various types of stochastic loading. It also provides a goodexample of how to use the Palmgren-Miner cumulative damage analysis method.
Ref ID 48Author Faltinsen, O. M. and Zhao, R.
Title Numerical prediction of ship motions
Source Phil. Trans. Royal Soc., London.
Volume Vol. A334
Summary This is an extension of the strip theory performed in 1970 by Faltinsen,Salvesen and Tuck. The theory will include high forward speed, which it did not do in itsoriginal state.
Ref ID 49Author Salvesen, N., Tuck, E. O., Faltinsen, O. M.
Title Ship motions and sea loads
Source SNAME Transaction
Volume 78: pp 250-287
Summary Formulation of the strip theory that is used to derive sea loads on a shiphull.
Ref ID 50Author Grant, J. E., Dickerson, P. B., Sharp, M. L., Wolff, N. P., Yanok, G. P.
Title Considerations for the structural detailing of aluminum ships
Source Naval Ship Engineering Center, USA
Volume Serial No. S4633 Task 18126Summary This report was initiated to improve the program CASDOS to be useable
on aluminum as well as steel. The report also provides a lot of background informationin aluminum ship design and construction, with all its implications.
Ref ID 51Author Myklebost, I., Oma, S.
Title Aluminium catamarans; material, design and hull fabrication technology

A-19
Source The Third International Forum on Aluminum Ships
Volume NA
Summary This paper describes various aspects of development of new aluminumcatamarans. Three main activities are dealt with: Aluminum Material technology,Catamaran design and fabrication technology.
Ref ID 52Author Bjorneklett, B. I., Frigaard, O., Grong, O., Myhr, O. R., Midling, O. T.
Title Modelling of local melting during friction stir welding of Al-ZN-Mg alloys
Source International Conference on Aluminum Alloys (ICCA-6)
Volume NA
Summary The conditions for local melting at high angle grain boundaries duringrapid heating of an Al-Zn-Mg alloy have been modeled. Local melting is discussed inrelation too friction stir welding.
Ref ID 53Author Fostervoll, H.
Title GT-MIG Welding: A new technique for increased productivity in arc welding of aluminum
Source SINTEF, Norway
Volume NA
Summary A new technique for arc welding of aluminum alloys, given the name T-MIG (Gas Tungsten-Metal Inert Gas) welding, is presented and tested. Theconventional MIG(Metal Inert Gas) and TIG(Tungsten Inert Gas) processes arecombined into one process.
Ref ID 54Author Frigaard, O., Grong, O., Bjorneklett, B., Midling, O. T.
Title Modeling of the thermal and microstructure fields during friction stir welding of aluminum
Source Hydro Aluminum, Norway
Volume NASummary The paper presents a process model for friction stir welding of Al-ZN-Mg
alloys. Framework for handling complex problems of this kind is outlined. The resultsare illustrated in different numerical examples and case studies.

A-20
Ref ID 55Author Hval, M., Sande, V.
Title A new high strength aluminum alloy for marine application
Source Hydro Aluminum Maritime, Raufoss Technology, Norway
Volume NA
Summary This paper presents the background for the development of a new highstrength aluminum alloy suitable for marine application and shipbuilding. The alloy thatis a variant of AA7108 is an AlZnMgZr- based alloy.
Ref ID 56Author Midling, O. T., Osterkamp, L. D., Bersaas, J.
Title Friction stir welding aluminum-process and applications
Source 7:th Int. Conference On Joints in aluminum (INALCO'98)
Volume NA
Summary This paper addresses the most recent advances in process technology,basic understanding of the process itself and new applications. Corrosion behavior ofjoints welded within the processing window is evaluated.
Ref ID 57Author Frigaard, O., Bjorneklett, B., Grong, O., Midling, O. T.
Title Process modeling applied to friction stir welding of Al-Mg-Si alloys
Source 6:th Int. Conference On Aluminum Alloys (ICAA-6)
Volume NA
Summary In the present investigation a 3-D numerical heat flow model for frictionstir welding of aluminum alloys has been developed.
Ref ID 58Author Myhr, O. R., Klokkehaug, S., Fjaer, H. J., Grong, O., Kluken, A. O.
Title Modeling of microstructure evolution and residual stresses in processing and welding of
Source 5:th Int. Conference On trends in Welding Research, 1998
Volume NA

A-21
Summary This paper illustrates the applications of process modeling for prediction ofmicrostructure evolution and residual stresses in welding of age hardened aluminumalloys. Three components: heat flow, microstructure and mechanical models are allconsidered.
Ref ID 59Author Mousavi, M. G., Cross, C. E., Grong, O., Hval, M.
Title Controlling weld metal dilution for optimized weld performance in aluminum
Source Hydro Aluminum, Norwegian University of Science and technology
Volume NA
Summary It is demonstrated how the current trend towards high speed, narrowgroove welding, and the corresponding shift towards high base metal dilution may resultin decreased weldability for 6XXX and 7XXX aluminum alloys.
Ref ID 60Author Myhr, O. R., Klokkehaug, S., Fjaer, H. J., Grong, O., Kluken, A. O.
Title Process model for welding of Al-Mg-Si extrusions
Source The Institute of Materials
Volume
Summary Model based alloy design and optimization of welded conditions for Al-Mg-Si extrusions, with particular emphasis on how changes in the base metal chemicalcomposition and thermal history affect the heat affected zone microstructure evolution.
Ref ID 61Author Menzemer, C. C., Srivatsan, T. S.
Title The effect on environment on fatigue crack growth behavior of aluminumalloy 5456
Source Material Science and Engineering: An Int. Journal
Volume
Summary The effect of laboratory air, water vapor and oxygen on fatigue crackpropagation behavior of aluminum alloy 5456 have been investigated over a range ofgrowth rates spanning five orders of magnitude.
Ref ID 62

A-22
Author Newman, Jr, J. C.
Title Prediction of crack growth under variable-amplitude loading in thin-sheet2024-T3
Source NASA Langley Research Center, USA
VolumeSummary This paper is concerned with the application of a "plasticity-induced" crack
closure model to study fatigue crack growth under various load histories on thin-sheet2024-T3 aluminum alloys.
Ref ID 63Author James, M. N., Paterson, A. E.
Title Fatigue performance of 6261-T6 aluminium alloy - constant and variableamplitude
Source In. Journal of Fatigue
Volume Vol. 19, pp S109-S118
Summary This work is a summary of the results to examine the fatigue strength ofextruded 6261-T6 I-beams with centrally located, welded cover plates under constantand variable amplitude loading.
Ref ID 64Author James, M. N., Paterson, A. E., Sutcliffe, N.
Title Constant and variable amplitude loading of 6261 aluminum alloy I-beamswith welded
Source In. Journal of Fatigue
Volume Vol. 19, pp125-133
Summary A study investigating the constant amplitude and variable amplitudefatigue performance of 6261-T6 aluminum I-beams with a rectangular cover plate isreported.
Ref ID 65Author Bretschneider, C. L.
Title Review of practical methods for observing and forecasting ocean wavesby means of
Source Trans. American Geophysical Union
Volume April, 1957

A-23
Summary Together with information from Ref ID 66 Bretschneider derives his wavespectra that are different from Pierson-Moskowitz spectrum. It can be used with finitefetch which is more suited to the high-speed craft.
Ref ID 66Author Bretschneider, C. L.
Title The generation and decay of wind waves in deep water
Source Trans. American Geophysical Union
Volume Vol. 37, 1952Summary See Ref. 65.
Ref ID 67Author Pierson, W. J., Moskowitz, L.
Title A proposed spectral form for fully developed wind seas based on thesimilarity theory of
Source Journal of Geophysical Research
Volume Vol. 69, 1964
Summary In this report Pierson and Moskowitz formulate their wave spectra that isbased on real time measurements and addresses fully developed sea states.
Ref ID 68Author Yee, R. D., Malik, L., Basu, R., Kirkhope, K.
Title Guide to damage tolerance analysis of marine structures
Source National Technical Info. Service, US Dept. of Commerce
Volume SSC-402
Summary This guide is intended to provide naval architects and structural engineerswith detail guidance on the application of damage tolerance analysis to ship structures.
Ref ID 69Author Conference proceedings
Title Short course on fatigue and fracture analysis of ship structures
Source Fleet Technology Limited (FLT), Kanata, Ontario, Canada
Volume August 18-21, 1998, Troy, Michigan

A-24
Summary The course provide basic information in a number of ship structure relatedtopics, such as material properties, fatigue, fracture mechanics, loads on ships, stressanalysis, residual stresses, environmental effects etc.
Ref ID 70Author Stambaugh, K. A., Lawrence, F., Dimitriakis, S.
Title Improved ship hull structural details relative to fatigue
Source National Technical Information Service. US Dept. of Commerce
Volume Report No. SSC-379Summary This report presents a fatigue design strategy for welded ship structural
details. The fatigue design is based on cumulative damage theory using nominal stress.Guidance is provided showing designers how to improve the fatigue life of details.
Ref ID 71Author Kirkhope, K. J., Bell, R., Caron, L., Basu, R. I.
Title Weld detail fatigue life improvement techniques
Source National Technical Information Service. US Dept. of Commerce
Volume Report No. SSC-400
Summary Key elements of this project were to compile available data on fatigue lifeimprovements techniques, assess the feasibility and practicality for their application toship details, identify gaps in the technology, and finally to recommend design,construction and repair requirements. Steel is the material considered, but somemethods might be applicable on alternative materials.
Ref ID 72Author American Society for Materials
Title Metals Handbook: Nondestructive inspection and quality control, 8thEdition
Source American Society for Metals
Volume Vol. 11
Summary This volume covers a variety of testing and inspection procedures, suchas hardness testing, ultrasonic inspection, leak testing, radiographic testing. It alsocovers quality inspections, e.g. weldments, forgings, castings, adhesive-bonded joints.
Ref ID 73
A-25
Author Reemsnyder, H. S.
Title Stress Analysis
Source SAE Transactions, Volume 91, 1983
Volume
Summary
Ref ID 74Author US Navy Sea Systems Command
Title Superstructure cracking repair.
Source Ingalls Shipbuilding, Inc.
VolumeSummary This is a manual on guideline for repairs of cracks in the CG 47
superstructure.
Ref ID 75Author American Bureau of Shipping
Title Guide for Building and Classing High-Speed Craft, (Feb. 1997)
Source American Bureau of Shipping
Volume
Summary This guide has been prepared to update the requirements of the ABS"Guide for Building and Classing High-Speed Craft October 1990". The guide specifiesmachinery requirements and hull construction requirements based on steel, aluminumalloys and fiber reinforced plastics (FRP). It does not address fatigue.
Ref ID 76Author Fuchs, H. O., Stephens, R.I.
Title Metal fatigue in engineering
Source John Wiley & Sons, New York
VolumeSummary This textbook provides general information about fatigue, fracture
mechanics, design methods and details, but mostly for steel applications.
Ref ID 77

A-26
Author Ferdinand, P. B., Johnston, Jr., E. R.
Title Mechanics of Materials
Source McGraw-Hill, New York
Volume
Summary Textbook about general strength assessment specifically addressingbasic beam theory.
Author Altenburg, C. J., and Scott, R. J.
Title SSC 218 Design Considerations for Aluminum Hull Structures Study ofAluminum Bulk Carriers.
Source Ship Structure Committee
Volume SSC 218Summary The fabrication of a large aluminum hull with state of the art materials andconstruction techniques is shown to be technically feasible. Present 5000 series alloys haveadequate properties, though additional research is required, particularly into fatiguecharacteristics. Experience to date with existing aluminum ships has been good, though instancesof cracking at welds and corrosion have been noted. Criteria for the design of the aluminum hullstructure are presented and justified. Methods of fire protection and system/equipmentinstallation are evaluated, and operational characteristics of an aluminum bulk carrier arereviewed. The designs of a large aluminum bulk carrier and an equivalent steel ship arepresented and compared. The aluminum ship's structure weighs 43 per cent less than the steelship, and its hull is about 50 per cent more flexible. Cargo deadweight is increased 7-1/2 percent. Cost studies indicate that for the same return on investment the required freight rate of thealuminum bulk carrier is higher than the equivalent steel ship, for all levels of procurement,assumed hull life, or voyage length considered. Areas for further research are presented andfurther investigations of large aluminum ships are proposed.

A-27
Damage DatabaseRef ID 1
Author K.
Title Revisions to the Aluminum Association Fatigue Design SpecificationsSource FAST '97 Papers
Volume p. 11
Summary 1) 1985 Aluminum Association aluminum fatigue design rules used S/Ncurves approximated by step curves - used data from tests and the literature in databasedeveloped at Iowa State - forerunner of the ALFABET database developed and maintained atTechnical University of Munich
2) 1994 design rules use straight line S/N curves based on numerous tests byAlcoa and others from 1892-1986 on 5 details - lower bound curves were established to provide95% confidence limit for 97.7% probability of failure - the design curves were set at twostandard deviations from the mean
Ref ID 2Author K.
Title A Comparison of Design Codes for Aluminum Structures
Source Proceedings, Sixth International Conference on AluminumVolume p. 25
Summary
Ref ID 3Author J.
Title Fatigue Behavior and Design of Welded Aluminum Hollow ShapesSource Proceedings, Sixth International Conference on AluminumVolume p. 197
Summary
Ref ID 4Author K.Title Safety and Reliability in Aluminum DesignSource Proceedings, Sixth International Conference on AluminumVolume p. 1Summary

A-28
Ref ID 5Author J.Title Design Review of an Aluminum Alloy Railway CoachSource Proceedings, Sixth International Conference on AluminumVolume p. 37Summary Fatigue assessment using BS8118 and detailed evaluation of hot spots
Ref ID 6Author K.Title Fatigue of Aluminum Stiffener-Girder ConnectionSource FAST '97 PapersVolume p. 637Summary See attached
Ref ID 7AuthorTitle Development of a Generic Ship Model for the Study of Fatigue in Welded
Aluminum CatamaranSource FAST '97 PapersVolume p. 629Summary 1) S/N response of many welded joints in catamaran structure is impreciseand largely unreliable function of weld type geometry and weld technique
2) further work includes generating the wave loading based on a selectedroute and sea-state, including slamming and other dynamic effects
Ref ID 8AuthorTitle Fatigue Aspects of High Speed CraftSource FAST '97 PapersVolume p. 217Summary See attached
Ref ID 9AuthorTitle Fatigue Performance of Welded Aluminum Tee ConnectionsSource FAST '97 PapersVolume p. 209Summary 1) S/N for 5083 for fillet welds of varying size and gap - results showdifferent weld toe HAZ properties from differences in welding voltage and amperage have more
effect than the weld size and gaps in these tests

A-29
2) the "hot-spot" using peak stresses from FEMA at the crack initiation siteis preferable to the use of nominal stresses because it is not always possible to define thenominal stress at a given detail because of the complexities of most designs, suitable fatigue testsresults are not always available for each structural detail
Ref ID 10AuthorTitle Fatigue Crack Growth in the Hull Structure of High Speed VesselsSource FAST '97 PapersVolume p. 255Summary 1) crack growth is governed by time varying local stresses in the detailwhere the crack is developing - these stresses are influenced by global moments in the ship hullfrom waves and ship motions, and also variations of the local pressure on the plates near theactual detail
2) slamming loads which may increase local pressure, whipping, andspringing response have not been taken into account - for some sea states these effects may be ofgreat importance and should be considered in a more refined analysis
Ref ID 11AuthorTitle Guide to Damage Tolerance Analysis of Marine StructuresSource Ship Structure Committee SSC-402, August 97.VolumeSummary 1) fracture toughness data are required at higher loading rate simulating thatfrom wave impacts (see 3.5.2)
2) key properties are yield strength, tensile strength, fracture toughness(3.5)
3) gives fracture toughness lower bound values for several steels withoutCharpy impact data, from conversion of Charpy impact data, and from conversion of crack tipopening displacement (CTOD) data
4) ship structural members are usually subject to intermediate strain rates of5x10-3 in/in/s which is higher than the quasi-static loading rate of normal fracture toughnesstests (3.5.2)
5) gives some crack growth rate data for steel in air and seawater (4.4)
Ref ID 12AuthorTitle Hydrodynamic Impact on Displacement Ship Hulls

A-30
Source Ship Structure Committee SSC-402, August 97.VolumeSummary 1) transient hydrodynamic impulsive loads (HIL) from slammings, waveslap, and frontal impact effects must be combined with those from slow varying wave inducedloads
2) impact loads involve extreme pressure acting over very short timeperiods relative to the natural rate of response of the structure
3) structure response to the HIL is high transient and non-linear - damagevaries from deformed shell plating, to distorted and buckled longitudinals and frames, to fatiguecracking - most damage is sustained by tertiary structure at location of impact, but secondarystructure can be damaged by direct action of impulse loads or by high frequency forces - primarystructure is usually only affected by whipping forces
4) under slamming during forward bottom impact, duration is millisecondsand excites dynamic response of local structure and hull girder
5) impact loads of high performance vehicles are basically of same nature ason conventional ships but HPV's have special features: usually aluminum which generally haslower ratio of allowable fatigue stress to yield strength than steel, and high hydrodynamic loadsdue to high speed and unconventional geometry of means of support cause unusual loaddistributions (3.2.4.1)
Ref ID 13AuthorTitle Fatigue and Damage Tolerance Design Philosophies: an Aerospace
Perspective with Applications to HighSource SNAME FAST 99 - 5th Int. Conf. On Fast Sea Transportation,VolumeSummary 1) starting point for damage tolerance analysis is to assume a defect ispresent - the major question is what size defect to use
2) need Structural Integrity Program (SIP) to address cracks found duringinspection - this program will include inspection intervals, inspection methods, etc
3) should also include Corrosion Prevention and Control Program (CPCP)
4) typically weldment fracture toughness is less than the base metal - weldrepair can further decrease fracture toughness by 20-30%
Ref ID 14AuthorTitle The Evolution of Structures for Fast Craft and Ships

A-31
Source 15th Fast Ferry International Conference, 2/16-17/99, HynesVolumeSummary See attached
Ref ID 15AuthorTitle Physical, Mechanical Properties and Corrosion Resistance of Alustar Alloy
Rolled MaterialsSource 15th Fast Ferry International Conference, 2/16-17/99, HynesVolumeSummary Alustar is modified 5083 with improved as welded strength,
ductility, corrosion resistance, fatigue strength, and toughness (as measured by notched tensile and impact tests)
Ref ID 16AuthorTitle Developments in Welding Techniques for Aluminum AlloysSource FAST '97 PapersVolume p. 559Summary
Ref ID 17AuthorTitle Two First Principles Structural Designs of a Fast Ferry -
All-Aluminum and All-CompositeSource FAST '97 PapersVolume p. 91Summary analysis is performed per DNV Rules for High Speed and Light Craft
Ref ID 18AuthorTitle Data Basis for Fracture Mechanics Analysis of Aluminum WeldmentsSource Source and date unknownVolumeSummary 1) tests on 7020 (AlZn4, 5Mg1), 5083 (AlMg4, 5Mn), and 6082 (AlMgSi1)base metal, HAZ, and weld metals 5183 (S-AlMg4, Mn), 5556 (S-AlMg5), and 4043 (S-AlSi5) -welding parameters are given in references 1 and 2 of this report
2) fracture toughness per ASTM E399: no valid results because of hightoughness
3) R-curves per ASTM E589: no valid results because of extended

A-32
plasticity - this methods is based on linear-elastic analysis
4) CTOD: calculated Kc values are 40% above KJc from J-integral
5) J-Integral per ASTM E813: 1149-2161 N/mm 3/2 - a thicknessdependency is present up to 20mm
6) fracture toughness and mechanical properties are reduced in the HAZ butless so for fracture toughness: unstable crack will not occur with these alloys - elastic KIc at theonset of stable crack growth and KJc values should be used as lower bounds of fracturetoughness
7) FCGR: three regions of different microscopic features - Data are onlypresented for AlMg4, 5Mn (5083) - behavior of the other alloys is similar - use of K effectivevalues eliminates effects of R ratio - propose to use the effective crack growth behavior as alower bound for computations - must use polynomial FCGR curve because straight line Pariscurve not valid for entire delta K range
Ref ID 19AuthorTitle Damage Tolerant Design HandbookSource WL-TR-94-4052 Compiled bv University of Dayton ResearchVolumeSummary fatigue and fracture properties for 2XXX, 6000, 7000 series
aluminum alloys
Ref ID 20AuthorTitle A Guide for the Use of Aluminum Alloys in Naval Ship Design and
Construction Volume I: Material Characteristics,Source David Taylor Naval Ship
Research and DevelopmentVolumeSummary S/N curves for base metal, welded, and notched 5083-H113, 5086-H32,5456-H321 - 5083-H113 in seawater spray
Ref ID 21AuthorTitle A Guide for the Use of Aluminum Alloys in Naval Ship Design andConstruction Volume II: Design for ShipbuildingSource David Taylor Naval Ship Research and DevelopmentVolumeSummary Probability based S/N curves for as-welded 5456 and 5086 butt welds in air

A-33
for R=-1
Ref ID 22AuthorTitle A Guide for the Use of Aluminum Alloys in Naval Ship Design
and Construction Volume III: Fabrication for ShipbuildingSource David Taylor Naval Ship Research and DevelopmentVolumeSummary
Ref ID 23AuthorTitle A Guide for the Use of Aluminum Alloys in Naval Ship Design
and Construction Volume IV: Maintenance and RepairSource David Taylor Naval Ship
Research and DevelopmentVolumeSummary
Ref ID 24AuthorTitle Methods for Assessing the Significance of Weld Defects and
Repair Welding on the Fatigue Performance of Thin 5000Source David Taylor Naval Ship Research and DevelopmentVolumeSummary 1) S/N curves and initial stress intensity vs cycles to failure for 5083 and5456-H116 with LOP, LOF, and porosity defects - the fatigue life depend on stress intensitycalculated from initial defect width, maximum stress, and plate thickness
2) S/N curve for repair welded 5456-H116 - fatigue life of weld repairs withembedded repair welds is less than original sound welds and can be less than original weldscontaining the above defects - this reduction appears primarily to result from weld residualstresses and geometric discontinuities
Ref ID 25AuthorTitle European Research on Fatigue of Aluminum StructuresSource Proceedings, Sixth International Conference on AluminumVolume p. 53Summary Evaluation of welded, adhesive-bonded, and friction-grip bolted joints

A-34
Ref ID 26AuthorTitle European Research on Fatigue of Aluminum StructuresSource Proceedings, Sixth International Conference on AluminumVolume p. 65Summary Evaluation of welded and adhesive-bonded joints
Ref ID 27AuthorTitle Scale Effect in Fatigue of Fillet Welded Aluminum AlloysSource Proceedings, Sixth International Conference on AluminumVolume p. 77Summary Use of TWI Fatigue Wise software to predict S/N curves and initial flaw sizeusing FCGR data
Ref ID 28AuthorTitle Fatigue Strength of Longitudinally Welded Aluminum Alloy StructuresSource Proceedings, Sixth International Conference on AluminumVolume p. 95Summary
Ref ID 29AuthorTitle Preliminary Fatigue Comparison of Transverse Butt Welded
Joints to Three Row Flush Riveted Aircraft Lap JointsSource Proceedings, Sixth International Conference on AluminumVolume p. 267Summary 1) Welded 5456-H116 vs riveted 2024-T3 for aircraft structure
2) good corrosion resistance of 5456 might allow it to be used
Ref ID 30AuthorTitle Application of Fracture Mechanics to the Assessment of
Aluminum WeldmentsSource Proceedings, Sixth International Conference on AluminumVolume p. 423Summary 1) 6082-0 and T6
2) 5083 annealed

A-35
Ref ID 31AuthorTitle Elements, Background and Evaluations on Fatigue and
Fracture Behavior of Aluminum ComponentsSource Proceedings, Sixth International Conference on AluminumVolume p. 463Summary 1) Addresses 1992 European Recommendations for Aluminum AlloyStructures - Fatigue Design (ERAAS)
2) S/N curves based on full scale component tests most to 2x10⁶ cycles
3) 5083 base metal S/N design curve and welded S/N design curves
Ref ID 32AuthorTitle Correlating Design and Quality Classifications of Welded
Structural Details in FatigueSource Proceedings, Sixth International Conference on AluminumVolume p. 487Summary 1) BS 8118 provides only correlation between strength classification andquality criteria
2) Analytical prediction of S/N behavior using FCGR curves from Graf (ref.[33])
3) Results of this study will contribute to Eurocode 9: Design of AluminumStructures
Ref ID 33AuthorTitle Fracture Mechanics Data and Procedures for the Calculation
of Fatigue Behavior of Welded Aluminum JointsSource Report of the Department of Constructional Engineering,VolumeSummary (need to review)
Ref ID 34AuthorTitle Selecting Aluminum Alloys to Resist Failure by Fracture MechanismsSource Engineering Fracture
Mechanics, Pergamon Press,

A-36
Volume Vol. 12, pp. 407-441Summary Summary of fatigue and fracture data for 2XXX, 3XXX, 5XXX, 6XXX, and7XXX alloys
Ref ID 35AuthorTitle Effect of Weld Discontinuities on Fatigue of Aluminum Butt JointsSource Welding Research Supplement, June 1987.Volume p. 162sSummary 1) the levels of incomplete penetration and gross porosity present in thesespecimens did not affect the fatigue strength of reinforcement intact welds
2) removing the weld reinforcement doubles the lives of sound welds, butgreatly reduced the lives of transverse specimens containing incomplete penetration
3) high residual stresses, such as would be found in actual structures, hadmore effect on longitudinal joints than on transverse joints
4) repaired welds had lives only 40% to 75% of sound welds, unless therepairs were suitably ground or peened
5) for relatively short fatigue cracks, insertion of interference bolts in holesat the ends of the cracks produced lives equivalent to those of sound welds - stoppage holes, evenexpanded holes, did not delay propagation much
6) reinforcement intact repair welding of fatigue cracks was more effectivefor transverse joints than for longitudinal joints - bonded or welded patches were as effective asrepair welds for transverse joints.
Ref ID 36AuthorTitle Effects of Flowing Natural Seawater and Electrochemical
Potential on Fatigue-Crack Growth in Several Hihg-StrengthSource Naval Research Lab Report 8042, 8/30/76VolumeSummary
Ref ID 37AuthorTitle Fatigue And Corrosion-Fatigue Crack Propagation in
Intermediate-Strength Aluminum AlloysSource ASME Paper 73, MAT-N 1973VolumeSummary

B-1
APPENDIX BExcerpts from
Aluminum Design Manual from the Aluminum Association
1.0 Copyright Release and Limitations on Liability
The information contained in this appendix is reprinted from the Aluminum DesignManual published by the Aluminum Association. The Ship Structure Committee has obtainedthe written permission of the Aluminum Association to use this information in accordance withthe guidance for preparation of SSC reports. Users of the information contained in this appendixassume all responsibilities and liabilities associated with its use unless other contractualarrangements are made directly with the Aluminum Association.
2.0 Introduction
This first portion of the Aluminum Design Manual reprinted herein comes from Part IA,Specifications for Aluminum Structures – Allowable Stress Design. The same information iscontained in Part IB of the design code but is not repeated herein. Part IB of the rules is entitledSpecifications for Aluminum Structures – Building Load and Resistance Factor Design. Itcontains the exact same formulation of the fatigue design procedure as Part IA except forelimination of discussion regarding the 1/3 increase in allowable stress values as provided inSection 2.3.2 of the design code.
The portions of the design code concerning fatigue contained in Part IIA and Part III arepresented after the information from Part IA. Part IIA is entitled “Commentary on Specificationsfor Aluminum Structures – Allowable Stress Design.” Part III is entitled “Design Guide.”
From Part IA:
4.8 FatigueWelded details, mechanically fastened joints and base material of aluminum alloys subjected torepeated fluctuations of stress shall meet all the static requirements of this specification as wellas the fatigue requirements of this section. Fatigue design of castings and associated details shallbe made by testing in accordance with Section 8.There shall be no 1/3 increase in allowable stress values determined in this section as providedby Section 2.3.2.Categories of details for fatigue design parameters shall be chosen from Figure 4.8-1 and Table4.8-1.The maximum and minimum stresses used to calculate the stress range are nominal stressesdetermined by standard elastic methods. Stresses perpendicular to the expected plane of crackingshall be used.

B-2
4.8.1 Constant Amplitude LoadingFor constant amplitude loading
S Sra rd≤ (Eq. 4.8.1-1)
whereSra = applied stress range, the algebraic difference between the minimum and maximum
calculated stress in the member or detailSrd = the allowable stress rangeSrd = AN –1/m (Eq. 4.8.1-2)A, m = constants from Table 4.8.1-1 and shown in Fig. 4.8.1-1N = the number of cycles to failureIf the applied stress range, Sra, is less than the constant amplitude fatigue limit as given in
Table 4.8.1-1, then no further fatigue consideration shall be needed. The allowable stress range,Srd shall not be less than the value from Eq. 4.8.1-2 when N = 5 x 10⁶ cycles and shall not begreater than the value from Eq. 4.8.1-2 when N = 105 cycles.
4.8.2 Variable Amplitude LoadingIf the maximum stress range in the spectrum is less than the fatigue limit, then no further
fatigue assessment shall be needed.
For variable amplitude loading:
Sre ≤ Srd (Eq. 4.8.2-1)where
Sra = equivalent stress range
S Sre I rim
i
N mS
= � �=
α1
1
(Eq. 4.8.2-2)
Srd = the allowable stress rangeSrd = AN –1\m (Eq. 4.8.2-3)αi = number of cycles in the spectrum of the ith stress range divided by the total number of
cyclesSri = the ith stress range in the spectrum
A, m = constants from Table 4.8.1-1 and shown in Fig. 4.8.1-1Ns = number of stress ranges in the spectrumN = the number of cycles to failureThe allowable stress range Srd shall not be greater than the value from Eq. 4.8.2-3 when N =
105 cycles.

B-3
Table 4.8-1STRESS
CATEGORY
GeneralCondition Detail Detail
Category(1)
FatigueDesignDetails(2)
Plain Material Base metal with rolled or cleaned surfaces. A 1,2
Built upMembers
Base metal and weld metal in members, without attachments, built-up of plates or shapes connected by continuous full- or partial-penetration groove welds or continuous fillet welds parallel to thedirection of applied stress.
B 3,4,5
Calculated flexural stress, fb, in base metal at toe of welds ongirder webs or flanges adjacent to welded transverse stiffeners.
C 6,21
Base metal at end of partial-length welded cover plates havingsquare or tapered ends, with or without welds across the ends.
E 5
MechanicallyFastened
Base metal at net section of mechanically fastened joints which donot induce out-of-plane bending in connected material, where
Stress ratio, the ratio of minimum stress to maximum stress, SRis:**
SR < 0
0 ≤ SR < 0.5
0.5 ≤ SR
C
D
E
7
7
7
Base metal at net section of mechanically fastened joints whichinduce out-of-plane bending in connected material.
E 8
Fillet WeldedConnections
Base metal at intermittent fillet welds. E
Base metal at junction of axially loaded members with fillet weldedend connections. Welds shall be disposed about the axis of themembers so as to balance weld stresses.
E 15,17
Weld metal of continuous or intermittent longitudinal or transversefillet welds.
F 5,15,18
Groove Welds Base metal and weld metal at full-penetration groove weldedsplices of parts of similar cross section ground flush, with grindingin the direction of applied stress and with weld soundnessestablished by nondestructive inspection.
B 9
Base metal and weld metal at full-penetration groove weldedsplices at transitions in width or thickness, with welds ground toprovide slopes no steeper than 1 to 2.5, with grinding in thedirection of applied stress, and with weld soundness established bynondestructive inspection.
B 11,12
Base metal and weld metal at full-penetration groove weldedsplices, with or without transitions having slopes no greater than 1to 2.5, when reinforcement is not removed and/or weld soundnessis not established by nondestructive inspection.
C 9,10,11,12

B-4
GeneralCondition Detail Detail
Category(1)
FatigueDesignDetails(2)
Attachments Base metal detail of any length attached by groove welds subjectto transverse and/or longitudinal loading, when the detail embodiesa transition radius, the radius of an attachment of the weld detail,R, not less than 2 in. (50 mm) and with the weld termination groundsmooth:
R ≥ 24 in. (610 mm) B 13
24 in. > R ≥ 6 in. (150 mm) C 13
6 in. > R ≥ 2 in. (50 mm) D 13
Base metal at detail attached by groove welds or fillet weldssubject to longitudinal loading, with transition radius, if any, lessthan 2 in. (50 mm):
2 in. (50 mm ) ≤ a ≤ 12b or 4 in. (100mm) D 14
a > 12b or 4 in. (100mm)where
E 14,19,20
a = detail dimension parallel to the direction of stressb = detail dimension normal to the direction of stress and the
surface of the base metal
Base metal at a detail of any length attached by fillet welds orpartial-penetration groove welds in the direction parallel to thestress, when the detail embodies a transition radius, R, not lessthan 2 in. (50 mm) and weld termination ground smooth:
R ≥ 24 in. (610 mm) B 16
24 in. (610 mm) > R ≥. 6 in. (150 mm) C 16
6 in. (150 mm) > R ≥ 2 in. (50 mm) D 16
Base metal at a detail attached by groove welds or fillet welds,where the detail dimension parallel to the direction of stress, a, isless than 2 in. (50 mm)
C 19
(1) See Table 4.8.1-1. All stresses are T and Rev., where "T" signifies range in tensile stress only; "Rev."signifies a range involving reversal of tensile or compressive stress; except Category F where stressrange is in shear including shear stress reversal.
(2) See Fig. 4.8-1. These examples are provided as guidelines and are not intended to exclude otherreasonably similar situations.
(**) Tensile stresses are considered to be positive and compressive stresses are considered to benegative.

B-5
Figure 4.8-1FATIGUE DESIGN DETAILS

B-6
Figure 4.8-1FATIGUE DESIGN DETAILS
(Continued)

B-7
Table 4.8.1-1
Figure 4.8.1-1SCHEMATIC FATIGUE CURVE

B-8
The following information is from Part IIA of the Aluminum Design Manual, “Commentary onSpecifications for Aluminum Structures – Allowable Stress Design.”
4.8 FatigueThe provisions of this section are modifications of the original fatigue specifications (44). The modifications
include changes to the fatigue strength curves and the addition of a method to determine life of parts under spectrumloading. The changes are based on recent tests of full scale welded beams in the United States (45) and Europe (46).
The analyses consider that the major factors affecting fatigue behavior are the number of stress cycles, themagnitude of the stress range and the type and location of the member or detail. The fatigue crack will generallygrow perpendicular to the plane of maximum stress. This section of the Specifications uses a nominal stress rangedetermined by elastic analysis. The effect of stress concentrations are accounted for through the proper selection offatigue details. Many other factors, including environment, detrimental weld quality, and post-weld mechanicaltreatment can have an effect, but are not considered within the scope of this document. Special analysis or tests arerequired for details and conditions not specifically covered by the specifications.
Loads and number of load applications are not covered. If the information exists for structures of other materials,the same values may be used for aluminum structures of the same type. Wind induced vibrations of undampedstructures or components can cause large numbers of cycles and high stresses and thus need to be avoided.Alternatively, vibration dampers may be used to limit wind induced vibrations.
4.8.1 Constant Amplitude LoadingThe equations for allowable stress are based on the 95% confidence for 97.7% probability of survival. The results
of the recent beam tests account for the revision of the previous values. The fatigue limit was assumed to occur at5x106 cycles for each detail. Static strength provisions in the other sections of the specification limit the designfatigue strength for low numbers of cycles.
4.8.2 Variable Amplitude LoadingReal load histories are frequently more complicated than the constant amplitude loading discussed in the previous
section. This section provides a method by which the engineer may design for more random variable amplitudeloadings experienced by many structures. The equivalent stress method is based on nominal stress ranges, lineardamage accumulation, and no sequencing effects. The engineer should also use a standard cycle counting algorithm,such as rainflow counting (72,73) to determine the equivalent stress range.
The equation for the equivalent stress range is derived directly from Miner's Rule when the S-N curve is astraight line in log-log space. Miner's rule is given by
nN
i
i≤ 10.
where
n = number of cycles of the ith stress range
Ni. = number of cycles constituting failure at the ith stress rangeThe equation states that when this fraction approaches unity, some of the details within the group have begun to
fail. The engineer may wish to use the Miner's rule formulation over the equivalent stress range when assessing theremaining life of an existing structure or when fatigue data is not linear in the Log(stress)-log(life) space.
The analysis is made as specified in Section 4.8.1 except that the fatigue limit is not used. In this case, theequations for allowable stress are also used for number of cycles greater than 5x10⁶ because available data forspectrum loads show continuing decrease at long lives.

B-9
The following information is from Part III of the Aluminum Design Manual, “Design Guide.”
4.0 FatigueDesign of components for fatigue is covered by Equations 4.8.1-1 and 4.8.1-2 for constant amplitude loadings
and by Equations 4.8.2-1 and 4.8.2-3 for spectrum loadings. Various standard details are provided andstress/number of cycle (S-N) curves are given for all the details. The S-N curves are based on the curve providing97.7% probability of survival with 95% confidence level. There is no factor of safety applied to the curves. Theprocedure for design is to use the fatigue strength of the standard detail that most closely approximates the newdetail being designed.
When designing for fatigue there are defined or assumed cyclic loads and a number of cycles. Joints orgeometrical discontinuities, such as holes, are usually areas in which fatigue cracks originate. The designer mustestablish the geometry and joining method such that the resulting stresses are within those given by Equations 4.8.1-1 and 4.8.2-1.
The aluminum component generally must be different from the steel component for the same load spectrum.Figure 4.0-1 shows fatigue strengths for aluminum and steel for groove welds (a Category C detail). For long livesthe fatigue strength of aluminum groove welds is about 40% that for steel. There is a smaller difference at shortlives. The design of the aluminum component must be consistent with the fatigue strength curves for aluminum.
There are a number of factors that should be considered when designing for fatigue.1. The light weight of the aluminum structure may result in reduced design loads. Examples are automotive frames
and some ship structures in which the loading is proportional to the mass of the structure. In cases in which theimposed loads are large compared to the mass of the structure, the design loads are about the same for allmaterials.
Figure 4.0-1FATIGUE DESIGN CURVES
FOR ALUMINUM AND STEEL
2. There are some general guidelines (as compared to steel design) that will provide for more efficient aluminumstructures. Aluminum members in bending should be deeper than those of steel. The spacing of stiffeners on plates

B-10
should be smaller for aluminum components compared to that for steel components. These geometrical differenceswill help meet any deflection requirements for the aluminum component and will lower the stresses in the parts,helping with any fatigue requirements.3. Joints may be eliminated by the use of extrusions and castings, thus removing sites for fatigue crack initiation. Insome cases the designer can locate joints or discontinuities in areas of low stress, thus improving fatigue resistance.4. The type of joint affects fatigue strength significantly, whether welded, mechanically fastened or adhesivelybonded. The designer should select the joint that best meets the need.5. There are enhancements to joints that can improve fatigue strength. These include shaping the weld toes andpeening the edges of the welds. Adhesives can be employed in mechanically fastened (and spot welded) joints. Allof these enhancements increase fatigue strength. Tests will be needed to establish fatigue strength.
Much more information is available on designing for fatigue (1,3,8). In many cases the cause of fatigue behaviorhas to be minimized or eliminated. Wind induced vibration of members can be prevented by proper design or by theaddition of damping. Vibration of structures caused by unbalanced forces from machinery, can be minimized by theuse of properly designed vibration mounts and proper design of the structure (natural frequency less than 1/2 ormore than 2 times the exciting frequency). Design for fatigue would not be possible without the control of the forcesin these cases.
Fatigue resistant joints should always be employed. Gradual changes in geometry of components and joints andavoiding areas of concentrated load and stress are two of many good design practices. Because most fatigue failuresinitiate at areas of localized high stress, particularly joints, these details need to be designed carefully. Environment,temperature, air quality and corrosive substances can influence fatigue strength in some cases.
The use of S-N curves is the most common but only one of perhaps four methods of designing for fatigue. Theothers are hot spot, strain-life, fracture mechanics and good practice design methods. All of the techniques havemerit and can be applied to most types of structures(8).
Components under constant amplitude loading generally have a fatigue endurance limit, a stress below whichfailure should not occur. Components of variable amplitude loading may not exhibit an endurance limit, because acrack can be initiated by the higher stress cycles of the spectrum and propagate at stresses below the constantamplitude endurance limit. Miner's rule is generally used for spectrum loading with the straight-line portion of thefatigue curves (assuming no endurance limit)(8). There also may not be an endurance limit in mechanicalconnections that fail by fretting. Tests may be required to evaluate the possibility of fretting failures.
The stress amplitudes in a spectrum usually are difficult to determine unless a cycle-counting procedure isemployed. Of the several procedures that are available(8), the rainflow counting method is commonly used.

C-1
APPENDIX CExcerpt from
EuroCode 9: Design of Aluminum Structures –Part 2: Structures Susceptible to FatigueThe European Committee for Standardization
1.0 Copyright Release and Limitations on Liability
The information contained in this appendix is reprinted from the EuroCode 9: Design ofAluminum Structures –Part 2: Structures Susceptible to Fatigue by the European Committee forStandardization. The Ship Structure Committee has obtained the written permission of theEuropean Committee for Standardization to use this information in accordance with the guidancefor preparation of SSC reports. Users of the information contained in this appendix assume allresponsibilities and liabilities associated with its use unless other contractual arrangements aremade directly with the European Committee for Standardization.
2.0 Introduction
The information in the EuroCode 9 presents unique guidance for the fatigue and damagetolerance analyses of aluminum weldments. Similar to the other two non-maritime codesdiscussed in this report, the primary focus of the EuroCode 9 is civil engineering applications.However, unlike any of the other codes, EuroCode 9 presents guidance for the use of theirfatigue and S/N curves for details in various environments other then air. Included in these otherenvironments are marine and immersion in water and seawater. This portion of the EuroCode 9is included in this appendix.
The EuroCode 9 is also the only design code with any information relating to the damagetolerance analysis of cracked details. Information is presented on crack growth rate with avariety of FCGR curves for various alloys and R ratios although all information is developed forthe in-air environment.
The unique nature of the information presented in EuroCode 9 and discussion withProfessor Kosteas strongly suggest that further investigation of the aluminum databasedeveloped to support this code needs to be investigated before further research is conducted forsubsequent to this task.
Designers considering the use of the information contained in this code should contactCEN at +32 2 550 08 11 and obtain a complete copy of the EuroCode 9 standard.

C-2

C-3

C-4

C-5

C-6

C-7

C-8

C-9

C-10

C-11

C-12

C-13

C-14

C-15

C-16

C-17

C-18

C-19

C-20

C-21

C-22

C-23

C-24

C-25

C-26

C-27

C-28

C-29

C-30

C-31

C-32
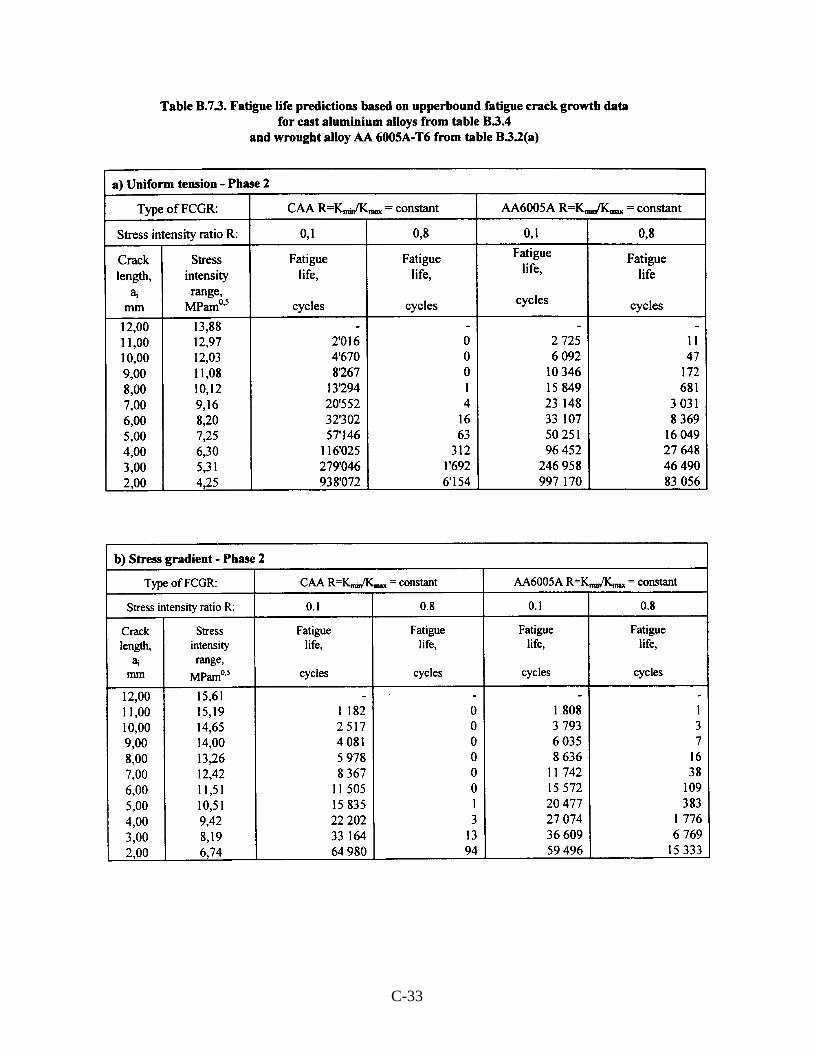
C-33

C-34

C-35

C-36

Association of American RailroadsTechnical Services Division—Mechanical Section
Manual of Standards and Recommended Practices
D-16/1/88
APPENDIX DExcerpts from
Manual of Standards and Recommended Practices Section C – Part IIAssociation of American Railroads
1.0 Copyright Release and Limitations on Liability
The information contained in this appendix is reprinted from the Manual of Standardsand Recommended Practices Section C – Part II published by the Association of AmericanRailroads. The Ship Structure Committee has obtained the written permission of the Associationof American Railroads to use this information in accordance with the guidance for preparation ofSSC reports. Users of the information contained in this appendix assume all responsibilities andliabilities associated with its use unless other contractual arrangements are made directly with theAssociation of American Railroads.
2.0 Introduction
The fatigue design information is contained within Chapter VII of the design codepublished by the AAR. In addition to the information contained in this appendix, the AARdesign manual also contains information for the fatigue design of steel details. This is similar tothe information for the aluminum details. Unlike any of the other design codes investigated forthis report, the AAR design manual also contains a tremendous amount of environmental loadingdata for various types of railroad cars. Contained in nearly 200 pages, this provides the railroaddesigner with consistent data for the development of details subjected to fatigue.

Association of American RailroadsTechnical Services Division—Mechanical Section
Manual of Standards and Recommended Practices
D-26/1/88
Chapter VIIFATIGUE DESIGN OF NEW FREIGHT CARS
SECTION 7.1 ADMINISTRATIVE PROVISIONS
7.1.1. PURPOSE AND SCOPE7.1.1.1. GENERAL
This interim specification is a guideline for fatigue analysis of freight cars and is notintended to supersede or make obsolete any existing AAR design requirement. In general,existing, specifications are concerned with static and high impact loads. However, when amember or connection is subjected to fluctuating stresses, failure can occur under stressesconsiderably lower than those that would cause failure under steady conditions. Thisguideline gives the designer or analyst a method for estimating the fatigue life of a freightcar or component when subjected to fluctuating stresses. The accuracy of fatigue analysis ishowever not as high as that of static stress analysis. While fatigue analysis methods give anindication of the adequacy of the design from a fatigue viewpoint, the actual life estimatesmust be utilized with caution.
7.1.1.2. RELATED SPECIFICATIONS AND PUBLICATIONSPortions of the following specification and publications form a part of this guideline
where applicable:1. ASTM Standards2. AWS welding symbols3. AAR Specification for Tank Cars
7.1.2. ANALYSIS REQUIREMENTS7.1.2.1. MILEAGE CRITERIA FOR ANALYSIS
The purpose of this fatigue design specification is to provide assurance that a proposedcar design that is not similar to an approved design in service, or has modifications notcontemplated in the original design, will meet the high utilization or full-interchangemileage criteria specified below. In addition to the basic strength requirements formodifications or "new appurtenances" discussed in Section 1.2, a demonstration ofsatisfactory fatigue strength or life relative to an approved design, detail or modificationalready in satisfactory service is required. Generally, the demonstration of basic strength ofappurtenances or structural modifications under static and/or impact loading alone is notsufficient.
The following mileage criteria are to be used to determine the acceptability of fatiguelife estimates:
Unit train and high utilization cars—3,000,000 milesGeneral interchange—1,000,000 miles

Association of American RailroadsTechnical Services Division—Mechanical Section
Manual of Standards and Recommended Practices
D-36/1/88
7.1.2.2. CAR TYPES REQUIRING FATIGUE ANALYSISThis specification will ultimately apply to all car types. In order to perform the analysis,
it is necessary to have relevant environmental data. If these data are not available, then afatigue review or analysis based on a comparison to a similar car type which hasdemonstrated satisfactory field performance in similar service is acceptable. For a radicallynew car design, it must be demonstrated that fatigue life has been considered. Applicationof fatigue analysis to the following car types is mandatory: 70 ton boxcars, 100 ton specialservice high side gondola cars, 100 ton open top hopper cars and 100 ton tank cars.
7.1.2.3. COMPONENTS REQUIRING FATIGUE ANALYSISBased on a survey of fatigue failures, the following components and their attachments
require fatigue analysis. This does not preclude fatigue analyses of other possible criticalcomponents in new designs.1. Bolsters2. Center sills and stub center sills3. Buff and draft attachments and supports4. Box car doorway area5. Side sills on center sill-less cars6. Covered hopper car roofs7. Covered hopper car interior partitions8. Automobile rack car side sills9. Flat car trailer hitch supports
7.1.3. ANALYSIS METHODSThe fatigue analysis methods used in the guideline are not considered the only methods
available. Many other methods have been proposed, but only those generally accepted andproven over a wide range of test cases will be accepted in place of these methods. Thosewishing to use methods other than these must be able to verify the methods' generalacceptance in the field of fatigue analysis.

Association of American RailroadsTechnical Services Division—Mechanical Section
Manual of Standards and Recommended Practices
D-46/1/88
7.1.4. GLOSSARY OF TERMS
α — Fraction of the total number of cycles applied at given stress levels Smax i and Smin i.
β — Total number of spectrum cycles per mile.
b — Fatigue limit for stress ratio R = o; The y-axis intercept on modified Goodman diagramcurve.
k — Absolute value of the slope of the S-N curve.
m — Slope of the modified Goodman diagram curve.
N' — Number of cycles applied at a given level of stress.
Ne — Number of cycles to produce failure at a given level of stress.
N — Number of cycles which produces failure at a stress level of Se.
NT — Fatigue life (total number of cycles to failure) under a given spectrum loading.
N'i — Number of cycles applied at each level of Smax i and Smin i.
Ni — Number of cycles to produce failure at each level of Smax i and Smin i.
R — Stress ratio, Smin/Smax.
Se — Fatigue limit or stress which produces failure in Ne cycles (Ne assumed 2 x 10⁶ cyclesfor steel).
Si — Fatigue limit computed for failure at Ni cycles.
Smax — Maximum or highest algebraic applied stress.
Smin — Minimum or lowest algebraic applied stress.
Sr — Range of stress. The algebraic difference between the maximum and minimum stress inone cycle, that is, Sr = Smax – Smin
Ki — Theoretical stress concentration factor.
Kf — Fatigue notch factor.

Association of American RailroadsTechnical Services Division—Mechanical Section
Manual of Standards and Recommended Practices
D-56/1/88
THIS PAGE LEFT BLANK INTENTIONALLY

Association of American RailroadsTechnical Services Division—Mechanical Section
Manual of Standards and Recommended Practices
D-66/1/88
SECTION 7.2 FATIGUE ANALYSIS METHODS
7.2.1. GENERALThe methodologies presented in this section provide two generally acceptable
approaches to fatigue analysis. The preferable of the two is to use nominal stresses and anapplicable member detail. One shortcoming of this approach is the limited number ofdetails available. However, the selection of details should be broad enough to allow theiruse to be expanded for analysis of similar but not exactly matching details. Great care willbe required in the selection of the "closest" detail. When doubt exists among severalchoices, the more conservative properties should be used or the second approach should betaken.
The second approach should be used when a member detail cannot be found to matcheven approximately the detail under analysis. This method involves determining the localstresses or strains thru the use of concentration factors in combination with basic materialfatigue properties. Since great care is required in establishing notch factors and materialproperties in the weld region, this method is not recommended for use with welds.
7.2.2. ANALYTICAL METHOD USING APPLICABLE FATIGUE PROPERTIES OFMEMBERS AND DETAILS
7.2.2.1. ASSUMPTIONS1. Miners linear cumulative damage rule using nominal stresses and experimental data
applies.2. Nominal stresses are below the yield strength of the material.3. Nominal stresses are accurately determined analytically or experimentally.4. Detail being analyzed corresponds realistically to the detail chosen from Section 7.4.5. S-N curve is a straight line on log-log paper from 100,000 cycles to 2,000,000 cycles
for steels and 100,000 cycles to 10,000,000 cycles for aluminum alloys, with a slopeindependent of the stress ratio, R.
6. Fatigue limit, Se, for steels is reached at 2,000,000 cycles, and for aluminum alloys at10,000,000 cycles.
7. Order of load application for environmental spectrums will not affect fatigue damageaccumulation.
8. The modified Goodman diagrams have constant slope and are truncated at the yieldpoint of the material.
9. If the minimum stress has greater absolute value than the maximum stress for a givencycle, the cycle is considered as a complete reversal (R = –1.0) cycle with a maximumstress equal to ½ the range of stress. For example, if the actual maximum stress of acycle is –5,000 psi and the minimum stress is –20,000 psi, then the maximum stresswill be taken as [–5,000 – (–20,000)] ÷ 2 = 7,500 psi.
10. The values of the stress ratio, R = Smin/Smax vary from –1.0 to +1.0 inclusive.11. No previous fatigue damage has occurred in the detail being analyzed.12. Failure in fatigue has occurred when a crack is detected by the unaided eye.

Association of American RailroadsTechnical Services Division—Mechanical Section
Manual of Standards and Recommended Practices
D-76/1/88
7.2.2.2. DERIVATION OF EQUATIONSAccording to the linear cumulative damage hypothesis, every time a component is
stressed to a given level above the fatigue limit for the detail at the applied stress ratio, aknown amount of damage is incurred. Consequently, it is assumed that failure from fatiguewill result when the summation of the "increments of damage" equals unity. If N'represents the number of cycles applied at some damaging stress level and N represents thenumber of cycles at that same stress level which would result in failure, then failure occurswhen:
′=
NN
i
i1 ..........................................................................................................(1)
If NT represents the total number of cycles to failure of a component under a spectrum ofloads, it is convenient to denote the fraction of the total number of cycles applied at eachstress level by a. Therefore Ni = αI NT and equation (1) may be rewritten:
NNT
i
i
α= 1....…...............................................................................................(2)
A relationship for the fatigue life under spectrum loading may now be expressed as:
N
N
Ti
i
=1α .……….........................................................................................(3)
where NT is the total number of spectrum cycles and not just cycles at damage producingstress levels. In actual calculations, however, only the cycles at damage producing levels(above the fatigue limit) are included in the summation of equation (3). Cycles at stresslevels below the fatigue limit are not included since they are assumed to do no damage.
The fatigue limit stresses shown in the fatigue properties table of Section 7.4 can beused to determine the damaging stress levels. From the stress spectrums derived from theload spectrums of Section 7.3, the fraction of total loaded cycles, α, falling into any rangecan be obtained for use in equation (3).
The fatigue properties of members and details presented in Section 7.4 of thisspecification are used to determine the fatigue limit, Se (assumed to occur at 2,000,000cycles), for a specific design detail and stress ratio, R. This fatigue limit represents themaximum stress, Smax, which may be introduced to this component an infinite number oftimes at that stress ratio without producing a fatigue failure. The application of maximumstresses of any greater value would, if applied often enough, eventually result in the fatiguefailure of the component. This maximum stress is the algebraic total of the static stress andthe dynamic stress. The fatigue properties presented were developed for average qualityworkmanship and were obtained from available literature.
It is noted that the fatigue property tables are all based on infinite life, or fatigue limitstresses. They cannot be used directly to indicate the number of cycles at some higher stresslevel that would produce a fatigue failure. Experimental evidence has been collected whichindicates that the classical S-N curve is essentially a straight line on log-log paper between100,000 cycles and the number of cycles corresponding to the fatigue limit for the materialunder study (2 x 10⁶ cycles for steel). By knowing the slope of this curve, it is possible topredict the life Ni (number of cycles to failure) of a component subjected to a stress Siexceeding the fatigue limit. Slopes of curves are presented as 'k' values in Section 7.4 of thisspecification. An equation for life, N„ may be derived from a S-N diagram as follows:
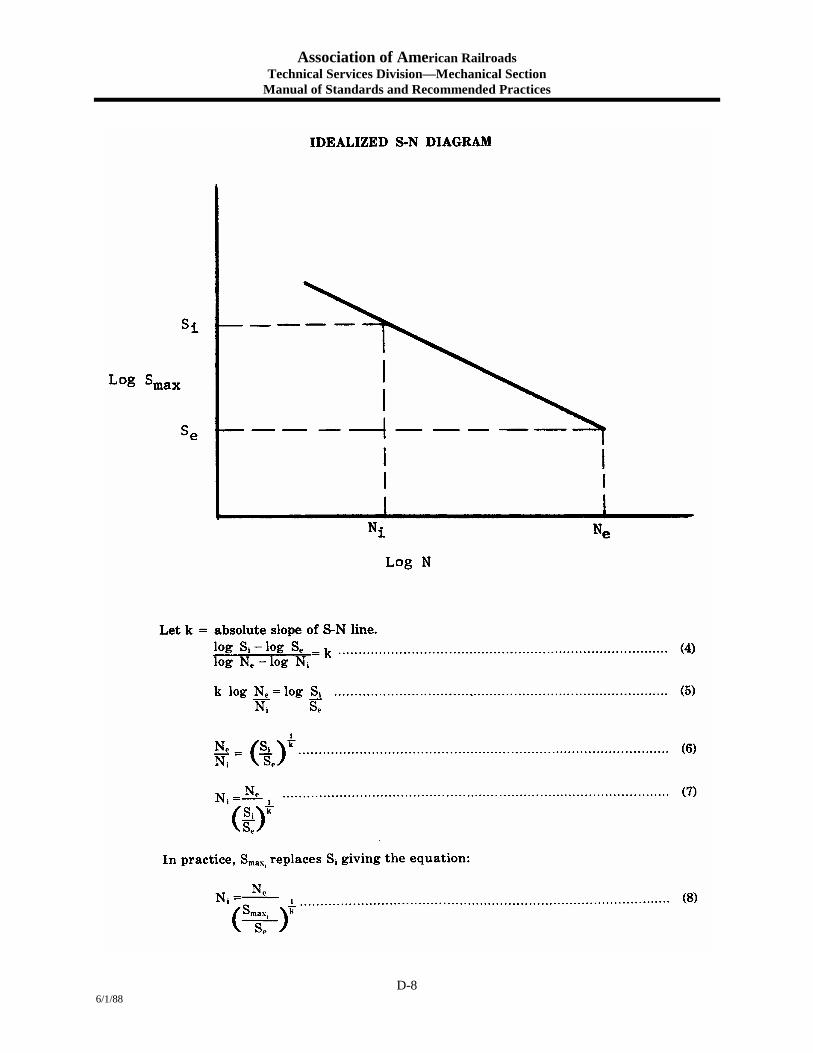
Association of American RailroadsTechnical Services Division—Mechanical Section
Manual of Standards and Recommended Practices
D-86/1/88

Association of American RailroadsTechnical Services Division—Mechanical Section
Manual of Standards and Recommended Practices
D-96/1/88

Association of American RailroadsTechnical Services Division—Mechanical Section
Manual of Standards and Recommended Practices
D-106/1/88
Finally, to determine the life of a component:
Life (in miles) =N T
β
where NT is total cycles to failure,β is total spectrum cycles per mile.
7.2.2.3. APPLIED STRESSESLocations of likely crack initiation sites are shown for each detail in the diagrams of
Section 7.4. In the case of welded connections, the stresses required are nominal stresseswithout consideration of stress concentrations of the detail. The nominal stresses such asthose based on simple beam formulas serve as indices of load intensity. They permit use ofmodified Goodman properties derived from fatigue tests of applicable structural detailswhich are assumed to include the same local state of stress and stress concentrations at thefatigue critical locations. This approach was chosen since the actual stresses at theconcentrations associated with weldments are extremely difficult if not impossible toaccurately determine either analytically or experimentally.
For analysis of members which do not include welds (and associated concentrations),the maximum stress levels must be determined analytically or experimentally and modifiedGoodman properties for the basic material used. Care must be used here to include theeffect of all stress concentrations. Even with the nominal stress approach, there aresituations in which a simple uniaxial stress concept is inadequate for the prediction of afatigue life based on the applicable modified Goodman diagram. In such cases, usuallyinvolving combined loadings that produce biaxial stress states with significant shearloading and reversals, a fatigue equivalent, uniaxial stress cycle should be derived. Forbiaxial stress states in which the signs of the principal stresses are the same, the stresshaving the larger absolute value and/or range can be used as the fatigue equivalent stress.When the signs of the principal stresses are opposite, a fatigue equivalent stress that has avalue equal to the sum of the magnitudes of the principal stresses can be used as anapproximation.
7.2.2.4. ENVIRONMENTAL LOAD SPECTRASeveral environmental load spectra are given in Section 7.3 for specific car types. The
spectra are to be used to derive an appropriate stress spectrum for use in a fatigue analysis.Spectra are provided for various force components acting on the car body structure.Considerable emphasis must be placed on an accurate conversion of the load spectra intostress spectra. The stress analysis, whether analytical or experimental, is the foundationupon which the fatigue analysis is based. Since the fatigue analysis predictions are notlinear relative to the stress level inputs, errors in the stress analysis can make any methodof fatigue life prediction grossly inaccurate.
Two or more force component spectra may act sequentially or simultaneously toproduce fatigue damage at the critical location. Completely accurate treatment of suchcombined spectra situations is not possible in many circumstances because of the usualuncertainty in force component time phase relationship and local stress directional effects,etc. Nevertheless, some guidelines may be obtained by analogy from the relationship forfatigue life given in equation (3) for a single spectrum loading.

Association of American RailroadsTechnical Services Division—Mechanical Section
Manual of Standards and Recommended Practices
D-116/1/88
The situation is most straightforward for the case of sequential histories. In most cases:
Life =+ +
11 1
Life 1 Life 2 ...........
where life 1, life 2, etc., are lives under the different force component spectra.If analysis requires a spectrum of a car type that is not available, a "best" estimate may
be made by choosing a spectrum of a car type which would exhibit similar dynamiccharacteristics. As examples, comparisons could be made of the car body bending stiffness,height of center of gravity, torsional stiffness, types of draft gear or cushioning, etc.
Users are cautioned that selecting a "worst case" or most conservative load spectrummay result in completely unrealistic life estimates.
Dimensional, structural, and suspension characteristics of specific cars for whichenvironmental load spectra are available are presented in Section 7.3.
A complete evaluation is required of factors which affect the stress spectrum for theanalysis being made. Only in the most simple instances could a single load spectrum beconverted directly to a representative stress spectrum. In most cases, the effect of the emptyto loaded car miles ratio should be considered in order to accurately describe the life of afreight car. Additional factors which could modify the basic spectrum are items of varyingload distribution. As an example, the distribution of trailer length carried may affect theactual stress cycles of an area being analyzed on a piggyback flat car.
Sections 4.1.3.1., 4.1.3.2., 4.1.3.2.1., 4.1.3.2.2. and 4.1.3.3. show distributions of loadingto be used in the static stress analysis of the car body. They represent worst cases and maybe too conservative for fatigue analysis. Fatigue analysis requires typical loadingdistributions.
The three-dimensional spectrum could be simply described as an elaboration of theconventional histogram. It is put in the form of a modified Goodman diagram using similarcoordinates; that is, maximum load versus minimum load. Thus, for each maximum-minimum load combination there is entered the percent occurrences (the third dimension)that the cycles are encountered in the environment. These percent occurrence distributionsare determined from actual environmental test records reduced to the three dimensionalformat. Reduction of the test data (basically cycle counting) could be done using one ofmany methods; however, the Rainflow counting method is currently considered the bestavailable and should be used in obtaining load spectrum information.NOTE: A description of the Rainflow counting method with application to freight car
fatigue life analysis is provided in "User's Guide to Rainflow Counting Program,"AAR report R-274, July 1977.
The load spectra presented in Section 7.3 are folded to provide a condensed format.Folding of these spectra refers to the operation of transferring the counts of occurrencesinto the upper left diagonal portion of the spectrum from the corresponding location in thelower right diagonal portion. This action is taken since it is considered that no difference indamage is caused by a cycle that starts at a negative value and goes positive versus a cycle(of equal maximum-minimum values) that starts at a positive value and goes negative.While this may not be true for very high stress values, this assumption is made for long-lifeprediction analysis.

Association of American RailroadsTechnical Services Division—Mechanical Section
Manual of Standards and Recommended Practices
D-126/1/88
Use of these folded spectra requires the reading of the percent occurrences for eachincrement or box and determining the coordinates (max and min) of that box. Since eachincrement relates to two maximum values and two minimum values, a conservativeapproach is used to choose a single max and min value representing each increment. Themaximum value is chosen as the value which provides the larger maximum stress, Smax.The minimum value is chosen to provide the greater range between Smax and Smin.
In addition to the selection of spectra based on dynamic characteristics, the empty-loaded ratios given in Section 7.3 should be used when applicable (i.e., vertical loadspectra). These ratios should be used as listed unless more specific information is availablefor the car being analyzed.
7.2.2.5. MATERIAL PROPERTIES FOR FATIGUE ANALYSISThe modified Goodman diagram or MGD given in Section 7.2.2.2. is a convenient
means of indicating the allowable stresses for dynamic stress cycles of various mean stresslevels. The horizontal scale shows the minimum stress for the cycle and the vertical scaleshows the maximum stress (positive or tensile stress). A vertical line is drawn through zeroon the horizontal scale representing all points for zero-to-tension cycles; i.e., the minimumstress is zero with any selected maximum tensile stress. This line is denoted as the R = 0line, where R is the stress ratio R = Smin/Smax. Cycles to the right of the R = 0 line will betension-to-tension cycles while to the left will be compression-to-tension cycles. The lineto the right inclined at 45 degrees is the R = +1 line representing a static stress condition. Asimilar line to the left is the R = –1 line representing complete stress reversal.
The modified Goodman diagrams constants are presented in tabular form in Section 7.4.The tabular data are conservative estimates which are not rigidly based on statisticalanalysis of the test data. The tabulated values have been factored from the mean values.This was necessary due to significant differences in sample sizes for various details andcorresponding ranges in scatter of data. A factor of 0.70 was generally used to obtainrepresentative MGD y-axis-intercept values at 2 x 10⁶ cycles for steels and 10,000,000cycles for aluminum, based on the mean fatigue strengths. These values correspond to avalue approximately 2 standard deviations below the mean fatigue strength. The interceptvalues at 10 x 106 cycles were generally obtained by multiplying the 2 x 10⁶ cycles valuesby a factor of 0.85. This corresponds to the reduction factor that would be obtained for anS-N slope of 0.20. Thus, the tabulated values make use of engineering judgements toprovide a reasonable and compatible set of data.
If the data are insufficient to determine the fatigue strength of a member or detail inaluminum and the fatigue strength is available for the member or detail in steel, then it canbe assumed that the aluminum fatigue strength (MGD y-axis-intercept) is about equal toone-third (1/3) of the steel fatigue strength and the MGD has the same S-N slope, k, andthe same MGD slope, M, with verification or adjustment of these strengths by comparisonwith other design codes. The one-third factor assumes that fatigue life consists of fatiguecrack propagation only, which is a function of the modulus of elasticity.
The use of the modified Goodman diagram details is desirable, since this data representstests of an actual construction; however, the test samples do not necessarily represent theactual connections as built in a freight car. While the details account for concentrationsassociated with average quality welding, influences such as residual stresses, weldingvariation, temperature and corrosion are not considered. When choosing a detail toapproximate a similar detail for analysis, care must be used to consider the geometry of themembers and the resulting concentrations. A convenient approach is to compare the stressflow path through the detail being analyzed and the available details.

Association of American RailroadsTechnical Services Division—Mechanical Section
Manual of Standards and Recommended Practices
D-136/1/88
7.2.2.6. ANALYSIS OUTLINE1. Determine nominal stress-load relationship for all applicable load inputs.2. Select an appropriate load spectrum.3. Select appropriate modified Goodman diagram constants for the detail to be
analyzed.4. Determine whether or not stress levels exceed the fatigue limit (check all values of
R).5. When the maximum stress levels exceed the fatigue limit and infinite life is not
predicted, determine which portion of spectrum exceeds Se.
6. Tabulate α i
iNincluding all factors such as empty-loaded ratio and multiple load
spectra.7. Determine β for the chosen spectrum and calculate the life = NT/β in miles.
7.2.3. ANALYTICAL METHOD USING MAXIMUM STRESS7.2.3.1. ASSUMPTIONS
The same assumptions (7.2.2.1) made in the nominal stress method apply.7.2.3.2. ANALYSIS OUTLINE
1. Determine nominal stress-load relationship for all applicable load inputs.2. Obtain maximum stresses by multiplying nominal stresses by appropriate fatigue
notch factor, Kf. If the value of Kf cannot be obtained, then use Kt the theoretical stressconcentration factor. The use of Kt will always result in a conservative analysis for ductilesteels.
NOTE: Kf and Kt can be obtained from textbooks such as "Stress Concentration DesignFactors", R. E. Peterson, Wiley and Sons, 1974 or "Stress and Strength of ManufacturedParts", Lipson, Noll and Clock, McGraw-Hill Company, 1950.3. Use fatigue properties for base material Section 7.4.1.1.1.4. Calculate fatigue life from formulas previously developed for nominal stress method.
7.2.4. MANUAL CALCULATION EXAMPLE7.2.4.1. MANUAL CALCULATION—ANALYTICAL METHOD USING APPLICABLE
FATIGUE PROPERTIES OF MEMBERS AND DETAILSThe following fatigue calculation is based on single spectrum loading. The member
analyzed is assumed to be part of a body bolster for a 100 ton cushioned underframe autoparts box car. Since the detail being analyzed is a beam reinforced by a partial cover plate,the design stresses will be the nominal stresses at the end of the cover plate and not the truemaximum stresses that would be used if we were doing a basic material analysis. Thenominal maximum and minimum stresses developed are fictitious and are used only forpurposes of illustration. All calculations are made by "long hand"; however, the computingtime required can be considerably reduced by use of a computer.
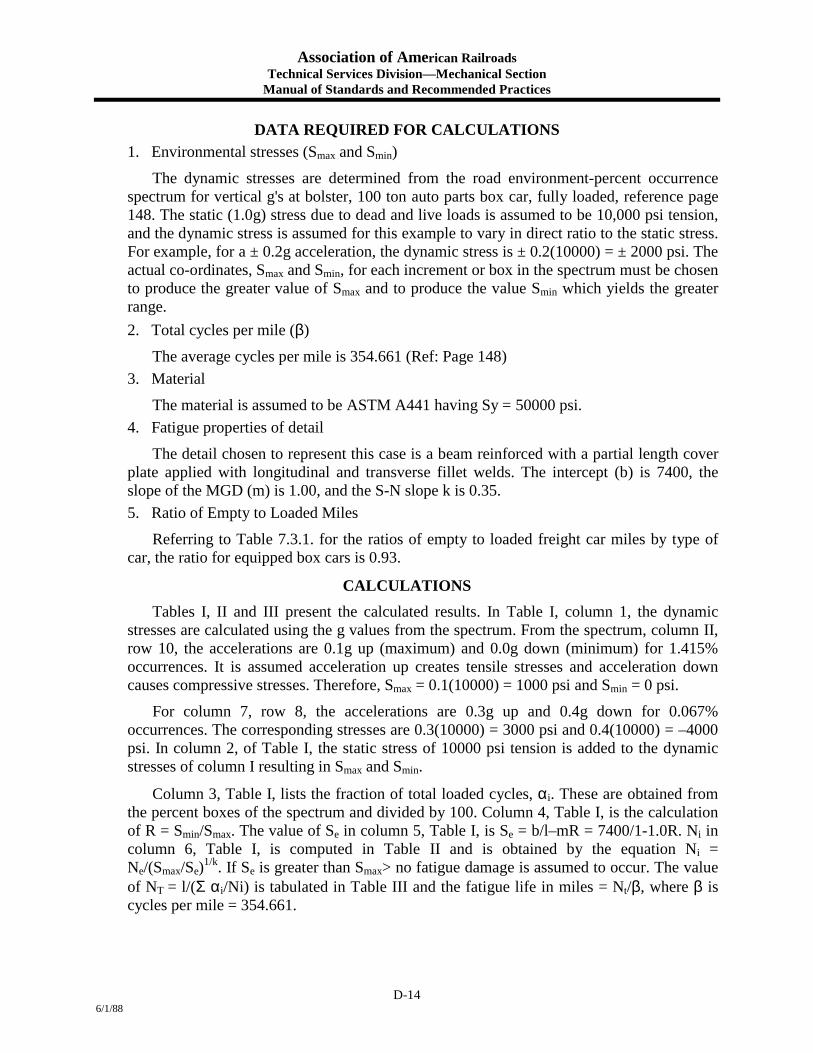
Association of American RailroadsTechnical Services Division—Mechanical Section
Manual of Standards and Recommended Practices
D-146/1/88
DATA REQUIRED FOR CALCULATIONS1. Environmental stresses (Smax and Smin)
The dynamic stresses are determined from the road environment-percent occurrencespectrum for vertical g's at bolster, 100 ton auto parts box car, fully loaded, reference page148. The static (1.0g) stress due to dead and live loads is assumed to be 10,000 psi tension,and the dynamic stress is assumed for this example to vary in direct ratio to the static stress.For example, for a ± 0.2g acceleration, the dynamic stress is ± 0.2(10000) = ± 2000 psi. Theactual co-ordinates, Smax and Smin, for each increment or box in the spectrum must be chosento produce the greater value of Smax and to produce the value Smin which yields the greaterrange.2. Total cycles per mile (β)
The average cycles per mile is 354.661 (Ref: Page 148)3. Material
The material is assumed to be ASTM A441 having Sy = 50000 psi.4. Fatigue properties of detail
The detail chosen to represent this case is a beam reinforced with a partial length coverplate applied with longitudinal and transverse fillet welds. The intercept (b) is 7400, theslope of the MGD (m) is 1.00, and the S-N slope k is 0.35.5. Ratio of Empty to Loaded Miles
Referring to Table 7.3.1. for the ratios of empty to loaded freight car miles by type ofcar, the ratio for equipped box cars is 0.93.
CALCULATIONSTables I, II and III present the calculated results. In Table I, column 1, the dynamic
stresses are calculated using the g values from the spectrum. From the spectrum, column II,row 10, the accelerations are 0.1g up (maximum) and 0.0g down (minimum) for 1.415%occurrences. It is assumed acceleration up creates tensile stresses and acceleration downcauses compressive stresses. Therefore, Smax = 0.1(10000) = 1000 psi and Smin = 0 psi.
For column 7, row 8, the accelerations are 0.3g up and 0.4g down for 0.067%occurrences. The corresponding stresses are 0.3(10000) = 3000 psi and 0.4(10000) = –4000psi. In column 2, of Table I, the static stress of 10000 psi tension is added to the dynamicstresses of column I resulting in Smax and Smin.
Column 3, Table I, lists the fraction of total loaded cycles, αi. These are obtained fromthe percent boxes of the spectrum and divided by 100. Column 4, Table I, is the calculationof R = Smin/Smax. The value of Se in column 5, Table I, is Se = b/l–mR = 7400/1-1.0R. Ni incolumn 6, Table I, is computed in Table II and is obtained by the equation Ni =Ne/(Smax/Se)1/k. If Se is greater than Smax> no fatigue damage is assumed to occur. The valueof NT = l/(Σ αi/Ni) is tabulated in Table III and the fatigue life in miles = Nt/β, where β iscycles per mile = 354.661.

Association of American RailroadsTechnical Services Division—Mechanical Section
Manual of Standards and Recommended Practices
D-156/1/88

Association of American RailroadsTechnical Services Division—Mechanical Section
Manual of Standards and Recommended Practices
D-166/1/88

Association of American RailroadsTechnical Services Division—Mechanical Section
Manual of Standards and Recommended Practices
D-176/1/88

Association of American RailroadsTechnical Services Division—Mechanical Section
Manual of Standards and Recommended Practices
D-186/1/88
EFFECT OF EMPTY TO LOADED RATIO:As stated for this example:
empty mileageeageloaded mil
= 0 98.
or empty mileage = 0.98 loaded mileageor total mileage = 1.98 loaded mileage
1. Recalculate life for loaded portion of usage as:
LifeN
LDT
LD=
ββ where = no. of loaded occurrences per mile.LD
β βLDloaded mil
= ×eage
total mileage
For this example LDβ = = ×354 6611
198354 661 0505.
..
βLD = 179122. loaded cycles per mile
2. Calculate empty car stresses:
In the example, empty car stresses are obtained by ratio of car weights,
empty car stress = loaded car stress x
In this example, S = SEMP LD ×90 000240 000
,,
SEMP = .375 SLD
3. Referring to Table I, and applying this reduction factor to SMAX and SMIN, all values arebelow the endurance limits, Si, and therefore the empty car cycles produce no damage.
4. Had the empty car stresses exceeded Se, a summation would have to be done to findLifeEMPTY and then combined as independent spectra to calculate total life as shown inSection 7.2.4.2.
5. Calculate total life (loaded and empty):Total Life = 1.98 Loaded Life
= 3,869,000 x 1.98= 7,661,000 miles
car body wt.max. wt. on railsminus truck weight

Association of A
merican R
ailroadsTechnical Services D
ivision—M
echanical SectionM
anual of Standards and Recom
mended Practices
D-19
6/1/88

Association of American RailroadsTechnical Services Division—Mechanical Section
Manual of Standards and Recommended Practices
D-206/1/88
7.2.4.2. MANUAL CALCULATION—MAXIMUM STRESS METHODThe following fatigue calculations illustrate the maximum stress method of determining
fatigue life. The member analyzed is assumed to be a center sill of a covered hoppersubjected to a single spectrum loading.
DATA REQUIRED FOR CALCULATIONS1. Environmental Stress (Smax and Smin)
The static stress for this example is assumed to be zero. The dynamic stresses aredetermined from the road environment percent occurrence spectrum for longitudinal couplerforce—100 ton hopper car, reference page 152. The stresses are assumed to apply for bothempty and loaded cars. The nominal stress for a 100,000 pound draft coupler force isassumed to be 9000 psi and for a 100,000 pound buff force is –9000 psi. At the location ofthe above nominal stresses in the center sill, a sharp groove with a very small radius exists. Itis assumed this notch creates a fatigue notch factor K of 3.0 and is similar to the detail shownin chart 77, page 135; Lipson, Noll and Clock; "Stress and Strength of Manufactured Parts";McGraw-Hill; 1950.2. Total Cycles per Mile ()3)
The average cycles per mile from the Repos is 105.03.3. Material The material is assumed to be ASTM A242 having Sy = 50000 psi.4. Fatigue Properties
The fatigue properties applicable for this analysis are in Section 7.4, Table I, as-rolledbase material. The intercept is 31000 psi, the slope of the MOD (m) is 0.86 and the S-Nslope, k, is 0.10.
CALCULATIONSTable IV shows the computation to determine the number of cycles to failure, Ni. The
coupler force in column 1 and the fraction of total cycles, αi, are obtained from the loadspectrum. The maximum dynamic stresses in column 2, Table IV, includes a fatigue notchfactor of 3.

Association of A
merican R
ailroadsTechnical Services D
ivision—M
echanical SectionM
anual of Standards and Recom
mended Practices
D-21
6/1/88

Association of American RailroadsTechnical Services Division—Mechanical Section
Manual of Standards and Recommended Practices
D-226/1/88

Association of A
merican R
ailroadsTechnical Services D
ivision—M
echanical SectionM
anual of Standards and Recom
mended Practices
D-23
6/1/88

Association of American RailroadsTechnical Services Division—Mechanical Section
Manual of Standards and Recommended Practices
D-246/1/88

Association of American RailroadsTechnical Services Division—Mechanical Section
Manual of Standards and Recommended Practices
D-256/1/88

Association of American RailroadsTechnical Services Division—Mechanical Section
Manual of Standards and Recommended Practices
D-266/1/88
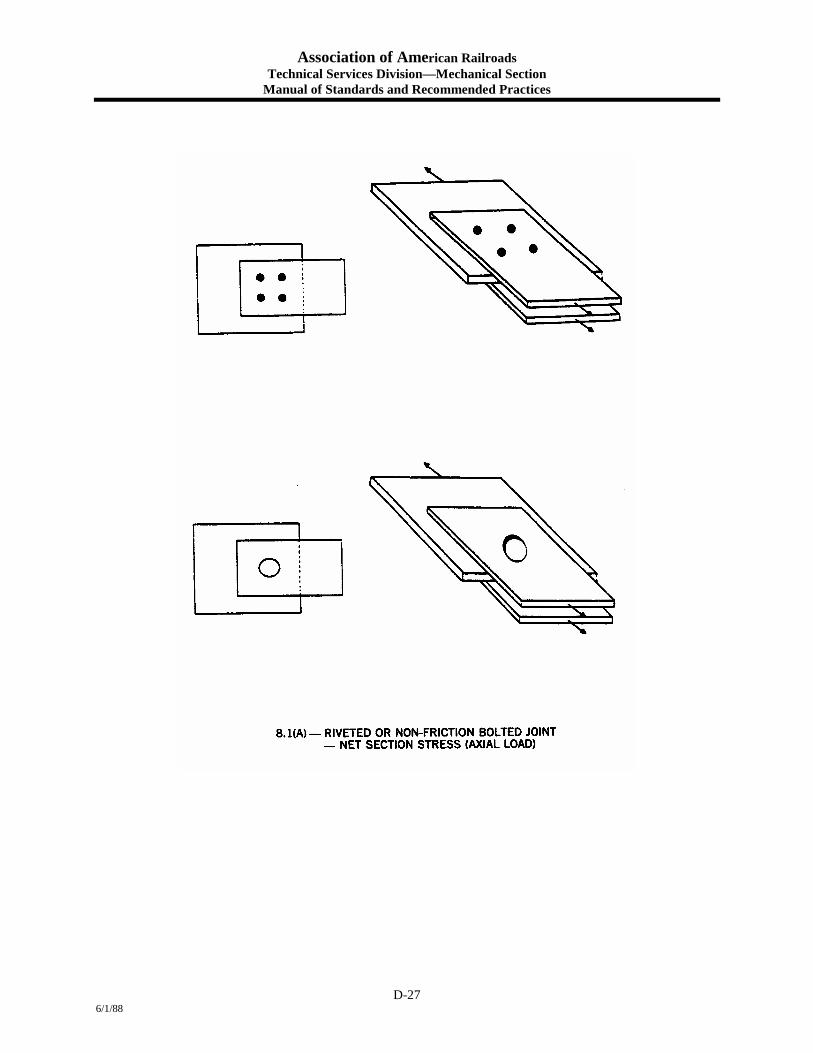
Association of American RailroadsTechnical Services Division—Mechanical Section
Manual of Standards and Recommended Practices
D-276/1/88
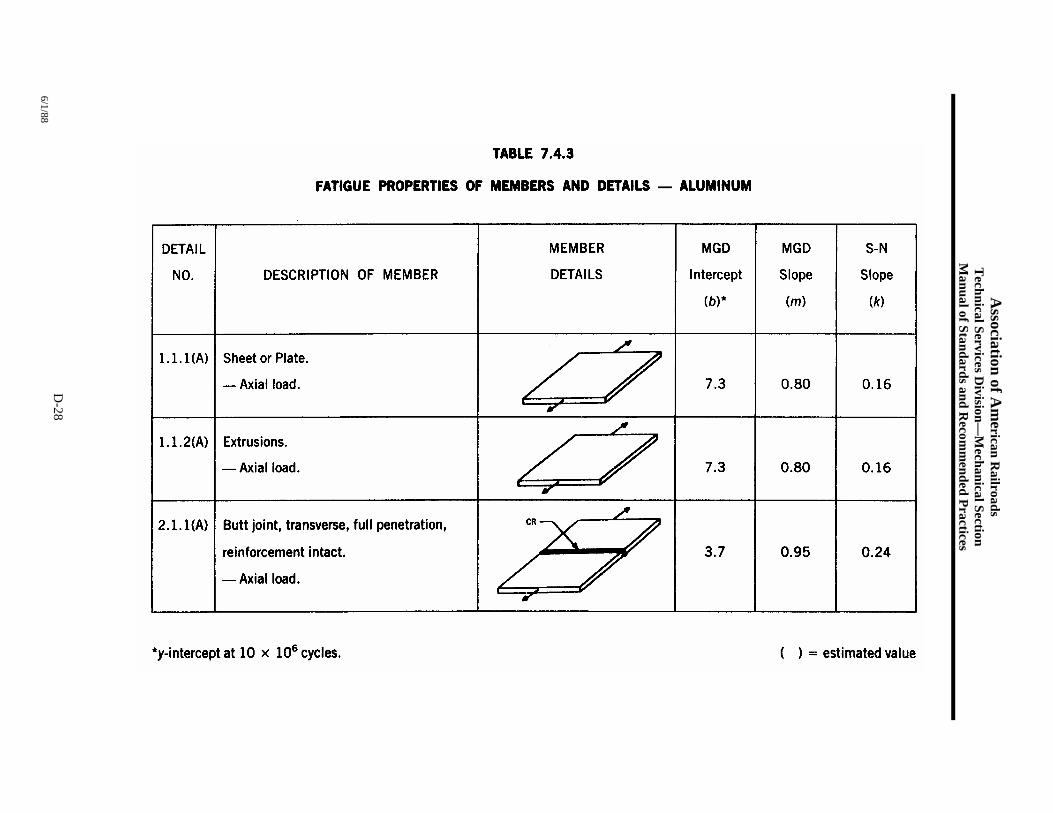
Association of A
merican R
ailroadsTechnical Services D
ivision—M
echanical SectionM
anual of Standards and Recom
mended Practices
D-28
6/1/88

Association of A
merican R
ailroadsTechnical Services D
ivision—M
echanical SectionM
anual of Standards and Recom
mended Practices
D-29
6/1/88

Association of A
merican R
ailroadsTechnical Services D
ivision—M
echanical SectionM
anual of Standards and Recom
mended Practices
D-30
6/1/88

Association of A
merican R
ailroadsTechnical Services D
ivision—M
echanical SectionM
anual of Standards and Recom
mended Practices
D-31
6/1/88

Association of A
merican R
ailroadsTechnical Services D
ivision—M
echanical SectionM
anual of Standards and Recom
mended Practices
D-32
6/1/88

Association of A
merican R
ailroadsTechnical Services D
ivision—M
echanical SectionM
anual of Standards and Recom
mended Practices
D-33
6/1/88

Association of A
merican R
ailroadsTechnical Services D
ivision—M
echanical SectionM
anual of Standards and Recom
mended Practices
D-34
6/1/88

Association of A
merican R
ailroadsTechnical Services D
ivision—M
echanical SectionM
anual of Standards and Recom
mended Practices
D-35
6/1/88

Association of A
merican R
ailroadsTechnical Services D
ivision—M
echanical SectionM
anual of Standards and Recom
mended Practices
D-36
6/1/88

Association of A
merican R
ailroadsTechnical Services D
ivision—M
echanical SectionM
anual of Standards and Recom
mended Practices
D-37
6/1/88

E-1
APPENDIX EAppendix E contains a few S/N diagrams that have been copied from the sources cited
below and in Section 4 of the report. It is recognized that significant information must still begathered before relevant S/N diagrams can be developed for design purposes. The curvespresented in this appendix represent raw data for the series of tests represented by the curves.There is insufficient data to confirm the statistical acceptability of the data and the use of thesecurves needs to incorporate safety factors that consider this condition. For purposes of design, itis recommended that the information in the various codes presented in appendices B, C and D beused until additional data can be gathered for compilation of design curves.
Reference (1) shown below addresses details 20 through 24 in Section 4 of the report andreference (2) addresses details 25 through 28. More information regarding the testing used togenerate these S/N curves is available through these references.
(1) Paauw, A. J., Fredheim, S., and Engh, B., Konstruksjonsdata for dynamisk belastedealuminum sveiseforbindelser (Construction data for dynamic testing of aluminum weldments),SINTEF Report No. STF34 A83042, 1983
(2) Tveiten, B. W., Fatigue Assessment of Welded Aluminum Ship Details, Doctoral Thesis,Department of Marine Structures, Norwegian University of Science and Technology,Trondheim, 1999.

E-2
Figure E-1; Transversely welded plate; Alloy AlMg4.5Mn; R = 0.1;
Figure E-2; Transversely welded plate subjected to both axial tension and 4 pointbending; Alloy AlMgSi1; R-ratio = 0.5;

E-3
Figure E-3; Transversely welded plate; Alloy AlMg4.5Mn; R = 0.1;Error!Reference source not found.
Figure E-4; Transversely welded plate; Alloy AlMg2.5; R-ratio = 0.1;

E-4
Figure E-5; T-Joint connection; Alloy AlMg4.5Mn; R = 0.1;
Figure E-6; T-Joint connection; Alloy AlMg2.5; R = 0.1; g);

E-5
Figure E-7 Transversely welded plate; Alloy AlMgSi1; R = 0.5;
Figure E-8; T-Joint connection; Alloy 5083; R = 0.1;

E-6
Figure E-9; Transversely welded plate with V- connection; Alloy AlMg2.5; R= 0.1;
Figure E-10; Transversally welded plate with V-connection; Alloy AlMg4.5Mn;R = 0.1;

E-7
Figure E-11; T-Joint connection; Alloy AlMg4.5Mn; R = 0.5;
Figure E-12; T-Joint connection; Alloy AlMgSi1; R = 0.5;

E-8
Figure E-13; Cruciform Joint; Alloy AlMg4.5Mn; R = 0.1;
Figure E-14; T-Joint connection; Alloy AlMg4.5Mn; R = 0.5;

E-9
Figure E-15; T-Joint; Alloy AlMgSi1; R = 0.5;
Figure E-16; T- Joint; Alloy AlMgSi1; R = 0.5;

E-10
Figure E-17 Flatbar/bracket (Joint 25) connection and bulb stiffener/webframe connection (Joint 26); Nominal stress range; Alloy 5083; R = 0.44;Tension;
Figure E-18; Flatbar/bracket connection (Joint 25) and thelongitudinal stiffener/web frame connection (Joint 26); Structuralstress range; Alloy 5083; R = 0.44; Tension;

E-11
Figure E-19; Box 1 (Joint 27) and Box 2 (Joint 28); Alloy 5083; R =0.44; Tension;

F-1
APPENDIX FList of Contacts
1.0 Introduction
In order to develop the database and gather the information necessary for the
development and completion of this report it was necessary to speak to individuals and
organizations recognized as authorities in the field. This appendix contains a listing of the
contacts made for this effort. Many of the individuals and organizations were contacted on more
than one occasion. It is not intended that this record reflect a “log-book” of all calls and
contacts, rather an index to be used in conjunction with this report. It is suggested that interested
parties contact any of these references for further information.

F-2
FATIGUE OF ALUMINUM STRUCTURAL WELDMENTS
Organization Individual Date ofcontact
Telephonenumber
Email address Summary of discussion
NAVSEA Alan Manuel 3/25/99 703-602-9402 Recommended calling of T. Montemarano & E. CzyrycaNSWCCD Tom Montemarano 3/25/99 301-227-5071 Recommended various volumes, articles and publications & call E. Duncan.NSWCCD Ernie Czyryca 301-227-5073NAVSES Eric Duncan 3/25/99 215-897-1287 Only performed maintenance on displacement hulls, CG47, FFG7.
Recommend to call C Cheeseman.NAVSES Chris Cheeseman 3/26/99 215-897-7652 Suggested Tech Manual for CG 47 Superstructure Cracking Repair. We agree
that Jim Bourne at NAVSEA may have copy.NAVSEA Jim Bourne 4/1/99 703-602-5959 Will provide Tech Manual for CG47 Superstructure Cracking Repair.NAVSEA Charles Null 3/26/99 703-602-0143 Welds very sensitive to imperfections, inclusions, etc. Need strict definition
for design of details and fabrication controls. Aluminum deckhouse in USNabandoned as much for fatigue & material problems as for survivability.
NSWCCD Jeff Beach 3/26/99 301-227-1742 Referred to same 4 volume set as T Montemarano “Guide for use of AlAlloys in D&C of Naval Vessels.” This is not in public domain and cannotbe referred to in report. Also suggest to call Prof. W. Sanders @ Iowa St.
Retired (Iowa StateUniversity)
Prof. WallaceSanders
3/26/99 515-232-7184 [email protected]
Significant source of information. Will provide CV of experience and willingto help with questions. Worked with AASHTO, Canadian DOT, CraigMenzemer (ALCOA fatigue guru currently @ Univ of Akron), AluminumAssoc. in D.C., Welding Research Council, Work in Europe (ECCS), Prof.Dimitris Kosteas
AluminumAssociation
Peter Pollak 3/26/99 202-862-5124 Recommended ASM Fatigue Data: Light Structural Alloys ASM @ 440-338-5151, Cleveland, OH. All data from Aluminum Assoc pertains to civil engrapps, not marine. Regardless, will pursue Aluminum Design Manual, 1994.
ASM 3/26/99 Investigated “Fatigue Data: Light Structural Alloys” @ www.asm-intl.orgJJMA Joe Koelbel 3/25/99 703-933-6773 Recommended numerous contacts @ CG, NAVSEA, NSWC & papers, etc.JJMA John Hollingsworth 3/26/99 703-933-6733 Recommend PMS 325 personnel and aluminum boat builder personnel.JJMA Dave Little 703-933-6652 Provided contacts @ National Center for Excellence in Metalworking
Technology (NCEMT) & Navy Joining Center (NJC).NSWCCD detNorfolk
Mark Hoggard 4/7/99 757-686-7160 Use existing NAVSEA stress level std’s. Does not have any data for fatigueof aluminum.
AWS Hardy Campbell 4/5/99 800-443-9353 Didn’t think that AWS would have useful information for aluminumweldments in marine environment. Recommended to contact Paul Dickerson.
Retired Paul Dickerson 724-339-9807 Repeated reference to Iowa State, University of Munich & Aluminum Assoc.AASHTO Kyung Kyu Lim 4/5/99 202-624-8918 Only info would be in 2nd Edition of LRFD Bridge Design Specs, 1998.
Technical inquires to Dr. John Kulieki @ Modjeski & Masters. 2nd call: Cango and review specs @ AASHTO in DC 8:30 to 4:30 @ 444 N Capitol St,NW, Suite 249.
Modjeski &Masters
Dr. John Kulieki 4/5/99 717-790-9565 Not able to provide much precise information without infringing uponAASHTO rights. Says that Specs contain series of details with allowablestress ranges. Suggest call back to AASHTO to get release of info.
F-3
FATIGUE OF ALUMINUM STRUCTURAL WELDMENTS
Organization Individual Date ofcontact
Telephonenumber
Email address Summary of discussion
ABS NY Jack Spencer 4/6/99 212-839-5274 Mr. Spencer used to be Chief of Hull Structures Group at USCGHQ. He hasbeen out of touch with this work for a long time and could not provide anyreferences or contacts to help with current task.
USCG HQ Steven Cohen 4/6/99 202-267-0467 No specific references or contacts however, he did recommend Fincanterriand Don Blunt (Navy Small Boat Group). Involved with 47 MLD that usedfatigue practice parallel to steel, i.e., low nominal stress, continuity/load path.
USCG ELC Debu Ghosh 4/7/99 410-762-6736 Mr. Ghosh is the Boat Branch Chief at ELC. He does not have any specificinformation that would help in this task at this time but would be interested inattending the PTC Meetings in the future.
Navy JoiningCenter (EWI)
Matt White 4/8/99 614-688-5241 Sent the task statement to Mr. White. He will review and return listing ofapplicable documents from NJC.
AssociationAmericanRailroads
Charlie Powell 6/10/99 719-585-1883 Cited the section of the AAR Code that is applicable to Aluminum fatigue. Inthe Manual of Standards & Recommended Practices it is Section C, Part 2,Volume 1. Also cited car producer Trinity or Johnson America for specificgrades of Al used in construction. AAR only produces performance specs.
ConcurrentTechnologies Corp.
Gary Miller 4/19/99 814-269-2874 Spoke to Richard Henry @ CTC who is PM for NCE in MetalworkingTechnology. Gary Miller ret’d call. He recommends speaking to SAE. Notmuch info at NCEMT. Also recommend John Cammett at NAVFAC CherryPoint (Helicopter refurbishment.)
SAE Phyllis Roessler 4/19/99 724-772-7154NSWCCD David Kihl 4/19/99 301-227-1956 Mr. Kihl is a member of the PTC for this task with a great deal of experience
relating to fatigue. We had an informal discussion relating to this task and hesuggested that he had little experience with aluminum and that all suchexperience at the Model Basin would be available through Jeff Beach.
TechnicalUniversity ofMunich
Prof. DimitrisKosteas
4/20/99 011-49 89 6427 04 24
Established connection with Prof. Kosteas through a letter I FAXED him. Heresponded via email and does indeed seem to be a very good source ofinformation. Also appears willing and able to assist in the current effort.
NAVSEA Gene Mitchell 4/21/99 703-602-0205 Will be able to supply a copy of ASM “Fatigue Data: Light StructuralAlloys.” Need to obtain and make copy of applicable information.
TechnicalUniversity ofMunich
Prof. DimitrisKosteas
5/20/99 011-49 89 6427 04 24
Met with Prof. Kosteas @ JJMA NYO. Discussed European works,EuroCode #9, ECCS and the database of information available thru Kosteas.Need to determine how database can be accessed for review for this task.Rec’d copy of EC9 after requesting from Prof. Kosteas.

F-4
FATIGUE OF ALUMINUM STRUCTURAL WELDMENTS
Organization Individual Date ofcontact
Telephonenumber
Email address Summary of discussion
Lehigh University John Fisher 6/10/99 610-758-3535 Most of his work is in steel. Only real work was with his grad student, CraigMenzemer. Their work led to a lot of the input in the Aluminum DesignManual.
Bethlehem Steel Harold S.Reemsnyder
6/10/99 610-694-6737 Mr. H. S. Reemsnyder was selected by the PTC as the Technical Advisor to thisreport. He provided invaluable commentary to the report and guidance duringits development. His insight and knowledge of the subject helped the entirePTC to better understand the mechanics of fatigue and fracture. Hrk.
University ofAkron
Dr. CraigMenzemer
6/10/99 330-972-7291 Confirmed that the work he and Prof. Fisher developed formed basis for fatiguedata in Aluminum Design Manual. Also confirmed that Kosteas is the primaryauthority for current work and database supervision. He will search for papershe wrote with Fisher regarding full size specimen work they did at Lehigh.
NTNU,Trondheim,Norway
Svein ErlingHeggelund
9/17/99 (735) 9 55 47 [email protected] Svein is a Dr. Ing. Student He Wrote an article entitled “Fatigue Analysis OfHigh Speed Aluminium Catamarans” together with Bard Wathne Tveiten andTorgeir Moan.It could be worth going through. And check up the other authors.Fax no. (735) 9 55 28
DNV, Norway Magnus Lindgren 9/24/99 [email protected]
Magnus was going to send me DNV Class. Notes 30.7. Magnus was projectleader for the project Aluminium in Ships which just were concluded. Heseemed very helpful and he might be in a position to help with additionalmaterial. Phone no. is available at DNVs homepege.
DNV, Norway Albert Fredriksen 9/24/1999 +4767577508 [email protected]
He on the contrary to Magnus Lindgren did not seem as helpful to provideadditional material. He recommended me to talk to Magnus and Bard WathneTveiten at NTNU in Trondheim.
Halliburton??,Stavanger,Norway.
Bard WathneTveiten
10/5/1999 +4751838179 [email protected]
Former Phd student that now is working in Stavanger for a company calledHalliburton??. He has done some work together with Torgeir Moan at NTNU inTrondheim. His paper is called, “Fatigue of Welded Joints in Aluminium”. Hewas going to send it and was very helpful. He had been with Torgeir Moan onboth FAST 97 and 99.
Chalmers,Goteborg, Sweden
Anders Ulfvarson Constant [email protected] Prof. at Chalmers University of Gothenburg. A profound knowledge in shipdesign and in aluminium. A lot of good connections at DNV and Lloyds.
Hydro Aluminium Ole Terje Midling 10/6/1999 +4752845019 [email protected]
Ole has been working in the project “Aluminium in Ships” together withKvaerner & DNV. OT Midling has extensive knowledge in materials and he hadbeen involved in most preojects that had to do with welding. But he had most ofpapers from the project that were “opened” to the public and were going to sendthose. Could be a good resource in material properties?
NTNU Torgeir Moan 10/7/1999 +4773595541 [email protected]
Torgeir Moan is Prof. at the department of marine structures at NTNU inTrondheim. They have conducted allot of work at NTNU and more is to come.Moan has also worked allot with DNV and helping them in there work.He has also done some work with Damage Tolerance Analysis.
F-5
C.J Roberts & Ass. John Roberts 10/7/1999 16042417960 [email protected]
John presented a paper at FAST 99 about Damage Tolerance Analysis. Theapplicability to the current effort is under investigation and it may not help.
ABS Houston 10/7/1999 (281) 877-6772 Weren’t aware of any work that is currently being done to develop aluminumfatigue data but recognize that this part of the industry is moving forward andABS is making plans to increase involvement in the high speed industry. Fax:281 877 6031
CTH Birger Karlsson 10/20/99 +46317721242 [email protected] Prof. in Material Science with good knowledge in steel, aluminum, fatigue andfracture mechanics. Recommended Rolf Sandstrom at KTH.
NTNU Jukka Mononen 10/26/99 +358 9 4513932
Jukka is a Ph.D. Student at the NTNU in Trondheim. He is conducting fatiguetests on aluminium alloys using different weld techniques. His result may be ofinterest. However he is not done testing yet.
Helsinki Universityof Technology,ShipLaboratory
Mirka SeppalaSec. At HUT ShipLaboratory.
10/26/99 [email protected]
HTU is conducting project in ship design. I ordered a couple of papers aboutship hull design loads and fatigue analysis. It is worth looking more into.
NTNU Oyvind Helland 11/04/99 Prof. at NTNU. Has a lot of knowledge in fatigue tests, but Bards Thesis containall information that Oyvind knows about at this time.
KTH Rolf Sandstrom 11/22/99 +4687908321 [email protected]
Suggested Kosteas as contact, so nothing new. He has a profound knowledge infatigue he was going to see if he could find more data bases.
TU Delft Jan Zuidema +31152782208 [email protected]
They had started some tests on fatigue in aluminum, but nothing else at themoment. These tests might are not completed but may be of interest in thefuture.
LTU Erkki Niemi 11/04/99 [email protected]
Retired. But has done a lot of research. Got a number of his papers
NTNU Arne Alborg 11/15/99 [email protected]
He suggested that I should talk to Haagesen.
KTH Karl Garme 11/29/99 [email protected] Involved in full scale tests about slamming on HSC at KTH and will most likelybe helpful in understanding the forces that act on a HSC.
TU Delft Bakker Recommended Jan Zuidema.TU Delft Spinkster [email protected]
udelft.nlRecommended B. Boon.
TU Delft B.Boon [email protected]
Suggestions were similar to those made by others interviewed for this report.
AMERAC Stephen CookAMERAC Kim Klaka 01/09/00 [email protected]
n.edu.auHe said that they had allot of co-operation with the University of NSW and tocontact Prof. Don Kelly.
UNSW Don Kelly 01/10/00 +61293854160 [email protected]
Don had been working on the project with AMECRC, but some parts of it mightbe confidential so it might take a while to get that cleared. He was going to getback to me with the appropriate contact for further discussion. The person whohad been on the project were a Mr Ruben Spyka, but he had left the AMERAC.
LUT Salme Arola 01/10/00 [email protected] 01/10/00 Fax: 33 149 90 3680ABS (Houston) Bill Hanzelak

F-6
ABS (New Jersey) Paul Said that he did not know anything about stress histogram for HSC.Lloyds Sue Rutherford 01/10/00 [email protected] Lloyd were not doing anything concerning fatigue in aluminum HSC. Nothing!SINTEF O. Orjaseter 01/20/00 +47 73592914 Orjaseter has conducted a number of aluminum fatigue tests that are included in
the report. He gave me some guidance in how to interpret the results. He hasbeen writing many articles about aluminum fatigue and should have a profoundknowledge about it.