PDF 8.01 MB
24
Lumwana Site Visit P tI O ti R i 1 PartI – Operations Review February 5-6, 2014 Agenda 1 SAFETY IMPROVEMENTS 2 OVERVIEW OF COPPER GROUP 1. SAFETY IMPROVEMENTS 2. OVERVIEW OF COPPER GROUP 3. SITE OVERVIEW 4. TURNAROUND PROGRESS TO DATE 2
Transcript of PDF 8.01 MB
Lumwana Site VisitP t I O ti R i
1
Part I – Operations ReviewFebruary 5-6, 2014
Agenda
1 SAFETY IMPROVEMENTS
2 OVERVIEW OF COPPER GROUP
1. SAFETY IMPROVEMENTS
2. OVERVIEW OF COPPER GROUP
3. SITE OVERVIEW
4. TURNAROUND PROGRESS TO DATE
2
Agenda
1 SAFETY IMPROVEMENTS
2 OVERVIEW OF COPPER GROUP
1. SAFETY IMPROVEMENTS
2. OVERVIEW OF COPPER GROUP
3. SITE OVERVIEW
4. TURNAROUND PROGRESS TO DATE
3
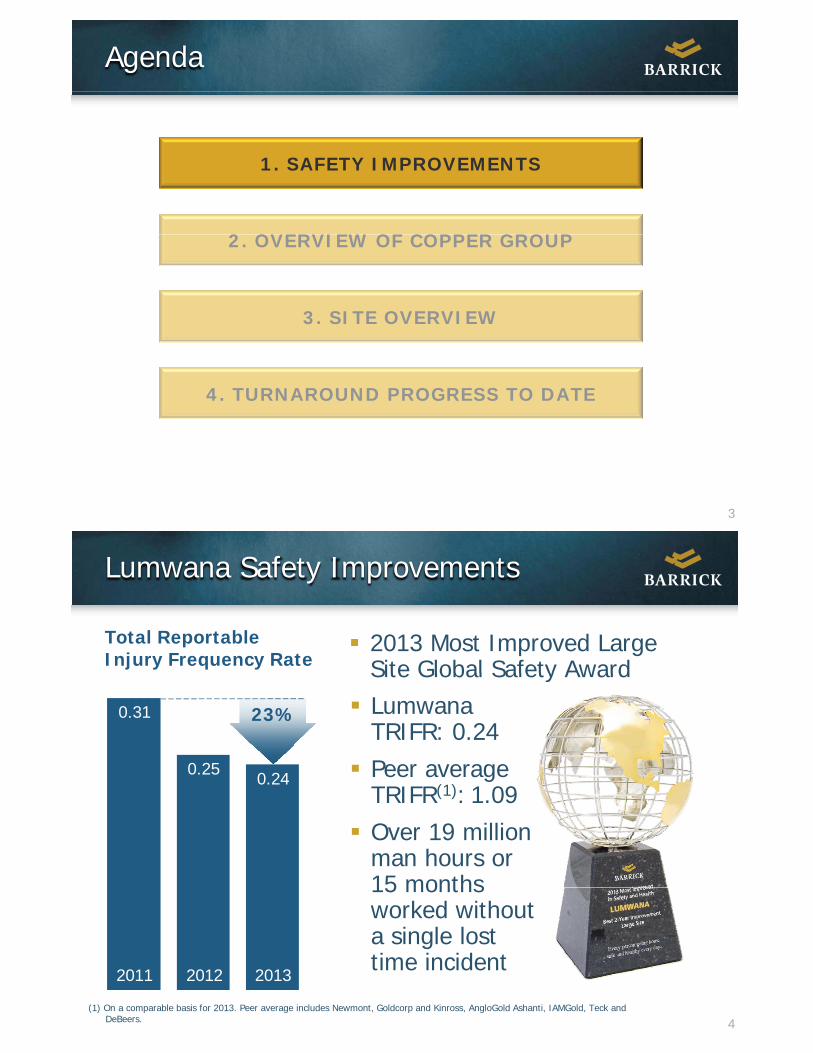
Lumwana Safety Improvements
2013 Most Improved Large Site Global Safety Award
Total Reportable Injury Frequency Rate Site Global Safety Award
23%0.31 Lumwana TRIFR: 0.24
0.25 0.24 Peer average TRIFR(1): 1.09Over 19 million man hours or 15 months15 monthsworked without a single lost time incident
4
2011 2012 2013
(1) On a comparable basis for 2013. Peer average includes Newmont, Goldcorp and Kinross, AngloGold Ashanti, IAMGold, Teck and DeBeers.
time incident
Agenda
1 SAFETY IMPROVEMENTS
2 OVERVIEW OF COPPER GROUP
1. SAFETY IMPROVEMENTS
2. OVERVIEW OF COPPER GROUP
3. SITE OVERVIEW
4. TURNAROUND PROGRESS TO DATE
5
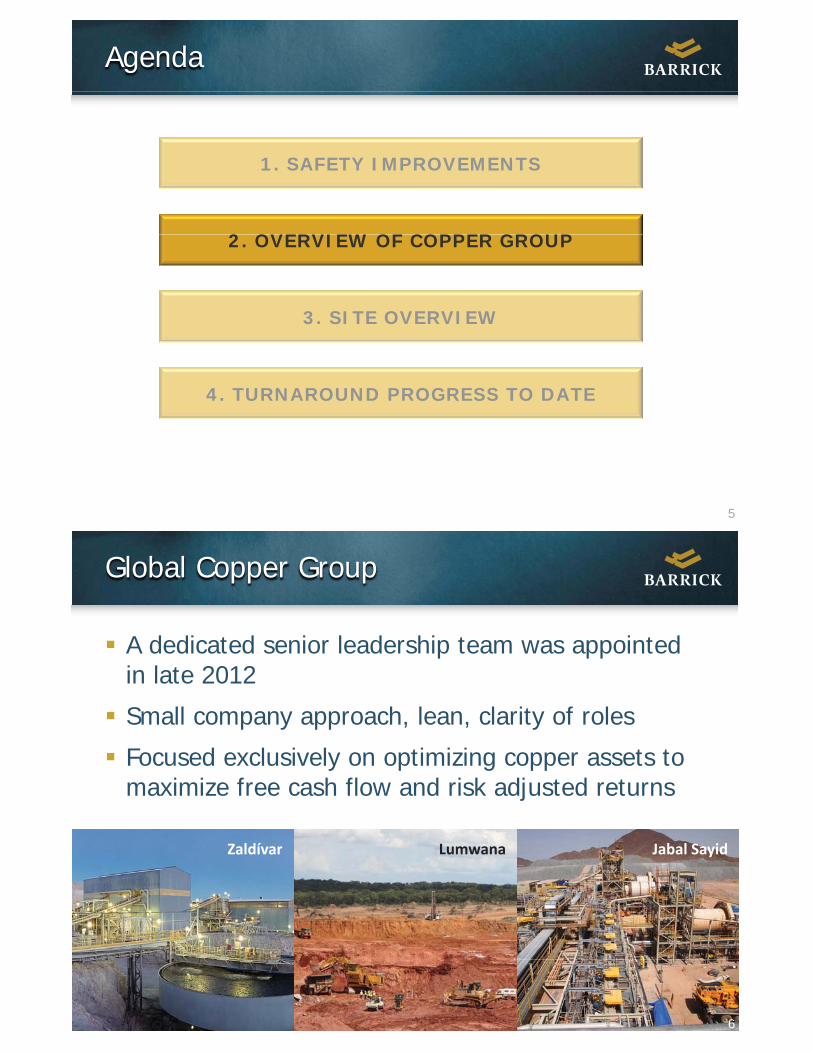
Global Copper Group
A dedicated senior leadership team was appointed in late 2012in late 2012
Small company approach, lean, clarity of roles
Focused exclusively on optimizing copper assets to maximize free cash flow and risk adjusted returns
Zaldívar Lumwana Jabal Sayid
66
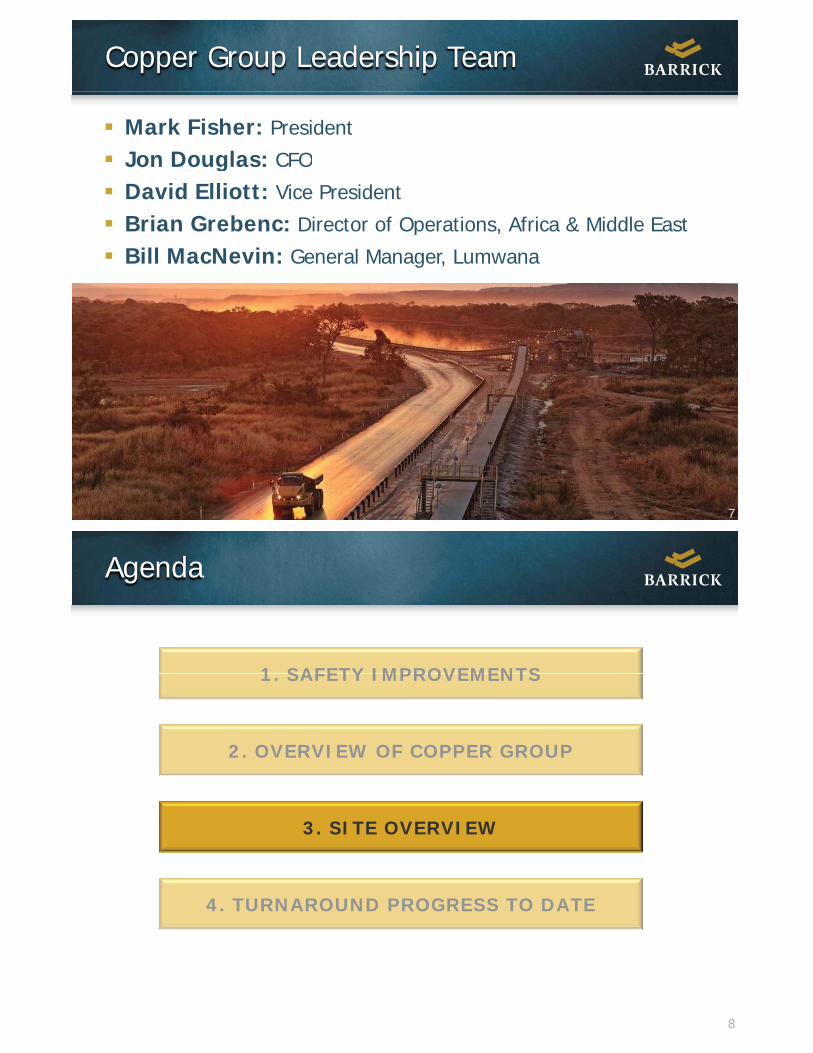
Copper Group Leadership Team
Mark Fisher: President
Jon Douglas: CFOJon Douglas: CFO
David Elliott: Vice President
Brian Grebenc: Director of Operations, Africa & Middle Eastp ,
Bill MacNevin: General Manager, Lumwana
77
Agenda
1 SAFETY IMPROVEMENTS
2 OVERVIEW OF COPPER GROUP
1. SAFETY IMPROVEMENTS
2. OVERVIEW OF COPPER GROUP
3. SITE OVERVIEW
4. TURNAROUND PROGRESS TO DATE
8
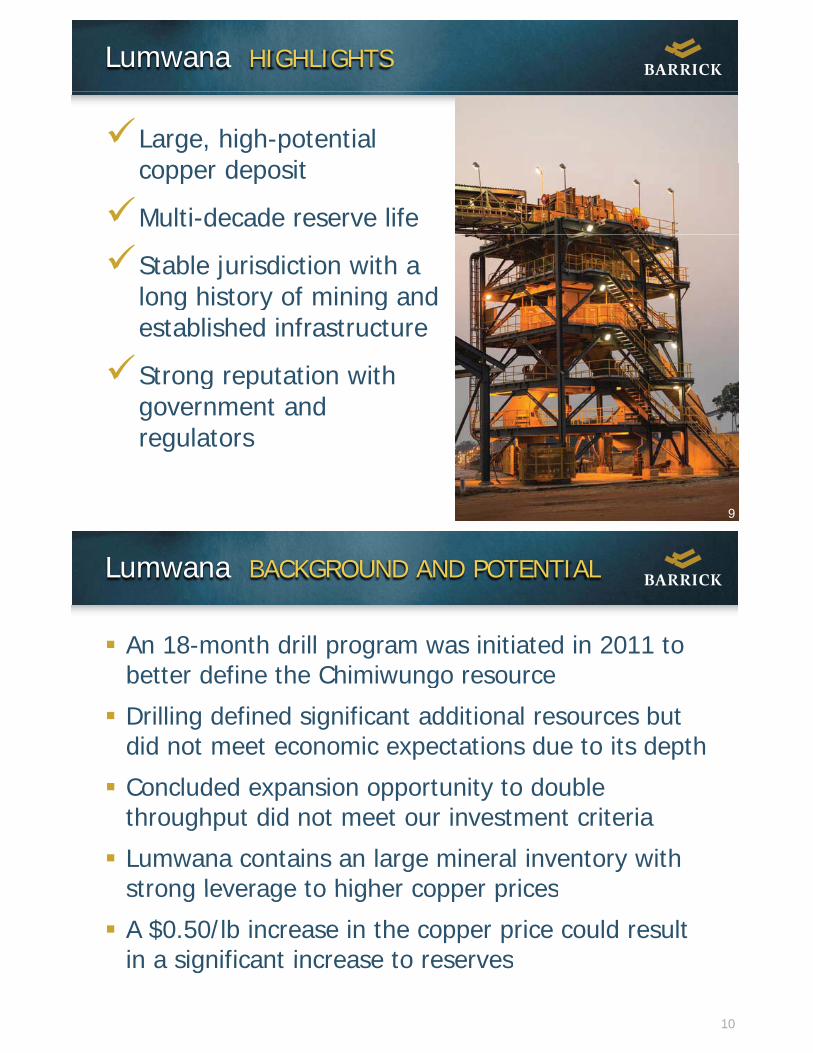
Lumwana HIGHLIGHTS
Large, high-potential d itcopper deposit
Multi-decade reserve life
Stable jurisdiction with a long history of mining and g y gestablished infrastructure
Strong reputation withStrong reputation withgovernment and regulators
9
g
9
Lumwana BACKGROUND AND POTENTIAL
An 18-month drill program was initiated in 2011 to better define the Chimiwungo resourcebetter define the Chimiwungo resource
Drilling defined significant additional resources but did not meet economic expectations due to its depthdid not meet economic expectations due to its depth
Concluded expansion opportunity to double throughput did not meet our investment criteriathroughput did not meet our investment criteria
Lumwana contains an large mineral inventory with strong leverage to higher copper pricesstrong leverage to higher copper prices
A $0.50/lb increase in the copper price could result in a significant increase to reserves
10
in a significant increase to reserves
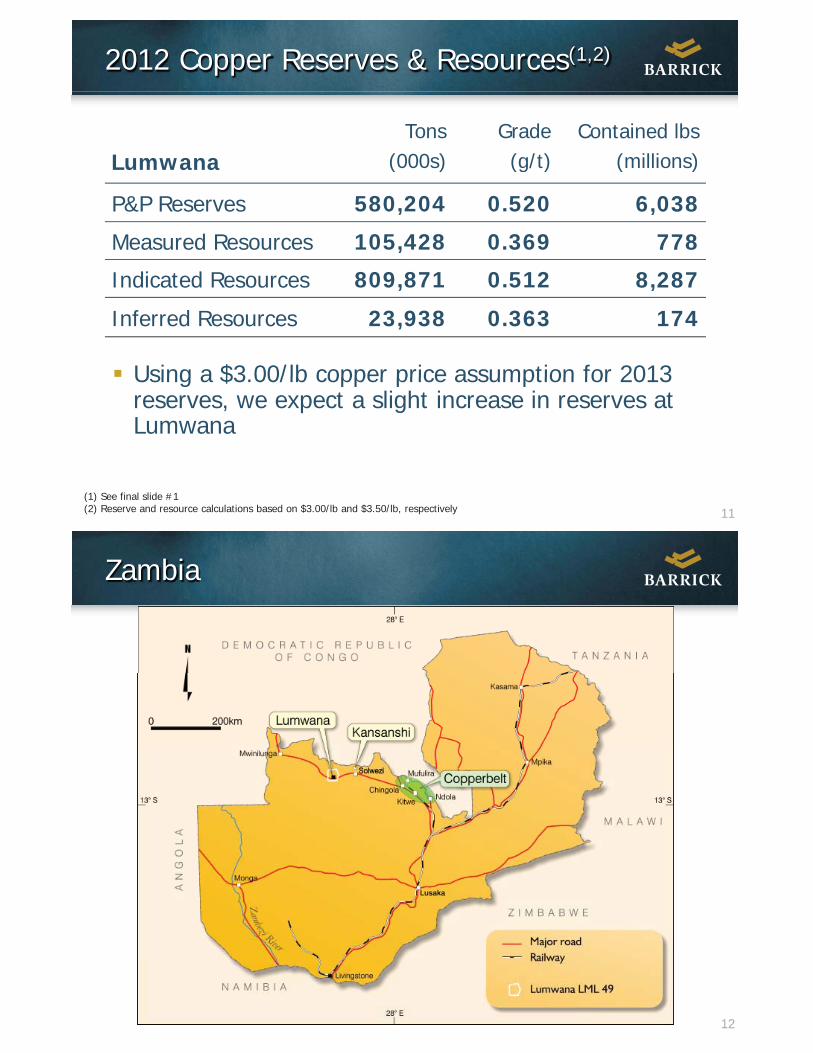
2012 Copper Reserves & Resources(1,2)
Tons Grade Contained lbsLumwana (000s) (g/t) (millions)Lumwana (000s) (g/t) (millions)
P&P Reserves 580,204 0.520 6,038
M d R 105 428 0 369 778Measured Resources 105,428 0.369 778
Indicated Resources 809,871 0.512 8,287
Inferred Resources 23,938 0.363 174
Using a $3 00/lb copper price assumption for 2013Using a $3.00/lb copper price assumption for 2013reserves, we expect a slight increase in reserves at Lumwana
11(1) See final slide #1(2) Reserve and resource calculations based on $3.00/lb and $3.50/lb, respectively
Zambia
12
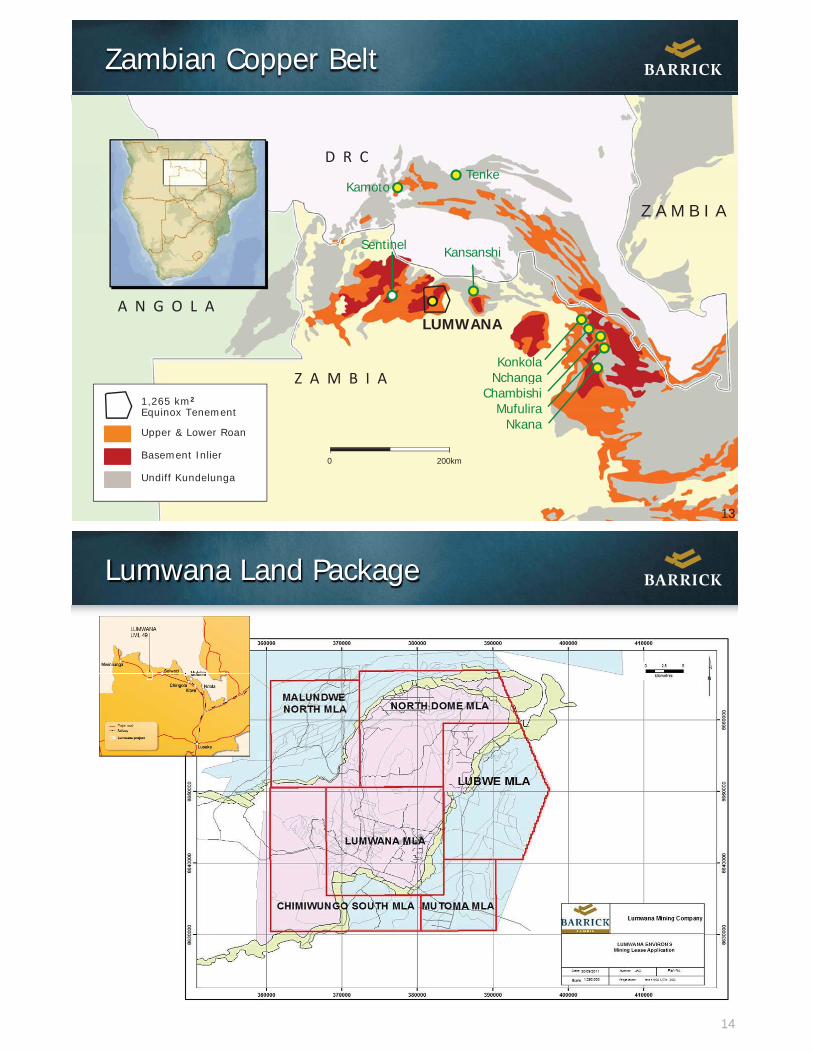
Zambian Copper Belt
D R CTenke
Kamoto
Z A M B I A
A N G O L A
KansanshiSentinel
A N G O L A
Z A M B I AKonkola
Nchanga
LUMWANA
Z A M B I A NchangaChambishi
MufuliraNkana
1,265 km2
Equinox Tenement
Upper & Lower Roan
13
0 200kmBasement Inlier
Undiff Kundelunga
13
Lumwana Land Package
14
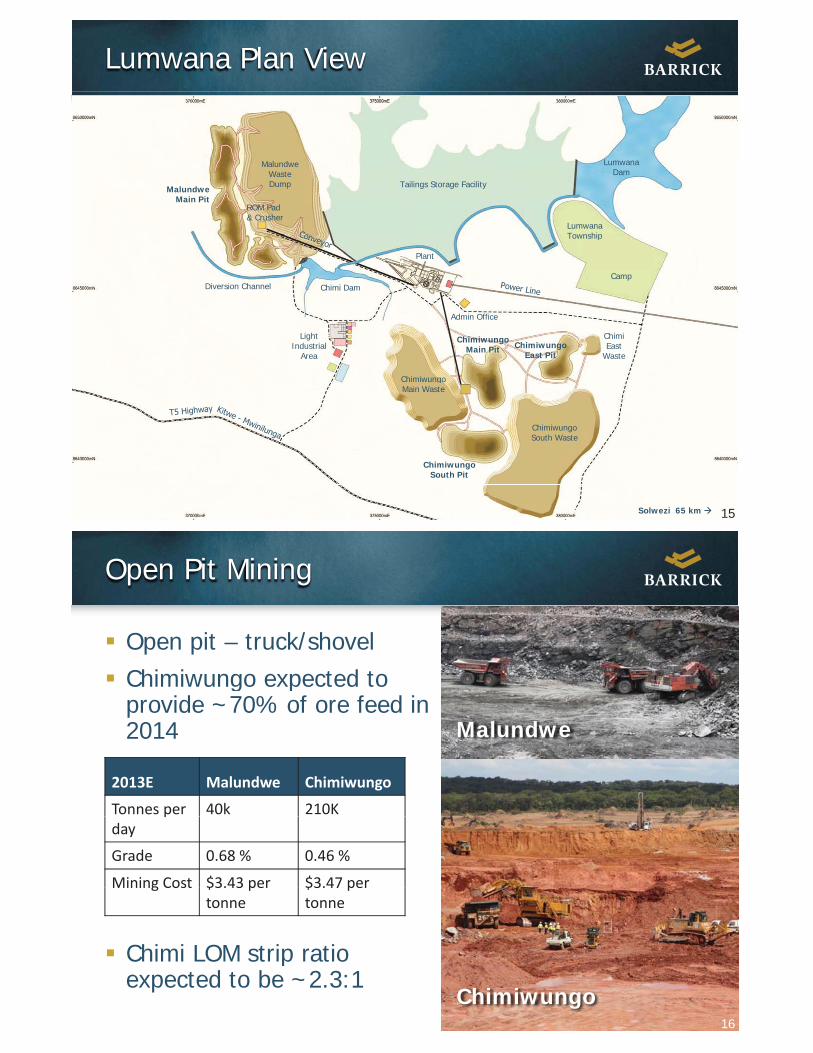
Lumwana Plan View
Malundwe Lumwana
Tailings Storage Facility
MalundweWasteDumpMalundwe
Main Pit
LumwanaTownship
LumwanaDam
ROM Pad & Crusher
Diversion Channel
Plant
Township
CampChimi Dam
LightIndustrial
Area
Admin Office
Chimi ngo
ChimiwungoEast Pit
ChimiwungoMain Pit
ChimiEast
Waste
Chimiwungo South Waste
ChimiwungoMain Waste
15
ChimiwungoSouth Pit
Solwezi 65 km 15
Open Pit Mining
Open pit – truck/shovel Chimiwungo expected toChimiwungo expected toprovide ~70% of ore feed in 2014 Malundwe
2013E Malundwe Chimiwungo
Tonnes per 40k 210Kpday
Grade 0.68 % 0.46 %
Mining Cost $3.43 per $3.47 per
Chimi LOM strip ratio
Mining Cost $3.43 pertonne
$3.47 pertonne
16
Chimi LOM strip ratioexpected to be ~2.3:1
Chimiwungo16
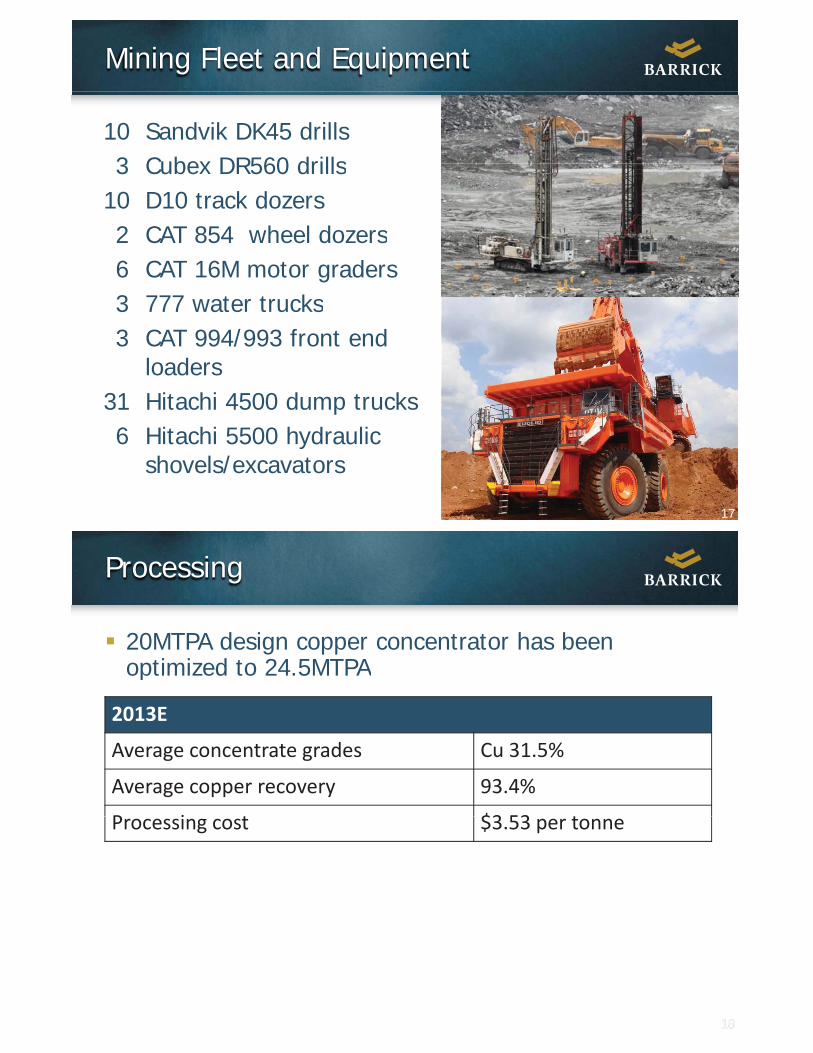
Mining Fleet and Equipment
10 Sandvik DK45 drills 3 Cubex DR560 drills3 Cubex DR560 drills
10 D10 track dozers2 CAT 854 wheel dozers2 CAT 854 wheel dozers6 CAT 16M motor graders3 777 water trucks3 777 water trucks3 CAT 994/993 front end
loaders31 Hitachi 4500 dump trucks6 Hitachi 5500 hydraulic
17
yshovels/excavators
17
Processing
20MTPA design copper concentrator has been optimized to 24.5MTPAoptimized to 24.5MTPA
2013E
A t t d C 31 5%Average concentrate grades Cu 31.5%
Average copper recovery 93.4%
P i t $3 53 tProcessing cost $3.53 per tonne
1818
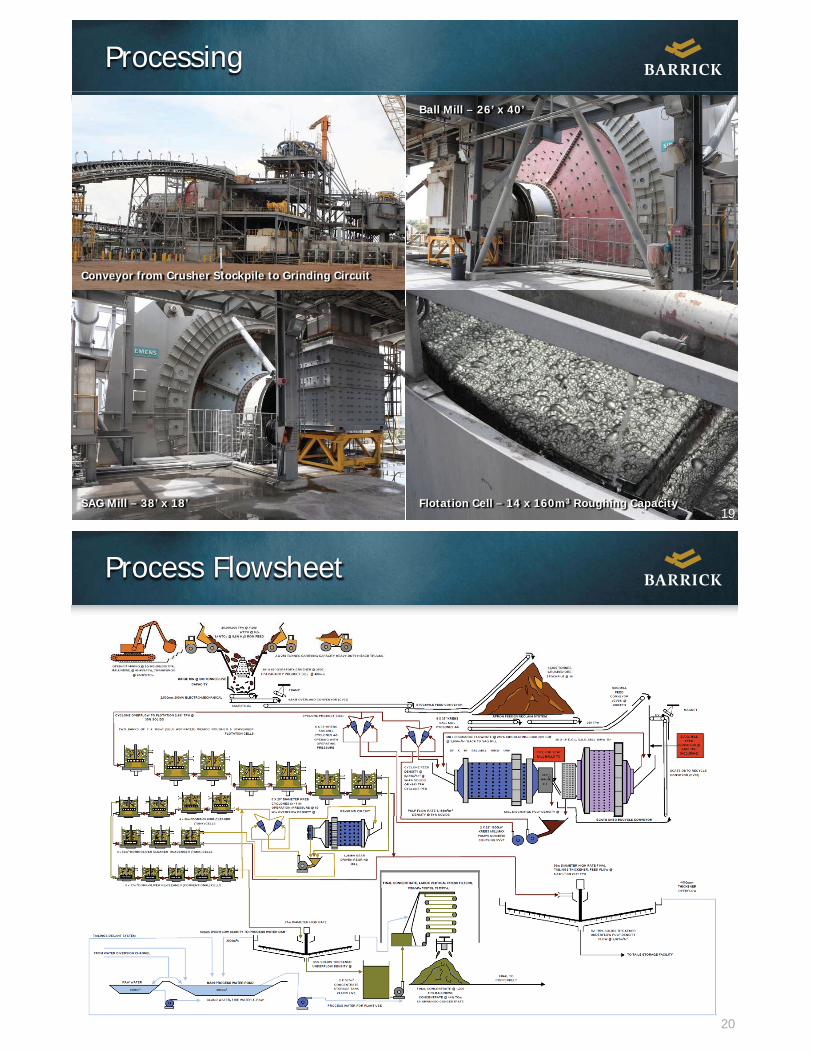
Processing
Ball Mill – 26’ x 40’
Conveyor from Crusher Stockpile to Grinding Circuit
19SAG Mill – 38’ x 18’ Flotation Cell – 14 x 160m3 Roughing Capacity
19
Process Flowsheet
20
Concentrate Marketing
Lumwana sells concentrate under long-term sales agreements to three smelters in Zambiaagreements to three smelters in Zambia– Chambishi Copper Smelter (CCS)– Konkola Copper Mines (KCM)Konkola Copper Mines (KCM)– Mopani
Concentrate is only sold domestically and is notConcentrate is only sold domestically and is notsubject to the 10% duty on all copper concentrate sold internationally (~$0.35/lb)
Smelter capacity not an issue as long-term agreements are in place that ensure our full
d ti b d
21
production can be processed
Agenda
1 SAFETY IMPROVEMENTS
2 OVERVIEW OF COPPER GROUP
1. SAFETY IMPROVEMENTS
2. OVERVIEW OF COPPER GROUP
3. SITE OVERVIEW
4. TURNAROUND PROGRESS TO DATE
22
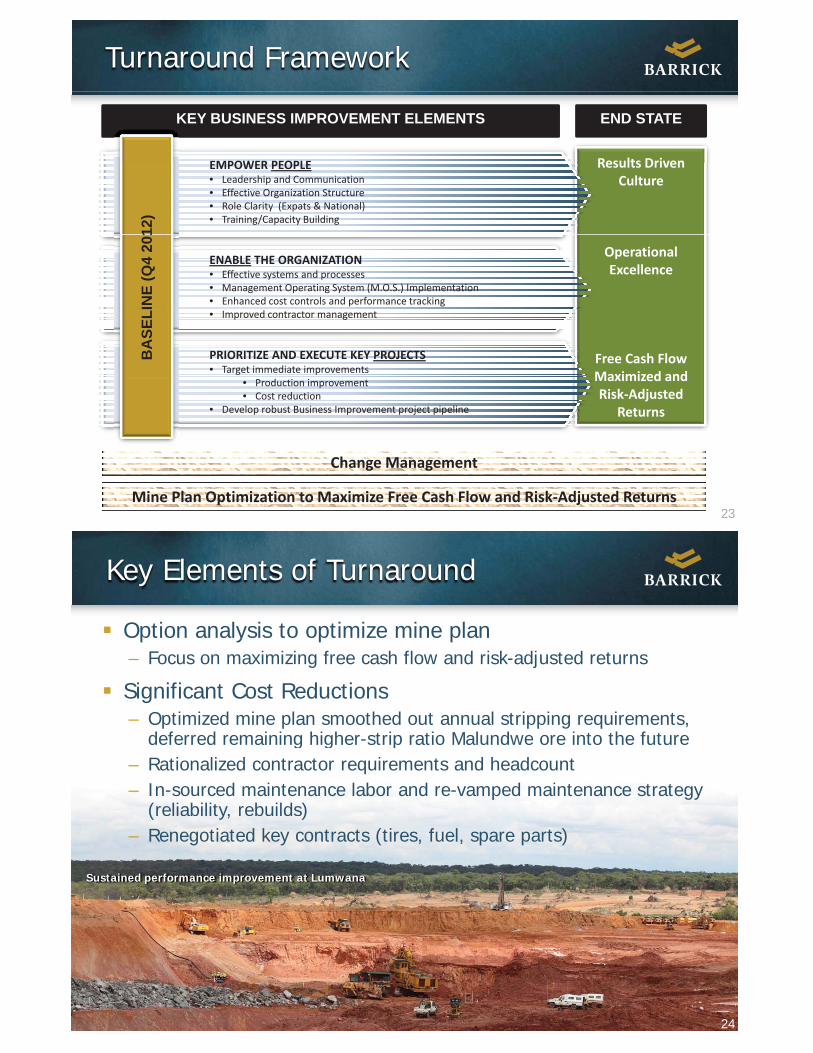
Turnaround Framework
Results Driven
KEY BUSINESS IMPROVEMENT ELEMENTS END STATE
EMPOWER PEOPLE Results DrivenCulture
EMPOWER PEOPLE• Leadership and Communication• Effective Organization Structure• Role Clarity (Expats & National)• Training/Capacity Building
12)
OperationalExcellence
ENABLE THE ORGANIZATION• Effective systems and processes• Management Operating System (M.O.S.) Implementation• Enhanced cost controls and performance trackingN
E (Q
4 20
1
Free Cash FlowMaximized and
p g• Improved contractor management
PRIORITIZE AND EXECUTE KEY PROJECTS• Target immediate improvements
BA
SELI
Maximized andRisk Adjusted
Returns
• Production improvement• Cost reduction
• Develop robust Business Improvement project pipeline
23Mine Plan Optimization to Maximize Free Cash Flow and Risk Adjusted Returns
Change Management
Key Elements of Turnaround
Option analysis to optimize mine plan – Focus on maximizing free cash flow and risk-adjusted returns
Significant Cost Reductions– Optimized mine plan smoothed out annual stripping requirements,
deferred remaining higher-strip ratio Malundwe ore into the futurede e ed e a g g e st p at o a u d e o e to t e utu e– Rationalized contractor requirements and headcount – In-sourced maintenance labor and re-vamped maintenance strategy
(reliability, rebuilds)
Sustained performance improvement at Lumwana
( y, )– Renegotiated key contracts (tires, fuel, spare parts)
2424
Key Elements of Turnaround
Efficiency Improvements: – Reconfigured organization structure and hired the right people– Launched Management Operating System Implementation
Improved Fleet Productivity LMC T 2012 60 2 illi t– LMC Tonnage 2012: 60.2 million tonnes
– LMC Tonnage 2013: 71.0 million tonnes (+18%)
2525
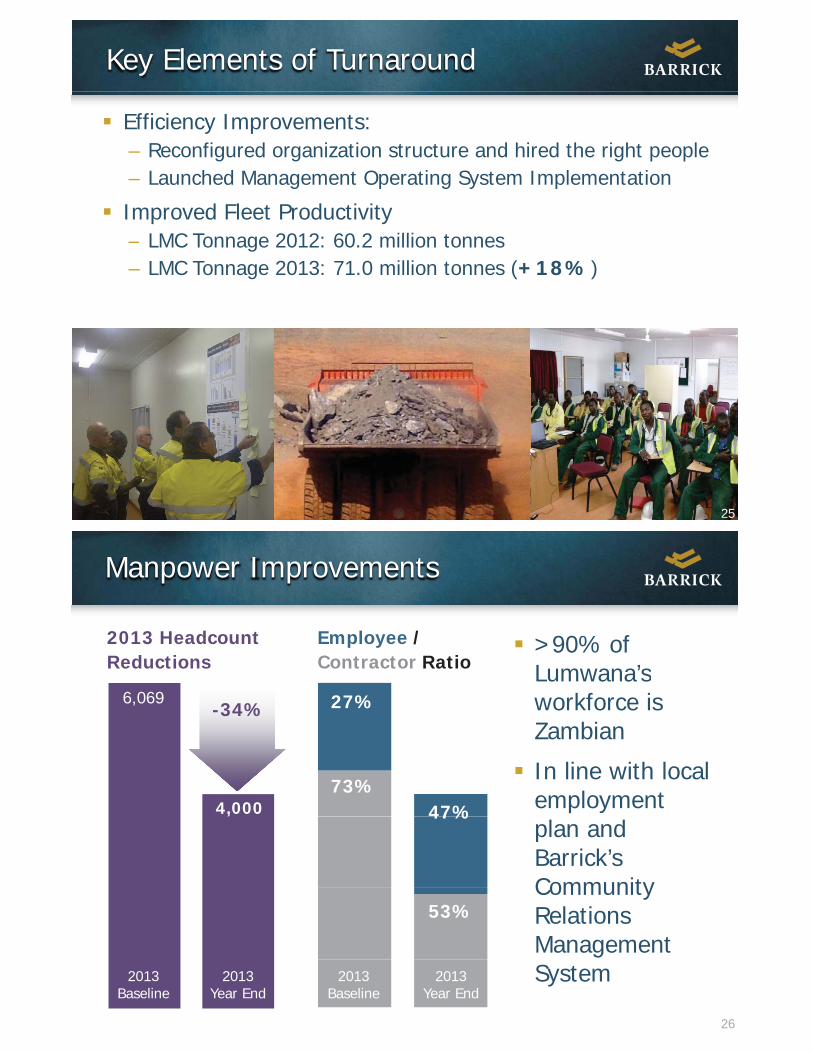
Manpower Improvements
>90% of Lumwana’s
2013 Headcount Reductions
Employee /Contractor Ratio Lumwana s
workforce is Zambian
6,069-34% 27%
In line with local employment 4,000
73%47%
plan and Barrick’sCommunity
, 47%
CommunityRelations Management
53%
26
System2013Year End
2013Baseline
2013Baseline
2013Year End
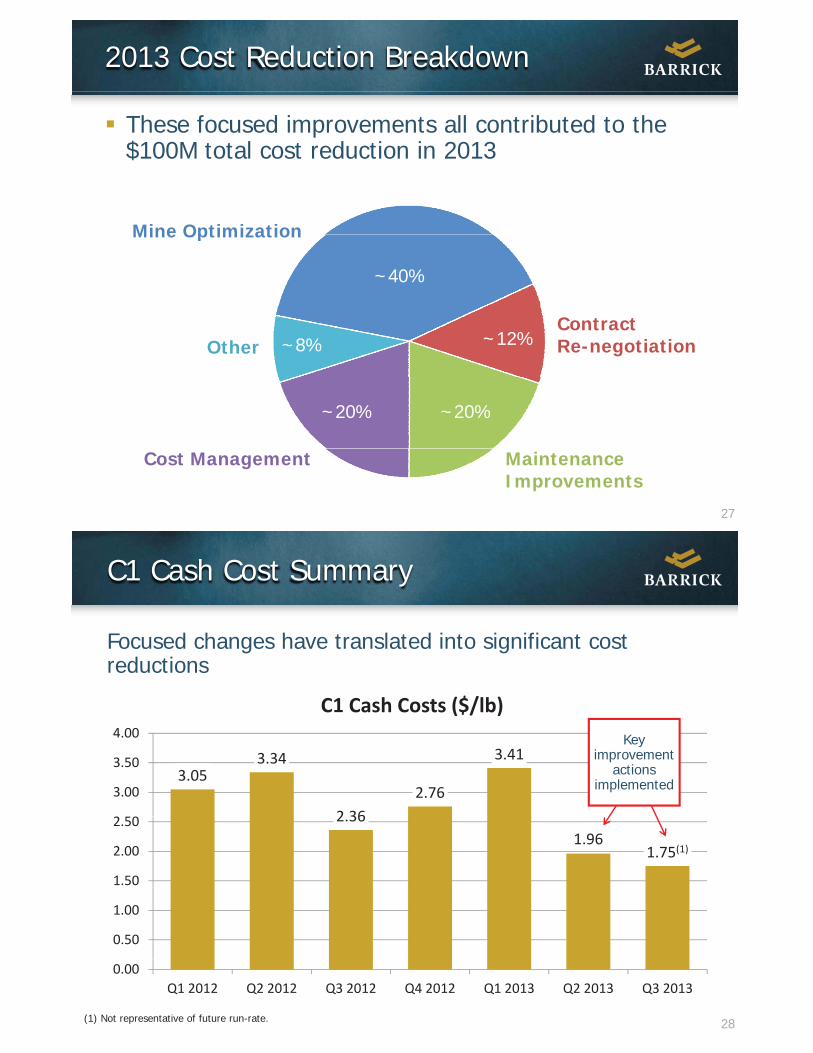
2013 Cost Reduction Breakdown
These focused improvements all contributed to the $100M total cost reduction in 2013
Mine OptimizationMine Optimization
~40%
ContractRe-negotiationOther ~8% ~12%
~20% ~20%
27
MaintenanceImprovements
Cost Management
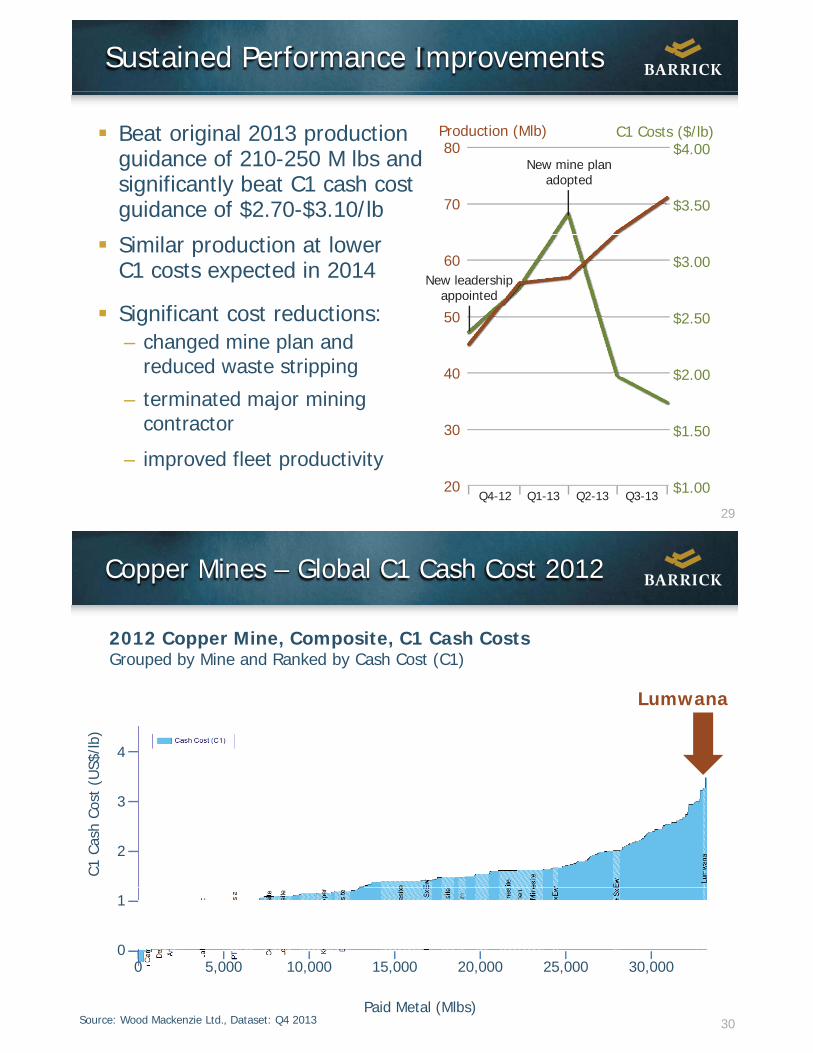
C1 Cash Cost Summary
Focused changes have translated into significant cost reductions
4.00
C1 Cash Costs ($/lb)Key
3.053.34
2 362.76
3.41
3.00
3.50y
improvement actions
implemented
2.361.96
1.75(1)
1.50
2.00
2.50
0.50
1.00
28
0.00Q1 2012 Q2 2012 Q3 2012 Q4 2012 Q1 2013 Q2 2013 Q3 2013
(1) Not representative of future run-rate.
Sustained Performance Improvements
Beat original 2013 production guidance of 210-250 M lbs and $4.0080
C1 Costs ($/lb)Production (Mlb)
New mine planguidance of 210 250 M lbs andsignificantly beat C1 cash cost guidance of $2.70-$3.10/lb $3.5070
New mine planadopted
Similar production at lower C1 costs expected in 2014
Si ifi t t d ti
$3.0060New leadership
appointed
Significant cost reductions:– changed mine plan and
reduced waste stripping $2 00
$2.50
40
50
– terminated major mining contractor $1.50
$2.00
30
40
29
– improved fleet productivity$1.0020
Q4-12 Q1-13 Q2-13 Q3-13
Copper Mines – Global C1 Cash Cost 2012
2012 Copper Mine, Composite, C1 Cash CostsGrouped by Mine and Ranked by Cash Cost (C1)
b)
Lumwana
Cost
(U
S$/l
3
4
C1Ca
sh C
2
0
1
30Paid Metal (Mlbs)
Source: Wood Mackenzie Ltd., Dataset: Q4 2013
30,00025,00020,00015,00010,0005,0000
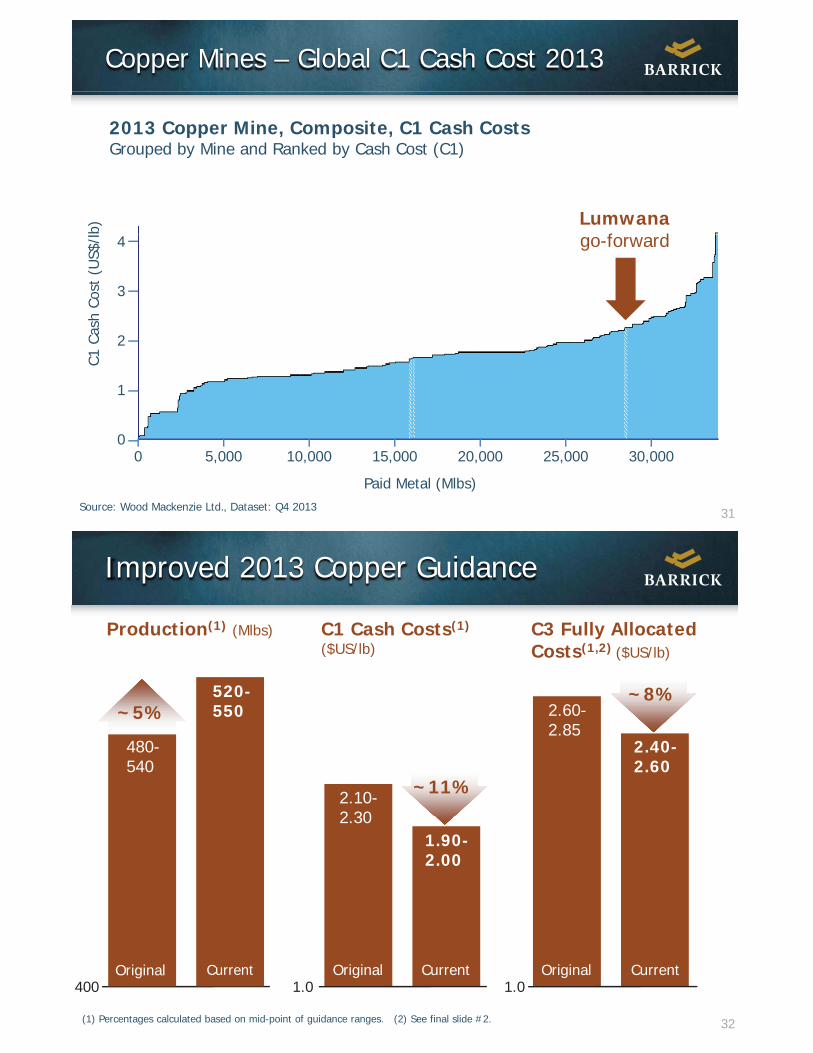
Copper Mines – Global C1 Cash Cost 2013
2013 Copper Mine, Composite, C1 Cash CostsGrouped by Mine and Ranked by Cash Cost (C1)
b)
Lumwanaf d
Cost
(U
S$/l
3
4 go-forward
C1Ca
sh C
2
0
1
31
Paid Metal (Mlbs)Source: Wood Mackenzie Ltd., Dataset: Q4 2013
30,00025,00020,00015,00010,0005,0000
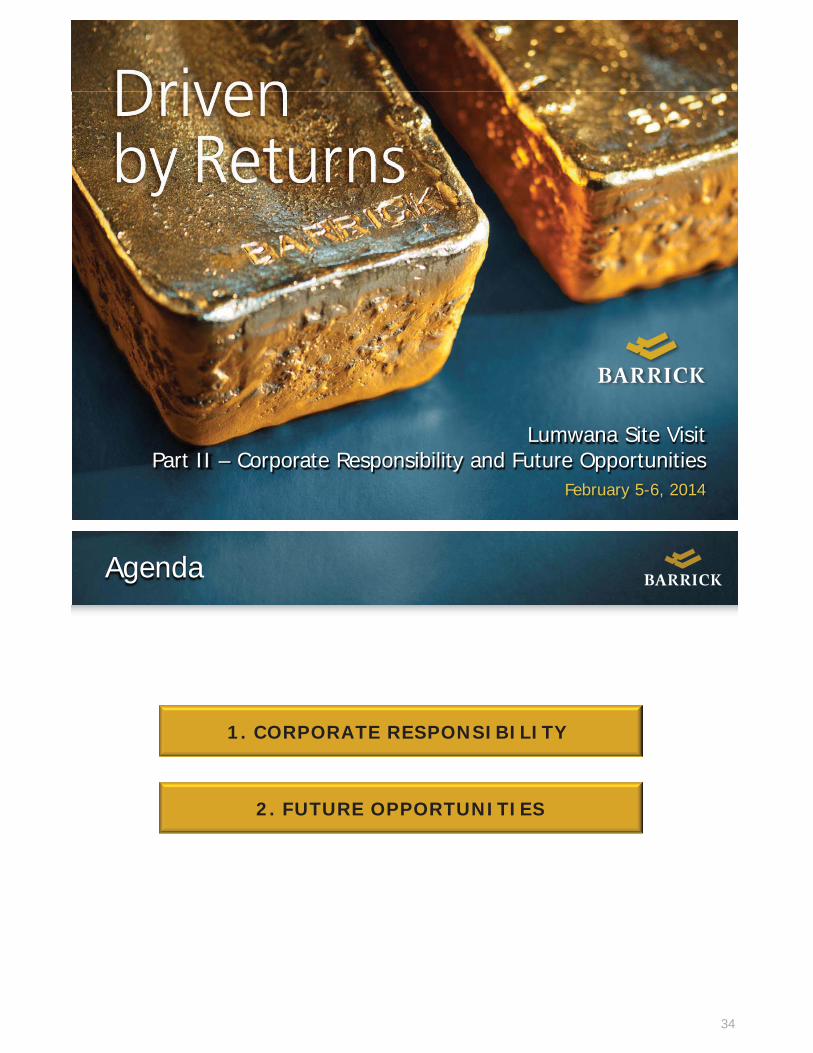
Improved 2013 Copper Guidance
C1 Cash Costs(1)
($US/lb)C3 Fully Allocated Costs(1,2) ($US/lb)
Production(1) (Mlbs)
2 40
2.60-2.85
~8%520-550
480
~5%
2.10-2 30
~11%
2.40-2.60
480-540
1.90-2.00
2.30
32
1.0 1.0Original Current Original Current
400Original Current
(1) Percentages calculated based on mid-point of guidance ranges. (2) See final slide #2.
Lumwana Site Visit
33
Part II – Corporate Responsibility and Future OpportunitiesFebruary 5-6, 2014
Agenda
1. CORPORATE RESPONSIBILITY
2. FUTURE OPPORTUNITIES
34
Agenda
1. CORPORATE RESPONSIBILITY
2. FUTURE OPPORTUNITIES
35
Corporate Responsibility
Lumwana has a long history of working together with local communities to foster sustainable, long-term success
Sample initiatives include:
Health and Support to Lumwana Community HIV and AIDS Task ForceHealth andSafetyAwareness Gender-based violence awareness and support
Road safety education and community-led water and sanitation
EducationDevelopment
Primary and Tertiary Education Scholarships
Support for community schools and public libraries
On-site ‘Lumwana Mine School’ successfully run since 2009
Suppo t o co u ty sc oo s a d pub c b a es
Community
Drilling of boreholes for clean water
Commissioning of by-pass road for haul trucks and road safety
36
yInfrastructure Road safety awareness
Population influx management
Relationships with Royal Establishments
Strong relationships with the three Royal Establishments in our areaRoyal Establishments in our area
Lumwana Development Trust Fund (LDTF) was established to ensure impact benefit is allocated appropriately between the Chiefdoms
A f l MOU h b d l d t dd iA formal MOU has been developed to address primaryareas of concern:– Land Use Planning and development (Consultation)Land Use Planning and development (Consultation)– LDTF– Lumwana Local Employment Register
37
– Local procurement and sourcing
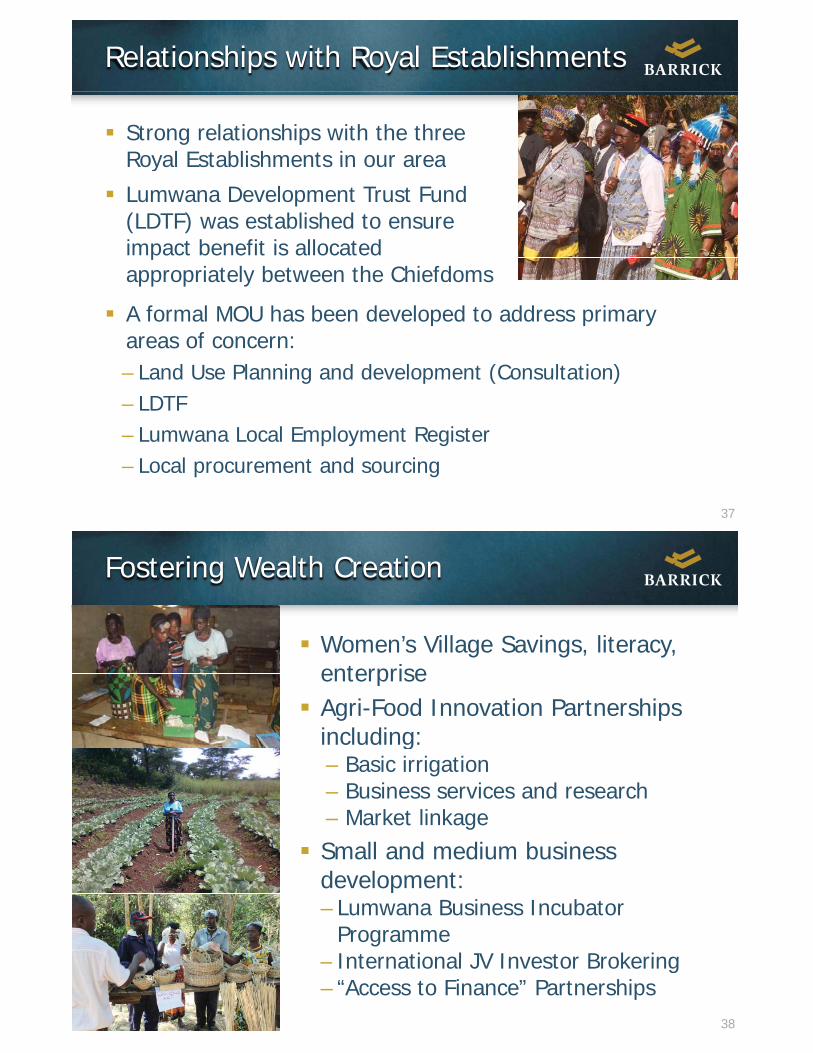
Fostering Wealth Creation
Women’s Village Savings, literacy, enterpriseenterpriseAgri-Food Innovation Partnerships including:c ud g– Basic irrigation– Business services and research
Market linkage– Market linkageSmall and medium business development:development:– Lumwana Business Incubator
ProgrammeInternational JV Investor Brokering
38
– International JV Investor Brokering– “Access to Finance” Partnerships
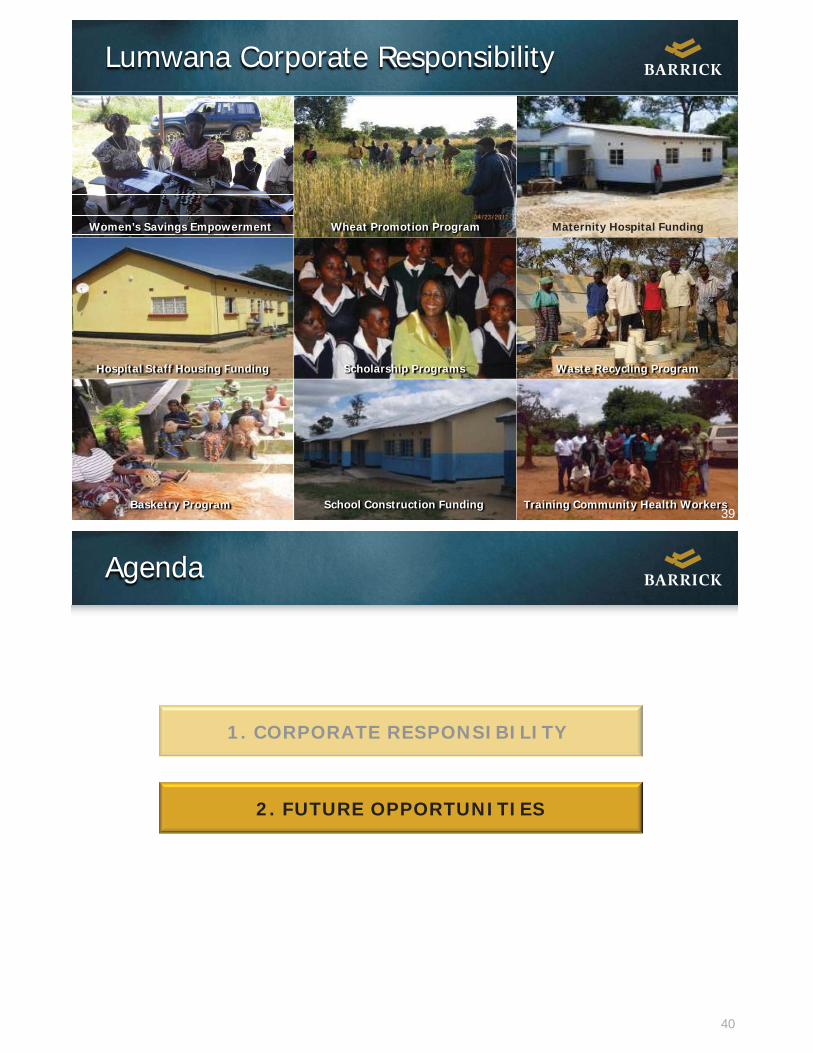
Lumwana Corporate Responsibility
Women’s Savings Empowerment Wheat Promotion Program Maternity Hospital Funding
Waste Recycling ProgramScholarship ProgramsHospital Staff Housing Funding
39Basketry Program School Construction Funding Training Community Health Workers
39
Agenda
1. CORPORATE RESPONSIBILITY
2. FUTURE OPPORTUNITIES
40
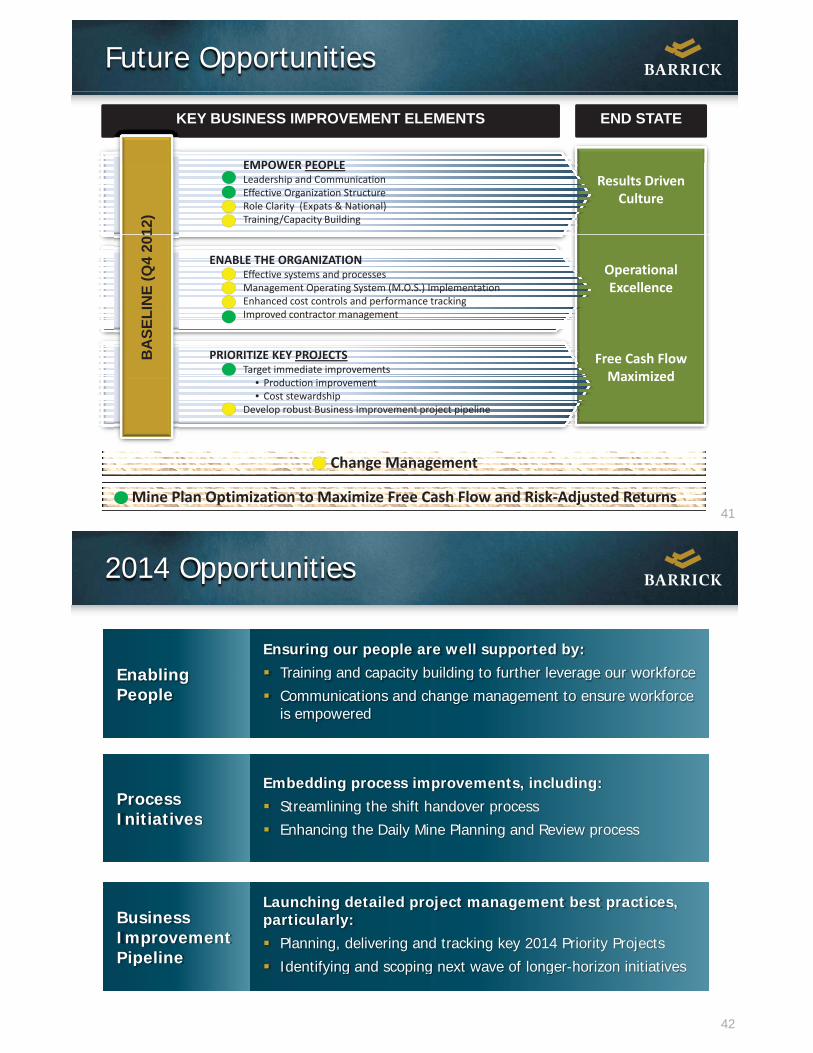
Future Opportunities
KEY BUSINESS IMPROVEMENT ELEMENTS END STATE
EMPOWER PEOPLEResults Driven
Culture
EMPOWER PEOPLELeadership and CommunicationEffective Organization StructureRole Clarity (Expats & National)Training/Capacity Building
12)
OperationalExcellence
ENABLE THE ORGANIZATIONEffective systems and processesManagement Operating System (M.O.S.) ImplementationEnhanced cost controls and performance trackingN
E (Q
4 20
1
Free Cash FlowMaximized
p gImproved contractor management
PRIORITIZE KEY PROJECTSTarget immediate improvements
BA
SELI
Maximized• Production improvement• Cost stewardship
Develop robust Business Improvement project pipeline
41Mine Plan Optimization to Maximize Free Cash Flow and Risk Adjusted Returns
Change Management
2014 Opportunities
EnablingEnsuring our people are well supported by:
Training and capacity building to further leverage our workforceEnablingPeople
Training and capacity building to further leverage our workforce
Communications and change management to ensure workforce is empowered
ProcessInitiatives
Embedding process improvements, including: Streamlining the shift handover process
InitiativesEnhancing the Daily Mine Planning and Review process
BusinessImprovementPipeline
Launching detailed project management best practices, particularly:
Planning, delivering and tracking key 2014 Priority Projects
42
Pipeline Identifying and scoping next wave of longer-horizon initiatives
Looking to the Future
Lumwana is a large deposit in a stable, mining-friendly jurisdictionfriendly jurisdiction
New mine plan maximizes free cash flow in the current price environment and preserves optionalityp p p y
Our goal is to continue to improve Lumwana’sproductivity and drive it further down the Global C1 p yCash Cost curve
The outlook for long term copper prices remains strong due to continued demand growth and supply-side challenges
43
Lumwana is very well positioned for the future
Appendix
COPPER MARKET OUTLOOK
44
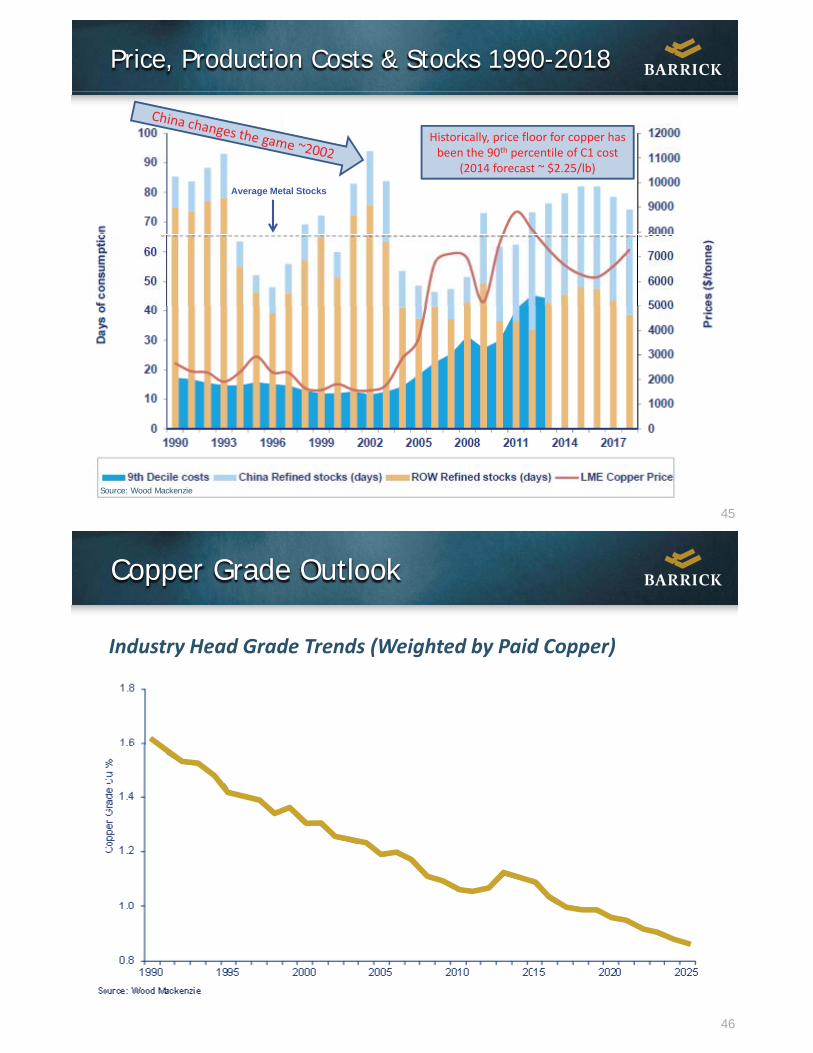
Price, Production Costs & Stocks 1990-2018
Historically, price floor for copper hasbeen the 90th percentile of C1 cost
( $ / )(2014 forecast ~ $2.25/lb)
Average Metal Stocks
45
Source: Wood Mackenzie
Copper Grade Outlook
Industry Head Grade Trends (Weighted by Paid Copper)
46
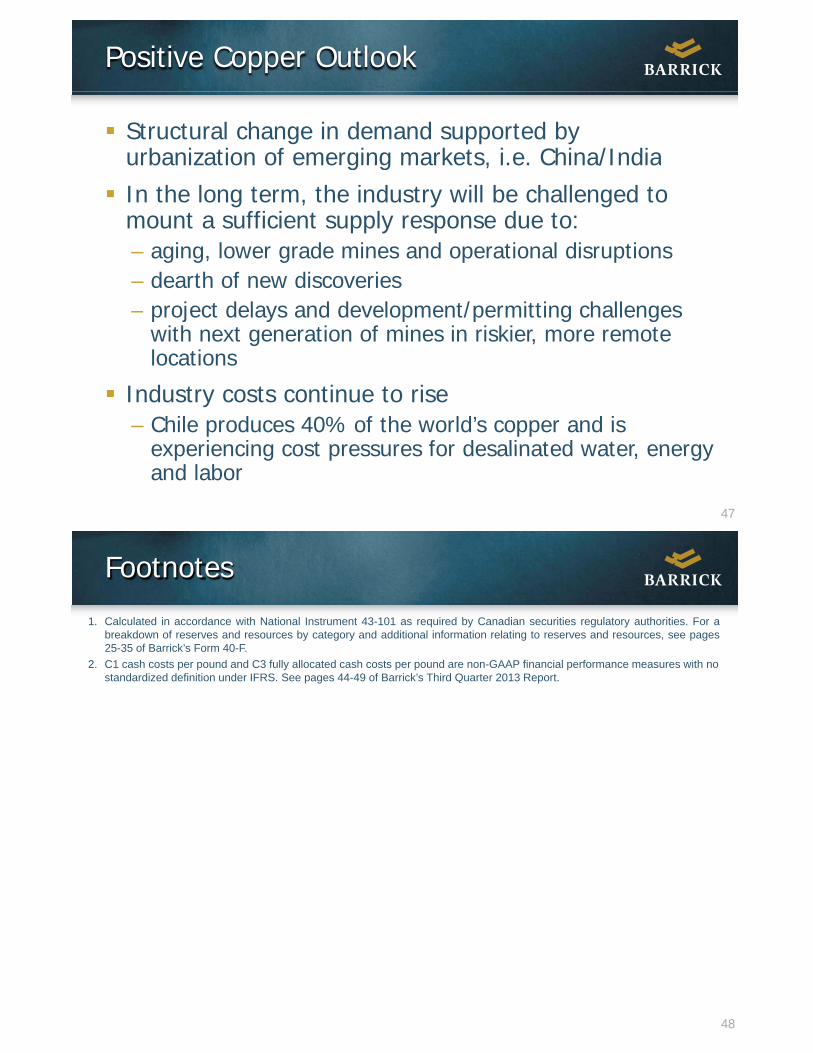
Positive Copper Outlook
Structural change in demand supported by urbanization of emerging markets, i.e. China/Indiaurbanization of emerging markets, i.e. China/IndiaIn the long term, the industry will be challenged to mount a sufficient supply response due to:– aging, lower grade mines and operational disruptions– dearth of new discoveries
project delays and development/permitting challenges– project delays and development/permitting challengeswith next generation of mines in riskier, more remote locations
Industry costs continue to rise– Chile produces 40% of the world’s copper and is
experiencing cost pressures for desalinated water energy
47
experiencing cost pressures for desalinated water, energyand labor
Footnotes
1. Calculated in accordance with National Instrument 43-101 as required by Canadian securities regulatory authorities. For abreakdown of reserves and resources by category and additional information relating to reserves and resources, see pages25-35 of Barrick’s Form 40-F.
2. C1 cash costs per pound and C3 fully allocated cash costs per pound are non-GAAP financial performance measures with no t d di d d fi iti d IFRS S 44 49 f B i k’ Thi d Q t 2013 R tstandardized definition under IFRS. See pages 44-49 of Barrick’s Third Quarter 2013 Report.
48


![PDF [2.50 MB]](https://static.fdocuments.in/doc/165x107/586a8b9d1a28ab123a8b9c0a/pdf-250-mb.jpg)