Pdf 2013 14 caper census
174
45 50 261 857 63 100 12689 U88989 089 89 7867 67678 890890 78 665 96 680 8907 689 5534 96 57 156154 845 5 64 846158 8907 65 656 75 867 8 908 9809 4794Y943 Y943Y9 028028474 479229 80909 89 367 9562 6782 83292 8362 5 382 2782 937 38 38792 723 02 4850 480 4980 890 904 60 540 3 3 3 2 3 3 8 8 8 1 1 1 1 3 3 3 3 12 12 12 4 4 3 3 2 16 16 16 1 1 2 2 2 3 3 3 3 2 14 14 14 2 2 2 2 3 11 11 11 3 3 3 2 2 13 13 12 1 1 1 1 1 1 5 5 5 13 13 12 11 11 1 61 61 60 1 103 107 59 41 35 3 1 349 348 1 346 3 3 3 3 2 3 3 8 8 8 1 1 1 1 3 3 3 3 12 12 12 4 4 3 3 2 16 16 16 1 1 2 2 2 3 3 3 3 2 14 14 14 2 2 2 2 3 11 11 11 3 3 3 2 2 13 13 12 1 1 1 1 1 1 5 5 5 13 13 12 11 11 1 61 61 60 1 103 107 59 41 35 3 1 349 348 1 346 3 2 2 13 13 12 1 1 1 1 1 1 5 5 5 13 13 12 11 11 1 61 61 60 1 103 107 59 41 35 3 1 349 348 1 346 3 75 79 064 20 379 07 590 3 2 8 48 05 856 40 672 90 46 892 34 04 04 90792 6 485 85 8 549 37 0 1 4 50 45 01 97 3 EDUCATION TRAINING HEALTH ÉTUDES FORMATION SANTÉ 758 64 26 12 03 13 015 23 12689 U88989 089 89 7867 67678 890890 78 665 96 680 8907 689 5534 96 57 156154 845 5 64 846158 8907 65 656 75 867 8 908 9809 4794Y943 Y943Y9 028028474 479229 80909 89 367 9562 6782 83292 8362 5 382 2782 937 38 38792 723 02 1103 1078 % + + 781 5413 9405540 466 0 1533 818 387 9 41 35 3 1 34 12689 U88989 089 89 7867 67678 890890 78 665 96 680 8907 689 5534 96 57 156154 845 5 64 846158 8907 65 656 75 867 8 908 9809 4794Y943 Y943Y9 028028474 479229 80909 89 367 9562 6782 83292 8362 5 382 2782 937 38 38792 723 02 8907 689 5534 96 57 028028474 479229 80909 8907 689 5534 96 57 { { 7 4 7 3 4 151 03 107 59 41 35 3 1 349 3 03 107 59 41 35 3 1 349 3 11 11 1 61 61 60 1 15 215 216 4451 52 8 6482 4612 6 12689 u88989 089 89 7867 67678 890890 78 665 96 680 8907 689 5534 96 57 156154 845 5 64 846158 8907 65 656 75 867 8 908 9809 4794y943 y943y9 TOTAL HEALTH SANTÉ EDUCATION ÉTUDES EDUCATION TRAINING HEALTH A 8 2 2 2 2 3 11 11 11 3 3 3 2 2 13 13 12 1 1 1 1 1 1 5 5 5 13 13 12 11 11 1 61 6 50 640 75 056 06 6890 780 9029 068 069066 7890 0 49 0463 0492 12689 U88989 089 89 7867 67678 890890 78 665 96 680 8907 689 5534 96 57 156154 845 5 64 846158 8907 65 656 75 867 8 908 9809 4794Y943 Y943Y9 028028474 479229 80909 89 367 9562 6782 83292 8362 5 382 2782 937 38 38792 723 02 8907 689 5534 96 57 028028474 479229 80909 8907 689 5534 96 5 12689 U88989 089 89 7867 67678 890890 78 665 96 680 8907 689 5534 96 57 156154 845 5 64 846158 8907 65 656 75 867 EDUCATION REGISTRY ENREGISTREMENT D’ÉDUCATION EDUCATION REGISTRY ENREGISTREMENT D’ÉDUCATION ÉTUDES FORMATION SANTÉ ANNUAL CENSUS OF POST-M.D. TRAINEES Recensement annuel des stagiaires post-M.D. CANADIAN POST-M.D. EDUCATION REGISTRY 13-14 2013 – 2014
description
Â
Transcript of Pdf 2013 14 caper census
45 50 261857 63 100
12689 U88989089 89 7867 67678
890890 78 665 96 6808907 689 5534 96 57
156154 845 5 64 8461588907 65 656 75 867 8 908
9809 4794Y943 Y943Y9028028474 479229 80909
89 367 9562 6782 83292 83625 382 2782 937 38 38792 723 02
4850 480 4980 890 904 60 540
3 3 32 3 3 8 8 81 1 1 13 3 3 3 12 12 124 4 3 3 2 16 16 161 1 2 2 23 3 3 3 2 14 14 142 2 2 2 3 11 11 113 3 3 2 2 13 13 12 11 1 1 1 1 5 5 513 13 12 11 11 1 61 61 60 1103 107 59 41 35 3 1 349 348 1 346 3
3 3 32 3 3 8 8 8
1 1 1 13 3 3 3 12 12 12
4 4 3 3 2 16 16 161 1 2 2 2
3 3 3 3 2 14 14 142 2 2 2 3 11 11 11
3 3 3 2 2 13 13 12 11 1 1 1 1 5 5 5
13 13 12 11 11 1 61 61 60 1103 107 59 41 35 3 1 349 348 1 346 3
2 2 13 13 12 11 1 1 1 1 5 5 5
13 13 12 11 11 1 61 61 60 1103 107 59 41 35 3 1 349 348 1 346 3
75 79 064 20 379 07 590 3 2 8
48 05 8
56 40 6
72 90 4
6
892 3
4 04 0
4 90792 6
4 8 5 8 5 8 5 4 9 3 7 0 1
4 5 0 4 5 0 1 9 7 3
EDUCATIONTRAINING
HEALTH ÉTUDESFORMATIONSANTÉ
758 64 26 12
03 13 015 23
12689 U88989089 89 7867 67678
890890 78 665 96 6808907 689 5534 96 57
156154 845 5 64 8461588907 65 656 75 867 8 908
9809 4794Y943 Y943Y9028028474 479229 80909
89 367 9562 6782 83292 83625 382 2782 937 38 38792 723 02
1103 1078
%+
+ 781 5413 9
405540 466
0 1533 8
18 387
9 41 3
5 3 1
34
12689 U88989
089 89 7867 67678
890890 78 665 96 680
8907 689 5534 96 57
156154 845 5 64 846158
8907 65 656 75 867 8 908
9809 4794Y943 Y943Y9
028028474 479229 80909
89 367 9562 6782 83292 8362
5 382 2782 937 38 38792 723 02
8907 689 5534 96 57
028028474 479229 80909
8907 689 5534 96 57
{ {7
4
7
3
4 15103 107 59 41 35 3 1 349 303 107 59 41 35 3 1 349 3
11 11 1 61 61 60 1
1 5 2 1 5 2 1 6
4 4 5 1 5 2 8
6 4 8 2 4 6 1 2 6
12689 u88989089 89 7867 67678890890 78 665 96 6808907 689 5534 96 57156154 845 5 64 8461588907 65 656 75 867 8 9089809 4794y943 y943y9
T O T A L
H E A L T H S A N T É
EDUCATIONÉTUDES
EDUCATIONTRAININGHEALTH
" " "" "
" "A
8
2 2 2 2 3 11 11 113 3 3 2 2 13 13 12 11 1 1 1 1 5 5 513 13 12 11 11 1 61 650 640 75 056 06 6890780 9029 068 0690667890 0 49 0463 0492
12689 U88989
089 89 7867 67678
890890 78 665 96 680
8907 689 5534 96 57
156154 845 5 64 846158
8907 65 656 75 867 8 908
9809 4794Y943 Y943Y9
028028474 479229 80909
89 367 9562 6782 83292 8362
5 382 2782 937 38 38792 723 02
8907 689 5534 96 57
028028474 479229 80909
8907 689 5534 96 5 12689 U88989
089 89 7867 67678
890890 78 665 96 680
8907 689 5534 96 57
156154 845 5 64 846158
8907 65 656 75 867
EDUCATION REGISTRY ENREGISTREMENT
D’ÉDUCATION
EDUCATION REGISTRY
ENREGISTREMENT D’ÉDUCATION
ÉTUDESFORMATION
SANTÉ
ANNUAL CENSUS OF POST-M.D. TRAINEESRecensement annuel des stagiaires post-M.D.
CANADIAN POST-M.D.EDUCATION REGISTRY
13-14
2013 – 2014
CAPER would like to acknowledge its contributors and thank them fortheir continued support.
The Association of Faculties of Medicine of Canada, Canadian Association of Internes and Residents, College of Family Physicians of Canada, Canadian Medical Association, Medical Council of Canada,
Royal College of Physicians and Surgeons of Canada, Health Canada, Newfoundland and Labrador Departmentof Health and Community Services, Prince Edward Island Department of Health, Nova Scotia Department
of Health, New Brunswick Department of Health, Ontario Ministry of Health and Long-Term Care, Manitoba Department of Health, Saskatchewan Department of Health, Alberta Department of Health
and Wellness, British Columbia Ministry of Health, Yukon Territory Department of Health and Social Services,Northwest Territories Department of Health and Social Services, Nunavut Department of Health
and Social Services
CAPER souhaite reconnaître la contribution des organismes suivantset les remercier de leur collaboration soutenue.
L’Association des facultés de médecine du Canada; l’Association canadienne des médecins résidents; le Collège des médecins de famille du Canada; l’Association médicale canadienne; le Conseil médical du
Canada; le Collège royal des médecins et chirurgiens du Canada; Santé Canada; le ministère de la Santé et desServices communautaires de Terre-Neuve-et-Labrador; le ministère de la Santé de l’Île-du-Prince-Édouard;
le ministère de la Santé de la Nouvelle-Écosse; le ministère de la Santé du Nouveau-Brunswick; le ministère de la Santé et des Soins de longue durée de l’Ontario; le ministère de la Santé du Manitoba;
le ministère de la Santé de la Saskatchewan; le ministère de la Santé et du Mieux-être de l’Alberta; le ministère de la Santé de la Colombie-Britannique; le ministère de la Santé et des Services sociaux du Yukon;
le ministère de la Santé et des Services sociaux des Territoires du Nord-Ouest; et le ministère de la Santé et des Services sociaux du Nunavut.
Canadian Post-M.D. Education Registry
Système informatisé sur les stagiaires post-M.D.en formation clinique
2013 – 2014ANNUAL CENSUS OF POST-M.D. TRAINEES
Recensement annuel des stagiaires post-M.D.
The Association of Faculties of Medicine of CanadaL’Association des facultés de médecine du Canada
265 avenue Carling Avenue, Suite/pièce 800Ottawa ON Canada K1S 2E1
Telephone/Téléphone: 613-730-1204Facsimile/Télécopie: 613-730-1196
E-mail/Courriel: [email protected] Site/Site Web: www.caper.ca
ISSN 1712-9184
AcknowledgementsWelcome to the 26th edition of the CAPER AnnualCensus of Post-M.D. Trainees. Today’s postgraduate medical residents are completing the final stage of theirinitial medical training. Soon they will serve our com-munities as family physicians, surgeons, pediatricians,internists, anesthetists, pathologists, and the many othermedical specialists who care for Canadians. The CAPERAnnual Census report is Canada’s definitive source of information on the numbers and types of physiciansbeing trained to meet our societal needs.
The Annual Census report is made possible through alongstanding partnership between governments, facul-ties of medicine and professional medical organizations.The federal, provincial and territorial governments listedon the inside of the front cover guide and financiallysupport CAPER. Guidance and financial support are also given by the Association of Faculties of Medicine ofCanada, Canadian Association of Internes and Residents,Canadian Medical Association, College of FamilyPhysicians of Canada, Medical Council of Canada andRoyal College of Physicians and Surgeons of Canada.CAPER is sincerely grateful for the stewardship and financial support of its contributing members.
Many individuals also need to be thanked for the timeand effort they give to CAPER. Members of CAPERsPolicy and Executive Committees provide guidancethrough their participation in annual meetings.
A sincere thank you is extended to CAPER dataproviders. Associate Deans, Managers and other staff inCanada’s postgraduate medical education offices submitand verify CAPER data files. The Ontario PhysicianHuman Resources Data Centre performs this work for all Ontario faculties of medicine. The time and effortgiven by data providers forms the cornerstone of theCAPER database.
Special thanks go to CAPER Database Manager, Mr. Leslie Forward, for working to a very high standard preparing the Annual Census report.
On behalf of CAPER, it is a pleasure working for ourparticipating members and clients in managing thisunique national resource.
Steve SladeVice President, Research and AnalysisCAPER/ORIS
RemerciementsVoici la 26e édition du Recensement annuel des stagiairespost-M.D. de CAPER. Les résidents postdoctoraux actuelsachèvent leur formation médicale initiale. Ils œuvreront bientôt au sein de nos communautés en tant que médecins de famille, chirurgiens, pédiatres, internistes, anesthésistes,pathologistes ou comme l’un des nombreux médecins spé-cialistes qui fournissent des soins aux Canadiens. Le rapportdu Recensement annuel de CAPER est la source définitived’information sur la quantité et les types de médecins en for-mation qui s’apprêtent à répondre à nos besoins sociétaux.
Le rapport du Recensement annuel est rendu possible grâceau partenariat de longue date entre les gouvernements, lesfacultés de médecine et les organisations médicales profes-sionnelles. Les gouvernements de niveau fédéral, provincial et territorial dont le nom se trouve à l’endos de la couvertureavant agissent à titre de guide et de subventionneur pourCAPER. Nous profitons également d’une orientation et d’une aide financière de la part de l’Association des facultésde médecine du Canada, de l’Association canadienne desmédecins résidents, du Conseil médical du Canada, duCollège des médecins de famille du Canada et du Collègeroyal des médecins et chirurgiens du Canada. CAPER reconnaît en toute sincérité le soutien et l’aide financière de ses membres adhérents.
Il faut également souligner le temps et l’effort que plusieurspersonnes consacrent à CAPER. Les membres du comité despolitiques et du conseil exécutif de CAPER agissent à titre deguide en participant aux réunions annuelles.
Un merci sincère aux fournisseurs de données de CAPER. Les doyens associés, les directeurs et les autres membres dupersonnel des bureaux de formation médicale postdoctorale à l’échelle du Canada soumettent et vérifient des fichiers dedonnées de CAPER. L’Ontario Physician Human Resources DataCentre s’attelle à cette tâche dans l’ensemble des facultés demédecine de l’Ontario. Le temps et l’effort qu’offrent les fournisseurs de données représentent la pierre angulaire de la base de données de CAPER.
Nous tenons à remercier tout particulièrement M. LeslieForward, gestionnaire de la base de données de CAPER, pour la très grande qualité de son travail en ce qui a trait à lapréparation du rapport sur le Recensement annuel.
Sachez que CAPER se fait un plaisir de collaborer avec sesmembres actifs et ses clients pour gérer notre ressource nationale unique.
Steve SladeVice-président, Recherche et analyseCAPER/ORI
iRecensement annuel des stagiaires post-M.D. | 2013-2014 | ANNUAL CENSUS OF POST-M.D. TRAINEES
Table of ContentsTable des matières
Table of Contents iThematic Table of Contents vFrequently Asked Questions xBackground 1Index to Abbreviations 2CAPER Policy Committee 2013-2014 3The Reporting Process 4How to Access the CAPER Data Tables 5Definitions 6Quick Facts, 2013-2014 11Data from the 2013-2014 CAPER Annual Census of Post-M.D. Trainees 24
A Faculty of Medicine Providing Post-M.D. Training 25
A-1 by Field of Post-M.D. Training 26A-1i by Field of Post-M.D. Training
(regular ministry funded trainees only) 29A-1ii by Field of Post-M.D. Training
(residents only – fellows not included) 32A-1iii by Field of Post-M.D. Training
(visa trainees not included) 35A-2 by Rank 38A-2i by Rank
(regular ministry funded trainees only) 38A-3 by Gender
(visa trainees not included) 39A-4 by Province of Location of University
Which Awarded the M.D. Degree 40A-4i by Province of Location of
University Which Awarded the M.D. Degree (visa trainees not included) 41
A-5 Clinician Investigator Program: by Field of Post-M.D. Training
43
B Field of Post-M.D. Training 45B-1 by Rank 46B-1i by Rank
(regular ministry funded trainees only) 48B-2 by Legal Status 50
C M.D. Degree 53C-1 Year M.D. Degree Received –
by Location of University Which Awarded the M.D. Degree 54
C-2 International Medical Graduates: Country Where M.D. Degree Was Awarded – by Legal Status and Rank 55
Tableau des MatièresTableau des Matières Thématique
Questions Souvent PoséesHistorique
Index des AbréviationsComité d’Orientation de CAPER 2013-2014
Procédure de CueilletteUtilisation de la Banque de Données de CAPER
DéfinitionsPoints Saillants, 2013-2014
Données Provenant du Recensement Annuel des Stagiaires Post-M.D. 2013-2014
Faculté de Médecine Offrant la Formation Post-M.D.
par Domaine de formation post-M.D.par Domaine de formation post-M.D. (seulement les stagiaires sub-
ventionnés par les fonds ministériels habituels)par Domaine de formation post-M.D.
(résidents seulement – les « fellows » ne sont pas compris)par Domaine de formation post-M.D. (les stagiaires
avec permis de travail ne sont pas compris)par Rang
par Rang (seulement les stagiaires subventionnés par les fonds ministériels habituels)
par Sexe (les stagiaires avec permis de travail ne sont pas compris)
par Province où est située l’université qui a décerné le diplôme M.D.
par Province où est située l’université qui a décerné le diplôme M.D.
(les stagiaires avec permis de travail ne sont pas compris)Programme de formation de cliniciens-chercheurs:
Domaine de formation post-M.D. par Faculté de médecine offrant la formation post-M.D.
Domaine de Formation Post-M.D.
par Rangpar Rang (seulement les stagiaires
subventionnés par les fonds ministériels habituels)par Statut légal
Diplôme M.D.
Année d’obtention du doctorat en médecine – par Lieu de l’université ayant décerné le
doctorat en médecine Diplômés des facultés de médecine étrangères :
Pays de l’université ayant décerné ledoctorat en médecine – par Statut légal et rang
ii CANADIAN POST-M.D. EDUCATION REGISTRY
D Source of Funding for Post-M.D. Training 59
D-1 by Legal Status Within Location of University Which Awarded the M.D. Degree 60
D-1i by Legal Status Within Location of University Which Awarded the M.D. Degree (residents only – fellows not included) 60
E Gender 61
Ei Age 61
F Legal Status 63F-1 Within Location of University
Which Awarded the M.D. Degree – by Rank 64F-2 by Province of Location of Faculty
of Medicine Providing Post-M.D. Training 65F-2i by Province of Location of Faculty
of Medicine Providing Post-M.D. Training (regular Ministry funded trainees only) 65
F-3 Field of Post-M.D. Training – by Province of Location of Faculty of Medicine Providing Post-M.D. Training (visa trainees only) 66
G First Year Trainees 69G-1 Field of Post-M.D. Training –
by Faculty of Medicine Providing Post-M.D. Training (first year trainees – visa trainees not included) 71
G-2 Table G-1 Summary 72G-3 Comparison of First Year Trainees
and R-1 Trainees 73G-4 Province of Location of Faculty of
Medicine Providing Post-M.D. Training – by Source of Funding for Post-M.D. Training (first year trainees only) 74
G-5 Legal Status – by Location of University Which Awarded the M.D. Degree (first year trainees only) 74
G-6 Field of Post-M.D. Training – by Gender (first year trainees only – visa trainees not included)
76
H Estimated Practice Entry Cohort77
H-1 Field of Post-M.D. Training of New Entry and Re-entry Groups – Graduates of Canadian Faculties of Medicine Who Exited at a Rank Level Consistent with Completion of Training Between Nov. 1, 2012 and Nov. 1, 2013 81
H-2 International Medical Graduates Who Exited at a Rank Level Consistent with Completion of Training Between Nov. 1, 2012 and Nov. 1, 2013 84
H-3 Summary Table 87H-4 Field of Post-M.D. Training – by Faculty
of Medicine Providing Post-M.D. Training (2013 estimated practice entry cohort) 88
Source de Financement pour la Formation Post-M.D.
par Statut légal dans les limites du lieu de l’université qui a décerné le diplôme M.D.par Statut légal dans les limites du lieu
de l’université qui a décerné le diplôme M.D. (résidents seulement – les « fellows » ne sont pas compris)
Sexe
Âge
Statut Légal
dans les limites du lieu de l’université qui a décerné le diplôme M.D. – par Rangpar Province où est située la faculté de médecine offrant la formation post-M.D.
par Province où est située la faculté de médecine offrant la formation post-M.D. (seulement les stagiaires
subventionnés par les fonds ministériels habituels)Domaine de formation post-M.D. – par Province où est
située la faculté de médecine offrant la formation post-M.D.(seulement les stagiaires avec permis de travail)
Stagiaires en Première Année Post-M.D.
Domaine de formation post-M.D. – par Faculté de médecine offrant la formation post-M.D. (stagiaires en première année –
les stagiaires avec permis de travail ne sont pas compris)Sommaire Tableau G-1
Comparaison entre les stagiaires en première année post-M.D. et ceux au niveau R-1
Province où est située la faculté de médecine offrant la formation post-M.D. – par Source de
financement pour la formation post-M.D. (stagiaires en première année post-M.D. seulement)
Statut légal – par Lieu où est située l’université qui a décerné le diplôme M.D. (stagiaires en première année post-M.D. seulement)
Domaine de formation post-M.D. – par Sexe (stagiaires en première année post-M.D. seulement – les stagiaires avec
permis de travail ne sont pas compris)
La Taille Approximative de la Cohorte qui Entre en Exercice
Domaine de formation post-M.D. des groupes de personnes admises et ré-admises – Diplômés des facultés de médecine
canadiennes ayant obtenu un diplôme conformément à l’achèvement de la formation entre le
1er novembre 2012 et le 1er novembre 2013Diplômés de facultés de médecine étrangères ayant obtenu undiplôme conformément à l’achèvement de la formation entre
le 1er novembre 2012 et le 1er novembre 2013Sommaire
Domaine de formation post-M.D. – par Faculté de médecine offrant la formation post-M.D. (la taille
approximative de la cohorte qui entre en exercice en 2013)
iiiRecensement annuel des stagiaires post-M.D. | 2013-2014 | ANNUAL CENSUS OF POST-M.D. TRAINEES
H-5 Summary Field of Post-M.D. Training – by Province of Location of Faculty of MedicineProviding Post-M.D. Training (2013 estimated practice entry cohort) 91
H-6 Field of Post-M.D. Training – by Average Age (2013 estimate practice entry cohort) 92
H-7 Field of Post-M.D. Training – by Gender (practice entry cohort) 93
H-8 Field of Post-M.D. Training – by Faculty of Medicine Providing Post-M.D. Training (return from practice cohort) 96
H-9 Year of Exit from Post-M.D. Training (1989-2013) – by Field of Post-M.D. Training (graduates of Canadian faculties of medicine) 98
H-9i Year of Exit from Post-M.D. Training (1989-2013) – by Field of Post-M.D. Training (Canadian citizens/permanent residents of Canada) 99
I Tables Covering the Time Period from 2009-2010 to 2013-2014 101
I-1 Field of Post-M.D. Training – by Source of Funding for Post-M.D. Training 102
I-2 Province of Location of Faculty of Medicine Providing Post-M.D. Training – by Source of Funding for Post-M.D. Training 107
I-2i Province of Location of Faculty of Medicine Providing Post-M.D. Training – by Source of Funding for Post-M.D. Training (fellows and visa trainees not included) 109
I-3 Field of Post-M.D. Training – by Gender (visa trainees not included) 111
I-4 Field of Post-M.D. Training – by Location of University Which Awarded the M.D. Degree 117
I-5 Faculty of Medicine Providing Post-M.D. Training – by Legal Status (residents only – fellows not included) 122
I-6 Faculty of Medicine Providing Post-M.D. Training – by M.D. Degree Awarded in the Province Providing Post-M.D. Training (current year Canadian M.D. graduates only) 124
I-7 Field of Post-M.D. Training – by Location of University Which Awarded the M.D. Degree(estimated practice entry cohort) 127
I-8 Field of Post-M.D. Training – by Gender (estimated practice entry cohort) 132
I-9 First Year Trainees, Field of Training – by Legal Status (Canadian citizens/permanent residents vs. visa trainees) 137
I-10 First Year Trainees: Proportion of First Year Trainees in Each Field of Training (Canadian citizens/permanent residents only)
139
Sommaire du domaine de formation post-M.D. – par Province où est située la faculté de médecine
offrant la formation post-M.D. (la taille approximative de la cohorte qui entre en exercice en 2013)
Domaine de formation post-M.D. – par Âge moyen (la taille approximative de la cohorte qui entre en exercice en 2013)
Domaine de formation post-M.D. – par Sexe (la taille de la cohorte qui entre en exercice)
Domaine de formation post-M.D. – par Faculté de médecine offrant la formation post-M.D.
(retour à pratique)La dernière année de formation post-M.D. (1989-2013) –
par Domaine de formation post-M.D. (diplômés des facultés de médecine canadiennes)
La dernière année de formation post-M.D. (1989-2013) – par Domaine de formation post-M.D.
(citoyens canadiens/résidents permanents au Canada)
Tableaux Couvrant la Période de 2009-2010 à 2013-2014
Domaine de formation post-M.D. – par Source de financement pour la formation post-M.D.
Province où est située la faculté de médecine offrant la formation post-M.D. – par Source de financement pour la formation post-M.D.
Province où est située la faculté de médecine offrant la formation post-M.D. – par Source de financement pour la formation post-M.D. (les « fellows » et les
stagiaires avec permis de travail ne sont pas compris)Domaine de formation post-M.D. – par Sexe
(les stagiaires avec permis de travail ne sont pas compris)Domaine de formation post-M.D. – par Lieu où est située l’université qui a décerné le diplôme M.D.
Faculté de médecine offrant la formation post-M.D. – par Statut légal (résidents seulement – les « fellows » ne sont pas compris)
Faculté de médecine offrant la formation post-M.D. – par Diplôme M.D. décerné dans la province offrant la formation post-M.D. (diplômés des
facultés canadiennes de l’année en cour seulement)Domaine de formation post-M.D. – par Lieu où est
située l’université qui a décerné le diplôme M.D. (la taille approximative de la cohorte qui entre en exercice)
Domaine de formation post-M.D. – par Sexe (la taille approximative de la cohorte qui entre en exercice)
Stagiaires en première année post-M.D., Domaine de formationpost-M.D. – par Statut légal (citoyens canadiens/résidents per-
manents vs les stagiaires avec permis de travail)Stagiaires en première année post-M.D. : Proportion
de stagiaires en première année post-M.D. dans chaque domaine de formation post-M.D.
(citoyens canadiens/résidents permanents seulement)
iv CANADIAN POST-M.D. EDUCATION REGISTRY
J Supplementary Data (includes information from CAPER as well as other data sources) 141
J-1 Faculty of Medicine Which Awarded the M.D. Degree (physicians who completed training In 2011) – by Practice Location (Region), July 2013 142
J-2 Faculty of Medicine Providing the Last Year of Post-M.D. Training (2011) – by Practice Location (Region), July 2013 144
J-2i Physicians Who Exited Post-M.D. Training in 2011 in the Same Province Which Had Awarded the M.D. Degree (Graduates of Canadian Faculties of Medicine) – Faculty of Medicine Providing the Last Year of Post-M.D. Training (2011) – by Practice Location (Region), July 2013 145
J-3 2yr Practice Location – Faculty of Medicine Providing the Last Year of Post-M.D. Training (2011) – by Practice Location (Province), July 2013 146
J-4 5yr Practice Location – Faculty of Medicine Providing the Last Year of Post-M.D. Training (2008) – by Practice Location (Province), July 2013 148
J-5 National Summary – 2013-14 Trainees Regular Ministry Funded – by Rank 150
J-5i National Summary – 2013-14 Trainees Other (Not Regular Ministry) Funded – by Rank 153
J-6 (AFMC, Table 18) – Students Enrolled in Faculties of Medicine – by Institution, Sex and Years to Graduation 156
J-7 (AFMC, Table 31) – M.D. Degrees Awarded by Canadian Universities – by Legal Status in Canada at Time of Entry to Medical School 157
J-8 The Number of Trainees Switching Between Major Training Field Categories for Each of the Last 5 Years 158
Données Supplémentaires (Renseignements provenant de CAPER ainsi que d’autres sources de données)
Faculté de médecine qui a décerné le diplôme M.D. (médecins ayant terminé leur formation post-M.D. en 2011) –
par Lieu de l’exercice (région), juillet 2013Faculté de médecine offrant la dernière année de formation post-M.D. (2011) –
par Lieu de l’exercice (région), juillet 2013Médecins ayant terminé leur formation post-M.D. en 2011 dans la même province que la faculté de médecine ayant
décerné leur diplôme (diplômés des facultés de médecine canadiennes) – Faculté de médecine offrant
la dernière année de formation post-M.D. (2011) – par Lieu de l’exercice (région), juillet 2013
Lieu de l’exercice après 2 ans – Faculté de médecine offrant ladernière année de formation post-M.D. (2011) – par Lieu de
l’exercice (province), juillet 2013Lieu de l’exercice après 5 ans – Faculté de médecine offrant ladernière année de formation post-M.D. (2008) – par Lieu de
l’exercice (province), juillet 2013Sommaire national – les stagiaires de 2013-14 subventionnés
par les fonds ministériels habituels – par RangSommaire national – les stagiaires de 2013-14
subventionnés par les autres – par Rang
(AFMC, Tableau 18) – Étudiants inscrits aux facultés de médecine – par Institution, sexe et le nombre
d’années avant l’obtention du diplôme M.D.(AFMC, Tableau 31) – Diplômes de doctorat en médecine (M.D.)
décernés par les universités canadiennes – by Statut légal au Canada au commencement des études en médecine
Nombre de stagiaires ayant opté pour une autre catégorie d’un domaine principal de formation médicale, à chacune des 5 dernières années
vRecensement annuel des stagiaires post-M.D. | 2013-2014 | ANNUAL CENSUS OF POST-M.D. TRAINEES
Thematic Table Of ContentsTable des matières thématique
Table of Contents iThematic Table of Contents vFrequently Asked Questions xBackground 1Index to Abbreviations 2CAPER Policy Committee 2013–2014 3The Reporting Process 4How to Access the CAPER Data Tables 5Definitions 6Quick Facts, 2013-2014 111. Quick Facts: Concerning Canadian Citizens/Permanent Residents 112. Quick Facts: Concerning Post-M.D. Trainees in Regular Ministry Funded Positions 173. Quick Facts: Concerning Non-Ministry Funded Post-M.D. Trainees 2004-2005 to 2013-2014
21Data from the 2013-2014 CAPER Annual Census of Post-M.D. Trainees 24
A. Faculty of Medicine Providing Post-M.D. Training 25by Field of Post-M.D. Training (Table A-1) 26by Field of Post-M.D. Training (regular ministry funded trainees only) (Table A-1i) 29by Field of Post-M.D. Training (residents only – fellows not included) (Table A-1ii) 32by Field of Post-M.D. Training (visa trainees not included) (Table A-1iii) 35by Rank (Table A-2) 38by Rank (regular ministry funded trainees only) (Table A-2i) 38by Gender (visa trainees not included) (Table A-3) 39by Province of Location of University Which Awarded the M.D. Degree (Table A-4) 40by Province of Location of UniversityWhich Awarded the M.D. Degree (visa trainees not included) (Table A-4i) 41Clinician Investigator Program:Field of Post-M.D. Training by Faculty of Medicine Providing Post-M.D. Training (Table A-5) 43
B. Field of Post-M.D. Training 45by Rank (Table B-1) 46by Rank (regular ministry funded trainees only) (Table B-1i) 48by Gender (visa trainees not included) (Table I-3) 111by Source of Funding for Post-M.D. Training (Table I-1) 102
Tableau des MatièresTableau des Matières Thématique
Questions Souvent PoséesHistorique
Index des AbréviationsComité D’Orientation de CAPER 2013–2014
Procédure de Cueillette Utilisation de la Banque de Données de CAPER
Définitions Points saillants, 2013-2014
1. Points saillants : concernant citoyencanadiens/résidents permanents
2. Points saillants : concernant les stagiaires subventionnés par les fonds ministériels habituels
3. Points saillants : concernant les stagiairesnon subventionnés par les fonds ministériels
habituels 2004-2005 à 2013-2014Données Provenant du Recensement Annuel
des Stagiaires Post-M.D. 2013-2014
Faculté de Médecine Offrant la Formation Post-M.D.
par Domaine de formation post-M.D. (tableau A-1)par Domaine de formation post-M.D. (seulement les stagiaires
subventionnés par les fonds ministériels habituels) (tableau A-1i)par Domaine de formation post-M.D. (résidents seulement –
les « fellows » ne sont pas compris) (tableau A-1ii)par Domaine de formation post-M.D. (les stagiaires avec permis de travail ne sont pas compris) (tableau A-1iii)
par Rang (tableau A-2)par Rang (seulement les stagiaires subventionnés par les fonds ministériels habituels) (tableau A-2i)
par Sexe (les stagiaires avec permis de travail ne sont pas compris) (tableau A-3)par Province où est située l’université qui a
décerné le diplôme M.D. (tableau A-4)par Province où est située l’université qui a décerné le diplôme M.D. (les stagiaires avec permis de travail
ne sont pas compris) (tableau A-4i)Programme de formation de cliniciens-chercheurs:
Domaine de formation post-M.D. par Faculté de médecine offrant la formation post-M.D. (tableau A-5)
Domaine de Formation Post-M.D.
par Rang (tableau B-1)par Rang (seulement les stagiaires subventionnés par les fonds ministériels habituels) (tableau B-1i)par Sexe (les stagiaires avec permis de travail
ne sont pas compris) (tableau I-3)par Source de financement pour la formation
post-M.D. (tableau I-1)
vi CANADIAN POST-M.D. EDUCATION REGISTRY
by Province of Location of Faculty of Medicine Providing Post-M.D. Training (Table A-1) 26by Province of Location of Faculty of Medicine Providing Post-M.D. Training (regular ministry funded trainees only) (Table A-1i) 29by Province of Location of Faculty of Medicine Providing Post-M.D. Training (residents only – fellows not included) (Table A-1ii) 32by Location of University Which Awarded the M.D. Degree (Table I-4) 117by Legal Status (Table B-2) 50
C. M.D. Degree 53Year M.D. Degree Received by Location of University Which Awarded the M.D. Degree (Table C-1) 54International Medical Graduates: Country Where M.D. Degree Was Awarded by Legal Status and Rank (Table C-2) 55Field of Post-M.D. Training by Location of University Which Awarded the M.D. Degree (Table I-4) 117Faculty of Medicine Providing Post-M.D. Trainingby Location of University Which Awarded the M.D. Degree (Table A-4) 40Faculty of Medicine Providing Post-M.D. Trainingby Location of University Which Awarded the M.D. Degree (visa trainees not included)(Table A-4i) 41Rank by Legal Status Within Location of University Which Awarded the M.D. Degree (Table F-1) 64Source of Funding for Post-M.D. Training by Legal Status Within Location of University Which Awarded the M.D. Degree (Table D-1) 60
D. Source of Funding for Post-M.D. Training 59by Rank (Tables A-2, A-2i) 38by Province of Location of Faculty of Medicine Providing Post-M.D. Training (Table I-2) 107by Field of Post-M.D. Training (Table I-1) 102by Legal Status Within Location of University Which Awarded the M.D. Degree (Table D-1) 60by Legal Status Within Location of University Which Awarded the M.D. Degree (residents only – fellows not included) (Table D-1i) 60
E. Gender 61by Faculty of Medicine Providing Post-M.D. Training (visa trainees not included) (Table A-3)
39by Field of Post-M.D. Training (visa trainees not included) (Table I-3) 111by Field of Post-M.D. Training (first year trainees only – visa trainees not included) (Table G-6)
76
par Province où est située la faculté de médecine offrant la formation post-M.D. (tableau A-1)
par Province où est située la faculté de médecine offrant la formation post-M.D. (seulement les stagiaires subventionnés par
les fonds ministériels habituels) (tableau A-1i)par Province où est située la faculté de médecine offrant
la formation post-M.D. (résidents seulement – les “fellows” ne sont pas compris) (tableau A-1ii)
par Lieu où est située l’université qui a décerné le diplôme M.D. (tableau I-4)
par Statut légal (tableau B-2)
Diplôme M.D.
Année d’obtention du doctorat en médecine par Lieu de l’université ayant décerné le
doctorat en médecine (tableau C-1)Diplômés des facultés de médecine étrangères : Pays de l’université ayant décerné le doctorat en médecine par Statut légal et rang (tableau C-2)
Domaine de formation post-M.D. par Lieu de l’université ayant décerné le doctorat en médecine (tableau I-4)Faculté de médecine offrant la formation post-M.D.
par Lieu de l’université ayant décerné le doctorat en médecine (tableau A-4)
Faculté de médecine offrant la formation post-M.D. par Lieu de l’université ayant décerné le
doctorat en médecine (stagiaires avec permis de travail ne sont pas compris) (tableau A-4i)
Rang par Statut légal dans les limites du lieu de l’université ayantdécerné le doctorat en médecine (tableau F-1)
Source de financement de la formation post-M.D. par Statut légal dans les limites du lieu de l’université ayant décerné le doctorat en médecine (tableau D-1)
Source de Financement pour la Formation Post-M.D.
par Rang (tableaux A-2, A-2i)par Province où est située la faculté de médecine
offrant la formation post-M.D. (tableau I-2)par Domaine de formation post-M.D. (tableau I-1)
par Statut légal dans les limites du lieu de l’université qui a décerné le diplôme M.D. (tableau D-1)
par Statut légal dans les limites du lieu de l’université qui a décerné le diplôme M.D. (résidents seulement –
les “fellows” ne sont pas compris) (tableau D-1i)
Sexe
par Faculté de médecine offrant la formation post-M.D. (les stagiaires avec permis de travail ne sont pas compris)
(tableau A-3)par Domaine de formation post-M.D. (les stagiaires avec
permis de travail ne sont pas compris) (tableau I-3)par Domaine de formation post-M.D. (stagiaires en première
année post-M.D. seulement – les stagiaires avec permis de travail ne sont pas compris) (tableau G-6)
viiRecensement annuel des stagiaires post-M.D. | 2013-2014 | ANNUAL CENSUS OF POST-M.D. TRAINEES
by Field of Post-M.D. Training (practice entry cohort) (Table H-7) 93
E.i. Age 61Field of Post-M.D. Training by Average Age (practice entry cohort) (Table H-6) 92
F. Legal Status 63by Field of Post-M.D. Training (Table B-2) 50Within Location of University Which Awarded the M.D. Degree by Rank (Table F-1) 64Within Location of University Which Awarded the M.D. Degree by Source of Funding for Post-M.D. Training (Table D-1) 60by Province of Location of Faculty of Medicine Providing Post-M.D. Training (Table F-2) 65by Province of Location of Faculty of Medicine Providing Post-M.D. Training (regular ministry funded trainees only) (Table F-2i) 65Field of Post-M.D. Training by Province of Location of Faculty of Medicine Providing Post-M.D. Training (visa trainees only) (Table F-3) 66by Field of Training (first year trainees only, 2009-2013) (Table I-9) 137
G. First Year Trainees 69Field of Post-M.D. Training by Faculty of Medicine Providing Post-M.D. Training (first year trainees – visa trainees not included) (Table G-1) 71Table 1 Summary (Table G-2) 72Comparison of First Year Trainees and R 1 Trainees (Table G-3) 73Province of Location of Faculty of Medicine Providing Post-M.D. Training by Source of Funding for Post-M.D. Training (first year trainees only) (Table G-4) 74Legal Status by Location of University Which Awarded the M.D. Degree (first year trainees only) (Table G-5) 74Field of Post-M.D. Training by Gender (first year trainees only – visa trainees not included) (Table G-6) 76Field of Training (first year trainees only, 2009-2013) by Legal Status (Table I-9) 137
H. Estimated Practice Entry Cohort77
Field of Post-M.D. Training of New Entry and Re-entry Groups – Graduates of Canadian Faculties of Medicine Who Exited at a Rank Level Consistent with Completion of Training Between Nov. 1, 2012 and Nov. 1, 2013 (Table H-1) 81International Medical Graduates Who Exited at a Rank Level Consistent with Completion of Training Between Nov. 1, 2012 and Nov. 1, 2013 (Table H-2) 84
par Domaine de formation post-M.D. (cohorte entrant en exercice) (tableau H-7)
Âge
Domaine de formation post-M.D. par Âge moyen (cohorte entrant en exercice) (tableau H-6)
Statut Légal
par Domaine de formation post-M.D. (tableau B-2)Dans les limites du lieu de l’université qui a
décerné le diplôme M.D. par Rang (tableau F-1)Dans les limites du lieu de l’université qui a décerné
le diplôme M.D. par Source de financement pour la formation post-M.D. (tableau D-1)
par Province où est située la faculté de médecine offrant la formation post-M.D. (tableau F-2)
par Province où est située la faculté de médecine offrant la formation post-M.D. (seulement les stagiaires subventionnés
par les fonds ministériels habituels) (tableau F-2i)Domaine de formation post-M.D. par Province où est
située la faculté de médecine offrant la formation post-M.D. (seulement les stagiaires avec permis de travail) (tableau F-3)
Domaine de formation post-M.D. (stagiaires en première année seulement – 2009-2013) (tableau I-9)
Stagiaires en Première Année Post-M.D.
Domaine de formation post-M.D. par Faculté de médecine offrant la formation post-M.D. (stagiaires en première année – les
stagiaires avec permis de travail ne sont pas compris) (tableau G-1)Sommaire – tableau 1 (tableau G-2)
Comparaison entre les stagiaires en première année post-M.D. et ceux au niveau R 1 (tableau G-3)Province où est située la faculté de médecine offrant la formation post-M.D. par Source de
financement pour la formation post-M.D. (stagiaires en première année post-M.D. seulement) (tableau G-4)
Statut légal par Lieu où est située l’université qui a décerné le diplôme M.D. (stagiaires en
première année post-M.D. seulement) (tableau G-5)Domaine de formation post-M.D. par Sexe
(stagiaires en première année post-M.D. seulement – les stagiairesavec permis de travail ne sont pas compris) (tableau G-6)
Domaine de formation post-M.D. par Statut légal (stagiaires en première année post-M.D. seulement, 2009-2013) (tableau I-9)
La Taille Approximative de la Cohorte qui Entre en Exercice
Domaine de formation post-M.D. des groupes de personnes admises et ré-admises – Diplômés des facultés de médecine
canadiennes ayant obtenu un diplôme conformément à l’achèvement de la formation entre le 1er novembre 2012
et le 1er novembre 2013 (tableau H-1)Les diplômés des facultés de médecine étrangères ayant obtenu un diplôme conformément à l’achèvement de la formation entre le
1er novembre 2012 et le 1er novembre 2013 (tableau H-2)
viii CANADIAN POST-M.D. EDUCATION REGISTRY
Summary Table (Table H-3) 87Field of Post-M.D. Training by Faculty of Medicine Providing Post-M.D. Training (2013 estimated practice entry cohort) (Table H-4) 88Summary Field of Post-M.D. Training by Province of Location of Faculty of Medicine Providing Post-M.D. Training (2013 estimated practice entry cohort) (Table H-5) 91Field of Post-M.D. Training by Average Age (2013 estimated practice entry cohort) (Table H-6) 92Field of Post-M.D. Training by Location of University Which Awarded the M.D. Degree (estimated practice entry cohort) (Table I-7) 127Field of Post-M.D. Training by Gender (practice entry cohort) (Table H-7) 93Field of Post-M.D. Training by Faculty of Medicine Providing Post-M.D. Training (return from practice cohort) (Table H-8) 96Year of Exit from Post-M.D. Training (1989-2013) by Field of Post-M.D. Training (graduates of Canadian faculties of medicine) (Table H-9) 98Year of Exit from Post-M.D. Training (1989-2013)by Field of Post-M.D. Training (Canadian citizens/permanent residents of Canada) (Table H-9i) 99
I. Tables Covering the Time Period From 2009-2010 to 2013-2014 101Field of Post-M.D. Training by Source of Funding for Post-M.D. Training (Table I-1) 102Province of Location of Faculty of Medicine Providing Post-M.D. Training by Source of Funding for Post-M.D. Training (Table I-2) 107Province of Location of Faculty of Medicine Providing Post-M.D. Training by Source of Funding for Post-M.D. Training (fellows and visa trainees not included) (Table I-2i) 109Field of Post-M.D. Training by Gender (visa trainees not included) (Table I-3) 111Field of Post-M.D. Training by Location of University Which Awarded the M.D. Degree (Table I-4) 117Faculty of Medicine Providing Post-M.D. Training by Legal Status (residents only – fellows not included) (Table I-5) 122Faculty of Medicine Providing Post-M.D. Training by M.D. Degree Awarded in the Province Providing Post-M.D. Training (current year Canadian M.D. graduates only) (Table I-6) 124Field of Post-M.D. Training by Location of University Which Awarded the M.D. Degree (estimated practice entry cohort) (Table I-7) 127Field of Post-M.D. Training by Gender (estimated practice entry cohort) (Table I-8) 132First Year Trainees, Field of Training by Legal Status (Canadian citizens/permanent residents vs. visa trainees) (Table I-9) 137
Sommaire (tableau H-3)Domaine de formation post-M.D. par Faculté de médecine
offrant la formation post-M.D. (la taille approximative de la cohorte qui entre en exercice en 2013) (tableau H-4)Sommaire du domaine de formation post-M.D. par Province
où est située la faculté de médecine offrant la formation post-M.D. (la taille approximative de la cohorte qui
entre en exercice en 2013) (tableau H-5)Domaine de formation post-M.D. par Âge moyen (la taille approxi-mative de la cohorte qui entre en exercice en 2013) (tableau H-6)
Domaine de formation post-M.D. par Lieu où est située l’université qui a décerné le diplôme M.D. (la taille
approximative de la cohorte qui entre en exercice) (tableau I-7)Domaine de formation post-M.D. par Sexe
(cohorte qui entre en exercice) (tableau H-7) Domaine de formation post-M.D. par Faculté de
médecine offrant la formation post-M.D. (retour à pratique) (tableau H-8)
La dernière année de formation post-M.D. (1989-2013) par Domaine de formation post-M.D. (diplômés des facultés de
médecine canadiennes) (tableau H-9) La dernière année de formation post-M.D. (1989-2013)
par Domaine de formation post-M.D. (citoyens canadiens/résidents permanents au Canada) (tableau H-9i)
Tableaux Couvrant la Période de 2009-2010 à 2013-2014
Domaine de formation post-M.D. par Source de financement pour la formation post-M.D. (tableau I-1)
Province où est située la faculté de médecine offrant la formation post-M.D. par Source de
financement pour la formation post-M.D. (tableau I-2)Province où est située la faculté de médecine offrant la formation post-M.D. par Source de financement
pour la formation post-M.D. (les “fellows” et les stagiaires avec permis de travail ne sont pas compris) (tableau I-2i) Domaine de formation post-M.D. par Sexe (les stagiaires avec permis de travail ne sont pas compris) (tableau I-3)
Domaine de formation post-M.D. par Lieu où est située l’université qui a décerné le diplôme M.D. (tableau I-4)
Faculté de médecine offrant la formation post-M.D. par Statut légal (résidents seulement –
les “fellows” ne sont pas compris) (tableau I-5)Faculté de médecine offrant la formation post-M.D.
par Diplôme M.D. décerné dans la province offrant la formation post-M.D. (diplômés des facultés canadiennes
de l’année en cours seulement) (tableau I-6)Domaine de formation post-M.D. par Lieu où est située
l’université qui a décerné le diplôme M.D. (la taille approximative dela cohorte qui entre en exercice) (tableau I-7)
Domaine de formation post-M.D. par Sexe (la taille approximativede la cohorte qui entre en exercice) (tableau I-8)
Stagiaires en première année post-M.D., domaine de formationpost-M.D. par Statut légal (citoyens canadiens/résidents
permanents vs les stagiaires avec permis de travail) (tableau I-9)
ixRecensement annuel des stagiaires post-M.D. | 2013-2014 | ANNUAL CENSUS OF POST-M.D. TRAINEES
First Year Trainees: Proportion of First Year Trainees in Each Field of Training (Canadian citizens/permanent residents only) (Table I-10) 139
J. Supplementary Data 141(Includes information from CAPER as well as other data sources)
Source: CMA/AMCPractice LocationFaculty of Medicine Which Awarded the M.D. Degree (Physicians who completed training in 2011) by Practice Location (Region), July 2013 (Table J-1) 142Faculty of Medicine Providing the Last Year of Post-M.D. Training (2011) by Practice Location (Region), July 2013 (Table J-2) 144Physicians Who Exited Post-M.D. Training in 2011 in the Same Province Which Had Awarded the M.D. Degree (Graduates of Canadian Faculties of Medicine) – Faculty of Medicine Providing the Last Year of Post-M.D. Training (2011) by Practice Location (Region), July 2013 (Table J-2i) 1452yr Practice Location – Faculty of Medicine Providing the Last Year of Post-M.D. Training (2011) by Practice Location (Province), July 2013 (Table J-3) 1465yr Practice Location – Faculty of Medicine Providing the Last Year of Post-M.D. Training (2008) by Practice Location (Province), July 2013 (Table J-4) 148
Source: CAPERNational Summary – 2013-14 Trainees Regular Ministry Funded Program by Rank (Table J-5) 150National Summary – 2013-14 Trainees Other (Not Regular Ministry) Funded Program by Rank (Table J-5i) 153
Source: AFMC[AFMC, Table 18] Students Enrolled in Faculties of Medicine by Institution, Sex and Years to Graduation (Table J-6) 156[AFMC, Table 31]M.D. Degrees Awarded by Canadian Universities by Legal Status in Canada at Time of Entry to Medical School (Table J-7) 157
Source: CAPERThe Number of Trainees Switching Between Major Training Field Categories for Each of the Last 5 Years (Table J-8) 158
Stagiaires en première année post-M.D.: Proportion de stagiaires en première année post-M.D. dans chaque domaine de formation post-M.D. (citoyens
canadiens/résidents permanents seulement) (tableau I-10)
Données Supplémentaires
(Renseignements provenant de CAPER ainsi que d’autres sources de données)
SLieu de l’exercice
Faculté de médecine qui a décerné le diplôme M.D. (médecins ayant terminé leur formation post-M.D.
en 2011) par Lieu de l’exercice (région), juillet 2013 (tableau J-1)
Faculté de médecine offrant la dernière année de formation post-M.D. (2011)
par Lieu de l’exercice (région), juillet 2013 (tableau J-2)Médecins ayant terminé leur formation post-M.D.
en 2011 dans la même province que la faculté de médecine ayant décerné leur diplôme (diplômés des facultés de médecine canadiennes) – Faculté de médecine offrant
la dernière année de formation post-M.D. (2011) par Lieu de l’exercice (région), juillet 2013 (tableau J-2i)Lieu de l’exercice après 2 ans – Faculté de médecine offrant la dernière année de formation post-M.D. (2011)
par Lieu de l’exercice (province), juillet 2013 (tableau J-3) Lieu de l’exercice après 5 ans – Faculté de médecine
offrant la dernière année de formation post-M.D. (2008) par Lieu de l’exercice (province), juillet 2013 (tableau J-4)
SSommaire national – les stagiaires de 2013-14 subventionnés par
les fonds ministériels habituels Programme – par Rang (tableau J-5)Sommaire national – les stagiaires de 2013-14 subventionnés
par les autres (pas ministériels habituels) fonds Programme – par Rang (tableau J-5i)
S[AFMC, tableau 18] Étudiants inscrits aux facultés de médecine
canadiennes par Institution, sexe et le nombre d’années avant l’obtention du diplôme M.D. (tableau J-6)[AFMC, tableau 31] Diplômes de doctorat en médecine (MD) décernés par les universités canadiennes par Statut légal au Canada au
commencement des études en médecine (tableau J-7)
SNombre de stagiaires ayant opté pour une autre
catégorie d’un domaine principal de formation médicale, à chacune des 5 dernières années (tableau J-8)
x CANADIAN POST-M.D. EDUCATION REGISTRY
Use the CAPER database to answer these frequently asked questions:
Utiliser la base de données du CAPER pour trouver ces renseignements sur des questions souvent posées :
1. Where do I find a summary of changes in the post-M.D. training population over the last 10 years?
2. How many ministry funded residents are in a specific specialty at each faculty?
3. How many ministry funded residents are there at each rank level?
4. How many new residents enteredtraining in each specialty this year?
5. What is the gender of residents entering each specialty?
6. How many new physicians completed and exited fromCanadian residency training?
7. How old are Canada’s new physicians when they finish training?
8. What is the gender of the newphysicians who completed and exited from Canadian residencytraining?
9. Where do the M.D. graduates ofmy faculty (province) eventuallygo to practise medicine?
10.Where do the post-M.D. traineesfrom my faculty (province) eventually go to practise medicine?
11.Individual training fields – detailed information (the numberof residents and fellows at eachrank level at each faculty)
Où puis-je trouver un résumé des changements qu’ont connus les stagiairespost-M. D. en formation clinique, au coursdes dix dernières années ?
Combien de stagiaires ayant droit à unebourse ministérielle trouve-t-on, pour une spécialité donnée, dans chaque faculté ?
Combien de médecins résidents bénéficiantd’une bourse ministérielle trouve-t-on, àchaque niveau de formation?
Pour chaque spécialité, quel est le nombre de médecins qui ont commencé leur résidence cette année?
Pour chaque spécialité, de quel sexe sont lesmédecins qui commencent leur résidence?
Combien de nouveaux médecins ont fait toute leur résidence en suivant le programmecanadien de formation clinique?
À quel âge les nouveaux médecins terminent-ils le programme canadien de formation clinique?
De quel sexe sont les nouveaux médecins quiont fait toute leur résidence en suivant le programme canadien de formation clinique?
Où les diplômés en médecine (M.D.) de mafaculté (province) entrent-ils généralement en pratique?
Où les stagiaires post-M.D. de ma faculté(province) entrent-ils généralement en pratique?
Tableaux individuels des spécialités –Renseignements détaillés (nombre de résidents et de stagiaires inscrits, à chaqueniveau de formation et pour chaque faculté).
Quick FactsEn bref!
Table A-1iTableau A-1i
Table B-1iTableau B-1i
Table G-1Tableau G-1
Table G-6Tableau G-6
Table H-4Tableau H-4
Table H-6Tableau H-6
Table H-7Tableau H-7
Table J-2Tableau J-2
Table J-2iTableau J-2i
IndividualSpecialtyTablesTableaux individuelsdes spécialités
pages 11-23
page 29
page 48
page 71
page 76
page 88
page 92
page 93
page144
page145
1Recensement annuel des stagiaires post-M.D. | 2013-2014 | ANNUAL CENSUS OF POST-M.D. TRAINEES
BackgroundHistorique
CAPER (the Canadian Post-M.D. EducationRegistry) was established in 1986 through the co-operation of national medical organizations withan interest in the post-M.D. clinical education ofphysicians in Canada. The Association of Facultiesof Medicine of Canada, the Canadian Association of Internes and Residents, the Canadian MedicalAssociation, the College of Family Physicians ofCanada, the Medical Council of Canada, HealthCanada, and the Royal College of Physicians andSurgeons of Canada, have provided both expertiseand financial support for the development and operation of CAPER. Provincial and territorial ministries of Health have contributed to CAPERsince 1992.
CAPER is incorporated within the by-laws of The Association of Faculties of Medicine of Canadawith the mandate to provide accurate informationwhich may be used for medical manpower planningon a national basis. To accomplish this task, an in-dividual longitudinal file is maintained containingsocio-demographic information and details of thecurrent and past training programs of each residentor fellow under the supervision of the CanadianFaculties of Medicine on November 1 of each year.The data in this document are derived from infor-mation submitted for November 1, 2013 by theoffice of Postgraduate Medical Education at each ofthe Canadian Faculties of Medicine.
CAPER (Système informatisé sur les stagiaires post-M.D.en formation clinique) a été établi en 1986 avec lacoopération de diverses organisations médicales duCanada intéressées par la formation clinique post-M.D.au Canada. L’Association des facultés de médecine duCanada, l’Association canadienne des médecins rési-dents, l’Association médicale canadienne, le Collège desmédecins de famille du Canada, Le Conseil médical duCanada, Santé Canada, ainsi que le Collège royal desmédecins et chirurgiens du Canada ont contribué audéveloppement et au bon fonctionnement de CAPER en partageant leurs connaissances et en lui apportant un soutien financier. Les Ministères de la Santé desprovinces et des territoires ont contribués depuis 1992.
CAPER est constitué en société dans le cadre des statutsde L’Association des facultés de médecine du Canadaavec pour mandat de fournir des renseignements précispouvant être utilisés pour fins de planification de lamain-d’œuvre médicale au niveau national. Pour cefaire, un fichier longitudinal est tenu à jour contenantl’information pertinente à chaque résident ou moniteurclinique (fellow) inscrit aux différentes facultés demédecine canadiennes en date du 1er novembre dechaque année. L’information socio-démographique et les détails du programme de formation de cette année et des années passées y sont inclus. Les donnéesde ce document reflètent l’information soumise au 1er novembre 2013 par le personnel administratif desbureaux de formation médicale postdoctorale des facultés de médecine canadiennes.
2 CANADIAN POST-M.D. EDUCATION REGISTRY
Index of AbbreviationsIndex des abréviations
AFMC The Association of Faculties of Medicineof Canada
ACAHO Association of Canadian HealthcareOrganizations
CAIR Canadian Association of Internes andResidents
CAPER Canadian Post-M.D. Education Registry
CaRMS Canadian Resident Matching Service
CFMS Canadian Federation of Medical Students
CFPC College of Family Physicians of Canada
CMA Canadian Medical Association
CMQ Collège des médecins du Québec
FMRAC The Federation of Medical RegulatoryAuthorities of Canada
FMRQ Fédération des médecins résidents du Québec
Health CanHealth Canada
MCC Medical Council of Canada
Prov./Terr. Health MinistriesProvincial and Territorial Ministries of Health
RCPSC Royal College of Physicians and Surgeons of Canada
AFMC L’Association des facultés de médecine du Canada
ACISU Représentant de l’Association des organismes canadiens d’enseignement des soins de santé
ACMR Association canadienne des médecins résidents
CAPER Système informatisé sur les stagiaires post-M.D. en formation clinique
SCJR Service canadien de jumelage des résidents
FEMC La Fédération des étudiants en médecine du Canada
CMFC Collège des médecins de famille du Canada
AMC Association médicale canadienne
CMQ Collège des médecins du Québec
FMRAC La Fédération des ordres des médecins du Canada
FMRQ Fédération des médecins résidents du Québec
Santé CanSanté Canada
CMC Le Conseil médical du Canada
Min. Santé prov. et terr.Ministères de la Santé des provinces et des territoires
CRMCC Collège royal des médecins et chirurgiens du Canada
3Recensement annuel des stagiaires post-M.D. | 2013-2014 | ANNUAL CENSUS OF POST-M.D. TRAINEES
CAPER Policy Committee (2013–2014)Comité D’Orientation de CAPER (2013–2014)
Chair / PrésidentDr. Sal Spadafora
The Association of Faculties of Medicine of CanadaL’Association des facultés de médecine du Canada
Members / Membres
Dr. James RourkeThe Association of Faculties of Medicine of CanadaL’Association des facultés de médecine du Canada
Dr. Serge LangevinThe Association of Faculties of Medicine of CanadaL’Association des facultés de médecine du Canada
Dr. Ramona KearneyThe Association of Faculties of Medicine of CanadaL’Association des facultés de médecine du Canada
Dr. Jasmine PawaCanadian Association of Internes and ResidentsAssociation canadienne des médecins résidents
Mr. Jesse KancirCanadian Federation of Medical StudentsLa Fédération des étudiants en médecine du Canada
Ms. Lynda BuskeCanadian Medical AssociationAssociation médicale du Canada
Dr. Eric WongCollege of Family Physicians of CanadaCollège des médecins de famille du Canada
Ms. Anne-Marie MacLellanCollège des médecins du Québec
Dr. Fleur-Ange LefebvreFederation of Medical Regulatory Authorities of CanadaFédération des ordres des médecins du Canada
TBAHealth CanadaSanté Canada
Dr. Ian BowmerMedical Council of CanadaConseil médical du Canada
Mr. Jeff GoodyearProvincial and Territorial Ministries of HealthMinistères de la Santé des provinces et territoires
Ms. Lynda CampbellProvincial and Territorial Ministries of HealthMinistères de la Santé des provinces et territoires
Mr. David Choy/Mr. Rhys DaviesProvincial and Territorial Ministries of HealthMinistères de la Santé des provinces et territoires
Dr. Jolanta KarpinskiRoyal College of Physicians and Surgeons of CanadaCollège royal des médecins et chirurgiens du Canada
Dr. Joseph DahineFédération des médecins résidents du Québec
Mr. Geoff BallingerCanadian Institute for Health InformationInstitut canadien d’information sur la Santé
Ex-officio Member / Membre D’Office
Mr. Steve SladeVice President, Research and Analysis: CAPER/ORIS / Vice-président à la recherche et analyse : CAPER/ORI
Previous Chairmen of CAPER / Présidents sortants de CAPER
1986 – 87 Dr. Robert H. Sheppard1987 – 88 Dr. Jean-Pierre DesGroseilliers1988 – 95 Dr. George Goldsand1995 – 97 Dr. Lucinda Whitman
1997 – 04 Dr. William Wrixon2004 – 07 Dr. Jill Nation 2007 – 09 Dr. Kristin Sivertz
4 CANADIAN POST-M.D. EDUCATION REGISTRY
The Reporting ProcessMéthode de déclaration
The individual records of all trainees under the supervision of each Canadian faculty of medicineare provided to CAPER by the postgraduate medicaleducation office of the respective faculty. All post-M.D. trainees (residents and fellows) in training positions on November 1 of the current academicyear are reported to CAPER. The following information is included in the yearly report:
• the faculty of medicine supervising post-M.D. training
• socio-demographic information
• previous medical education and certification, and
• field of current post-M.D. training
This information is collected by all faculties at thetime of registration for post-M.D. training each yearand is sent to CAPER, in coded form. Informationsent to CAPER is checked for missing or incorrectitems. Reports are then sent back to the appropriatepostgraduate medical education office of theCanadian faculties of medicine for further verification of the information on their trainees.
Data Privacy
At the Canadian Post-M.D. Education Registry(CAPER), we take physician privacy very seriously.It is a long-established policy of CAPER and theAssociation of Faculties of Medicine of Canada(AFMC), of which Association CAPER is a compo-nent division, to deal with all physician informationin a sensitive manner, in order to ensure that ourcollections, uses, disclosures, retention and disposalof physician information are carried out in accordance with best privacy practices.
The full CAPER Privacy Policy is on the website:caper.ca.
Le bureau de la formation médicale postdoctorale de chaque faculté de médecine canadienne fournit àCAPER les dossiers de tous les stagiaires qui relèvent de la faculté. Sont déclarés à CAPER tous les stagiairespost-M.D. (résidents et moniteurs cliniques) qui occu-pent un poste de formation le 1er novembre de l’annéeuniversitaire en cours. La déclaration annuelle comprend les renseignements suivants :
• la faculté de médecine qui encadre la formation post-M.D.,
• des données sociodémographiques,
• la formation médicale antérieure et les titres de compétence,
• le domaine de la formation post-M.D. en cours
Ces renseignements sont recueillis chaque année partoutes les facultés lors des inscriptions aux programmesde formation post-M.D., puis transmis à CAPER sousforme chiffrée. CAPER les vérifie pour déceler les erreursou omissions, puis renvoie les déclarations au bureau de la formation médicale postdoctorale de la faculté de médecine en question. Les renseignements sur lesstagiaires font alors l’objet d’une nouvelle vérification.
Confidentialité des données
Le Système informatisé sur les stagiaires post- M.D. enformation clinique (CAPER) prend très au sérieux laconfidentialité des renseignements concernant lesmédecins. CAPER et l’Association des facultés demédecine du Canada (AFMC), dont CAPER est une division, s’emploient de longue date à appliquer unepolitique des plus à jour sur la protection des renseigne-ments personnels concernant les médecins, de façon à ce que les activités de collecte, d’utilisation, de divulgation, de conservation et d’élimination desditsrenseignements respectent les règles de l’art en la matière.
La confidentialité des données de CAPER se trouve au complet sur le site Web : caper.ca.
5Recensement annuel des stagiaires post-M.D. | 2013-2014 | ANNUAL CENSUS OF POST-M.D. TRAINEES
How to Access the CAPER Data TablesUtilisation de la banque de données de CAPER
The CAPER data tables are available on the CAPERwebsite www.caper.ca.
A hard copy of CAPER Annual Census of Post-M.D.Trainees is available upon request. Be sure to use the website to access the information you need. The CAPER Annual Census of Post-M.D. Trainees, theCAPER Provincial Reports, and the CAPER IndividualSpecialty Tables can be found at www.caper.ca.
The CAPER database has been designed to serve as an information resource for physician workforceplanning on a national and provincial or regionalbasis in Canada. Information is held in an individ-ual longitudinal format to permit the study of theflow of trainees through the post-M.D. training system. Although information permitting the identification of individuals is not released fromCAPER, group data tabulations and statistics will be prepared in response to requests. Preparationwill be on a cost-recovery basis.
Data requests made to CAPER are welcome.
Les tableaux de données de CAPER sont disponible surle site Web à www.caper.ca.
L’Annuaire de recensement de CAPER des stagiaires post-M.D. en formation clinique est disponible sur demande. Veuillez désormais utiliser le site Web pourobtenir des informations. Les Rapports provinciaux sur les stagiaires post-M. D. en formation clinique, ainsi que les Tableaux individuels des spécialités sont disponible àwww.caper.ca.
La base de données de CAPER fut conçue commesource d’information pour la planification de la maind’œuvre médicale au niveau national et provincial ou régional. L’information est cueillie sous forme de ficheslongitudinales individuelles afin de pouvoir obtenir unvue d’ensemble des stagiaires inscrits à la formationpost-M.D. Bien que CAPER ne divulgue aucun ren-seignement permettant d’identifier des individus, destableaux et des statistiques de groupe peuvent être pré-parés sur demande. Ce service est offert à prixcoûtant.
Toutes demandes de statistiques faites auprès de CAPERseront les bienvenues.
6 CANADIAN POST-M.D. EDUCATION REGISTRY
DefinitionsDéfinitions
The data provided to CAPER by all the CanadianFaculties of medicine contain the information on each trainee in accordance with definitions established by CAPER. Following are these defini-tions and other important details pertaining to thespecific variables used in the tables presented inthis document.
Faculty of Medicine Providing Post-M.D. Training
The faculty of medicine supervising the post-M.D.trainee on November 1 of the report year.
Field of Post-M.D. Training
The type of non-specialized training, family medicine training, or the speciality field in which a trainee is enrolled on November 1 of the reportyear. Several subspecialties have multiple entrypoints. For example, anaesthesiology, emergencymedicine, internal medicine, pediatrics and generalsurgery all have critical care subspecialties. As individuals transition from primary to subspecialtytraining, CAPER counts them within the subspe-cialty field that is consistent with their priortraining.
Clinician Investigator Program
This is a training program accredited by theRCPSC for the purpose of providing additionalresearch skills for physicians who are registeredin one of the specialty or subspecialty trainingprograms. Physicians reported in the A-5 tablehave already been included within their spe-cialty training field in all other tables.
Note
Child and Adolescent PsychiatryEffective September, 2009 Child and AdolescentPsychiatry is a recognized subspecialty of the Royal
Les données, fournies par toutes les facultés demédecine canadiennes à CAPER, contiennent les renseignements concernant chaque stagiaire suivant lesdéfinitions établies par CAPER. Ces définitions, ainsique d’autres détails importants relatifs aux variables spécifiques utilisées dans les tableaux présentés dans ce document, sont énoncés ci-après.
Faculté de Médecine Offrant laFormation Post-M.D.
La faculté de médecine supervisant le stagiaire d’un programme post-M.D. au 1er novembre de l’année du rapport.
Domaine de Formation Post-M.D.
Le genre de stage non spécialisé, de médecine de famille, ou la spécialité auquel le stagiaire s’est inscrit au 1er novembre de l’année du rapport. Plusieurs sur-spécialités se greffent en définitive à de multiplesdisciplines particulières. Par exemple, l’anesthésiologie,la médecine d’urgence, la médecine interne, la pédiatrieet la chirurgie générale s’accompagnent toutes d’une surspécialité en soins intensifs. Alors que les personnespassent de la formation de base à la formation de surspécialité, CAPER inscrit ces personnes dans le domaine de surspécialité correspondant à leur formation antérieure.
Programme de Formation de Cliniciens-Chercheurs
Voici un programme de formation accrédité par le CRMCC, qui a pour objet d’enseigner des techniques de recherche supplémentairesaux médecins inscrits à l’un des programmes de spécialisation ou surspécialisation. Lesmédecins inscrits au tableau A-5 sont déjà inclus avec leur champ de spécialité dans tousles autres tableaux.
Note
Psychiatrie de l’enfant et de l’adolescent Depuis septembre 2009, la psychiatrie de l’enfant et del’adolescent est une surspécialité reconnue du Collège
7Recensement annuel des stagiaires post-M.D. | 2013-2014 | ANNUAL CENSUS OF POST-M.D. TRAINEES
College of Physicians and Surgeons of Canada.Starting in 2012/13 this subspecialty will be re-ported in CAPER publications.
Forensic PsychiatryEffective September, 2009 Forensic Psychiatry is arecognized subspecialty of the Royal College ofPhysicians and Surgeons of Canada. Starting in2012/13 this subspecialty will be reported inCAPER publications.
Geriatric PsychiatryEffective September, 2009 Geriatric Psychiatry is arecognized subspecialty of the Royal College ofPhysicians and Surgeons of Canada. Starting in2012/13 this subspecialty will be reported inCAPER publications.
Rank
All new M.D. graduates now enter directly into either a family medicine or a specialty training program at the PGY-1 level.
Two years of training, the PGY-1 and PGY-2 levels,are required for certification in family medicine.PGY-3 level training in family medicine is providedin the accredited family medicine training programsin care of the elderly and emergency medicine as well as in other additional training programs. Tomeet the training requirements of the RCPSC aminimum of four to six years of training is required,depending on the specific specialty in which certifi-cation is sought.
A trainee progresses through the rank levels in thefollowing sequence:
PGY-1 (Family medicine or specialty training)PGY-2PGY-3PGY-4PGY-5PGY-6PGY-7
royal des médecins et chirurgiens du Canada. À compterde 2012/13, nous ferons rapport de cette surspécialitédans les publications de CAPER.
Psychiatrie légaleDepuis septembre 2009, la psychiatrie légale est unesurspécialité reconnue du Collège royal des médecins etchirurgiens du Canada. À compter de 2012/13, nousferons rapport de cette surspécialité dans les publica-tions de CAPER.
Gérontopsychiatrie Depuis septembre 2009, la gérontopsychiatrie est unesurspécialité reconnue du Collège royal des médecins etchirurgiens du Canada. À compter de 2012/13, nousferons rapport de cette surspécialité dans les publica-tions de CAPER.
Rang
Tous les nouveaux diplômés en médecine doivent commencer maintenant leur formation postdoctorale au niveau PGY-1 soit par le programme de médecine defamille soit par un programme de spécialité.
Le certificat de médecine de famille est une formation dedeux ans, soit les niveaux PGY-1 et PGY-2. Le niveauPGY-3 de médecine de famille est dispensé par les pro-grammes agréés de médecine de famille spécialisés dansles soins aux personnes âgées, la médecine d’urgence etd’autres programmes de formation. Selon la spécialitéchoisie, un minimum de 4 à 6 années est nécessairepour obtenir un certificat du CRMCC.
Un stagiaire progresse de la façon suivante:
PGY-1 (médecine de famille ou spécialité)PGY-2PGY-3PGY-4PGY-5PGY-6PGY-7
8 CANADIAN POST-M.D. EDUCATION REGISTRY
Fellows
CAPER uses the following definition of the term“fellow”: a post-M.D. trainee who is registered withthe Postgraduate Medical Education Office of a university faculty of medicine and who, regardlessof the source of funding, is pursuing clinical or research training which will NOT be evaluated bythe supervising faculty for the purpose of Canadianlicensure, or certification by the College of FamilyPhysicians of Canada, the Collège des médecins duQuébec or the Royal College of Physicians andSurgeons of Canada. (Trainees with appropriate prerequisite training registered in RCPSC “accreditation without certification” programs are considered as residents, not fellows.)
Location of the Faculty of Medicine That Awarded the M.D. Degree
For individuals who earned the degree in Canada,the province of location of the faculty of medicinethat awarded the M.D. degree is used. Post-M.D.trainees who earned the M.D. degree outsideCanada are classified as such.
Source of Funding
The source of funding is the organization or gov-ernment agency providing the funding for theposition occupied by the trainee. Two main cate-gories are used: “Regular Ministry Funds” and“Other Funds”. “Regular Ministry Funds” refers tofunds provided by the appropriate provincial gov-ernment ministry responsible for the training ofresidents within that province. All other fundingsources are grouped as “Other Funds”. Graph I-2identifies a subcategory of “Other Funds”. This sub-category is called “Other Provincial GovernmentFunds” and includes such sources as ministry fundsprovided for complementary training by theQuebec Ministry of Health and Social Services, funds for residency trainingtransferred from one province to another and government-funded foundations such as the Alberta Heritage Foundation.
Moniteurs cliniques (Fellows)
CAPER utilise la définition du terme moniteur clinique(fellow) énoncée ci-après : un stagiaire post-M.D. qui estinscrit auprès du Bureau des études médicales postdoc-torales de la faculté de médecine d’une université et qui,quelque soit la source du financement, poursuit un stage clinique ou de recherche n’étant PAS évalué par lafaculté supervisant en vue de l’obtention du permis d’exercer la médecine au Canada ou de la certificationpar le Collège des médecins de famille du Canada, par leCollège des médecins du Québec ou par le Collège royaldes médecins et chirurgiens du Canada. (Les stagiairespossédant la formation requise et qui sont inscrits dansles programmes de “l’agrément sans le certificat” duCRMCC sont considérés comme des résidents et noncomme des « fellows ».)
Lieu de la faculté de médecine qui adécerné le diplôme M.D.
Pour les individus qui ont reçu leur diplôme au Canada,la province de la faculté de médecine qui a décerné lediplôme M.D. est utilisé. Ceux qui ont reçu leurdiplôme ailleurs qu’au Canada sont classifiés en tant que diplômés de facultés de médecine étrangères.
Source de financement
La source de financement est l’organisme ou l’agencegouvernementale qui fournit le financement pour la position occupée par le stagiaire. Deux grandes caté-gories sont utilisées: « Fonds ministériels habituels » et « Autres fonds ». Les « Fonds ministériels habituels »sont les fonds provenant des ministères des gouverne-ments provinciaux appropriés responsables des stagesdes résidents au sein de la province. Tous les autressources de financement sont regroupés sous l’appella-tion « Autres fonds ». Le graphe I-2 présente unesous-catégorie de la catégorie « Autres fonds ». Cettesous-catégorie s’intitule « Autres fonds des gouverne-ments provinciaux » et comprend entre autres des fonds provenant du ministère de la Santé et des Servicessociaux du Québec destinés à financer une formationcomplémentaire, des fonds de transfert d’une province à une autre pour la formation clinique, et des fondsprovenant de fondations financées par les gouverne-ments comme l’Alberta Heritage Foundation.
9Recensement annuel des stagiaires post-M.D. | 2013-2014 | ANNUAL CENSUS OF POST-M.D. TRAINEES
Age
Age is calculated as the age of the trainee on July 1,2013 (the age of the trainee at the beginning of theJuly 2013 training session).
Legal Status
Three categories are used:
Canadian Citizen / Permanent Resident
Trainee is a citizen of Canada or has been acceptedas a landed immigrant and has the right to live andwork in Canada.
Visa
Trainees holding a visa permitting employment inCanada temporarily as a post-M.D. trainee.
First Year Trainees
Only first-time trainees in their first year of post-M.D. training in Canada at the PGY-1 level aredesignated as “first year trainees” and are includedin Section G of the book. Other trainees at the PGY-1 level who are re-entering training, repeating the first year, or changing specialties requiring asecond year at the PGY-1 level are NOT included in Section G on first year trainees.
Trainees included in the first year trainee categoryaccording to CAPER are:
1. Graduates of Canadian medical schools at the PGY-1 training level who have not been previ-ously reported to CAPER.
2. International medical graduates who are entering training at the PGY-1 level in Canada for the first time (visa trainees beginning a program at the PGY-1 level are, therefore, included in this group).
Âge
L’âge est calculé en fonction de l’âge du stagiaire au 1er juillet 2013 (l’âge du stagiaire au commencement dela séance de stage de juillet 2013).
Statut légal
On utilise trois catégories :
Citoyen canadien / Résident permanent
Le stagiaire est citoyen canadien ou un individu ayantreçu le droit d’établissement au Canada et qui, en tantque tel, a le droit de vivre et travailler au Canada.
Visa
Le stagiaire est en possession d’un visa permettant d’êtreemployé temporairement en tant que stagiaire post-M.D..
Stagiaires en première année post-M.D.
Seuls les stagiaires en première année post-M.D. auCanada pour la première fois sont regroupés dans la catégorie « stagiaires en première année post-M.D. » etsont inclus dans la section G de ce document. Les autresstagiaires du niveau PGY-1 qui reprennent une forma-tion, redouble leur première année ou changent despécialité et ont besoin de recommencer une premièreannée au niveau PGY-1 NE SONT PAS inclus dans lasection G dans la catégorie « stagiaires en première annéepost-M.D. ».
Selon CAPER, les stagiaires regroupés dans la catégorie « stagiaires en première année post-M.D. » sont lessuivants :
1. les diplômés des facultés de médecine canadiennes au niveau PGY-1 et n’ayant pas encore été enregistrés dans les données de CAPER.
2. les diplômés de facultés de médecine étrangèresqui sont admis au niveau PGY-1 au Canadapour la première fois (les stagiaires possédantun visa et débutant une formation au niveauPGY-1 sont donc inclus dans cette catégorie).
10 CANADIAN POST-M.D. EDUCATION REGISTRY
Estimated Practice Entry Cohort
The practice entry cohort comprises the physicianswho have left the post-M.D. training system eachyear and would be legally able to work in Canada.In order to give a picture of new entries to practice,re-entry trainees (as discussed in Section H) andvisa trainees have not been included in the esti-mated practice entry cohort.
Gender
Visa trainees have not been included in the datapertaining to gender. This was done to give a morerealistic picture of the gender mix of the cohorts ofphysicians who will be entering practice in Canada.The tables which have been affected are A-3, G-6and I-3.
Completion of Training
This term is used in Section J to indicate that thegroup exited training at a level appropriate for completion of training (e.g. PGY-2 or higher forFamily medicine, PGY-4 or higher for most RCPSCspecialties and PGY-5 or higher for subspecialtiesand surgical specialties).
Palliative Medicine
Palliative medicine is a unique specialty in that it is accredited jointly by the Royal College ofPhysicians and Surgeons of Canada and by theCollege of Family Physicians of Canada. As such, it is placed in a separate category where trainingprograms have been listed separately. Where thetraining programs have been grouped in the cate-gories “family medicine”, “medical specialties”,“laboratory medicine specialties” and “surgical spe-cialties”, palliative medicine has been included with“medical specialties”. This is because it includes toofew physicians in it to form an isolated category.
Estimation de la cohorte de nouveauxpraticiens
La cohorte de nouveaux praticiens contienne lesmédecins ayant terminé leur formation post-M.D. dansl’année et qui sont en droit d’exercer au Canada. Afin de présenter un tableau des nouveaux praticiens, les stagiaires qui reprennent leur pratique (voir section H)et les stagiaires qui ont un visa d’emploi temporaire nesont pas inclus dans cette estimation.
Sexe
Les stagiaires qui ont un visa n’ont pas été inclus dansles données relatives au sexe, de façon à présenter untableau plus réaliste des sexes dans les cohortes demédecins commençant à exercer au Canada. Ce changement porte sur les tableaux A-3, G-6 et I-3.
Fin de formation
Ce terme est utilisé dans la section J et signifie que legroupe a atteint le niveau d’études correspondant à la fin de formation (par exemple: PGY-2 pour la médecinede famille, PGY-4 ou plus pour la plupart des spécialitésdu Collège royal et PGY-5 pour les surspécialités et spécialités de chirurgie).
Médecine palliative
Le programme de médecine palliative se distingue par le fait qu’il a été agréé à la fois par le Collège royal desmédecins et chirurgiens du Canada et par le Collège des médecins de famille du Canada. À ce titre, il a été classé dans une catégorie distincte qui énumère séparément les programmes de formation. Lorsque cesderniers sont regroupés par catégorie, soit « médecinede famille », « spécialités médicales », « spécialités demédecine de laboratoire » et « spécialités chirurgicales », le programme de médecine palliative fait partie de « spécialités médicales ». Il comprend en effet trop peu de médecins pour former une catégorie à part entière.
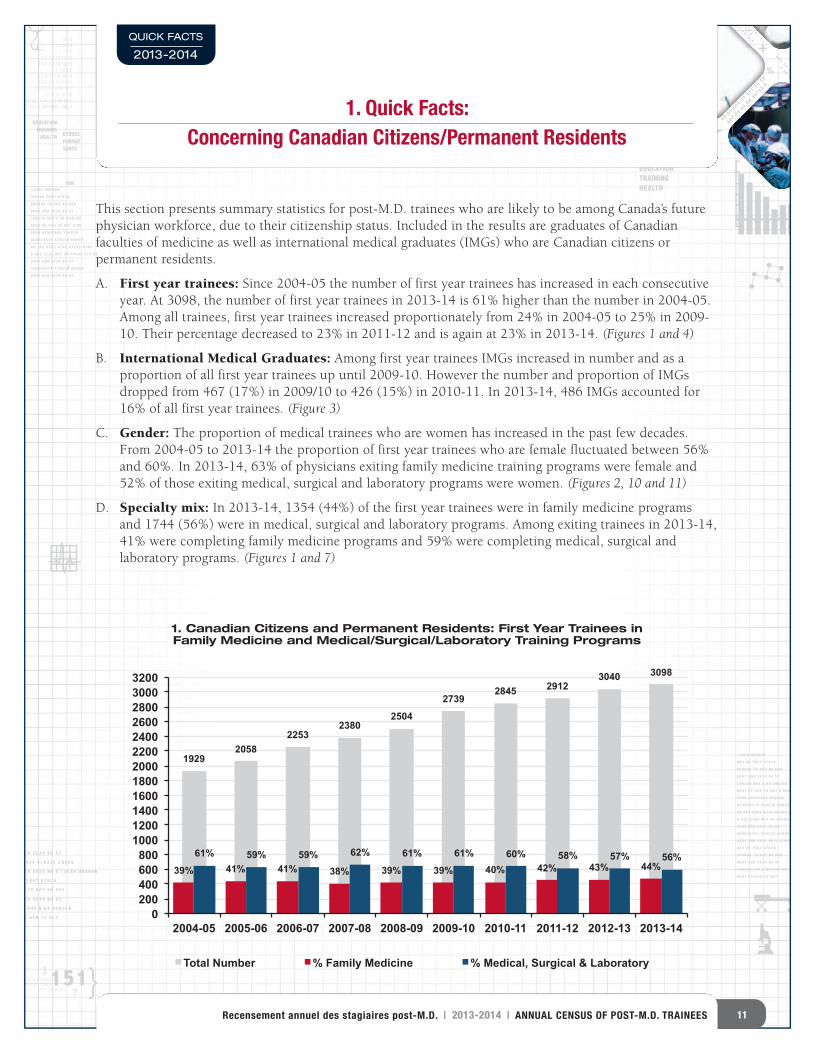
8989077 68686868689 9 5535535535534 969696 5 57
02028028402840284028474 4747479229229229 8090909009
89898989890007777 68686868689 9 9 9 5535535535534 4 4 96969696 5 5 5 12121266668989 U U U889888988898999
08089 8989 7 7 7 7867867 6 676776788
89890890890890 78 6666665 969696 680
89898989000777 68686868689 9 9 5535535535534 4 4 96969696 5 5 5777
15156154154154 845 55 64 88846156156158
898907 656565 656 7 75 8686867
45 50 261857 63 100
12689 U88989089 89 7867 67678
890890 78 665 96 6808907 689 5534 96 57
156154 845 5 64 8461588907 65 656 75 867 8 908
9809 4794Y943 Y943Y9028028474 479229 80909
89 367 9562 6782 83292 83625 382 2782 937 38 38792 723 02
4850 480 4980 890 904 60 540
3 3 32 3 3 8 8 81 1 1 13 3 3 3 12 12 124 4 3 3 2 16 16 161 1 2 2 23 3 3 3 2 14 14 142 2 2 2 3 11 11 113 3 3 2 2 13 13 12 11 1 1 1 1 5 5 513 13 12 11 11 1 61 61 60 1103 107 59 41 35 3 1 349 348 1 346 3
3 3 32 3 3 8 8 8
1 1 1 13 3 3 3 12 12 12
4 4 3 3 2 16 16 161 1 2 2 2
3 3 3 3 2 14 14 142 2 2 2 3 11 11 11
3 3 3 2 2 13 13 12 11 1 1 1 1 5 5 5
13 13 12 11 11 1 61 61 60 1103 107 59 41 35 3 1 349 348 1 346 3
2 2 13 13 12 11 1 1 1 1 5 5 5
13 13 12 11 11 1 61 61 60 1103 107 59 41 35 3 1 349 348 1 346 3
75 79 064 20 379 07 590 3 2 8
48 05 8
56 40 6
72 90 4
6
892 3
4 04 0
4 90792 6
4 8 5 8 5 8 5 4 9 3 7 0 1
4 5 0 4 5 0 1 9 7 3
EDUCATIONTRAINING
HEALTH ÉTUDESFORMAT
ION
SANTÉ
758 64 26 12
03 13 015 23
12689 U88989089 89 7867 67678
890890 78 665 96 6808907 689 5534 96 57
156154 845 5 64 8461588907 65 656 75 867 8 908
9809 4794Y943 Y943Y9028028474 479229 80909
89 367 9562 6782 83292 83625 382 2782 937 38 38792 723 02
1103 1078
%+
+ 781 5413 9
405540 466
0 1533 8
18 387
9 41 3
5 3 1
34
12689 U88989
089 89 7867 67678
890890 78 665 96 680
8907 689 5534 96 57
156154 845 5 64 846158
8907 65 656 75 867 8 90
8
9809 4794Y943 Y943Y9
028028474 479229 80909
89 367 9562 6782 83292 8362
5 382 2782 937 38 38792 723 02
8907 689 5534 96 57
028028474 479229 80909
8907 689 5534 96 57
4
{ {7
7
3
4 15103 107 59 41 35 3 1 349 303 107 59 41 35 3 1 349 3
11 11 1 61 61 60 1
1 5 2 1 5 2 1 6
4 4 5 1 5 2 8
6 4 8 2 4 6 1 2 6
12689 u88989089 89 7867 67678890890 78 665 96 6808907 689 5534 96 57156154 845 5 64 8461588907 65 656 75 867 8 9089809 4794y943 y943y9
T O
T A L
H E A L T H S A N T É
EDUCATIONÉTUDES
EDUCATIONTRAININGHEALTH
" " "" "
" "A
8
2 2 2 2 3 11 11 113 3 3 2 2 13 13 12 11 1 1 1 1 5 5 513 13 12 11 11 1 61 650 640 75 056 06 6890780 9029 068 0690667890 0 49 0463 0492
12689 U88989
089 89 7867 67678
890890 78 665 96 680
8907 689 5534 96 57
156154 845 5 64 846158
8907 65 656 75 867 8 908
9809 4794Y943 Y943Y9
028028474 479229 80909
89 367 9562 6782 83292 8362
5 382 2782 937 38 38792 723 02
8907 689 5534 96 57
028028474 479229 80909
8907 689 5534 96 5 12689 U88989
089 89 7867 67678
890890 78 665 96 680
8907 689 5534 96 57
156154 845 5 64 846158
8907 65 656 75 867
EDUCATION REGISTRY ENREGISTREMENT
D’ÉDUCATION
EDUCAT
ION REGISTRY
ENREGISTREMENT D’ÉDUCATION
1. Quick Facts: Concerning Canadian Citizens/Permanent Residents
QUICK FACTS
2013-2014
11Recensement annuel des stagiaires post-M.D. | 2013-2014 | ANNUAL CENSUS OF POST-M.D. TRAINEES
This section presents summary statistics for post-M.D. trainees who are likely to be among Canada’s futurephysician workforce, due to their citizenship status. Included in the results are graduates of Canadian faculties of medicine as well as international medical graduates (IMGs) who are Canadian citizens or permanent residents.
A. First year trainees: Since 2004-05 the number of first year trainees has increased in each consecutiveyear. At 3098, the number of first year trainees in 2013-14 is 61% higher than the number in 2004-05.Among all trainees, first year trainees increased proportionately from 24% in 2004-05 to 25% in 2009-10. Their percentage decreased to 23% in 2011-12 and is again at 23% in 2013-14. (Figures 1 and 4)
B. International Medical Graduates: Among first year trainees IMGs increased in number and as a proportion of all first year trainees up until 2009-10. However the number and proportion of IMGsdropped from 467 (17%) in 2009/10 to 426 (15%) in 2010-11. In 2013-14, 486 IMGs accounted for16% of all first year trainees. (Figure 3)
C. Gender: The proportion of medical trainees who are women has increased in the past few decades.From 2004-05 to 2013-14 the proportion of first year trainees who are female fluctuated between 56%and 60%. In 2013-14, 63% of physicians exiting family medicine training programs were female and52% of those exiting medical, surgical and laboratory programs were women. (Figures 2, 10 and 11)
D. Specialty mix: In 2013-14, 1354 (44%) of the first year trainees were in family medicine programs and 1744 (56%) were in medical, surgical and laboratory programs. Among exiting trainees in 2013-14,41% were completing family medicine programs and 59% were completing medical, surgical and laboratory programs. (Figures 1 and 7)
1929 2058
2253 2380
2504
2739 2845 2912
3040 3098
39% 41% 41% 38% 39% 39% 40% 42% 43% 44% 61% 59% 59% 62% 61% 61% 60% 58% 57% 56%
0 200 400 600 800
1000 1200 1400 1600 1800 2000 2200 2400 2600 2800 3000 3200
2004-05 2005-06 2006-07 2007-08 2008-09 2009-10 2010-11 2011-12 2012-13 2013-14
Total Number % Family Medicine % Medical, Surgical & Laboratory
1. Canadian Citizens and Permanent Residents: First Year Trainees in Family Medicine and Medical/Surgical/Laboratory Training Programs
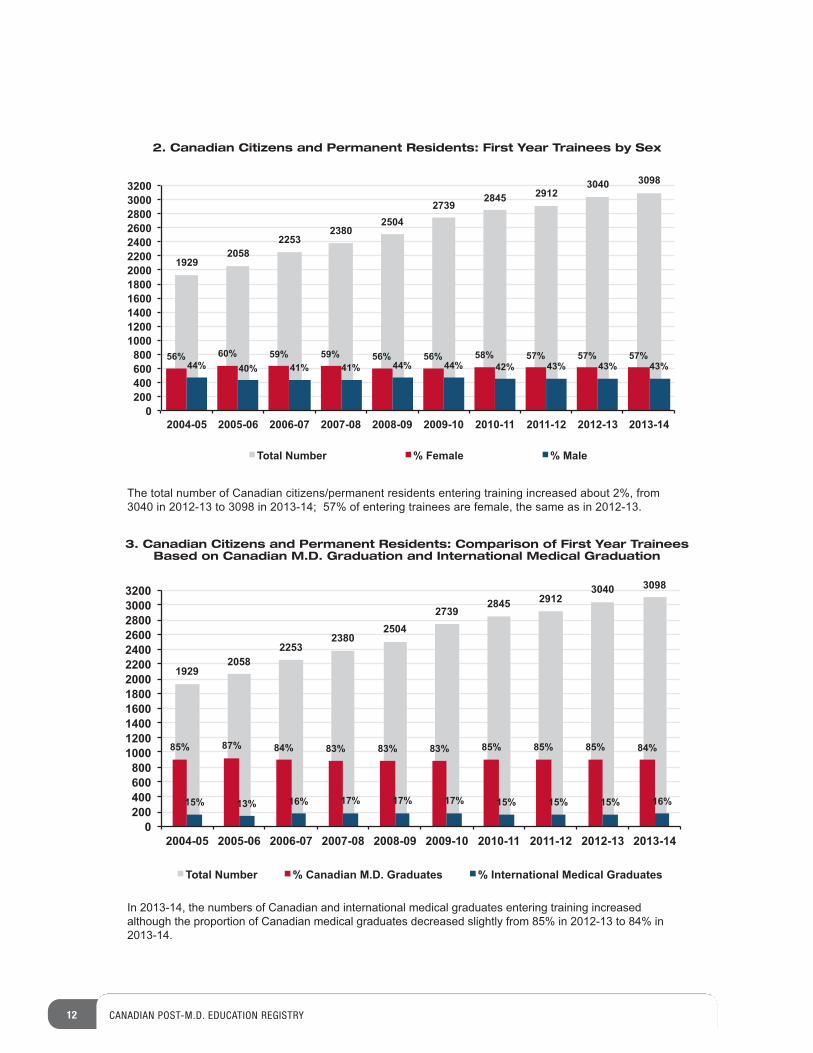
12 CANADIAN POST-M.D. EDUCATION REGISTRY
The total number of Canadian citizens/permanent residents entering training increased about 2%, from 3040 in 2012-13 to 3098 in 2013-14; 57% of entering trainees are female, the same as in 2012-13.
In 2013-14, the numbers of Canadian and international medical graduates entering training increased although the proportion of Canadian medical graduates decreased slightly from 85% in 2012-13 to 84% in 2013-14.
1929 2058
2253 2380
2504 2739
2845 2912 3040 3098
56% 60% 59% 59% 56% 56% 58% 57% 57% 57% 44% 40% 41% 41% 44% 44% 42% 43% 43% 43%
0 200 400 600 800
1000 1200 1400 1600 1800 2000 2200 2400 2600 2800 3000 3200
2004-05 2005-06 2006-07 2007-08 2008-09 2009-10 2010-11 2011-12 2012-13 2013-14
Total Number % Female % Male
1929 2058
2253 2380
2504 2739
2845 2912 3040 3098
85% 87% 84% 83% 83% 83% 85% 85% 85% 84%
15% 13% 16% 17% 17% 17% 15% 15% 15% 16%
0 200 400 600 800
1000 1200 1400 1600 1800 2000 2200 2400 2600 2800 3000 3200
2004-05 2005-06 2006-07 2007-08 2008-09 2009-10 2010-11 2011-12 2012-13 2013-14
Total Number % Canadian M.D. Graduates % International Medical Graduates
3. Canadian Citizens and Permanent Residents: Comparison of First Year Trainees Based on Canadian M.D. Graduation and International Medical Graduation
2. Canadian Citizens and Permanent Residents: First Year Trainees by Sex
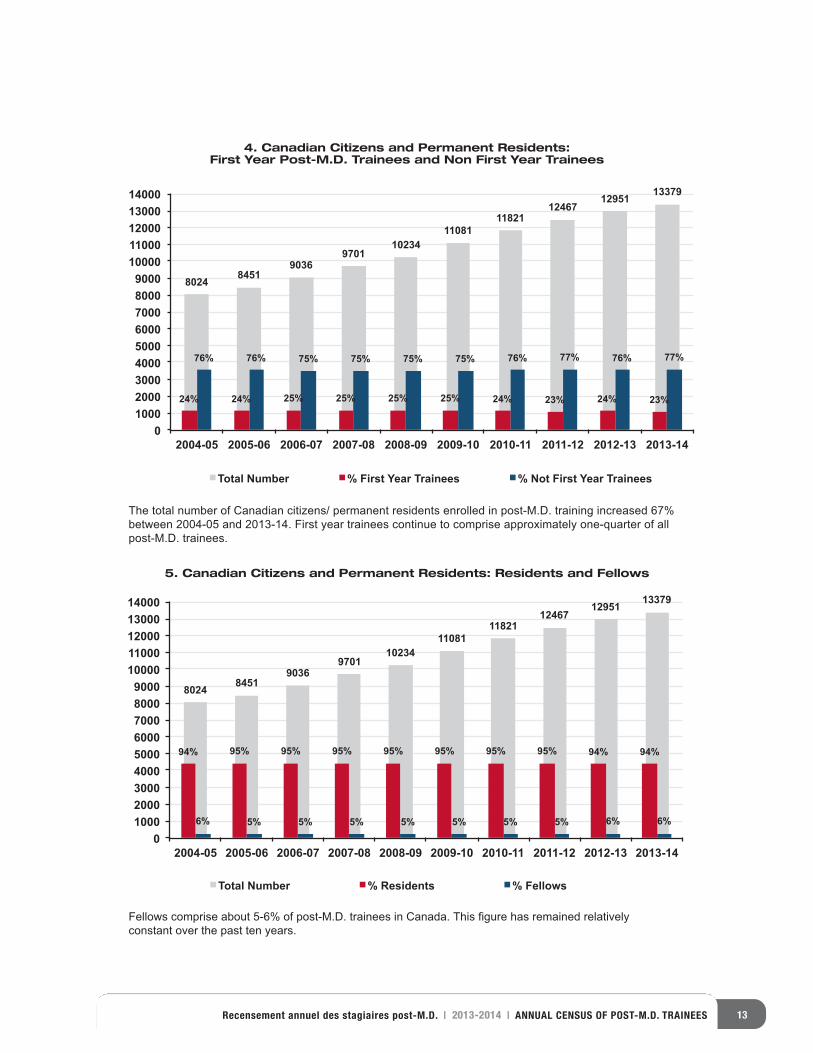
13Recensement annuel des stagiaires post-M.D. | 2013-2014 | ANNUAL CENSUS OF POST-M.D. TRAINEES
The total number of Canadian citizens/ permanent residents enrolled in post-M.D. training increased 67% between 2004-05 and 2013-14. First year trainees continue to comprise approximately one-quarter of all post-M.D. trainees.
Fellows comprise about 5-6% of post-M.D. trainees in Canada. This figure has remained relatively constant over the past ten years.
8024 8451
9036 9701
10234 11081
11821 12467
12951 13379
24% 24% 25% 25% 25% 25% 24% 23% 24% 23%
76% 76% 75% 75% 75% 75% 76% 77% 76% 77%
0 1000 2000 3000 4000 5000 6000 7000 8000 9000
10000 11000 12000 13000 14000
2004-05 2005-06 2006-07 2007-08 2008-09 2009-10 2010-11 2011-12 2012-13 2013-14
Total Number % First Year Trainees % Not First Year Trainees
8024 8451 9036
9701 10234
11081 11821
12467 12951 13379
94% 95% 95% 95% 95% 95% 95% 95% 94% 94%
6% 5% 5% 5% 5% 5% 5% 5% 6% 6%
0 1000 2000 3000 4000 5000 6000 7000 8000 9000
10000 11000 12000 13000 14000
2004-05 2005-06 2006-07 2007-08 2008-09 2009-10 2010-11 2011-12 2012-13 2013-14
Total Number % Residents % Fellows
4. Canadian Citizens and Permanent Residents: First Year Post-M.D. Trainees and Non First Year Trainees
5. Canadian Citizens and Permanent Residents: Residents and Fellows
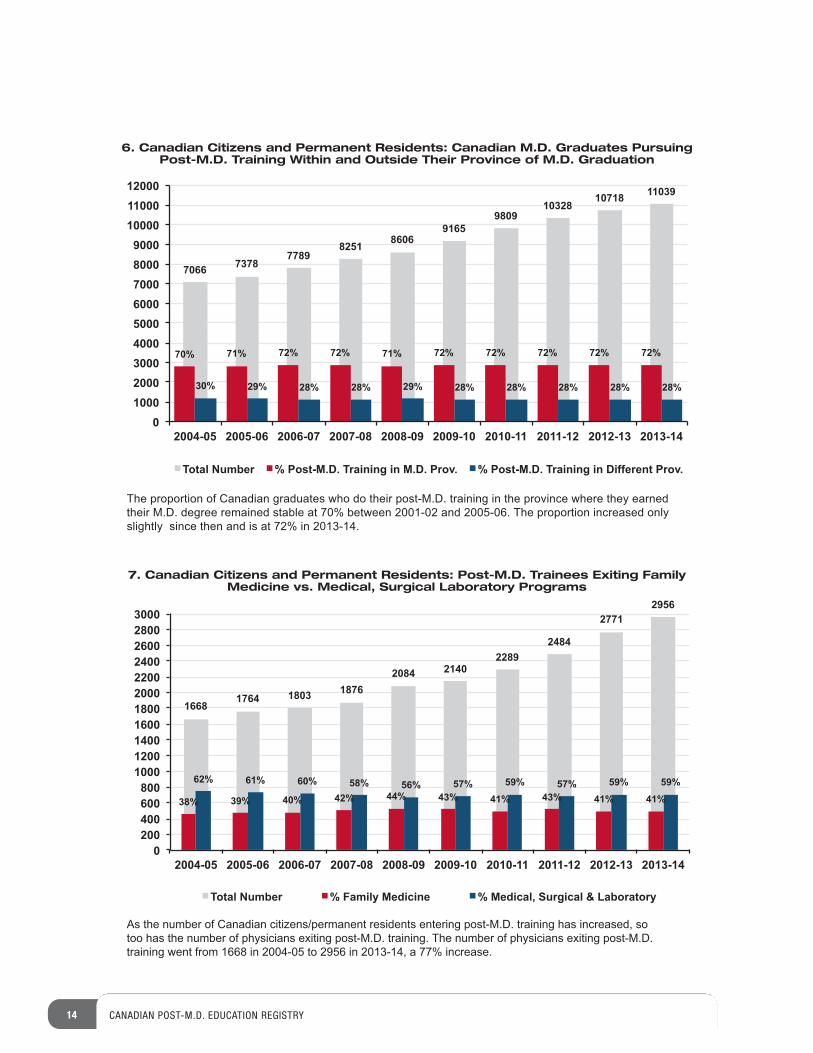
14 CANADIAN POST-M.D. EDUCATION REGISTRY
The proportion of Canadian graduates who do their post-M.D. training in the province where they earned their M.D. degree remained stable at 70% between 2001-02 and 2005-06. The proportion increased only slightly since then and is at 72% in 2013-14.
As the number of Canadian citizens/permanent residents entering post-M.D. training has increased, so too has the number of physicians exiting post-M.D. training. The number of physicians exiting post-M.D. training went from 1668 in 2004-05 to 2956 in 2013-14, a 77% increase.
7066 7378 7789
8251 8606 9165
9809 10328
10718 11039
70% 71% 72% 72% 71% 72% 72% 72% 72% 72%
30% 29% 28% 28% 29% 28% 28% 28% 28% 28%
0 1000 2000 3000 4000 5000 6000 7000 8000 9000
10000 11000 12000
2004-05 2005-06 2006-07 2007-08 2008-09 2009-10 2010-11 2011-12 2012-13 2013-14
Total Number % Post-M.D. Training in M.D. Prov. % Post-M.D. Training in Different Prov.
1668 1764 1803 1876
2084 2140 2289
2484
2771 2956
38% 39% 40% 42% 44% 43% 41% 43% 41% 41%
62% 61% 60% 58% 56% 57% 59% 57% 59% 59%
0 200 400 600 800
1000 1200 1400 1600 1800 2000 2200 2400 2600 2800 3000
2004-05 2005-06 2006-07 2007-08 2008-09 2009-10 2010-11 2011-12 2012-13 2013-14
Total Number % Family Medicine % Medical, Surgical & Laboratory
6. Canadian Citizens and Permanent Residents: Canadian M.D. Graduates Pursuing Post-M.D. Training Within and Outside Their Province of M.D. Graduation
7. Canadian Citizens and Permanent Residents: Post-M.D. Trainees Exiting FamilyMedicine vs. Medical, Surgical Laboratory Programs
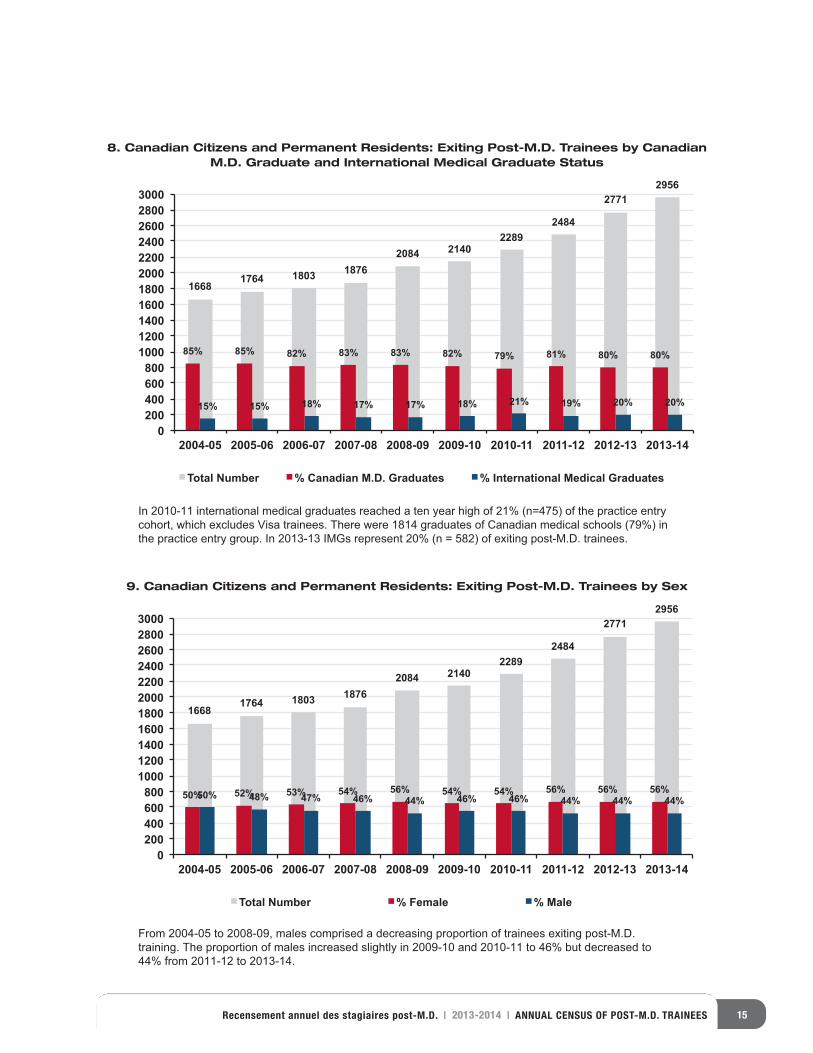
15Recensement annuel des stagiaires post-M.D. | 2013-2014 | ANNUAL CENSUS OF POST-M.D. TRAINEES
In 2010-11 international medical graduates reached a ten year high of 21% (n=475) of the practice entry cohort, which excludes Visa trainees. There were 1814 graduates of Canadian medical schools (79%) in the practice entry group. In 2013-13 IMGs represent 20% (n = 582) of exiting post-M.D. trainees.
From 2004-05 to 2008-09, males comprised a decreasing proportion of trainees exiting post-M.D. training. The proportion of males increased slightly in 2009-10 and 2010-11 to 46% but decreased to 44% from 2011-12 to 2013-14.
1668 1764 1803 1876
2084 2140 2289
2484
2771 2956
85% 85% 82% 83% 83% 82% 79% 81% 80% 80%
15% 15% 18% 17% 17% 18% 21% 19% 20% 20%
0 200 400 600 800
1000 1200 1400 1600 1800 2000 2200 2400 2600 2800 3000
2004-05 2005-06 2006-07 2007-08 2008-09 2009-10 2010-11 2011-12 2012-13 2013-14
Total Number % Canadian M.D. Graduates % International Medical Graduates
1668 1764 1803 1876
2084 2140 2289
2484
2771 2956
50% 52% 53% 54% 56% 54% 54% 56% 56% 56% 50% 48% 47% 46% 44% 46% 46% 44% 44% 44%
0 200 400 600 800
1000 1200 1400 1600 1800 2000 2200 2400 2600 2800 3000
2004-05 2005-06 2006-07 2007-08 2008-09 2009-10 2010-11 2011-12 2012-13 2013-14
Total Number % Female % Male
8. Canadian Citizens and Permanent Residents: Exiting Post-M.D. Trainees by CanadianM.D. Graduate and International Medical Graduate Status
9. Canadian Citizens and Permanent Residents: Exiting Post-M.D. Trainees by Sex
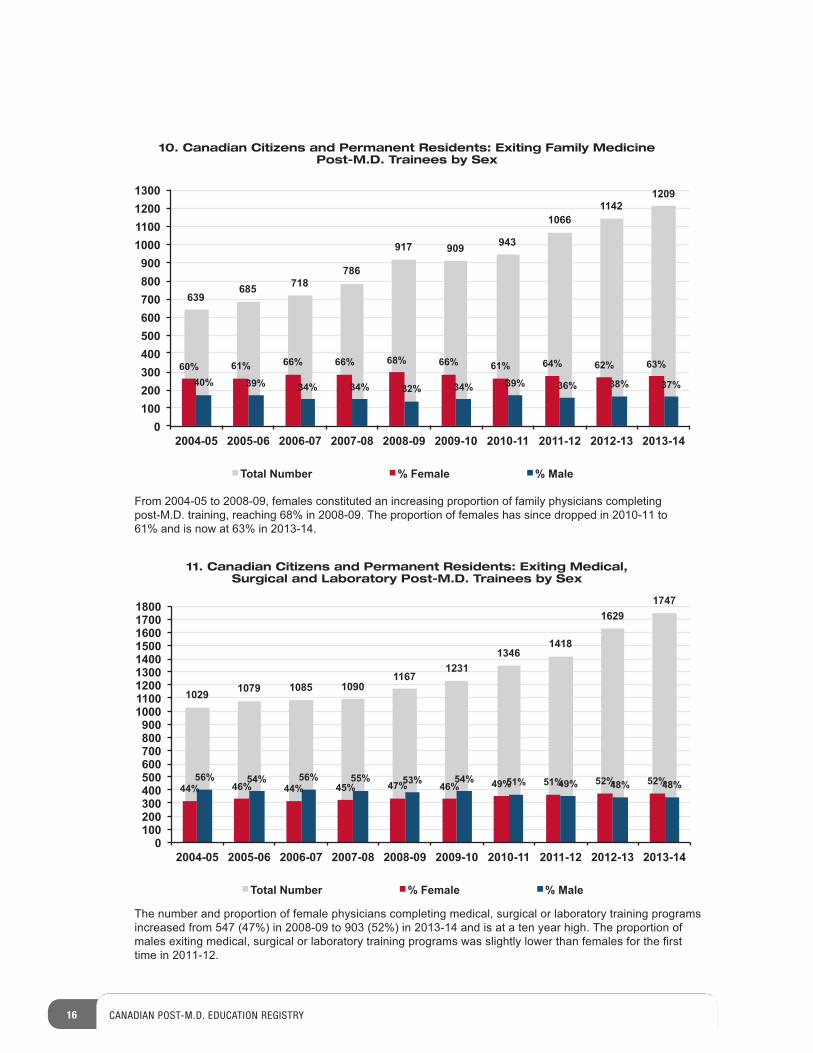
16 CANADIAN POST-M.D. EDUCATION REGISTRY
The number and proportion of female physicians completing medical, surgical or laboratory training programs increased from 547 (47%) in 2008-09 to 903 (52%) in 2013-14 and is at a ten year high. The proportion of males exiting medical, surgical or laboratory training programs was slightly lower than females for the first time in 2011-12.
From 2004-05 to 2008-09, females constituted an increasing proportion of family physicians completing post-M.D. training, reaching 68% in 2008-09. The proportion of females has since dropped in 2010-11 to 61% and is now at 63% in 2013-14.
639 685 718
786
917 909 943
1066 1142
1209
60% 61% 66% 66% 68% 66% 61% 64% 62% 63%
40% 39% 34% 34% 32% 34% 39% 36% 38% 37%
0 100 200 300 400 500 600 700 800 900
1000 1100 1200 1300
2004-05 2005-06 2006-07 2007-08 2008-09 2009-10 2010-11 2011-12 2012-13 2013-14
Total Number % Female % Male
1029 1079 1085 1090 1167
1231 1346
1418
1629 1747
44% 46% 44% 45% 47% 46% 49% 51% 52% 52% 56% 54% 56% 55% 53% 54% 51% 49% 48% 48%
0 100 200 300 400 500 600 700 800 900
1000 1100 1200 1300 1400 1500 1600 1700 1800
2004-05 2005-06 2006-07 2007-08 2008-09 2009-10 2010-11 2011-12 2012-13 2013-14
Total Number % Female % Male
10. Canadian Citizens and Permanent Residents: Exiting Family Medicine Post-M.D. Trainees by Sex
11. Canadian Citizens and Permanent Residents: Exiting Medical, Surgical and Laboratory Post-M.D. Trainees by Sex
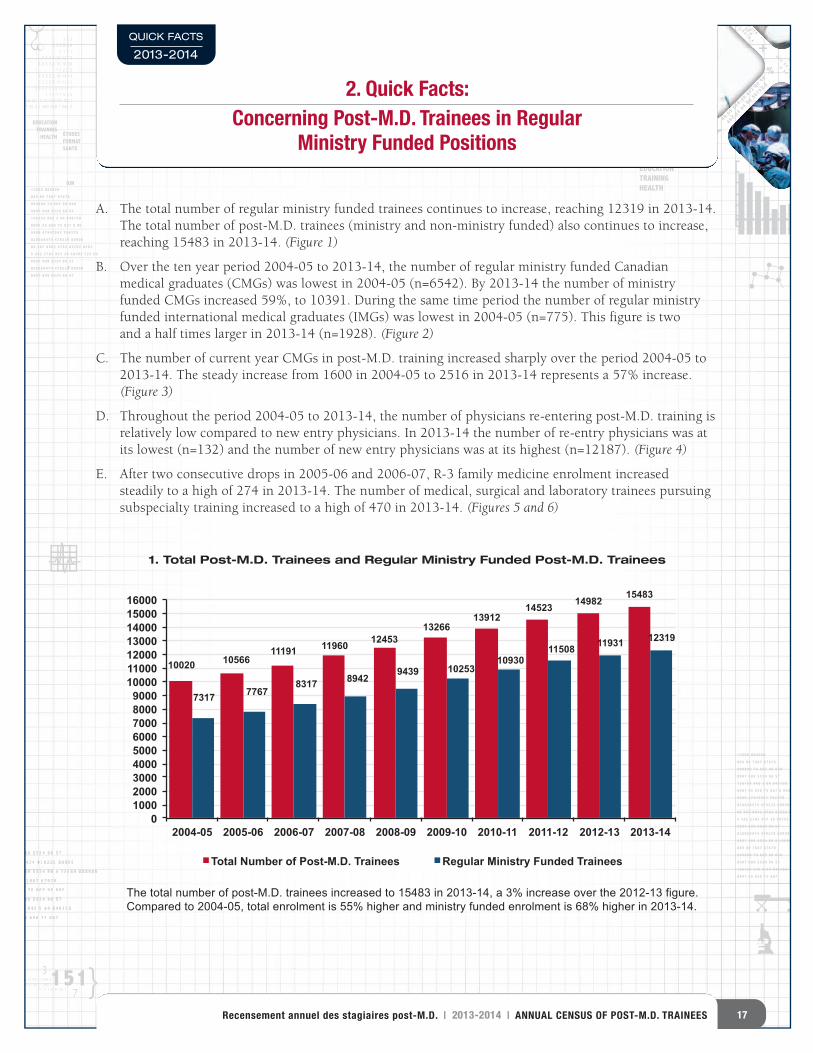
8989077 68686868689 9 5535535535534 969696 5 57
02028028402840284028474 4747479229229229 8090909009
89898989890007777 68686868689 9 9 9 5535535535534 4 4 96969696 5 5 5 12121266668989 U U U889888988898999
08089 8989 7 7 7 7867867 6 676776788
89890890890890 78 6666665 969696 680
89898989000777 68686868689 9 9 5535535535534 4 4 96969696 5 5 5777
15156154154154 845 55 64 88846156156158
898907 656565 656 7 75 8686867
45 50 261857 63 100
12689 U88989089 89 7867 67678
890890 78 665 96 6808907 689 5534 96 57
156154 845 5 64 8461588907 65 656 75 867 8 908
9809 4794Y943 Y943Y9028028474 479229 80909
89 367 9562 6782 83292 83625 382 2782 937 38 38792 723 02
4850 480 4980 890 904 60 540
3 3 32 3 3 8 8 81 1 1 13 3 3 3 12 12 124 4 3 3 2 16 16 161 1 2 2 23 3 3 3 2 14 14 142 2 2 2 3 11 11 113 3 3 2 2 13 13 12 11 1 1 1 1 5 5 513 13 12 11 11 1 61 61 60 1103 107 59 41 35 3 1 349 348 1 346 3
3 3 32 3 3 8 8 8
1 1 1 13 3 3 3 12 12 12
4 4 3 3 2 16 16 161 1 2 2 2
3 3 3 3 2 14 14 142 2 2 2 3 11 11 11
3 3 3 2 2 13 13 12 11 1 1 1 1 5 5 5
13 13 12 11 11 1 61 61 60 1103 107 59 41 35 3 1 349 348 1 346 3
2 2 13 13 12 11 1 1 1 1 5 5 5
13 13 12 11 11 1 61 61 60 1103 107 59 41 35 3 1 349 348 1 346 3
75 79 064 20 379 07 590 3 2 8
48 05 8
56 40 6
72 90 4
6
892 3
4 04 0
4 90792 6
4 8 5 8 5 8 5 4 9 3 7 0 1
4 5 0 4 5 0 1 9 7 3
EDUCATIONTRAINING
HEALTH ÉTUDESFORMAT
ION
SANTÉ
758 64 26 12
03 13 015 23
12689 U88989089 89 7867 67678
890890 78 665 96 6808907 689 5534 96 57
156154 845 5 64 8461588907 65 656 75 867 8 908
9809 4794Y943 Y943Y9028028474 479229 80909
89 367 9562 6782 83292 83625 382 2782 937 38 38792 723 02
1103 1078
%+
+ 781 5413 9
405540 466
0 1533 8
18 387
9 41 3
5 3 1
34
12689 U88989
089 89 7867 67678
890890 78 665 96 680
8907 689 5534 96 57
156154 845 5 64 846158
8907 65 656 75 867 8 90
8
9809 4794Y943 Y943Y9
028028474 479229 80909
89 367 9562 6782 83292 8362
5 382 2782 937 38 38792 723 02
8907 689 5534 96 57
028028474 479229 80909
8907 689 5534 96 57
4
{ {7
7
3
4 15103 107 59 41 35 3 1 349 303 107 59 41 35 3 1 349 3
11 11 1 61 61 60 1
1 5 2 1 5 2 1 6
4 4 5 1 5 2 8
6 4 8 2 4 6 1 2 6
12689 u88989089 89 7867 67678890890 78 665 96 6808907 689 5534 96 57156154 845 5 64 8461588907 65 656 75 867 8 9089809 4794y943 y943y9
T O
T A L
H E A L T H S A N T É
EDUCATIONÉTUDES
EDUCATIONTRAININGHEALTH
" " "" "
" "A
8
2 2 2 2 3 11 11 113 3 3 2 2 13 13 12 11 1 1 1 1 5 5 513 13 12 11 11 1 61 650 640 75 056 06 6890780 9029 068 0690667890 0 49 0463 0492
12689 U88989
089 89 7867 67678
890890 78 665 96 680
8907 689 5534 96 57
156154 845 5 64 846158
8907 65 656 75 867 8 908
9809 4794Y943 Y943Y9
028028474 479229 80909
89 367 9562 6782 83292 8362
5 382 2782 937 38 38792 723 02
8907 689 5534 96 57
028028474 479229 80909
8907 689 5534 96 5 12689 U88989
089 89 7867 67678
890890 78 665 96 680
8907 689 5534 96 57
156154 845 5 64 846158
8907 65 656 75 867
EDUCATION REGISTRY ENREGISTREMENT
D’ÉDUCATION
EDUCAT
ION REGISTRY
ENREGISTREMENT D’ÉDUCATION
2. Quick Facts: Concerning Post-M.D. Trainees in Regular
Ministry Funded Positions
QUICK FACTS
2013-2014
A. The total number of regular ministry funded trainees continues to increase, reaching 12319 in 2013-14.The total number of post-M.D. trainees (ministry and non-ministry funded) also continues to increase,reaching 15483 in 2013-14. (Figure 1)
B. Over the ten year period 2004-05 to 2013-14, the number of regular ministry funded Canadian medical graduates (CMGs) was lowest in 2004-05 (n=6542). By 2013-14 the number of ministryfunded CMGs increased 59%, to 10391. During the same time period the number of regular ministryfunded international medical graduates (IMGs) was lowest in 2004-05 (n=775). This figure is two and a half times larger in 2013-14 (n=1928). (Figure 2)
C. The number of current year CMGs in post-M.D. training increased sharply over the period 2004-05 to2013-14. The steady increase from 1600 in 2004-05 to 2516 in 2013-14 represents a 57% increase.(Figure 3)
D. Throughout the period 2004-05 to 2013-14, the number of physicians re-entering post-M.D. training isrelatively low compared to new entry physicians. In 2013-14 the number of re-entry physicians was atits lowest (n=132) and the number of new entry physicians was at its highest (n=12187). (Figure 4)
E. After two consecutive drops in 2005-06 and 2006-07, R-3 family medicine enrolment increased steadily to a high of 274 in 2013-14. The number of medical, surgical and laboratory trainees pursuingsubspecialty training increased to a high of 470 in 2013-14. (Figures 5 and 6)
The total number of post-M.D. trainees increased to 15483 in 2013-14, a 3% increase over the 2012-13 figure. Compared to 2004-05, total enrolment is 55% higher and ministry funded enrolment is 68% higher in 2013-14.
10020 10566 11191 11960 12453
13266 13912
14523 14982 15483
7317 7767 8317 8942
9439 10253 10930
11508 11931 12319
0 1000 2000 3000 4000 5000 6000 7000 8000 9000
10000 11000 12000 13000 14000 15000 16000
2004-05 2005-06 2006-07 2007-08 2008-09 2009-10 2010-11 2011-12 2012-13 2013-14
Total Number of Post-M.D. Trainees Regular Ministry Funded Trainees
1. Total Post-M.D. Trainees and Regular Ministry Funded Post-M.D. Trainees
17Recensement annuel des stagiaires post-M.D. | 2013-2014 | ANNUAL CENSUS OF POST-M.D. TRAINEES
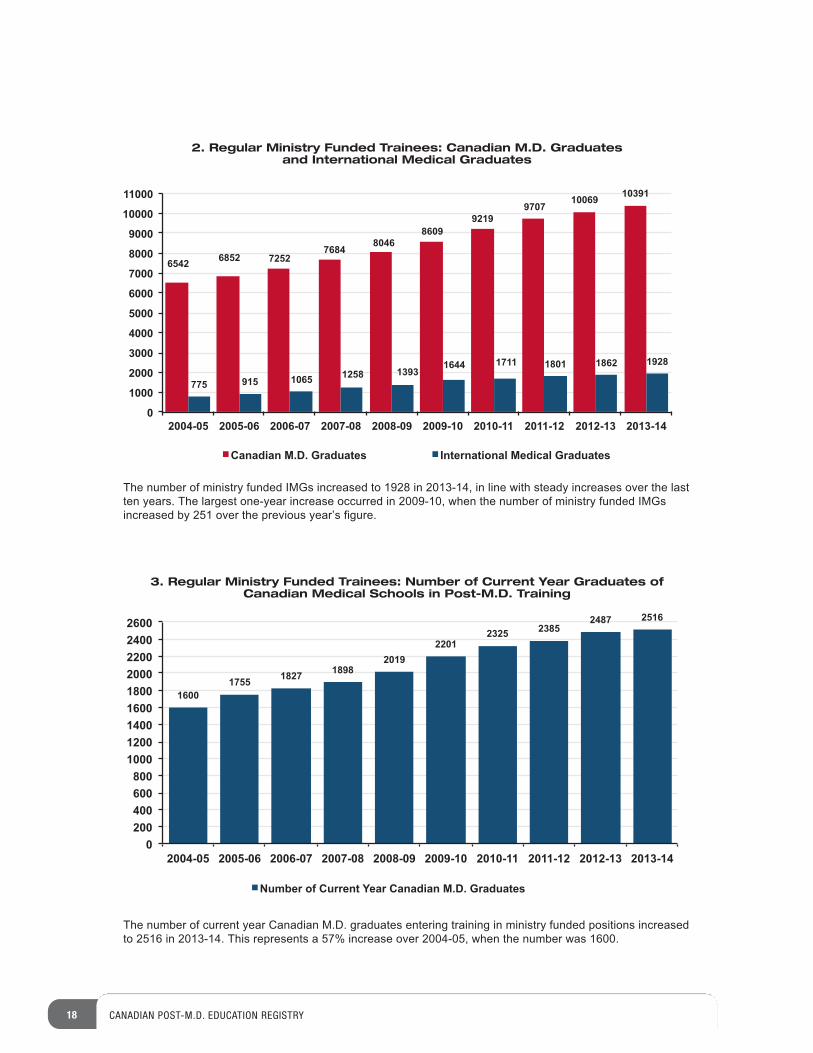
18 CANADIAN POST-M.D. EDUCATION REGISTRY
The number of ministry funded IMGs increased to 1928 in 2013-14, in line with steady increases over the last ten years. The largest one-year increase occurred in 2009-10, when the number of ministry funded IMGs increased by 251 over the previous year’s figure.
The number of current year Canadian M.D. graduates entering training in ministry funded positions increased to 2516 in 2013-14. This represents a 57% increase over 2004-05, when the number was 1600.
6542 6852 7252 7684
8046 8609
9219 9707
10069 10391
775 915 1065 1258 1393 1644 1711 1801 1862 1928
0
1000
2000
3000
4000
5000
6000
7000
8000
9000
10000
11000
2004-05 2005-06 2006-07 2007-08 2008-09 2009-10 2010-11 2011-12 2012-13 2013-14
Canadian M.D. Graduates International Medical Graduates
1600 1755 1827 1898
2019 2201
2325 2385 2487 2516
0 200 400 600 800
1000 1200 1400 1600 1800 2000 2200 2400 2600
2004-05 2005-06 2006-07 2007-08 2008-09 2009-10 2010-11 2011-12 2012-13 2013-14
Number of Current Year Canadian M.D. Graduates
2. Regular Ministry Funded Trainees: Canadian M.D. Graduates and International Medical Graduates
3. Regular Ministry Funded Trainees: Number of Current Year Graduates of Canadian Medical Schools in Post-M.D. Training
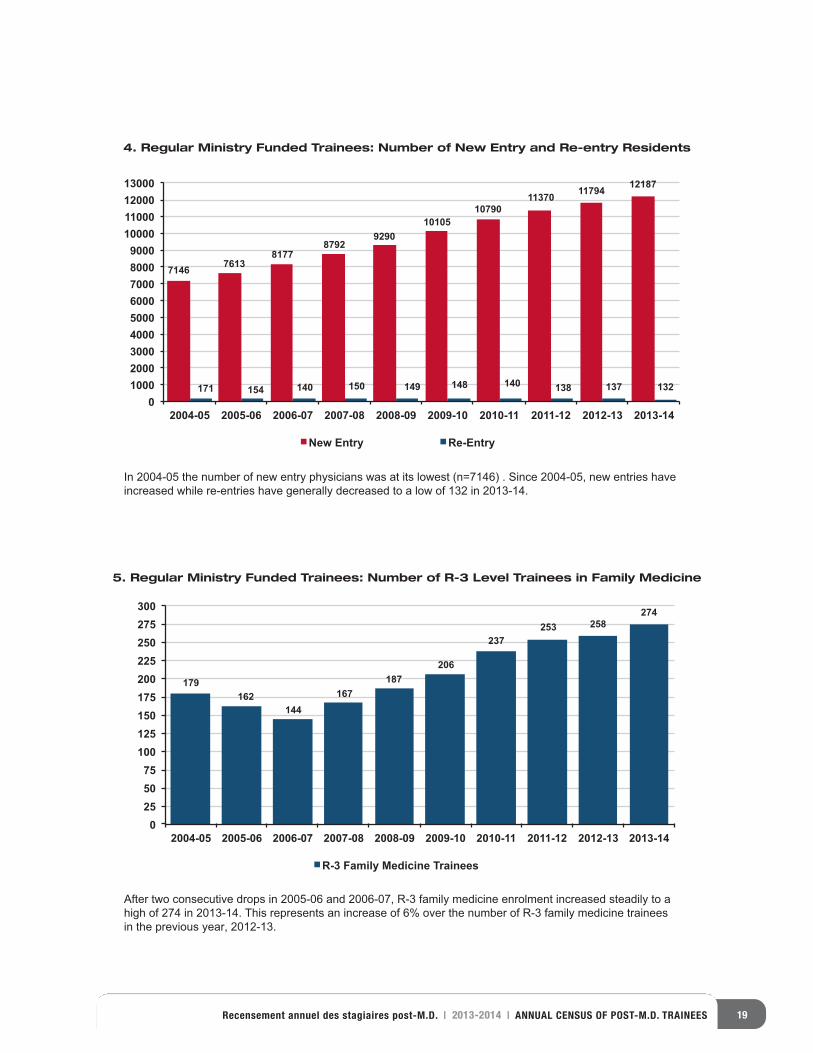
19Recensement annuel des stagiaires post-M.D. | 2013-2014 | ANNUAL CENSUS OF POST-M.D. TRAINEES
In 2004-05 the number of new entry physicians was at its lowest (n=7146) . Since 2004-05, new entries have increased while re-entries have generally decreased to a low of 132 in 2013-14.
After two consecutive drops in 2005-06 and 2006-07, R-3 family medicine enrolment increased steadily to a high of 274 in 2013-14. This represents an increase of 6% over the number of R-3 family medicine trainees in the previous year, 2012-13.
7146 7613 8177
8792 9290
10105 10790
11370 11794 12187
171 154 140 150 149 148 140 138 137 132 0
1000 2000 3000 4000 5000 6000 7000 8000 9000
10000 11000 12000 13000
2004-05 2005-06 2006-07 2007-08 2008-09 2009-10 2010-11 2011-12 2012-13 2013-14
New Entry Re-Entry
179 162
144 167
187 206
237 253 258
274
0 25 50 75
100 125 150 175 200 225 250 275 300
2004-05 2005-06 2006-07 2007-08 2008-09 2009-10 2010-11 2011-12 2012-13 2013-14
R-3 Family Medicine Trainees
4. Regular Ministry Funded Trainees: Number of New Entry and Re-entry Residents
5. Regular Ministry Funded Trainees: Number of R-3 Level Trainees in Family Medicine
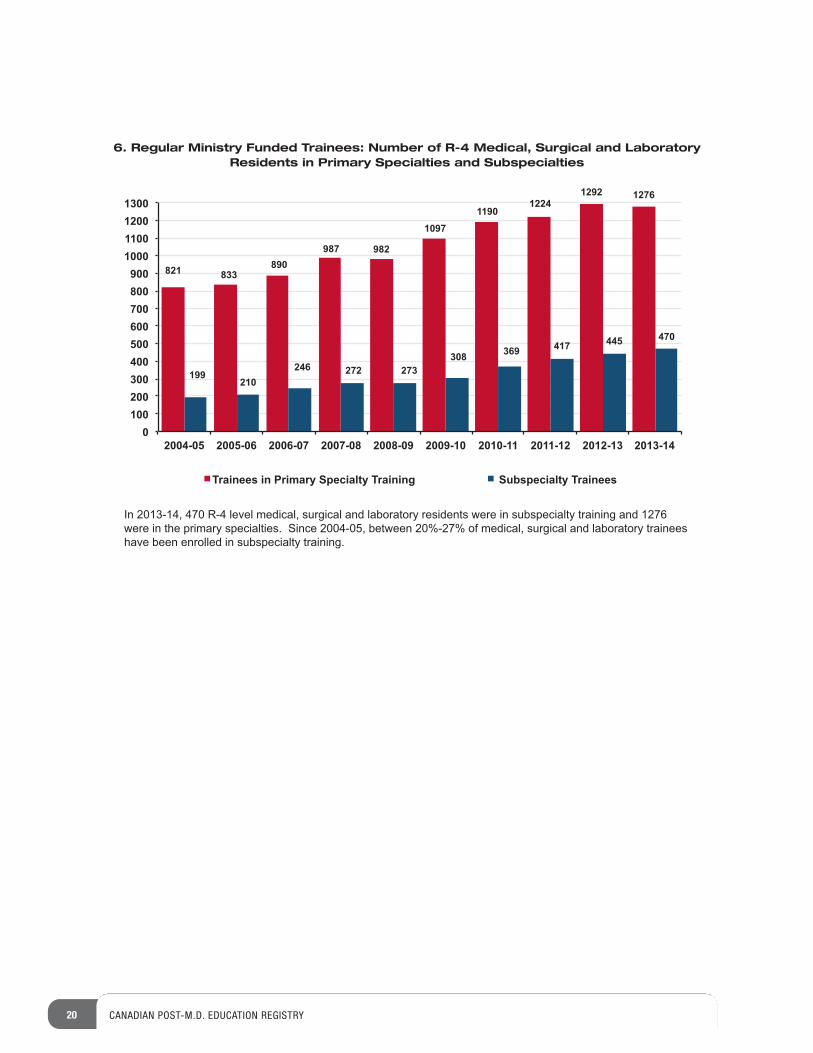
20 CANADIAN POST-M.D. EDUCATION REGISTRY
In 2013-14, 470 R-4 level medical, surgical and laboratory residents were in subspecialty training and 1276 were in the primary specialties. Since 2004-05, between 20%-27% of medical, surgical and laboratory trainees have been enrolled in subspecialty training.
821 833 890
987 982
1097 1190
1224 1292 1276
199 210
246 272 273 308 369 417 445 470
0 100 200 300 400 500 600 700 800 900
1000 1100 1200 1300
2004-05 2005-06 2006-07 2007-08 2008-09 2009-10 2010-11 2011-12 2012-13 2013-14
Trainees in Primary Specialty Training Subspecialty Trainees
6. Regular Ministry Funded Trainees: Number of R-4 Medical, Surgical and LaboratoryResidents in Primary Specialties and Subspecialties
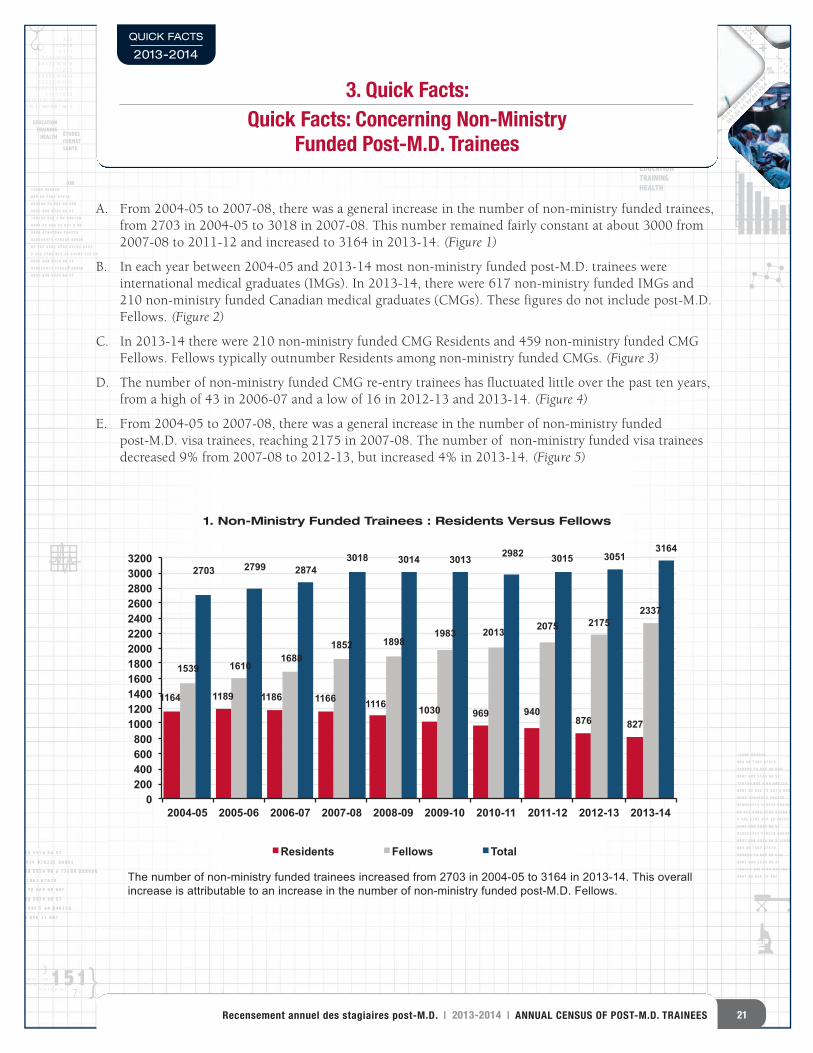
8989077 68686868689 9 5535535535534 969696 5 57
02028028402840284028474 4747479229229229 8090909009
89898989890007777 68686868689 9 9 9 5535535535534 4 4 96969696 5 5 5 12121266668989 U U U889888988898999
08089 8989 7 7 7 7867867 6 676776788
89890890890890 78 6666665 969696 680
89898989000777 68686868689 9 9 5535535535534 4 4 96969696 5 5 5777
15156154154154 845 55 64 88846156156158
898907 656565 656 7 75 8686867
45 50 261857 63 100
12689 U88989089 89 7867 67678
890890 78 665 96 6808907 689 5534 96 57
156154 845 5 64 8461588907 65 656 75 867 8 908
9809 4794Y943 Y943Y9028028474 479229 80909
89 367 9562 6782 83292 83625 382 2782 937 38 38792 723 02
4850 480 4980 890 904 60 540
3 3 32 3 3 8 8 81 1 1 13 3 3 3 12 12 124 4 3 3 2 16 16 161 1 2 2 23 3 3 3 2 14 14 142 2 2 2 3 11 11 113 3 3 2 2 13 13 12 11 1 1 1 1 5 5 513 13 12 11 11 1 61 61 60 1103 107 59 41 35 3 1 349 348 1 346 3
3 3 32 3 3 8 8 8
1 1 1 13 3 3 3 12 12 12
4 4 3 3 2 16 16 161 1 2 2 2
3 3 3 3 2 14 14 142 2 2 2 3 11 11 11
3 3 3 2 2 13 13 12 11 1 1 1 1 5 5 5
13 13 12 11 11 1 61 61 60 1103 107 59 41 35 3 1 349 348 1 346 3
2 2 13 13 12 11 1 1 1 1 5 5 5
13 13 12 11 11 1 61 61 60 1103 107 59 41 35 3 1 349 348 1 346 3
75 79 064 20 379 07 590 3 2 8
48 05 8
56 40 6
72 90 4
6
892 3
4 04 0
4 90792 6
4 8 5 8 5 8 5 4 9 3 7 0 1
4 5 0 4 5 0 1 9 7 3
EDUCATIONTRAINING
HEALTH ÉTUDESFORMAT
ION
SANTÉ
758 64 26 12
03 13 015 23
12689 U88989089 89 7867 67678
890890 78 665 96 6808907 689 5534 96 57
156154 845 5 64 8461588907 65 656 75 867 8 908
9809 4794Y943 Y943Y9028028474 479229 80909
89 367 9562 6782 83292 83625 382 2782 937 38 38792 723 02
1103 1078
%+
+ 781 5413 9
405540 466
0 1533 8
18 387
9 41 3
5 3 1
34
12689 U88989
089 89 7867 67678
890890 78 665 96 680
8907 689 5534 96 57
156154 845 5 64 846158
8907 65 656 75 867 8 90
8
9809 4794Y943 Y943Y9
028028474 479229 80909
89 367 9562 6782 83292 8362
5 382 2782 937 38 38792 723 02
8907 689 5534 96 57
028028474 479229 80909
8907 689 5534 96 57
4
{ {7
7
3
4 15103 107 59 41 35 3 1 349 303 107 59 41 35 3 1 349 3
11 11 1 61 61 60 1
1 5 2 1 5 2 1 6
4 4 5 1 5 2 8
6 4 8 2 4 6 1 2 6
12689 u88989089 89 7867 67678890890 78 665 96 6808907 689 5534 96 57156154 845 5 64 8461588907 65 656 75 867 8 9089809 4794y943 y943y9
T O
T A L
H E A L T H S A N T É
EDUCATIONÉTUDES
EDUCATIONTRAININGHEALTH
" " "" "
" "A
8
2 2 2 2 3 11 11 113 3 3 2 2 13 13 12 11 1 1 1 1 5 5 513 13 12 11 11 1 61 650 640 75 056 06 6890780 9029 068 0690667890 0 49 0463 0492
12689 U88989
089 89 7867 67678
890890 78 665 96 680
8907 689 5534 96 57
156154 845 5 64 846158
8907 65 656 75 867 8 908
9809 4794Y943 Y943Y9
028028474 479229 80909
89 367 9562 6782 83292 8362
5 382 2782 937 38 38792 723 02
8907 689 5534 96 57
028028474 479229 80909
8907 689 5534 96 5 12689 U88989
089 89 7867 67678
890890 78 665 96 680
8907 689 5534 96 57
156154 845 5 64 846158
8907 65 656 75 867
EDUCATION REGISTRY ENREGISTREMENT
D’ÉDUCATION
EDUCAT
ION REGISTRY
ENREGISTREMENT D’ÉDUCATION
3. Quick Facts: Quick Facts: Concerning Non-Ministry
Funded Post-M.D. Trainees
QUICK FACTS
2013-2014
A. From 2004-05 to 2007-08, there was a general increase in the number of non-ministry funded trainees,from 2703 in 2004-05 to 3018 in 2007-08. This number remained fairly constant at about 3000 from2007-08 to 2011-12 and increased to 3164 in 2013-14. (Figure 1)
B. In each year between 2004-05 and 2013-14 most non-ministry funded post-M.D. trainees were international medical graduates (IMGs). In 2013-14, there were 617 non-ministry funded IMGs and210 non-ministry funded Canadian medical graduates (CMGs). These figures do not include post-M.D.Fellows. (Figure 2)
C. In 2013-14 there were 210 non-ministry funded CMG Residents and 459 non-ministry funded CMGFellows. Fellows typically outnumber Residents among non-ministry funded CMGs. (Figure 3)
D. The number of non-ministry funded CMG re-entry trainees has fluctuated little over the past ten years,from a high of 43 in 2006-07 and a low of 16 in 2012-13 and 2013-14. (Figure 4)
E. From 2004-05 to 2007-08, there was a general increase in the number of non-ministry funded post-M.D. visa trainees, reaching 2175 in 2007-08. The number of non-ministry funded visa traineesdecreased 9% from 2007-08 to 2012-13, but increased 4% in 2013-14. (Figure 5)
The number of non-ministry funded trainees increased from 2703 in 2004-05 to 3164 in 2013-14. This overall increase is attributable to an increase in the number of non-ministry funded post-M.D. Fellows.
1164 1189 1186 1166 1116 1030 969 940 876 827
1539 1610 1688
1852 1898 1983 2013 2075 2175
2337
2703 2799 2874 3018 3014 3013 2982 3015 3051
3164
0 200 400 600 800
1000 1200 1400 1600 1800 2000 2200 2400 2600 2800 3000 3200
2004-05 2005-06 2006-07 2007-08 2008-09 2009-10 2010-11 2011-12 2012-13 2013-14
Residents Fellows Total
1. Non-Ministry Funded Trainees : Residents Versus Fellows
21Recensement annuel des stagiaires post-M.D. | 2013-2014 | ANNUAL CENSUS OF POST-M.D. TRAINEES
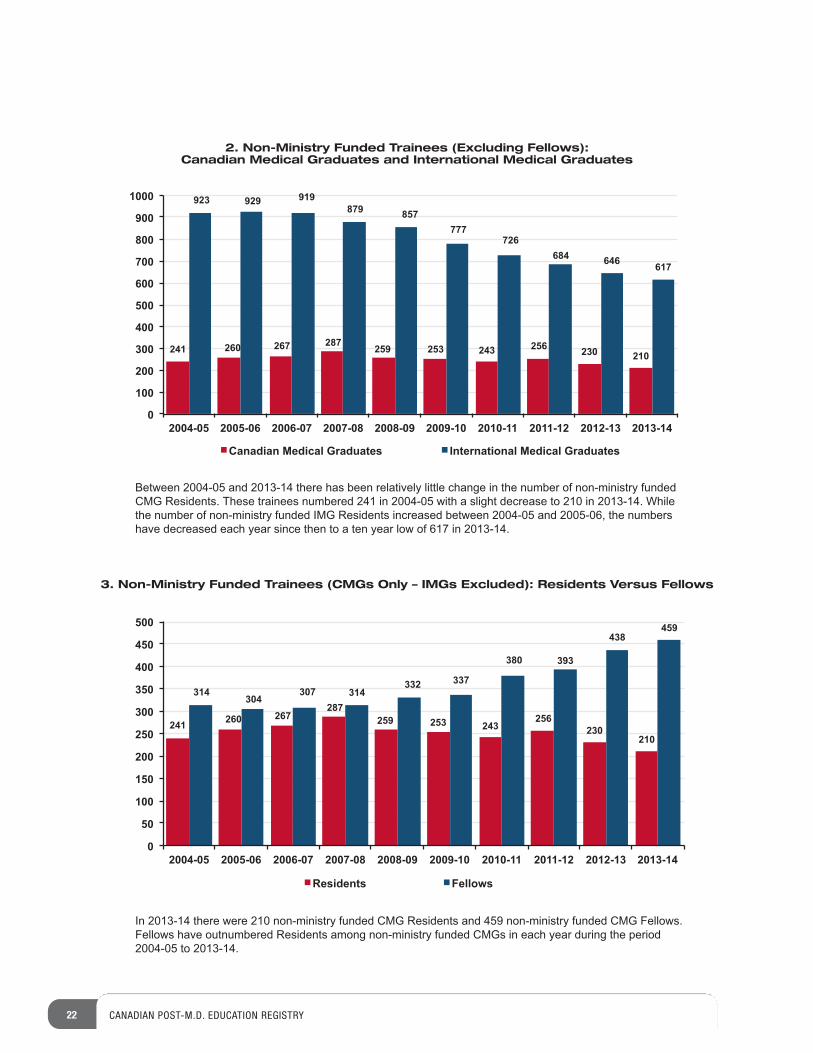
22 CANADIAN POST-M.D. EDUCATION REGISTRY
Between 2004-05 and 2013-14 there has been relatively little change in the number of non-ministry funded CMG Residents. These trainees numbered 241 in 2004-05 with a slight decrease to 210 in 2013-14. While the number of non-ministry funded IMG Residents increased between 2004-05 and 2005-06, the numbers have decreased each year since then to a ten year low of 617 in 2013-14.
In 2013-14 there were 210 non-ministry funded CMG Residents and 459 non-ministry funded CMG Fellows. Fellows have outnumbered Residents among non-ministry funded CMGs in each year during the period 2004-05 to 2013-14.
241 260 267 287 259 253 243 256 230 210
923 929 919 879 857
777 726
684 646 617
0
100
200
300
400
500
600
700
800
900
1000
2004-05 2005-06 2006-07 2007-08 2008-09 2009-10 2010-11 2011-12 2012-13 2013-14
Canadian Medical Graduates International Medical Graduates
241 260 267 287
259 253 243 256
230 210
314 304
307 314 332 337
380 393
438 459
0
50
100
150
200
250
300
350
400
450
500
2004-05 2005-06 2006-07 2007-08 2008-09 2009-10 2010-11 2011-12 2012-13 2013-14
Residents Fellows
2. Non-Ministry Funded Trainees (Excluding Fellows): Canadian Medical Graduates and International Medical Graduates
3. Non-Ministry Funded Trainees (CMGs Only – IMGs Excluded): Residents Versus Fellows
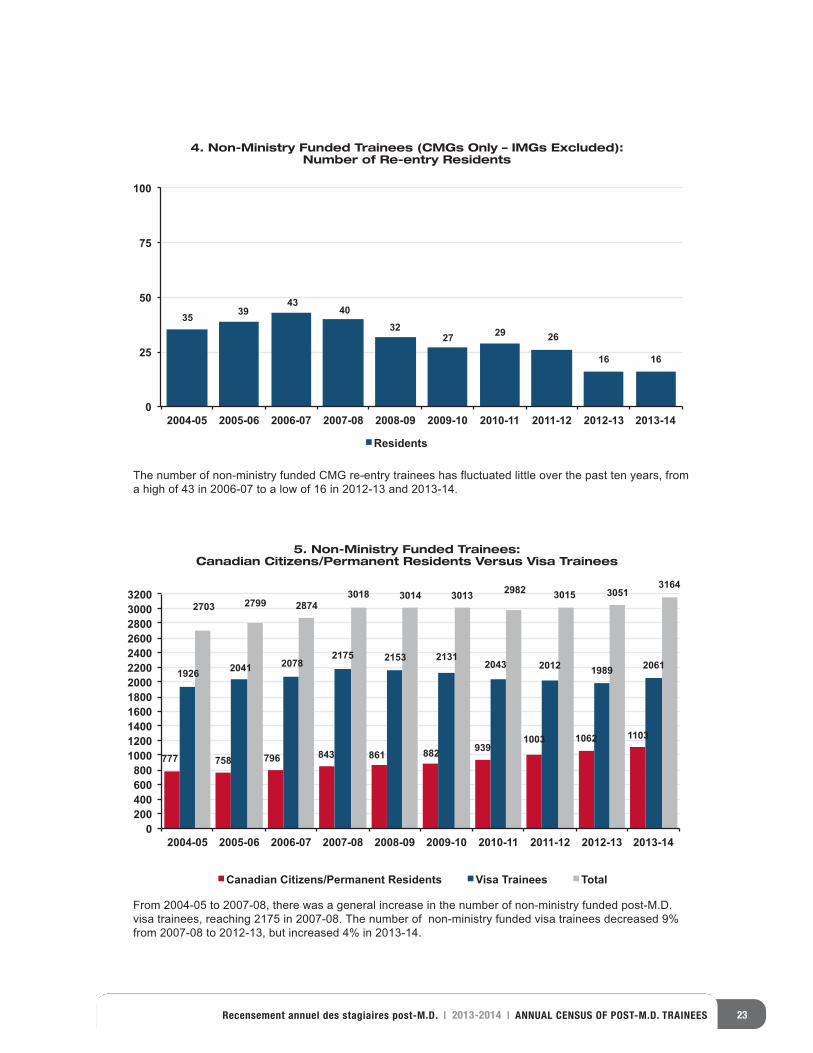
23Recensement annuel des stagiaires post-M.D. | 2013-2014 | ANNUAL CENSUS OF POST-M.D. TRAINEES
The number of non-ministry funded CMG re-entry trainees has fluctuated little over the past ten years, from a high of 43 in 2006-07 to a low of 16 in 2012-13 and 2013-14.
From 2004-05 to 2007-08, there was a general increase in the number of non-ministry funded post-M.D. visa trainees, reaching 2175 in 2007-08. The number of non-ministry funded visa trainees decreased 9% from 2007-08 to 2012-13, but increased 4% in 2013-14.
35 39 43
40
32 27 29 26
16 16
0
25
50
75
100
2004-05 2005-06 2006-07 2007-08 2008-09 2009-10 2010-11 2011-12 2012-13 2013-14
Residents
777 758 796 843 861 882 939 1003 1062 1103
1926 2041 2078 2175 2153 2131
2043 2012 1989 2061
2703 2799 2874 3018 3014 3013 2982 3015 3051
3164
0 200 400 600 800
1000 1200 1400 1600 1800 2000 2200 2400 2600 2800 3000 3200
2004-05 2005-06 2006-07 2007-08 2008-09 2009-10 2010-11 2011-12 2012-13 2013-14
Canadian Citizens/Permanent Residents Visa Trainees Total
4. Non-Ministry Funded Trainees (CMGs Only – IMGs Excluded): Number of Re-entry Residents
5. Non-Ministry Funded Trainees: Canadian Citizens/Permanent Residents Versus Visa Trainees
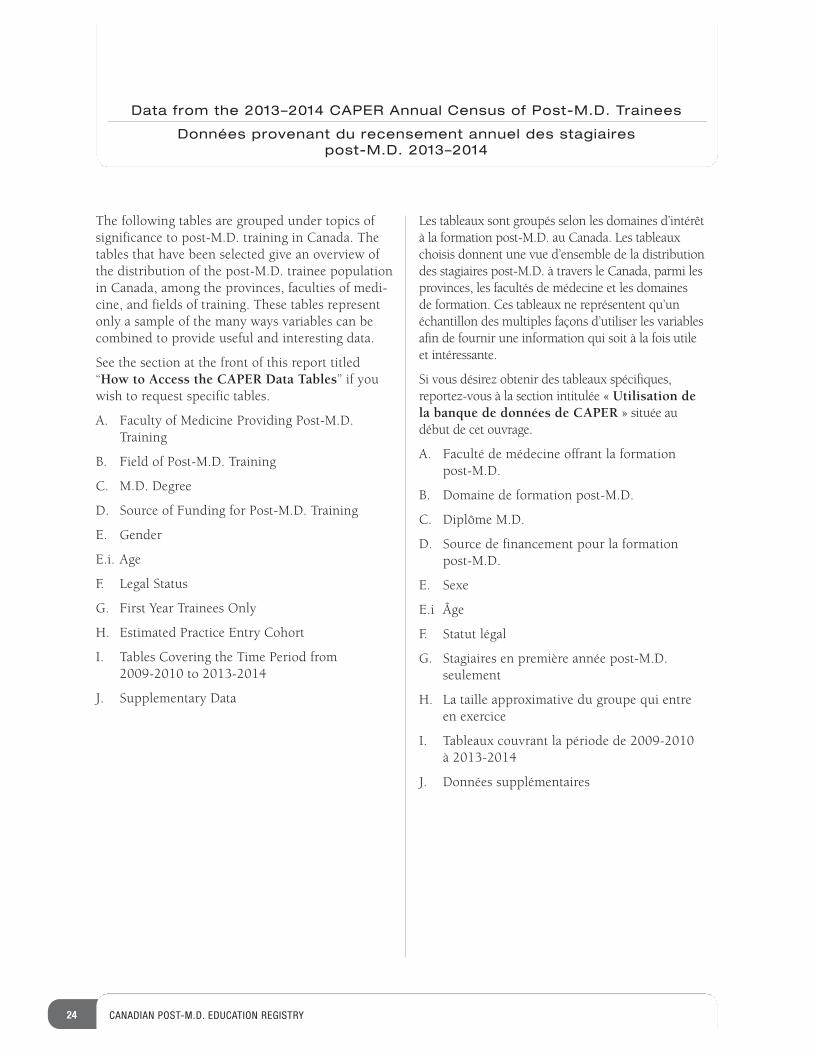
24 CANADIAN POST-M.D. EDUCATION REGISTRY
Data from the 2013–2014 CAPER Annual Census of Post-M.D. Trainees
Données provenant du recensement annuel des stagiaires post-M.D. 2013–2014
The following tables are grouped under topics ofsignificance to post-M.D. training in Canada. Thetables that have been selected give an overview ofthe distribution of the post-M.D. trainee populationin Canada, among the provinces, faculties of medi-cine, and fields of training. These tables representonly a sample of the many ways variables can becombined to provide useful and interesting data.
See the section at the front of this report titled“How to Access the CAPER Data Tables” if youwish to request specific tables.
A. Faculty of Medicine Providing Post-M.D.Training
B. Field of Post-M.D. Training
C. M.D. Degree
D. Source of Funding for Post-M.D. Training
E. Gender
E.i. Age
F. Legal Status
G. First Year Trainees Only
H. Estimated Practice Entry Cohort
I. Tables Covering the Time Period from 2009-2010 to 2013-2014
J. Supplementary Data
Les tableaux sont groupés selon les domaines d’intérêt à la formation post-M.D. au Canada. Les tableaux choisis donnent une vue d’ensemble de la distributiondes stagiaires post-M.D. à travers le Canada, parmi lesprovinces, les facultés de médecine et les domaines de formation. Ces tableaux ne représentent qu’unéchantillon des multiples façons d’utiliser les variablesafin de fournir une information qui soit à la fois utile et intéressante.
Si vous désirez obtenir des tableaux spécifiques, reportez-vous à la section intitulée « Utilisation de la banque de données de CAPER » située au début de cet ouvrage.
A. Faculté de médecine offrant la formation post-M.D.
B. Domaine de formation post-M.D.
C. Diplôme M.D.
D. Source de financement pour la formation post-M.D.
E. Sexe
E.i Âge
F. Statut légal
G. Stagiaires en première année post-M.D. seulement
H. La taille approximative du groupe qui entre en exercice
I. Tableaux couvrant la période de 2009-2010 à 2013-2014
J. Données supplémentaires
8989077 68686868689 9 5535535535534 969696 5 57
02028028402840284028474 4747479229229229 8090909009
898989890007777 68686868689 9 9 5535535535534 4 4 96969696 5 5 5 12121266668989 U U U889888988898999
08089 8989 7 7 7 7867867 6 676776788
89890890890890 78 6666665 969696 680
89898989000777 68686868689 9 9 5535535535534 4 4 96969696 5 5 5777
15156154154154 845 55 64 88846156156158
898907 656565 656 7 75 8686867
45 50 261857 63 100
12689 U88989089 89 7867 67678
890890 78 665 96 6808907 689 5534 96 57
156154 845 5 64 8461588907 65 656 75 867 8 908
9809 4794Y943 Y943Y9028028474 479229 80909
89 367 9562 6782 83292 83625 382 2782 937 38 38792 723 02
4850 480 4980 890 904 60 540
3 3 32 3 3 8 8 81 1 1 13 3 3 3 12 12 124 4 3 3 2 16 16 161 1 2 2 23 3 3 3 2 14 14 142 2 2 2 3 11 11 113 3 3 2 2 13 13 12 11 1 1 1 1 5 5 513 13 12 11 11 1 61 61 60 1103 107 59 41 35 3 1 349 348 1 346 3
3 3 32 3 3 8 8 8
1 1 1 13 3 3 3 12 12 12
4 4 3 3 2 16 16 161 1 2 2 2
3 3 3 3 2 14 14 142 2 2 2 3 11 11 11
3 3 3 2 2 13 13 12 11 1 1 1 1 5 5 5
13 13 12 11 11 1 61 61 60 1103 107 59 41 35 3 1 349 348 1 346 3
2 2 13 13 12 11 1 1 1 1 5 5 5
13 13 12 11 11 1 61 61 60 1103 107 59 41 35 3 1 349 348 1 346 3
75 79 064 20 379 07 590 3 2 8
48 05 8
56 40 6
72 90 4
6
892 3
4 04 0
4 90792 6
4 8 5 8 5 8 5 4 9 3 7 0 1
4 5 0 4 5 0 1 9 7 3
EDUCATIONTRAINING
HEALTH ÉTUDESFORMAT
ION
SANTÉ
758 64 26 12
03 13 015 23
12689 U88989089 89 7867 67678
890890 78 665 96 6808907 689 5534 96 57
156154 845 5 64 8461588907 65 656 75 867 8 908
9809 4794Y943 Y943Y9028028474 479229 80909
89 367 9562 6782 83292 83625 382 2782 937 38 38792 723 02
1103 1078
%+
+ 781 5413 9
405540 466
0 1533 8
18 387
9 41 3
5 3 1
34
12689 U88989
089 89 7867 67678
890890 78 665 96 680
8907 689 5534 96 57
156154 845 5 64 846158
8907 65 656 75 867 8 90
8
9809 4794Y943 Y943Y9
028028474 479229 80909
89 367 9562 6782 83292 8362
5 382 2782 937 38 38792 723 02
8907 689 5534 96 57
028028474 479229 80909
8907 689 5534 96 57
4
{ {7
7
3
4 15103 107 59 41 35 3 1 349 303 107 59 41 35 3 1 349 3
11 11 1 61 61 60 1
1 5 2 1 5 2 1 6
4 4 5 1 5 2 8
6 4 8 2 4 6 1 2 6
12689 u88989089 89 7867 67678890890 78 665 96 6808907 689 5534 96 57156154 845 5 64 8461588907 65 656 75 867 8 9089809 4794y943 y943y9
T O
T A L
H E A L T H S A N T É
EDUCATIONÉTUDES
EDUCATIONTRAININGHEALTH
" " "" "
" "A
8
2 2 2 2 3 11 11 113 3 3 2 2 13 13 12 11 1 1 1 1 5 5 513 13 12 11 11 1 61 650 640 75 056 06 6890780 9029 068 0690667890 0 49 0463 0492
12689 U88989
089 89 7867 67678
890890 78 665 96 680
8907 689 5534 96 57
156154 845 5 64 846158
8907 65 656 75 867 8 908
9809 4794Y943 Y943Y9
028028474 479229 80909
89 367 9562 6782 83292 8362
5 382 2782 937 38 38792 723 02
8907 689 5534 96 57
028028474 479229 80909
8907 689 5534 96 5 12689 U88989
089 89 7867 67678
890890 78 665 96 680
8907 689 5534 96 57
156154 845 5 64 846158
8907 65 656 75 867
EDUCATION REGISTRY ENREGISTREMENT
D’ÉDUCATION
EDUCAT
ION REGISTRY
ENREGISTREMENT D’ÉDUCATION
Faculty of Medicine Providing Post-M.D. TrainingFaculté de médecine offrant la formation post-M.D.
25Recensement annuel des stagiaires post-M.D. | 2013-2014 | ANNUAL CENSUS OF POST-M.D. TRAINEES
by Field of Post-M.D. Training(Table A-1) 26by Field of Post-M.D. Training (regular ministry funded trainees only)(Table A-1i)
29by Field of Post-M.D. Training(residents only – fellows not included) (Table A-1ii) 32by Field of Post-M.D. Training (visa trainees not included) (Table A-1iii) 35by Rank (Table A-2) 38by Rank (regular ministry funded trainees only) (Table A-2i) 38by Gender (visa trainees not included)(Table A-3) 39by Province of Location of University Which Awarded the M.D. Degree (Table A-4) 40by Province of Location of University Which Awarded the M.D. Degree (visa trainees not included) (Table A-4i) 41Clinician Investigator Program:Field of Post-M.D. Training by Faculty of Medicine Providing Post-M.D. Training (Table A-5) 43
par domaine de formation post-M.D. (tableau A-1)
par domaine de formation post-M.D. (stagiaires subventionnés par les
fonds ministériels habituels seulement)(tableau A-1i)
par domaine de formation post-M.D. (résidents seulement – moniteurs cliniques non compris)
(tableau A-1ii)par domaine de formation post-M.D.
(stagiaires avec permis de travail non compris) (tableau A-1iii)
par rang (tableau A-2)
par rang (stagiaires subventionnés par les fonds ministériels habituels seulement)
(tableau A-2i)par sexe (stagiaires avec permis
de travail non compris) (tableau A-3)
par province de l’université ayant décerné le doctorat en médecine
(tableau A-4)par province de l’université ayant décerné
le doctorat en médecine (stagiaires avec permis de travail non compris)
(tableau A-4i) Programme de formation de
cliniciens-chercheurs :Domaine de formation post-M.D. par faculté de médecine offrant la formation post-M.D.
(tableau A-5)
SECTION
A
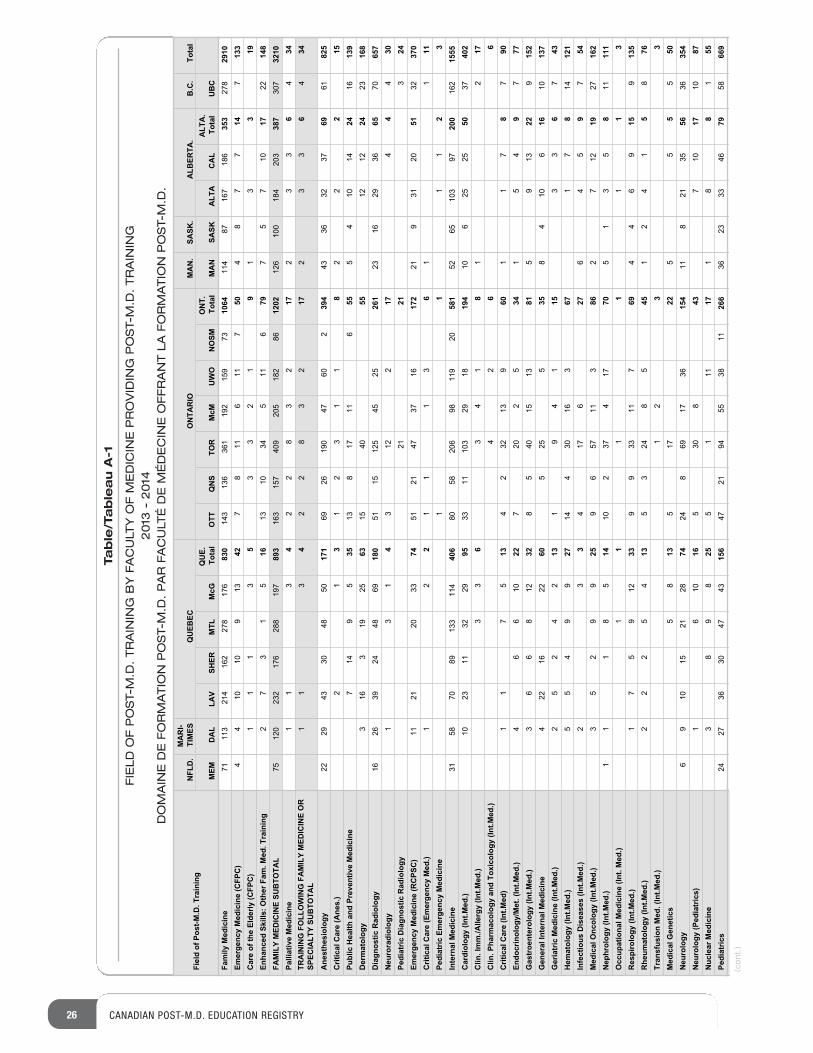
26 CANADIAN POST-M.D. EDUCATION REGISTRY
Fiel
d of
Pos
t-M.D
. Tra
inin
gN
FLD
.M
AR
I- TI
MES
QU
EBEC
ON
TAR
IOM
AN
.SA
SK.
ALB
ERTA
.B
.C.
Tota
l
MEM
DA
LLA
VSH
ERM
TLM
cGQ
UE.
To
tal
OTT
QN
STO
RM
cMU
WO
NO
SMO
NT.
To
tal
MA
NSA
SKA
LTA
CA
LA
LTA
. To
tal
UB
CFa
mily
Med
icin
eEm
erge
ncy
Med
icin
e (C
FPC
)C
are
of th
e El
derly
(CFP
C)
Enha
nced
Ski
lls: O
ther
Fam
. Med
. Tra
inin
gFA
MIL
Y M
EDIC
INE
SUB
TOTA
LPa
lliat
ive
Med
icin
eTR
AIN
ING
FO
LLO
WIN
G F
AM
ILY
MED
ICIN
E O
R
SPEC
IALT
Y SU
BTO
TAL
Ane
sthe
siol
ogy
Crit
ical
Car
e (A
nes.
)Pu
blic
Hea
lth a
nd P
reve
ntiv
e M
edic
ine
Der
mat
olog
yD
iagn
ostic
Rad
iolo
gyN
euro
radi
olog
yPe
diat
ric D
iagn
ostic
Rad
iolo
gyEm
erge
ncy
Med
icin
e (R
CPS
C)
Crit
ical
Car
e (E
mer
genc
y M
ed.)
Pedi
atric
Em
erge
ncy
Med
icin
eIn
tern
al M
edic
ine
Car
diol
ogy
(Int.M
ed.)
Clin
. Im
m./A
llerg
y (In
t.Med
.)C
lin. P
harm
acol
ogy
and
Toxi
colo
gy (I
nt.M
ed.)
Crit
ical
Car
e (In
t.Med
)En
docr
inol
ogy/
Met
. (In
t.Med
.)G
astr
oent
erol
ogy
(Int.M
ed.)
Gen
eral
Inte
rnal
Med
icin
eG
eria
tric
Med
icin
e (In
t.Med
.)H
emat
olog
y (In
t.Med
.)In
fect
ious
Dis
ease
s (In
t.Med
.)M
edic
al O
ncol
ogy
(Int.M
ed.)
Nep
hrol
ogy
(Int.M
ed.)
Occ
upat
iona
l Med
icin
e (In
t. M
ed.)
Res
piro
logy
(Int
.Med
.)R
heum
atol
ogy
(Int.M
ed.)
Tran
sfus
ion
Med
. (In
t.Med
.)M
edic
al G
enet
ics
Neu
rolo
gyN
euro
logy
(Ped
iatr
ics)
Nuc
lear
Med
icin
ePe
diat
rics
71113
214
162
278
176
830
143
136
361
192
159
7310
64114
87167
186
353
278
2910
44
1010
913
427
811
611
750
48
77
147
133
11
13
53
32
19
13
319
27
31
516
1310
345
116
797
57
1017
2214
875
120
232
176
288
197
893
163
157
409
205
182
8612
02126
100
184
203
387
307
3210
31
14
22
83
217
23
36
434
11
34
22
83
217
23
36
434
2229
4330
4850
171
6926
190
4760
239
443
3632
3769
6182
51
23
12
31
18
22
215
714
95
3513
817
116
555
410
1424
1613
93
163
1925
6315
4055
1212
2423
168
1626
3924
4869
180
5115
125
4525
261
2316
2936
6570
657
13
14
312
217
44
430
2121
324
1121
2033
7451
2147
3716
172
219
3120
5132
370
21
21
11
36
11
111
11
12
331
5870
89133
114
406
8058
206
98119
2058
152
65103
9720
0162
1555
1023
1132
2995
3311
103
2918
194
106
2525
5037
402
33
63
41
81
217
42
66
11
75
134
232
139
601
17
87
904
66
1022
720
25
341
54
97
773
66
812
328
540
1513
815
913
229
152
422
1622
605
255
358
410
616
1013
72
52
42
131
94
115
33
67
435
54
99
2714
430
163
671
78
1412
13
23
417
627
64
59
754
35
29
925
96
5711
386
27
1219
2716
21
11
85
1410
237
417
705
13
58
1111
11
11
11
13
17
59
1233
99
3311
769
44
69
159
135
22
25
413
53
248
545
12
41
58
761
23
35
813
517
225
55
550
69
1015
2128
7424
869
1736
154
118
2135
5636
354
016
116
530
843
710
1710
873
89
825
51
1117
18
81
5524
2736
3047
4315
647
2194
5538
1126
636
2333
4679
5866
9
(cont.)
Table/Tableau A-1
FIELD OF POST-M.D. TRAINING BY FACULTY OF MEDICINE PROVIDING POST-M.D. TRAINING
2013 - 2014
DOMAINE DE FORMATION POST-M.D. PAR FACULTÉ DE MÉDECINE OFFRANT LA FORMATION POST-M.D.
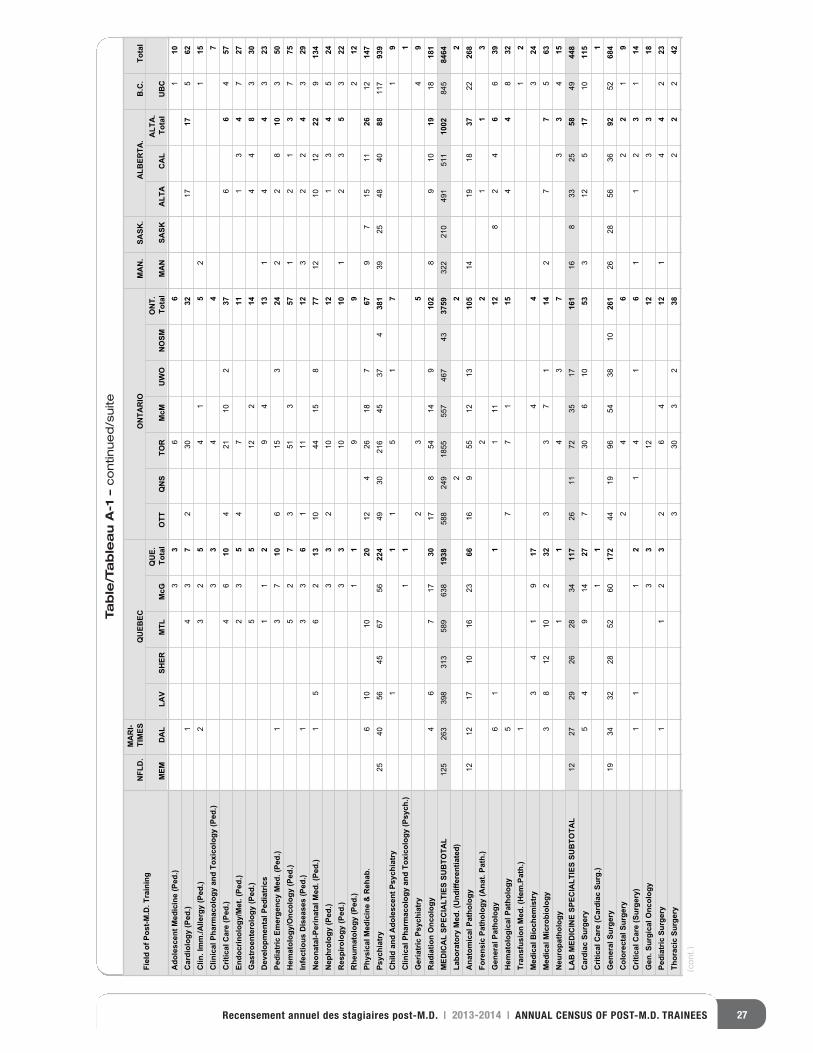
Table/Tableau A-1 –continued/suite
27Recensement annuel des stagiaires post-M.D. | 2013-2014 | ANNUAL CENSUS OF POST-M.D. TRAINEES
Fiel
d of
Pos
t-M.D
. Tra
inin
gN
FLD
.M
AR
I- TI
MES
QU
EBEC
ON
TAR
IOM
AN
.SA
SK.
ALB
ERTA
.B
.C.
Tota
l
MEM
DA
LLA
VSH
ERM
TLM
cGQ
UE.
To
tal
OTT
QN
STO
RM
cMU
WO
NO
SMO
NT.
To
tal
MA
NSA
SKA
LTA
CA
LA
LTA
. To
tal
UB
CA
dole
scen
t Med
icin
e (P
ed.)
Car
diol
ogy
(Ped
.)C
lin. I
mm
./Alle
rgy
(Ped
.)C
linic
al P
harm
acol
ogy
and
Toxi
colo
gy (P
ed.)
Crit
ical
Car
e (P
ed.)
Endo
crin
olog
y/M
et. (
Ped.
)G
astr
oent
erol
ogy
(Ped
.)D
evel
opm
enta
l Ped
iatr
ics
Pedi
atric
Em
erge
ncy
Med
. (Pe
d.)
Hem
atol
ogy/
Onc
olog
y (P
ed.)
Infe
ctio
us D
isea
ses
(Ped
.)N
eona
tal-P
erin
atal
Med
. (Pe
d.)
Nep
hrol
ogy
(Ped
.)R
espi
rolo
gy (P
ed.)
Rhe
umat
olog
y (P
ed.)
Phys
ical
Med
icin
e &
Reh
ab.
Psyc
hiat
ryC
hild
and
Ado
lesc
ent P
sych
iatr
yC
linic
al P
harm
acol
ogy
and
Toxi
colo
gy (P
sych
.)G
eria
tric
Psy
chia
try
Rad
iatio
n O
ncol
ogy
MED
ICA
L SP
ECIA
LTIE
S SU
BTO
TAL
Labo
rato
ry M
ed. (
Und
iffer
entia
ted)
Ana
tom
ical
Pat
holo
gyFo
rens
ic P
atho
logy
(Ana
t. Pa
th.)
Gen
eral
Pat
holo
gyH
emat
olog
ical
Pat
holo
gyTr
ansf
usio
n M
ed. (
Hem
.Pat
h.)
Med
ical
Bio
chem
istr
yM
edic
al M
icro
biol
ogy
Neu
ropa
thol
ogy
LAB
MED
ICIN
E SP
ECIA
LTIE
S SU
BTO
TAL
Car
diac
Sur
gery
Crit
ical
Car
e (C
ardi
ac S
urg.
)G
ener
al S
urge
ryC
olor
ecta
l Sur
gery
Crit
ical
Car
e (S
urge
ry)
Gen
. Sur
gica
l Onc
olog
yPe
diat
ric S
urge
ryTh
orac
ic S
urge
ry
33
66
110
34
17
230
3217
175
622
32
54
15
21
153
34
47
46
104
2110
237
66
457
23
54
711
13
47
275
512
214
44
83
301
12
94
131
44
323
73
110
615
324
22
810
350
52
73
513
571
21
37
753
31
61
1112
32
24
329
15
62
1310
4415
877
1210
1222
913
43
32
1012
13
45
243
310
101
23
53
221
19
92
126
1010
2012
426
187
679
715
1126
1214
725
4056
4567
5622
449
30216
4537
438
139
2548
4088
117
939
11
15
17
19
11
12
35
49
46
717
3017
854
149
102
89
1019
1818
1125
263
398
313
589
638
1938
588
249
1855
557
467
4337
59322
210
491
511
1002
845
8464
22
212
1217
1016
2366
169
5512
1310
514
1918
3722
268
22
11
36
11
111
128
24
66
395
77
115
44
832
11
23
41
917
44
324
38
1210
232
33
71
142
77
563
11
43
73
34
1512
2729
2628
3411
726
1172
3517
161
168
3325
5849
448
54
914
277
306
1053
312
517
1011
51
11
1934
3228
5260
172
4419
9654
3810
261
2628
5636
9252
684
24
62
21
91
11
21
41
61
12
31
143
312
123
318
21
13
26
412
41
42
233
303
238
22
242
(cont.)
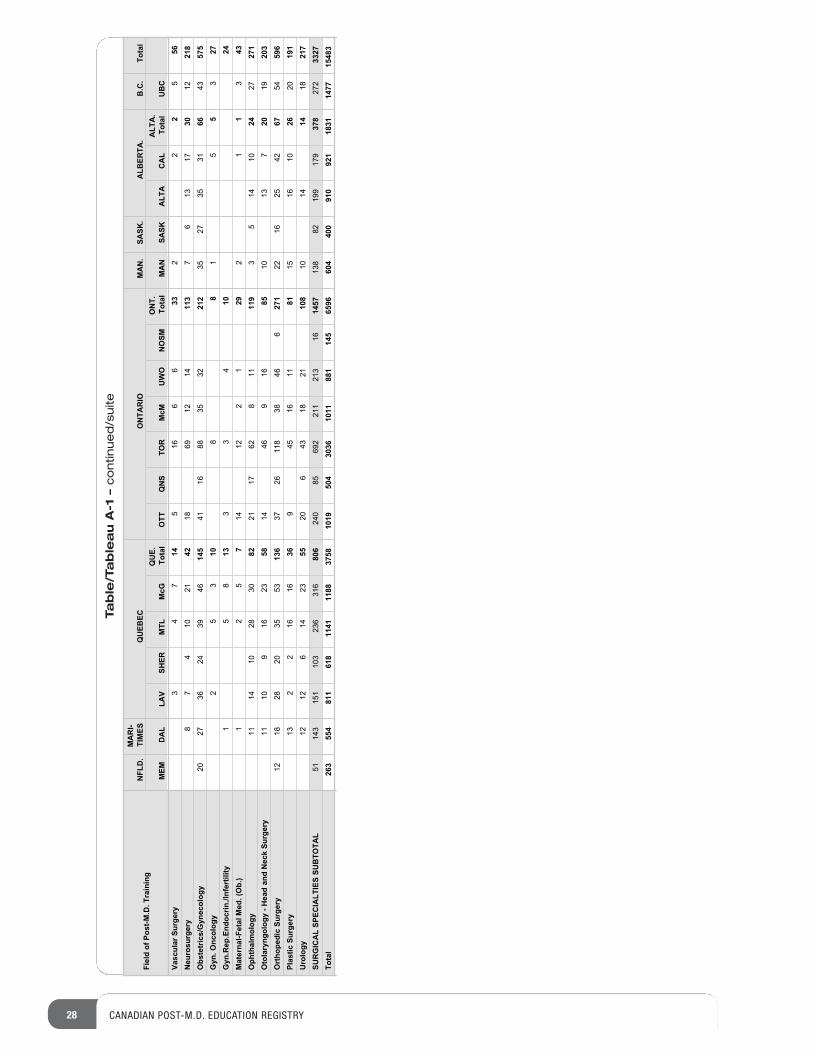
28 CANADIAN POST-M.D. EDUCATION REGISTRY
Table/Tableau A-1 –continued/suite
Fiel
d of
Pos
t-M.D
. Tra
inin
gN
FLD
.M
AR
I- TI
MES
QU
EBEC
ON
TAR
IOM
AN
.SA
SK.
ALB
ERTA
.B
.C.
Tota
l
MEM
DA
LLA
VSH
ERM
TLM
cGQ
UE.
To
tal
OTT
QN
STO
RM
cMU
WO
NO
SMO
NT.
To
tal
MA
NSA
SKA
LTA
CA
LA
LTA
. To
tal
UB
CVa
scul
ar S
urge
ryN
euro
surg
ery
Obs
tetr
ics/
Gyn
ecol
ogy
Gyn
. Onc
olog
yG
yn.R
ep.E
ndoc
rin./I
nfer
tility
Mat
erna
l-Fet
al M
ed. (
Ob.
)O
phth
alm
olog
yO
tola
ryng
olog
y - H
ead
and
Nec
k Su
rger
yO
rtho
pedi
c Su
rger
yPl
astic
Sur
gery
Uro
logy
SUR
GIC
AL
SPEC
IALT
IES
SUB
TOTA
LTo
tal
34
714
516
66
332
22
556
87
410
2142
1869
1214
113
76
1317
3012
218
2027
3624
3946
145
4116
8835
3221
235
2735
3166
4357
52
53
108
85
15
327
85
113
33
410
245
21
714
122
129
12
13
4311
1410
2830
8221
1762
811
119
35
1410
2427
271
1110
916
2358
1446
916
8510
137
2019
203
1218
2820
3553
136
3726
118
3846
627
122
1625
4267
5459
613
22
1616
369
4516
1181
1516
1026
2019
112
126
1423
5520
643
1821
108
1014
1418
217
51143
151
103
236
316
806
240
85692
211
213
1614
57138
82199
179
378
272
3327
263
554
811
618
1141
1188
3758
1019
504
3036
1011
881
145
6596
604
400
910
921
1831
1477
1548
3

29Recensement annuel des stagiaires post-M.D. | 2013-2014 | ANNUAL CENSUS OF POST-M.D. TRAINEES
Fiel
d of
Pos
t-M.D
. Tra
inin
gN
FLD
.M
AR
I- TI
MES
QU
EBEC
ON
TAR
IOM
AN
.SA
SK.
ALB
ERTA
.B
.C.
Tota
l
MEM
DA
LLA
VSH
ERM
TLM
cGQ
UE.
To
tal
OTT
QN
STO
RM
cMU
WO
NO
SMO
NT.
To
tal
MA
NSA
SKA
LTA
CA
LA
LTA
. To
tal
UB
CFa
mily
Med
icin
eEm
erge
ncy
Med
icin
e (C
FPC
)C
are
of th
e El
derly
(CFP
C)
Enha
nced
Ski
lls: O
ther
Fam
. Med
. Tra
inin
gFA
MIL
Y M
EDIC
INE
SUB
TOTA
LPa
lliat
ive
Med
icin
eTR
AIN
ING
FO
LLO
WIN
G F
AM
ILY
MED
ICIN
E O
R
SPEC
IALT
Y SU
BTO
TAL
Ane
sthe
siol
ogy
Crit
ical
Car
e (A
nes.
)Pu
blic
Hea
lth a
nd P
reve
ntiv
e M
edic
ine
Der
mat
olog
yD
iagn
ostic
Rad
iolo
gyN
euro
radi
olog
yPe
diat
ric D
iagn
ostic
Rad
iolo
gyEm
erge
ncy
Med
icin
e (R
CPS
C)
Crit
ical
Car
e (E
mer
genc
y M
ed.)
Pedi
atric
Em
erge
ncy
Med
icin
eIn
tern
al M
edic
ine
Car
diol
ogy
(Int.M
ed.)
Clin
. Im
m./A
llerg
y (In
t.Med
.)C
lin. P
harm
acol
ogy
and
Toxi
colo
gy (I
nt.M
ed.)
Crit
ical
Car
e (In
t.Med
)En
docr
inol
ogy/
Met
. (In
t.Med
.)G
astr
oent
erol
ogy
(Int.M
ed.)
Gen
eral
Inte
rnal
Med
icin
eG
eria
tric
Med
icin
e (In
t.Med
.)H
emat
olog
y (In
t.Med
.)In
fect
ious
Dis
ease
s (In
t.Med
.)M
edic
al O
ncol
ogy
(Int.M
ed.)
Nep
hrol
ogy
(Int.M
ed.)
Occ
upat
iona
l Med
icin
e (In
t. M
ed.)
Res
piro
logy
(Int
.Med
.)R
heum
atol
ogy
(Int.M
ed.)
Tran
sfus
ion
Med
. (In
t.Med
.)M
edic
al G
enet
ics
Neu
rolo
gyN
euro
logy
(Ped
iatr
ics)
71110
210
131
275
176
792
136
126
356
188
156
7310
35113
84165
182
347
276
2828
44
1010
913
427
811
611
750
48
77
147
133
11
12
43
32
19
13
318
27
21
414
1310
185
106
626
45
1015
2012
375
117
228
144
285
195
852
156
147
388
201
178
8611
56124
96180
199
379
303
3102
31
14
16
22
112
22
43
251
13
41
62
211
22
24
325
2226
4230
4837
157
5024
9838
412
253
3032
2835
6351
634
12
31
21
11
62
11
127
149
535
138
1711
655
44
1012
2216
136
216
318
1451
1435
499
1120
1713
916
2139
2446
3914
835
1560
3421
165
2316
2429
5334
476
11
11
22
22
1121
2021
6248
2145
3416
164
209
3020
5031
347
11
11
11
36
11
101
12
231
5170
89133
107
399
8058
184
87102
2053
148
6592
9318
5146
1456
615
922
1763
97
2711
1064
86
108
1815
180
32
53
31
71
215
12
33
11
72
103
110
76
271
67
348
36
68
203
92
519
13
47
656
26
57
1028
44
116
429
55
813
380
322
1622
605
125
228
410
616
1012
32
52
32
121
64
112
23
55
365
44
99
264
19
42
201
56
562
31
33
95
173
35
86
383
52
96
224
414
71
302
68
149
801
81
110
21
81
719
41
55
545
11
11
11
36
59
828
63
116
430
14
67
137
832
22
43
113
77
421
12
41
57
491
11
55
105
1116
44
44
386
610
1521
1662
198
3612
2196
88
1114
2526
237
76
113
58
720
79
167
57
(cont.)
Table/Tableau A-1i
(Regular Ministry Funded Trainees Only/stagiaires subventionnés par les fonds ministériels habituels)
FIELD OF POST-M.D. TRAINING BY FACULTY OF MEDICINE PROVIDING POST-M.D. TRAINING
2013 - 2014
DOMAINE DE FORMATION POST-M.D. PAR FACULTÉ DE MÉDECINE OFFRANT LA FORMATION POST-M.D.
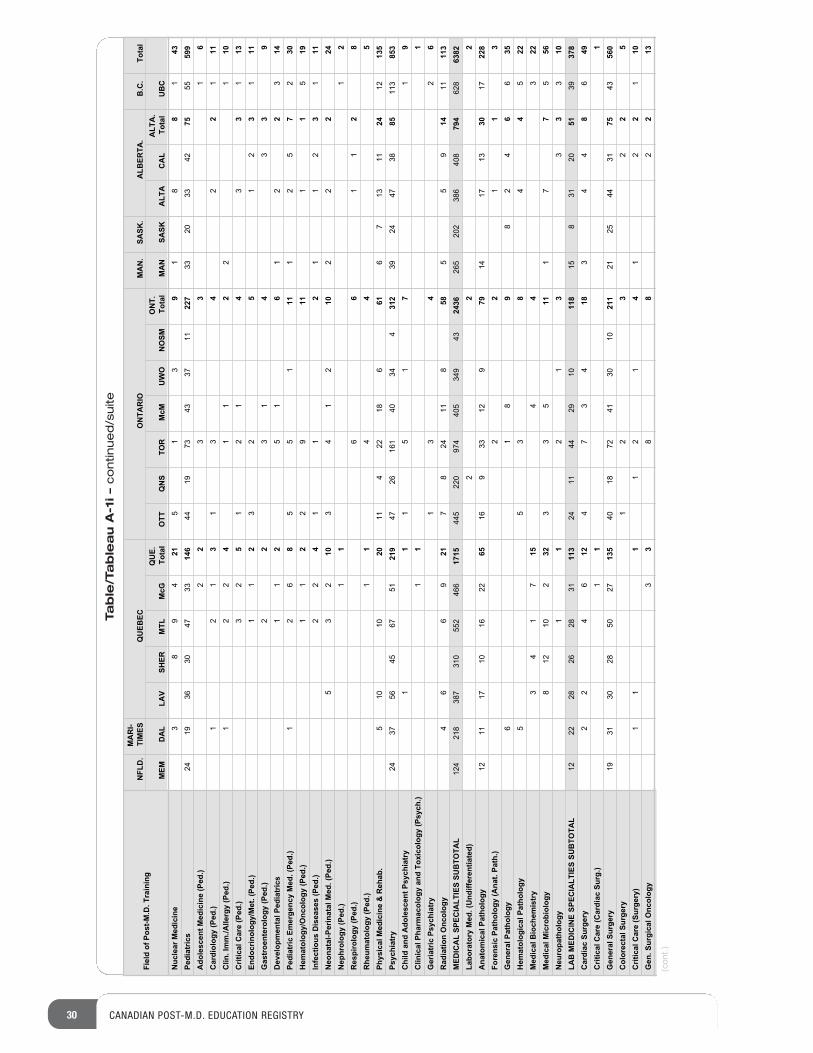
30 CANADIAN POST-M.D. EDUCATION REGISTRY
Fiel
d of
Pos
t-M.D
. Tra
inin
gN
FLD
.M
AR
I- TI
MES
QU
EBEC
ON
TAR
IOM
AN
.SA
SK.
ALB
ERTA
.B
.C.
Tota
l
MEM
DA
LLA
VSH
ERM
TLM
cGQ
UE.
To
tal
OTT
QN
STO
RM
cMU
WO
NO
SMO
NT.
To
tal
MA
NSA
SKA
LTA
CA
LA
LTA
. To
tal
UB
CN
ucle
ar M
edic
ine
Pedi
atric
sA
dole
scen
t Med
icin
e (P
ed.)
Car
diol
ogy
(Ped
.)C
lin. I
mm
./Alle
rgy
(Ped
.)C
ritic
al C
are
(Ped
.)En
docr
inol
ogy/
Met
. (Pe
d.)
Gas
troe
nter
olog
y (P
ed.)
Dev
elop
men
tal P
edia
tric
sPe
diat
ric E
mer
genc
y M
ed. (
Ped.
)H
emat
olog
y/O
ncol
ogy
(Ped
.)In
fect
ious
Dis
ease
s (P
ed.)
Neo
nata
l-Per
inat
al M
ed. (
Ped.
)N
ephr
olog
y (P
ed.)
Res
piro
logy
(Ped
.)R
heum
atol
ogy
(Ped
.)Ph
ysic
al M
edic
ine
& R
ehab
.Ps
ychi
atry
Chi
ld a
nd A
dole
scen
t Psy
chia
try
Clin
ical
Pha
rmac
olog
y an
d To
xico
logy
(Psy
ch.)
Ger
iatr
ic P
sych
iatr
yR
adia
tion
Onc
olog
yM
EDIC
AL
SPEC
IALT
IES
SUB
TOTA
LLa
bora
tory
Med
. (U
ndiff
eren
tiate
d)A
nato
mic
al P
atho
logy
Fore
nsic
Pat
holo
gy (A
nat.
Path
.)G
ener
al P
atho
logy
Hem
atol
ogic
al P
atho
logy
Med
ical
Bio
chem
istr
yM
edic
al M
icro
biol
ogy
Neu
ropa
thol
ogy
LAB
MED
ICIN
E SP
ECIA
LTIE
S SU
BTO
TAL
Car
diac
Sur
gery
Crit
ical
Car
e (C
ardi
ac S
urg.
)G
ener
al S
urge
ryC
olor
ecta
l Sur
gery
Crit
ical
Car
e (S
urge
ry)
Gen
. Sur
gica
l Onc
olog
y
38
94
215
13
91
88
143
2419
3630
4733
146
4419
7343
3711
227
3320
3342
7555
599
22
33
16
12
13
13
42
21
112
21
41
12
21
103
25
12
14
33
113
11
23
25
12
31
112
23
14
33
91
12
51
61
22
314
62
18
55
111
12
57
230
11
22
911
11
519
22
41
12
11
23
111
53
210
34
12
102
22
241
11
26
61
12
81
14
45
510
1020
114
2218
661
67
1311
2412
135
2437
5645
6751
219
4726
161
4034
431
239
2447
3885
113
853
11
15
17
19
11
11
34
26
46
69
217
824
118
585
59
1411
113
124
218
387
310
552
466
1715
445
220
974
405
349
4324
36265
202
386
408
794
628
6382
22
212
1117
1016
2265
169
3312
979
1417
1330
1722
82
21
13
61
89
82
46
635
55
38
44
522
34
17
154
43
228
1210
232
33
511
17
75
561
12
13
33
310
1222
2826
2831
113
2411
4429
1011
815
831
2051
3937
82
24
612
47
34
183
44
86
491
11
1931
3028
5027
135
4018
7241
3010
211
2125
4431
7543
560
12
32
25
11
11
21
42
12
110
33
88
22
13
(cont.)
Table/Tableau A-1i –continued/suite
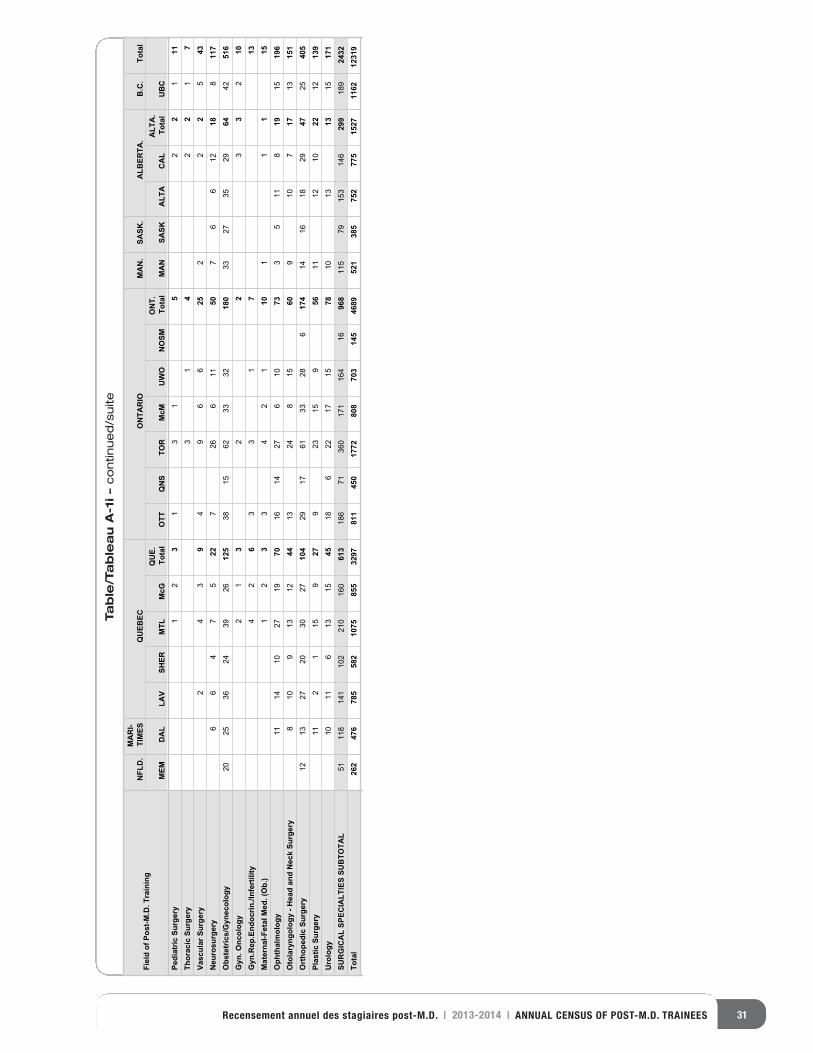
31Recensement annuel des stagiaires post-M.D. | 2013-2014 | ANNUAL CENSUS OF POST-M.D. TRAINEES
Fiel
d of
Pos
t-M.D
. Tra
inin
gN
FLD
.M
AR
I- TI
MES
QU
EBEC
ON
TAR
IOM
AN
.SA
SK.
ALB
ERTA
.B
.C.
Tota
l
MEM
DA
LLA
VSH
ERM
TLM
cGQ
UE.
To
tal
OTT
QN
STO
RM
cMU
WO
NO
SMO
NT.
To
tal
MA
NSA
SKA
LTA
CA
LA
LTA
. To
tal
UB
CPe
diat
ric S
urge
ryTh
orac
ic S
urge
ryVa
scul
ar S
urge
ryN
euro
surg
ery
Obs
tetr
ics/
Gyn
ecol
ogy
Gyn
. Onc
olog
yG
yn.R
ep.E
ndoc
rin./I
nfer
tility
Mat
erna
l-Fet
al M
ed. (
Ob.
)O
phth
alm
olog
yO
tola
ryng
olog
y - H
ead
and
Nec
k Su
rger
yO
rtho
pedi
c Su
rger
yPl
astic
Sur
gery
Uro
logy
SUR
GIC
AL
SPEC
IALT
IES
SUB
TOTA
LTo
tal
12
31
31
52
21
113
14
22
17
24
39
49
66
252
22
543
66
47
522
726
611
507
66
1218
811
720
2536
2439
2612
538
1562
3332
180
3327
3529
6442
516
21
32
23
32
104
26
33
17
131
23
34
21
101
11
1511
1410
2719
7016
1427
610
733
511
819
1519
68
109
1312
4413
248
1560
910
717
1315
112
1327
2030
2710
429
1761
3328
617
414
1618
2947
2540
511
21
159
279
2315
956
1112
1022
1213
910
116
1315
4518
622
1715
7810
1313
1517
151
118
141
102
210
160
613
186
71360
171
164
1696
8115
79153
146
299
189
2432
262
476
785
582
1075
855
3297
811
450
1772
808
703
145
4689
521
385
752
775
1527
1162
1231
9
Table/Tableau A-1i –continued/suite
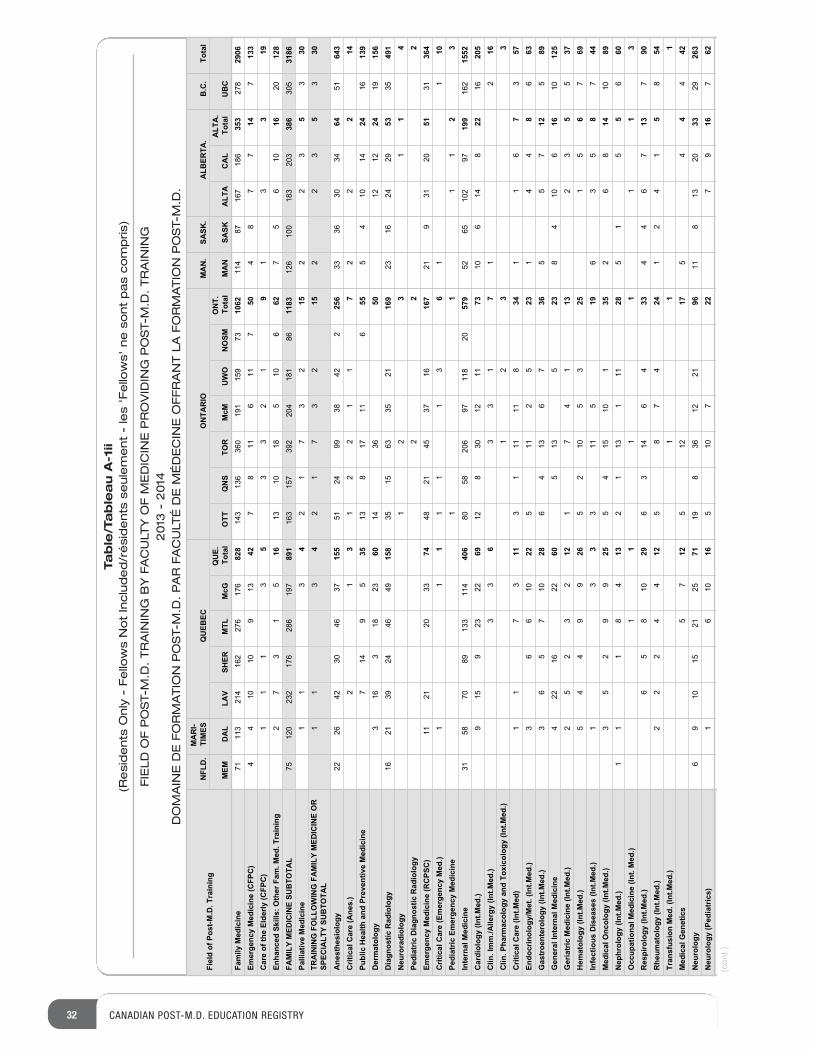
32 CANADIAN POST-M.D. EDUCATION REGISTRY
Fiel
d of
Pos
t-M.D
. Tra
inin
gN
FLD
.M
AR
I- TI
MES
QU
EBEC
ON
TAR
IOM
AN
.SA
SK.
ALB
ERTA
.B
.C.
Tota
l
MEM
DA
LLA
VSH
ERM
TLM
cGQ
UE.
To
tal
OTT
QN
STO
RM
cMU
WO
NO
SMO
NT.
To
tal
MA
NSA
SKA
LTA
CA
LA
LTA
. To
tal
UB
CFa
mily
Med
icin
eEm
erge
ncy
Med
icin
e (C
FPC
)C
are
of th
e El
derly
(CFP
C)
Enha
nced
Ski
lls: O
ther
Fam
. Med
. Tra
inin
gFA
MIL
Y M
EDIC
INE
SUB
TOTA
LPa
lliat
ive
Med
icin
eTR
AIN
ING
FO
LLO
WIN
G F
AM
ILY
MED
ICIN
E O
R
SPEC
IALT
Y SU
BTO
TAL
Ane
sthe
siol
ogy
Crit
ical
Car
e (A
nes.
)Pu
blic
Hea
lth a
nd P
reve
ntiv
e M
edic
ine
Der
mat
olog
yD
iagn
ostic
Rad
iolo
gyN
euro
radi
olog
yPe
diat
ric D
iagn
ostic
Rad
iolo
gyEm
erge
ncy
Med
icin
e (R
CPS
C)
Crit
ical
Car
e (E
mer
genc
y M
ed.)
Pedi
atric
Em
erge
ncy
Med
icin
eIn
tern
al M
edic
ine
Car
diol
ogy
(Int.M
ed.)
Clin
. Im
m./A
llerg
y (In
t.Med
.)C
lin. P
harm
acol
ogy
and
Toxi
colo
gy (I
nt.M
ed.)
Crit
ical
Car
e (In
t.Med
)En
docr
inol
ogy/
Met
. (In
t.Med
.)G
astr
oent
erol
ogy
(Int.M
ed.)
Gen
eral
Inte
rnal
Med
icin
eG
eria
tric
Med
icin
e (In
t.Med
.)H
emat
olog
y (In
t.Med
.)In
fect
ious
Dis
ease
s (In
t.Med
.)M
edic
al O
ncol
ogy
(Int.M
ed.)
Nep
hrol
ogy
(Int.M
ed.)
Occ
upat
iona
l Med
icin
e (In
t. M
ed.)
Res
piro
logy
(Int
.Med
.)R
heum
atol
ogy
(Int.M
ed.)
Tran
sfus
ion
Med
. (In
t.Med
.)M
edic
al G
enet
ics
Neu
rolo
gyN
euro
logy
(Ped
iatr
ics)
71113
214
162
276
176
828
143
136
360
191
159
7310
62114
87167
186
353
278
2906
44
1010
913
427
811
611
750
48
77
147
133
11
13
53
32
19
13
319
27
31
516
1310
185
106
627
56
1016
2012
875
120
232
176
286
197
891
163
157
392
204
181
8611
83126
100
183
203
386
305
3186
31
14
21
73
215
22
35
330
11
34
21
73
215
22
35
330
2226
4230
4637
155
5124
9938
422
256
3336
3034
6451
643
12
31
22
11
72
22
147
149
535
138
1711
655
54
1014
2416
139
316
318
2360
1436
5012
1224
1915
616
2139
2446
4915
835
1563
3521
169
2316
2429
5335
491
12
31
14
22
211
2120
3374
4821
4537
1616
721
931
2051
3136
41
11
11
13
61
110
11
11
23
3158
7089
133
114
406
8058
206
97118
2057
952
65102
9719
9162
1552
915
923
2269
128
3012
1173
106
148
2216
205
33
63
31
71
216
12
33
11
73
113
111
118
341
16
73
573
66
1022
511
25
231
44
86
633
65
710
286
413
67
365
57
125
894
2216
2260
513
523
84
106
1610
125
25
23
212
17
41
132
35
537
54
49
926
52
105
325
15
67
693
13
311
519
63
58
744
35
29
925
54
1510
135
26
814
1089
11
18
413
21
131
1128
51
55
660
11
11
11
36
58
1029
63
146
433
44
67
137
902
22
44
125
87
424
12
41
58
541
11
57
125
1217
45
44
426
910
1521
2571
198
3612
2196
118
1320
3329
263
016
116
510
722
79
167
62
(cont.)
Table/Tableau A-1ii
(Residents Only - Fellows Not Included/résidents seulement - les 'Fellows' ne sont pas compris)
FIELD OF POST-M.D. TRAINING BY FACULTY OF MEDICINE PROVIDING POST-M.D. TRAINING
2013 - 2014
DOMAINE DE FORMATION POST-M.D. PAR FACULTÉ DE MÉDECINE OFFRANT LA FORMATION POST-M.D.
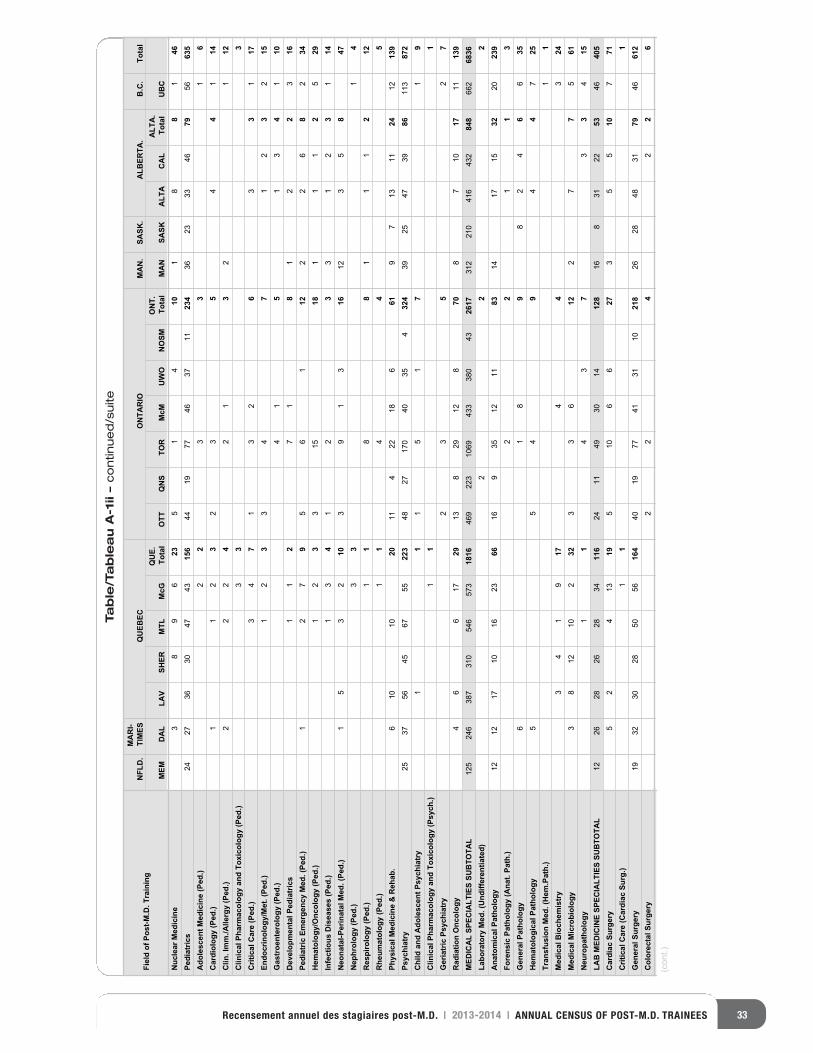
33Recensement annuel des stagiaires post-M.D. | 2013-2014 | ANNUAL CENSUS OF POST-M.D. TRAINEES
Table/Tableau A-1ii –continued/suite
Fiel
d of
Pos
t-M.D
. Tra
inin
gN
FLD
.M
AR
I- TI
MES
QU
EBEC
ON
TAR
IOM
AN
.SA
SK.
ALB
ERTA
.B
.C.
Tota
l
MEM
DA
LLA
VSH
ERM
TLM
cGQ
UE.
To
tal
OTT
QN
STO
RM
cMU
WO
NO
SMO
NT.
To
tal
MA
NSA
SKA
LTA
CA
LA
LTA
. To
tal
UB
CN
ucle
ar M
edic
ine
Pedi
atric
sA
dole
scen
t Med
icin
e (P
ed.)
Car
diol
ogy
(Ped
.)C
lin. I
mm
./Alle
rgy
(Ped
.)C
linic
al P
harm
acol
ogy
and
Toxi
colo
gy (P
ed.)
Crit
ical
Car
e (P
ed.)
Endo
crin
olog
y/M
et. (
Ped.
)G
astr
oent
erol
ogy
(Ped
.)D
evel
opm
enta
l Ped
iatr
ics
Pedi
atric
Em
erge
ncy
Med
. (Pe
d.)
Hem
atol
ogy/
Onc
olog
y (P
ed.)
Infe
ctio
us D
isea
ses
(Ped
.)N
eona
tal-P
erin
atal
Med
. (Pe
d.)
Nep
hrol
ogy
(Ped
.)R
espi
rolo
gy (P
ed.)
Rhe
umat
olog
y (P
ed.)
Phys
ical
Med
icin
e &
Reh
ab.
Psyc
hiat
ryC
hild
and
Ado
lesc
ent P
sych
iatr
yC
linic
al P
harm
acol
ogy
and
Toxi
colo
gy (P
sych
.)G
eria
tric
Psy
chia
try
Rad
iatio
n O
ncol
ogy
MED
ICA
L SP
ECIA
LTIE
S SU
BTO
TAL
Labo
rato
ry M
ed. (
Und
iffer
entia
ted)
Ana
tom
ical
Pat
holo
gyFo
rens
ic P
atho
logy
(Ana
t. Pa
th.)
Gen
eral
Pat
holo
gyH
emat
olog
ical
Pat
holo
gyTr
ansf
usio
n M
ed. (
Hem
.Pat
h.)
Med
ical
Bio
chem
istr
yM
edic
al M
icro
biol
ogy
Neu
ropa
thol
ogy
LAB
MED
ICIN
E SP
ECIA
LTIE
S SU
BTO
TAL
Car
diac
Sur
gery
Crit
ical
Car
e (C
ardi
ac S
urg.
)G
ener
al S
urge
ryC
olor
ecta
l Sur
gery
38
96
235
14
101
88
146
2427
3630
4743
156
4419
7746
3711
234
3623
3346
7956
635
22
33
16
21
13
23
54
41
142
22
42
13
21
123
33
34
71
32
63
31
171
23
34
71
23
215
41
51
34
110
11
27
18
12
23
167
21
95
61
122
26
82
341
23
315
181
11
25
291
34
12
33
12
31
141
53
210
39
13
1612
35
847
33
14
11
88
11
12
121
14
45
610
1020
114
2218
661
97
1311
2412
139
2537
5645
6755
223
4827
170
4035
432
439
2547
3986
113
872
11
15
17
19
11
12
35
27
46
617
2913
829
128
708
710
1711
139
125
246
387
310
546
573
1816
469
223
1069
433
380
4326
17312
210
416
432
848
662
6836
22
212
1217
1016
2366
169
3512
1183
1417
1532
2023
92
21
13
61
89
82
46
635
55
49
44
725
11
34
19
174
43
243
812
102
323
36
122
77
561
11
43
73
34
1512
2628
2628
3411
624
1149
3014
128
168
3122
5346
405
52
413
195
106
627
35
510
771
11
119
3230
2850
5616
440
1977
4131
1021
826
2848
3179
4661
22
24
22
6
(cont.)
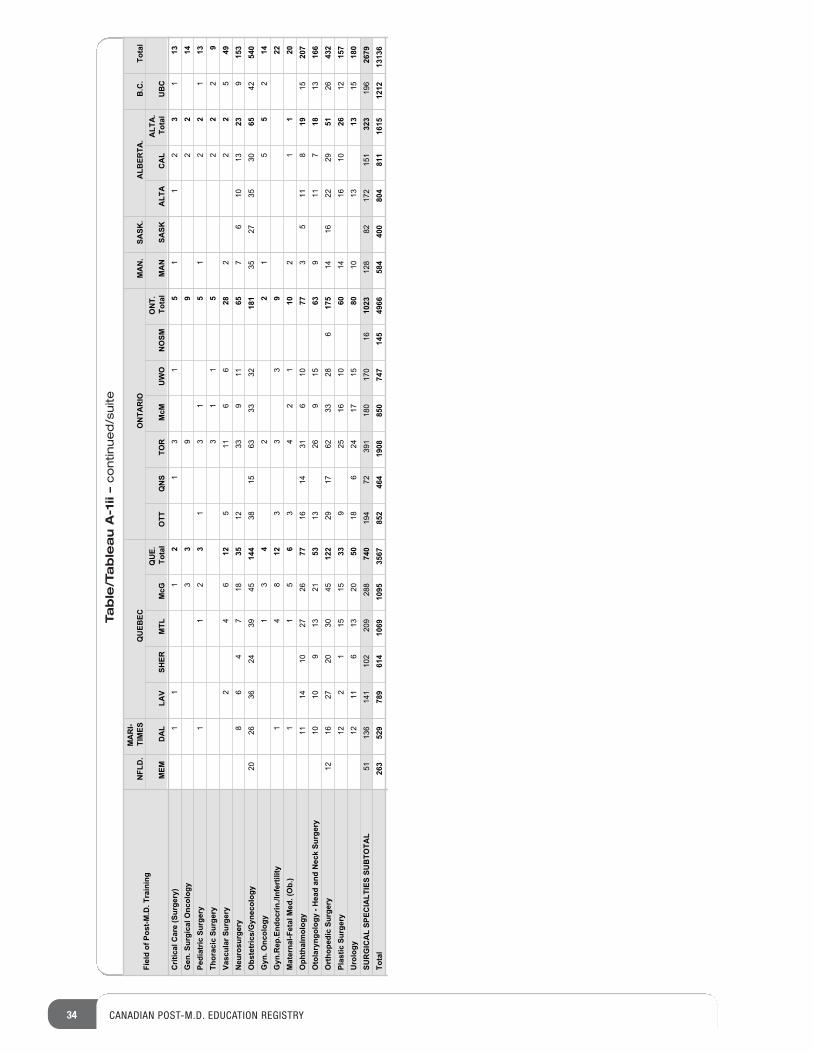
34 CANADIAN POST-M.D. EDUCATION REGISTRY
Table/Tableau A-1ii –continued/suite
Fiel
d of
Pos
t-M.D
. Tra
inin
gN
FLD
.M
AR
I- TI
MES
QU
EBEC
ON
TAR
IOM
AN
.SA
SK.
ALB
ERTA
.B
.C.
Tota
l
MEM
DA
LLA
VSH
ERM
TLM
cGQ
UE.
To
tal
OTT
QN
STO
RM
cMU
WO
NO
SMO
NT.
To
tal
MA
NSA
SKA
LTA
CA
LA
LTA
. To
tal
UB
CC
ritic
al C
are
(Sur
gery
)G
en. S
urgi
cal O
ncol
ogy
Pedi
atric
Sur
gery
Thor
acic
Sur
gery
Vasc
ular
Sur
gery
Neu
rosu
rger
yO
bste
tric
s/G
ynec
olog
yG
yn. O
ncol
ogy
Gyn
.Rep
.End
ocrin
./Inf
ertil
ityM
ater
nal-F
etal
Med
. (O
b.)
Oph
thal
mol
ogy
Oto
lary
ngol
ogy
- Hea
d an
d N
eck
Surg
ery
Ort
hope
dic
Surg
ery
Plas
tic S
urge
ryU
rolo
gySU
RG
ICA
L SP
ECIA
LTIE
S SU
BTO
TAL
Tota
l
11
12
13
15
11
23
113
33
99
22
142
11
31
31
52
12
113
31
15
22
29
24
612
511
66
282
22
549
86
47
1835
1233
911
657
610
1323
915
320
2636
2439
4514
438
1563
3332
181
3527
3530
6542
540
13
42
25
15
214
84
112
33
39
225
11
63
42
110
12
120
1114
1027
2677
1614
316
1077
35
118
1915
207
1010
913
2153
1326
915
639
117
1813
166
1216
2720
3045
122
2917
6233
286
175
1416
2229
5126
432
122
115
1533
925
1610
6014
1610
2612
157
1211
613
2050
186
2417
1580
1013
1315
180
51136
141
102
209
288
740
194
72391
180
170
1610
23128
82172
151
323
196
2679
263
529
789
614
1069
1095
3567
852
464
1908
850
747
145
4966
584
400
804
811
1615
1212
1313
6
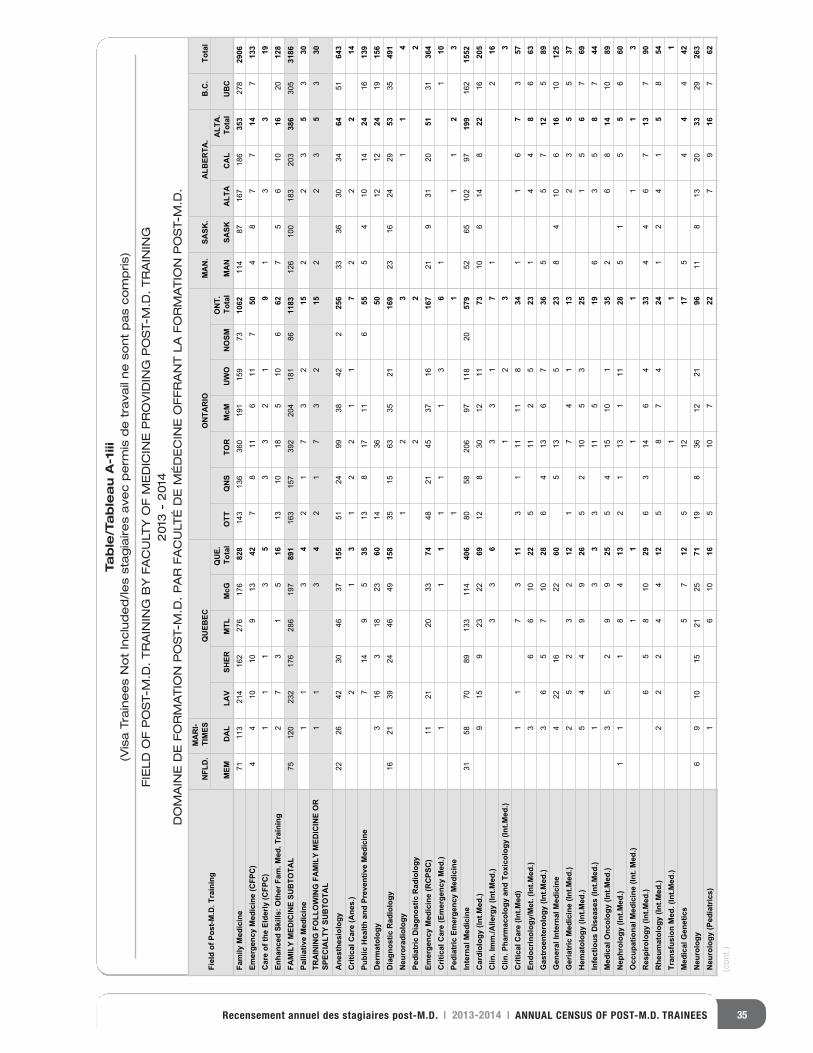
35Recensement annuel des stagiaires post-M.D. | 2013-2014 | ANNUAL CENSUS OF POST-M.D. TRAINEES
Fiel
d of
Pos
t-M.D
. Tra
inin
gN
FLD
.M
AR
I- TI
MES
QU
EBEC
ON
TAR
IOM
AN
.SA
SK.
ALB
ERTA
.B
.C.
Tota
l
MEM
DA
LLA
VSH
ERM
TLM
cGQ
UE.
To
tal
OTT
QN
STO
RM
cMU
WO
NO
SMO
NT.
To
tal
MA
NSA
SKA
LTA
CA
LA
LTA
. To
tal
UB
CFa
mily
Med
icin
eEm
erge
ncy
Med
icin
e (C
FPC
)C
are
of th
e El
derly
(CFP
C)
Enha
nced
Ski
lls: O
ther
Fam
. Med
. Tra
inin
gFA
MIL
Y M
EDIC
INE
SUB
TOTA
LPa
lliat
ive
Med
icin
eTR
AIN
ING
FO
LLO
WIN
G F
AM
ILY
MED
ICIN
E O
R
SPEC
IALT
Y SU
BTO
TAL
Ane
sthe
siol
ogy
Crit
ical
Car
e (A
nes.
)Pu
blic
Hea
lth a
nd P
reve
ntiv
e M
edic
ine
Der
mat
olog
yD
iagn
ostic
Rad
iolo
gyN
euro
radi
olog
yPe
diat
ric D
iagn
ostic
Rad
iolo
gyEm
erge
ncy
Med
icin
e (R
CPS
C)
Crit
ical
Car
e (E
mer
genc
y M
ed.)
Pedi
atric
Em
erge
ncy
Med
icin
eIn
tern
al M
edic
ine
Car
diol
ogy
(Int.M
ed.)
Clin
. Im
m./A
llerg
y (In
t.Med
.)C
lin. P
harm
acol
ogy
and
Toxi
colo
gy (I
nt.M
ed.)
Crit
ical
Car
e (In
t.Med
)En
docr
inol
ogy/
Met
. (In
t.Med
.)G
astr
oent
erol
ogy
(Int.M
ed.)
Gen
eral
Inte
rnal
Med
icin
eG
eria
tric
Med
icin
e (In
t.Med
.)H
emat
olog
y (In
t.Med
.)In
fect
ious
Dis
ease
s (In
t.Med
.)M
edic
al O
ncol
ogy
(Int.M
ed.)
Nep
hrol
ogy
(Int.M
ed.)
Occ
upat
iona
l Med
icin
e (In
t. M
ed.)
Res
piro
logy
(Int
.Med
.)R
heum
atol
ogy
(Int.M
ed.)
Tran
sfus
ion
Med
. (In
t.Med
.)M
edic
al G
enet
ics
Neu
rolo
gyN
euro
logy
(Ped
iatr
ics)
71113
214
162
276
176
828
143
136
360
191
159
7310
62114
87167
186
353
278
2906
44
1010
913
427
811
611
750
48
77
147
133
11
13
53
32
19
13
319
27
31
516
1310
185
106
627
56
1016
2012
875
120
232
176
286
197
891
163
157
392
204
181
8611
83126
100
183
203
386
305
3186
31
14
21
73
215
22
35
330
11
34
21
73
215
22
35
330
2226
4230
4637
155
5124
9938
422
256
3336
3034
6451
643
12
31
22
11
72
22
147
149
535
138
1711
655
54
1014
2416
139
316
318
2360
1436
5012
1224
1915
616
2139
2446
4915
835
1563
3521
169
2316
2429
5335
491
12
31
14
22
211
2120
3374
4821
4537
1616
721
931
2051
3136
41
11
11
13
61
110
11
11
23
3158
7089
133
114
406
8058
206
97118
2057
952
65102
9719
9162
1552
915
923
2269
128
3012
1173
106
148
2216
205
33
63
31
71
216
12
33
11
73
113
111
118
341
16
73
573
66
1022
511
25
231
44
86
633
65
710
286
413
67
365
57
125
894
2216
2260
513
523
84
106
1610
125
25
23
212
17
41
132
35
537
54
49
926
52
105
325
15
67
693
13
311
519
63
58
744
35
29
925
54
1510
135
26
814
1089
11
18
413
21
131
1128
51
55
660
11
11
11
36
58
1029
63
146
433
44
67
137
902
22
44
125
87
424
12
41
58
541
11
57
125
1217
45
44
426
910
1521
2571
198
3612
2196
118
1320
3329
263
016
116
510
722
79
167
62
(cont.)
Table/Tableau A-1iii
(Visa Trainees Not Included/les stagiaires avec permis de travail ne sont pas compris)
FIELD OF POST-M.D. TRAINING BY FACULTY OF MEDICINE PROVIDING POST-M.D. TRAINING
2013 - 2014
DOMAINE DE FORMATION POST-M.D. PAR FACULTÉ DE MÉDECINE OFFRANT LA FORMATION POST-M.D.
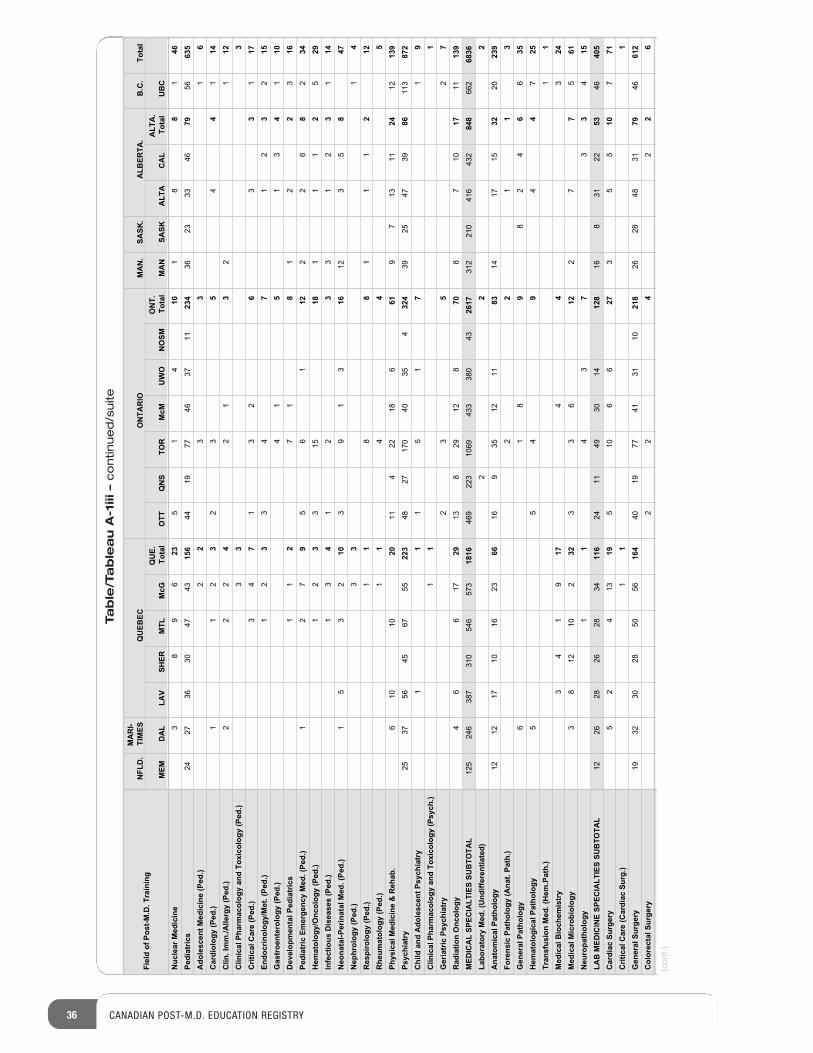
36 CANADIAN POST-M.D. EDUCATION REGISTRY
Table/Tableau A-1iii –continued/suite
Fiel
d of
Pos
t-M.D
. Tra
inin
gN
FLD
.M
AR
I- TI
MES
QU
EBEC
ON
TAR
IOM
AN
.SA
SK.
ALB
ERTA
.B
.C.
Tota
l
MEM
DA
LLA
VSH
ERM
TLM
cGQ
UE.
To
tal
OTT
QN
STO
RM
cMU
WO
NO
SMO
NT.
To
tal
MA
NSA
SKA
LTA
CA
LA
LTA
. To
tal
UB
CN
ucle
ar M
edic
ine
Pedi
atric
sA
dole
scen
t Med
icin
e (P
ed.)
Car
diol
ogy
(Ped
.)C
lin. I
mm
./Alle
rgy
(Ped
.)C
linic
al P
harm
acol
ogy
and
Toxi
colo
gy (P
ed.)
Crit
ical
Car
e (P
ed.)
Endo
crin
olog
y/M
et. (
Ped.
)G
astr
oent
erol
ogy
(Ped
.)D
evel
opm
enta
l Ped
iatr
ics
Pedi
atric
Em
erge
ncy
Med
. (Pe
d.)
Hem
atol
ogy/
Onc
olog
y (P
ed.)
Infe
ctio
us D
isea
ses
(Ped
.)N
eona
tal-P
erin
atal
Med
. (Pe
d.)
Nep
hrol
ogy
(Ped
.)R
espi
rolo
gy (P
ed.)
Rhe
umat
olog
y (P
ed.)
Phys
ical
Med
icin
e &
Reh
ab.
Psyc
hiat
ryC
hild
and
Ado
lesc
ent P
sych
iatr
yC
linic
al P
harm
acol
ogy
and
Toxi
colo
gy (P
sych
.)G
eria
tric
Psy
chia
try
Rad
iatio
n O
ncol
ogy
MED
ICA
L SP
ECIA
LTIE
S SU
BTO
TAL
Labo
rato
ry M
ed. (
Und
iffer
entia
ted)
Ana
tom
ical
Pat
holo
gyFo
rens
ic P
atho
logy
(Ana
t. Pa
th.)
Gen
eral
Pat
holo
gyH
emat
olog
ical
Pat
holo
gyTr
ansf
usio
n M
ed. (
Hem
.Pat
h.)
Med
ical
Bio
chem
istr
yM
edic
al M
icro
biol
ogy
Neu
ropa
thol
ogy
LAB
MED
ICIN
E SP
ECIA
LTIE
S SU
BTO
TAL
Car
diac
Sur
gery
Crit
ical
Car
e (C
ardi
ac S
urg.
)G
ener
al S
urge
ryC
olor
ecta
l Sur
gery
38
96
235
14
101
88
146
2427
3630
4743
156
4419
7746
3711
234
3623
3346
7956
635
22
33
16
21
13
23
54
41
142
22
42
13
21
123
33
34
71
32
63
31
171
23
34
71
23
215
41
51
34
110
11
27
18
12
23
167
21
95
61
122
26
82
341
23
315
181
11
25
291
34
12
33
12
31
141
53
210
39
13
1612
35
847
33
14
11
88
11
12
121
14
45
610
1020
114
2218
661
97
1311
2412
139
2537
5645
6755
223
4827
170
4035
432
439
2547
3986
113
872
11
15
17
19
11
12
35
27
46
617
2913
829
128
708
710
1711
139
125
246
387
310
546
573
1816
469
223
1069
433
380
4326
17312
210
416
432
848
662
6836
22
212
1217
1016
2366
169
3512
1183
1417
1532
2023
92
21
13
61
89
82
46
635
55
49
44
725
11
34
19
174
43
243
812
102
323
36
122
77
561
11
43
73
34
1512
2628
2628
3411
624
1149
3014
128
168
3122
5346
405
52
413
195
106
627
35
510
771
11
119
3230
2850
5616
440
1977
4131
1021
826
2848
3179
4661
22
24
22
6
(cont.)
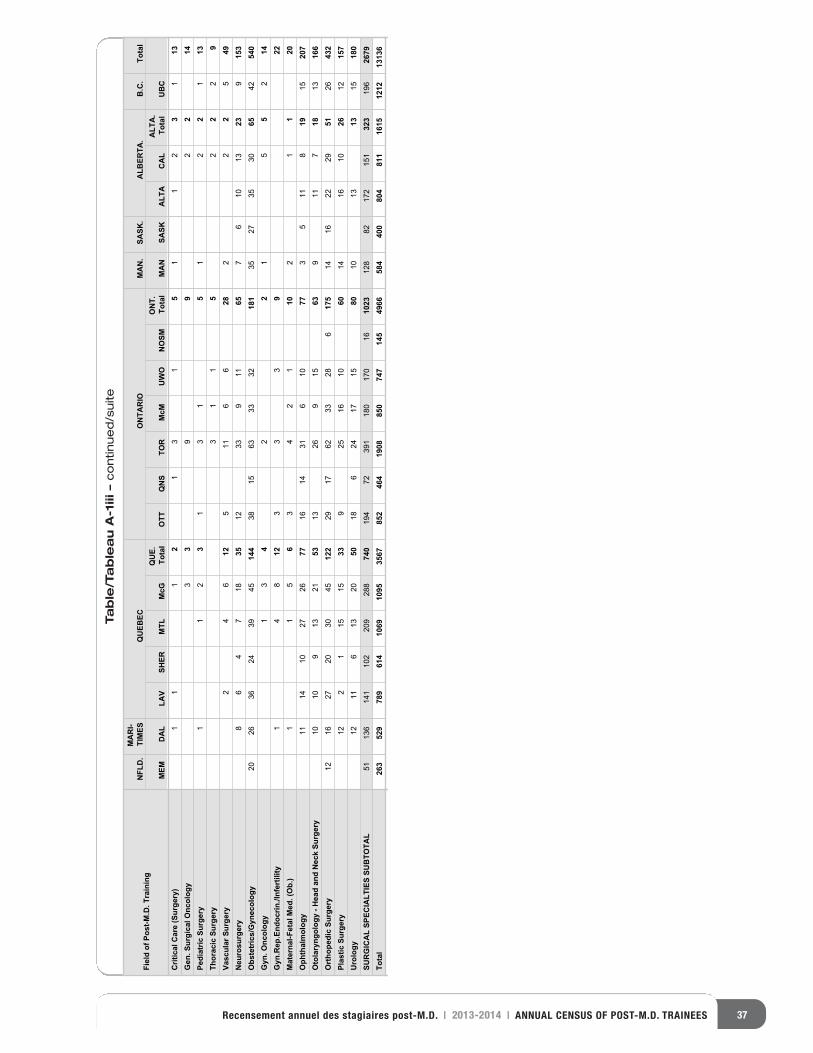
37Recensement annuel des stagiaires post-M.D. | 2013-2014 | ANNUAL CENSUS OF POST-M.D. TRAINEES
Table/Tableau A-1iii –continued/suite
Fiel
d of
Pos
t-M.D
. Tra
inin
gN
FLD
.M
AR
I- TI
MES
QU
EBEC
ON
TAR
IOM
AN
.SA
SK.
ALB
ERTA
.B
.C.
Tota
l
MEM
DA
LLA
VSH
ERM
TLM
cGQ
UE.
To
tal
OTT
QN
STO
RM
cMU
WO
NO
SMO
NT.
To
tal
MA
NSA
SKA
LTA
CA
LA
LTA
. To
tal
UB
CC
ritic
al C
are
(Sur
gery
)G
en. S
urgi
cal O
ncol
ogy
Pedi
atric
Sur
gery
Thor
acic
Sur
gery
Vasc
ular
Sur
gery
Neu
rosu
rger
yO
bste
tric
s/G
ynec
olog
yG
yn. O
ncol
ogy
Gyn
.Rep
.End
ocrin
./Inf
ertil
ityM
ater
nal-F
etal
Med
. (O
b.)
Oph
thal
mol
ogy
Oto
lary
ngol
ogy
- Hea
d an
d N
eck
Surg
ery
Ort
hope
dic
Surg
ery
Plas
tic S
urge
ryU
rolo
gySU
RG
ICA
L SP
ECIA
LTIE
S SU
BTO
TAL
Tota
l
11
12
13
15
11
23
113
33
99
22
142
11
31
31
52
12
113
31
15
22
29
24
612
511
66
282
22
549
86
47
1835
1233
911
657
610
1323
915
320
2636
2439
4514
438
1563
3332
181
3527
3530
6542
540
13
42
25
15
214
84
112
33
39
225
11
63
42
110
12
120
1114
1027
2677
1614
316
1077
35
118
1915
207
1010
913
2153
1326
915
639
117
1813
166
1216
2720
3045
122
2917
6233
286
175
1416
2229
5126
432
122
115
1533
925
1610
6014
1610
2612
157
1211
613
2050
186
2417
1580
1013
1315
180
51136
141
102
209
288
740
194
72391
180
170
1610
23128
82172
151
323
196
2679
263
529
789
614
1069
1095
3567
852
464
1908
850
747
145
4966
584
400
804
811
1615
1212
1313
6
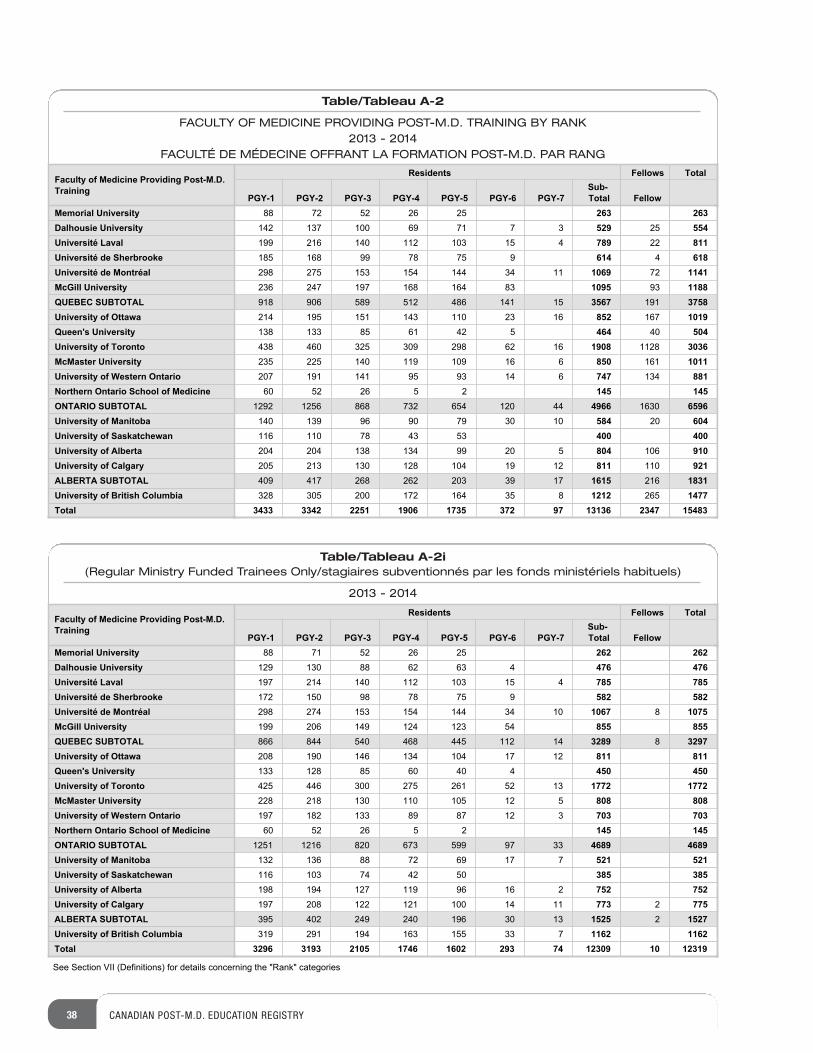
Table/Tableau A-2
FACULTY OF MEDICINE PROVIDING POST-M.D. TRAINING BY RANK2013 - 2014
FACULTÉ DE MÉDECINE OFFRANT LA FORMATION POST-M.D. PAR RANG
38 CANADIAN POST-M.D. EDUCATION REGISTRY
Faculty of Medicine Providing Post-M.D. Training
Residents Fellows Total
PGY-1 PGY-2 PGY-3 PGY-4 PGY-5 PGY-6 PGY-7Sub-Total Fellow
Memorial UniversityDalhousie UniversityUniversité LavalUniversité de SherbrookeUniversité de MontréalMcGill UniversityQUEBEC SUBTOTALUniversity of OttawaQueen's UniversityUniversity of TorontoMcMaster UniversityUniversity of Western OntarioNorthern Ontario School of MedicineONTARIO SUBTOTALUniversity of ManitobaUniversity of SaskatchewanUniversity of AlbertaUniversity of CalgaryALBERTA SUBTOTALUniversity of British ColumbiaTotal
88 72 52 26 25 263 263142 137 100 69 71 7 3 529 25 554199 216 140 112 103 15 4 789 22 811185 168 99 78 75 9 614 4 618298 275 153 154 144 34 11 1069 72 1141236 247 197 168 164 83 1095 93 1188918 906 589 512 486 141 15 3567 191 3758214 195 151 143 110 23 16 852 167 1019138 133 85 61 42 5 464 40 504438 460 325 309 298 62 16 1908 1128 3036235 225 140 119 109 16 6 850 161 1011207 191 141 95 93 14 6 747 134 88160 52 26 5 2 145 145
1292 1256 868 732 654 120 44 4966 1630 6596140 139 96 90 79 30 10 584 20 604116 110 78 43 53 400 400204 204 138 134 99 20 5 804 106 910205 213 130 128 104 19 12 811 110 921409 417 268 262 203 39 17 1615 216 1831328 305 200 172 164 35 8 1212 265 1477
3433 3342 2251 1906 1735 372 97 13136 2347 15483
Table/Tableau A-2i(Regular Ministry Funded Trainees Only/stagiaires subventionnés par les fonds ministériels habituels)
2013 - 2014
Faculty of Medicine Providing Post-M.D. Training
Residents Fellows Total
PGY-1 PGY-2 PGY-3 PGY-4 PGY-5 PGY-6 PGY-7Sub-Total Fellow
Memorial UniversityDalhousie UniversityUniversité LavalUniversité de SherbrookeUniversité de MontréalMcGill UniversityQUEBEC SUBTOTALUniversity of OttawaQueen's UniversityUniversity of TorontoMcMaster UniversityUniversity of Western OntarioNorthern Ontario School of MedicineONTARIO SUBTOTALUniversity of ManitobaUniversity of SaskatchewanUniversity of AlbertaUniversity of CalgaryALBERTA SUBTOTALUniversity of British ColumbiaTotal
88 71 52 26 25 262 262129 130 88 62 63 4 476 476197 214 140 112 103 15 4 785 785172 150 98 78 75 9 582 582298 274 153 154 144 34 10 1067 8 1075199 206 149 124 123 54 855 855866 844 540 468 445 112 14 3289 8 3297208 190 146 134 104 17 12 811 811133 128 85 60 40 4 450 450425 446 300 275 261 52 13 1772 1772228 218 130 110 105 12 5 808 808197 182 133 89 87 12 3 703 703
60 52 26 5 2 145 1451251 1216 820 673 599 97 33 4689 4689
132 136 88 72 69 17 7 521 521116 103 74 42 50 385 385198 194 127 119 96 16 2 752 752197 208 122 121 100 14 11 773 2 775395 402 249 240 196 30 13 1525 2 1527319 291 194 163 155 33 7 1162 1162
3296 3193 2105 1746 1602 293 74 12309 10 12319
See Section VII (Definitions) for details concerning the "Rank" categories
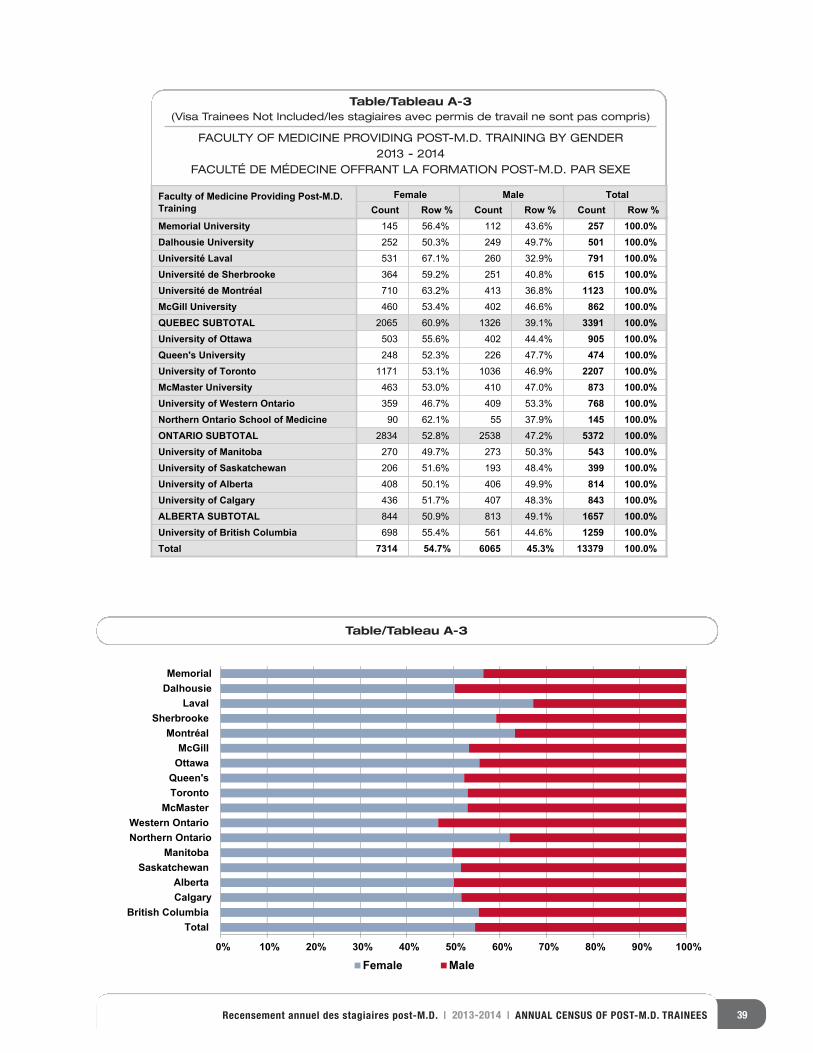
39Recensement annuel des stagiaires post-M.D. | 2013-2014 | ANNUAL CENSUS OF POST-M.D. TRAINEES
Table/Tableau A-3(Visa Trainees Not Included/les stagiaires avec permis de travail ne sont pas compris)
FACULTY OF MEDICINE PROVIDING POST-M.D. TRAINING BY GENDER2013 - 2014
FACULTÉ DE MÉDECINE OFFRANT LA FORMATION POST-M.D. PAR SEXE
TotalBritish Columbia
CalgaryAlberta
SaskatchewanManitoba
Northern OntarioWestern Ontario
McMasterTorontoQueen's
OttawaMcGill
MontréalSherbrooke
LavalDalhousieMemorial
Female Male
Table/Tableau A-3
0% 10% 20% 30% 40% 50% 60% 70% 80% 90% 100%
Faculty of Medicine Providing Post-M.D. Training
Female Male TotalCount Row % Count Row % Count Row %
Memorial UniversityDalhousie UniversityUniversité LavalUniversité de SherbrookeUniversité de MontréalMcGill UniversityQUEBEC SUBTOTALUniversity of OttawaQueen's UniversityUniversity of TorontoMcMaster UniversityUniversity of Western OntarioNorthern Ontario School of MedicineONTARIO SUBTOTALUniversity of ManitobaUniversity of SaskatchewanUniversity of AlbertaUniversity of CalgaryALBERTA SUBTOTALUniversity of British ColumbiaTotal
145 56.4% 112 43.6% 257 100.0%252 50.3% 249 49.7% 501 100.0%531 67.1% 260 32.9% 791 100.0%364 59.2% 251 40.8% 615 100.0%710 63.2% 413 36.8% 1123 100.0%460 53.4% 402 46.6% 862 100.0%2065 60.9% 1326 39.1% 3391 100.0%503 55.6% 402 44.4% 905 100.0%248 52.3% 226 47.7% 474 100.0%1171 53.1% 1036 46.9% 2207 100.0%463 53.0% 410 47.0% 873 100.0%359 46.7% 409 53.3% 768 100.0%90 62.1% 55 37.9% 145 100.0%
2834 52.8% 2538 47.2% 5372 100.0%270 49.7% 273 50.3% 543 100.0%206 51.6% 193 48.4% 399 100.0%408 50.1% 406 49.9% 814 100.0%436 51.7% 407 48.3% 843 100.0%844 50.9% 813 49.1% 1657 100.0%698 55.4% 561 44.6% 1259 100.0%
7314 54.7% 6065 45.3% 13379 100.0%
Table/Tableau A-3
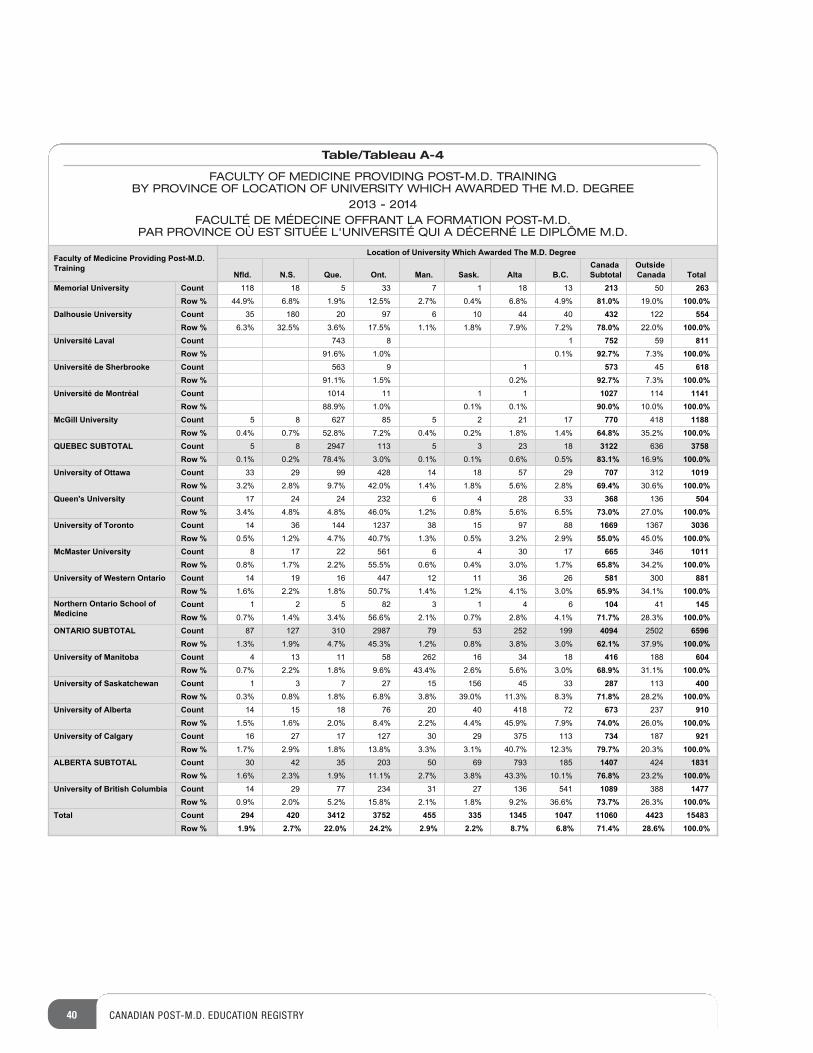
40 CANADIAN POST-M.D. EDUCATION REGISTRY
Table/Tableau A-4
FACULTY OF MEDICINE PROVIDING POST-M.D. TRAININGBY PROVINCE OF LOCATION OF UNIVERSITY WHICH AWARDED THE M.D. DEGREE
2013 - 2014FACULTÉ DE MÉDECINE OFFRANT LA FORMATION POST-M.D.
PAR PROVINCE OÙ EST SITUÉE L'UNIVERSITÉ QUI A DÉCERNÉ LE DIPLÔME M.D.
Faculty of Medicine Providing Post-M.D. Training
Location of University Which Awarded The M.D. Degree
Nfld. N.S. Que. Ont. Man. Sask. Alta B.C.CanadaSubtotal
OutsideCanada Total
Memorial University CountRow %
Dalhousie University CountRow %
Université Laval CountRow %
Université de Sherbrooke CountRow %
Université de Montréal CountRow %
McGill University CountRow %
QUEBEC SUBTOTAL CountRow %
University of Ottawa CountRow %
Queen's University CountRow %
University of Toronto CountRow %
McMaster University CountRow %
University of Western Ontario CountRow %
Northern Ontario School of Medicine
CountRow %
ONTARIO SUBTOTAL CountRow %
University of Manitoba CountRow %
University of Saskatchewan CountRow %
University of Alberta CountRow %
University of Calgary CountRow %
ALBERTA SUBTOTAL CountRow %
University of British Columbia CountRow %
Total CountRow %
118 18 5 33 7 1 18 13 213 50 26344.9% 6.8% 1.9% 12.5% 2.7% 0.4% 6.8% 4.9% 81.0% 19.0% 100.0%
35 180 20 97 6 10 44 40 432 122 5546.3% 32.5% 3.6% 17.5% 1.1% 1.8% 7.9% 7.2% 78.0% 22.0% 100.0%
18347 752 59 811%1.0%0.1%6.19 92.7% 7.3% 100.0%
19365 573 45 618%2.0%5.1%1.19 92.7% 7.3% 100.0%11114101 1027 114 1141
88.9% 1.0% 0.1% 0.1% 90.0% 10.0% 100.0%5 8 627 85 5 2 21 17 770 418 1188
0.4% 0.7% 52.8% 7.2% 0.4% 0.2% 1.8% 1.4% 64.8% 35.2% 100.0%5 8 2947 113 5 3 23 18 3122 636 3758
0.1% 0.2% 78.4% 3.0% 0.1% 0.1% 0.6% 0.5% 83.1% 16.9% 100.0%33 29 99 428 14 18 57 29 707 312 1019
3.2% 2.8% 9.7% 42.0% 1.4% 1.8% 5.6% 2.8% 69.4% 30.6% 100.0%17 24 24 232 6 4 28 33 368 136 504
3.4% 4.8% 4.8% 46.0% 1.2% 0.8% 5.6% 6.5% 73.0% 27.0% 100.0%14 36 144 1237 38 15 97 88 1669 1367 3036
0.5% 1.2% 4.7% 40.7% 1.3% 0.5% 3.2% 2.9% 55.0% 45.0% 100.0%8 17 22 561 6 4 30 17 665 346 1011
0.8% 1.7% 2.2% 55.5% 0.6% 0.4% 3.0% 1.7% 65.8% 34.2% 100.0%14 19 16 447 12 11 36 26 581 300 881
1.6% 2.2% 1.8% 50.7% 1.4% 1.2% 4.1% 3.0% 65.9% 34.1% 100.0%1 2 5 82 3 1 4 6 104 41 145
0.7% 1.4% 3.4% 56.6% 2.1% 0.7% 2.8% 4.1% 71.7% 28.3% 100.0%87 127 310 2987 79 53 252 199 4094 2502 6596
1.3% 1.9% 4.7% 45.3% 1.2% 0.8% 3.8% 3.0% 62.1% 37.9% 100.0%4 13 11 58 262 16 34 18 416 188 604
0.7% 2.2% 1.8% 9.6% 43.4% 2.6% 5.6% 3.0% 68.9% 31.1% 100.0%1 3 7 27 15 156 45 33 287 113 400
0.3% 0.8% 1.8% 6.8% 3.8% 39.0% 11.3% 8.3% 71.8% 28.2% 100.0%14 15 18 76 20 40 418 72 673 237 910
1.5% 1.6% 2.0% 8.4% 2.2% 4.4% 45.9% 7.9% 74.0% 26.0% 100.0%16 27 17 127 30 29 375 113 734 187 921
1.7% 2.9% 1.8% 13.8% 3.3% 3.1% 40.7% 12.3% 79.7% 20.3% 100.0%30 42 35 203 50 69 793 185 1407 424 1831
1.6% 2.3% 1.9% 11.1% 2.7% 3.8% 43.3% 10.1% 76.8% 23.2% 100.0%14 29 77 234 31 27 136 541 1089 388 1477
0.9% 2.0% 5.2% 15.8% 2.1% 1.8% 9.2% 36.6% 73.7% 26.3% 100.0%294 420 3412 3752 455 335 1345 1047 11060 4423 15483
1.9% 2.7% 22.0% 24.2% 2.9% 2.2% 8.7% 6.8% 71.4% 28.6% 100.0%
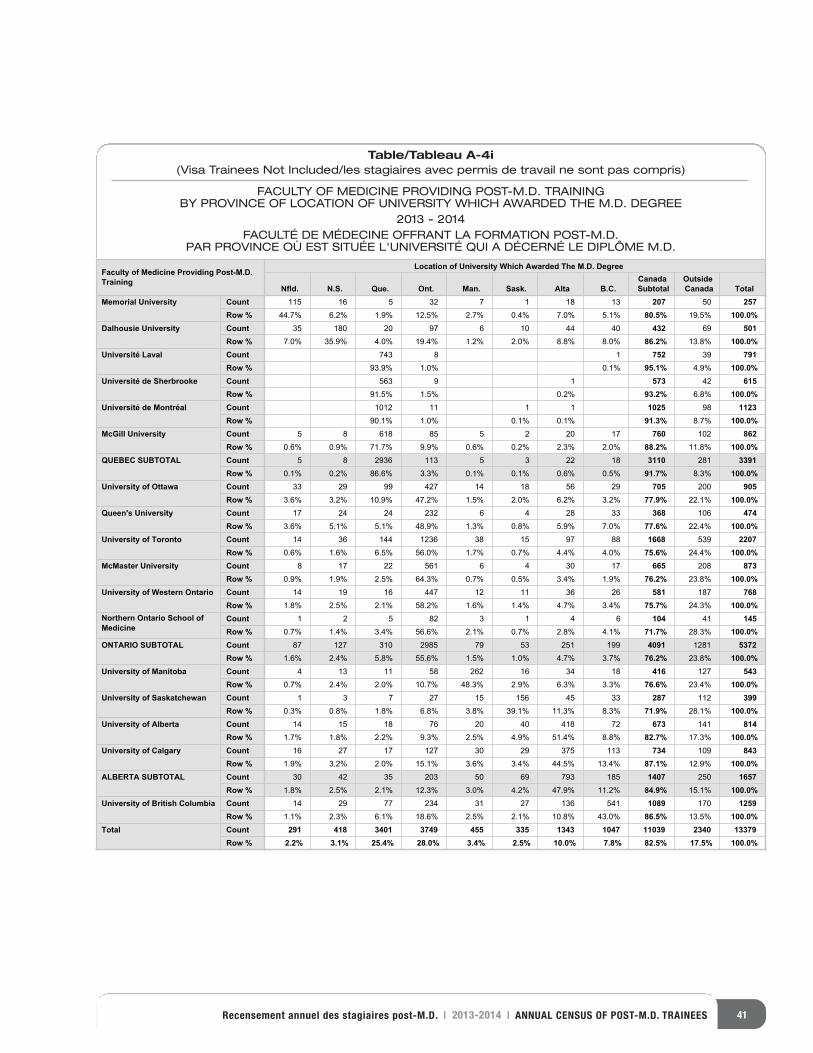
41Recensement annuel des stagiaires post-M.D. | 2013-2014 | ANNUAL CENSUS OF POST-M.D. TRAINEES
Table/Tableau A-4i(Visa Trainees Not Included/les stagiaires avec permis de travail ne sont pas compris)
FACULTY OF MEDICINE PROVIDING POST-M.D. TRAININGBY PROVINCE OF LOCATION OF UNIVERSITY WHICH AWARDED THE M.D. DEGREE
2013 - 2014FACULTÉ DE MÉDECINE OFFRANT LA FORMATION POST-M.D.
PAR PROVINCE OÙ EST SITUÉE L'UNIVERSITÉ QUI A DÉCERNÉ LE DIPLÔME M.D.
Faculty of Medicine Providing Post-M.D. Training
Location of University Which Awarded The M.D. Degree
Nfld. N.S. Que. Ont. Man. Sask. Alta B.C.CanadaSubtotal
OutsideCanada Total
Memorial University CountRow %
Dalhousie University CountRow %
Université Laval CountRow %
Université de Sherbrooke CountRow %
Université de Montréal CountRow %
McGill University CountRow %
QUEBEC SUBTOTAL CountRow %
University of Ottawa CountRow %
Queen's University CountRow %
University of Toronto CountRow %
McMaster University CountRow %
University of Western Ontario CountRow %
Northern Ontario School of Medicine
CountRow %
ONTARIO SUBTOTAL CountRow %
University of Manitoba CountRow %
University of Saskatchewan CountRow %
University of Alberta CountRow %
University of Calgary CountRow %
ALBERTA SUBTOTAL CountRow %
University of British Columbia CountRow %
Total CountRow %
115 16 5 32 7 1 18 13 207 50 25744.7% 6.2% 1.9% 12.5% 2.7% 0.4% 7.0% 5.1% 80.5% 19.5% 100.0%
35 180 20 97 6 10 44 40 432 69 5017.0% 35.9% 4.0% 19.4% 1.2% 2.0% 8.8% 8.0% 86.2% 13.8% 100.0%
18347 752 39 791%1.0%0.1%9.39 95.1% 4.9% 100.0%
19365 573 42 615%2.0%5.1%5.19 93.2% 6.8% 100.0%11112101 1025 98 1123
90.1% 1.0% 0.1% 0.1% 91.3% 8.7% 100.0%5 8 618 85 5 2 20 17 760 102 862
0.6% 0.9% 71.7% 9.9% 0.6% 0.2% 2.3% 2.0% 88.2% 11.8% 100.0%5 8 2936 113 5 3 22 18 3110 281 3391
0.1% 0.2% 86.6% 3.3% 0.1% 0.1% 0.6% 0.5% 91.7% 8.3% 100.0%33 29 99 427 14 18 56 29 705 200 905
3.6% 3.2% 10.9% 47.2% 1.5% 2.0% 6.2% 3.2% 77.9% 22.1% 100.0%17 24 24 232 6 4 28 33 368 106 474
3.6% 5.1% 5.1% 48.9% 1.3% 0.8% 5.9% 7.0% 77.6% 22.4% 100.0%14 36 144 1236 38 15 97 88 1668 539 2207
0.6% 1.6% 6.5% 56.0% 1.7% 0.7% 4.4% 4.0% 75.6% 24.4% 100.0%8 17 22 561 6 4 30 17 665 208 873
0.9% 1.9% 2.5% 64.3% 0.7% 0.5% 3.4% 1.9% 76.2% 23.8% 100.0%14 19 16 447 12 11 36 26 581 187 768
1.8% 2.5% 2.1% 58.2% 1.6% 1.4% 4.7% 3.4% 75.7% 24.3% 100.0%1 2 5 82 3 1 4 6 104 41 145
0.7% 1.4% 3.4% 56.6% 2.1% 0.7% 2.8% 4.1% 71.7% 28.3% 100.0%87 127 310 2985 79 53 251 199 4091 1281 5372
1.6% 2.4% 5.8% 55.6% 1.5% 1.0% 4.7% 3.7% 76.2% 23.8% 100.0%4 13 11 58 262 16 34 18 416 127 543
0.7% 2.4% 2.0% 10.7% 48.3% 2.9% 6.3% 3.3% 76.6% 23.4% 100.0%1 3 7 27 15 156 45 33 287 112 399
0.3% 0.8% 1.8% 6.8% 3.8% 39.1% 11.3% 8.3% 71.9% 28.1% 100.0%14 15 18 76 20 40 418 72 673 141 814
1.7% 1.8% 2.2% 9.3% 2.5% 4.9% 51.4% 8.8% 82.7% 17.3% 100.0%16 27 17 127 30 29 375 113 734 109 843
1.9% 3.2% 2.0% 15.1% 3.6% 3.4% 44.5% 13.4% 87.1% 12.9% 100.0%30 42 35 203 50 69 793 185 1407 250 1657
1.8% 2.5% 2.1% 12.3% 3.0% 4.2% 47.9% 11.2% 84.9% 15.1% 100.0%14 29 77 234 31 27 136 541 1089 170 1259
1.1% 2.3% 6.1% 18.6% 2.5% 2.1% 10.8% 43.0% 86.5% 13.5% 100.0%291 418 3401 3749 455 335 1343 1047 11039 2340 13379
2.2% 3.1% 25.4% 28.0% 3.4% 2.5% 10.0% 7.8% 82.5% 17.5% 100.0%
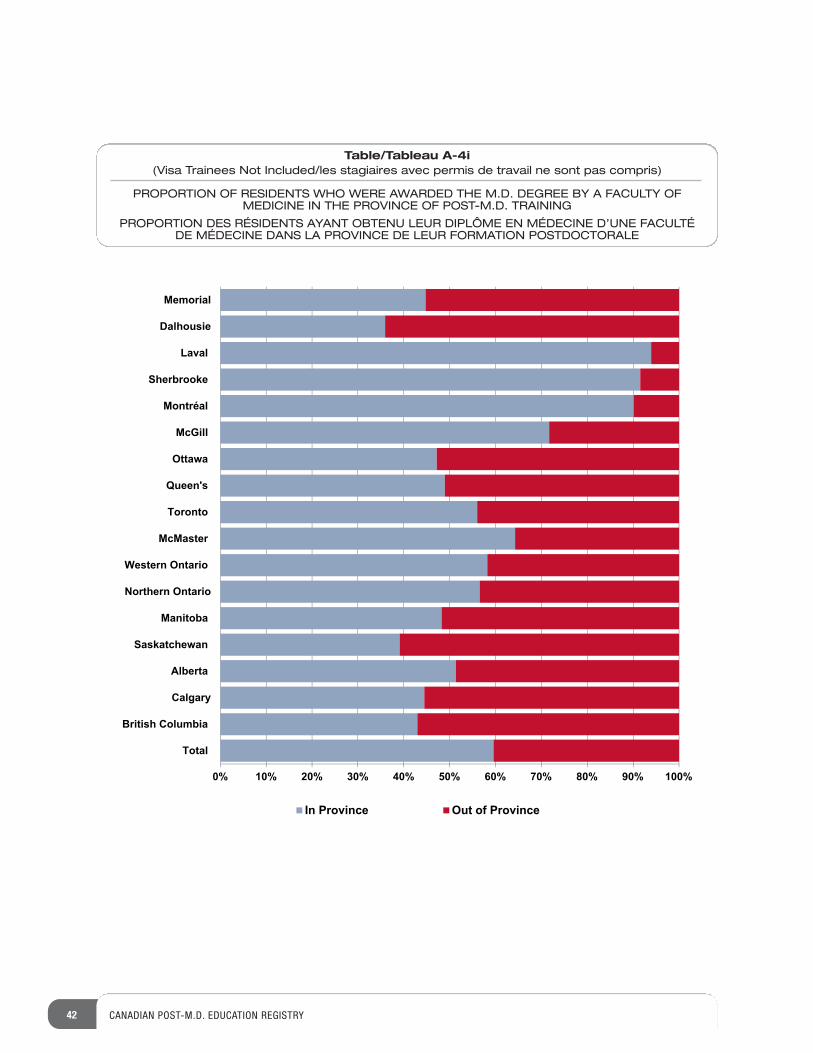
42 CANADIAN POST-M.D. EDUCATION REGISTRY
0% 10% 20% 30% 40% 50% 60% 70% 80% 90% 100%
Total
British Columbia
Calgary
Alberta
Saskatchewan
Manitoba
Northern Ontario
Western Ontario
McMaster
Toronto
Queen's
Ottawa
McGill
Montréal
Sherbrooke
Laval
Dalhousie
Memorial
In Province Out of Province
Table/Tableau A-4i(Visa Trainees Not Included/les stagiaires avec permis de travail ne sont pas compris)
PROPORTION OF RESIDENTS WHO WERE AWARDED THE M.D. DEGREE BY A FACULTY OFMEDICINE IN THE PROVINCE OF POST-M.D. TRAINING
PROPORTION DES RÉSIDENTS AYANT OBTENU LEUR DIPLÔME EN MÉDECINE D’UNE FACULTÉDE MÉDECINE DANS LA PROVINCE DE LEUR FORMATION POSTDOCTORALE
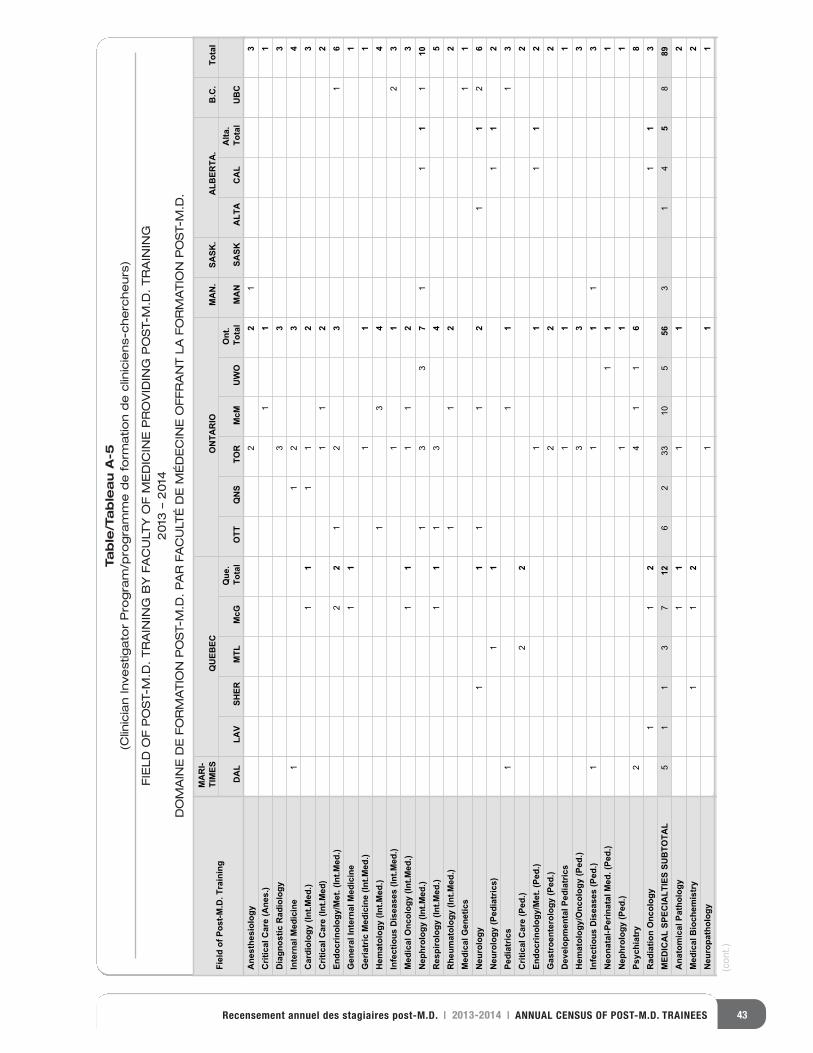
43Recensement annuel des stagiaires post-M.D. | 2013-2014 | ANNUAL CENSUS OF POST-M.D. TRAINEES
Fiel
d of
Pos
t-M.D
. Tra
inin
g
MA
RI-
TIM
ESQ
UEB
ECO
NTA
RIO
MA
N.
SASK
.A
LBER
TA.
B.C
.To
tal
DA
LLA
VSH
ERM
TLM
cGQ
ue.
Tota
lO
TTQ
NS
TOR
McM
UW
OO
nt.
Tota
lM
AN
SASK
ALT
AC
AL
Alta
. To
tal
UB
CA
nest
hesi
olog
yC
ritic
al C
are
(Ane
s.)
Dia
gnos
tic R
adio
logy
Inte
rnal
Med
icin
eC
ardi
olog
y (In
t.Med
.)C
ritic
al C
are
(Int.M
ed)
Endo
crin
olog
y/M
et. (
Int.M
ed.)
Gen
eral
Inte
rnal
Med
icin
eG
eria
tric
Med
icin
e (In
t.Med
.)H
emat
olog
y (In
t.Med
.)In
fect
ious
Dis
ease
s (In
t.Med
.)M
edic
al O
ncol
ogy
(Int.M
ed.)
Nep
hrol
ogy
(Int.M
ed.)
Res
piro
logy
(Int
.Med
.)R
heum
atol
ogy
(Int.M
ed.)
Med
ical
Gen
etic
sN
euro
logy
Neu
rolo
gy (P
edia
tric
s)Pe
diat
rics
Crit
ical
Car
e (P
ed.)
Endo
crin
olog
y/M
et. (
Ped.
)G
astr
oent
erol
ogy
(Ped
.)D
evel
opm
enta
l Ped
iatr
ics
Hem
atol
ogy/
Onc
olog
y (P
ed.)
Infe
ctio
us D
isea
ses
(Ped
.)N
eona
tal-P
erin
atal
Med
. (Pe
d.)
Nep
hrol
ogy
(Ped
.)Ps
ychi
atry
Rad
iatio
n O
ncol
ogy
MED
ICA
L SP
ECIA
LTIE
S SU
BTO
TAL
Ana
tom
ical
Pat
holo
gyM
edic
al B
ioch
emis
try
Neu
ropa
thol
ogy
22
13
11
13
33
11
23
41
11
12
31
12
22
21
23
16
11
11
11
31
44
11
23
11
11
23
13
37
11
11
101
11
34
51
12
21
11
11
12
11
26
11
11
21
11
13
22
21
11
12
22
21
11
33
31
11
13
11
11
11
24
11
68
11
21
13
51
13
712
62
3310
556
31
45
889
11
11
21
12
21
11
(cont.)
Table/Tableau A-5
(Clinician Investigator Program/programme de formation de cliniciens-chercheurs)
FIELD OF POST-M.D. TRAINING BY FACULTY OF MEDICINE PROVIDING POST-M.D. TRAINING
2013 – 2014
DOMAINE DE FORMATION POST-M.D. PAR FACULTÉ DE MÉDECINE OFFRANT LA FORMATION POST-M.D.
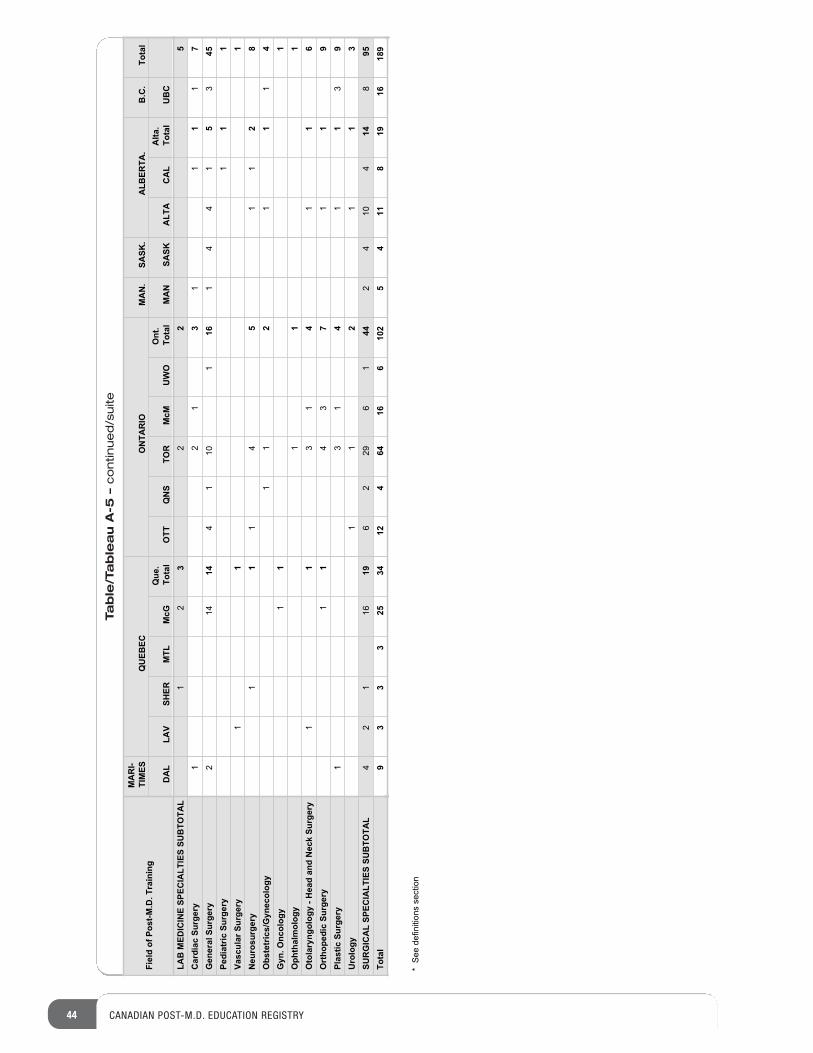
44 CANADIAN POST-M.D. EDUCATION REGISTRY
Table/Tableau A-5 –continued/suite
Fiel
d of
Pos
t-M.D
. Tra
inin
g
MA
RI-
TIM
ESQ
UEB
ECO
NTA
RIO
MA
N.
SASK
.A
LBER
TA.
B.C
.To
tal
DA
LLA
VSH
ERM
TLM
cGQ
ue.
Tota
lO
TTQ
NS
TOR
McM
UW
OO
nt.
Tota
lM
AN
SASK
ALT
AC
AL
Alta
. To
tal
UB
CLA
B M
EDIC
INE
SPEC
IALT
IES
SUB
TOTA
LC
ardi
ac S
urge
ryG
ener
al S
urge
ryPe
diat
ric S
urge
ryVa
scul
ar S
urge
ryN
euro
surg
ery
Obs
tetr
ics/
Gyn
ecol
ogy
Gyn
. Onc
olog
yO
phth
alm
olog
yO
tola
ryng
olog
y - H
ead
and
Nec
k Su
rger
yO
rtho
pedi
c Su
rger
yPl
astic
Sur
gery
Uro
logy
SUR
GIC
AL
SPEC
IALT
IES
SUB
TOTA
LTo
tal
12
32
25
12
13
11
11
741
214
41
101
161
44
15
345
11
11
11
11
14
51
12
81
12
11
14
11
11
11
11
31
41
16
11
43
71
19
13
14
11
39
11
21
13
42
116
196
229
61
442
410
414
895
93
33
2534
124
6416
610
25
411
819
1618
9
* S
ee d
efin
ition
s se
ctio
n
8989077 68686868689 9 5535535535534 969696 5 57
02028028402840284028474 4747479229229229 8090909009
89898989890007777 68686868689 9 9 9 5535535535534 4 4 96969696 5 5 5 12121266668989 U U U889888988898999
08089 8989 7 7 7 7867867 6 676776788
89890890890890 78 6666665 969696 680
89898989000777 68686868689 9 9 5535535535534 4 4 96969696 5 5 5777
15156154154154 845 55 64 88846156156158
898907 656565 656 7 75 8686867
45 50 261857 63 100
12689 U88989089 89 7867 67678
890890 78 665 96 6808907 689 5534 96 57
156154 845 5 64 8461588907 65 656 75 867 8 908
9809 4794Y943 Y943Y9028028474 479229 80909
89 367 9562 6782 83292 83625 382 2782 937 38 38792 723 02
4850 480 4980 890 904 60 540
3 3 32 3 3 8 8 81 1 1 13 3 3 3 12 12 124 4 3 3 2 16 16 161 1 2 2 23 3 3 3 2 14 14 142 2 2 2 3 11 11 113 3 3 2 2 13 13 12 11 1 1 1 1 5 5 513 13 12 11 11 1 61 61 60 1103 107 59 41 35 3 1 349 348 1 346 3
3 3 32 3 3 8 8 8
1 1 1 13 3 3 3 12 12 12
4 4 3 3 2 16 16 161 1 2 2 2
3 3 3 3 2 14 14 142 2 2 2 3 11 11 11
3 3 3 2 2 13 13 12 11 1 1 1 1 5 5 5
13 13 12 11 11 1 61 61 60 1103 107 59 41 35 3 1 349 348 1 346 3
2 2 13 13 12 11 1 1 1 1 5 5 5
13 13 12 11 11 1 61 61 60 1103 107 59 41 35 3 1 349 348 1 346 3
75 79 064 20 379 07 590 3 2 8
48 05 8
56 40 6
72 90 4
6
892 3
4 04 0
4 90792 6
4 8 5 8 5 8 5 4 9 3 7 0 1
4 5 0 4 5 0 1 9 7 3
EDUCATIONTRAINING
HEALTH ÉTUDESFORMAT
ION
SANTÉ
758 64 26 12
03 13 015 23
12689 U88989089 89 7867 67678
890890 78 665 96 6808907 689 5534 96 57
156154 845 5 64 8461588907 65 656 75 867 8 908
9809 4794Y943 Y943Y9028028474 479229 80909
89 367 9562 6782 83292 83625 382 2782 937 38 38792 723 02
1103 1078
%+
+ 781 5413 9
405540 466
0 1533 8
18 387
9 41 3
5 3 1
34
12689 U88989
089 89 7867 67678
890890 78 665 96 680
8907 689 5534 96 57
156154 845 5 64 846158
8907 65 656 75 867 8 90
8
9809 4794Y943 Y943Y9
028028474 479229 80909
89 367 9562 6782 83292 8362
5 382 2782 937 38 38792 723 02
8907 689 5534 96 57
028028474 479229 80909
8907 689 5534 96 57
4
{ {7
7
3
4 15103 107 59 41 35 3 1 349 303 107 59 41 35 3 1 349 3
11 11 1 61 61 60 1
1 5 2 1 5 2 1 6
4 4 5 1 5 2 8
6 4 8 2 4 6 1 2 6
12689 u88989089 89 7867 67678890890 78 665 96 6808907 689 5534 96 57156154 845 5 64 8461588907 65 656 75 867 8 9089809 4794y943 y943y9
T O
T A L
H E A L T H S A N T É
EDUCATIONÉTUDES
EDUCATIONTRAININGHEALTH
" " "" "
" "A
8
2 2 2 2 3 11 11 113 3 3 2 2 13 13 12 11 1 1 1 1 5 5 513 13 12 11 11 1 61 650 640 75 056 06 6890780 9029 068 0690667890 0 49 0463 0492
12689 U88989
089 89 7867 67678
890890 78 665 96 680
8907 689 5534 96 57
156154 845 5 64 846158
8907 65 656 75 867 8 908
9809 4794Y943 Y943Y9
028028474 479229 80909
89 367 9562 6782 83292 8362
5 382 2782 937 38 38792 723 02
8907 689 5534 96 57
028028474 479229 80909
8907 689 5534 96 5 12689 U88989
089 89 7867 67678
890890 78 665 96 680
8907 689 5534 96 57
156154 845 5 64 846158
8907 65 656 75 867
EDUCATION REGISTRY ENREGISTREMENT
D’ÉDUCATION
EDUCAT
ION REGISTRY
ENREGISTREMENT D’ÉDUCATION
Field of Post-M.D. TrainingDomaine de formation post-M.D.
by Rank (Table B-1) 46by Rank (regular ministry funded trainees only) (Table B-1i) 48by Gender (visa trainees not included)(Table I-3) 111by Source of Funding for Post-M.D. Training (Table I-1) 102by Province of Location of Faculty of Medicine Providing Post-M.D. Training(Table A-1) 26by Province of Location of Faculty of Medicine Providing Post-M.D. Training (regular ministry funded trainees only)(Table A-1i) 29by Province of Location of Faculty of Medicine Providing Post-M.D. Training (residents only – fellows not included)(Table A-1ii) 32by Location of University Which Awarded the M.D. Degree (Table I-4) 117by Legal Status (Table B-2) 50
par rang (tableau B-1)
par rang (stagiaires subventionnés par les fonds ministériels habituels seulement)
(tableau B-1i)par sexe (stagiaires avec
permis de travail non compris) (tableau I-3)
par source de financement de la formation post-M.D.
(tableau I-1)par province de la faculté de médecine
offrant la formation post-M.D. (tableau A-1)
par province de la faculté de médecine offrant la formation post-M.D. (stagiaires subventionnés par les fonds ministériels habituels seulement)
(tableau A-1i)par province de la faculté de médecine offrant la formation post-M.D. (résidents seulement –
moniteurs cliniques non compris) (tableau A-1ii)
par lieu de l’université ayant décerné le doctorat en médecine
(tableau I-4)par statut légal (tableau B-2)
SECTION
B
45Recensement annuel des stagiaires post-M.D. | 2013-2014 | ANNUAL CENSUS OF POST-M.D. TRAINEES
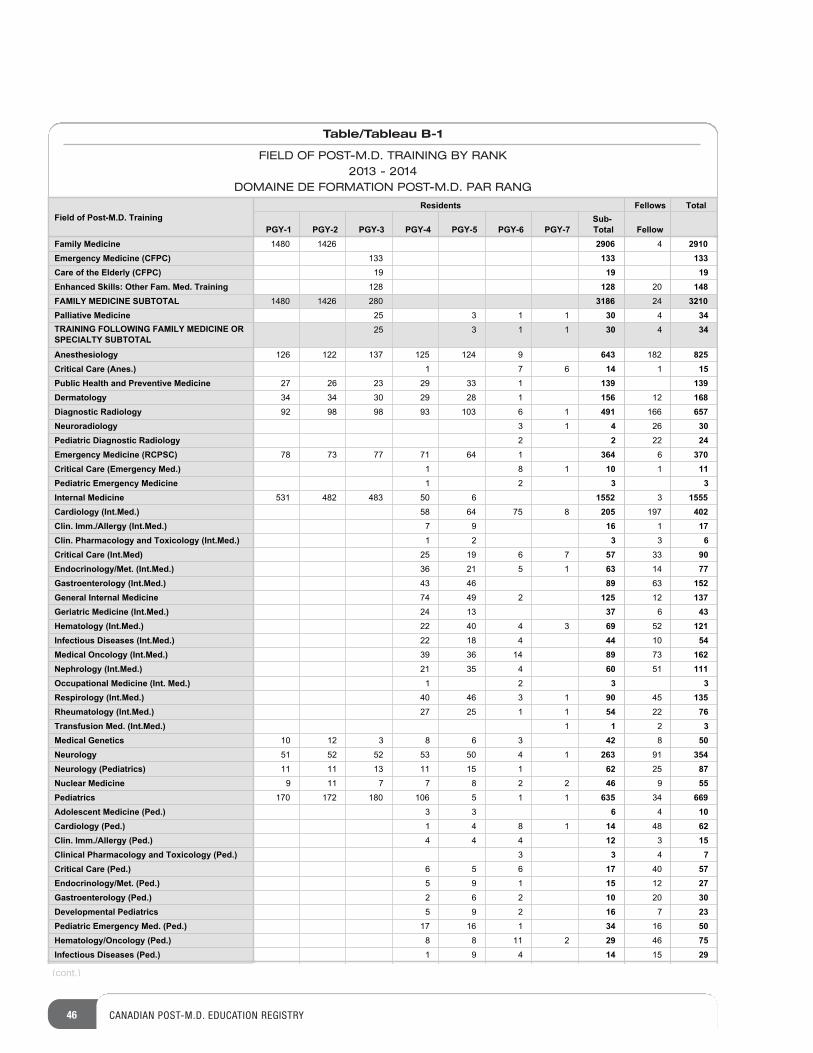
46 CANADIAN POST-M.D. EDUCATION REGISTRY
Table/Tableau B-1
FIELD OF POST-M.D. TRAINING BY RANK2013 - 2014
DOMAINE DE FORMATION POST-M.D. PAR RANG
Field of Post-M.D. TrainingResidents Fellows Total
PGY-1 PGY-2 PGY-3 PGY-4 PGY-5 PGY-6 PGY-7Sub-Total Fellow
Family MedicineEmergency Medicine (CFPC)Care of the Elderly (CFPC)Enhanced Skills: Other Fam. Med. TrainingFAMILY MEDICINE SUBTOTALPalliative MedicineTRAINING FOLLOWING FAMILY MEDICINE OR SPECIALTY SUBTOTAL
AnesthesiologyCritical Care (Anes.)Public Health and Preventive MedicineDermatologyDiagnostic RadiologyNeuroradiologyPediatric Diagnostic RadiologyEmergency Medicine (RCPSC)Critical Care (Emergency Med.)Pediatric Emergency MedicineInternal MedicineCardiology (Int.Med.)Clin. Imm./Allergy (Int.Med.)Clin. Pharmacology and Toxicology (Int.Med.)Critical Care (Int.Med)Endocrinology/Met. (Int.Med.)Gastroenterology (Int.Med.)General Internal MedicineGeriatric Medicine (Int.Med.)Hematology (Int.Med.)Infectious Diseases (Int.Med.)Medical Oncology (Int.Med.)Nephrology (Int.Med.)Occupational Medicine (Int. Med.)Respirology (Int.Med.)Rheumatology (Int.Med.)Transfusion Med. (Int.Med.)Medical GeneticsNeurologyNeurology (Pediatrics)Nuclear MedicinePediatricsAdolescent Medicine (Ped.)Cardiology (Ped.)Clin. Imm./Allergy (Ped.)Clinical Pharmacology and Toxicology (Ped.)Critical Care (Ped.)Endocrinology/Met. (Ped.)Gastroenterology (Ped.)Developmental PediatricsPediatric Emergency Med. (Ped.)Hematology/Oncology (Ped.)Infectious Diseases (Ped.)
1480 1426 2906 4 2910133 133 13319 19 19128 128 20 148
1480 1426 280 3186 24 321011352 30 4 34
25 3 1 1 30 4 34
126 122 137 125 124 9 643 182 825671 14 1 15
27 26 23 29 33 1 139 13934 34 30 29 28 1 156 12 16892 98 98 93 103 6 1 491 166 657
3 1 4 26 302 2 22 24
78 73 77 71 64 1 364 6 370181 10 1 11
21 3 3531 482 483 50 6 1552 3 1555
58 64 75 8 205 197 4027 9 16 1 171 2 3 3 625 19 6 7 57 33 9036 21 5 1 63 14 7743 46 89 63 15274 49 2 125 12 13724 13 37 6 4322 40 4 3 69 52 12122 18 4 44 10 5439 36 14 89 73 16221 35 4 60 51 111
21 3 340 46 3 1 90 45 13527 25 1 1 54 22 76
1 1 2 310 12 3 8 6 3 42 8 5051 52 52 53 50 4 1 263 91 35411 11 13 11 15 1 62 25 879 11 7 7 8 2 2 46 9 55
170 172 180 106 5 1 1 635 34 6693 3 6 4 101 4 8 1 14 48 624 4 4 12 3 15
3 3 4 76 5 6 17 40 575 9 1 15 12 272 6 2 10 20 305 9 2 16 7 2317 16 1 34 16 508 8 11 2 29 46 751 9 4 14 15 29
(cont.)
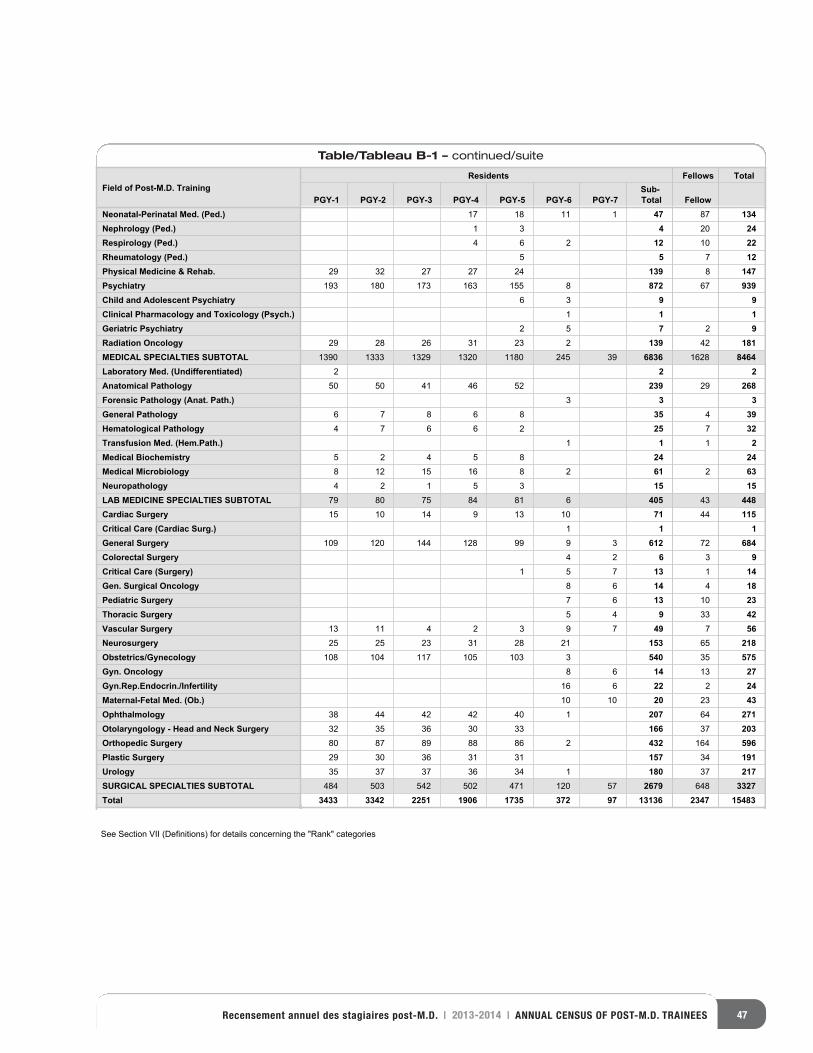
47Recensement annuel des stagiaires post-M.D. | 2013-2014 | ANNUAL CENSUS OF POST-M.D. TRAINEES
Table/Tableau B-1 – continued/suite
Field of Post-M.D. TrainingResidents Fellows Total
PGY-1 PGY-2 PGY-3 PGY-4 PGY-5 PGY-6 PGY-7Sub-Total Fellow
Neonatal-Perinatal Med. (Ped.)Nephrology (Ped.)Respirology (Ped.)Rheumatology (Ped.)Physical Medicine & Rehab.PsychiatryChild and Adolescent PsychiatryClinical Pharmacology and Toxicology (Psych.)Geriatric PsychiatryRadiation OncologyMEDICAL SPECIALTIES SUBTOTALLaboratory Med. (Undifferentiated)Anatomical PathologyForensic Pathology (Anat. Path.)General PathologyHematological PathologyTransfusion Med. (Hem.Path.)Medical BiochemistryMedical MicrobiologyNeuropathologyLAB MEDICINE SPECIALTIES SUBTOTALCardiac SurgeryCritical Care (Cardiac Surg.)General SurgeryColorectal SurgeryCritical Care (Surgery)Gen. Surgical OncologyPediatric SurgeryThoracic SurgeryVascular SurgeryNeurosurgeryObstetrics/GynecologyGyn. OncologyGyn.Rep.Endocrin./InfertilityMaternal-Fetal Med. (Ob.)OphthalmologyOtolaryngology - Head and Neck SurgeryOrthopedic SurgeryPlastic SurgeryUrologySURGICAL SPECIALTIES SUBTOTALTotal
17 18 11 1 47 87 1341 3 4 20 244 6 2 12 10 22
5 5 7 1229 32 27 27 24 139 8 147
193 180 173 163 155 8 872 67 9396 3 9 9
1 1 12 5 7 2 9
29 28 26 31 23 2 139 42 1811390 1333 1329 1320 1180 245 39 6836 1628 8464
2 2 250 50 41 46 52 239 29 268
3 3 36 7 8 6 8 35 4 394 7 6 6 2 25 7 32
1 1 1 25 2 4 5 8 24 248 12 15 16 8 2 61 2 634 2 1 5 3 15 15
79 80 75 84 81 6 405 43 44815 10 14 9 13 10 71 44 115
1 1 1109 120 144 128 99 9 3 612 72 684
4 2 6 3 91 5 7 13 1 14
8 6 14 4 187 6 13 10 235 4 9 33 42
13 11 4 2 3 9 7 49 7 5625 25 23 31 28 21 153 65 218
108 104 117 105 103 3 540 35 5758 6 14 13 27
16 6 22 2 2410 10 20 23 43
38 44 42 42 40 1 207 64 27132 35 36 30 33 166 37 20380 87 89 88 86 2 432 164 59629 30 36 31 31 157 34 19135 37 37 36 34 1 180 37 217
484 503 542 502 471 120 57 2679 648 33273433 3342 2251 1906 1735 372 97 13136 2347 15483
See Section VII (Definitions) for details concerning the "Rank" categories
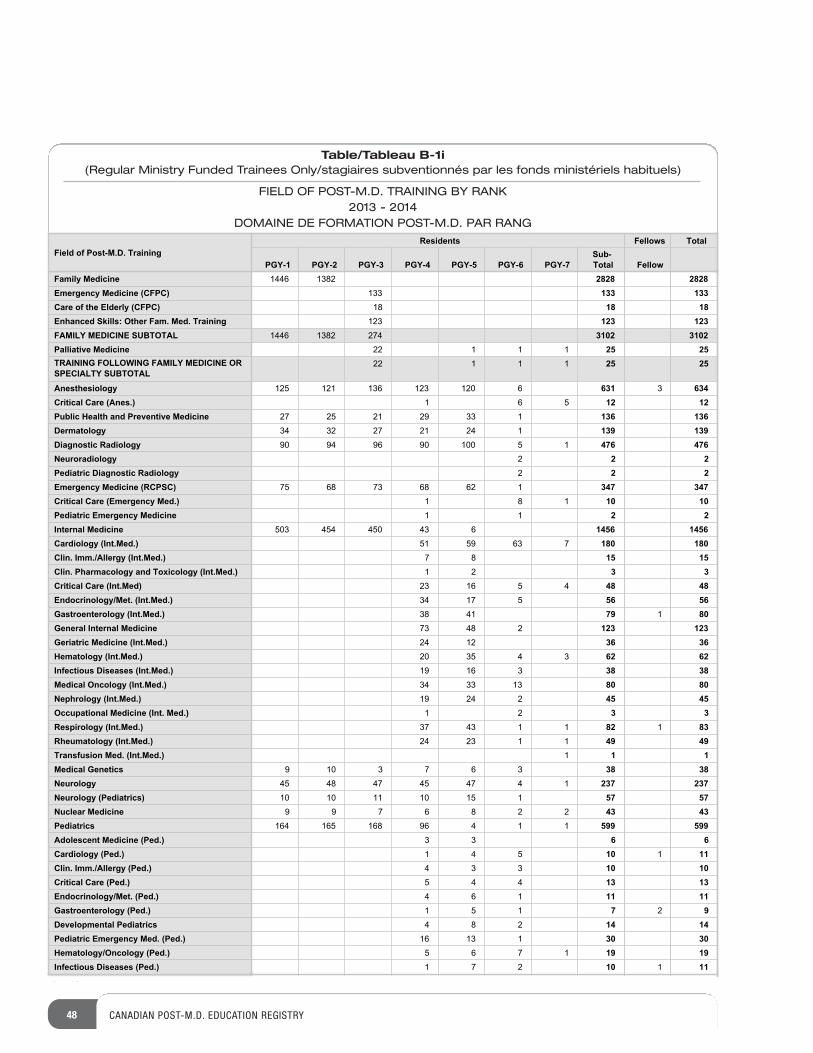
48 CANADIAN POST-M.D. EDUCATION REGISTRY
Table/Tableau B-1i(Regular Ministry Funded Trainees Only/stagiaires subventionnés par les fonds ministériels habituels)
FIELD OF POST-M.D. TRAINING BY RANK2013 - 2014
DOMAINE DE FORMATION POST-M.D. PAR RANG
Field of Post-M.D. TrainingResidents Fellows Total
PGY-1 PGY-2 PGY-3 PGY-4 PGY-5 PGY-6 PGY-7Sub-Total Fellow
Family MedicineEmergency Medicine (CFPC)Care of the Elderly (CFPC)Enhanced Skills: Other Fam. Med. TrainingFAMILY MEDICINE SUBTOTALPalliative MedicineTRAINING FOLLOWING FAMILY MEDICINE OR SPECIALTY SUBTOTAL
AnesthesiologyCritical Care (Anes.)Public Health and Preventive MedicineDermatologyDiagnostic RadiologyNeuroradiologyPediatric Diagnostic RadiologyEmergency Medicine (RCPSC)Critical Care (Emergency Med.)Pediatric Emergency MedicineInternal MedicineCardiology (Int.Med.)Clin. Imm./Allergy (Int.Med.)Clin. Pharmacology and Toxicology (Int.Med.)Critical Care (Int.Med)Endocrinology/Met. (Int.Med.)Gastroenterology (Int.Med.)General Internal MedicineGeriatric Medicine (Int.Med.)Hematology (Int.Med.)Infectious Diseases (Int.Med.)Medical Oncology (Int.Med.)Nephrology (Int.Med.)Occupational Medicine (Int. Med.)Respirology (Int.Med.)Rheumatology (Int.Med.)Transfusion Med. (Int.Med.)Medical GeneticsNeurologyNeurology (Pediatrics)Nuclear MedicinePediatricsAdolescent Medicine (Ped.)Cardiology (Ped.)Clin. Imm./Allergy (Ped.)Critical Care (Ped.)Endocrinology/Met. (Ped.)Gastroenterology (Ped.)Developmental PediatricsPediatric Emergency Med. (Ped.)Hematology/Oncology (Ped.)Infectious Diseases (Ped.)
1446 1382 2828 2828133 133 13318 18 18123 123 123
1446 1382 274 3102 310211122 25 25
22 1 1 1 25 25
125 121 136 123 120 6 631 3 634561 12 12
27 25 21 29 33 1 136 13634 32 27 21 24 1 139 13990 94 96 90 100 5 1 476 476
2 2 22 2 2
75 68 73 68 62 1 347 347181 10 10
11 2 2503 454 450 43 6 1456 1456
51 59 63 7 180 1807 8 15 151 2 3 323 16 5 4 48 4834 17 5 56 5638 41 79 1 8073 48 2 123 12324 12 36 3620 35 4 3 62 6219 16 3 38 3834 33 13 80 8019 24 2 45 45
21 3 337 43 1 1 82 1 8324 23 1 1 49 49
1 1 19 10 3 7 6 3 38 3845 48 47 45 47 4 1 237 23710 10 11 10 15 1 57 579 9 7 6 8 2 2 43 43
164 165 168 96 4 1 1 599 5993 3 6 61 4 5 10 1 114 3 3 10 105 4 4 13 134 6 1 11 111 5 1 7 2 94 8 2 14 1416 13 1 30 305 6 7 1 19 191 7 2 10 1 11
(cont.)
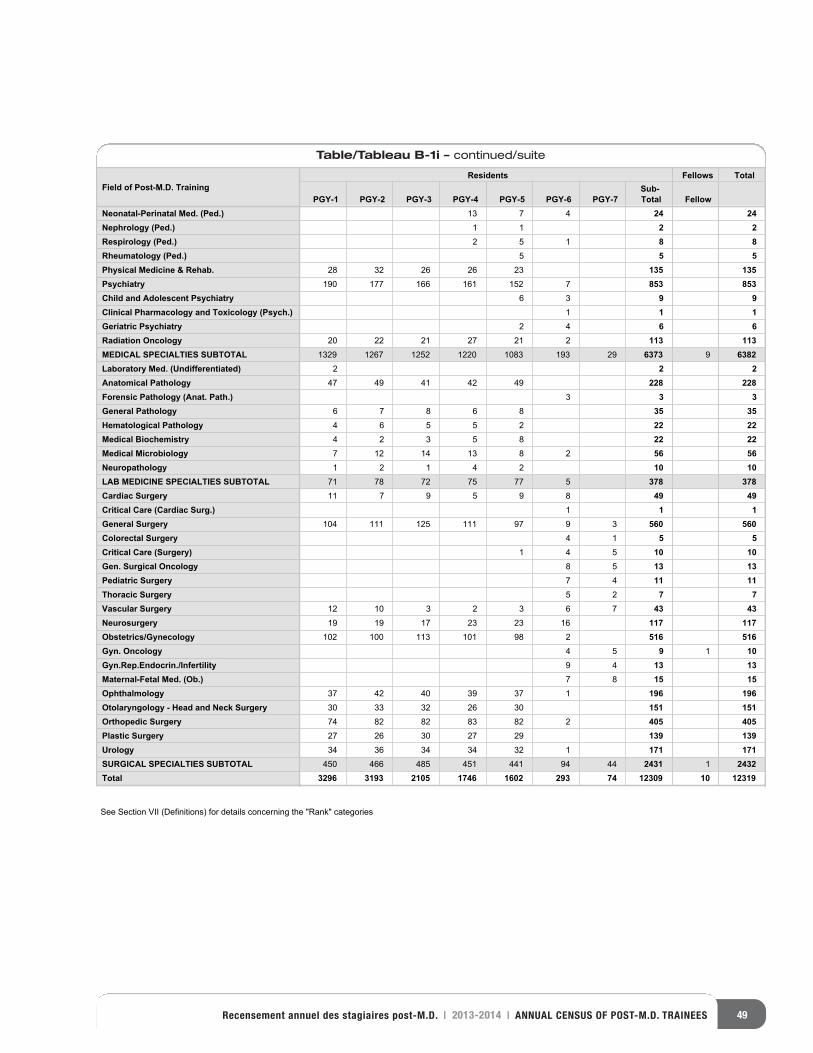
49Recensement annuel des stagiaires post-M.D. | 2013-2014 | ANNUAL CENSUS OF POST-M.D. TRAINEES
Table/Tableau B-1i – continued/suite
Field of Post-M.D. TrainingResidents Fellows Total
PGY-1 PGY-2 PGY-3 PGY-4 PGY-5 PGY-6 PGY-7Sub-Total Fellow
Neonatal-Perinatal Med. (Ped.)Nephrology (Ped.)Respirology (Ped.)Rheumatology (Ped.)Physical Medicine & Rehab.PsychiatryChild and Adolescent PsychiatryClinical Pharmacology and Toxicology (Psych.)Geriatric PsychiatryRadiation OncologyMEDICAL SPECIALTIES SUBTOTALLaboratory Med. (Undifferentiated)Anatomical PathologyForensic Pathology (Anat. Path.)General PathologyHematological PathologyMedical BiochemistryMedical MicrobiologyNeuropathologyLAB MEDICINE SPECIALTIES SUBTOTALCardiac SurgeryCritical Care (Cardiac Surg.)General SurgeryColorectal SurgeryCritical Care (Surgery)Gen. Surgical OncologyPediatric SurgeryThoracic SurgeryVascular SurgeryNeurosurgeryObstetrics/GynecologyGyn. OncologyGyn.Rep.Endocrin./InfertilityMaternal-Fetal Med. (Ob.)OphthalmologyOtolaryngology - Head and Neck SurgeryOrthopedic SurgeryPlastic SurgeryUrologySURGICAL SPECIALTIES SUBTOTALTotal
13 7 4 24 241 1 2 22 5 1 8 8
5 5 528 32 26 26 23 135 135
190 177 166 161 152 7 853 8536 3 9 9
1 1 12 4 6 6
20 22 21 27 21 2 113 1131329 1267 1252 1220 1083 193 29 6373 9 6382
2 2 247 49 41 42 49 228 228
3 3 36 7 8 6 8 35 354 6 5 5 2 22 224 2 3 5 8 22 227 12 14 13 8 2 56 561 2 1 4 2 10 10
71 78 72 75 77 5 378 37811 7 9 5 9 8 49 49
1 1 1104 111 125 111 97 9 3 560 560
4 1 5 51 4 5 10 10
8 5 13 137 4 11 115 2 7 7
12 10 3 2 3 6 7 43 4319 19 17 23 23 16 117 117
102 100 113 101 98 2 516 5164 5 9 1 109 4 13 137 8 15 15
37 42 40 39 37 1 196 19630 33 32 26 30 151 15174 82 82 83 82 2 405 40527 26 30 27 29 139 13934 36 34 34 32 1 171 171
450 466 485 451 441 94 44 2431 1 24323296 3193 2105 1746 1602 293 74 12309 10 12319
See Section VII (Definitions) for details concerning the "Rank" categories
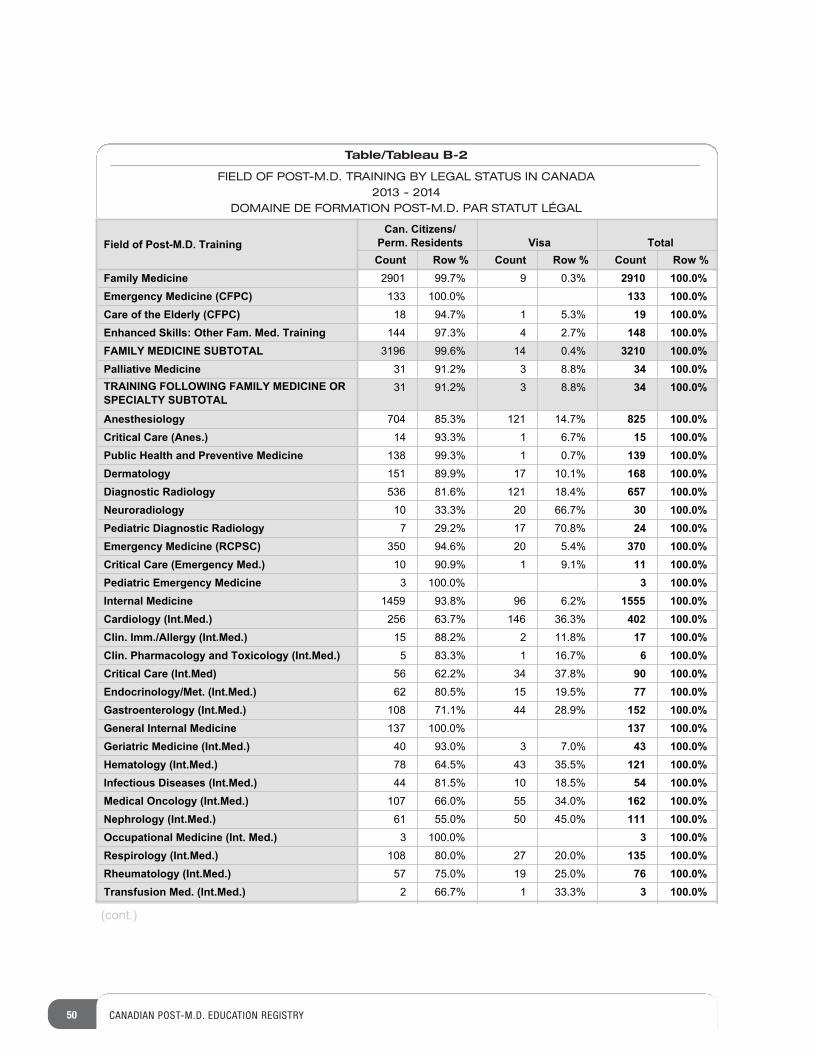
50 CANADIAN POST-M.D. EDUCATION REGISTRY
Table/Tableau B-2
FIELD OF POST-M.D. TRAINING BY LEGAL STATUS IN CANADA2013 - 2014
DOMAINE DE FORMATION POST-M.D. PAR STATUT LÉGAL
Field of Post-M.D. TrainingCan. Citizens/
Perm. Residents Visa TotalCount Row % Count Row % Count Row %
Family MedicineEmergency Medicine (CFPC)Care of the Elderly (CFPC)Enhanced Skills: Other Fam. Med. TrainingFAMILY MEDICINE SUBTOTALPalliative MedicineTRAINING FOLLOWING FAMILY MEDICINE OR SPECIALTY SUBTOTAL
AnesthesiologyCritical Care (Anes.)Public Health and Preventive MedicineDermatologyDiagnostic RadiologyNeuroradiologyPediatric Diagnostic RadiologyEmergency Medicine (RCPSC)Critical Care (Emergency Med.)Pediatric Emergency MedicineInternal MedicineCardiology (Int.Med.)Clin. Imm./Allergy (Int.Med.)Clin. Pharmacology and Toxicology (Int.Med.)Critical Care (Int.Med)Endocrinology/Met. (Int.Med.)Gastroenterology (Int.Med.)General Internal MedicineGeriatric Medicine (Int.Med.)Hematology (Int.Med.)Infectious Diseases (Int.Med.)Medical Oncology (Int.Med.)Nephrology (Int.Med.)Occupational Medicine (Int. Med.)Respirology (Int.Med.)Rheumatology (Int.Med.)Transfusion Med. (Int.Med.)
2901 99.7% 9 0.3% 2910 100.0%133 100.0% 133 100.0%18 94.7% 1 5.3% 19 100.0%144 97.3% 4 2.7% 148 100.0%3196 99.6% 14 0.4% 3210 100.0%31 91.2% 3 8.8% 34 100.0%31 91.2% 3 8.8% 34 100.0%
704 85.3% 121 14.7% 825 100.0%14 93.3% 1 6.7% 15 100.0%138 99.3% 1 0.7% 139 100.0%151 89.9% 17 10.1% 168 100.0%536 81.6% 121 18.4% 657 100.0%10 33.3% 20 66.7% 30 100.0%7 29.2% 17 70.8% 24 100.0%
350 94.6% 20 5.4% 370 100.0%10 90.9% 1 9.1% 11 100.0%3 100.0% 3 100.0%
1459 93.8% 96 6.2% 1555 100.0%256 63.7% 146 36.3% 402 100.0%15 88.2% 2 11.8% 17 100.0%5 83.3% 1 16.7% 6 100.0%56 62.2% 34 37.8% 90 100.0%62 80.5% 15 19.5% 77 100.0%108 71.1% 44 28.9% 152 100.0%137 100.0% 137 100.0%40 93.0% 3 7.0% 43 100.0%78 64.5% 43 35.5% 121 100.0%44 81.5% 10 18.5% 54 100.0%107 66.0% 55 34.0% 162 100.0%61 55.0% 50 45.0% 111 100.0%3 100.0% 3 100.0%
108 80.0% 27 20.0% 135 100.0%57 75.0% 19 25.0% 76 100.0%2 66.7% 1 33.3% 3 100.0%
(cont.)
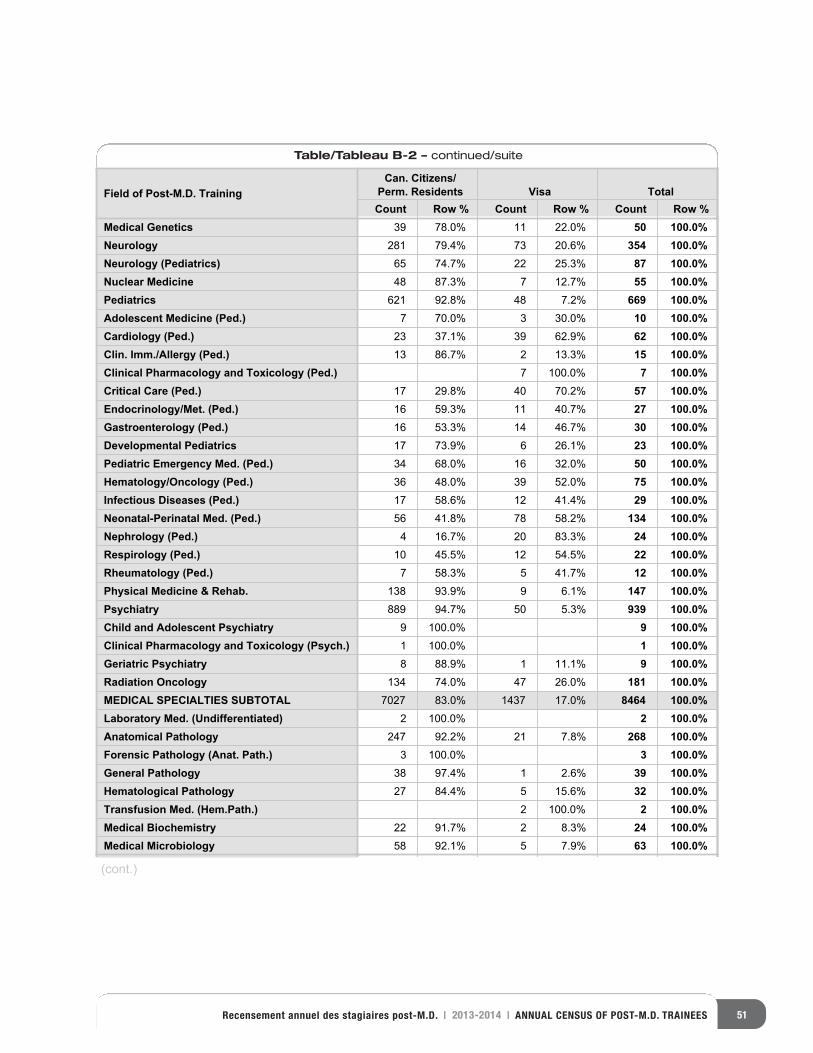
51Recensement annuel des stagiaires post-M.D. | 2013-2014 | ANNUAL CENSUS OF POST-M.D. TRAINEES
Table/Tableau B-2 – continued/suite
Field of Post-M.D. TrainingCan. Citizens/
Perm. Residents Visa TotalCount Row % Count Row % Count Row %
Medical GeneticsNeurologyNeurology (Pediatrics)Nuclear MedicinePediatricsAdolescent Medicine (Ped.)Cardiology (Ped.)Clin. Imm./Allergy (Ped.)Clinical Pharmacology and Toxicology (Ped.)Critical Care (Ped.)Endocrinology/Met. (Ped.)Gastroenterology (Ped.)Developmental PediatricsPediatric Emergency Med. (Ped.)Hematology/Oncology (Ped.)Infectious Diseases (Ped.)Neonatal-Perinatal Med. (Ped.)Nephrology (Ped.)Respirology (Ped.)Rheumatology (Ped.)Physical Medicine & Rehab.PsychiatryChild and Adolescent PsychiatryClinical Pharmacology and Toxicology (Psych.)Geriatric PsychiatryRadiation OncologyMEDICAL SPECIALTIES SUBTOTALLaboratory Med. (Undifferentiated)Anatomical PathologyForensic Pathology (Anat. Path.)General PathologyHematological PathologyTransfusion Med. (Hem.Path.)Medical BiochemistryMedical Microbiology
39 78.0% 11 22.0% 50 100.0%281 79.4% 73 20.6% 354 100.0%65 74.7% 22 25.3% 87 100.0%48 87.3% 7 12.7% 55 100.0%621 92.8% 48 7.2% 669 100.0%7 70.0% 3 30.0% 10 100.0%23 37.1% 39 62.9% 62 100.0%13 86.7% 2 13.3% 15 100.0%
7 100.0% 7 100.0%17 29.8% 40 70.2% 57 100.0%16 59.3% 11 40.7% 27 100.0%16 53.3% 14 46.7% 30 100.0%17 73.9% 6 26.1% 23 100.0%34 68.0% 16 32.0% 50 100.0%36 48.0% 39 52.0% 75 100.0%17 58.6% 12 41.4% 29 100.0%56 41.8% 78 58.2% 134 100.0%4 16.7% 20 83.3% 24 100.0%10 45.5% 12 54.5% 22 100.0%7 58.3% 5 41.7% 12 100.0%
138 93.9% 9 6.1% 147 100.0%889 94.7% 50 5.3% 939 100.0%9 100.0% 9 100.0%1 100.0% 1 100.0%8 88.9% 1 11.1% 9 100.0%
134 74.0% 47 26.0% 181 100.0%7027 83.0% 1437 17.0% 8464 100.0%
2 100.0% 2 100.0%247 92.2% 21 7.8% 268 100.0%3 100.0% 3 100.0%38 97.4% 1 2.6% 39 100.0%27 84.4% 5 15.6% 32 100.0%
2 100.0% 2 100.0%22 91.7% 2 8.3% 24 100.0%58 92.1% 5 7.9% 63 100.0%
(cont.)
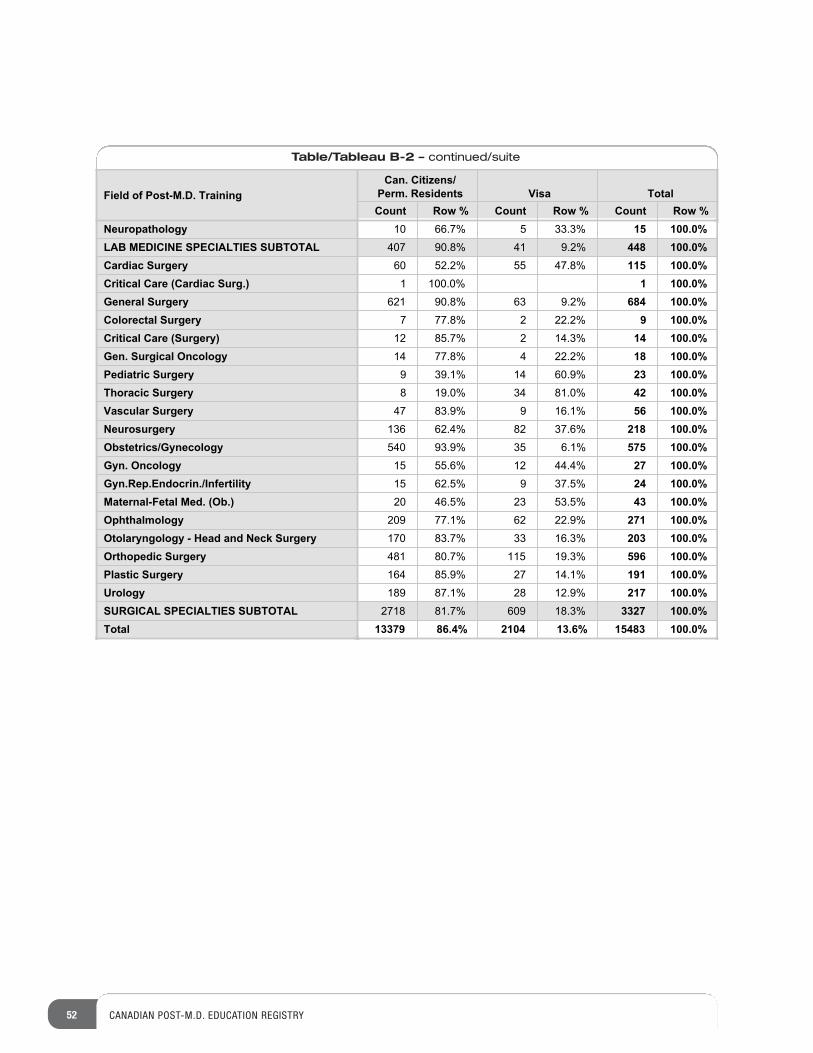
52 CANADIAN POST-M.D. EDUCATION REGISTRY
Table/Tableau B-2 – continued/suite
Field of Post-M.D. TrainingCan. Citizens/
Perm. Residents Visa TotalCount Row % Count Row % Count Row %
NeuropathologyLAB MEDICINE SPECIALTIES SUBTOTALCardiac SurgeryCritical Care (Cardiac Surg.)General SurgeryColorectal SurgeryCritical Care (Surgery)Gen. Surgical OncologyPediatric SurgeryThoracic SurgeryVascular SurgeryNeurosurgeryObstetrics/GynecologyGyn. OncologyGyn.Rep.Endocrin./InfertilityMaternal-Fetal Med. (Ob.)OphthalmologyOtolaryngology - Head and Neck SurgeryOrthopedic SurgeryPlastic SurgeryUrologySURGICAL SPECIALTIES SUBTOTALTotal
10 66.7% 5 33.3% 15 100.0%407 90.8% 41 9.2% 448 100.0%60 52.2% 55 47.8% 115 100.0%1 100.0% 1 100.0%
621 90.8% 63 9.2% 684 100.0%7 77.8% 2 22.2% 9 100.0%12 85.7% 2 14.3% 14 100.0%14 77.8% 4 22.2% 18 100.0%9 39.1% 14 60.9% 23 100.0%8 19.0% 34 81.0% 42 100.0%47 83.9% 9 16.1% 56 100.0%136 62.4% 82 37.6% 218 100.0%540 93.9% 35 6.1% 575 100.0%15 55.6% 12 44.4% 27 100.0%15 62.5% 9 37.5% 24 100.0%20 46.5% 23 53.5% 43 100.0%209 77.1% 62 22.9% 271 100.0%170 83.7% 33 16.3% 203 100.0%481 80.7% 115 19.3% 596 100.0%164 85.9% 27 14.1% 191 100.0%189 87.1% 28 12.9% 217 100.0%2718 81.7% 609 18.3% 3327 100.0%
13379 86.4% 2104 13.6% 15483 100.0%
8989077 68686868689 9 5535535535534 969696 5 57
02028028402840284028474 4747479229229229 8090909009
89898989890007777 68686868689 9 9 9 5535535535534 4 4 96969696 5 5 5 12121266668989 U U U889888988898999
08089 8989 7 7 7 7867867 6 676776788
89890890890890 78 6666665 969696 680
89898989000777 68686868689 9 9 5535535535534 4 4 96969696 5 5 5777
15156154154154 845 55 64 88846156156158
898907 656565 656 7 75 8686867
45 50 261857 63 100
12689 U88989089 89 7867 67678
890890 78 665 96 6808907 689 5534 96 57
156154 845 5 64 8461588907 65 656 75 867 8 908
9809 4794Y943 Y943Y9028028474 479229 80909
89 367 9562 6782 83292 83625 382 2782 937 38 38792 723 02
4850 480 4980 890 904 60 540
3 3 32 3 3 8 8 81 1 1 13 3 3 3 12 12 124 4 3 3 2 16 16 161 1 2 2 23 3 3 3 2 14 14 142 2 2 2 3 11 11 113 3 3 2 2 13 13 12 11 1 1 1 1 5 5 513 13 12 11 11 1 61 61 60 1103 107 59 41 35 3 1 349 348 1 346 3
3 3 32 3 3 8 8 8
1 1 1 13 3 3 3 12 12 12
4 4 3 3 2 16 16 161 1 2 2 2
3 3 3 3 2 14 14 142 2 2 2 3 11 11 11
3 3 3 2 2 13 13 12 11 1 1 1 1 5 5 5
13 13 12 11 11 1 61 61 60 1103 107 59 41 35 3 1 349 348 1 346 3
2 2 13 13 12 11 1 1 1 1 5 5 5
13 13 12 11 11 1 61 61 60 1103 107 59 41 35 3 1 349 348 1 346 3
75 79 064 20 379 07 590 3 2 8
48 05 8
56 40 6
72 90 4
6
892 3
4 04 0
4 90792 6
4 8 5 8 5 8 5 4 9 3 7 0 1
4 5 0 4 5 0 1 9 7 3
EDUCATIONTRAINING
HEALTH ÉTUDESFORMAT
ION
SANTÉ
758 64 26 12
03 13 015 23
12689 U88989089 89 7867 67678
890890 78 665 96 6808907 689 5534 96 57
156154 845 5 64 8461588907 65 656 75 867 8 908
9809 4794Y943 Y943Y9028028474 479229 80909
89 367 9562 6782 83292 83625 382 2782 937 38 38792 723 02
1103 1078
%+
+ 781 5413 9
405540 466
0 1533 8
18 387
9 41 3
5 3 1
34
12689 U88989
089 89 7867 67678
890890 78 665 96 680
8907 689 5534 96 57
156154 845 5 64 846158
8907 65 656 75 867 8 90
8
9809 4794Y943 Y943Y9
028028474 479229 80909
89 367 9562 6782 83292 8362
5 382 2782 937 38 38792 723 02
8907 689 5534 96 57
028028474 479229 80909
8907 689 5534 96 57
4
{ {7
7
3
4 15103 107 59 41 35 3 1 349 303 107 59 41 35 3 1 349 3
11 11 1 61 61 60 1
1 5 2 1 5 2 1 6
4 4 5 1 5 2 8
6 4 8 2 4 6 1 2 6
12689 u88989089 89 7867 67678890890 78 665 96 6808907 689 5534 96 57156154 845 5 64 8461588907 65 656 75 867 8 9089809 4794y943 y943y9
T O
T A L
H E A L T H S A N T É
EDUCATIONÉTUDES
EDUCATIONTRAININGHEALTH
" " "" "
" "A
8
2 2 2 2 3 11 11 113 3 3 2 2 13 13 12 11 1 1 1 1 5 5 513 13 12 11 11 1 61 650 640 75 056 06 6890780 9029 068 0690667890 0 49 0463 0492
12689 U88989
089 89 7867 67678
890890 78 665 96 680
8907 689 5534 96 57
156154 845 5 64 846158
8907 65 656 75 867 8 908
9809 4794Y943 Y943Y9
028028474 479229 80909
89 367 9562 6782 83292 8362
5 382 2782 937 38 38792 723 02
8907 689 5534 96 57
028028474 479229 80909
8907 689 5534 96 5 12689 U88989
089 89 7867 67678
890890 78 665 96 680
8907 689 5534 96 57
156154 845 5 64 846158
8907 65 656 75 867
EDUCATION REGISTRY ENREGISTREMENT
D’ÉDUCATION
EDUCAT
ION REGISTRY
ENREGISTREMENT D’ÉDUCATION
M.D. DegreeDiplôme M.D.
Year M.D. Degree Receivedby Location of University Which Awarded the M.D. Degree (Table C-1) 54International Medical Graduates: Country Where M.D. Degree Was Awardedby Legal Status and Rank (Table C-2) 55Field of Post-M.D. Trainingby Location of University Which Awarded the M.D. Degree (Table I-4) 117Faculty of Medicine Providing Post-M.D. Trainingby Location of University Which Awarded the M.D. Degree (Table A-4) 40Faculty of Medicine Providing Post-M.D. Trainingby Location of University Which Awarded the M.D. Degree (visa trainees not included) (Table A-4i) 41Rank by Legal Status Within Location of University Which Awarded the M.D. Degree (Table F-1) 64Source of Funding for Post-M.D. Trainingby Legal Status Within Location of University Which Awarded the M.D. Degree (Table D-1) 60
Année d’obtention du doctorat en médecinepar lieu de l’université ayant décerné
le doctorat en médecine (tableau C-1)
Diplômés des facultés de médecine étrangères: Pays de l’université ayant décerné le doctorat en
médecine par statut légal et rang (tableau C-2)
Domaine de formation post-M.D. par lieu de l’université ayant décerné
le doctorat en médecine (tableau I-4)
Faculté de médecine offrant la formation post-M.D. par lieu de l’université ayant décerné
le doctorat en médecine (tableau A-4)
Faculté de médecine offrant la formation post-M.D.par lieu de l’université ayant décerné le doctorat en
médecine (stagiaires avec permis de travail non compris)(tableau A-4i)
Rang par statut légal dans les limites du lieu de l’université ayant décerné le doctorat en médecine
(tableau F-1)Source de financement de la formation post-M.D.
par statut légal dans les limites du lieu de l’université ayant décerné le doctorat en médecine
(tableau D-1)
SECTION
C
53Recensement annuel des stagiaires post-M.D. | 2013-2014 | ANNUAL CENSUS OF POST-M.D. TRAINEES
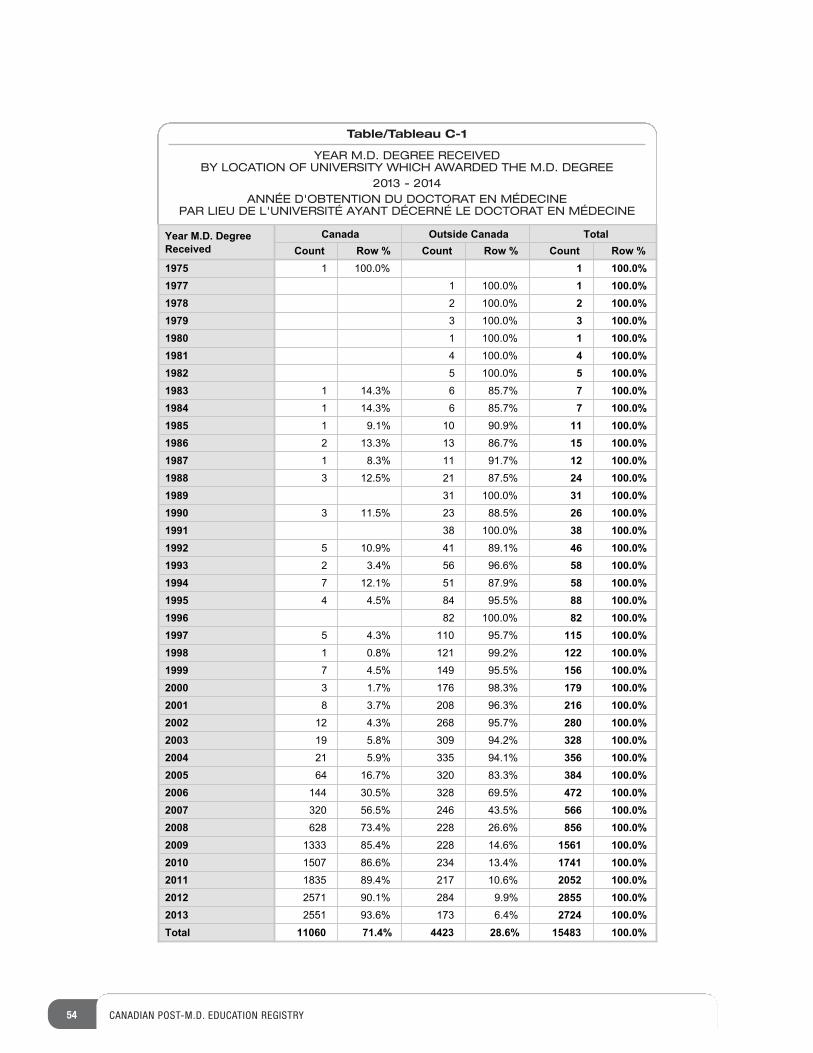
54 CANADIAN POST-M.D. EDUCATION REGISTRY
Table/Tableau C-1
YEAR M.D. DEGREE RECEIVEDBY LOCATION OF UNIVERSITY WHICH AWARDED THE M.D. DEGREE
2013 - 2014ANNÉE D'OBTENTION DU DOCTORAT EN MÉDECINE
PAR LIEU DE L'UNIVERSITÉ AYANT DÉCERNÉ LE DOCTORAT EN MÉDECINE
Year M.D. Degree Received
Canada Outside Canada TotalCount Row % Count Row % Count Row %
19751977197819791980198119821983198419851986198719881989199019911992199319941995199619971998199920002001200220032004200520062007200820092010201120122013Total
1 100.0% 1 100.0%1 100.0% 1 100.0%2 100.0% 2 100.0%3 100.0% 3 100.0%1 100.0% 1 100.0%4 100.0% 4 100.0%5 100.0% 5 100.0%
1 14.3% 6 85.7% 7 100.0%1 14.3% 6 85.7% 7 100.0%1 9.1% 10 90.9% 11 100.0%2 13.3% 13 86.7% 15 100.0%1 8.3% 11 91.7% 12 100.0%3 12.5% 21 87.5% 24 100.0%
31 100.0% 31 100.0%3 11.5% 23 88.5% 26 100.0%
38 100.0% 38 100.0%5 10.9% 41 89.1% 46 100.0%2 3.4% 56 96.6% 58 100.0%7 12.1% 51 87.9% 58 100.0%4 4.5% 84 95.5% 88 100.0%
82 100.0% 82 100.0%5 4.3% 110 95.7% 115 100.0%1 0.8% 121 99.2% 122 100.0%7 4.5% 149 95.5% 156 100.0%3 1.7% 176 98.3% 179 100.0%8 3.7% 208 96.3% 216 100.0%12 4.3% 268 95.7% 280 100.0%19 5.8% 309 94.2% 328 100.0%21 5.9% 335 94.1% 356 100.0%64 16.7% 320 83.3% 384 100.0%144 30.5% 328 69.5% 472 100.0%320 56.5% 246 43.5% 566 100.0%628 73.4% 228 26.6% 856 100.0%1333 85.4% 228 14.6% 1561 100.0%1507 86.6% 234 13.4% 1741 100.0%1835 89.4% 217 10.6% 2052 100.0%2571 90.1% 284 9.9% 2855 100.0%2551 93.6% 173 6.4% 2724 100.0%
11060 71.4% 4423 28.6% 15483 100.0%
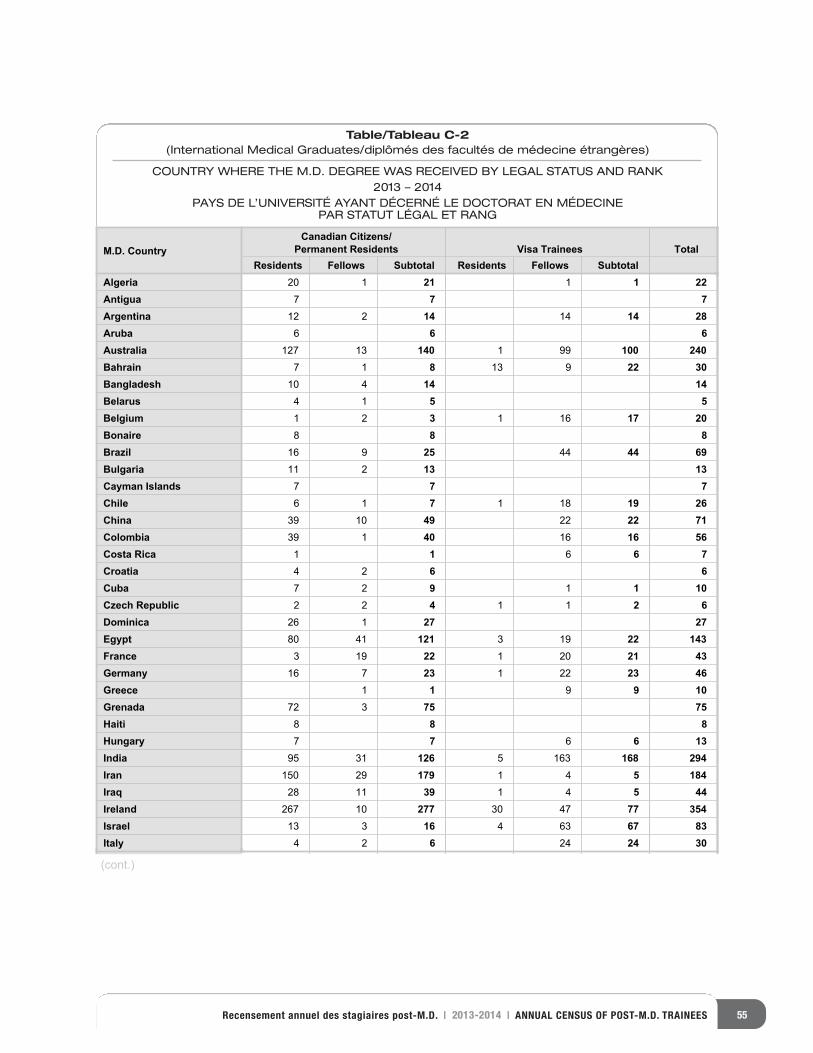
55Recensement annuel des stagiaires post-M.D. | 2013-2014 | ANNUAL CENSUS OF POST-M.D. TRAINEES
M.D. CountryCanadian Citizens/
Permanent Residents Visa Trainees TotalResidents Fellows Subtotal Residents Fellows Subtotal
AlgeriaAntiguaArgentinaArubaAustraliaBahrainBangladeshBelarusBelgiumBonaireBrazilBulgariaCayman IslandsChileChinaColombiaCosta RicaCroatiaCubaCzech RepublicDominicaEgyptFranceGermanyGreeceGrenadaHaitiHungaryIndiaIranIraqIrelandIsraelItaly
20 1 21 1 1 227 7 712 2 14 14 14 286 6 6
127 13 140 1 99 100 2407 1 8 13 9 22 3010 4 14 144 1 5 51 2 3 1 16 17 208 8 816 9 25 44 44 6911 2 13 137 7 76 1 7 1 18 19 2639 10 49 22 22 7139 1 40 16 16 561 1 6 6 74 2 6 67 2 9 1 1 102 2 4 1 1 2 626 1 27 2780 41 121 3 19 22 1433 19 22 1 20 21 4316 7 23 1 22 23 46
1 1 9 9 1072 3 75 758 8 87 7 6 6 1395 31 126 5 163 168 294150 29 179 1 4 5 18428 11 39 1 4 5 44267 10 277 30 47 77 35413 3 16 4 63 67 834 2 6 24 24 30
(cont.)
Table/Tableau C-2(International Medical Graduates/diplômés des facultés de médecine étrangères)
COUNTRY WHERE THE M.D. DEGREE WAS RECEIVED BY LEGAL STATUS AND RANK2013 – 2014
PAYS DE L’UNIVERSITÉ AYANT DÉCERNÉ LE DOCTORAT EN MÉDECINE PAR STATUT LÉGAL ET RANG
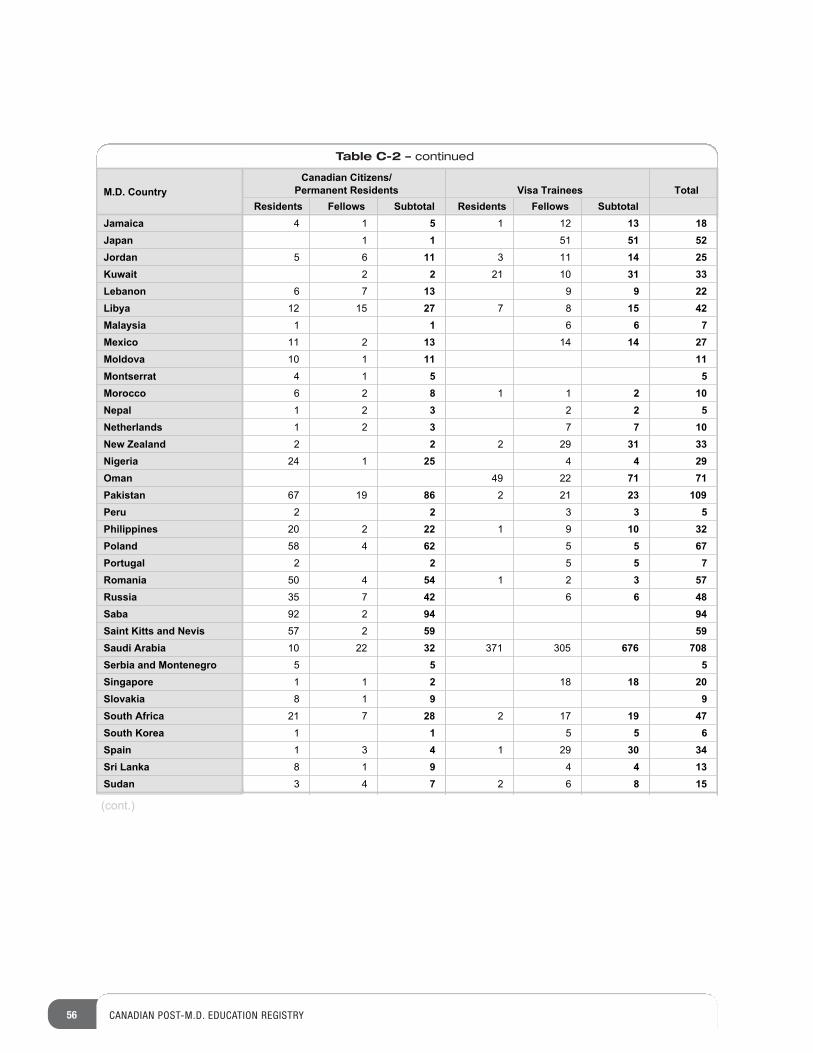
56 CANADIAN POST-M.D. EDUCATION REGISTRY
M.D. CountryCanadian Citizens/
Permanent Residents Visa Trainees TotalResidents Fellows Subtotal Residents Fellows Subtotal
JamaicaJapanJordanKuwaitLebanonLibyaMalaysiaMexicoMoldovaMontserratMoroccoNepalNetherlandsNew ZealandNigeriaOmanPakistanPeruPhilippinesPolandPortugalRomaniaRussiaSabaSaint Kitts and NevisSaudi ArabiaSerbia and MontenegroSingaporeSlovakiaSouth AfricaSouth KoreaSpainSri LankaSudan
4 1 5 1 12 13 181 1 51 51 52
5 6 11 3 11 14 252 2 21 10 31 33
6 7 13 9 9 2212 15 27 7 8 15 421 1 6 6 711 2 13 14 14 2710 1 11 114 1 5 56 2 8 1 1 2 101 2 3 2 2 51 2 3 7 7 102 2 2 29 31 3324 1 25 4 4 29
49 22 71 7167 19 86 2 21 23 1092 2 3 3 520 2 22 1 9 10 3258 4 62 5 5 672 2 5 5 750 4 54 1 2 3 5735 7 42 6 6 4892 2 94 9457 2 59 5910 22 32 371 305 676 7085 5 51 1 2 18 18 208 1 9 921 7 28 2 17 19 471 1 5 5 61 3 4 1 29 30 348 1 9 4 4 133 4 7 2 6 8 15
(cont.)
Table C-2 – continued
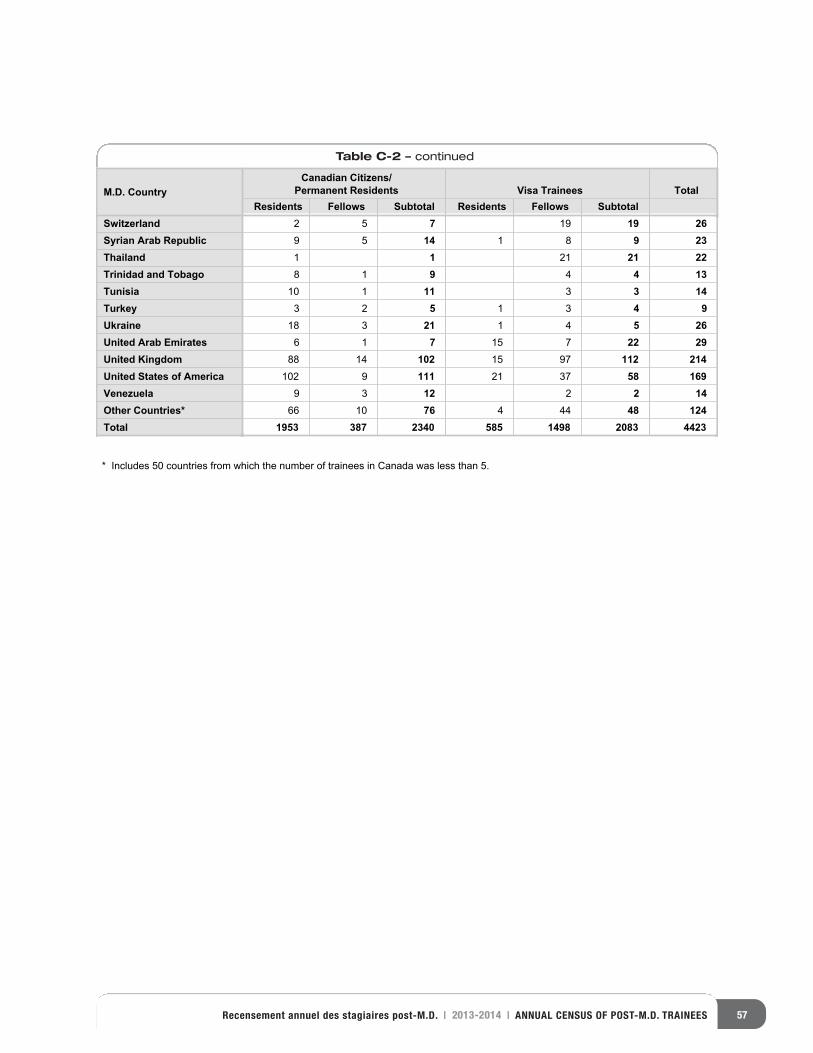
57Recensement annuel des stagiaires post-M.D. | 2013-2014 | ANNUAL CENSUS OF POST-M.D. TRAINEES
M.D. CountryCanadian Citizens/
Permanent Residents Visa Trainees TotalResidents Fellows Subtotal Residents Fellows Subtotal
SwitzerlandSyrian Arab RepublicThailandTrinidad and TobagoTunisiaTurkeyUkraineUnited Arab EmiratesUnited KingdomUnited States of AmericaVenezuelaOther Countries*Total
2 5 7 19 19 269 5 14 1 8 9 231 1 21 21 228 1 9 4 4 13
10 1 11 3 3 143 2 5 1 3 4 9
18 3 21 1 4 5 266 1 7 15 7 22 29
88 14 102 15 97 112 214102 9 111 21 37 58 169
9 3 12 2 2 1466 10 76 4 44 48 124
1953 387 2340 585 1498 2083 4423
* Includes 50 countries from which the number of trainees in Canada was less than 5.
Table C-2 – continued

58 CANADIAN POST-M.D. EDUCATION REGISTRY
8989077 68686868689 9 5535535535534 969696 5 57
02028028402840284028474 4747479229229229 8090909009
89898989890007777 68686868689 9 9 9 5535535535534 4 4 96969696 5 5 5 12121266668989 U U U889888988898999
08089 8989 7 7 7 7867867 6 676776788
89890890890890 78 6666665 969696 680
89898989000777 68686868689 9 9 5535535535534 4 4 96969696 5 5 5777
15156154154154 845 55 64 88846156156158
898907 656565 656 7 75 8686867
45 50 261857 63 100
12689 U88989089 89 7867 67678
890890 78 665 96 6808907 689 5534 96 57
156154 845 5 64 8461588907 65 656 75 867 8 908
9809 4794Y943 Y943Y9028028474 479229 80909
89 367 9562 6782 83292 83625 382 2782 937 38 38792 723 02
4850 480 4980 890 904 60 540
3 3 32 3 3 8 8 81 1 1 13 3 3 3 12 12 124 4 3 3 2 16 16 161 1 2 2 23 3 3 3 2 14 14 142 2 2 2 3 11 11 113 3 3 2 2 13 13 12 11 1 1 1 1 5 5 513 13 12 11 11 1 61 61 60 1103 107 59 41 35 3 1 349 348 1 346 3
3 3 32 3 3 8 8 8
1 1 1 13 3 3 3 12 12 12
4 4 3 3 2 16 16 161 1 2 2 2
3 3 3 3 2 14 14 142 2 2 2 3 11 11 11
3 3 3 2 2 13 13 12 11 1 1 1 1 5 5 5
13 13 12 11 11 1 61 61 60 1103 107 59 41 35 3 1 349 348 1 346 3
2 2 13 13 12 11 1 1 1 1 5 5 5
13 13 12 11 11 1 61 61 60 1103 107 59 41 35 3 1 349 348 1 346 3
75 79 064 20 379 07 590 3 2 8
48 05 8
56 40 6
72 90 4
6
892 3
4 04 0
4 90792 6
4 8 5 8 5 8 5 4 9 3 7 0 1
4 5 0 4 5 0 1 9 7 3
EDUCATIONTRAINING
HEALTH ÉTUDESFORMAT
ION
SANTÉ
758 64 26 12
03 13 015 23
12689 U88989089 89 7867 67678
890890 78 665 96 6808907 689 5534 96 57
156154 845 5 64 8461588907 65 656 75 867 8 908
9809 4794Y943 Y943Y9028028474 479229 80909
89 367 9562 6782 83292 83625 382 2782 937 38 38792 723 02
1103 1078
%+
+ 781 5413 9
405540 466
0 1533 8
18 387
9 41 3
5 3 1
34
12689 U88989
089 89 7867 67678
890890 78 665 96 680
8907 689 5534 96 57
156154 845 5 64 846158
8907 65 656 75 867 8 90
8
9809 4794Y943 Y943Y9
028028474 479229 80909
89 367 9562 6782 83292 8362
5 382 2782 937 38 38792 723 02
8907 689 5534 96 57
028028474 479229 80909
8907 689 5534 96 57
4
{ {7
7
3
4 15103 107 59 41 35 3 1 349 303 107 59 41 35 3 1 349 3
11 11 1 61 61 60 1
1 5 2 1 5 2 1 6
4 4 5 1 5 2 8
6 4 8 2 4 6 1 2 6
12689 u88989089 89 7867 67678890890 78 665 96 6808907 689 5534 96 57156154 845 5 64 8461588907 65 656 75 867 8 9089809 4794y943 y943y9
T O
T A L
H E A L T H S A N T É
EDUCATIONÉTUDES
EDUCATIONTRAININGHEALTH
" " "" "
" "A
8
2 2 2 2 3 11 11 113 3 3 2 2 13 13 12 11 1 1 1 1 5 5 513 13 12 11 11 1 61 650 640 75 056 06 6890780 9029 068 0690667890 0 49 0463 0492
12689 U88989
089 89 7867 67678
890890 78 665 96 680
8907 689 5534 96 57
156154 845 5 64 846158
8907 65 656 75 867 8 908
9809 4794Y943 Y943Y9
028028474 479229 80909
89 367 9562 6782 83292 8362
5 382 2782 937 38 38792 723 02
8907 689 5534 96 57
028028474 479229 80909
8907 689 5534 96 5 12689 U88989
089 89 7867 67678
890890 78 665 96 680
8907 689 5534 96 57
156154 845 5 64 846158
8907 65 656 75 867
EDUCATION REGISTRY ENREGISTREMENT
D’ÉDUCATION
EDUCAT
ION REGISTRY
ENREGISTREMENT D’ÉDUCATION
Source of Funding For Post-M.D. TrainingSource de financement pour la formation post-M.D.
by Rank (Tables A-2, A-2i) 38by Province of Location of Faculty of Medicine Providing Post-M.D. Training(Table I-2) 107by Field of Post-M.D. Training(Table I-1) 102by Legal Status Within Location of University Which Awarded the M.D. Degree (Table D-1) 60by Legal Status Within Location of University Which Awarded the M.D. Degree (residents only – fellows not included) (Table D-1i) 60
par rang (tableaux A-2, A-2i)
par province où est située la faculté de médecine offrant la formation post-M.D.
(tableau I-2)par domaine de formation post-M.D.
(tableau I-1)par statut légal dans les limites du lieu de l’université
ayant décerné le doctorat en médecine (tableau D-1)
par statut légal dans les limites du lieu de l’université ayant décerné le doctorat en médecine (résidents
seulement – moniteurs cliniques non compris) (tableau D-1i)
SECTION
D
59Recensement annuel des stagiaires post-M.D. | 2013-2014 | ANNUAL CENSUS OF POST-M.D. TRAINEES
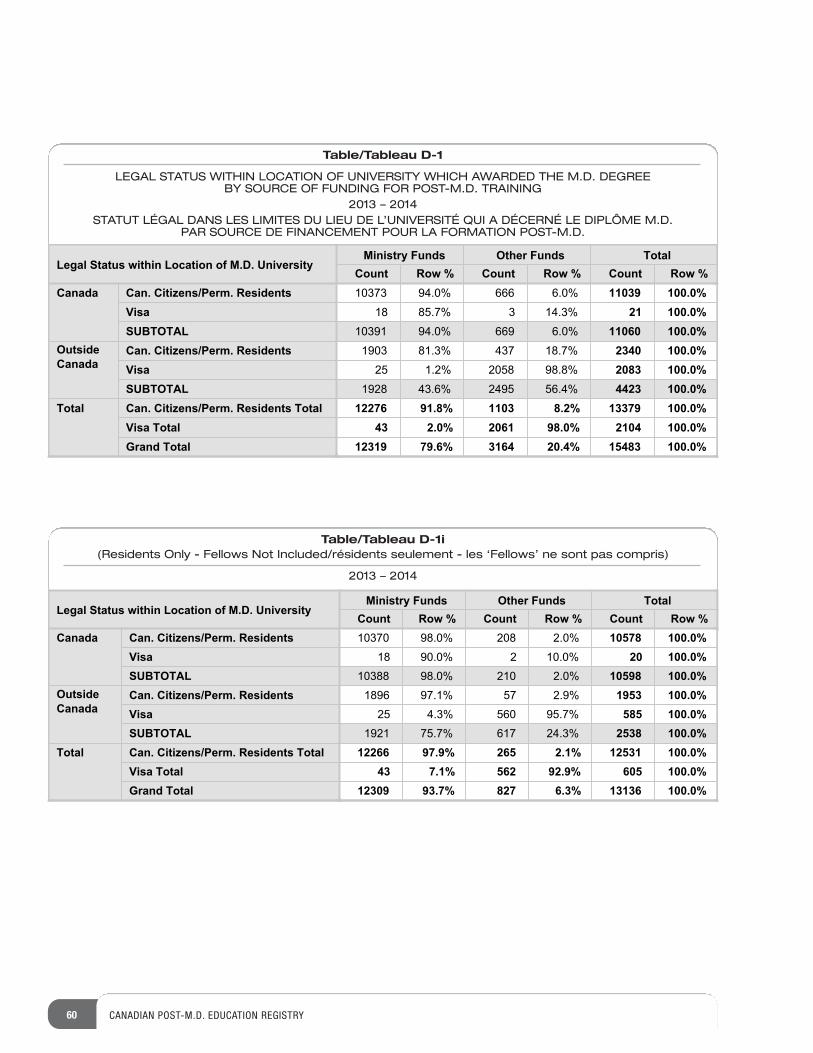
Table/Tableau D-1i(Residents Only - Fellows Not Included/résidents seulement - les ‘Fellows’ ne sont pas compris)
2013 – 2014
60 CANADIAN POST-M.D. EDUCATION REGISTRY
Table/Tableau D-1
LEGAL STATUS WITHIN LOCATION OF UNIVERSITY WHICH AWARDED THE M.D. DEGREEBY SOURCE OF FUNDING FOR POST-M.D. TRAINING
2013 – 2014STATUT LÉGAL DANS LES LIMITES DU LIEU DE L’UNIVERSITÉ QUI A DÉCERNÉ LE DIPLÔME M.D.
PAR SOURCE DE FINANCEMENT POUR LA FORMATION POST-M.D.
Legal Status within Location of M.D. UniversityMinistry Funds Other Funds Total
Count Row % Count Row % Count Row %Canada Can. Citizens/Perm. Residents
VisaSUBTOTAL
OutsideCanada
Can. Citizens/Perm. ResidentsVisaSUBTOTAL
Total Can. Citizens/Perm. Residents TotalVisa TotalGrand Total
10373 94.0% 666 6.0% 11039 100.0%18 85.7% 3 14.3% 21 100.0%
10391 94.0% 669 6.0% 11060 100.0%1903 81.3% 437 18.7% 2340 100.0%25 1.2% 2058 98.8% 2083 100.0%
1928 43.6% 2495 56.4% 4423 100.0%12276 91.8% 1103 8.2% 13379 100.0%
43 2.0% 2061 98.0% 2104 100.0%12319 79.6% 3164 20.4% 15483 100.0%
Legal Status within Location of M.D. UniversityMinistry Funds Other Funds Total
Count Row % Count Row % Count Row %Canada Can. Citizens/Perm. Residents
VisaSUBTOTAL
OutsideCanada
Can. Citizens/Perm. ResidentsVisaSUBTOTAL
Total Can. Citizens/Perm. Residents TotalVisa TotalGrand Total
10370 98.0% 208 2.0% 10578 100.0%18 90.0% 2 10.0% 20 100.0%
10388 98.0% 210 2.0% 10598 100.0%1896 97.1% 57 2.9% 1953 100.0%25 4.3% 560 95.7% 585 100.0%
1921 75.7% 617 24.3% 2538 100.0%12266 97.9% 265 2.1% 12531 100.0%
43 7.1% 562 92.9% 605 100.0%12309 93.7% 827 6.3% 13136 100.0%
Legal Status within Location of M.D. UniversityMinistry Funds Other Funds Total
Count Row % Count Row % Count Row %Canada Can. Citizens/Perm. Residents
VisaSUBTOTAL
OutsideCanada
Can. Citizens/Perm. ResidentsVisaSUBTOTAL
Total Can. Citizens/Perm. Residents TotalVisa TotalGrand Total
10373 94.0% 666 6.0% 11039 100.0%18 85.7% 3 14.3% 21 100.0%
10391 94.0% 669 6.0% 11060 100.0%1903 81.3% 437 18.7% 2340 100.0%25 1.2% 2058 98.8% 2083 100.0%
1928 43.6% 2495 56.4% 4423 100.0%12276 91.8% 1103 8.2% 13379 100.0%
43 2.0% 2061 98.0% 2104 100.0%12319 79.6% 3164 20.4% 15483 100.0%
Legal Status within Location of M.D. UniversityMinistry Funds Other Funds Total
Count Row % Count Row % Count Row %Canada Can. Citizens/Perm. Residents
VisaSUBTOTAL
OutsideCanada
Can. Citizens/Perm. ResidentsVisaSUBTOTAL
Total Can. Citizens/Perm. Residents TotalVisa TotalGrand Total
10370 98.0% 208 2.0% 10578 100.0%18 90.0% 2 10.0% 20 100.0%
10388 98.0% 210 2.0% 10598 100.0%1896 97.1% 57 2.9% 1953 100.0%25 4.3% 560 95.7% 585 100.0%
1921 75.7% 617 24.3% 2538 100.0%12266 97.9% 265 2.1% 12531 100.0%
43 7.1% 562 92.9% 605 100.0%12309 93.7% 827 6.3% 13136 100.0%
45 50 261857 63 100
12689 U88989089 89 7867 67678
890890 78 665 96 6808907 689 5534 96 57
156154 845 5 64 8461588907 65 656 75 867 8 908
9809 4794Y943 Y943Y9028028474 479229 80909
89 367 9562 6782 83292 83625 382 2782 937 38 38792 723 02
4850 480 4980 890 904 60 540
3 3 32 3 3 8 8 81 1 1 13 3 3 3 12 12 124 4 3 3 2 16 16 161 1 2 2 23 3 3 3 2 14 14 142 2 2 2 3 11 11 113 3 3 2 2 13 13 12 11 1 1 1 1 5 5 513 13 12 11 11 1 61 61 60 1103 107 59 41 35 3 1 349 348 1 346 3
3 3 32 3 3 8 8 8
1 1 1 13 3 3 3 12 12 12
4 4 3 3 2 16 16 161 1 2 2 2
3 3 3 3 2 14 14 142 2 2 2 3 11 11 11
3 3 3 2 2 13 13 12 11 1 1 1 1 5 5 5
13 13 12 11 11 1 61 61 60 1103 107 59 41 35 3 1 349 348 1 346 3
2 2 13 13 12 11 1 1 1 1 5 5 5
13 13 12 11 11 1 61 61 60 1103 107 59 41 35 3 1 349 348 1 346 3
75 79 064 20 379 07 590 3 2 8
48 05 8
56 40 6
72 90 4
6
892 3
4 04 0
4 90792 6
4 8 5 8 5 8 5 4 9 3 7 0 1
4 5 0 4 5 0 1 9 7 3
EDUCATIONTRAINING
HEALTH ÉTUDESFORMAT
ION
SANTÉ
758 64 26 12
03 13 015 23
12689 U88989089 89 7867 67678
890890 78 665 96 6808907 689 5534 96 57
156154 845 5 64 8461588907 65 656 75 867 8 908
9809 4794Y943 Y943Y9028028474 479229 80909
89 367 9562 6782 83292 83625 382 2782 937 38 38792 723 02
1103 1078
%+
+ 781 5413 9
405540 466
0 1533 8
18 387
9 41 3
5 3 1
34
12689 U88989
089 89 7867 67678
890890 78 665 96 680
8907 689 5534 96 57
156154 845 5 64 846158
8907 65 656 75 867 8 90
8
9809 4794Y943 Y943Y9
028028474 479229 80909
89 367 9562 6782 83292 8362
5 382 2782 937 38 38792 723 02
8907 689 5534 96 57
028028474 479229 80909
8907 689 5534 96 57
4
{ {7
7
3
4 15103 107 59 41 35 3 1 349 303 107 59 41 35 3 1 349 3
11 11 1 61 61 60 1
1 5 2 1 5 2 1 6
4 4 5 1 5 2 8
6 4 8 2 4 6 1 2 6
12689 u88989089 89 7867 67678890890 78 665 96 6808907 689 5534 96 57156154 845 5 64 8461588907 65 656 75 867 8 9089809 4794y943 y943y9
T O
T A L
H E A L T H S A N T É
EDUCATIONÉTUDES
EDUCATIONTRAININGHEALTH
" " "" "
" "A
8
2 2 2 2 3 11 11 113 3 3 2 2 13 13 12 11 1 1 1 1 5 5 513 13 12 11 11 1 61 650 640 75 056 06 6890780 9029 068 0690667890 0 49 0463 0492
12689 U88989
089 89 7867 67678
890890 78 665 96 680
8907 689 5534 96 57
156154 845 5 64 846158
8907 65 656 75 867 8 908
9809 4794Y943 Y943Y9
028028474 479229 80909
89 367 9562 6782 83292 8362
5 382 2782 937 38 38792 723 02
8907 689 5534 96 57
028028474 479229 80909
8907 689 5534 96 5 12689 U88989
089 89 7867 67678
890890 78 665 96 680
8907 689 5534 96 57
156154 845 5 64 846158
8907 65 656 75 867
EDUCATION REGISTRY ENREGISTREMENT
D’ÉDUCATION
EDUCAT
ION REGISTRY
ENREGISTREMENT D’ÉDUCATION
Age Âge
SECTION
Ei
Field of Post-M.D. Training by Average Age (practice entry cohort) (Table H-6) 92
Domaine de formation post-M.D.par âge moyen (cohorte entrant en exercice)
(tableau H-6)
45 50 261857 63 100
12689 U88989089 89 7867 67678
890890 78 665 96 6808907 689 5534 96 57
156154 845 5 64 8461588907 65 656 75 867 8 908
9809 4794Y943 Y943Y9028028474 479229 80909
89 367 9562 6782 83292 83625 382 2782 937 38 38792 723 02
4850 480 4980 890 904 60 540
3 3 32 3 3 8 8 81 1 1 13 3 3 3 12 12 124 4 3 3 2 16 16 161 1 2 2 23 3 3 3 2 14 14 142 2 2 2 3 11 11 113 3 3 2 2 13 13 12 11 1 1 1 1 5 5 513 13 12 11 11 1 61 61 60 1103 107 59 41 35 3 1 349 348 1 346 3
3 3 32 3 3 8 8 8
1 1 1 13 3 3 3 12 12 12
4 4 3 3 2 16 16 161 1 2 2 2
3 3 3 3 2 14 14 142 2 2 2 3 11 11 11
3 3 3 2 2 13 13 12 11 1 1 1 1 5 5 5
13 13 12 11 11 1 61 61 60 1103 107 59 41 35 3 1 349 348 1 346 3
2 2 13 13 12 11 1 1 1 1 5 5 5
13 13 12 11 11 1 61 61 60 1103 107 59 41 35 3 1 349 348 1 346 3
75 79 064 20 379 07 590 3 2 8
48 05 8
56 40 6
72 90 4
6
892 3
4 04 0
4 90792 6
4 8 5 8 5 8 5 4 9 3 7 0 1
4 5 0 4 5 0 1 9 7 3
EDUCATIONTRAINING
HEALTH ÉTUDESFORMAT
ION
SANTÉ
758 64 26 12
03 13 015 23
12689 U88989089 89 7867 67678
890890 78 665 96 6808907 689 5534 96 57
156154 845 5 64 8461588907 65 656 75 867 8 908
9809 4794Y943 Y943Y9028028474 479229 80909
89 367 9562 6782 83292 83625 382 2782 937 38 38792 723 02
1103 1078
%+
+ 781 5413 9
405540 466
0 1533 8
18 387
9 41 3
5 3 1
34
12689 U88989
089 89 7867 67678
890890 78 665 96 680
8907 689 5534 96 57
156154 845 5 64 846158
8907 65 656 75 867 8 90
8
9809 4794Y943 Y943Y9
028028474 479229 80909
89 367 9562 6782 83292 8362
5 382 2782 937 38 38792 723 02
8907 689 5534 96 57
028028474 479229 80909
8907 689 5534 96 57
4
{ {7
7
3
4 15103 107 59 41 35 3 1 349 303 107 59 41 35 3 1 349 3
11 11 1 61 61 60 1
1 5 2 1 5 2 1 6
4 4 5 1 5 2 8
6 4 8 2 4 6 1 2 6
12689 u88989089 89 7867 67678890890 78 665 96 6808907 689 5534 96 57156154 845 5 64 8461588907 65 656 75 867 8 9089809 4794y943 y943y9
T O
T A L
H E A L T H S A N T É
EDUCATIONÉTUDES
EDUCATIONTRAININGHEALTH
" " "" "
" "A
8
2 2 2 2 3 11 11 113 3 3 2 2 13 13 12 11 1 1 1 1 5 5 513 13 12 11 11 1 61 650 640 75 056 06 6890780 9029 068 0690667890 0 49 0463 0492
12689 U88989
089 89 7867 67678
890890 78 665 96 680
8907 689 5534 96 57
156154 845 5 64 846158
8907 65 656 75 867 8 908
9809 4794Y943 Y943Y9
028028474 479229 80909
89 367 9562 6782 83292 8362
5 382 2782 937 38 38792 723 02
8907 689 5534 96 57
028028474 479229 80909
8907 689 5534 96 5 12689 U88989
089 89 7867 67678
890890 78 665 96 680
8907 689 5534 96 57
156154 845 5 64 846158
8907 65 656 75 867
EDUCATION REGISTRY ENREGISTREMENT
D’ÉDUCATION
EDUCAT
ION REGISTRY
ENREGISTREMENT D’ÉDUCATION
GenderSexe
by Faculty of Medicine Providing Post-M.D. Training (visa trainees not included) (Table A-3) 39by Field of Post-M.D. Training (visa trainees not included) (Table I-3) 111by Field of Post-M.D. Training (first year trainees only – visa trainees not included) (Table G-6) 76by Field of Post-M.D. Training (practice entry cohort) (Table H-7) 93
par faculté de médecine offrant la formation post-M.D. (stagiaires avec
permis de travail non compris)(tableau A-3)
par domaine de formation post-M.D. (stagiaires avec permis de travail non compris)
(tableau I-3)par domaine de formation post-M.D. (stagiaires en
première année post-M.D. seulement – stagiaires avec permis de travail non compris)
(tableau G-6)par domaine de formation post-M.D.
(cohorte entrant en exercice)(tableau H-7)
SECTION
E
61Recensement annuel des stagiaires post-M.D. | 2013-2014 | ANNUAL CENSUS OF POST-M.D. TRAINEES

62 CANADIAN POST-M.D. EDUCATION REGISTRY

8989077 68686868689 9 5535535535534 969696 5 57
02028028402840284028474 4747479229229229 8090909009
89898989890007777 68686868689 9 9 9 5535535535534 4 4 96969696 5 5 5 12121266668989 U U U889888988898999
08089 8989 7 7 7 7867867 6 676776788
89890890890890 78 6666665 969696 680
89898989000777 68686868689 9 9 5535535535534 4 4 96969696 5 5 5777
15156154154154 845 55 64 88846156156158
898907 656565 656 7 75 8686867
45 50 261857 63 100
12689 U88989089 89 7867 67678
890890 78 665 96 6808907 689 5534 96 57
156154 845 5 64 8461588907 65 656 75 867 8 908
9809 4794Y943 Y943Y9028028474 479229 80909
89 367 9562 6782 83292 83625 382 2782 937 38 38792 723 02
4850 480 4980 890 904 60 540
3 3 32 3 3 8 8 81 1 1 13 3 3 3 12 12 124 4 3 3 2 16 16 161 1 2 2 23 3 3 3 2 14 14 142 2 2 2 3 11 11 113 3 3 2 2 13 13 12 11 1 1 1 1 5 5 513 13 12 11 11 1 61 61 60 1103 107 59 41 35 3 1 349 348 1 346 3
3 3 32 3 3 8 8 8
1 1 1 13 3 3 3 12 12 12
4 4 3 3 2 16 16 161 1 2 2 2
3 3 3 3 2 14 14 142 2 2 2 3 11 11 11
3 3 3 2 2 13 13 12 11 1 1 1 1 5 5 5
13 13 12 11 11 1 61 61 60 1103 107 59 41 35 3 1 349 348 1 346 3
2 2 13 13 12 11 1 1 1 1 5 5 5
13 13 12 11 11 1 61 61 60 1103 107 59 41 35 3 1 349 348 1 346 3
75 79 064 20 379 07 590 3 2 8
48 05 8
56 40 6
72 90 4
6
892 3
4 04 0
4 90792 6
4 8 5 8 5 8 5 4 9 3 7 0 1
4 5 0 4 5 0 1 9 7 3
EDUCATIONTRAINING
HEALTH ÉTUDESFORMAT
ION
SANTÉ
758 64 26 12
03 13 015 23
12689 U88989089 89 7867 67678
890890 78 665 96 6808907 689 5534 96 57
156154 845 5 64 8461588907 65 656 75 867 8 908
9809 4794Y943 Y943Y9028028474 479229 80909
89 367 9562 6782 83292 83625 382 2782 937 38 38792 723 02
1103 1078
%+
+ 781 5413 9
405540 466
0 1533 8
18 387
9 41 3
5 3 1
34
12689 U88989
089 89 7867 67678
890890 78 665 96 680
8907 689 5534 96 57
156154 845 5 64 846158
8907 65 656 75 867 8 90
8
9809 4794Y943 Y943Y9
028028474 479229 80909
89 367 9562 6782 83292 8362
5 382 2782 937 38 38792 723 02
8907 689 5534 96 57
028028474 479229 80909
8907 689 5534 96 57
4
{ {7
7
3
4 15103 107 59 41 35 3 1 349 303 107 59 41 35 3 1 349 3
11 11 1 61 61 60 1
1 5 2 1 5 2 1 6
4 4 5 1 5 2 8
6 4 8 2 4 6 1 2 6
12689 u88989089 89 7867 67678890890 78 665 96 6808907 689 5534 96 57156154 845 5 64 8461588907 65 656 75 867 8 9089809 4794y943 y943y9
T O
T A L
H E A L T H S A N T É
EDUCATIONÉTUDES
EDUCATIONTRAININGHEALTH
" " "" "
" "A
8
2 2 2 2 3 11 11 113 3 3 2 2 13 13 12 11 1 1 1 1 5 5 513 13 12 11 11 1 61 650 640 75 056 06 6890780 9029 068 0690667890 0 49 0463 0492
12689 U88989
089 89 7867 67678
890890 78 665 96 680
8907 689 5534 96 57
156154 845 5 64 846158
8907 65 656 75 867 8 908
9809 4794Y943 Y943Y9
028028474 479229 80909
89 367 9562 6782 83292 8362
5 382 2782 937 38 38792 723 02
8907 689 5534 96 57
028028474 479229 80909
8907 689 5534 96 5 12689 U88989
089 89 7867 67678
890890 78 665 96 680
8907 689 5534 96 57
156154 845 5 64 846158
8907 65 656 75 867
EDUCATION REGISTRY ENREGISTREMENT
D’ÉDUCATION
EDUCAT
ION REGISTRY
ENREGISTREMENT D’ÉDUCATION
Legal StatusStatut légal
by Field of Post-M.D. Training (Table B-2) 50Within Location of University Which Awarded the M.D. Degree by Rank (Table F-1) 64Within Location of University Which Awarded the M.D. Degreeby Source of Funding for Post-M.D. Training (Table D-1) 60by Province of Location of Faculty of Medicine Providing Post-M.D. Training (Table F-2) 65by Province of Location of Faculty of Medicine Providing Post-M.D. Training (regular ministry funded trainees only) (Table F-2i) 65Field of Post-M.D. Trainingby Province of Location of Faculty of Medicine Providing Post-M.D. Training (visa trainees only) (Table F-3) 66by Field of Training (first year trainees only – 2009-2013) (Table I-9) 137
par domaine de formation post-M.D.(tableau B-2)
Dans les limites du lieu de l’université ayant décerné le doctorat en médecine par rang
(tableau F-1)Dans les limites du lieu de l’université ayant
décerné le doctorat en médecinepar source de financement de la formation post-M.D.
(tableau D-1)par province où est située la faculté de médecine offrant la formation post-M.D.
(tableau F-2)par province où est située la faculté de médecine
offrant la formation post-M.D. (stagiaires subventionnés par les fonds ministériels habituels seulement)
(tableau F-2i)Domaine de formation post-M.D.
par province où est située la faculté de médecine offrant la formation post-M.D.
(stagiaires avec permis de travail seulement) (tableau F-3)
par domaine de formation post-M.D. (stagiaires en première année seulement – 2009-2013)
(tableau I-9)
SECTION
F
63Recensement annuel des stagiaires post-M.D. | 2013-2014 | ANNUAL CENSUS OF POST-M.D. TRAINEES
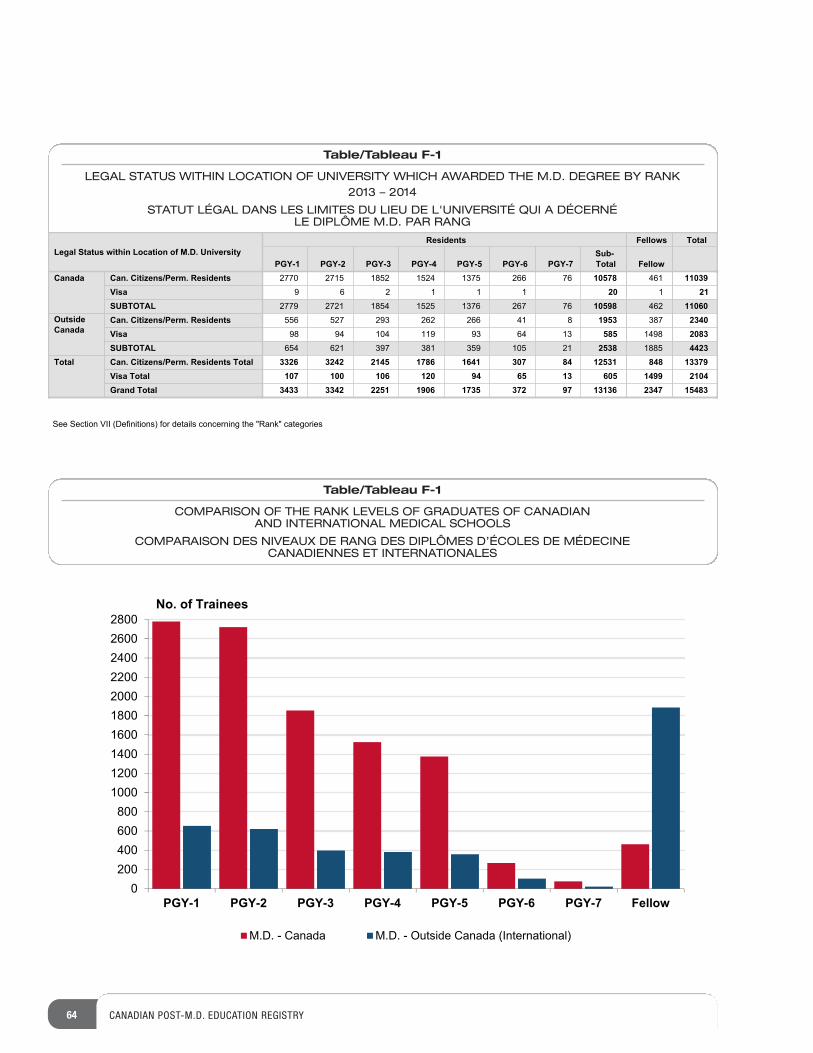
64 CANADIAN POST-M.D. EDUCATION REGISTRY
Table/Tableau F-1
LEGAL STATUS WITHIN LOCATION OF UNIVERSITY WHICH AWARDED THE M.D. DEGREE BY RANK2013 – 2014
STATUT LÉGAL DANS LES LIMITES DU LIEU DE L'UNIVERSITÉ QUI A DÉCERNÉ LE DIPLÔME M.D. PAR RANG
Table/Tableau F-1
COMPARISON OF THE RANK LEVELS OF GRADUATES OF CANADIAN AND INTERNATIONAL MEDICAL SCHOOLS
COMPARAISON DES NIVEAUX DE RANG DES DIPLÔMES D’ÉCOLES DE MÉDECINECANADIENNES ET INTERNATIONALES
Legal Status within Location of M.D. UniversityResidents Fellows Total
PGY-1 PGY-2 PGY-3 PGY-4 PGY-5 PGY-6 PGY-7Sub-Total Fellow
Canada Can. Citizens/Perm. ResidentsVisaSUBTOTAL
OutsideCanada
Can. Citizens/Perm. ResidentsVisaSUBTOTAL
Total Can. Citizens/Perm. Residents TotalVisa TotalGrand Total
2770 2715 1852 1524 1375 266 76 10578 461 110399 6 2 1 1 1 20 1 21
2779 2721 1854 1525 1376 267 76 10598 462 11060556 527 293 262 266 41 8 1953 387 2340
98 94 104 119 93 64 13 585 1498 2083654 621 397 381 359 105 21 2538 1885 4423
3326 3242 2145 1786 1641 307 84 12531 848 13379107 100 106 120 94 65 13 605 1499 2104
3433 3342 2251 1906 1735 372 97 13136 2347 15483
See Section VII (Definitions) for details concerning the "Rank" categories
0200400600800
1000120014001600180020002200240026002800
PGY-1 PGY-2 PGY-3 PGY-4 PGY-5 PGY-6 PGY-7 Fellow
M.D. - Canada M.D. - Outside Canada (International)
No. of Trainees
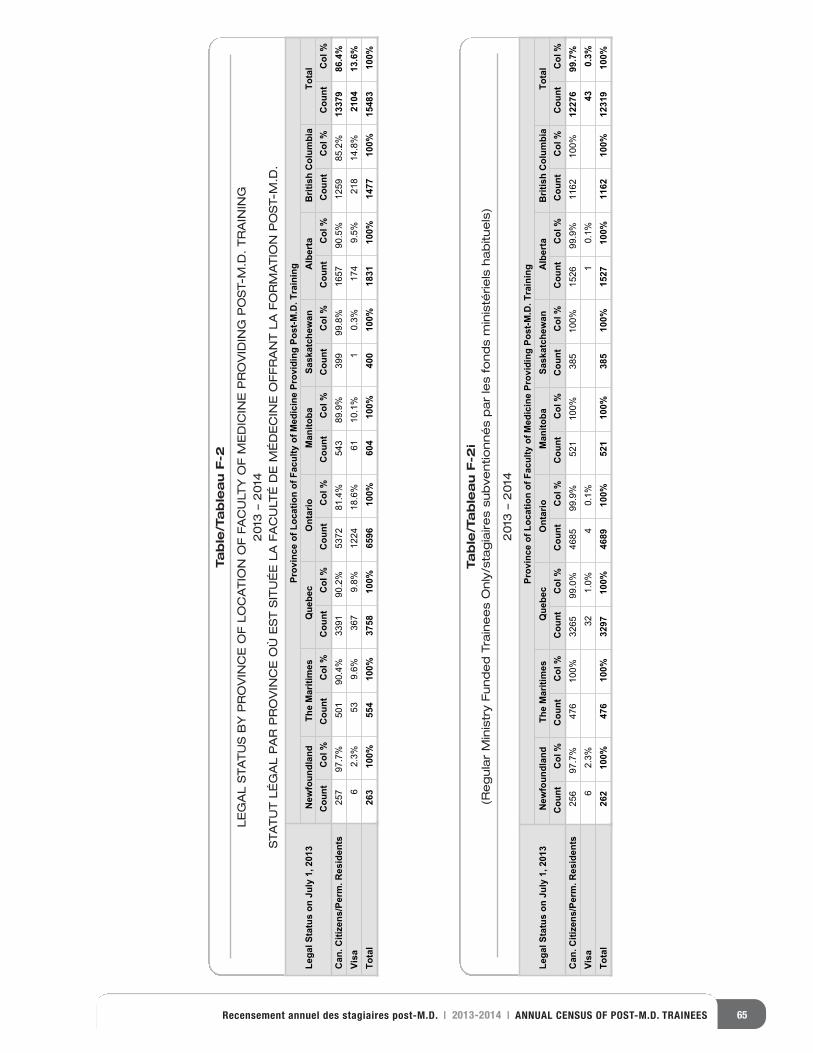
65Recensement annuel des stagiaires post-M.D. | 2013-2014 | ANNUAL CENSUS OF POST-M.D. TRAINEES
Lega
l Sta
tus
on J
uly
1, 2
013
Prov
ince
of L
ocat
ion
of F
acul
ty o
f Med
icin
e Pr
ovid
ing
Post
-M.D
. Tra
inin
gN
ewfo
undl
and
The
Mar
itim
esQ
uebe
cO
ntar
ioM
anito
baSa
skat
chew
anA
lber
taB
ritis
h C
olum
bia
Tota
lC
ount
Col
%C
ount
Col
%C
ount
Col
%C
ount
Col
%C
ount
Col
%C
ount
Col
%C
ount
Col
%C
ount
Col
%C
ount
Col
%C
an. C
itize
ns/P
erm
. Res
iden
tsVi
saTo
tal
257
97.7%
501
90.4%
3391
90.2%
5372
81.4%
543
89.9%
399
99.8%
1657
90.5%
1259
85.2%
1337
986
.4%
62.3%
539.6%
367
9.8%
1224
18.6%
6110.1%
10.3%
174
9.5%
218
14.8%
2104
13.6
%26
310
0%55
410
0%37
5810
0%65
9610
0%60
410
0%40
010
0%18
3110
0%14
7710
0%15
483
100%
Lega
l Sta
tus
on J
uly
1, 2
013
Prov
ince
of L
ocat
ion
of F
acul
ty o
f Med
icin
e Pr
ovid
ing
Post
-M.D
. Tra
inin
gN
ewfo
undl
and
The
Mar
itim
esQ
uebe
cO
ntar
ioM
anito
baSa
skat
chew
anA
lber
taB
ritis
h C
olum
bia
Tota
lC
ount
Col
%C
ount
Col
%C
ount
Col
%C
ount
Col
%C
ount
Col
%C
ount
Col
%C
ount
Col
%C
ount
Col
%C
ount
Col
%C
an. C
itize
ns/P
erm
. Res
iden
tsVi
saTo
tal
256
97.7%
476
100%
3265
99.0%
4685
99.9%
521
100%
385
100%
1526
99.9%
1162
100%
1227
699
.7%
%1.01
%1.04
%0.123
%3.26
430.
3%26
210
0%47
610
0%32
9710
0%46
8910
0%52
110
0%38
510
0%15
2710
0%11
6210
0%12
319
100%
Table/Tableau F-2
LEGAL STATUS BY PROVINCE OF LOCATION OF FACULTY OF MEDICINE PROVIDING POST-M.D. TRAINING
2013 –2014
STATUT LÉGAL PAR PROVINCE OÙ EST SITUÉE LA FACULTÉ DE MÉDECINE OFFRANT LA FORMATION POST-M.D.
Lega
l Sta
tus
on J
uly
1, 2
013
Prov
ince
of L
ocat
ion
of F
acul
ty o
f Med
icin
e Pr
ovid
ing
Post
-M.D
. Tra
inin
gN
ewfo
undl
and
The
Mar
itim
esQ
uebe
cO
ntar
ioM
anito
baSa
skat
chew
anA
lber
taB
ritis
h C
olum
bia
Tota
lC
ount
Col
%C
ount
Col
%C
ount
Col
%C
ount
Col
%C
ount
Col
%C
ount
Col
%C
ount
Col
%C
ount
Col
%C
ount
Col
%C
an. C
itize
ns/P
erm
. Res
iden
tsVi
saTo
tal
257
97.7%
501
90.4%
3391
90.2%
5372
81.4%
543
89.9%
399
99.8%
1657
90.5%
1259
85.2%
1337
986
.4%
62.3%
539.6%
367
9.8%
1224
18.6%
6110.1%
10.3%
174
9.5%
218
14.8%
2104
13.6
%26
310
0%55
410
0%37
5810
0%65
9610
0%60
410
0%40
010
0%18
3110
0%14
7710
0%15
483
100%
Lega
l Sta
tus
on J
uly
1, 2
013
Prov
ince
of L
ocat
ion
of F
acul
ty o
f Med
icin
e Pr
ovid
ing
Post
-M.D
. Tra
inin
gN
ewfo
undl
and
The
Mar
itim
esQ
uebe
cO
ntar
ioM
anito
baSa
skat
chew
anA
lber
taB
ritis
h C
olum
bia
Tota
lC
ount
Col
%C
ount
Col
%C
ount
Col
%C
ount
Col
%C
ount
Col
%C
ount
Col
%C
ount
Col
%C
ount
Col
%C
ount
Col
%C
an. C
itize
ns/P
erm
. Res
iden
tsVi
saTo
tal
256
97.7%
476
100%
3265
99.0%
4685
99.9%
521
100%
385
100%
1526
99.9%
1162
100%
1227
699
.7%
%1.01
%1.04
%0.123
%3.26
430.
3%26
210
0%47
610
0%32
9710
0%46
8910
0%52
110
0%38
510
0%15
2710
0%11
6210
0%12
319
100%
Table/Tableau F-2i
(Regular Ministry Funded Trainees Only/stagiaires subventionnés par les fonds ministériels habituels)
2013 –2014
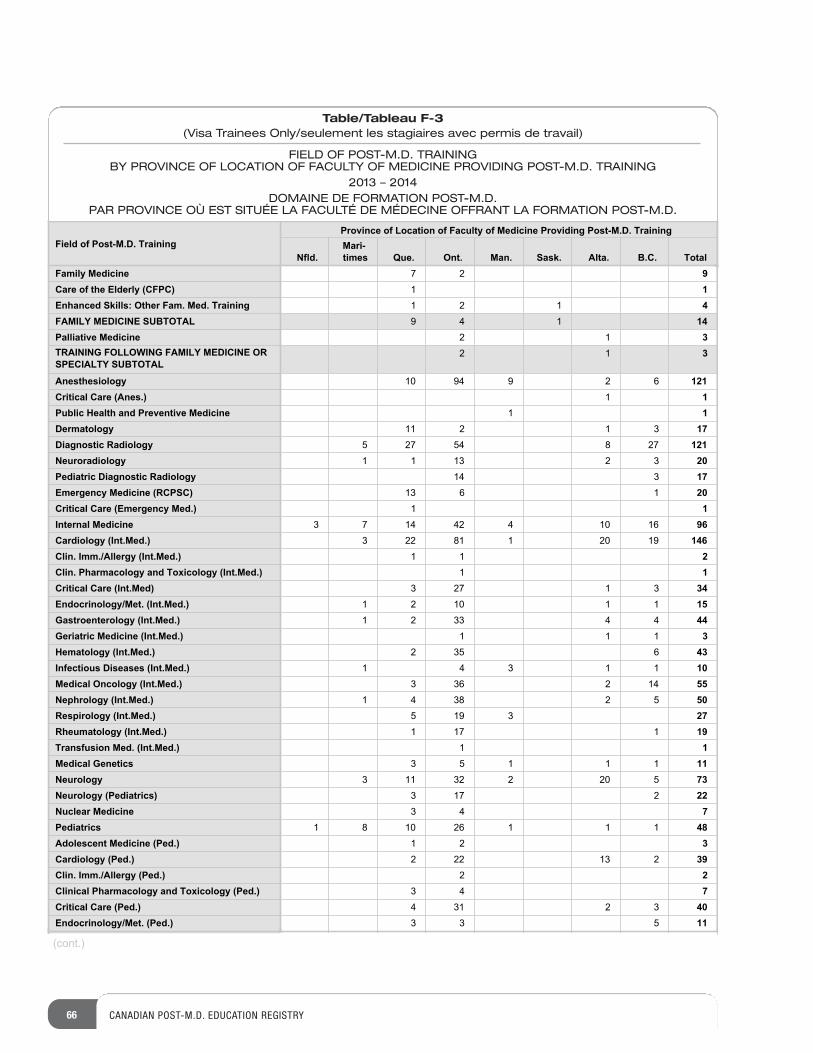
66 CANADIAN POST-M.D. EDUCATION REGISTRY
Table/Tableau F-3(Visa Trainees Only/seulement les stagiaires avec permis de travail)
FIELD OF POST-M.D. TRAININGBY PROVINCE OF LOCATION OF FACULTY OF MEDICINE PROVIDING POST-M.D. TRAINING
2013 – 2014DOMAINE DE FORMATION POST-M.D.
PAR PROVINCE OÙ EST SITUÉE LA FACULTÉ DE MÉDECINE OFFRANT LA FORMATION POST-M.D.
Field of Post-M.D. TrainingProvince of Location of Faculty of Medicine Providing Post-M.D. Training
Nfld.Mari-times Que. Ont. Man. Sask. Alta. B.C. Total
Family MedicineCare of the Elderly (CFPC)Enhanced Skills: Other Fam. Med. TrainingFAMILY MEDICINE SUBTOTALPalliative MedicineTRAINING FOLLOWING FAMILY MEDICINE OR SPECIALTY SUBTOTAL
AnesthesiologyCritical Care (Anes.)Public Health and Preventive MedicineDermatologyDiagnostic RadiologyNeuroradiologyPediatric Diagnostic RadiologyEmergency Medicine (RCPSC)Critical Care (Emergency Med.)Internal MedicineCardiology (Int.Med.)Clin. Imm./Allergy (Int.Med.)Clin. Pharmacology and Toxicology (Int.Med.)Critical Care (Int.Med)Endocrinology/Met. (Int.Med.)Gastroenterology (Int.Med.)Geriatric Medicine (Int.Med.)Hematology (Int.Med.)Infectious Diseases (Int.Med.)Medical Oncology (Int.Med.)Nephrology (Int.Med.)Respirology (Int.Med.)Rheumatology (Int.Med.)Transfusion Med. (Int.Med.)Medical GeneticsNeurologyNeurology (Pediatrics)Nuclear MedicinePediatricsAdolescent Medicine (Ped.)Cardiology (Ped.)Clin. Imm./Allergy (Ped.)Clinical Pharmacology and Toxicology (Ped.)Critical Care (Ped.)Endocrinology/Met. (Ped.)
7 2 91 11 2 1 49 4 1 14
12 32 1 3
10 94 9 2 6 1211 1
1 131211 1772845725 121323111 20341 171631 20
1 13 7 14 42 4 10 16 96
3 22 81 1 20 19 1461 1 2
1 131723 34110121 15443321 44111 36532 43
1 4 3 1 1 10412633 55528341 50
5 19 3 271711 19
1 13 5 1 1 1 11
3 11 32 2 20 5 732713 22
3 4 71 8 10 26 1 1 1 48
1 2 3231222 39
2 23 4 7
32134 40533 11
(cont.)
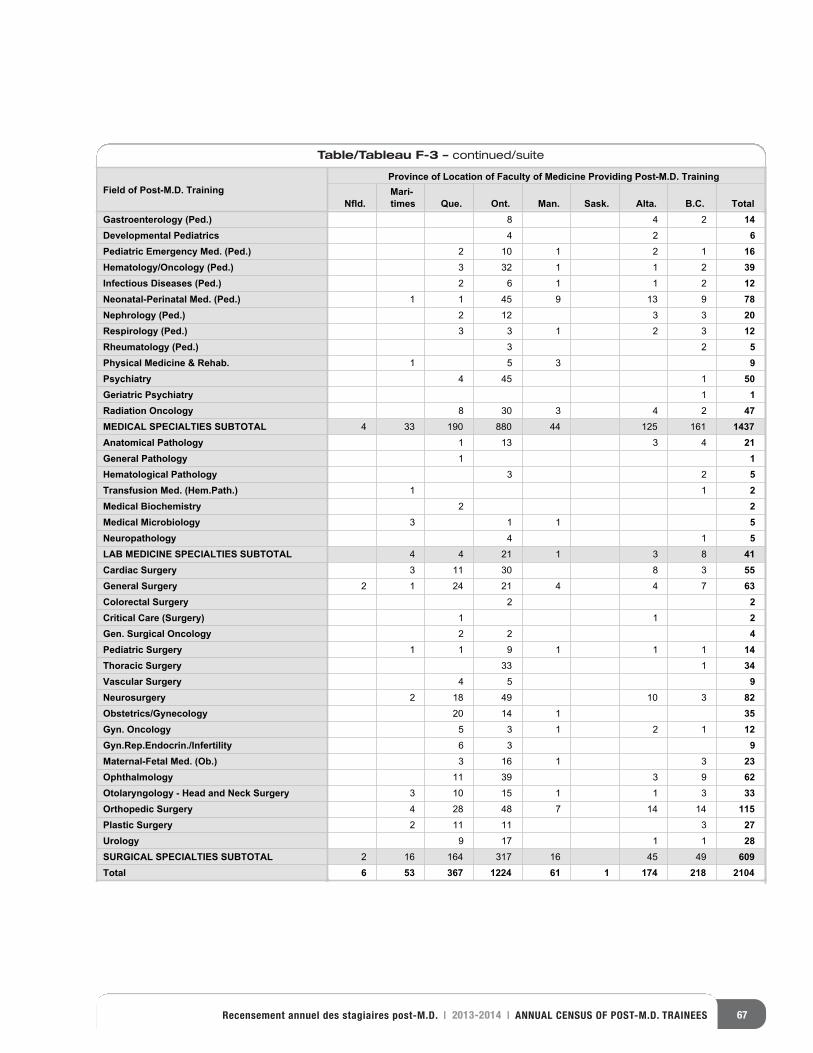
67Recensement annuel des stagiaires post-M.D. | 2013-2014 | ANNUAL CENSUS OF POST-M.D. TRAINEES
Table/Tableau F-3 – continued/suite
Field of Post-M.D. TrainingProvince of Location of Faculty of Medicine Providing Post-M.D. Training
Nfld.Mari-times Que. Ont. Man. Sask. Alta. B.C. Total
Gastroenterology (Ped.)Developmental PediatricsPediatric Emergency Med. (Ped.)Hematology/Oncology (Ped.)Infectious Diseases (Ped.)Neonatal-Perinatal Med. (Ped.)Nephrology (Ped.)Respirology (Ped.)Rheumatology (Ped.)Physical Medicine & Rehab.PsychiatryGeriatric PsychiatryRadiation OncologyMEDICAL SPECIALTIES SUBTOTALAnatomical PathologyGeneral PathologyHematological PathologyTransfusion Med. (Hem.Path.)Medical BiochemistryMedical MicrobiologyNeuropathologyLAB MEDICINE SPECIALTIES SUBTOTALCardiac SurgeryGeneral SurgeryColorectal SurgeryCritical Care (Surgery)Gen. Surgical OncologyPediatric SurgeryThoracic SurgeryVascular SurgeryNeurosurgeryObstetrics/GynecologyGyn. OncologyGyn.Rep.Endocrin./InfertilityMaternal-Fetal Med. (Ob.)OphthalmologyOtolaryngology - Head and Neck SurgeryOrthopedic SurgeryPlastic SurgeryUrologySURGICAL SPECIALTIES SUBTOTALTotal
248 1424 6
2 10 1 2 1 163 32 1 1 2 392 6 1 1 2 12
1 1 45 9 13 9 7833212 20
3 3 1 2 3 1223 5
1 5 3 91544 501 1
8 30 3 4 2 474 33 190 880 44 125 161 1437
43311 211 1
23 511 2
2 23 1 1 5
14 54 4 21 1 3 8 41
3803113 552 1 24 21 4 4 7 63
2 211 2
2 2 41 1 9 1 1 1 14
133 344 5 9
30194812 8220 14 1 355 3 1 2 1 126 3 9
31613 23939311 62
3 10 15 1 1 3 334 28 48 7 14 14 115
311112 2711719 28
2 16 164 317 16 45 49 6096 53 367 1224 61 1 174 218 2104

68 CANADIAN POST-M.D. EDUCATION REGISTRY
8989077 68686868689 9 5535535535534 969696 5 57
02028028402840284028474 4747479229229229 8090909009
89898989890007777 68686868689 9 9 9 5535535535534 4 4 96969696 5 5 5 12121266668989 U U U889888988898999
08089 8989 7 7 7 7867867 6 676776788
89890890890890 78 6666665 969696 680
89898989000777 68686868689 9 9 5535535535534 4 4 96969696 5 5 5777
15156154154154 845 55 64 88846156156158
898907 656565 656 7 75 8686867
45 50 261857 63 100
12689 U88989089 89 7867 67678
890890 78 665 96 6808907 689 5534 96 57
156154 845 5 64 8461588907 65 656 75 867 8 908
9809 4794Y943 Y943Y9028028474 479229 80909
89 367 9562 6782 83292 83625 382 2782 937 38 38792 723 02
4850 480 4980 890 904 60 540
3 3 32 3 3 8 8 81 1 1 13 3 3 3 12 12 124 4 3 3 2 16 16 161 1 2 2 23 3 3 3 2 14 14 142 2 2 2 3 11 11 113 3 3 2 2 13 13 12 11 1 1 1 1 5 5 513 13 12 11 11 1 61 61 60 1103 107 59 41 35 3 1 349 348 1 346 3
3 3 32 3 3 8 8 8
1 1 1 13 3 3 3 12 12 12
4 4 3 3 2 16 16 161 1 2 2 2
3 3 3 3 2 14 14 142 2 2 2 3 11 11 11
3 3 3 2 2 13 13 12 11 1 1 1 1 5 5 5
13 13 12 11 11 1 61 61 60 1103 107 59 41 35 3 1 349 348 1 346 3
2 2 13 13 12 11 1 1 1 1 5 5 5
13 13 12 11 11 1 61 61 60 1103 107 59 41 35 3 1 349 348 1 346 3
75 79 064 20 379 07 590 3 2 8
48 05 8
56 40 6
72 90 4
6
892 3
4 04 0
4 90792 6
4 8 5 8 5 8 5 4 9 3 7 0 1
4 5 0 4 5 0 1 9 7 3
EDUCATIONTRAINING
HEALTH ÉTUDESFORMAT
ION
SANTÉ
758 64 26 12
03 13 015 23
12689 U88989089 89 7867 67678
890890 78 665 96 6808907 689 5534 96 57
156154 845 5 64 8461588907 65 656 75 867 8 908
9809 4794Y943 Y943Y9028028474 479229 80909
89 367 9562 6782 83292 83625 382 2782 937 38 38792 723 02
1103 1078
%+
+ 781 5413 9
405540 466
0 1533 8
18 387
9 41 3
5 3 1
34
12689 U88989
089 89 7867 67678
890890 78 665 96 680
8907 689 5534 96 57
156154 845 5 64 846158
8907 65 656 75 867 8 90
8
9809 4794Y943 Y943Y9
028028474 479229 80909
89 367 9562 6782 83292 8362
5 382 2782 937 38 38792 723 02
8907 689 5534 96 57
028028474 479229 80909
8907 689 5534 96 57
4
{ {7
7
3
4 15103 107 59 41 35 3 1 349 303 107 59 41 35 3 1 349 3
11 11 1 61 61 60 1
1 5 2 1 5 2 1 6
4 4 5 1 5 2 8
6 4 8 2 4 6 1 2 6
12689 u88989089 89 7867 67678890890 78 665 96 6808907 689 5534 96 57156154 845 5 64 8461588907 65 656 75 867 8 9089809 4794y943 y943y9
T O
T A L
H E A L T H S A N T É
EDUCATIONÉTUDES
EDUCATIONTRAININGHEALTH
" " "" "
" "A
8
2 2 2 2 3 11 11 113 3 3 2 2 13 13 12 11 1 1 1 1 5 5 513 13 12 11 11 1 61 650 640 75 056 06 6890780 9029 068 0690667890 0 49 0463 0492
12689 U88989
089 89 7867 67678
890890 78 665 96 680
8907 689 5534 96 57
156154 845 5 64 846158
8907 65 656 75 867 8 908
9809 4794Y943 Y943Y9
028028474 479229 80909
89 367 9562 6782 83292 8362
5 382 2782 937 38 38792 723 02
8907 689 5534 96 57
028028474 479229 80909
8907 689 5534 96 5 12689 U88989
089 89 7867 67678
890890 78 665 96 680
8907 689 5534 96 57
156154 845 5 64 846158
8907 65 656 75 867
EDUCATION REGISTRY ENREGISTREMENT
D’ÉDUCATION
EDUCAT
ION REGISTRY
ENREGISTREMENT D’ÉDUCATION
First Year TraineesStagiaires en première année post-M.D.
Field of Post-M.D. Training by Faculty of Medicine Providing Post-M.D. Training (first year trainees – visa trainees not included) (Table G-1) 71Table 1 Summary (Table G-2) 72Comparison of first year trainees and R 1 trainees (Table G-3) 73Province of Location of Faculty of Medicine Providing Post-M.D. Training by Source of Funding for Post-M.D. Training (first year trainees only) (Table G-4) 74Legal Status by Location of University Which Awarded the M.D. Degree (first year trainees only)(Table G-5) 74Field of Post-M.D. Training by Gender (first year trainees only – visa trainees not included) (Table G-6) 76Field of Training (first year trainees only – 2009-2013)by Legal Status (Table I-9) 137
Domaine de formation post-M.D. par faculté de médecineoffrant la formation post-M.D. (stagiaires en première
année – stagiaires avec permis de travail non compris) (tableau G-1)
Sommaire – tableau 1 (tableau G-2)
Comparaison entre les stagiaires en première année post-M.D. et ceux au niveau R 1
(tableau G-3)Province où est située la faculté de
médecine offrant la formation post-M.D.par source de financement de la formation post-M.D.(stagiaires en première année post-M.D. seulement)
(tableau G-4) Statut légal par lieu où est située l’université
ayant décerné le doctorat en médecine (stagiaires en première année post-M.D. seulement)
(tableau G-5)Domaine de formation post-M.D. par sexe
(stagiaires en première année post-M.D. seulement –stagiaires avec permis de travail non compris)
(tableau G-6)Domaine de formation post-M.D. (stagiaires en première
année post-M.D. seulement – 2009-2013)par Statut légal (tableau I-9)
SECTION
G
69Recensement annuel des stagiaires post-M.D. | 2013-2014 | ANNUAL CENSUS OF POST-M.D. TRAINEES
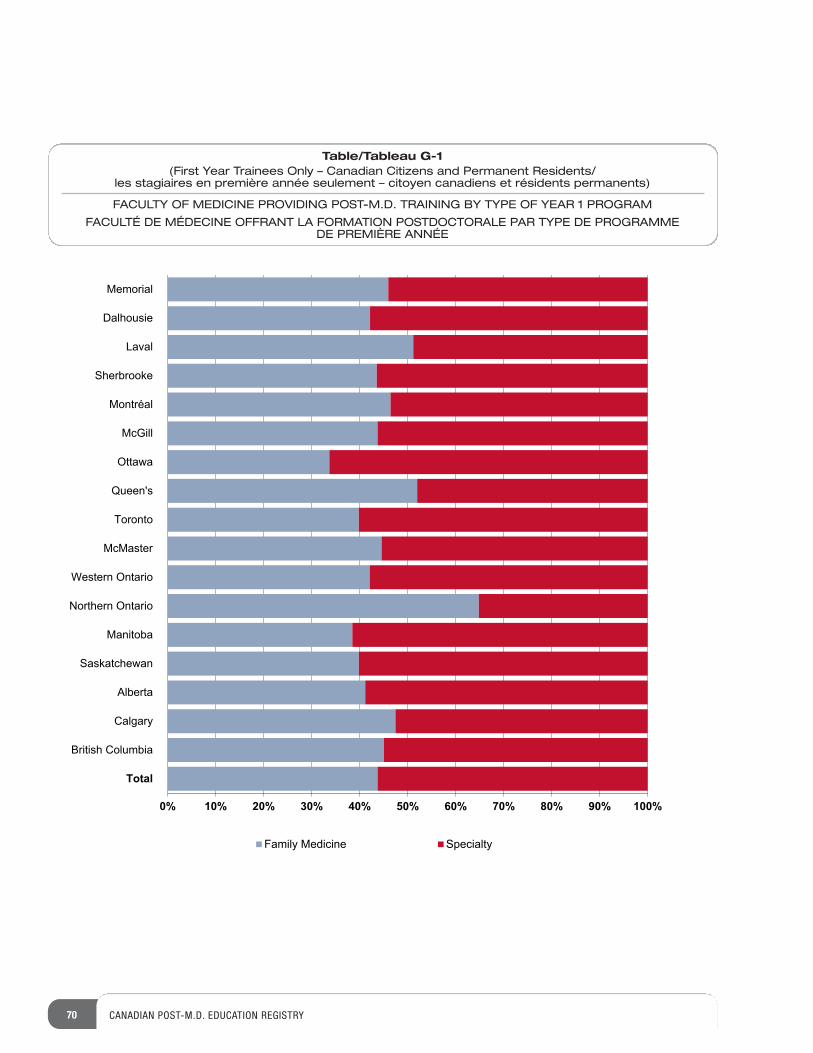
70 CANADIAN POST-M.D. EDUCATION REGISTRY
Table/Tableau G-1(First Year Trainees Only – Canadian Citizens and Permanent Residents/
les stagiaires en première année seulement – citoyen canadiens et résidents permanents)
FACULTY OF MEDICINE PROVIDING POST-M.D. TRAINING BY TYPE OF YEAR 1 PROGRAM
FACULTÉ DE MÉDECINE OFFRANT LA FORMATION POSTDOCTORALE PAR TYPE DE PROGRAMME DE PREMIÈRE ANNÉE
0% 10% 20% 30% 40% 50% 60% 70% 80% 90% 100%
Total
British Columbia
Calgary
Alberta
Saskatchewan
Manitoba
Northern Ontario
Western Ontario
McMaster
Toronto
Queen's
Ottawa
McGill
Montréal
Sherbrooke
Laval
Dalhousie
Memorial
Family Medicine Specialty
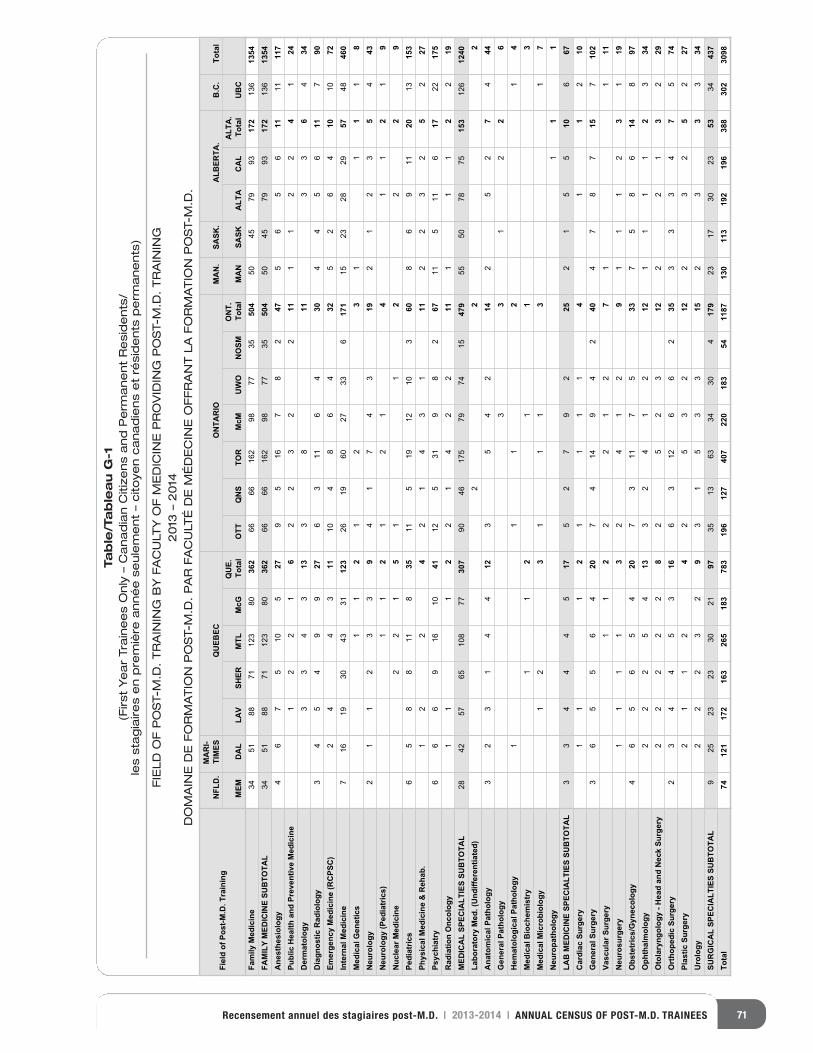
71Recensement annuel des stagiaires post-M.D. | 2013-2014 | ANNUAL CENSUS OF POST-M.D. TRAINEES
Fiel
d of
Pos
t-M.D
. Tra
inin
gN
FLD
.M
AR
I-TI
MES
QU
EBEC
ON
TAR
IOM
AN
.SA
SK.
ALB
ERTA
.B
.C.
Tota
l
MEM
DA
LLA
VSH
ERM
TLM
cGQ
UE.
Tota
lO
TTQ
NS
TOR
McM
UW
ON
OSM
ON
T.To
tal
MA
NSA
SKA
LTA
CA
LA
LTA
.To
tal
UB
CFa
mily
Med
icin
eFA
MIL
Y M
EDIC
INE
SUB
TOTA
LA
nest
hesi
olog
yPu
blic
Hea
lth a
nd P
reve
ntiv
e M
edic
ine
Der
mat
olog
yD
iagn
ostic
Rad
iolo
gyEm
erge
ncy
Med
icin
e (R
CPS
C)
Inte
rnal
Med
icin
eM
edic
al G
enet
ics
Neu
rolo
gyN
euro
logy
(Ped
iatr
ics)
Nuc
lear
Med
icin
ePe
diat
rics
Phys
ical
Med
icin
e &
Reh
ab.
Psyc
hiat
ryR
adia
tion
Onc
olog
yM
EDIC
AL
SPEC
IALT
IES
SUB
TOTA
LLa
bora
tory
Med
. (U
ndiff
eren
tiate
d)A
nato
mic
al P
atho
logy
Gen
eral
Pat
holo
gyH
emat
olog
ical
Pat
holo
gyM
edic
al B
ioch
emis
try
Med
ical
Mic
robi
olog
yN
euro
path
olog
yLA
B M
EDIC
INE
SPEC
IALT
IES
SUB
TOTA
LC
ardi
ac S
urge
ryG
ener
al S
urge
ryVa
scul
ar S
urge
ryN
euro
surg
ery
Obs
tetr
ics/
Gyn
ecol
ogy
Oph
thal
mol
ogy
Oto
lary
ngol
ogy
- Hea
d an
d N
eck
Surg
ery
Ort
hope
dic
Surg
ery
Plas
tic S
urge
ryU
rolo
gySU
RG
ICA
L SP
ECIA
LTIE
S SU
BTO
TAL
Tota
l
3451
8871
123
8036
266
66162
9877
3550
450
4579
9317
2136
1354
3451
8871
123
8036
266
66162
9877
3550
450
4579
9317
2136
1354
46
75
105
279
516
78
247
56
56
1111
117
12
21
62
23
22
111
12
24
124
33
43
133
811
33
64
343
45
49
927
63
116
430
44
56
117
902
44
311
104
86
432
52
64
1010
727
1619
3043
3112
326
1960
2733
617
115
2328
2957
4846
01
12
12
31
11
18
21
12
33
94
17
43
192
12
35
443
11
21
21
41
12
19
22
15
11
22
29
65
88
118
3511
519
1210
360
86
911
2013
153
12
24
21
43
111
22
32
52
276
66
916
1041
125
319
82
6711
511
617
2217
51
11
22
14
22
111
11
22
1928
4257
65108
7730
790
46175
7974
1547
955
5078
7515
3126
1240
22
23
23
14
412
35
42
142
52
74
443
31
22
61
11
21
41
12
11
31
23
11
13
17
11
13
34
44
517
52
79
225
21
55
106
671
11
21
11
14
11
210
36
55
64
207
414
94
240
47
87
157
102
11
22
21
27
11
111
11
13
24
12
91
11
23
119
46
56
54
207
311
75
337
58
614
897
22
25
413
32
41
212
11
11
23
342
22
22
82
52
312
22
13
229
23
44
53
166
312
66
235
33
34
75
742
11
24
25
32
122
32
52
272
22
32
93
15
33
152
33
334
925
2323
3021
9735
1363
3430
417
923
1730
2353
3443
774
121
172
163
265
183
783
196
127
407
220
183
5411
8713
011
319
219
638
830
230
98
Table/Tableau G-1
(First Year Trainees Only – Canadian Citizens and Permanent Residents/
les stagiaires en première année seulement – citoyen canadiens et résidents permanents)
FIELD OF POST-M.D. TRAINING BY FACULTY OF MEDICINE PROVIDING POST-M.D. TRAINING
2013 – 2014
DOMAINE DE FORMATION POST-M.D. PAR FACULTÉ DE MÉDECINE OFFRANT LA FORMATION POST-M.D.
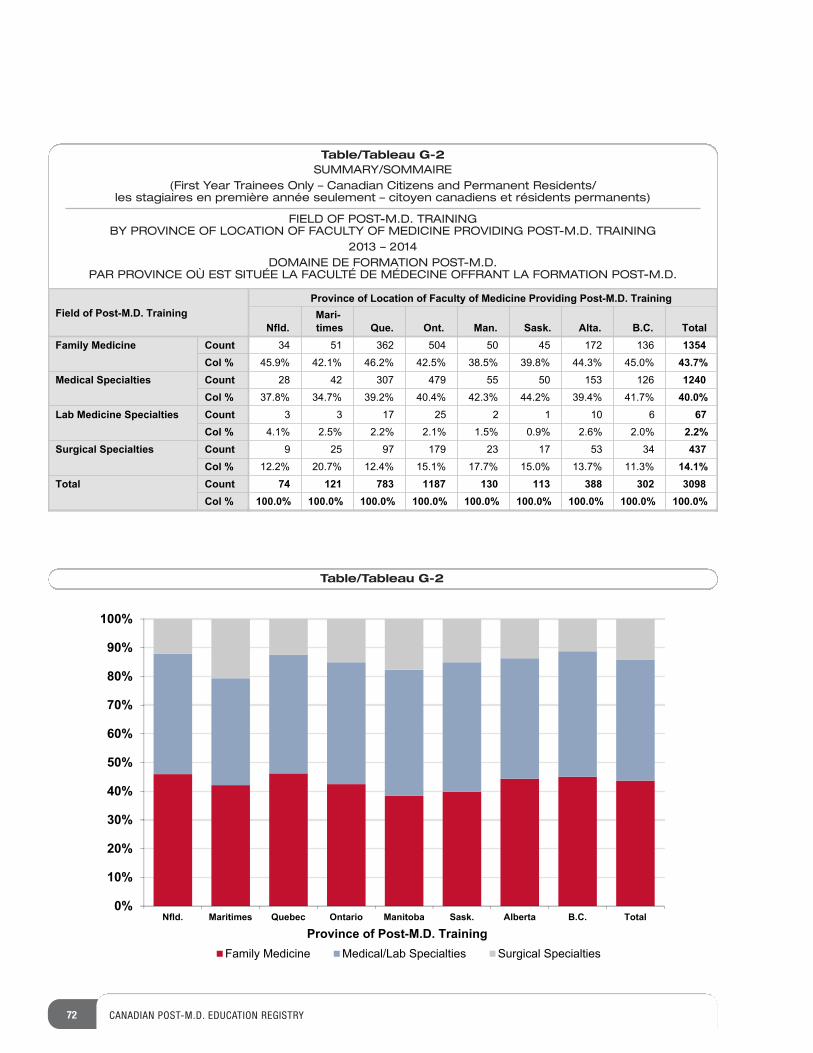
72 CANADIAN POST-M.D. EDUCATION REGISTRY
Table/Tableau G-2
Field of Post-M.D. TrainingProvince of Location of Faculty of Medicine Providing Post-M.D. Training
Nfld.Mari-times Que. Ont. Man. Sask. Alta. B.C. Total
Family Medicine CountCol %
Medical Specialties CountCol %
Lab Medicine Specialties CountCol %
Surgical Specialties CountCol %
Total CountCol %
34 51 362 504 50 45 172 136 135445.9% 42.1% 46.2% 42.5% 38.5% 39.8% 44.3% 45.0% 43.7%
28 42 307 479 55 50 153 126 124037.8% 34.7% 39.2% 40.4% 42.3% 44.2% 39.4% 41.7% 40.0%
3 3 17 25 2 1 10 6 674.1% 2.5% 2.2% 2.1% 1.5% 0.9% 2.6% 2.0% 2.2%
9 25 97 179 23 17 53 34 43712.2% 20.7% 12.4% 15.1% 17.7% 15.0% 13.7% 11.3% 14.1%
74 121 783 1187 130 113 388 302 3098100.0% 100.0% 100.0% 100.0% 100.0% 100.0% 100.0% 100.0% 100.0%
0%
10%
20%
30%
40%
50%
60%
70%
80%
90%
100%
Nfld. Maritimes Quebec Ontario Manitoba Sask. Alberta B.C. Total
Family Medicine Medical/Lab Specialties Surgical SpecialtiesProvince of Post-M.D. Training
Table/Tableau G-2
Table/Tableau G-2SUMMARY/SOMMAIRE
(First Year Trainees Only – Canadian Citizens and Permanent Residents/les stagiaires en première année seulement – citoyen canadiens et résidents permanents)
FIELD OF POST-M.D. TRAINING BY PROVINCE OF LOCATION OF FACULTY OF MEDICINE PROVIDING POST-M.D. TRAINING
2013 – 2014DOMAINE DE FORMATION POST-M.D.
PAR PROVINCE OÙ EST SITUÉE LA FACULTÉ DE MÉDECINE OFFRANT LA FORMATION POST-M.D.
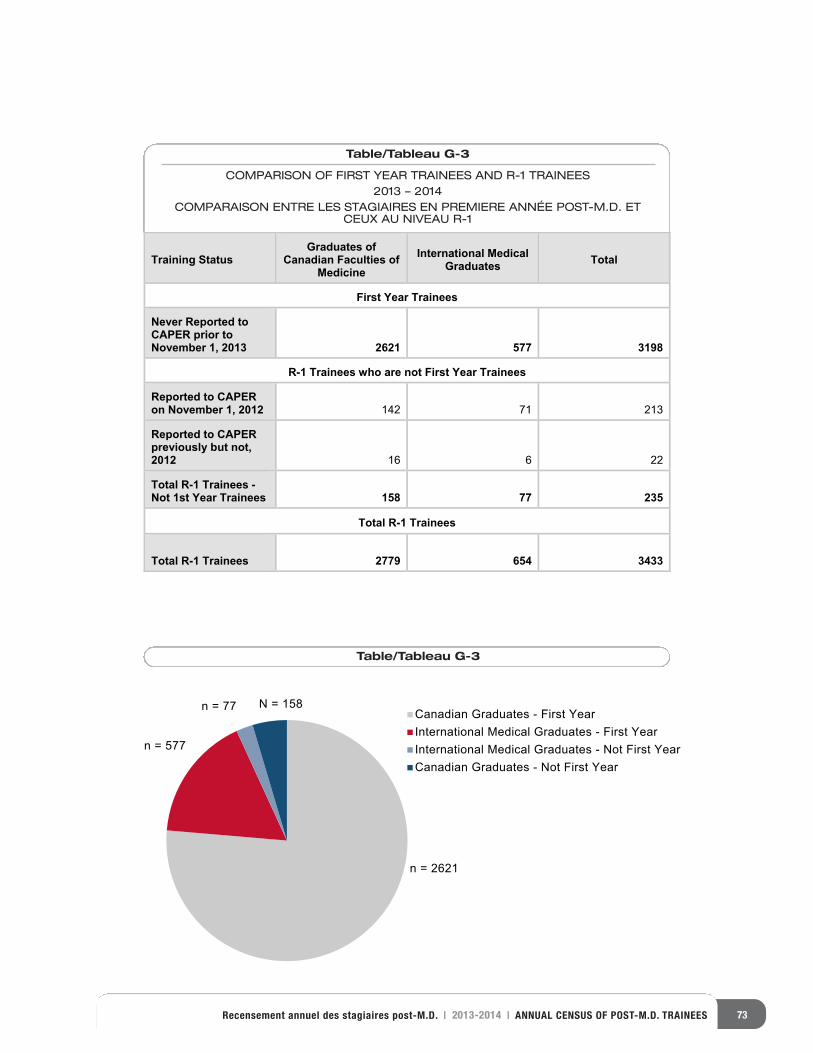
73Recensement annuel des stagiaires post-M.D. | 2013-2014 | ANNUAL CENSUS OF POST-M.D. TRAINEES
Table/Tableau G-3
Training Status Graduates of
Canadian Faculties of Medicine
International Medical Graduates Total
First Year Trainees
Never Reported to CAPER prior to November 1, 2013 2621 577 3198
R-1 Trainees who are not First Year Trainees
Reported to CAPER on November 1, 2012 31217241
Reported to CAPER previously but not, 2012 22661
Total R-1 Trainees - Not 1st Year Trainees 158 53277
Total R-1 Trainees
33434569772 seeniarT 1-R latoT
Table/Tableau G-3
Canadian Graduates - First YearInternational Medical Graduates - First YearInternational Medical Graduates - Not First YearCanadian Graduates - Not First Year
n = 2621
N = 158n = 77
n = 577
Table/Tableau G-3
Canadian Graduates - First YearInternational Medical Graduates - First YearInternational Medical Graduates - Not First YearCanadian Graduates - Not First Year
n = 2621
N = 158n = 77
n = 577
Table/Tableau G-3
COMPARISON OF FIRST YEAR TRAINEES AND R-1 TRAINEES2013 – 2014
COMPARAISON ENTRE LES STAGIAIRES EN PREMIERE ANNÉE POST-M.D. ETCEUX AU NIVEAU R-1
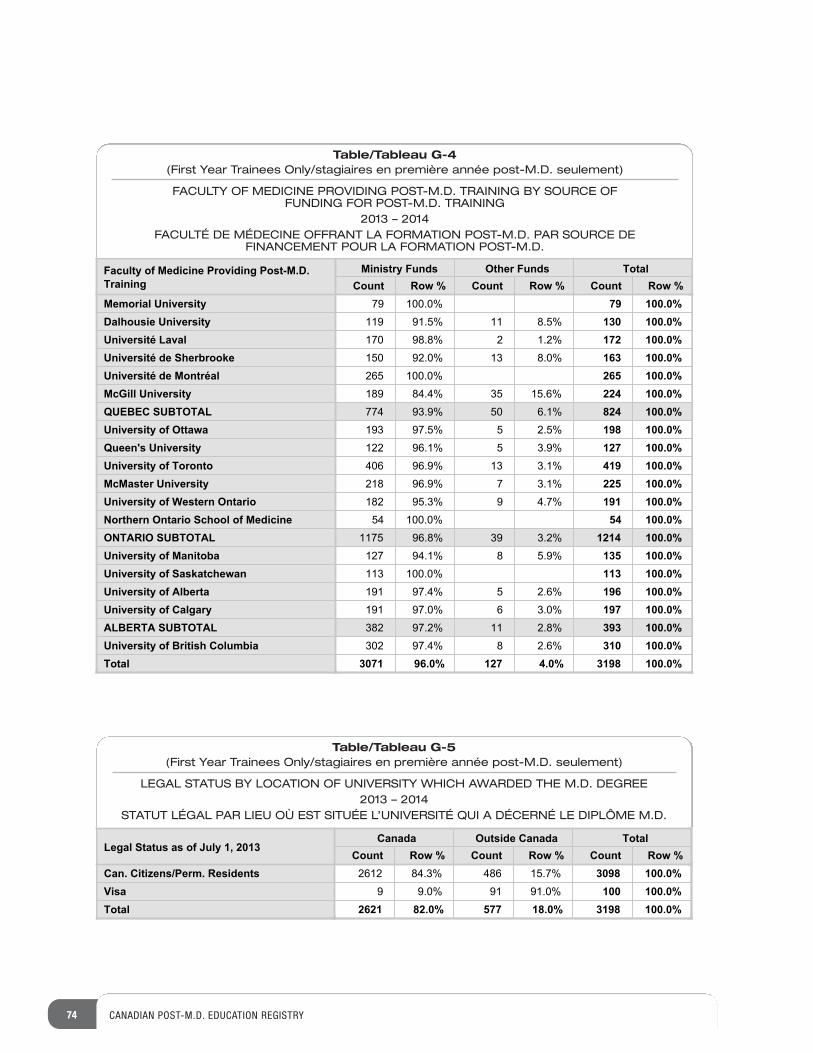
74 CANADIAN POST-M.D. EDUCATION REGISTRY
Table/Tableau G-4(First Year Trainees Only/stagiaires en première année post-M.D. seulement)
FACULTY OF MEDICINE PROVIDING POST-M.D. TRAINING BY SOURCE OF FUNDING FOR POST-M.D. TRAINING
2013 – 2014FACULTÉ DE MÉDECINE OFFRANT LA FORMATION POST-M.D. PAR SOURCE DE
FINANCEMENT POUR LA FORMATION POST-M.D.
Faculty of Medicine Providing Post-M.D. Training
Ministry Funds Other Funds TotalCount Row % Count Row % Count Row %
Memorial UniversityDalhousie UniversityUniversité LavalUniversité de SherbrookeUniversité de MontréalMcGill UniversityQUEBEC SUBTOTALUniversity of OttawaQueen's UniversityUniversity of TorontoMcMaster UniversityUniversity of Western OntarioNorthern Ontario School of MedicineONTARIO SUBTOTALUniversity of ManitobaUniversity of SaskatchewanUniversity of AlbertaUniversity of CalgaryALBERTA SUBTOTALUniversity of British ColumbiaTotal
79 100.0% 79 100.0%119 91.5% 11 8.5% 130 100.0%170 98.8% 2 1.2% 172 100.0%150 92.0% 13 8.0% 163 100.0%265 100.0% 265 100.0%189 84.4% 35 15.6% 224 100.0%774 93.9% 50 6.1% 824 100.0%193 97.5% 5 2.5% 198 100.0%122 96.1% 5 3.9% 127 100.0%406 96.9% 13 3.1% 419 100.0%218 96.9% 7 3.1% 225 100.0%182 95.3% 9 4.7% 191 100.0%54 100.0% 54 100.0%
1175 96.8% 39 3.2% 1214 100.0%127 94.1% 8 5.9% 135 100.0%113 100.0% 113 100.0%191 97.4% 5 2.6% 196 100.0%191 97.0% 6 3.0% 197 100.0%382 97.2% 11 2.8% 393 100.0%302 97.4% 8 2.6% 310 100.0%
3071 96.0% 127 4.0% 3198 100.0%
Table/Tableau G-5(First Year Trainees Only/stagiaires en première année post-M.D. seulement)
LEGAL STATUS BY LOCATION OF UNIVERSITY WHICH AWARDED THE M.D. DEGREE2013 – 2014
STATUT LÉGAL PAR LIEU OÙ EST SITUÉE L’UNIVERSITÉ QUI A DÉCERNÉ LE DIPLÔME M.D.
Legal Status as of July 1, 2013Canada Outside Canada Total
Count Row % Count Row % Count Row %Can. Citizens/Perm. ResidentsVisaTotal
2612 84.3% 486 15.7% 3098 100.0%9 9.0% 91 91.0% 100 100.0%
2621 82.0% 577 18.0% 3198 100.0%
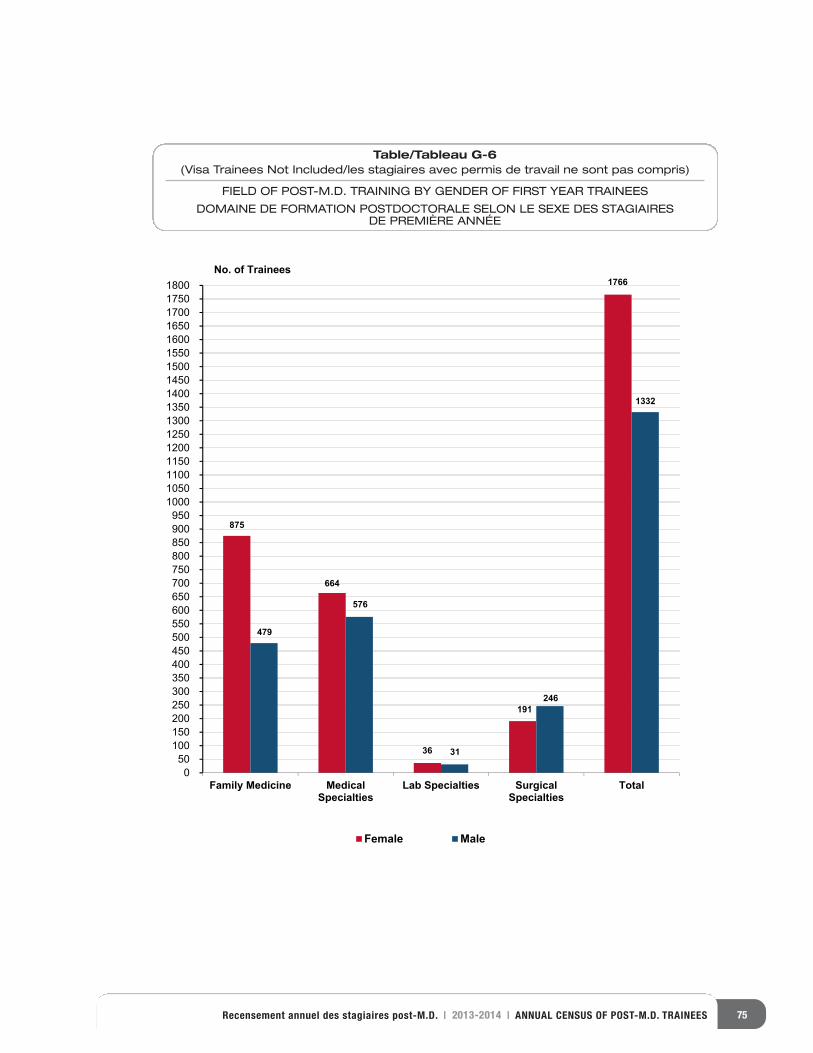
75Recensement annuel des stagiaires post-M.D. | 2013-2014 | ANNUAL CENSUS OF POST-M.D. TRAINEES
875
664
36
191
1766
479
576
31
246
1332
05010015020025030035040045050055060065070075080085090095010001050110011501200125013001350140014501500155016001650170017501800
Family Medicine MedicalSpecialties
Lab Specialties SurgicalSpecialties
Total
Female Male
No. of Trainees
Table/Tableau G-6(Visa Trainees Not Included/les stagiaires avec permis de travail ne sont pas compris)
FIELD OF POST-M.D. TRAINING BY GENDER OF FIRST YEAR TRAINEES
DOMAINE DE FORMATION POSTDOCTORALE SELON LE SEXE DES STAGIAIRES DE PREMIÈRE ANNÉE
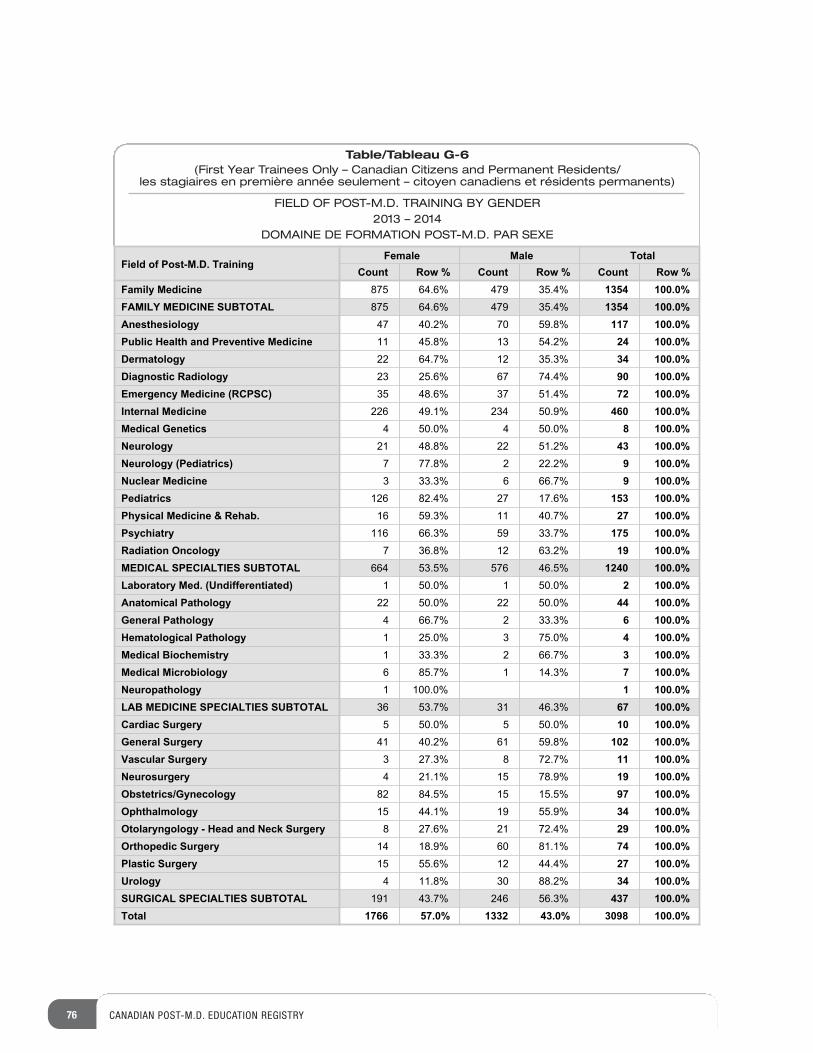
76 CANADIAN POST-M.D. EDUCATION REGISTRY
Table/Tableau G-6(First Year Trainees Only – Canadian Citizens and Permanent Residents/
les stagiaires en première année seulement – citoyen canadiens et résidents permanents)
FIELD OF POST-M.D. TRAINING BY GENDER2013 – 2014
DOMAINE DE FORMATION POST-M.D. PAR SEXE
Field of Post-M.D. TrainingFemale Male Total
Count Row % Count Row % Count Row %Family MedicineFAMILY MEDICINE SUBTOTALAnesthesiologyPublic Health and Preventive MedicineDermatologyDiagnostic RadiologyEmergency Medicine (RCPSC)Internal MedicineMedical GeneticsNeurologyNeurology (Pediatrics)Nuclear MedicinePediatricsPhysical Medicine & Rehab.PsychiatryRadiation OncologyMEDICAL SPECIALTIES SUBTOTALLaboratory Med. (Undifferentiated)Anatomical PathologyGeneral PathologyHematological PathologyMedical BiochemistryMedical MicrobiologyNeuropathologyLAB MEDICINE SPECIALTIES SUBTOTALCardiac SurgeryGeneral SurgeryVascular SurgeryNeurosurgeryObstetrics/GynecologyOphthalmologyOtolaryngology - Head and Neck SurgeryOrthopedic SurgeryPlastic SurgeryUrologySURGICAL SPECIALTIES SUBTOTALTotal
875 64.6% 479 35.4% 1354 100.0%875 64.6% 479 35.4% 1354 100.0%47 40.2% 70 59.8% 117 100.0%11 45.8% 13 54.2% 24 100.0%22 64.7% 12 35.3% 34 100.0%23 25.6% 67 74.4% 90 100.0%35 48.6% 37 51.4% 72 100.0%226 49.1% 234 50.9% 460 100.0%4 50.0% 4 50.0% 8 100.0%21 48.8% 22 51.2% 43 100.0%7 77.8% 2 22.2% 9 100.0%3 33.3% 6 66.7% 9 100.0%
126 82.4% 27 17.6% 153 100.0%16 59.3% 11 40.7% 27 100.0%116 66.3% 59 33.7% 175 100.0%7 36.8% 12 63.2% 19 100.0%
664 53.5% 576 46.5% 1240 100.0%1 50.0% 1 50.0% 2 100.0%22 50.0% 22 50.0% 44 100.0%4 66.7% 2 33.3% 6 100.0%1 25.0% 3 75.0% 4 100.0%1 33.3% 2 66.7% 3 100.0%6 85.7% 1 14.3% 7 100.0%1 100.0% 1 100.0%36 53.7% 31 46.3% 67 100.0%5 50.0% 5 50.0% 10 100.0%41 40.2% 61 59.8% 102 100.0%3 27.3% 8 72.7% 11 100.0%4 21.1% 15 78.9% 19 100.0%82 84.5% 15 15.5% 97 100.0%15 44.1% 19 55.9% 34 100.0%8 27.6% 21 72.4% 29 100.0%14 18.9% 60 81.1% 74 100.0%15 55.6% 12 44.4% 27 100.0%4 11.8% 30 88.2% 34 100.0%
191 43.7% 246 56.3% 437 100.0%1766 57.0% 1332 43.0% 3098 100.0%
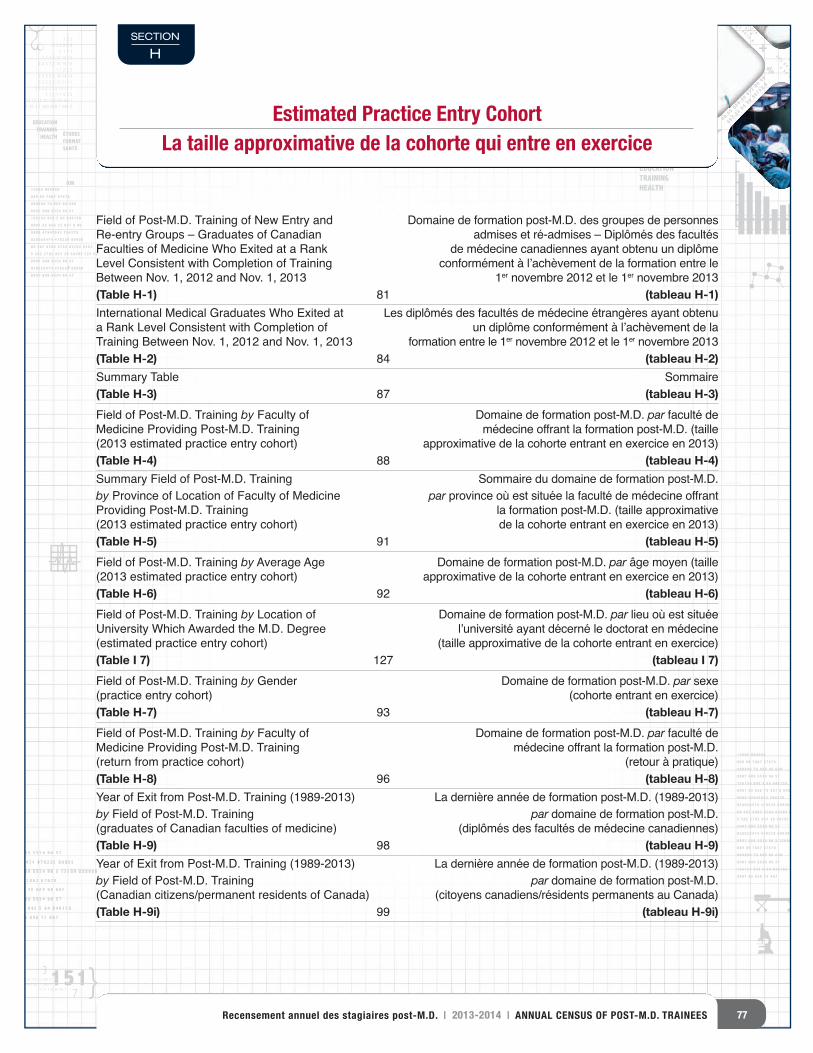
8989077 68686868689 9 5535535535534 969696 5 57
02028028402840284028474 4747479229229229 8090909009
89898989890007777 68686868689 9 9 9 5535535535534 4 4 96969696 5 5 5 12121266668989 U U U889888988898999
08089 8989 7 7 7 7867867 6 676776788
89890890890890 78 6666665 969696 680
89898989000777 68686868689 9 9 5535535535534 4 4 96969696 5 5 5777
15156154154154 845 55 64 88846156156158
898907 656565 656 7 75 8686867
45 50 261857 63 100
12689 U88989089 89 7867 67678
890890 78 665 96 6808907 689 5534 96 57
156154 845 5 64 8461588907 65 656 75 867 8 908
9809 4794Y943 Y943Y9028028474 479229 80909
89 367 9562 6782 83292 83625 382 2782 937 38 38792 723 02
4850 480 4980 890 904 60 540
3 3 32 3 3 8 8 81 1 1 13 3 3 3 12 12 124 4 3 3 2 16 16 161 1 2 2 23 3 3 3 2 14 14 142 2 2 2 3 11 11 113 3 3 2 2 13 13 12 11 1 1 1 1 5 5 513 13 12 11 11 1 61 61 60 1103 107 59 41 35 3 1 349 348 1 346 3
3 3 32 3 3 8 8 8
1 1 1 13 3 3 3 12 12 12
4 4 3 3 2 16 16 161 1 2 2 2
3 3 3 3 2 14 14 142 2 2 2 3 11 11 11
3 3 3 2 2 13 13 12 11 1 1 1 1 5 5 5
13 13 12 11 11 1 61 61 60 1103 107 59 41 35 3 1 349 348 1 346 3
2 2 13 13 12 11 1 1 1 1 5 5 5
13 13 12 11 11 1 61 61 60 1103 107 59 41 35 3 1 349 348 1 346 3
75 79 064 20 379 07 590 3 2 8
48 05 8
56 40 6
72 90 4
6
892 3
4 04 0
4 90792 6
4 8 5 8 5 8 5 4 9 3 7 0 1
4 5 0 4 5 0 1 9 7 3
EDUCATIONTRAINING
HEALTH ÉTUDESFORMAT
ION
SANTÉ
758 64 26 12
03 13 015 23
12689 U88989089 89 7867 67678
890890 78 665 96 6808907 689 5534 96 57
156154 845 5 64 8461588907 65 656 75 867 8 908
9809 4794Y943 Y943Y9028028474 479229 80909
89 367 9562 6782 83292 83625 382 2782 937 38 38792 723 02
1103 1078
%+
+ 781 5413 9
405540 466
0 1533 8
18 387
9 41 3
5 3 1
34
12689 U88989
089 89 7867 67678
890890 78 665 96 680
8907 689 5534 96 57
156154 845 5 64 846158
8907 65 656 75 867 8 90
8
9809 4794Y943 Y943Y9
028028474 479229 80909
89 367 9562 6782 83292 8362
5 382 2782 937 38 38792 723 02
8907 689 5534 96 57
028028474 479229 80909
8907 689 5534 96 57
4
{ {7
7
3
4 15103 107 59 41 35 3 1 349 303 107 59 41 35 3 1 349 3
11 11 1 61 61 60 1
1 5 2 1 5 2 1 6
4 4 5 1 5 2 8
6 4 8 2 4 6 1 2 6
12689 u88989089 89 7867 67678890890 78 665 96 6808907 689 5534 96 57156154 845 5 64 8461588907 65 656 75 867 8 9089809 4794y943 y943y9
T O
T A L
H E A L T H S A N T É
EDUCATIONÉTUDES
EDUCATIONTRAININGHEALTH
" " "" "
" "A
8
2 2 2 2 3 11 11 113 3 3 2 2 13 13 12 11 1 1 1 1 5 5 513 13 12 11 11 1 61 650 640 75 056 06 6890780 9029 068 0690667890 0 49 0463 0492
12689 U88989
089 89 7867 67678
890890 78 665 96 680
8907 689 5534 96 57
156154 845 5 64 846158
8907 65 656 75 867 8 908
9809 4794Y943 Y943Y9
028028474 479229 80909
89 367 9562 6782 83292 8362
5 382 2782 937 38 38792 723 02
8907 689 5534 96 57
028028474 479229 80909
8907 689 5534 96 5 12689 U88989
089 89 7867 67678
890890 78 665 96 680
8907 689 5534 96 57
156154 845 5 64 846158
8907 65 656 75 867
EDUCATION REGISTRY ENREGISTREMENT
D’ÉDUCATION
EDUCAT
ION REGISTRY
ENREGISTREMENT D’ÉDUCATION
Estimated Practice Entry CohortLa taille approximative de la cohorte qui entre en exercice
Field of Post-M.D. Training of New Entry and Re-entry Groups – Graduates of Canadian Faculties of Medicine Who Exited at a Rank Level Consistent with Completion of Training Between Nov. 1, 2012 and Nov. 1, 2013 (Table H-1) 81International Medical Graduates Who Exited at a Rank Level Consistent with Completion of Training Between Nov. 1, 2012 and Nov. 1, 2013 (Table H-2) 84Summary Table (Table H-3) 87Field of Post-M.D. Training by Faculty of Medicine Providing Post-M.D. Training (2013 estimated practice entry cohort) (Table H-4) 88Summary Field of Post-M.D. Training by Province of Location of Faculty of Medicine Providing Post-M.D. Training (2013 estimated practice entry cohort)(Table H-5) 91Field of Post-M.D. Training by Average Age (2013 estimated practice entry cohort) (Table H-6) 92Field of Post-M.D. Training by Location of University Which Awarded the M.D. Degree (estimated practice entry cohort) (Table I 7) 127Field of Post-M.D. Training by Gender (practice entry cohort)(Table H-7) 93Field of Post-M.D. Training by Faculty of Medicine Providing Post-M.D. Training (return from practice cohort) (Table H-8) 96Year of Exit from Post-M.D. Training (1989-2013)by Field of Post-M.D. Training(graduates of Canadian faculties of medicine) (Table H-9) 98Year of Exit from Post-M.D. Training (1989-2013)by Field of Post-M.D. Training (Canadian citizens/permanent residents of Canada) (Table H-9i) 99
Domaine de formation post-M.D. des groupes de personnes admises et ré-admises – Diplômés des facultés
de médecine canadiennes ayant obtenu un diplôme conformément à l’achèvement de la formation entre le
1er novembre 2012 et le 1er novembre 2013(tableau H-1)
Les diplômés des facultés de médecine étrangères ayant obtenuun diplôme conformément à l’achèvement de la
formation entre le 1er novembre 2012 et le 1er novembre 2013 (tableau H-2)
Sommaire (tableau H-3)
Domaine de formation post-M.D. par faculté de médecine offrant la formation post-M.D. (taille
approximative de la cohorte entrant en exercice en 2013) (tableau H-4)
Sommaire du domaine de formation post-M.D. par province où est située la faculté de médecine offrant
la formation post-M.D. (taille approximative de la cohorte entrant en exercice en 2013)
(tableau H-5)Domaine de formation post-M.D. par âge moyen (taille
approximative de la cohorte entrant en exercice en 2013)(tableau H-6)
Domaine de formation post-M.D. par lieu où est située l’université ayant décerné le doctorat en médecine
(taille approximative de la cohorte entrant en exercice) (tableau I 7)
Domaine de formation post-M.D. par sexe (cohorte entrant en exercice)
(tableau H-7)Domaine de formation post-M.D. par faculté de
médecine offrant la formation post-M.D. (retour à pratique)
(tableau H-8)La dernière année de formation post-M.D. (1989-2013)
par domaine de formation post-M.D. (diplômés des facultés de médecine canadiennes)
(tableau H-9)La dernière année de formation post-M.D. (1989-2013)
par domaine de formation post-M.D. (citoyens canadiens/résidents permanents au Canada)
(tableau H-9i)
SECTION
H
77Recensement annuel des stagiaires post-M.D. | 2013-2014 | ANNUAL CENSUS OF POST-M.D. TRAINEES
78 CANADIAN POST-M.D. EDUCATION REGISTRY
Trainees Who Exited Post-M.D.Training Between November 1,2012 AND November 1, 2013(at a rank level consistent with completion of training)
Beginning with the “2000” exit cohort, physicianswho left a training program prior to completing a sufficient number of years of training required forcertification from any of Canada’s three certification organizations (the College of Family Physicians ofCanada, le Collège des médecins du Québec andthe Royal College of Physicians and Surgeons ofCanada) were not included in the estimated prac-tice entry cohort. The CAPER Policy Committeeagreed to this change in the definition of the practice entry cohort because unrestricted licensurein each province and territory of Canada requires certification in either Family medicine or a specialty. Physicians who exit training prior to completion of their program would not have thequalifications for full licensure in Canada.
Other than this change in exit criteria, the exitgroups will be presented in the same four groups as in previous CAPER publications.
I. Graduates of Canadian Faculties of Medicine
a) Physicians who earned the M.D. degree inCanada who went directly through post-M.D.training and are entering practice for the firsttime (the new entry cohort).
b) Physicians who earned the M.D. degree inCanada who have re-entered training after having already had a period of practice inCanada (the re-entry cohort).
II. Graduates of International MedicalSchools
a) International medical graduates who wereCanadian citizens /permanent residents on July 1 of their last year of post-M.D. training (A small re-entry cohort has been isolated fromthis group). These physicians would have thelegal status necessary to work in Canada.
Stagiaires ayant obtenu undiplôme postdoctoral entre le 1er novembre 2012 ET le 1er novembre 2013
(conformément à l’achèvement de la formation)
Depuis 2000, l’estimation de la cohorte accédant à l’exercice ne tient pas compte des médecins ayant quittéun programme de formation avant d’avoir achevé lenombre d’années de formation requises pour obtenirune certification de la part d’un des trois organismes de certification (le Collège des médecins de famille duCanada, le Collège des médecins du Québec et leCollège royal des médecins et chirurgiens du Canada).Le Comité des politiques de CAPER a approuvé cechangement de définition de la cohorte accédant à l’exercice étant donné que l’accréditation incondition-nelle dans chaque province et territoire du Canadaexige une certification en médecine familiale ou dansune spécialité. Les médecins qui quittent la formationavant d’achever leur programme n’ont pas les compé-tences nécessaires à l’accréditation intégrale au Canada.
À part ce changement aux critères d’achèvement, lesgroupes de diplômés feront partie des mêmes quatregroupes que dans les publications antérieures deCAPER.
I. Diplômés des facultés de médecinecanadiennes
a) Médecins ayant obtenu leur diplôme en médecineau Canada, ayant entamé tout de suite une forma-tion postdoctorale et accédant à l’exercice pour lapremière fois (la cohorte de nouvel exercice).
b) Médecins ayant obtenu leur diplôme en médecineau Canada et ayant retourné aux études après une période d’exercice au Canada (la cohorte desecond exercice).
II. Diplômés d’écoles de médecine internationales
a) Diplômés internationaux en médecine étantcitoyens canadiens/résidents permanents le 1er juillet de leur dernière année de formationpostdoctorale (on a isolé une petite cohorte desecond exercice de ce groupe). Ces médecins sont légalement autorisés à travailler au Canada.
79Recensement annuel des stagiaires post-M.D. | 2013-2014 | ANNUAL CENSUS OF POST-M.D. TRAINEES
a) International medical graduates who held atemporary employment visa while in their lastyear of post-M.D. training. It is assumed thatthese physicians will not enter practice inCanada in view of their visa status and they are not included in the practice entry cohort.
I. Isolation of the New Entry and Re-Entry Groups of Graduates ofCanadian Faculties of Medicine
Table H-1 compares the proportion of trainees in each field of training for the new entry (2380trainees) and re-entry (86 trainees) group of graduates of Canadian faculties of medicine in the exit group.
In the new entry group, 988 (42%) of the cohortexited from family medicine programs, and 1392(58%) exited from medical, surgical and laboratoryprograms: 957 (40%) from medical programs, 42 (2%) from lab medicine programs and 385(16%) from surgical programs. (8 palliative medicine physicians are included in themedical/surgical/lab program total.)
Among the re-entry group (n = 86), 24 (28%)physicians were completing family medicine programs and most of them were in programs giving additional training beyond the 2-year familymedicine program. The majority of re-entry resi-dents (72%) were in medical, surgical or laboratorytraining programs.
II. Graduates of International MedicalSchools
Table H-2 compares two groups of internationalmedical school graduates – those exiting asCanadian citizens/permanent residents and thoseexiting as Visa trainees. Of the 605 Canadian citizens/permanent residents, 226 (37%) exitedfrom family medicine training programs and 379(63%) exited from medical/surgical/laboratory
a) Diplômés internationaux en médecine possédantun visa d’emploi temporaire pendant leur dernièreannée de formation postdoctorale. On prend pour acquis que ces médecins n’accéderont pas àl’exercice au Canada en raison de leur visa et nesont donc pas inclus dans la cohorte accédant àl’exercice.
I. Isolement des groupes de nouvel exercice et de second exercice parmi les diplômés des facultés demédecine canadiennes
Le tableau H-1 compare la proportion de stagiaires danschaque domaine de formation pour les groupes de nou-vel exercice (2 380 stagiaires) et de second exercice (86stagiaires) parmi les diplômés des facultés de médecinecanadiennes dans le groupe accédant à l’exercice.
Dans le groupe de nouvel exercice, 998 diplômés (42 %) de la cohorte ont quitté un programme demédecine familiale, et 1 392 diplômés (58 %) ont quitté un programme de médecine, de chirurgie et de laboratoire : 957 diplômés (40 %) ont quitté un programme en médecine, 42 diplômés (2 %) ont quitté un programme en médecine de laboratoire et 385 diplômés (16 %) ont quitté un programme enchirurgie. (Le total de médecins dans un programme de médecine/chirurgie/ laboratoire compte 8 partici-pants au programme de médecine palliative.)
Parmi le groupe de second exercice (n = 86), 24 médecins (28 %) achevaient un programme enmédecine familiale et la plupart d’entre eux partici-paient à un programme offrant une formationsupplémentaire au-delà du programme de deux ans en médecine familiale. La majorité des résidents de second exercice (72 %) étaient dans un programme de formation en médecine, chirurgie ou laboratoire.
II. Diplômés d’écoles de médecine internationales
Le tableau H-2 compare les deux groupes de diplômésd’écoles de médecine internationales – ceux achevanten tant que citoyens canadiens/résidents permanents etceux achevant en tant que stagiaires avec visa. Parmi les605 citoyens canadiens/résidents permanents, 226diplômés (37 %) ont quitté un programme de forma-tion en médecine familiale et 379 diplômés (63 %) ont
80 CANADIAN POST-M.D. EDUCATION REGISTRY
training programs. Physicians who exit postgradu-ate training as Canadian citizens/permanentresidents are considered to be eligible for practice in Canada.
Table H-3: Trainees Exiting Canadian TrainingPrograms Between November 1, 2012 andNovember 1, 2013 (at a rank level consistent with completion of training).
Four main exit groups have been isolated and asmall group of re-entry graduates of internationalmedical schools has also been noted.
Estimated Practice Entry Cohort (Table I–7)
Table I-7 reports the number of new physicians expected to enter medical practice in Canada viaCanadian post-M.D. training programs. These esti-mates include graduates of Canadian faculties ofmedicine as well as international medical graduateswho are Canadian citizens/permanent residents.Thus, groups 1A and 2Ai from Table H-3 are com-bined to form the estimated practice entry cohort.
In 2013, there were 2956 new physicians in the estimated practice entry cohort. This figure includes 2374 graduates of Canadian faculties of medicineand 582 graduates of international medical schools (the 23 re-entry international graduates are not included in the practice entry cohort). The follow-ing tables, H-4 and H-5, were prepared using theestimated practice entry cohort. Only physicians exiting at a rank level consistent with completion of training were included.
quitté un programme de formation en médecine/chirurgie/ laboratoire. On considère que les médecinsqui achèvent une formation postdoctorale en tant que citoyens canadiens/résidents permanents sont admissibles à l’exercice au Canada.
Tableau H-3 : Stagiaires achevant un programme deformation canadien entre le 1er novembre 2012 et le 1er novembre 2013 (conformément à l’achèvement de la formation).
On a isolé quatre principaux groupes accédant à l’exercice et un petit groupe de diplômés de second exercice parmi les diplômés d’écoles de médecine internationales.
Estimation de la cohorte accédant à l’exercice (tableau I–7)
Le tableau I-7 représente le nombre prévu de nouveauxmédecins qui accéderont à l’exercice de la médecine auCanada par un programme de formation postdoctoralecanadien. Ces estimations comprennent les diplômésdes facultés de médecine canadiennes ainsi que lesdiplômés internationaux en médecine qui sont citoyenscanadiens/résidents permanents. Par conséquent, lesgroupes 1A et 2Ai du tableau H-3 sont combinés pourformer la cohorte prévue accédant à l’exercice.
En 2013, la cohorte prévue accédant à l’exercice comp-tait 2 956 nouveaux médecins. Cette figure comprend 2 374 diplômés des facultés de médecine canadienneset 582 diplômés des écoles de médecine internationales(les 23 diplômés internationaux de second exercice nefont pas partie de la cohorte accédant à l’exercice). Lestableaux suivants, H-4 et H-5, ont été préparés à l’aidede la cohorte prévue accédant à l’exercice. Seuls lesmédecins obtenant un diplôme conformément àl’achèvement de la formation ont été inclus.

Table/Tableau H-1Graduates of Canadian Faculties of Medicine Who Exited at a Rank Level Consistent
with Completion of Training Between Nov 1, 2012 and Nov 1, 2013Diplômés des facultés de médecine canadiennes ayant obtenu un diplôme conformément
à l’ achèvement de la formation entre le 1 novembre 2012 et le 1 novembre 2013
FIELD OF POST-M.D. TRAINING OF NEW ENTRY AND RE-ENTRY GROUPS*DOMAINE DE FORMATION POST-M.D. DES GROUPES DE PERSONNES ADMISES ET RÉ-ADMISES
81Recensement annuel des stagiaires post-M.D. | 2013-2014 | ANNUAL CENSUS OF POST-M.D. TRAINEES
Field of Post-M.D. TrainingNew Entry Re-entry Total
Count Col % Count Col % Count Col %Family MedicineEmergency Medicine (CFPC)Care of the Elderly (CFPC)Enhanced Skills: Other Fam. Med. TrainingFAMILY MEDICINE SUBTOTALPalliative MedicineTRAINING FOLLOWING FAMILY MEDICINE OR SPECIALTY SUBTOTAL
AnesthesiologyCritical Care (Anes.)Pain Medicine (Anes.)Public Health and Preventive MedicineDermatologyDiagnostic RadiologyNeuroradiologyPediatric Diagnostic RadiologyEmergency Medicine (RCPSC)Critical Care (Emergency Med.)Pediatric Emergency MedicineInternal MedicineCardiology (Int.Med.)Clin. Imm./Allergy (Int.Med.)Clin. Pharmacology and Toxicology (Int.Med.)Critical Care (Int.Med)Endocrinology/Met. (Int.Med.)Gastroenterology (Int.Med.)General Internal MedicineGeriatric Medicine (Int.Med.)Hematology (Int.Med.)Infectious Diseases (Int.Med.)Medical Oncology (Int.Med.)Nephrology (Int.Med.)Occupational Medicine (Int. Med.)
781 32.8% 3 3.5% 784 31.8%120 5.0% 7 8.1% 127 5.2%13 0.5% 1 1.2% 14 0.6%74 3.1% 13 15.1% 87 3.5%988 41.5% 24 27.9% 1012 41.0%8 0.3% 4 4.7% 12 0.5%8 0.3% 4 4.7% 12 0.5%
104 4.4% 4 4.7% 108 4.4%9 0.4% 9 0.4%1 0.0% 1 0.0%9 0.4% 2 2.3% 11 0.4%21 0.9% 21 0.9%85 3.6% 6 7.0% 91 3.7%4 0.2% 4 0.2%2 0.1% 2 0.1%45 1.9% 45 1.8%5 0.2% 5 0.2%1 0.0% 1 0.0%30 1.3% 1 1.2% 31 1.3%38 1.6% 2 2.3% 40 1.6%5 0.2% 1 1.2% 6 0.2%3 0.1% 3 0.1%26 1.1% 1 1.2% 27 1.1%18 0.8% 18 0.7%34 1.4% 1 1.2% 35 1.4%43 1.8% 1 1.2% 44 1.8%8 0.3% 8 0.3%14 0.6% 3 3.5% 17 0.7%13 0.5% 13 0.5%26 1.1% 26 1.1%23 1.0% 23 0.9%1 0.0% 1 0.0%
(cont.)
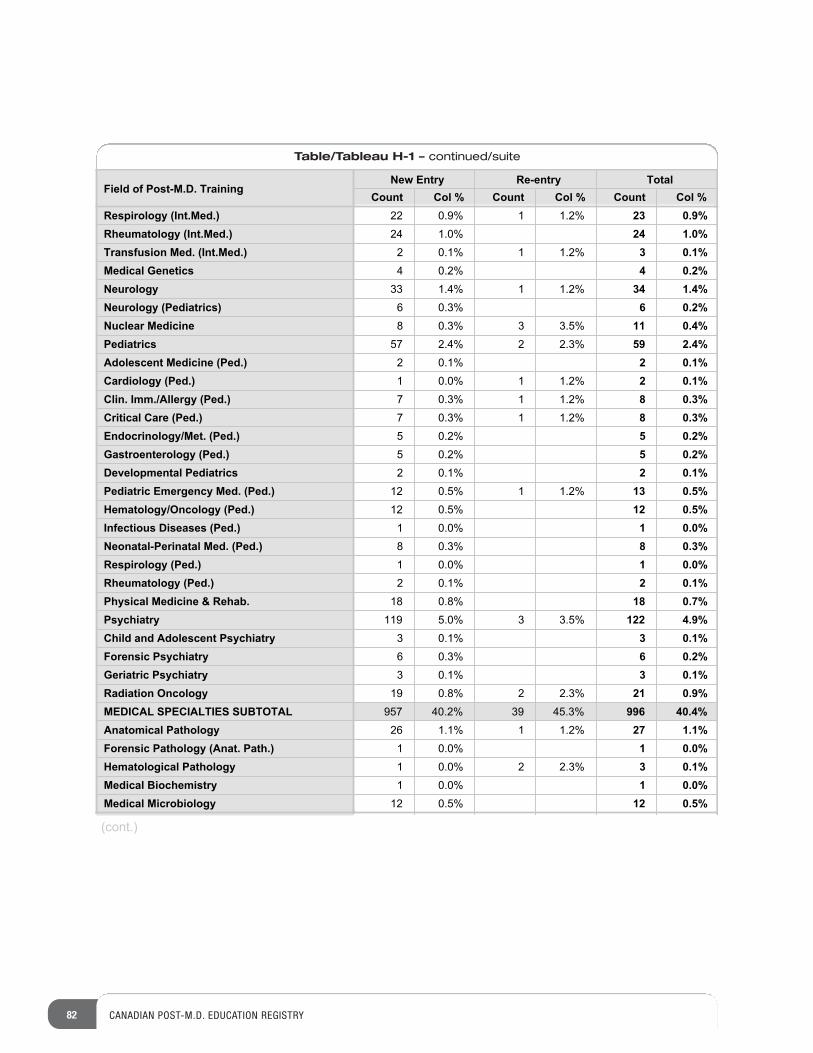
82 CANADIAN POST-M.D. EDUCATION REGISTRY
Table/Tableau H-1 – continued/suite
Field of Post-M.D. TrainingNew Entry Re-entry Total
Count Col % Count Col % Count Col %Respirology (Int.Med.)Rheumatology (Int.Med.)Transfusion Med. (Int.Med.)Medical GeneticsNeurologyNeurology (Pediatrics)Nuclear MedicinePediatricsAdolescent Medicine (Ped.)Cardiology (Ped.)Clin. Imm./Allergy (Ped.)Critical Care (Ped.)Endocrinology/Met. (Ped.)Gastroenterology (Ped.)Developmental PediatricsPediatric Emergency Med. (Ped.)Hematology/Oncology (Ped.)Infectious Diseases (Ped.)Neonatal-Perinatal Med. (Ped.)Respirology (Ped.)Rheumatology (Ped.)Physical Medicine & Rehab.PsychiatryChild and Adolescent PsychiatryForensic PsychiatryGeriatric PsychiatryRadiation OncologyMEDICAL SPECIALTIES SUBTOTALAnatomical PathologyForensic Pathology (Anat. Path.)Hematological PathologyMedical BiochemistryMedical Microbiology
22 0.9% 1 1.2% 23 0.9%24 1.0% 24 1.0%2 0.1% 1 1.2% 3 0.1%4 0.2% 4 0.2%33 1.4% 1 1.2% 34 1.4%6 0.3% 6 0.2%8 0.3% 3 3.5% 11 0.4%57 2.4% 2 2.3% 59 2.4%2 0.1% 2 0.1%1 0.0% 1 1.2% 2 0.1%7 0.3% 1 1.2% 8 0.3%7 0.3% 1 1.2% 8 0.3%5 0.2% 5 0.2%5 0.2% 5 0.2%2 0.1% 2 0.1%12 0.5% 1 1.2% 13 0.5%12 0.5% 12 0.5%1 0.0% 1 0.0%8 0.3% 8 0.3%1 0.0% 1 0.0%2 0.1% 2 0.1%18 0.8% 18 0.7%119 5.0% 3 3.5% 122 4.9%3 0.1% 3 0.1%6 0.3% 6 0.2%3 0.1% 3 0.1%19 0.8% 2 2.3% 21 0.9%957 40.2% 39 45.3% 996 40.4%26 1.1% 1 1.2% 27 1.1%1 0.0% 1 0.0%1 0.0% 2 2.3% 3 0.1%1 0.0% 1 0.0%12 0.5% 12 0.5%
(cont.)
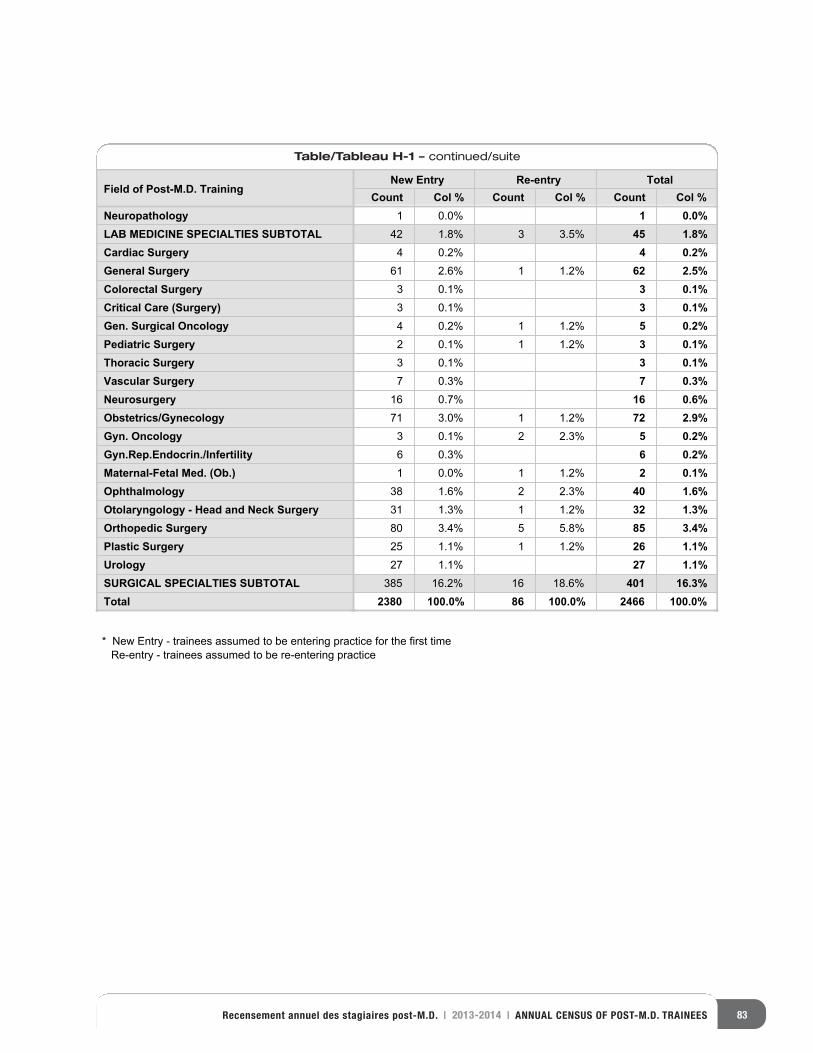
83Recensement annuel des stagiaires post-M.D. | 2013-2014 | ANNUAL CENSUS OF POST-M.D. TRAINEES
Table/Tableau H-1 – continued/suite
Field of Post-M.D. TrainingNew Entry Re-entry Total
Count Col % Count Col % Count Col %NeuropathologyLAB MEDICINE SPECIALTIES SUBTOTALCardiac SurgeryGeneral SurgeryColorectal SurgeryCritical Care (Surgery)Gen. Surgical OncologyPediatric SurgeryThoracic SurgeryVascular SurgeryNeurosurgeryObstetrics/GynecologyGyn. OncologyGyn.Rep.Endocrin./InfertilityMaternal-Fetal Med. (Ob.)OphthalmologyOtolaryngology - Head and Neck SurgeryOrthopedic SurgeryPlastic SurgeryUrologySURGICAL SPECIALTIES SUBTOTALTotal
1 0.0% 1 0.0%42 1.8% 3 3.5% 45 1.8%
4 0.2% 4 0.2%61 2.6% 1 1.2% 62 2.5%
3 0.1% 3 0.1%3 0.1% 3 0.1%4 0.2% 1 1.2% 5 0.2%2 0.1% 1 1.2% 3 0.1%3 0.1% 3 0.1%7 0.3% 7 0.3%
16 0.7% 16 0.6%71 3.0% 1 1.2% 72 2.9%
3 0.1% 2 2.3% 5 0.2%6 0.3% 6 0.2%1 0.0% 1 1.2% 2 0.1%
38 1.6% 2 2.3% 40 1.6%31 1.3% 1 1.2% 32 1.3%80 3.4% 5 5.8% 85 3.4%25 1.1% 1 1.2% 26 1.1%27 1.1% 27 1.1%
385 16.2% 16 18.6% 401 16.3%2380 100.0% 86 100.0% 2466 100.0%
* New Entry - trainees assumed to be entering practice for the first time Re-entry - trainees assumed to be re-entering practice
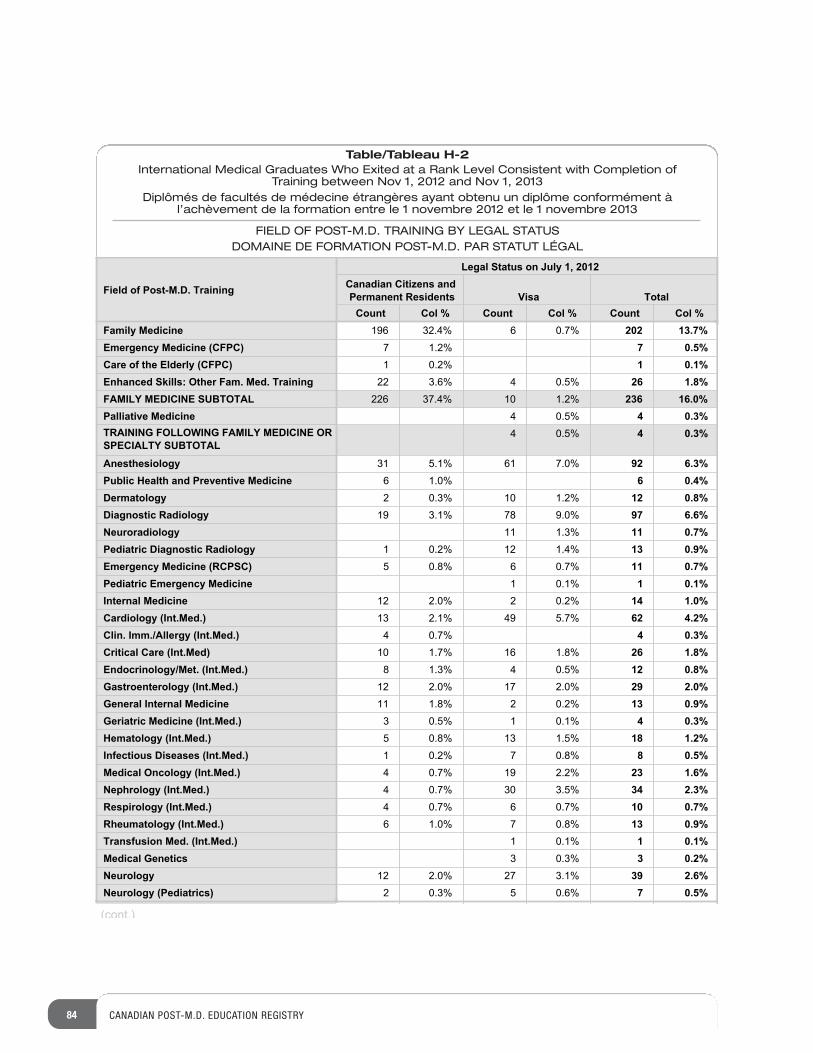
Table/Tableau H-2International Medical Graduates Who Exited at a Rank Level Consistent with Completion of
Training between Nov 1, 2012 and Nov 1, 2013Diplômés de facultés de médecine étrangères ayant obtenu un diplôme conformément à
l’achèvement de la formation entre le 1 novembre 2012 et le 1 novembre 2013
FIELD OF POST-M.D. TRAINING BY LEGAL STATUSDOMAINE DE FORMATION POST-M.D. PAR STATUT LÉGAL
84 CANADIAN POST-M.D. EDUCATION REGISTRY
Field of Post-M.D. Training
Legal Status on July 1, 2012Canadian Citizens and Permanent Residents Visa Total
Count Col % Count Col % Count Col %Family MedicineEmergency Medicine (CFPC)Care of the Elderly (CFPC)Enhanced Skills: Other Fam. Med. TrainingFAMILY MEDICINE SUBTOTALPalliative MedicineTRAINING FOLLOWING FAMILY MEDICINE OR SPECIALTY SUBTOTAL
AnesthesiologyPublic Health and Preventive MedicineDermatologyDiagnostic RadiologyNeuroradiologyPediatric Diagnostic RadiologyEmergency Medicine (RCPSC)Pediatric Emergency MedicineInternal MedicineCardiology (Int.Med.)Clin. Imm./Allergy (Int.Med.)Critical Care (Int.Med)Endocrinology/Met. (Int.Med.)Gastroenterology (Int.Med.)General Internal MedicineGeriatric Medicine (Int.Med.)Hematology (Int.Med.)Infectious Diseases (Int.Med.)Medical Oncology (Int.Med.)Nephrology (Int.Med.)Respirology (Int.Med.)Rheumatology (Int.Med.)Transfusion Med. (Int.Med.)Medical GeneticsNeurologyNeurology (Pediatrics)
196 32.4% 6 0.7% 202 13.7%7 1.2% 7 0.5%1 0.2% 1 0.1%22 3.6% 4 0.5% 26 1.8%226 37.4% 10 1.2% 236 16.0%
4 0.5% 4 0.3%4 0.5% 4 0.3%
31 5.1% 61 7.0% 92 6.3%6 1.0% 6 0.4%2 0.3% 10 1.2% 12 0.8%19 3.1% 78 9.0% 97 6.6%
11 1.3% 11 0.7%1 0.2% 12 1.4% 13 0.9%5 0.8% 6 0.7% 11 0.7%
1 0.1% 1 0.1%12 2.0% 2 0.2% 14 1.0%13 2.1% 49 5.7% 62 4.2%4 0.7% 4 0.3%10 1.7% 16 1.8% 26 1.8%8 1.3% 4 0.5% 12 0.8%12 2.0% 17 2.0% 29 2.0%11 1.8% 2 0.2% 13 0.9%3 0.5% 1 0.1% 4 0.3%5 0.8% 13 1.5% 18 1.2%1 0.2% 7 0.8% 8 0.5%4 0.7% 19 2.2% 23 1.6%4 0.7% 30 3.5% 34 2.3%4 0.7% 6 0.7% 10 0.7%6 1.0% 7 0.8% 13 0.9%
1 0.1% 1 0.1%3 0.3% 3 0.2%
12 2.0% 27 3.1% 39 2.6%2 0.3% 5 0.6% 7 0.5%
(cont.)
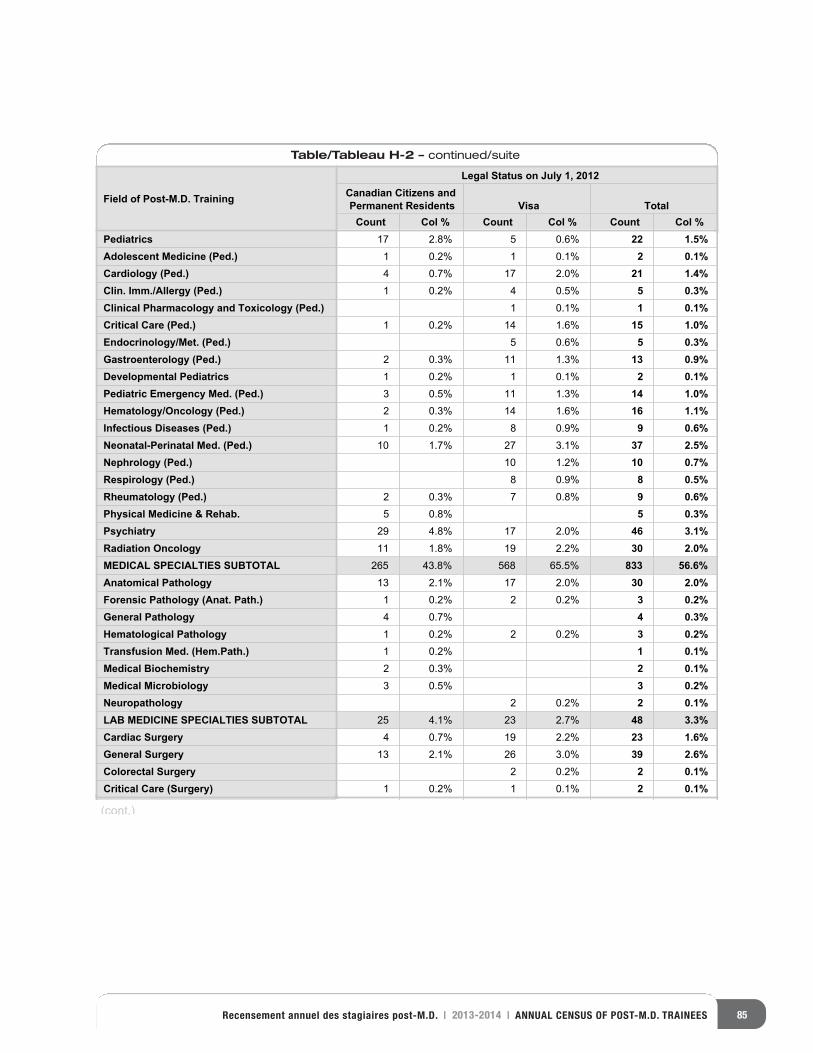
Table/Tableau H-2 – continued/suite
85Recensement annuel des stagiaires post-M.D. | 2013-2014 | ANNUAL CENSUS OF POST-M.D. TRAINEES
Field of Post-M.D. Training
Legal Status on July 1, 2012Canadian Citizens and Permanent Residents Visa Total
Count Col % Count Col % Count Col %PediatricsAdolescent Medicine (Ped.)Cardiology (Ped.)Clin. Imm./Allergy (Ped.)Clinical Pharmacology and Toxicology (Ped.)Critical Care (Ped.)Endocrinology/Met. (Ped.)Gastroenterology (Ped.)Developmental PediatricsPediatric Emergency Med. (Ped.)Hematology/Oncology (Ped.)Infectious Diseases (Ped.)Neonatal-Perinatal Med. (Ped.)Nephrology (Ped.)Respirology (Ped.)Rheumatology (Ped.)Physical Medicine & Rehab.PsychiatryRadiation OncologyMEDICAL SPECIALTIES SUBTOTALAnatomical PathologyForensic Pathology (Anat. Path.)General PathologyHematological PathologyTransfusion Med. (Hem.Path.)Medical BiochemistryMedical MicrobiologyNeuropathologyLAB MEDICINE SPECIALTIES SUBTOTALCardiac SurgeryGeneral SurgeryColorectal SurgeryCritical Care (Surgery)
17 2.8% 5 0.6% 22 1.5%1 0.2% 1 0.1% 2 0.1%4 0.7% 17 2.0% 21 1.4%1 0.2% 4 0.5% 5 0.3%
1 0.1% 1 0.1%1 0.2% 14 1.6% 15 1.0%
5 0.6% 5 0.3%2 0.3% 11 1.3% 13 0.9%1 0.2% 1 0.1% 2 0.1%3 0.5% 11 1.3% 14 1.0%2 0.3% 14 1.6% 16 1.1%1 0.2% 8 0.9% 9 0.6%10 1.7% 27 3.1% 37 2.5%
10 1.2% 10 0.7%8 0.9% 8 0.5%
2 0.3% 7 0.8% 9 0.6%5 0.8% 5 0.3%29 4.8% 17 2.0% 46 3.1%11 1.8% 19 2.2% 30 2.0%265 43.8% 568 65.5% 833 56.6%13 2.1% 17 2.0% 30 2.0%1 0.2% 2 0.2% 3 0.2%4 0.7% 4 0.3%1 0.2% 2 0.2% 3 0.2%1 0.2% 1 0.1%2 0.3% 2 0.1%3 0.5% 3 0.2%
2 0.2% 2 0.1%25 4.1% 23 2.7% 48 3.3%4 0.7% 19 2.2% 23 1.6%13 2.1% 26 3.0% 39 2.6%
2 0.2% 2 0.1%1 0.2% 1 0.1% 2 0.1%
(cont.)
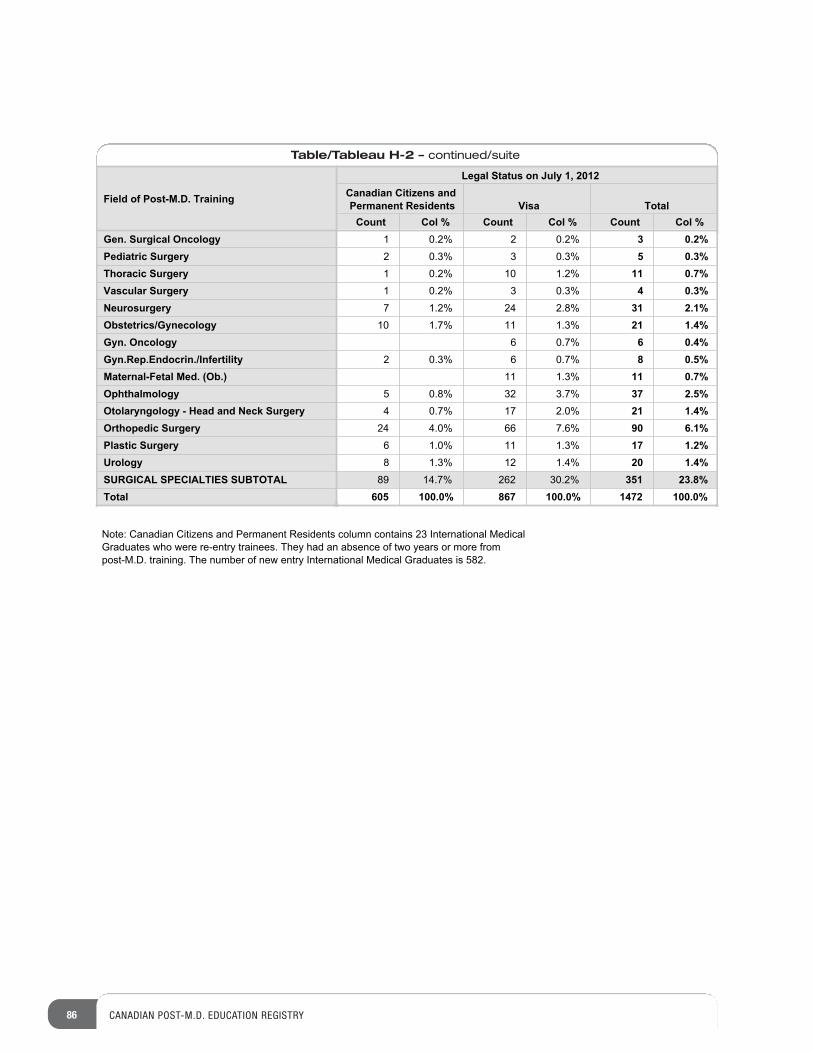
86 CANADIAN POST-M.D. EDUCATION REGISTRY
Table/Tableau H-2 – continued/suite
Field of Post-M.D. Training
Legal Status on July 1, 2012Canadian Citizens and Permanent Residents Visa Total
Count Col % Count Col % Count Col %Gen. Surgical OncologyPediatric SurgeryThoracic SurgeryVascular SurgeryNeurosurgeryObstetrics/GynecologyGyn. OncologyGyn.Rep.Endocrin./InfertilityMaternal-Fetal Med. (Ob.)OphthalmologyOtolaryngology - Head and Neck SurgeryOrthopedic SurgeryPlastic SurgeryUrologySURGICAL SPECIALTIES SUBTOTALTotal
1 0.2% 2 0.2% 3 0.2%2 0.3% 3 0.3% 5 0.3%1 0.2% 10 1.2% 11 0.7%1 0.2% 3 0.3% 4 0.3%7 1.2% 24 2.8% 31 2.1%
10 1.7% 11 1.3% 21 1.4%6 0.7% 6 0.4%
2 0.3% 6 0.7% 8 0.5%11 1.3% 11 0.7%
5 0.8% 32 3.7% 37 2.5%4 0.7% 17 2.0% 21 1.4%
24 4.0% 66 7.6% 90 6.1%6 1.0% 11 1.3% 17 1.2%8 1.3% 12 1.4% 20 1.4%
89 14.7% 262 30.2% 351 23.8%605 100.0% 867 100.0% 1472 100.0%
Note: Canadian Citizens and Permanent Residents column contains 23 International MedicalGraduates who were re-entry trainees. They had an absence of two years or more frompost-M.D. training. The number of new entry International Medical Graduates is 582.
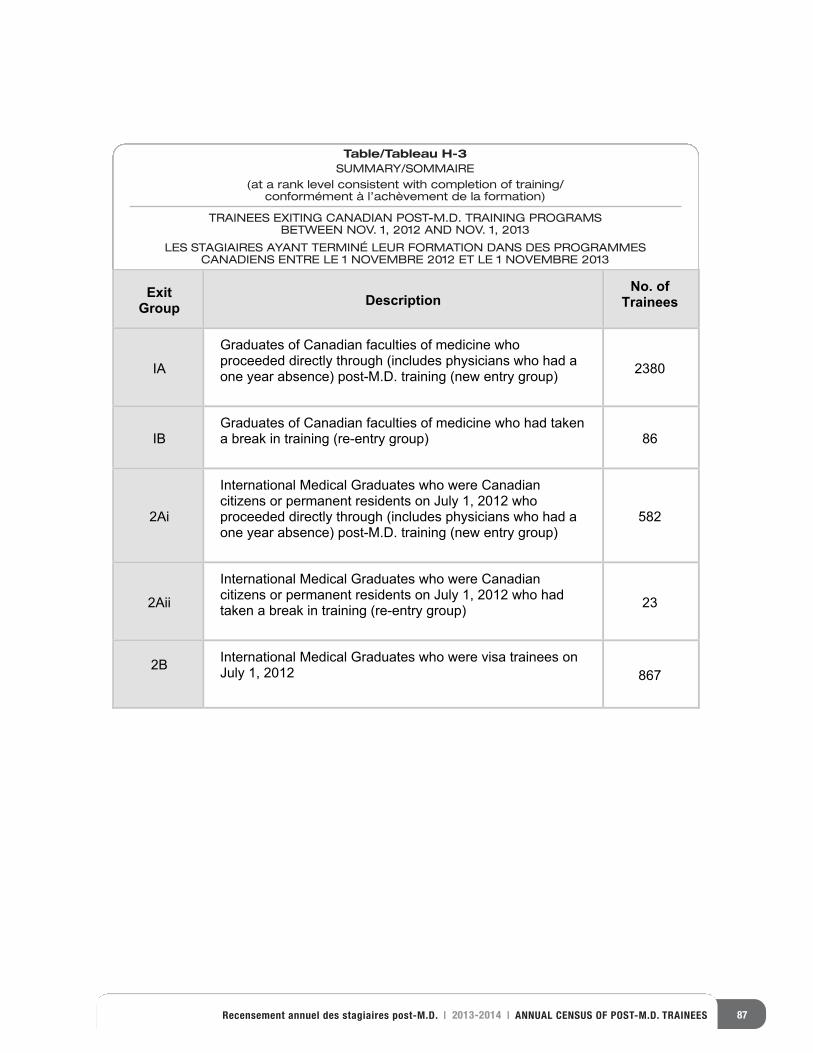
87Recensement annuel des stagiaires post-M.D. | 2013-2014 | ANNUAL CENSUS OF POST-M.D. TRAINEES
Table/Tableau H-3SUMMARY/SOMMAIRE
(at a rank level consistent with completion of training/conformément à l’achèvement de la formation)
TRAINEES EXITING CANADIAN POST-M.D. TRAINING PROGRAMSBETWEEN NOV. 1, 2012 AND NOV. 1, 2013
LES STAGIAIRES AYANT TERMINÉ LEUR FORMATION DANS DES PROGRAMMESCANADIENS ENTRE LE 1 NOVEMBRE 2012 ET LE 1 NOVEMBRE 2013
ExitGroup Description
No. of Trainees
IA
Graduates of Canadian faculties of medicine who proceeded directly through (includes physicians who had a one year absence) post-M.D. training (new entry group) 2380
IBGraduates of Canadian faculties of medicine who had taken a break in training (re-entry group) 86
2Ai
International Medical Graduates who were Canadian citizens or permanent residents on July 1, 2012 who proceeded directly through (includes physicians who had a one year absence) post-M.D. training (new entry group)
582
2Aii
International Medical Graduates who were Canadian citizens or permanent residents on July 1, 2012 who had taken a break in training (re-entry group) 23
2B International Medical Graduates who were visa trainees on July 1, 2012 867
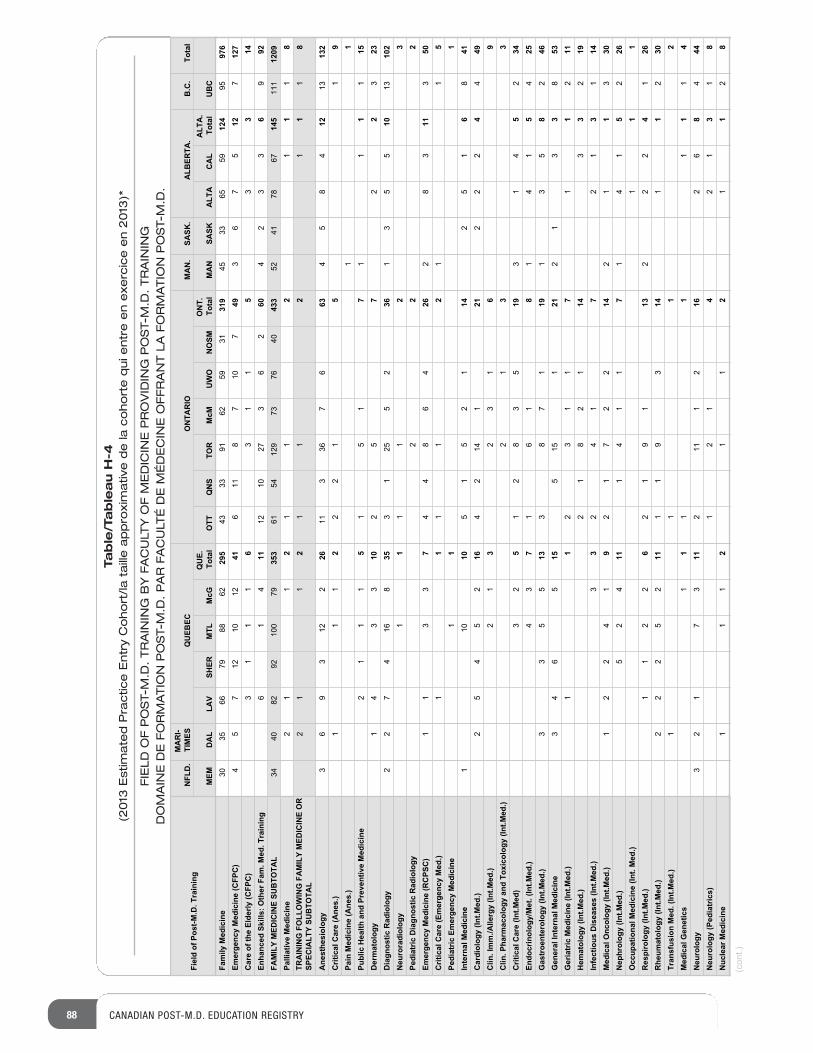
88 CANADIAN POST-M.D. EDUCATION REGISTRY
Table/Tableau H-4
(2013 Estimated Practice Entry Cohort/la taille approximative de la cohorte qui entre en exercice en 2013)*
FIELD OF POST-M.D. TRAINING BY FACULTY OF MEDICINE PROVIDING POST-M.D. TRAINING
DOMAINE DE FORMATION POST-M.D. PAR FACULTÉ DE MÉDECINE OFFRANT LA FORMATION POST-M.D.
Fiel
d of
Pos
t-M.D
. Tra
inin
gN
FLD
.M
AR
I-TI
MES
QU
EBEC
ON
TAR
IOM
AN
.SA
SK.
ALB
ERTA
.B
.C.
Tota
l
MEM
DA
LLA
VSH
ERM
TLM
cGQ
UE.
To
tal
OTT
QN
STO
RM
cMU
WO
NO
SMO
NT.
To
tal
MA
NSA
SKA
LTA
CA
LA
LTA
.To
tal
UB
CFa
mily
Med
icin
eEm
erge
ncy
Med
icin
e (C
FPC
)C
are
of th
e El
derly
(CFP
C)
Enha
nced
Ski
lls: O
ther
Fam
. Med
. Tra
inin
gFA
MIL
Y M
EDIC
INE
SUB
TOTA
LPa
lliat
ive
Med
icin
eTR
AIN
ING
FO
LLO
WIN
G F
AM
ILY
MED
ICIN
E O
R
SPEC
IALT
Y SU
BTO
TAL
Ane
sthe
siol
ogy
Crit
ical
Car
e (A
nes.
)Pa
in M
edic
ine
(Ane
s.)
Publ
ic H
ealth
and
Pre
vent
ive
Med
icin
eD
erm
atol
ogy
Dia
gnos
tic R
adio
logy
Neu
rora
diol
ogy
Pedi
atric
Dia
gnos
tic R
adio
logy
Emer
genc
y M
edic
ine
(RC
PSC
)C
ritic
al C
are
(Em
erge
ncy
Med
.)Pe
diat
ric E
mer
genc
y M
edic
ine
Inte
rnal
Med
icin
eC
ardi
olog
y (In
t.Med
.)C
lin. I
mm
./Alle
rgy
(Int.M
ed.)
Clin
. Pha
rmac
olog
y an
d To
xico
logy
(Int
.Med
.)C
ritic
al C
are
(Int.M
ed)
Endo
crin
olog
y/M
et. (
Int.M
ed.)
Gas
troe
nter
olog
y (In
t.Med
.)G
ener
al In
tern
al M
edic
ine
Ger
iatr
ic M
edic
ine
(Int.M
ed.)
Hem
atol
ogy
(Int.M
ed.)
Infe
ctio
us D
isea
ses
(Int.M
ed.)
Med
ical
Onc
olog
y (In
t.Med
.)N
ephr
olog
y (In
t.Med
.)O
ccup
atio
nal M
edic
ine
(Int.
Med
.)R
espi
rolo
gy (I
nt.M
ed.)
Rhe
umat
olog
y (In
t.Med
.)Tr
ansf
usio
n M
ed. (
Int.M
ed.)
Med
ical
Gen
etic
sN
euro
logy
Neu
rolo
gy (P
edia
tric
s)N
ucle
ar M
edic
ine
3035
6679
8862
295
4333
9162
5931
319
4533
6559
124
9597
64
57
1210
1241
611
87
107
493
67
512
712
73
11
16
31
15
33
146
14
1112
1027
36
260
42
33
69
9234
4082
92100
7935
361
54129
7376
4043
352
4178
6714
5111
1209
11
22
11
21
11
82
11
21
12
11
18
36
93
122
2611
336
76
634
58
412
1313
21
11
22
21
51
91
12
11
15
15
17
11
11
151
43
310
25
72
23
232
27
416
835
31
255
236
13
55
1013
102
11
11
23
22
21
13
37
44
86
426
28
311
350
11
11
21
15
11
101
110
51
52
114
25
16
841
25
45
216
42
141
212
22
44
492
13
23
16
92
13
33
25
12
83
519
31
45
234
43
71
61
81
41
54
253
35
513
38
71
191
35
82
463
46
515
515
121
21
33
853
11
23
11
71
12
112
18
21
143
32
193
32
41
72
13
114
12
24
19
21
72
214
21
13
305
24
111
41
17
14
15
226
11
11
12
26
21
91
132
22
41
262
22
52
111
19
314
11
230
11
12
11
11
11
14
32
17
311
211
12
162
68
444
12
14
21
31
81
11
21
12
11
28
(cont.)
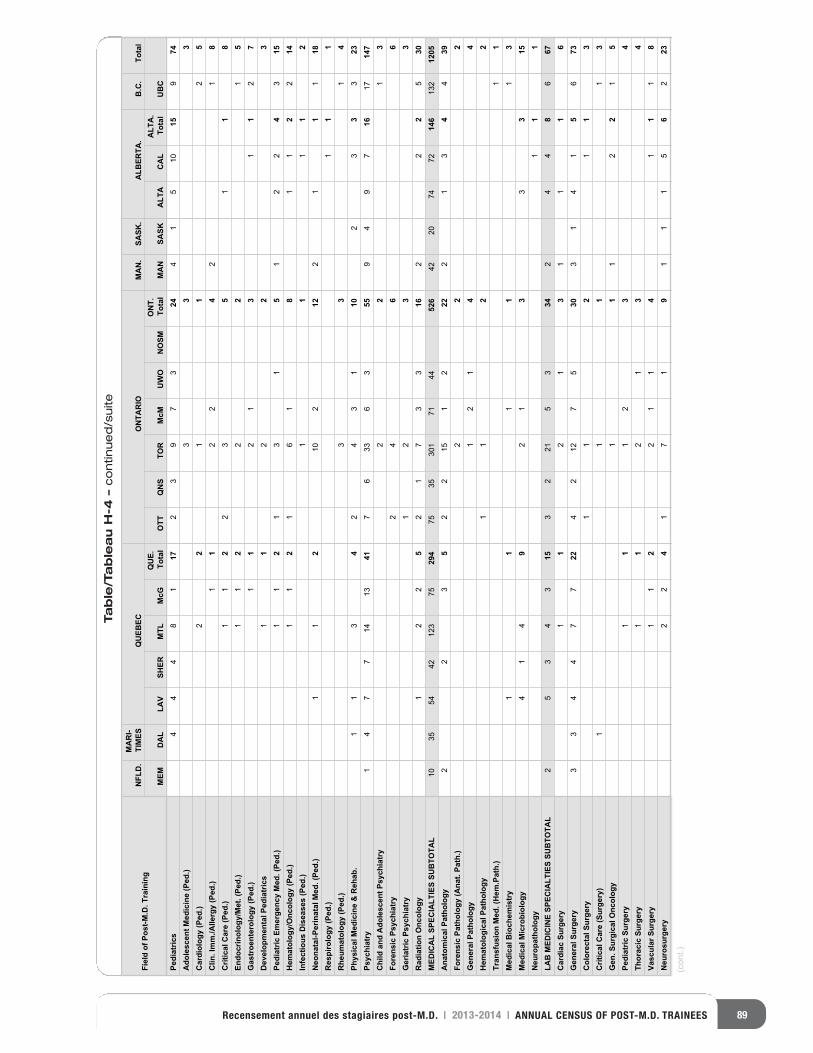
89Recensement annuel des stagiaires post-M.D. | 2013-2014 | ANNUAL CENSUS OF POST-M.D. TRAINEES
Table/Tableau H-4 –continued/suite
Fiel
d of
Pos
t-M.D
. Tra
inin
gN
FLD
.M
AR
I-TI
MES
QU
EBEC
ON
TAR
IOM
AN
.SA
SK.
ALB
ERTA
.B
.C.
Tota
l
MEM
DA
LLA
VSH
ERM
TLM
cGQ
UE.
To
tal
OTT
QN
STO
RM
cMU
WO
NO
SMO
NT.
To
tal
MA
NSA
SKA
LTA
CA
LA
LTA
.To
tal
UB
CPe
diat
rics
Ado
lesc
ent M
edic
ine
(Ped
.)C
ardi
olog
y (P
ed.)
Clin
. Im
m./A
llerg
y (P
ed.)
Crit
ical
Car
e (P
ed.)
Endo
crin
olog
y/M
et. (
Ped.
)G
astr
oent
erol
ogy
(Ped
.)D
evel
opm
enta
l Ped
iatr
ics
Pedi
atric
Em
erge
ncy
Med
. (Pe
d.)
Hem
atol
ogy/
Onc
olog
y (P
ed.)
Infe
ctio
us D
isea
ses
(Ped
.)N
eona
tal-P
erin
atal
Med
. (Pe
d.)
Res
piro
logy
(Ped
.)R
heum
atol
ogy
(Ped
.)Ph
ysic
al M
edic
ine
& R
ehab
.Ps
ychi
atry
Chi
ld a
nd A
dole
scen
t Psy
chia
try
Fore
nsic
Psy
chia
try
Ger
iatr
ic P
sych
iatr
yR
adia
tion
Onc
olog
yM
EDIC
AL
SPEC
IALT
IES
SUB
TOTA
LA
nato
mic
al P
atho
logy
Fore
nsic
Pat
holo
gy (A
nat.
Path
.)G
ener
al P
atho
logy
Hem
atol
ogic
al P
atho
logy
Tran
sfus
ion
Med
. (H
em.P
ath.
)M
edic
al B
ioch
emis
try
Med
ical
Mic
robi
olog
yN
euro
path
olog
yLA
B M
EDIC
INE
SPEC
IALT
IES
SUB
TOTA
LC
ardi
ac S
urge
ryG
ener
al S
urge
ryC
olor
ecta
l Sur
gery
Crit
ical
Car
e (S
urge
ry)
Gen
. Sur
gica
l Onc
olog
yPe
diat
ric S
urge
ryTh
orac
ic S
urge
ryVa
scul
ar S
urge
ryN
euro
surg
ery
44
48
117
23
97
324
41
510
159
743
33
22
11
25
11
22
42
18
11
22
35
11
81
12
22
15
11
21
31
12
71
12
23
11
21
31
51
22
43
151
12
16
18
11
22
141
11
12
11
210
212
21
11
181
11
33
14
11
34
24
31
102
33
323
14
77
1413
417
633
63
559
49
716
1714
72
21
32
46
61
23
31
22
52
17
33
162
22
530
1035
5442
123
7529
475
35301
7144
526
4220
7472
146
132
1205
32
25
22
151
222
21
34
439
22
21
21
44
11
22
11
11
11
13
41
49
21
33
315
11
12
53
43
153
221
53
342
44
86
671
12
13
11
16
33
44
77
224
212
75
303
14
15
673
11
21
13
11
11
31
12
12
15
11
12
34
11
21
34
11
22
11
41
11
82
24
17
19
11
15
62
23
(cont.)
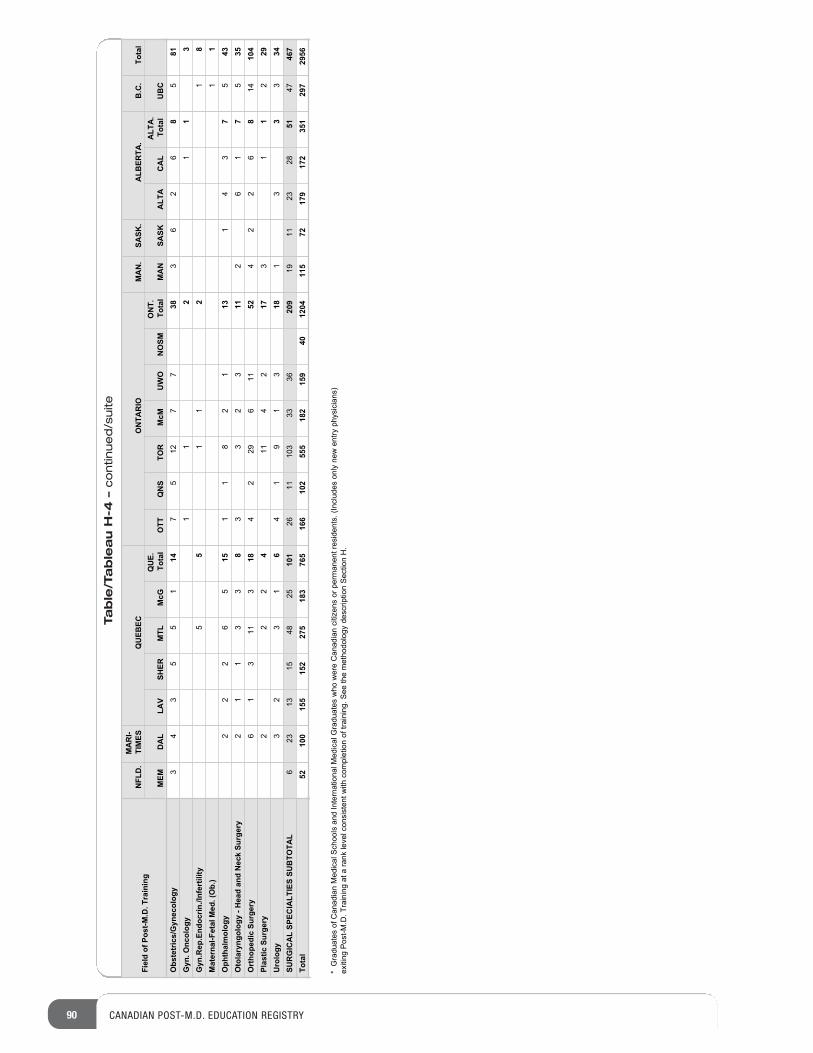
90 CANADIAN POST-M.D. EDUCATION REGISTRY
Table/Tableau H-4 –continued/suite
Fiel
d of
Pos
t-M.D
. Tra
inin
gN
FLD
.M
AR
I-TI
MES
QU
EBEC
ON
TAR
IOM
AN
.SA
SK.
ALB
ERTA
.B
.C.
Tota
l
MEM
DA
LLA
VSH
ERM
TLM
cGQ
UE.
To
tal
OTT
QN
STO
RM
cMU
WO
NO
SMO
NT.
To
tal
MA
NSA
SKA
LTA
CA
LA
LTA
.To
tal
UB
CO
bste
tric
s/G
ynec
olog
yG
yn. O
ncol
ogy
Gyn
.Rep
.End
ocrin
./Inf
ertil
ityM
ater
nal-F
etal
Med
. (O
b.)
Oph
thal
mol
ogy
Oto
lary
ngol
ogy
- Hea
d an
d N
eck
Surg
ery
Ort
hope
dic
Surg
ery
Plas
tic S
urge
ryU
rolo
gySU
RG
ICA
L SP
ECIA
LTIE
S SU
BTO
TAL
Tota
l
34
35
51
147
512
77
383
62
68
581
11
21
13
55
11
21
81
12
22
65
151
18
21
131
43
75
432
11
33
83
32
311
26
17
535
61
311
318
42
296
1152
42
26
814
104
22
24
114
217
13
12
293
23
16
41
91
318
13
33
346
2313
1548
2510
126
1110
333
3620
919
1123
2851
4746
752
100
155
152
275
183
765
166
102
555
182
159
4012
0411
572
179
172
351
297
2956
* G
radu
ates
of C
anad
ian
Med
ical
Sch
ools
and
Inte
rnat
iona
l Med
ical
Gra
duat
es w
ho w
ere
Can
adia
n ci
tizen
s or
per
man
ent r
esid
ents
. (In
clud
es o
nly
new
ent
ry p
hysi
cian
s)ex
iting
Pos
t-M.D
. Tra
inin
g at
a ra
nk le
vel c
onsi
sten
t with
com
plet
ion
of tr
aini
ng. S
ee th
e m
etho
dolo
gy d
escr
iptio
n S
ectio
n H
.
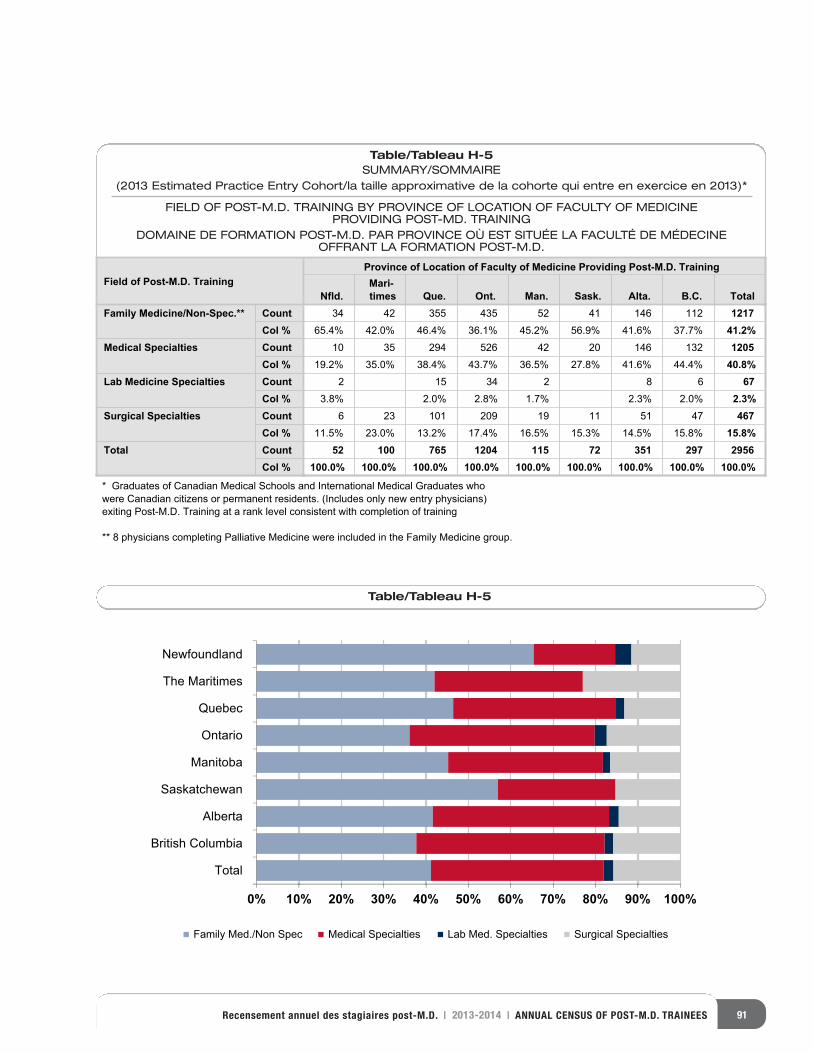
91Recensement annuel des stagiaires post-M.D. | 2013-2014 | ANNUAL CENSUS OF POST-M.D. TRAINEES
Table/Tableau H-5SUMMARY/SOMMAIRE
(2013 Estimated Practice Entry Cohort/la taille approximative de la cohorte qui entre en exercice en 2013)*
FIELD OF POST-M.D. TRAINING BY PROVINCE OF LOCATION OF FACULTY OF MEDICINE PROVIDING POST-MD. TRAINING
DOMAINE DE FORMATION POST-M.D. PAR PROVINCE OÙ EST SITUÉE LA FACULTÉ DE MÉDECINE OFFRANT LA FORMATION POST-M.D.
Field of Post-M.D. TrainingProvince of Location of Faculty of Medicine Providing Post-M.D. Training
Nfld.Mari-times Que. Ont. Man. Sask. Alta. B.C. Total
Family Medicine/Non-Spec.** CountCol %
Medical Specialties CountCol %
Lab Medicine Specialties CountCol %
Surgical Specialties CountCol %
Total CountCol %
34 42 355 435 52 41 146 112 121765.4% 42.0% 46.4% 36.1% 45.2% 56.9% 41.6% 37.7% 41.2%
10 35 294 526 42 20 146 132 120519.2% 35.0% 38.4% 43.7% 36.5% 27.8% 41.6% 44.4% 40.8%
2 15 34 2 8 6 673.8% 2.0% 2.8% 1.7% 2.3% 2.0% 2.3%
6 23 101 209 19 11 51 47 46711.5% 23.0% 13.2% 17.4% 16.5% 15.3% 14.5% 15.8% 15.8%
52 100 765 1204 115 72 351 297 2956100.0% 100.0% 100.0% 100.0% 100.0% 100.0% 100.0% 100.0% 100.0%
* Graduates of Canadian Medical Schools and International Medical Graduates whowere Canadian citizens or permanent residents. (Includes only new entry physicians)exiting Post-M.D. Training at a rank level consistent with completion of training
** 8 physicians completing Palliative Medicine were included in the Family Medicine group.
Table/Tableau H-5
Table/Tableau H-5
0% 10% 20% 30% 40% 50% 60% 70% 80% 90% 100%
Total
British Columbia
Alberta
Saskatchewan
Manitoba
Ontario
Quebec
The Maritimes
Newfoundland
Family Med./Non Spec Medical Specialties Lab Med. Specialties Surgical Specialties
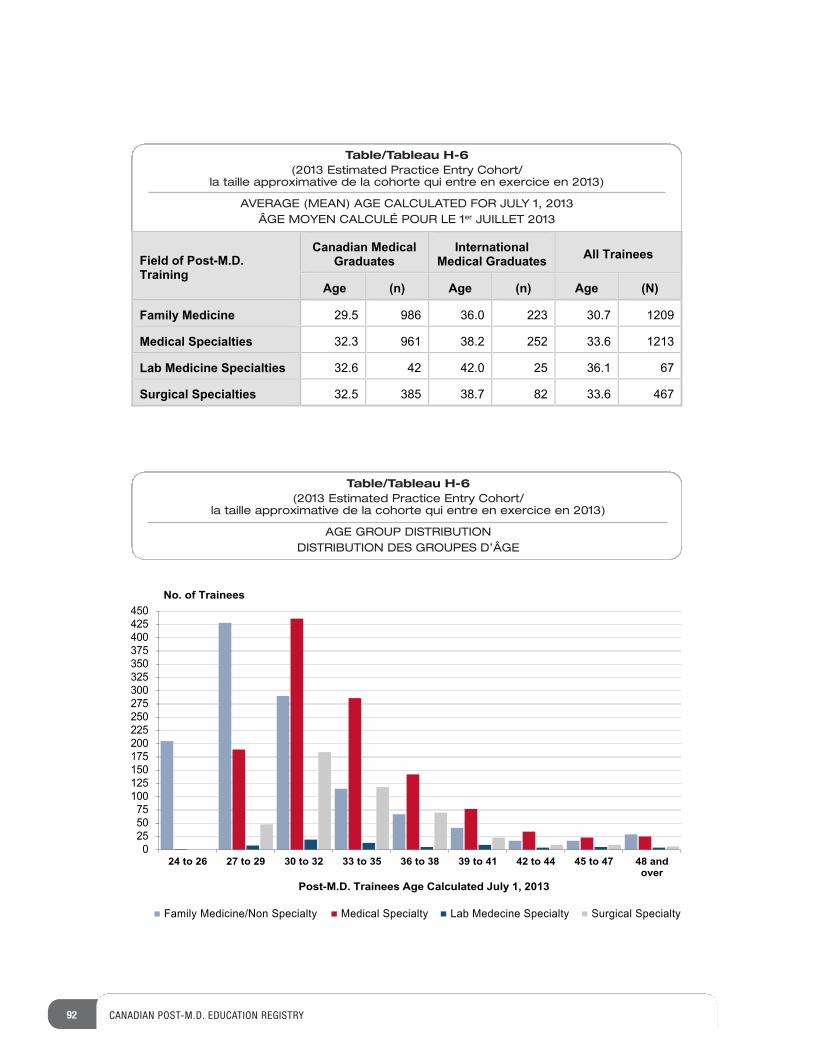
92 CANADIAN POST-M.D. EDUCATION REGISTRY
Table/Tableau H-6(2013 Estimated Practice Entry Cohort/
la taille approximative de la cohorte qui entre en exercice en 2013)
AVERAGE (MEAN) AGE CALCULATED FOR JULY 1, 2013ÂGE MOYEN CALCULÉ POUR LE 1er JUILLET 2013
Field of Post-M.D. Training
Canadian Medical Graduates
International Medical Graduates All Trainees
Age (n) Age (n) Age (N)
Family Medicine 29.5 986 36.0 223 30.7 1209
Medical Specialties 32.3 961 38.2 252 33.6 1213
Lab Medicine Specialties 32.6 42 42.0 25 36.1 67
Surgical Specialties 32.5 385 38.7 82 33.6 467
0255075
100125150175200225250275300325350375400425450
24 to 26 27 to 29 30 to 32 33 to 35 36 to 38 39 to 41 42 to 44 45 to 47 48 andover
Family Medicine/Non Specialty Medical Specialty Lab Medecine Specialty Surgical Specialty
No. of Trainees
Post-M.D. Trainees Age Calculated July 1, 2013
Table/Tableau H-6(2013 Estimated Practice Entry Cohort/
la taille approximative de la cohorte qui entre en exercice en 2013)
AGE GROUP DISTRIBUTIONDISTRIBUTION DES GROUPES D’ÂGE
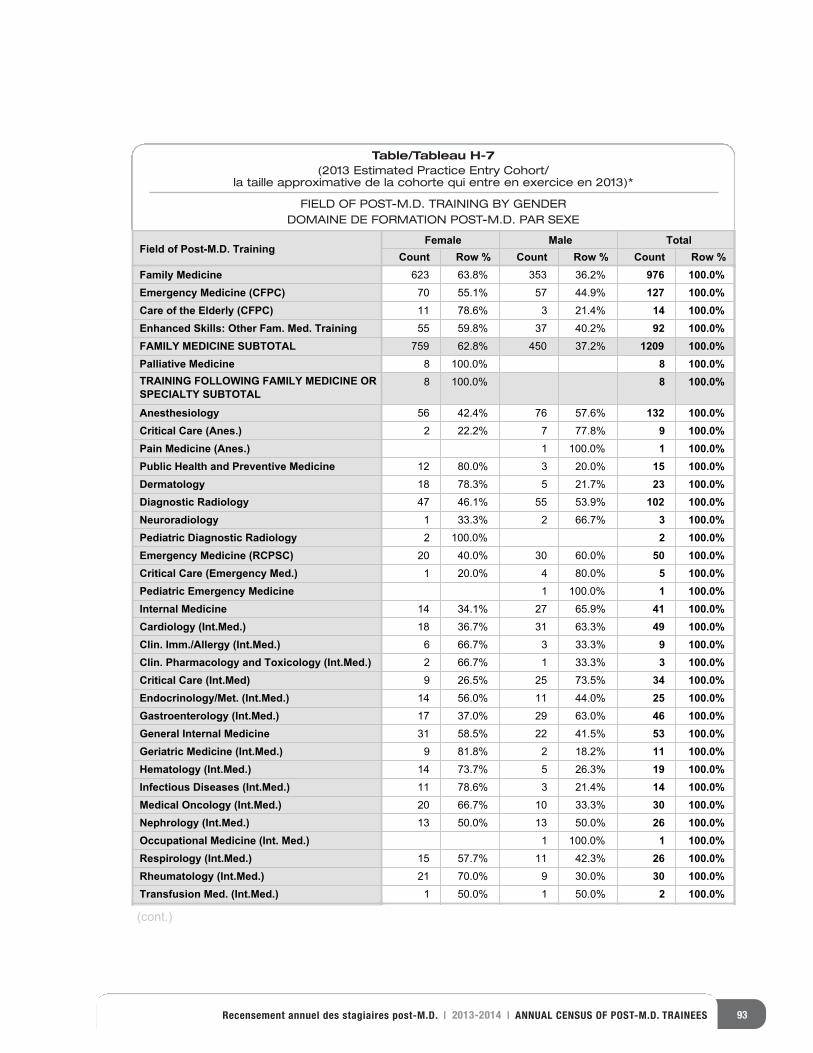
93Recensement annuel des stagiaires post-M.D. | 2013-2014 | ANNUAL CENSUS OF POST-M.D. TRAINEES
Field of Post-M.D. TrainingFemale Male Total
Count Row % Count Row % Count Row %Family MedicineEmergency Medicine (CFPC)Care of the Elderly (CFPC)Enhanced Skills: Other Fam. Med. TrainingFAMILY MEDICINE SUBTOTALPalliative MedicineTRAINING FOLLOWING FAMILY MEDICINE OR SPECIALTY SUBTOTAL
AnesthesiologyCritical Care (Anes.)Pain Medicine (Anes.)Public Health and Preventive MedicineDermatologyDiagnostic RadiologyNeuroradiologyPediatric Diagnostic RadiologyEmergency Medicine (RCPSC)Critical Care (Emergency Med.)Pediatric Emergency MedicineInternal MedicineCardiology (Int.Med.)Clin. Imm./Allergy (Int.Med.)Clin. Pharmacology and Toxicology (Int.Med.)Critical Care (Int.Med)Endocrinology/Met. (Int.Med.)Gastroenterology (Int.Med.)General Internal MedicineGeriatric Medicine (Int.Med.)Hematology (Int.Med.)Infectious Diseases (Int.Med.)Medical Oncology (Int.Med.)Nephrology (Int.Med.)Occupational Medicine (Int. Med.)Respirology (Int.Med.)Rheumatology (Int.Med.)Transfusion Med. (Int.Med.)
623 63.8% 353 36.2% 976 100.0%70 55.1% 57 44.9% 127 100.0%11 78.6% 3 21.4% 14 100.0%55 59.8% 37 40.2% 92 100.0%759 62.8% 450 37.2% 1209 100.0%8 100.0% 8 100.0%8 100.0% 8 100.0%
56 42.4% 76 57.6% 132 100.0%2 22.2% 7 77.8% 9 100.0%
1 100.0% 1 100.0%12 80.0% 3 20.0% 15 100.0%18 78.3% 5 21.7% 23 100.0%47 46.1% 55 53.9% 102 100.0%1 33.3% 2 66.7% 3 100.0%2 100.0% 2 100.0%20 40.0% 30 60.0% 50 100.0%1 20.0% 4 80.0% 5 100.0%
1 100.0% 1 100.0%14 34.1% 27 65.9% 41 100.0%18 36.7% 31 63.3% 49 100.0%6 66.7% 3 33.3% 9 100.0%2 66.7% 1 33.3% 3 100.0%9 26.5% 25 73.5% 34 100.0%14 56.0% 11 44.0% 25 100.0%17 37.0% 29 63.0% 46 100.0%31 58.5% 22 41.5% 53 100.0%9 81.8% 2 18.2% 11 100.0%14 73.7% 5 26.3% 19 100.0%11 78.6% 3 21.4% 14 100.0%20 66.7% 10 33.3% 30 100.0%13 50.0% 13 50.0% 26 100.0%
1 100.0% 1 100.0%15 57.7% 11 42.3% 26 100.0%21 70.0% 9 30.0% 30 100.0%1 50.0% 1 50.0% 2 100.0%
(cont.)
Table/Tableau H-7(2013 Estimated Practice Entry Cohort/
la taille approximative de la cohorte qui entre en exercice en 2013)*
FIELD OF POST-M.D. TRAINING BY GENDERDOMAINE DE FORMATION POST-M.D. PAR SEXE
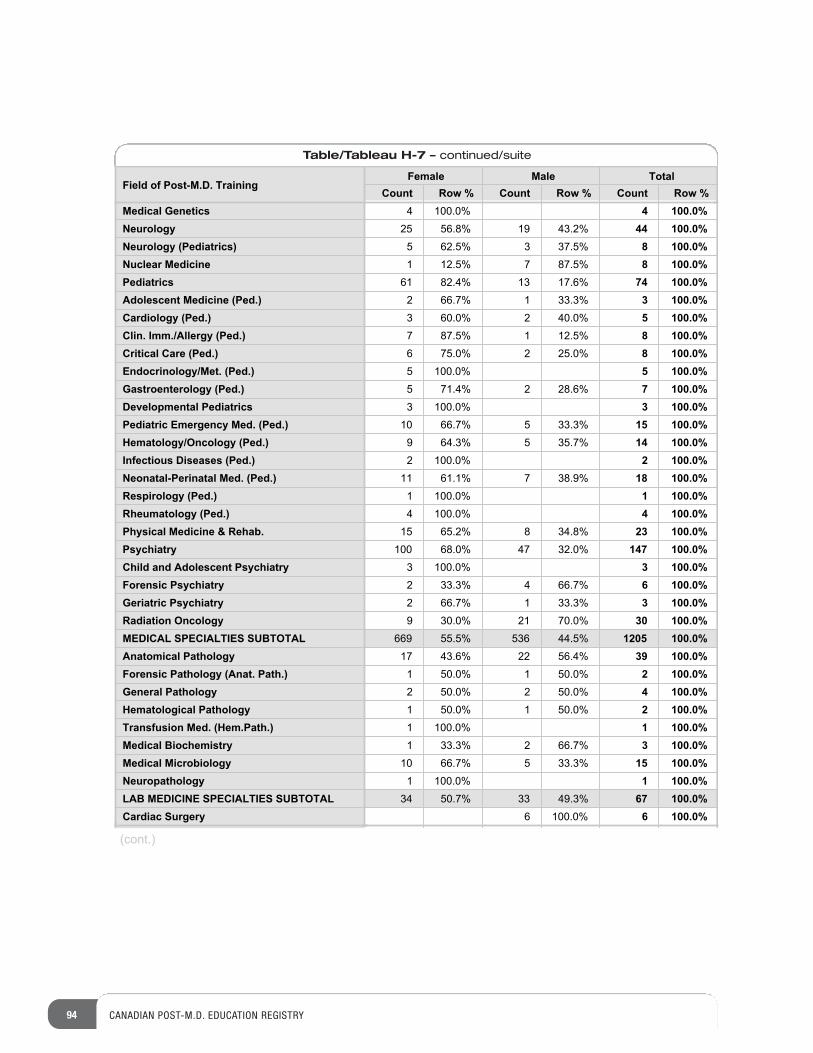
94 CANADIAN POST-M.D. EDUCATION REGISTRY
Table/Tableau H-7 – continued/suite
Field of Post-M.D. TrainingFemale Male Total
Count Row % Count Row % Count Row %Medical GeneticsNeurologyNeurology (Pediatrics)Nuclear MedicinePediatricsAdolescent Medicine (Ped.)Cardiology (Ped.)Clin. Imm./Allergy (Ped.)Critical Care (Ped.)Endocrinology/Met. (Ped.)Gastroenterology (Ped.)Developmental PediatricsPediatric Emergency Med. (Ped.)Hematology/Oncology (Ped.)Infectious Diseases (Ped.)Neonatal-Perinatal Med. (Ped.)Respirology (Ped.)Rheumatology (Ped.)Physical Medicine & Rehab.PsychiatryChild and Adolescent PsychiatryForensic PsychiatryGeriatric PsychiatryRadiation OncologyMEDICAL SPECIALTIES SUBTOTALAnatomical PathologyForensic Pathology (Anat. Path.)General PathologyHematological PathologyTransfusion Med. (Hem.Path.)Medical BiochemistryMedical MicrobiologyNeuropathologyLAB MEDICINE SPECIALTIES SUBTOTALCardiac Surgery
4 100.0% 4 100.0%25 56.8% 19 43.2% 44 100.0%5 62.5% 3 37.5% 8 100.0%1 12.5% 7 87.5% 8 100.0%61 82.4% 13 17.6% 74 100.0%2 66.7% 1 33.3% 3 100.0%3 60.0% 2 40.0% 5 100.0%7 87.5% 1 12.5% 8 100.0%6 75.0% 2 25.0% 8 100.0%5 100.0% 5 100.0%5 71.4% 2 28.6% 7 100.0%3 100.0% 3 100.0%10 66.7% 5 33.3% 15 100.0%9 64.3% 5 35.7% 14 100.0%2 100.0% 2 100.0%11 61.1% 7 38.9% 18 100.0%1 100.0% 1 100.0%4 100.0% 4 100.0%15 65.2% 8 34.8% 23 100.0%100 68.0% 47 32.0% 147 100.0%3 100.0% 3 100.0%2 33.3% 4 66.7% 6 100.0%2 66.7% 1 33.3% 3 100.0%9 30.0% 21 70.0% 30 100.0%
669 55.5% 536 44.5% 1205 100.0%17 43.6% 22 56.4% 39 100.0%1 50.0% 1 50.0% 2 100.0%2 50.0% 2 50.0% 4 100.0%1 50.0% 1 50.0% 2 100.0%1 100.0% 1 100.0%1 33.3% 2 66.7% 3 100.0%10 66.7% 5 33.3% 15 100.0%1 100.0% 1 100.0%34 50.7% 33 49.3% 67 100.0%
6 100.0% 6 100.0%
(cont.)
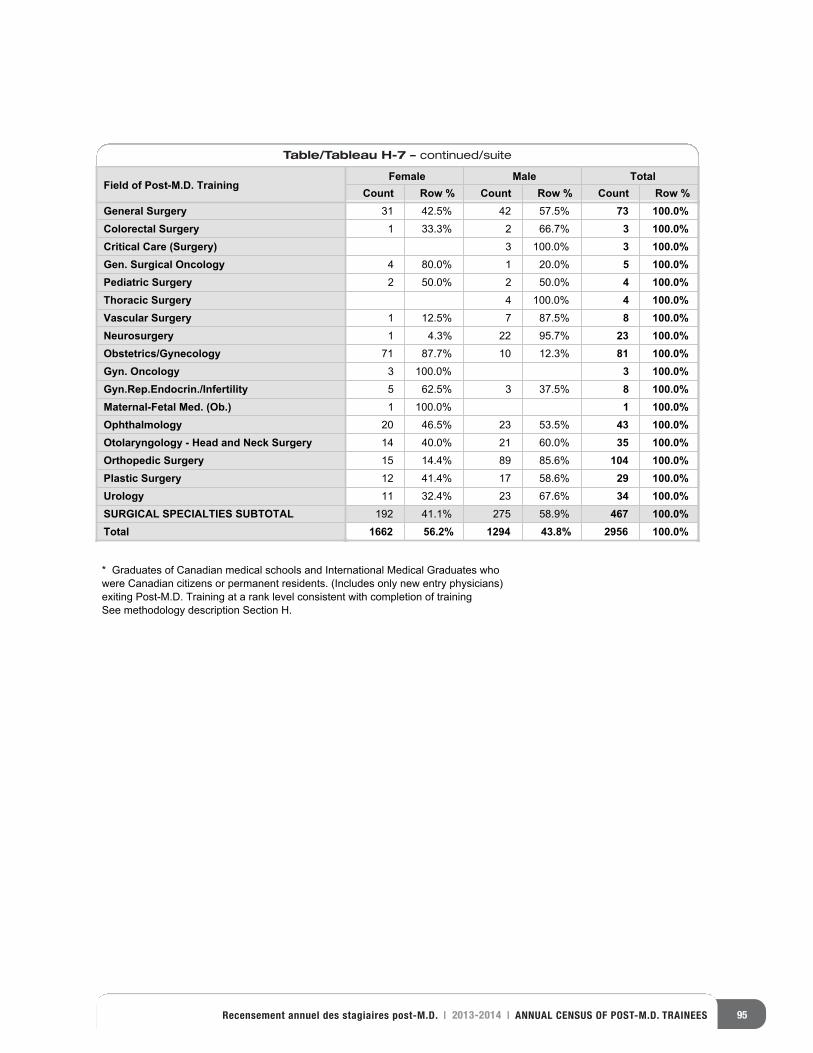
95Recensement annuel des stagiaires post-M.D. | 2013-2014 | ANNUAL CENSUS OF POST-M.D. TRAINEES
Table/Tableau H-7 – continued/suite
Field of Post-M.D. TrainingFemale Male Total
Count Row % Count Row % Count Row %General SurgeryColorectal SurgeryCritical Care (Surgery)Gen. Surgical OncologyPediatric SurgeryThoracic SurgeryVascular SurgeryNeurosurgeryObstetrics/GynecologyGyn. OncologyGyn.Rep.Endocrin./InfertilityMaternal-Fetal Med. (Ob.)OphthalmologyOtolaryngology - Head and Neck SurgeryOrthopedic SurgeryPlastic SurgeryUrologySURGICAL SPECIALTIES SUBTOTALTotal
31 42.5% 42 57.5% 73 100.0%1 33.3% 2 66.7% 3 100.0%
3 100.0% 3 100.0%4 80.0% 1 20.0% 5 100.0%2 50.0% 2 50.0% 4 100.0%
4 100.0% 4 100.0%1 12.5% 7 87.5% 8 100.0%1 4.3% 22 95.7% 23 100.0%
71 87.7% 10 12.3% 81 100.0%3 100.0% 3 100.0%5 62.5% 3 37.5% 8 100.0%1 100.0% 1 100.0%
20 46.5% 23 53.5% 43 100.0%14 40.0% 21 60.0% 35 100.0%15 14.4% 89 85.6% 104 100.0%12 41.4% 17 58.6% 29 100.0%11 32.4% 23 67.6% 34 100.0%
192 41.1% 275 58.9% 467 100.0%1662 56.2% 1294 43.8% 2956 100.0%
* Graduates of Canadian medical schools and International Medical Graduates whowere Canadian citizens or permanent residents. (Includes only new entry physicians)exiting Post-M.D. Training at a rank level consistent with completion of trainingSee methodology description Section H.
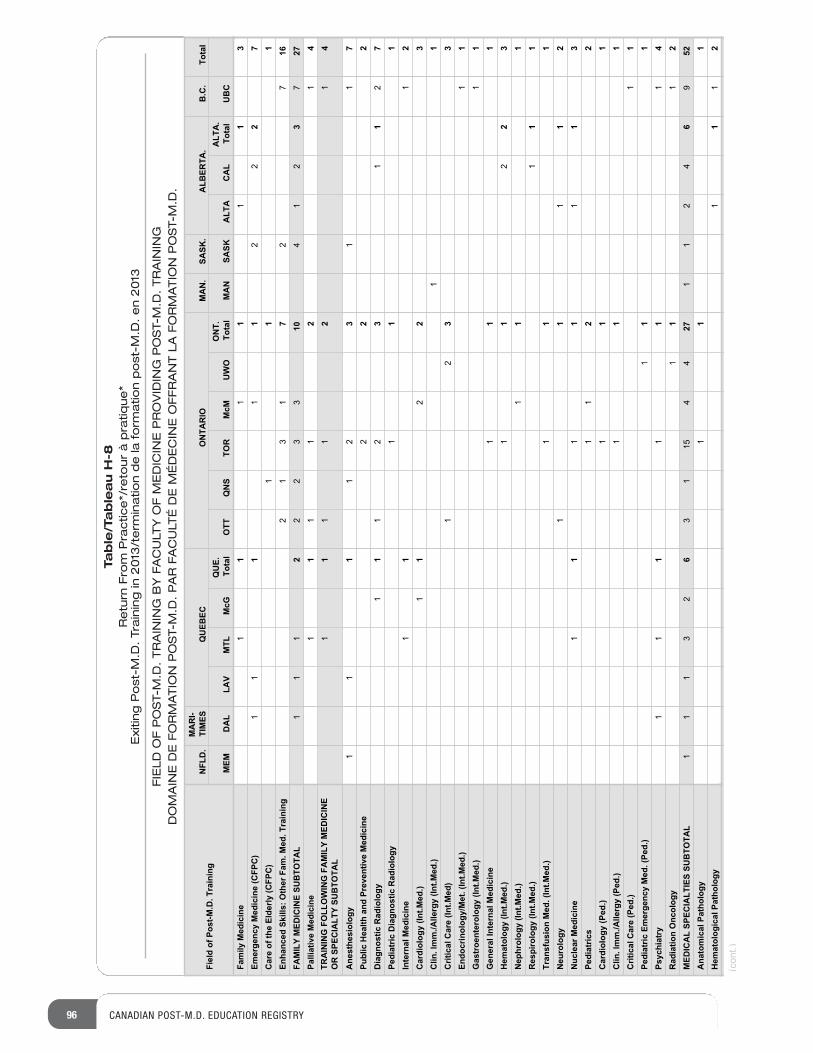
96 CANADIAN POST-M.D. EDUCATION REGISTRY
Table/Tableau H-8
Return From Practice*/retour à pratique*
Exiting Post-M.D. Training in 2013/termination de la formation post-M.D. en 2013
FIELD OF POST-M.D. TRAINING BY FACULTY OF MEDICINE PROVIDING POST-M.D. TRAINING
DOMAINE DE FORMATION POST-M.D. PAR FACULTÉ DE MÉDECINE OFFRANT LA FORMATION POST-M.D.
Fiel
d of
Pos
t-M.D
. Tra
inin
gN
FLD
.M
AR
I- TI
MES
QU
EBEC
ON
TAR
IOM
AN
.SA
SK.
ALB
ERTA
.B
.C.
Tota
l
MEM
DA
LLA
VM
TLM
cGQ
UE.
Tota
lO
TTQ
NS
TOR
McM
UW
OO
NT.
Tota
lM
AN
SASK
ALT
AC
AL
ALT
A.
Tota
lU
BC
Fam
ily M
edic
ine
Emer
genc
y M
edic
ine
(CFP
C)
Car
e of
the
Elde
rly (C
FPC
)En
hanc
ed S
kills
: Oth
er F
am. M
ed. T
rain
ing
FAM
ILY
MED
ICIN
E SU
BTO
TAL
Palli
ativ
e M
edic
ine
TRA
ININ
G F
OLL
OW
ING
FA
MIL
Y M
EDIC
INE
OR
SPE
CIA
LTY
SUB
TOTA
L
Ane
sthe
siol
ogy
Publ
ic H
ealth
and
Pre
vent
ive
Med
icin
eD
iagn
ostic
Rad
iolo
gyPe
diat
ric D
iagn
ostic
Rad
iolo
gyIn
tern
al M
edic
ine
Car
diol
ogy
(Int.M
ed.)
Clin
. Im
m./A
llerg
y (In
t.Med
.)C
ritic
al C
are
(Int.M
ed)
Endo
crin
olog
y/M
et. (
Int.M
ed.)
Gas
troe
nter
olog
y (In
t.Med
.)G
ener
al In
tern
al M
edic
ine
Hem
atol
ogy
(Int.M
ed.)
Nep
hrol
ogy
(Int.M
ed.)
Res
piro
logy
(Int
.Med
.)Tr
ansf
usio
n M
ed. (
Int.M
ed.)
Neu
rolo
gyN
ucle
ar M
edic
ine
Pedi
atric
sC
ardi
olog
y (P
ed.)
Clin
. Im
m./A
llerg
y (P
ed.)
Crit
ical
Car
e (P
ed.)
Pedi
atric
Em
erge
ncy
Med
. (Pe
d.)
Psyc
hiat
ryR
adia
tion
Onc
olog
yM
EDIC
AL
SPEC
IALT
IES
SUB
TOTA
LA
nato
mic
al P
atho
logy
Hem
atol
ogic
al P
atho
logy
11
11
11
31
11
11
22
27
11
12
13
17
27
161
11
22
23
310
41
23
727
11
11
21
41
11
12
14
11
11
23
11
72
22
11
12
31
12
71
11
11
12
11
22
31
12
13
31
11
11
11
11
22
31
11
11
11
11
11
11
21
11
11
13
11
22
11
11
11
11
11
11
11
11
14
11
12
11
13
26
31
154
427
11
24
69
521
11
11
12
(cont.)
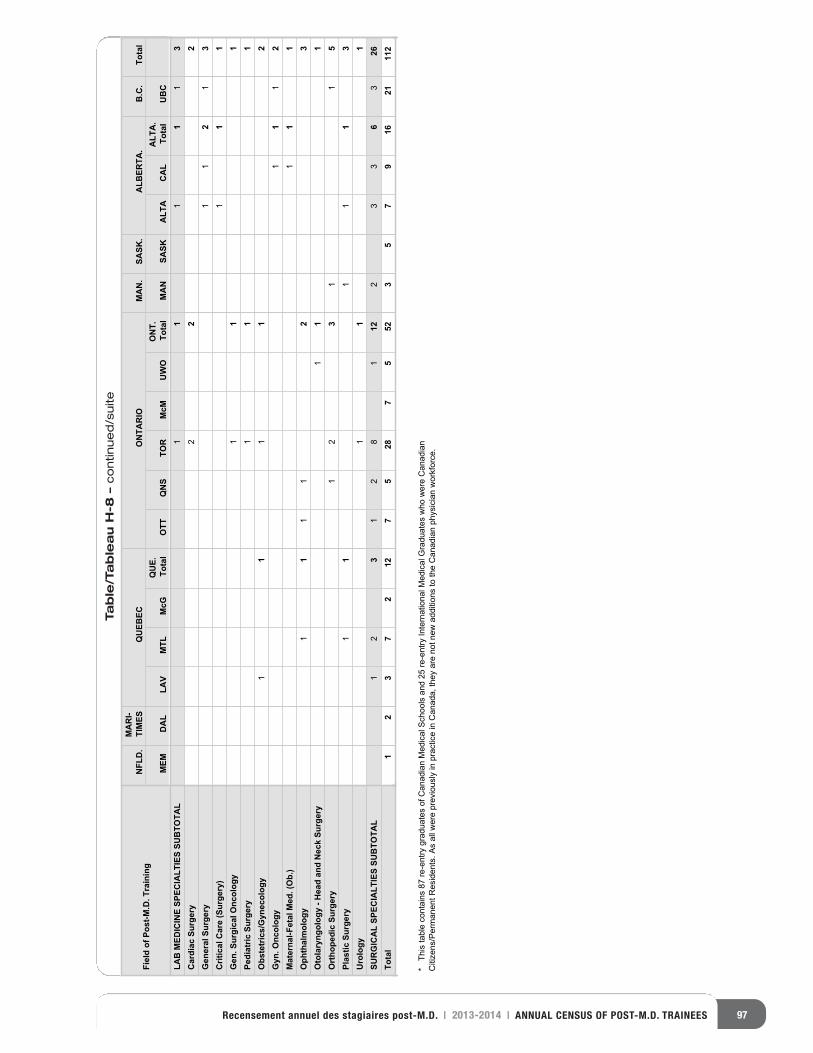
97Recensement annuel des stagiaires post-M.D. | 2013-2014 | ANNUAL CENSUS OF POST-M.D. TRAINEES
Table/Tableau H-8 –continued/suite
Fiel
d of
Pos
t-M.D
. Tra
inin
gN
FLD
.M
AR
I- TI
MES
QU
EBEC
ON
TAR
IOM
AN
.SA
SK.
ALB
ERTA
.B
.C.
Tota
l
MEM
DA
LLA
VM
TLM
cGQ
UE.
Tota
lO
TTQ
NS
TOR
McM
UW
OO
NT.
Tota
lM
AN
SASK
ALT
AC
AL
ALT
A.
Tota
lU
BC
LAB
MED
ICIN
E SP
ECIA
LTIE
S SU
BTO
TAL
Car
diac
Sur
gery
Gen
eral
Sur
gery
Crit
ical
Car
e (S
urge
ry)
Gen
. Sur
gica
l Onc
olog
yPe
diat
ric S
urge
ryO
bste
tric
s/G
ynec
olog
yG
yn. O
ncol
ogy
Mat
erna
l-Fet
al M
ed. (
Ob.
)O
phth
alm
olog
yO
tola
ryng
olog
y - H
ead
and
Nec
k Su
rger
yO
rtho
pedi
c Su
rger
yPl
astic
Sur
gery
Uro
logy
SUR
GIC
AL
SPEC
IALT
IES
SUB
TOTA
LTo
tal
11
11
13
22
21
12
13
11
11
11
11
11
11
12
11
12
11
11
11
12
31
11
12
31
15
11
11
13
11
11
23
12
81
122
33
63
261
23
72
127
528
75
523
57
916
2111
2
* T
his
tabl
e co
ntai
ns 8
7 re
-ent
ry g
radu
ates
of C
anad
ian
Med
ical
Sch
ools
and
25
re-e
ntry
Inte
rnat
iona
l Med
ical
Gra
duat
es w
ho w
ere
Can
adia
nC
itize
ns/P
erm
anen
t Res
iden
ts. A
s al
l wer
e pr
evio
usly
in p
ract
ice
in C
anad
a, th
ey a
re n
ot n
ew a
dditi
ons
to th
e C
anad
ian
phys
icia
n w
orkf
orce
.
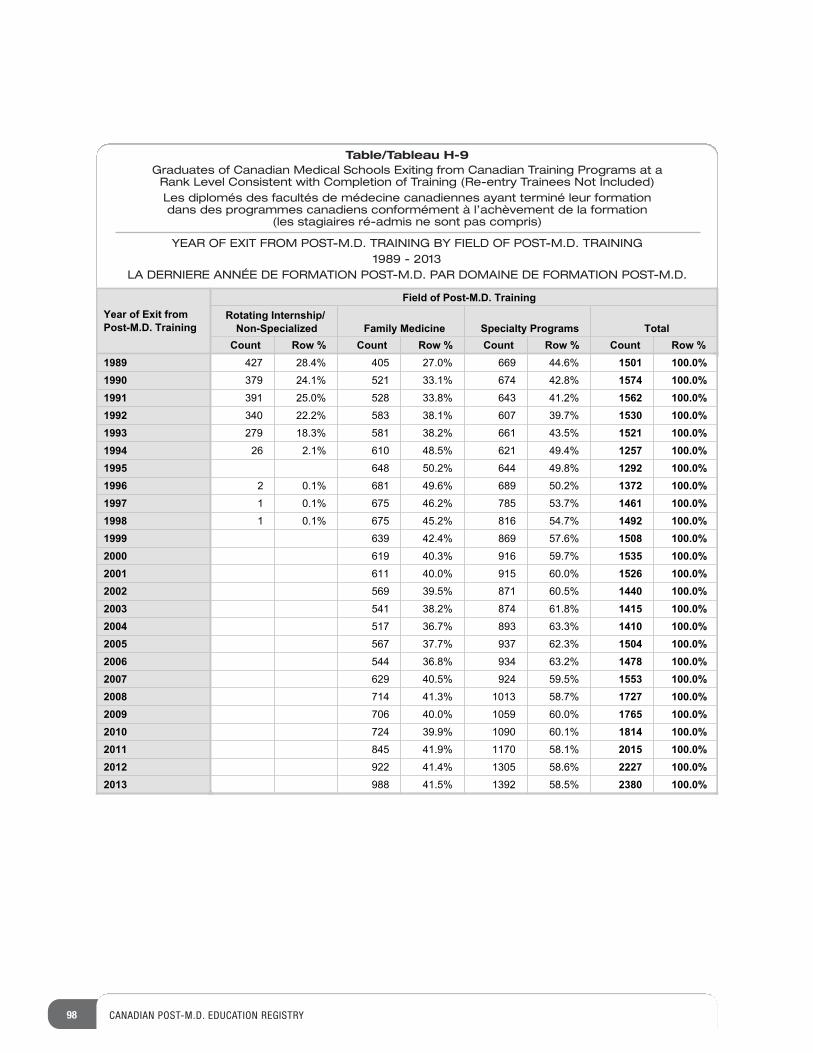
Year of Exit from Post-M.D. Training
Field of Post-M.D. TrainingRotating Internship/
Non-Specialized Family Medicine Specialty Programs TotalCount Row % Count Row % Count Row % Count Row %
1989199019911992199319941995199619971998199920002001200220032004200520062007200820092010201120122013
427 28.4% 405 27.0% 669 44.6% 1501 100.0%379 24.1% 521 33.1% 674 42.8% 1574 100.0%391 25.0% 528 33.8% 643 41.2% 1562 100.0%340 22.2% 583 38.1% 607 39.7% 1530 100.0%279 18.3% 581 38.2% 661 43.5% 1521 100.0%26 2.1% 610 48.5% 621 49.4% 1257 100.0%
648 50.2% 644 49.8% 1292 100.0%2 0.1% 681 49.6% 689 50.2% 1372 100.0%1 0.1% 675 46.2% 785 53.7% 1461 100.0%1 0.1% 675 45.2% 816 54.7% 1492 100.0%
639 42.4% 869 57.6% 1508 100.0%619 40.3% 916 59.7% 1535 100.0%611 40.0% 915 60.0% 1526 100.0%569 39.5% 871 60.5% 1440 100.0%541 38.2% 874 61.8% 1415 100.0%517 36.7% 893 63.3% 1410 100.0%567 37.7% 937 62.3% 1504 100.0%544 36.8% 934 63.2% 1478 100.0%629 40.5% 924 59.5% 1553 100.0%714 41.3% 1013 58.7% 1727 100.0%706 40.0% 1059 60.0% 1765 100.0%724 39.9% 1090 60.1% 1814 100.0%845 41.9% 1170 58.1% 2015 100.0%922 41.4% 1305 58.6% 2227 100.0%988 41.5% 1392 58.5% 2380 100.0%
98 CANADIAN POST-M.D. EDUCATION REGISTRY
Table/Tableau H-9Graduates of Canadian Medical Schools Exiting from Canadian Training Programs at a Rank Level Consistent with Completion of Training (Re-entry Trainees Not Included)Les diplomés des facultés de médecine canadiennes ayant terminé leur formation dans des programmes canadiens conformément à l’achèvement de la formation
(les stagiaires ré-admis ne sont pas compris)
YEAR OF EXIT FROM POST-M.D. TRAINING BY FIELD OF POST-M.D. TRAINING1989 - 2013
LA DERNIERE ANNÉE DE FORMATION POST-M.D. PAR DOMAINE DE FORMATION POST-M.D.
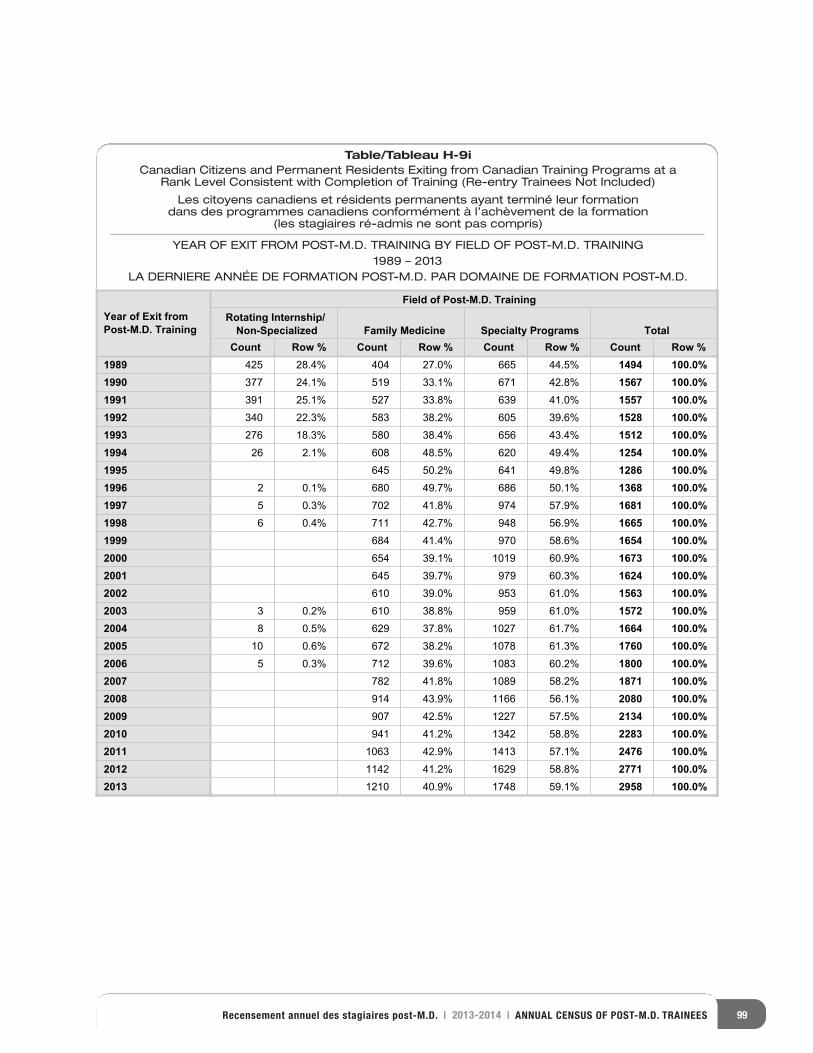
99Recensement annuel des stagiaires post-M.D. | 2013-2014 | ANNUAL CENSUS OF POST-M.D. TRAINEES
Table/Tableau H-9iCanadian Citizens and Permanent Residents Exiting from Canadian Training Programs at a
Rank Level Consistent with Completion of Training (Re-entry Trainees Not Included)
Les citoyens canadiens et résidents permanents ayant terminé leur formation dans des programmes canadiens conformément à l’achèvement de la formation
(les stagiaires ré-admis ne sont pas compris)
YEAR OF EXIT FROM POST-M.D. TRAINING BY FIELD OF POST-M.D. TRAINING1989 – 2013
LA DERNIERE ANNÉE DE FORMATION POST-M.D. PAR DOMAINE DE FORMATION POST-M.D.
Year of Exit from Post-M.D. Training
Field of Post-M.D. TrainingRotating Internship/
Non-Specialized Family Medicine Specialty Programs TotalCount Row % Count Row % Count Row % Count Row %
1989199019911992199319941995199619971998199920002001200220032004200520062007200820092010201120122013
425 28.4% 404 27.0% 665 44.5% 1494 100.0%377 24.1% 519 33.1% 671 42.8% 1567 100.0%391 25.1% 527 33.8% 639 41.0% 1557 100.0%340 22.3% 583 38.2% 605 39.6% 1528 100.0%276 18.3% 580 38.4% 656 43.4% 1512 100.0%26 2.1% 608 48.5% 620 49.4% 1254 100.0%
645 50.2% 641 49.8% 1286 100.0%2 0.1% 680 49.7% 686 50.1% 1368 100.0%5 0.3% 702 41.8% 974 57.9% 1681 100.0%6 0.4% 711 42.7% 948 56.9% 1665 100.0%
684 41.4% 970 58.6% 1654 100.0%654 39.1% 1019 60.9% 1673 100.0%645 39.7% 979 60.3% 1624 100.0%610 39.0% 953 61.0% 1563 100.0%
3 0.2% 610 38.8% 959 61.0% 1572 100.0%8 0.5% 629 37.8% 1027 61.7% 1664 100.0%10 0.6% 672 38.2% 1078 61.3% 1760 100.0%5 0.3% 712 39.6% 1083 60.2% 1800 100.0%
782 41.8% 1089 58.2% 1871 100.0%914 43.9% 1166 56.1% 2080 100.0%907 42.5% 1227 57.5% 2134 100.0%941 41.2% 1342 58.8% 2283 100.0%1063 42.9% 1413 57.1% 2476 100.0%1142 41.2% 1629 58.8% 2771 100.0%1210 40.9% 1748 59.1% 2958 100.0%

100 CANADIAN POST-M.D. EDUCATION REGISTRY
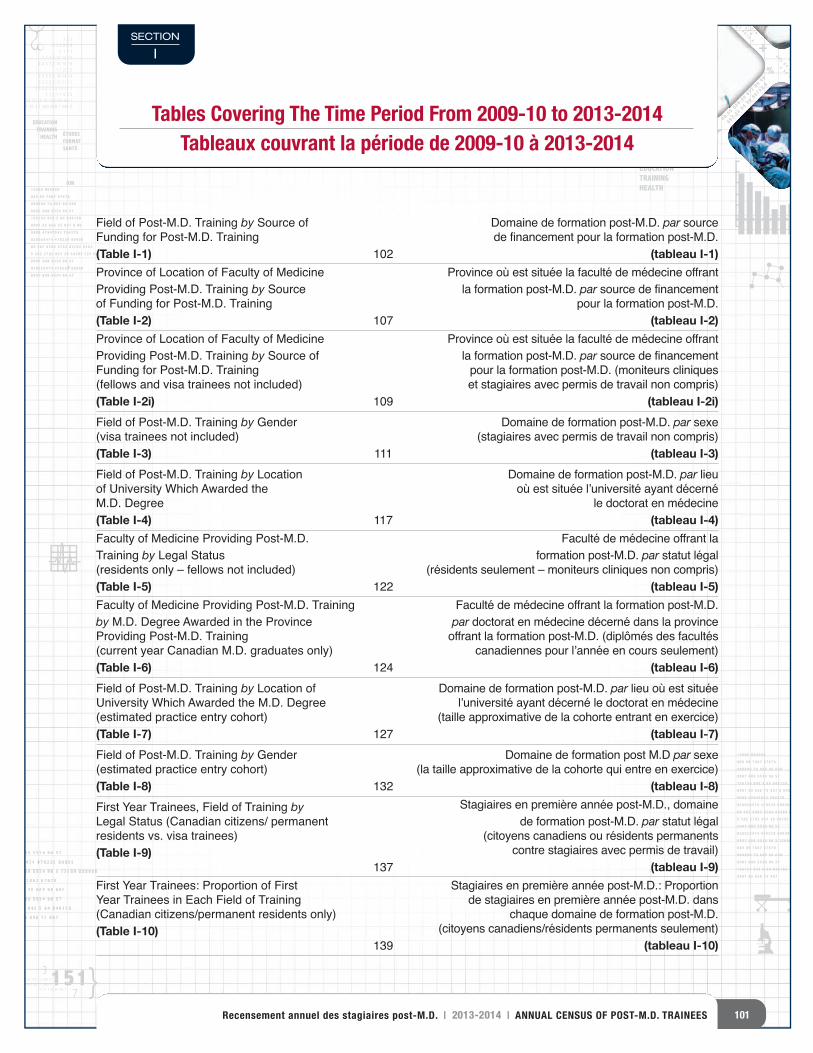
8989077 68686868689 9 5535535535534 969696 5 57
02028028402840284028474 4747479229229229 8090909009
89898989890007777 68686868689 9 9 9 5535535535534 4 4 96969696 5 5 5 12121266668989 U U U889888988898999
08089 8989 7 7 7 7867867 6 676776788
89890890890890 78 6666665 969696 680
89898989000777 68686868689 9 9 5535535535534 4 4 96969696 5 5 5777
15156154154154 845 55 64 88846156156158
898907 656565 656 7 75 8686867
45 50 261857 63 100
12689 U88989089 89 7867 67678
890890 78 665 96 6808907 689 5534 96 57
156154 845 5 64 8461588907 65 656 75 867 8 908
9809 4794Y943 Y943Y9028028474 479229 80909
89 367 9562 6782 83292 83625 382 2782 937 38 38792 723 02
4850 480 4980 890 904 60 540
3 3 32 3 3 8 8 81 1 1 13 3 3 3 12 12 124 4 3 3 2 16 16 161 1 2 2 23 3 3 3 2 14 14 142 2 2 2 3 11 11 113 3 3 2 2 13 13 12 11 1 1 1 1 5 5 513 13 12 11 11 1 61 61 60 1103 107 59 41 35 3 1 349 348 1 346 3
3 3 32 3 3 8 8 8
1 1 1 13 3 3 3 12 12 12
4 4 3 3 2 16 16 161 1 2 2 2
3 3 3 3 2 14 14 142 2 2 2 3 11 11 11
3 3 3 2 2 13 13 12 11 1 1 1 1 5 5 5
13 13 12 11 11 1 61 61 60 1103 107 59 41 35 3 1 349 348 1 346 3
2 2 13 13 12 11 1 1 1 1 5 5 5
13 13 12 11 11 1 61 61 60 1103 107 59 41 35 3 1 349 348 1 346 3
75 79 064 20 379 07 590 3 2 8
48 05 8
56 40 6
72 90 4
6
892 3
4 04 0
4 90792 6
4 8 5 8 5 8 5 4 9 3 7 0 1
4 5 0 4 5 0 1 9 7 3
EDUCATIONTRAINING
HEALTH ÉTUDESFORMAT
ION
SANTÉ
758 64 26 12
03 13 015 23
12689 U88989089 89 7867 67678
890890 78 665 96 6808907 689 5534 96 57
156154 845 5 64 8461588907 65 656 75 867 8 908
9809 4794Y943 Y943Y9028028474 479229 80909
89 367 9562 6782 83292 83625 382 2782 937 38 38792 723 02
1103 1078
%+
+ 781 5413 9
405540 466
0 1533 8
18 387
9 41 3
5 3 1
34
12689 U88989
089 89 7867 67678
890890 78 665 96 680
8907 689 5534 96 57
156154 845 5 64 846158
8907 65 656 75 867 8 90
8
9809 4794Y943 Y943Y9
028028474 479229 80909
89 367 9562 6782 83292 8362
5 382 2782 937 38 38792 723 02
8907 689 5534 96 57
028028474 479229 80909
8907 689 5534 96 57
4
{ {7
7
3
4 15103 107 59 41 35 3 1 349 303 107 59 41 35 3 1 349 3
11 11 1 61 61 60 1
1 5 2 1 5 2 1 6
4 4 5 1 5 2 8
6 4 8 2 4 6 1 2 6
12689 u88989089 89 7867 67678890890 78 665 96 6808907 689 5534 96 57156154 845 5 64 8461588907 65 656 75 867 8 9089809 4794y943 y943y9
T O
T A L
H E A L T H S A N T É
EDUCATIONÉTUDES
EDUCATIONTRAININGHEALTH
" " "" "
" "A
8
2 2 2 2 3 11 11 113 3 3 2 2 13 13 12 11 1 1 1 1 5 5 513 13 12 11 11 1 61 650 640 75 056 06 6890780 9029 068 0690667890 0 49 0463 0492
12689 U88989
089 89 7867 67678
890890 78 665 96 680
8907 689 5534 96 57
156154 845 5 64 846158
8907 65 656 75 867 8 908
9809 4794Y943 Y943Y9
028028474 479229 80909
89 367 9562 6782 83292 8362
5 382 2782 937 38 38792 723 02
8907 689 5534 96 57
028028474 479229 80909
8907 689 5534 96 5 12689 U88989
089 89 7867 67678
890890 78 665 96 680
8907 689 5534 96 57
156154 845 5 64 846158
8907 65 656 75 867
EDUCATION REGISTRY ENREGISTREMENT
D’ÉDUCATION
EDUCAT
ION REGISTRY
ENREGISTREMENT D’ÉDUCATION
Tables Covering The Time Period From 2009-10 to 2013-2014Tableaux couvrant la période de 2009-10 à 2013-2014
Field of Post-M.D. Training by Source of Funding for Post-M.D. Training (Table I-1) 102Province of Location of Faculty of Medicine Providing Post-M.D. Training by Source of Funding for Post-M.D. Training (Table I-2) 107Province of Location of Faculty of Medicine Providing Post-M.D. Training by Source of Funding for Post-M.D. Training (fellows and visa trainees not included) (Table I-2i) 109Field of Post-M.D. Training by Gender (visa trainees not included) (Table I-3) 111Field of Post-M.D. Training by Location of University Which Awarded the M.D. Degree (Table I-4) 117Faculty of Medicine Providing Post-M.D. Training by Legal Status (residents only – fellows not included) (Table I-5) 122Faculty of Medicine Providing Post-M.D. Training by M.D. Degree Awarded in the Province Providing Post-M.D. Training (current year Canadian M.D. graduates only)(Table I-6) 124Field of Post-M.D. Training by Location of University Which Awarded the M.D. Degree (estimated practice entry cohort) (Table I-7) 127Field of Post-M.D. Training by Gender (estimated practice entry cohort) (Table I-8) 132First Year Trainees, Field of Training byLegal Status (Canadian citizens/ permanent residents vs. visa trainees)(Table I-9)
137First Year Trainees: Proportion of First Year Trainees in Each Field of Training (Canadian citizens/permanent residents only) (Table I-10)
139
Domaine de formation post-M.D. par source de financement pour la formation post-M.D.
(tableau I-1)Province où est située la faculté de médecine offrant la formation post-M.D. par source de financement
pour la formation post-M.D. (tableau I-2)
Province où est située la faculté de médecine offrant la formation post-M.D. par source de financement pour la formation post-M.D. (moniteurs cliniques et stagiaires avec permis de travail non compris)
(tableau I-2i)Domaine de formation post-M.D. par sexe
(stagiaires avec permis de travail non compris) (tableau I-3)
Domaine de formation post-M.D. par lieu où est située l’université ayant décerné
le doctorat en médecine (tableau I-4)
Faculté de médecine offrant la formation post-M.D. par statut légal
(résidents seulement – moniteurs cliniques non compris)(tableau I-5)
Faculté de médecine offrant la formation post-M.D. par doctorat en médecine décerné dans la province offrant la formation post-M.D. (diplômés des facultés
canadiennes pour l’année en cours seulement) (tableau I-6)
Domaine de formation post-M.D. par lieu où est située l’université ayant décerné le doctorat en médecine
(taille approximative de la cohorte entrant en exercice)(tableau I-7)
Domaine de formation post M.D par sexe (la taille approximative de la cohorte qui entre en exercice)
(tableau I-8)Stagiaires en première année post-M.D., domaine
de formation post-M.D. par statut légal (citoyens canadiens ou résidents permanents
contre stagiaires avec permis de travail) (tableau I-9)
Stagiaires en première année post-M.D.: Proportion de stagiaires en première année post-M.D. dans
chaque domaine de formation post-M.D. (citoyens canadiens/résidents permanents seulement)
(tableau I-10)
SECTION
I
101Recensement annuel des stagiaires post-M.D. | 2013-2014 | ANNUAL CENSUS OF POST-M.D. TRAINEES
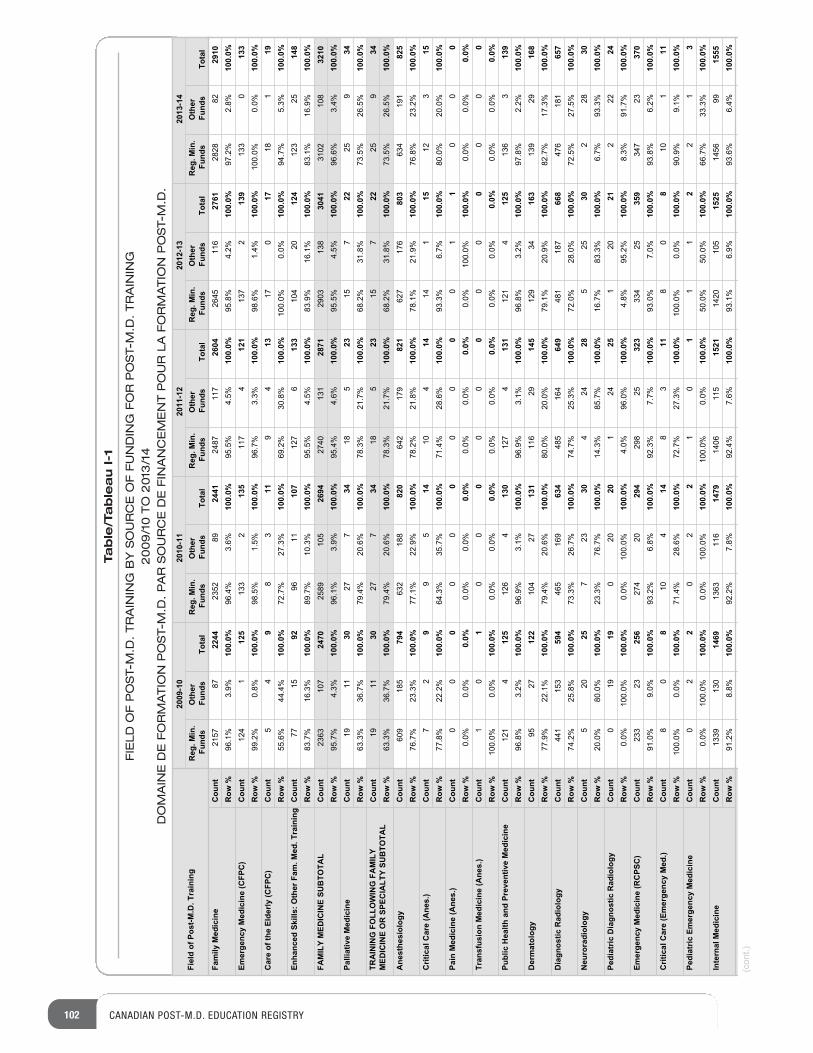
102 CANADIAN POST-M.D. EDUCATION REGISTRY
Table/Tableau I-1
FIELD OF POST-M.D. TRAINING BY SOURCE OF FUNDING FOR POST-M.D. TRAINING
2009/10 TO 2013/14
DOMAINE DE FORMATION POST-M.D. PAR SOURCE DE FINANCEMENT POUR LA FORMATION POST-M.D.
Fiel
d of
Pos
t-M.D
. Tra
inin
g20
09-1
020
10-1
120
11-1
220
12-1
320
13-1
4R
eg. M
in.
Fund
sO
ther
Fu
nds
Tota
lR
eg. M
in.
Fund
sO
ther
Fu
nds
Tota
lR
eg. M
in.
Fund
sO
ther
Fu
nds
Tota
lR
eg. M
in.
Fund
sO
ther
Fu
nds
Tota
lR
eg. M
in.
Fund
sO
ther
Fu
nds
Tota
lFa
mily
Med
icin
eC
ount
Row
%Em
erge
ncy
Med
icin
e (C
FPC
)C
ount
Row
%C
are
of th
e El
derly
(CFP
C)
Cou
ntR
ow %
Enha
nced
Ski
lls: O
ther
Fam
. Med
. Tra
inin
gC
ount
Row
%FA
MIL
Y M
EDIC
INE
SUB
TOTA
LC
ount
Row
%Pa
lliat
ive
Med
icin
eC
ount
Row
%TR
AIN
ING
FO
LLO
WIN
G F
AM
ILY
MED
ICIN
E O
R S
PEC
IALT
Y SU
BTO
TAL
Cou
ntR
ow %
Ane
sthe
siol
ogy
Cou
ntR
ow %
Crit
ical
Car
e (A
nes.
)C
ount
Row
%Pa
in M
edic
ine
(Ane
s.)
Cou
ntR
ow %
Tran
sfus
ion
Med
icin
e (A
nes.
)C
ount
Row
%Pu
blic
Hea
lth a
nd P
reve
ntiv
e M
edic
ine
Cou
ntR
ow %
Der
mat
olog
yC
ount
Row
%D
iagn
ostic
Rad
iolo
gyC
ount
Row
%N
euro
radi
olog
yC
ount
Row
%Pe
diat
ric D
iagn
ostic
Rad
iolo
gyC
ount
Row
%Em
erge
ncy
Med
icin
e (R
CPS
C)
Cou
ntR
ow %
Crit
ical
Car
e (E
mer
genc
y M
ed.)
Cou
ntR
ow %
Pedi
atric
Em
erge
ncy
Med
icin
eC
ount
Row
%In
tern
al M
edic
ine
Cou
ntR
ow %
2157
8722
442352
8924
412487
117
2604
2645
116
2761
2828
8229
1096.1%
3.9%
100.
0%96.4%
3.6%
100.
0%95.5%
4.5%
100.
0%95.8%
4.2%
100.
0%97.2%
2.8%
100.
0%124
112
5133
213
5117
412
1137
213
9133
013
399.2%
0.8%
100.
0%98.5%
1.5%
100.
0%96.7%
3.3%
100.
0%98.6%
1.4%
100.
0%100.0%
0.0%
100.
0%5
49
83
119
413
170
1718
119
55.6%
44.4%
100.
0%72.7%
27.3%
100.
0%69.2%
30.8%
100.
0%100.0%
0.0%
100.
0%94.7%
5.3%
100.
0%77
1592
9611
107
127
613
3104
2012
4123
2514
883.7%
16.3%
100.
0%89.7%
10.3%
100.
0%95.5%
4.5%
100.
0%83.9%
16.1%
100.
0%83.1%
16.9%
100.
0%2363
107
2470
2589
105
2694
2740
131
2871
2903
138
3041
3102
108
3210
95.7%
4.3%
100.
0%96.1%
3.9%
100.
0%95.4%
4.6%
100.
0%95.5%
4.5%
100.
0%96.6%
3.4%
100.
0%19
1130
277
3418
523
157
2225
934
63.3%
36.7%
100.
0%79.4%
20.6%
100.
0%78.3%
21.7%
100.
0%68.2%
31.8%
100.
0%73.5%
26.5%
100.
0%19
1130
277
3418
523
157
2225
934
63.3%
36.7%
100.
0%79.4%
20.6%
100.
0%78.3%
21.7%
100.
0%68.2%
31.8%
100.
0%73.5%
26.5%
100.
0%609
185
794
632
188
820
642
179
821
627
176
803
634
191
825
76.7%
23.3%
100.
0%77.1%
22.9%
100.
0%78.2%
21.8%
100.
0%78.1%
21.9%
100.
0%76.8%
23.2%
100.
0%7
29
95
1410
414
141
1512
315
77.8%
22.2%
100.
0%64.3%
35.7%
100.
0%71.4%
28.6%
100.
0%93.3%
6.7%
100.
0%80.0%
20.0%
100.
0%0
00
00
00
00
01
10
00
0.0%
0.0%
0.0%
0.0%
0.0%
0.0%
0.0%
0.0%
0.0%
0.0%
100.0%
100.
0%0.0%
0.0%
0.0%
10
10
00
00
00
00
00
0100.0%
0.0%
100.
0%0.0%
0.0%
0.0%
0.0%
0.0%
0.0%
0.0%
0.0%
0.0%
0.0%
0.0%
0.0%
121
412
5126
413
0127
413
1121
412
5136
313
996.8%
3.2%
100.
0%96.9%
3.1%
100.
0%96.9%
3.1%
100.
0%96.8%
3.2%
100.
0%97.8%
2.2%
100.
0%95
2712
2104
2713
1116
2914
5129
3416
3139
2916
877.9%
22.1%
100.
0%79.4%
20.6%
100.
0%80.0%
20.0%
100.
0%79.1%
20.9%
100.
0%82.7%
17.3%
100.
0%441
153
594
465
169
634
485
164
649
481
187
668
476
181
657
74.2%
25.8%
100.
0%73.3%
26.7%
100.
0%74.7%
25.3%
100.
0%72.0%
28.0%
100.
0%72.5%
27.5%
100.
0%5
2025
723
304
2428
525
302
2830
20.0%
80.0%
100.
0%23.3%
76.7%
100.
0%14.3%
85.7%
100.
0%16.7%
83.3%
100.
0%6.7%
93.3%
100.
0%0
1919
020
201
2425
120
212
2224
0.0%
100.0%
100.
0%0.0%
100.0%
100.
0%4.0%
96.0%
100.
0%4.8%
95.2%
100.
0%8.3%
91.7%
100.
0%233
2325
6274
2029
4298
2532
3334
2535
9347
2337
091.0%
9.0%
100.
0%93.2%
6.8%
100.
0%92.3%
7.7%
100.
0%93.0%
7.0%
100.
0%93.8%
6.2%
100.
0%8
08
104
148
311
80
810
111
100.0%
0.0%
100.
0%71.4%
28.6%
100.
0%72.7%
27.3%
100.
0%100.0%
0.0%
100.
0%90.9%
9.1%
100.
0%0
22
02
21
01
11
22
13
0.0%
100.0%
100.
0%0.0%
100.0%
100.
0%100.0%
0.0%
100.
0%50.0%
50.0%
100.
0%66.7%
33.3%
100.
0%1339
130
1469
1363
116
1479
1406
115
1521
1420
105
1525
1456
9915
5591.2%
8.8%
100.
0%92.2%
7.8%
100.
0%92.4%
7.6%
100.
0%93.1%
6.9%
100.
0%93.6%
6.4%
100.
0%
(cont.)
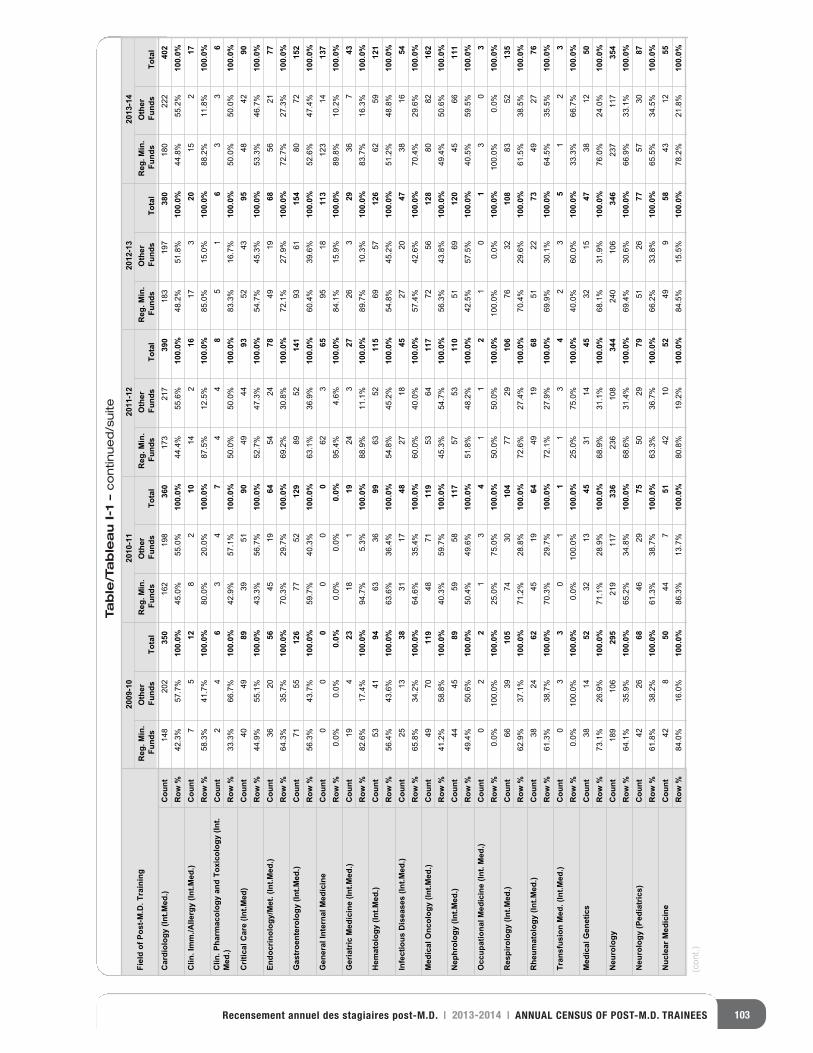
103Recensement annuel des stagiaires post-M.D. | 2013-2014 | ANNUAL CENSUS OF POST-M.D. TRAINEES
Table/Tableau I-1 –continued/suite
Fiel
d of
Pos
t-M.D
. Tra
inin
g20
09-1
020
10-1
120
11-1
220
12-1
320
13-1
4R
eg. M
in.
Fund
sO
ther
Fu
nds
Tota
lR
eg. M
in.
Fund
sO
ther
Fu
nds
Tota
lR
eg. M
in.
Fund
sO
ther
Fu
nds
Tota
lR
eg. M
in.
Fund
sO
ther
Fu
nds
Tota
lR
eg. M
in.
Fund
sO
ther
Fu
nds
Tota
lC
ardi
olog
y (In
t.Med
.)C
ount
Row
%C
lin. I
mm
./Alle
rgy
(Int.M
ed.)
Cou
ntR
ow %
Clin
. Pha
rmac
olog
y an
d To
xico
logy
(Int
.M
ed.)
Cou
ntR
ow %
Crit
ical
Car
e (In
t.Med
)C
ount
Row
%En
docr
inol
ogy/
Met
. (In
t.Med
.)C
ount
Row
%G
astr
oent
erol
ogy
(Int.M
ed.)
Cou
ntR
ow %
Gen
eral
Inte
rnal
Med
icin
eC
ount
Row
%G
eria
tric
Med
icin
e (In
t.Med
.)C
ount
Row
%H
emat
olog
y (In
t.Med
.)C
ount
Row
%In
fect
ious
Dis
ease
s (In
t.Med
.)C
ount
Row
%M
edic
al O
ncol
ogy
(Int.M
ed.)
Cou
ntR
ow %
Nep
hrol
ogy
(Int.M
ed.)
Cou
ntR
ow %
Occ
upat
iona
l Med
icin
e (In
t. M
ed.)
Cou
ntR
ow %
Res
piro
logy
(Int
.Med
.)C
ount
Row
%R
heum
atol
ogy
(Int.M
ed.)
Cou
ntR
ow %
Tran
sfus
ion
Med
. (In
t.Med
.)C
ount
Row
%M
edic
al G
enet
ics
Cou
ntR
ow %
Neu
rolo
gyC
ount
Row
%N
euro
logy
(Ped
iatr
ics)
Cou
ntR
ow %
Nuc
lear
Med
icin
eC
ount
Row
%
148
202
350
162
198
360
173
217
390
183
197
380
180
222
402
42.3%
57.7%
100.
0%45.0%
55.0%
100.
0%44.4%
55.6%
100.
0%48.2%
51.8%
100.
0%44.8%
55.2%
100.
0%7
512
82
1014
216
173
2015
217
58.3%
41.7%
100.
0%80.0%
20.0%
100.
0%87.5%
12.5%
100.
0%85.0%
15.0%
100.
0%88.2%
11.8%
100.
0%2
46
34
74
48
51
63
36
33.3%
66.7%
100.
0%42.9%
57.1%
100.
0%50.0%
50.0%
100.
0%83.3%
16.7%
100.
0%50.0%
50.0%
100.
0%40
4989
3951
9049
4493
5243
9548
4290
44.9%
55.1%
100.
0%43.3%
56.7%
100.
0%52.7%
47.3%
100.
0%54.7%
45.3%
100.
0%53.3%
46.7%
100.
0%36
2056
4519
6454
2478
4919
6856
2177
64.3%
35.7%
100.
0%70.3%
29.7%
100.
0%69.2%
30.8%
100.
0%72.1%
27.9%
100.
0%72.7%
27.3%
100.
0%71
5512
677
5212
989
5214
193
6115
480
7215
256.3%
43.7%
100.
0%59.7%
40.3%
100.
0%63.1%
36.9%
100.
0%60.4%
39.6%
100.
0%52.6%
47.4%
100.
0%0
00
00
062
365
9518
113
123
1413
70.0%
0.0%
0.0%
0.0%
0.0%
0.0%
95.4%
4.6%
100.
0%84.1%
15.9%
100.
0%89.8%
10.2%
100.
0%19
423
181
1924
327
263
2936
743
82.6%
17.4%
100.
0%94.7%
5.3%
100.
0%88.9%
11.1%
100.
0%89.7%
10.3%
100.
0%83.7%
16.3%
100.
0%53
4194
6336
9963
5211
569
5712
662
5912
156.4%
43.6%
100.
0%63.6%
36.4%
100.
0%54.8%
45.2%
100.
0%54.8%
45.2%
100.
0%51.2%
48.8%
100.
0%25
1338
3117
4827
1845
2720
4738
1654
65.8%
34.2%
100.
0%64.6%
35.4%
100.
0%60.0%
40.0%
100.
0%57.4%
42.6%
100.
0%70.4%
29.6%
100.
0%49
7011
948
7111
953
6411
772
5612
880
8216
241.2%
58.8%
100.
0%40.3%
59.7%
100.
0%45.3%
54.7%
100.
0%56.3%
43.8%
100.
0%49.4%
50.6%
100.
0%44
4589
5958
117
5753
110
5169
120
4566
111
49.4%
50.6%
100.
0%50.4%
49.6%
100.
0%51.8%
48.2%
100.
0%42.5%
57.5%
100.
0%40.5%
59.5%
100.
0%0
22
13
41
12
10
13
03
0.0%
100.0%
100.
0%25.0%
75.0%
100.
0%50.0%
50.0%
100.
0%100.0%
0.0%
100.
0%100.0%
0.0%
100.
0%66
3910
574
3010
477
2910
676
3210
883
5213
562.9%
37.1%
100.
0%71.2%
28.8%
100.
0%72.6%
27.4%
100.
0%70.4%
29.6%
100.
0%61.5%
38.5%
100.
0%38
2462
4519
6449
1968
5122
7349
2776
61.3%
38.7%
100.
0%70.3%
29.7%
100.
0%72.1%
27.9%
100.
0%69.9%
30.1%
100.
0%64.5%
35.5%
100.
0%0
33
01
11
34
23
51
23
0.0%
100.0%
100.
0%0.0%
100.0%
100.
0%25.0%
75.0%
100.
0%40.0%
60.0%
100.
0%33.3%
66.7%
100.
0%38
1452
3213
4531
1445
3215
4738
1250
73.1%
26.9%
100.
0%71.1%
28.9%
100.
0%68.9%
31.1%
100.
0%68.1%
31.9%
100.
0%76.0%
24.0%
100.
0%189
106
295
219
117
336
236
108
344
240
106
346
237
117
354
64.1%
35.9%
100.
0%65.2%
34.8%
100.
0%68.6%
31.4%
100.
0%69.4%
30.6%
100.
0%66.9%
33.1%
100.
0%42
2668
4629
7550
2979
5126
7757
3087
61.8%
38.2%
100.
0%61.3%
38.7%
100.
0%63.3%
36.7%
100.
0%66.2%
33.8%
100.
0%65.5%
34.5%
100.
0%42
850
447
5142
1052
499
5843
1255
84.0%
16.0%
100.
0%86.3%
13.7%
100.
0%80.8%
19.2%
100.
0%84.5%
15.5%
100.
0%78.2%
21.8%
100.
0%
(cont.)
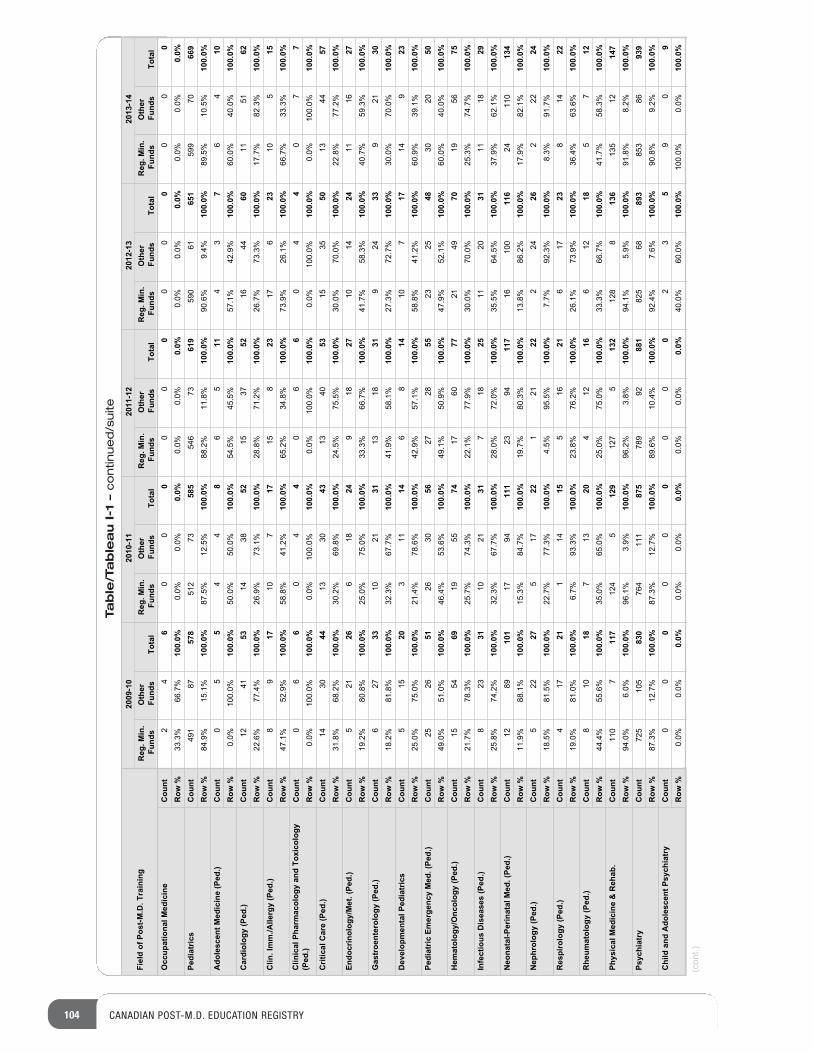
Table/Tableau I-1 –continued/suite
104 CANADIAN POST-M.D. EDUCATION REGISTRY
Fiel
d of
Pos
t-M.D
. Tra
inin
g20
09-1
020
10-1
120
11-1
220
12-1
320
13-1
4R
eg. M
in.
Fund
sO
ther
Fu
nds
Tota
lR
eg. M
in.
Fund
sO
ther
Fu
nds
Tota
lR
eg. M
in.
Fund
sO
ther
Fu
nds
Tota
lR
eg. M
in.
Fund
sO
ther
Fu
nds
Tota
lR
eg. M
in.
Fund
sO
ther
Fu
nds
Tota
lO
ccup
atio
nal M
edic
ine
Cou
ntR
ow %
Pedi
atric
sC
ount
Row
%A
dole
scen
t Med
icin
e (P
ed.)
Cou
ntR
ow %
Car
diol
ogy
(Ped
.)C
ount
Row
%C
lin. I
mm
./Alle
rgy
(Ped
.)C
ount
Row
%C
linic
al P
harm
acol
ogy
and
Toxi
colo
gy
(Ped
.)C
ount
Row
%C
ritic
al C
are
(Ped
.)C
ount
Row
%En
docr
inol
ogy/
Met
. (Pe
d.)
Cou
ntR
ow %
Gas
troe
nter
olog
y (P
ed.)
Cou
ntR
ow %
Dev
elop
men
tal P
edia
tric
sC
ount
Row
%Pe
diat
ric E
mer
genc
y M
ed. (
Ped.
)C
ount
Row
%H
emat
olog
y/O
ncol
ogy
(Ped
.)C
ount
Row
%In
fect
ious
Dis
ease
s (P
ed.)
Cou
ntR
ow %
Neo
nata
l-Per
inat
al M
ed. (
Ped.
)C
ount
Row
%N
ephr
olog
y (P
ed.)
Cou
ntR
ow %
Res
piro
logy
(Ped
.)C
ount
Row
%R
heum
atol
ogy
(Ped
.)C
ount
Row
%Ph
ysic
al M
edic
ine
& R
ehab
.C
ount
Row
%Ps
ychi
atry
Cou
ntR
ow %
Chi
ld a
nd A
dole
scen
t Psy
chia
try
Cou
ntR
ow %
24
60
00
00
00
00
00
033.3%
66.7%
100.
0%0.0%
0.0%
0.0%
0.0%
0.0%
0.0%
0.0%
0.0%
0.0%
0.0%
0.0%
0.0%
491
8757
8512
7358
5546
7361
9590
6165
1599
7066
984.9%
15.1%
100.
0%87.5%
12.5%
100.
0%88.2%
11.8%
100.
0%90.6%
9.4%
100.
0%89.5%
10.5%
100.
0%0
55
44
86
511
43
76
410
0.0%
100.0%
100.
0%50.0%
50.0%
100.
0%54.5%
45.5%
100.
0%57.1%
42.9%
100.
0%60.0%
40.0%
100.
0%12
4153
1438
5215
3752
1644
6011
5162
22.6%
77.4%
100.
0%26.9%
73.1%
100.
0%28.8%
71.2%
100.
0%26.7%
73.3%
100.
0%17.7%
82.3%
100.
0%8
917
107
1715
823
176
2310
515
47.1%
52.9%
100.
0%58.8%
41.2%
100.
0%65.2%
34.8%
100.
0%73.9%
26.1%
100.
0%66.7%
33.3%
100.
0%0
66
04
40
66
04
40
77
0.0%
100.0%
100.
0%0.0%
100.0%
100.
0%0.0%
100.0%
100.
0%0.0%
100.0%
100.
0%0.0%
100.0%
100.
0%14
3044
1330
4313
4053
1535
5013
4457
31.8%
68.2%
100.
0%30.2%
69.8%
100.
0%24.5%
75.5%
100.
0%30.0%
70.0%
100.
0%22.8%
77.2%
100.
0%5
2126
618
249
1827
1014
2411
1627
19.2%
80.8%
100.
0%25.0%
75.0%
100.
0%33.3%
66.7%
100.
0%41.7%
58.3%
100.
0%40.7%
59.3%
100.
0%6
2733
1021
3113
1831
924
339
2130
18.2%
81.8%
100.
0%32.3%
67.7%
100.
0%41.9%
58.1%
100.
0%27.3%
72.7%
100.
0%30.0%
70.0%
100.
0%5
1520
311
146
814
107
1714
923
25.0%
75.0%
100.
0%21.4%
78.6%
100.
0%42.9%
57.1%
100.
0%58.8%
41.2%
100.
0%60.9%
39.1%
100.
0%25
2651
2630
5627
2855
2325
4830
2050
49.0%
51.0%
100.
0%46.4%
53.6%
100.
0%49.1%
50.9%
100.
0%47.9%
52.1%
100.
0%60.0%
40.0%
100.
0%15
5469
1955
7417
6077
2149
7019
5675
21.7%
78.3%
100.
0%25.7%
74.3%
100.
0%22.1%
77.9%
100.
0%30.0%
70.0%
100.
0%25.3%
74.7%
100.
0%8
2331
1021
317
1825
1120
3111
1829
25.8%
74.2%
100.
0%32.3%
67.7%
100.
0%28.0%
72.0%
100.
0%35.5%
64.5%
100.
0%37.9%
62.1%
100.
0%12
8910
117
9411
123
9411
716
100
116
24110
134
11.9%
88.1%
100.
0%15.3%
84.7%
100.
0%19.7%
80.3%
100.
0%13.8%
86.2%
100.
0%17.9%
82.1%
100.
0%5
2227
517
221
2122
224
262
2224
18.5%
81.5%
100.
0%22.7%
77.3%
100.
0%4.5%
95.5%
100.
0%7.7%
92.3%
100.
0%8.3%
91.7%
100.
0%4
1721
114
155
1621
617
238
1422
19.0%
81.0%
100.
0%6.7%
93.3%
100.
0%23.8%
76.2%
100.
0%26.1%
73.9%
100.
0%36.4%
63.6%
100.
0%8
1018
713
204
1216
612
185
712
44.4%
55.6%
100.
0%35.0%
65.0%
100.
0%25.0%
75.0%
100.
0%33.3%
66.7%
100.
0%41.7%
58.3%
100.
0%110
711
7124
512
9127
513
2128
813
6135
1214
794.0%
6.0%
100.
0%96.1%
3.9%
100.
0%96.2%
3.8%
100.
0%94.1%
5.9%
100.
0%91.8%
8.2%
100.
0%725
105
830
764
111
875
789
9288
1825
6889
3853
8693
987.3%
12.7%
100.
0%87.3%
12.7%
100.
0%89.6%
10.4%
100.
0%92.4%
7.6%
100.
0%90.8%
9.2%
100.
0%0
00
00
00
00
23
59
09
0.0%
0.0%
0.0%
0.0%
0.0%
0.0%
0.0%
0.0%
0.0%
40.0%
60.0%
100.
0%100.0%
0.0%
100.
0%
(cont.)
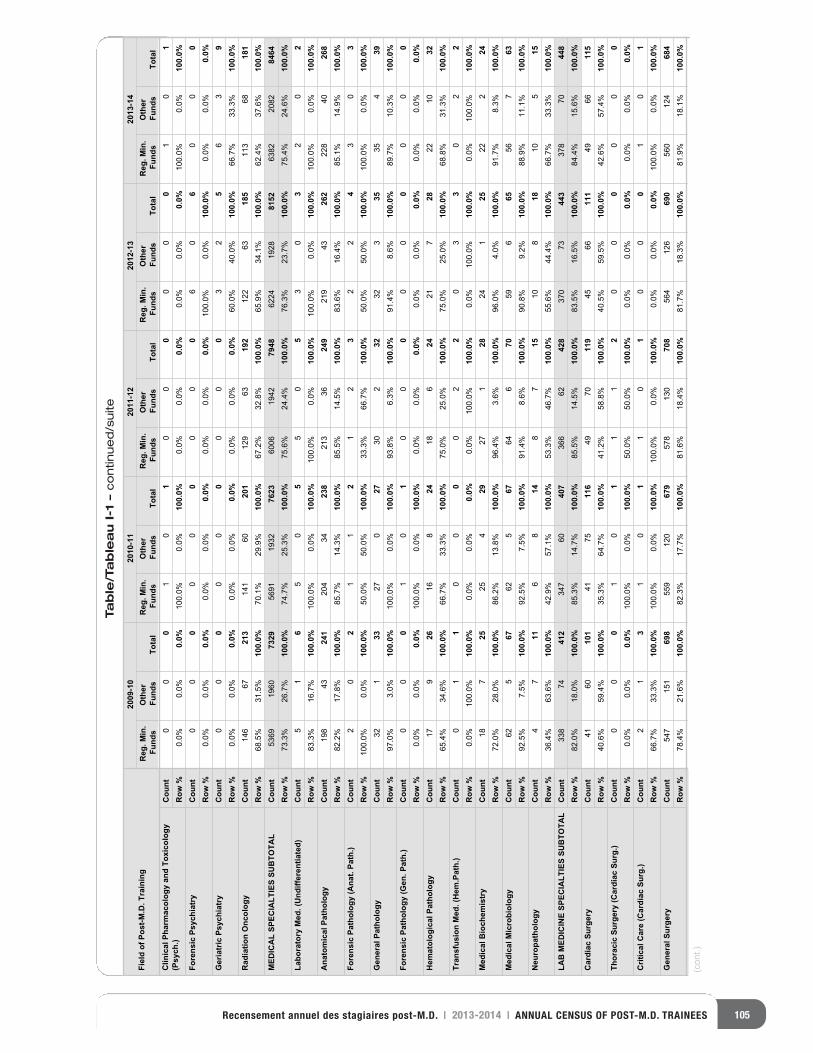
Table/Tableau I-1 –continued/suite
105Recensement annuel des stagiaires post-M.D. | 2013-2014 | ANNUAL CENSUS OF POST-M.D. TRAINEES
Fiel
d of
Pos
t-M.D
. Tra
inin
g20
09-1
020
10-1
120
11-1
220
12-1
320
13-1
4R
eg. M
in.
Fund
sO
ther
Fu
nds
Tota
lR
eg. M
in.
Fund
sO
ther
Fu
nds
Tota
lR
eg. M
in.
Fund
sO
ther
Fu
nds
Tota
lR
eg. M
in.
Fund
sO
ther
Fu
nds
Tota
lR
eg. M
in.
Fund
sO
ther
Fu
nds
Tota
lC
linic
al P
harm
acol
ogy
and
Toxi
colo
gy
(Psy
ch.)
Cou
ntR
ow %
Fore
nsic
Psy
chia
try
Cou
ntR
ow %
Ger
iatr
ic P
sych
iatr
yC
ount
Row
%R
adia
tion
Onc
olog
yC
ount
Row
%M
EDIC
AL
SPEC
IALT
IES
SUB
TOTA
LC
ount
Row
%La
bora
tory
Med
. (U
ndiff
eren
tiate
d)C
ount
Row
%A
nato
mic
al P
atho
logy
Cou
ntR
ow %
Fore
nsic
Pat
holo
gy (A
nat.
Path
.)C
ount
Row
%G
ener
al P
atho
logy
Cou
ntR
ow %
Fore
nsic
Pat
holo
gy (G
en. P
ath.
)C
ount
Row
%H
emat
olog
ical
Pat
holo
gyC
ount
Row
%Tr
ansf
usio
n M
ed. (
Hem
.Pat
h.)
Cou
ntR
ow %
Med
ical
Bio
chem
istr
yC
ount
Row
%M
edic
al M
icro
biol
ogy
Cou
ntR
ow %
Neu
ropa
thol
ogy
Cou
ntR
ow %
LAB
MED
ICIN
E SP
ECIA
LTIE
S SU
BTO
TAL
Cou
ntR
ow %
Car
diac
Sur
gery
Cou
ntR
ow %
Thor
acic
Sur
gery
(Car
diac
Sur
g.)
Cou
ntR
ow %
Crit
ical
Car
e (C
ardi
ac S
urg.
)C
ount
Row
%G
ener
al S
urge
ryC
ount
Row
%
00
01
01
00
00
00
10
10.0%
0.0%
0.0%
100.0%
0.0%
100.
0%0.0%
0.0%
0.0%
0.0%
0.0%
0.0%
100.0%
0.0%
100.
0%0
00
00
00
00
60
60
00
0.0%
0.0%
0.0%
0.0%
0.0%
0.0%
0.0%
0.0%
0.0%
100.0%
0.0%
100.
0%0.0%
0.0%
0.0%
00
00
00
00
03
25
63
90.0%
0.0%
0.0%
0.0%
0.0%
0.0%
0.0%
0.0%
0.0%
60.0%
40.0%
100.
0%66.7%
33.3%
100.
0%146
6721
3141
6020
1129
6319
2122
6318
5113
6818
168.5%
31.5%
100.
0%70.1%
29.9%
100.
0%67.2%
32.8%
100.
0%65.9%
34.1%
100.
0%62.4%
37.6%
100.
0%5369
1960
7329
5691
1932
7623
6006
1942
7948
6224
1928
8152
6382
2082
8464
73.3%
26.7%
100.
0%74.7%
25.3%
100.
0%75.6%
24.4%
100.
0%76.3%
23.7%
100.
0%75.4%
24.6%
100.
0%5
16
50
55
05
30
32
02
83.3%
16.7%
100.
0%100.0%
0.0%
100.
0%100.0%
0.0%
100.
0%100.0%
0.0%
100.
0%100.0%
0.0%
100.
0%198
4324
1204
3423
8213
3624
9219
4326
2228
4026
882.2%
17.8%
100.
0%85.7%
14.3%
100.
0%85.5%
14.5%
100.
0%83.6%
16.4%
100.
0%85.1%
14.9%
100.
0%2
02
11
21
23
22
43
03
100.0%
0.0%
100.
0%50.0%
50.0%
100.
0%33.3%
66.7%
100.
0%50.0%
50.0%
100.
0%100.0%
0.0%
100.
0%32
133
270
2730
232
323
3535
439
97.0%
3.0%
100.
0%100.0%
0.0%
100.
0%93.8%
6.3%
100.
0%91.4%
8.6%
100.
0%89.7%
10.3%
100.
0%0
00
10
10
00
00
00
00
0.0%
0.0%
0.0%
100.0%
0.0%
100.
0%0.0%
0.0%
0.0%
0.0%
0.0%
0.0%
0.0%
0.0%
0.0%
179
2616
824
186
2421
728
2210
3265.4%
34.6%
100.
0%66.7%
33.3%
100.
0%75.0%
25.0%
100.
0%75.0%
25.0%
100.
0%68.8%
31.3%
100.
0%0
11
00
00
22
03
30
22
0.0%
100.0%
100.
0%0.0%
0.0%
0.0%
0.0%
100.0%
100.
0%0.0%
100.0%
100.
0%0.0%
100.0%
100.
0%18
725
254
2927
128
241
2522
224
72.0%
28.0%
100.
0%86.2%
13.8%
100.
0%96.4%
3.6%
100.
0%96.0%
4.0%
100.
0%91.7%
8.3%
100.
0%62
567
625
6764
670
596
6556
763
92.5%
7.5%
100.
0%92.5%
7.5%
100.
0%91.4%
8.6%
100.
0%90.8%
9.2%
100.
0%88.9%
11.1%
100.
0%4
711
68
148
715
108
1810
515
36.4%
63.6%
100.
0%42.9%
57.1%
100.
0%53.3%
46.7%
100.
0%55.6%
44.4%
100.
0%66.7%
33.3%
100.
0%338
7441
2347
6040
7366
6242
8370
7344
3378
7044
882.0%
18.0%
100.
0%85.3%
14.7%
100.
0%85.5%
14.5%
100.
0%83.5%
16.5%
100.
0%84.4%
15.6%
100.
0%41
6010
141
7511
649
7011
945
6611
149
6611
540.6%
59.4%
100.
0%35.3%
64.7%
100.
0%41.2%
58.8%
100.
0%40.5%
59.5%
100.
0%42.6%
57.4%
100.
0%0
00
10
11
12
00
00
00
0.0%
0.0%
0.0%
100.0%
0.0%
100.
0%50.0%
50.0%
100.
0%0.0%
0.0%
0.0%
0.0%
0.0%
0.0%
21
31
01
10
10
00
10
166.7%
33.3%
100.
0%100.0%
0.0%
100.
0%100.0%
0.0%
100.
0%0.0%
0.0%
0.0%
100.0%
0.0%
100.
0%547
151
698
559
120
679
578
130
708
564
126
690
560
124
684
78.4%
21.6%
100.
0%82.3%
17.7%
100.
0%81.6%
18.4%
100.
0%81.7%
18.3%
100.
0%81.9%
18.1%
100.
0%
(cont.)
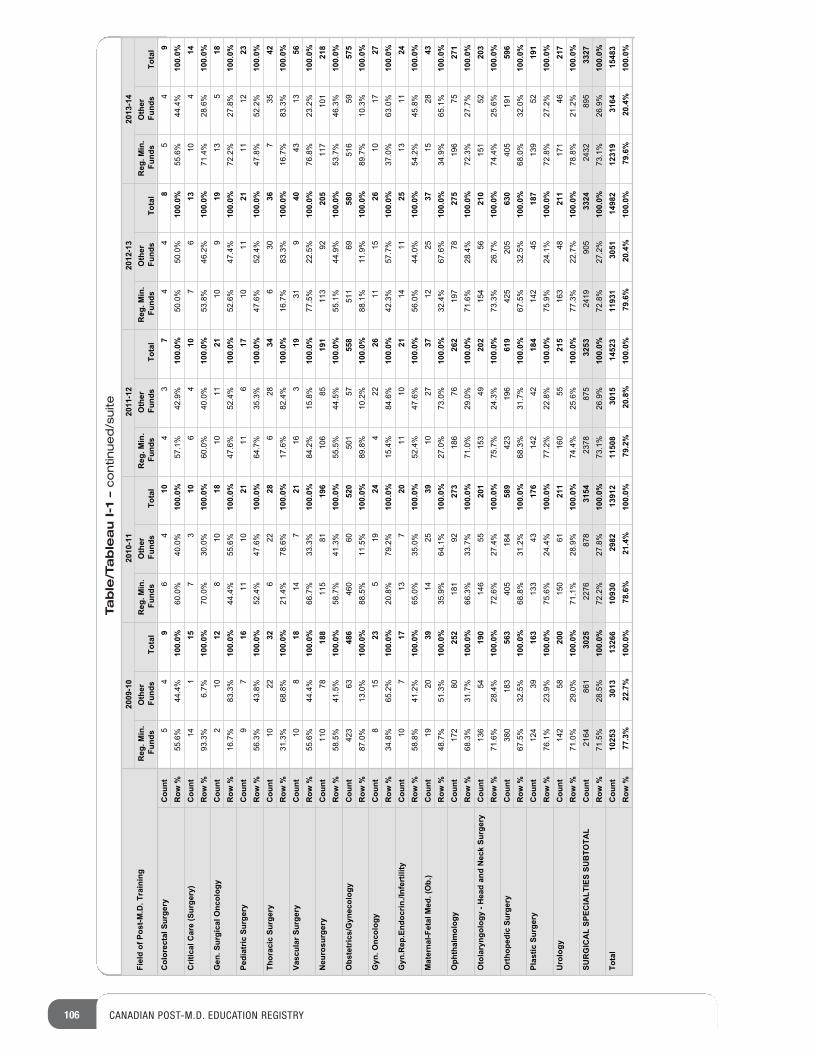
106 CANADIAN POST-M.D. EDUCATION REGISTRY
Table/Tableau I-1 –continued/suite
Fiel
d of
Pos
t-M.D
. Tra
inin
g20
09-1
020
10-1
120
11-1
220
12-1
320
13-1
4R
eg. M
in.
Fund
sO
ther
Fu
nds
Tota
lR
eg. M
in.
Fund
sO
ther
Fu
nds
Tota
lR
eg. M
in.
Fund
sO
ther
Fu
nds
Tota
lR
eg. M
in.
Fund
sO
ther
Fu
nds
Tota
lR
eg. M
in.
Fund
sO
ther
Fu
nds
Tota
lC
olor
ecta
l Sur
gery
Cou
ntR
ow %
Crit
ical
Car
e (S
urge
ry)
Cou
ntR
ow %
Gen
. Sur
gica
l Onc
olog
yC
ount
Row
%Pe
diat
ric S
urge
ryC
ount
Row
%Th
orac
ic S
urge
ryC
ount
Row
%Va
scul
ar S
urge
ryC
ount
Row
%N
euro
surg
ery
Cou
ntR
ow %
Obs
tetr
ics/
Gyn
ecol
ogy
Cou
ntR
ow %
Gyn
. Onc
olog
yC
ount
Row
%G
yn.R
ep.E
ndoc
rin./I
nfer
tility
Cou
ntR
ow %
Mat
erna
l-Fet
al M
ed. (
Ob.
)C
ount
Row
%O
phth
alm
olog
yC
ount
Row
%O
tola
ryng
olog
y - H
ead
and
Nec
k Su
rger
yC
ount
Row
%O
rtho
pedi
c Su
rger
yC
ount
Row
%Pl
astic
Sur
gery
Cou
ntR
ow %
Uro
logy
Cou
ntR
ow %
SUR
GIC
AL
SPEC
IALT
IES
SUB
TOTA
LC
ount
Row
%To
tal
Cou
ntR
ow %
54
96
410
43
74
48
54
955.6%
44.4%
100.
0%60.0%
40.0%
100.
0%57.1%
42.9%
100.
0%50.0%
50.0%
100.
0%55.6%
44.4%
100.
0%14
115
73
106
410
76
1310
414
93.3%
6.7%
100.
0%70.0%
30.0%
100.
0%60.0%
40.0%
100.
0%53.8%
46.2%
100.
0%71.4%
28.6%
100.
0%2
1012
810
1810
1121
109
1913
518
16.7%
83.3%
100.
0%44.4%
55.6%
100.
0%47.6%
52.4%
100.
0%52.6%
47.4%
100.
0%72.2%
27.8%
100.
0%9
716
1110
2111
617
1011
2111
1223
56.3%
43.8%
100.
0%52.4%
47.6%
100.
0%64.7%
35.3%
100.
0%47.6%
52.4%
100.
0%47.8%
52.2%
100.
0%10
2232
622
286
2834
630
367
3542
31.3%
68.8%
100.
0%21.4%
78.6%
100.
0%17.6%
82.4%
100.
0%16.7%
83.3%
100.
0%16.7%
83.3%
100.
0%10
818
147
2116
319
319
4043
1356
55.6%
44.4%
100.
0%66.7%
33.3%
100.
0%84.2%
15.8%
100.
0%77.5%
22.5%
100.
0%76.8%
23.2%
100.
0%110
7818
8115
8119
6106
8519
1113
9220
5117
101
218
58.5%
41.5%
100.
0%58.7%
41.3%
100.
0%55.5%
44.5%
100.
0%55.1%
44.9%
100.
0%53.7%
46.3%
100.
0%423
6348
6460
6052
0501
5755
8511
6958
0516
5957
587.0%
13.0%
100.
0%88.5%
11.5%
100.
0%89.8%
10.2%
100.
0%88.1%
11.9%
100.
0%89.7%
10.3%
100.
0%8
1523
519
244
2226
1115
2610
1727
34.8%
65.2%
100.
0%20.8%
79.2%
100.
0%15.4%
84.6%
100.
0%42.3%
57.7%
100.
0%37.0%
63.0%
100.
0%10
717
137
2011
1021
1411
2513
1124
58.8%
41.2%
100.
0%65.0%
35.0%
100.
0%52.4%
47.6%
100.
0%56.0%
44.0%
100.
0%54.2%
45.8%
100.
0%19
2039
1425
3910
2737
1225
3715
2843
48.7%
51.3%
100.
0%35.9%
64.1%
100.
0%27.0%
73.0%
100.
0%32.4%
67.6%
100.
0%34.9%
65.1%
100.
0%172
8025
2181
9227
3186
7626
2197
7827
5196
7527
168.3%
31.7%
100.
0%66.3%
33.7%
100.
0%71.0%
29.0%
100.
0%71.6%
28.4%
100.
0%72.3%
27.7%
100.
0%136
5419
0146
5520
1153
4920
2154
5621
0151
5220
371.6%
28.4%
100.
0%72.6%
27.4%
100.
0%75.7%
24.3%
100.
0%73.3%
26.7%
100.
0%74.4%
25.6%
100.
0%380
183
563
405
184
589
423
196
619
425
205
630
405
191
596
67.5%
32.5%
100.
0%68.8%
31.2%
100.
0%68.3%
31.7%
100.
0%67.5%
32.5%
100.
0%68.0%
32.0%
100.
0%124
3916
3133
4317
6142
4218
4142
4518
7139
5219
176.1%
23.9%
100.
0%75.6%
24.4%
100.
0%77.2%
22.8%
100.
0%75.9%
24.1%
100.
0%72.8%
27.2%
100.
0%142
5820
0150
6121
1160
5521
5163
4821
1171
4621
771.0%
29.0%
100.
0%71.1%
28.9%
100.
0%74.4%
25.6%
100.
0%77.3%
22.7%
100.
0%78.8%
21.2%
100.
0%2164
861
3025
2276
878
3154
2378
875
3253
2419
905
3324
2432
895
3327
71.5%
28.5%
100.
0%72.2%
27.8%
100.
0%73.1%
26.9%
100.
0%72.8%
27.2%
100.
0%73.1%
26.9%
100.
0%10
253
3013
1326
610
930
2982
1391
211
508
3015
1452
311
931
3051
1498
212
319
3164
1548
377
.3%
22.7
%10
0.0%
78.6
%21
.4%
100.
0%79
.2%
20.8
%10
0.0%
79.6
%20
.4%
100.
0%79
.6%
20.4
%10
0.0%
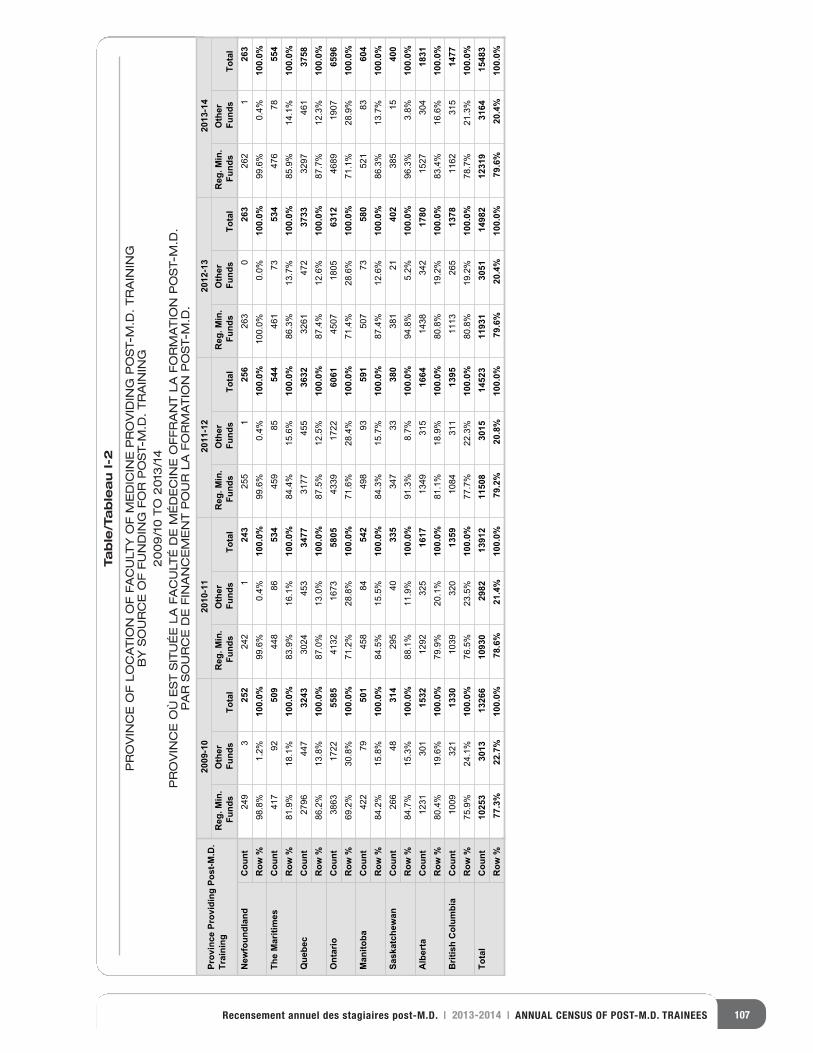
107Recensement annuel des stagiaires post-M.D. | 2013-2014 | ANNUAL CENSUS OF POST-M.D. TRAINEES
Table/Tableau I-2
PROVINCE OF LOCATION OF FACULTY OF MEDICINE PROVIDING POST-M.D. TRAINING
BY SOURCE OF FUNDING FOR POST-M.D. TRAINING
2009/10 TO 2013/14
PROVINCE OÙ EST SITUÉE LA FACULTÉ DE MÉDECINE OFFRANT LA FORMATION POST-M.D.
PAR SOURCE DE FINANCEMENT POUR LA FORMATION POST-M.D.
Prov
ince
Pro
vidi
ng P
ost-M
.D.
Trai
ning
2009
-10
2010
-11
2011
-12
2012
-13
2013
-14
Reg
. Min
. Fu
nds
Oth
er
Fund
sTo
tal
Reg
. Min
. Fu
nds
Oth
er
Fund
sTo
tal
Reg
. Min
. Fu
nds
Oth
er
Fund
sTo
tal
Reg
. Min
. Fu
nds
Oth
er
Fund
sTo
tal
Reg
. Min
. Fu
nds
Oth
er
Fund
sTo
tal
New
foun
dlan
dC
ount
Row
%Th
e M
ariti
mes
Cou
ntR
ow %
Que
bec
Cou
ntR
ow %
Ont
ario
Cou
ntR
ow %
Man
itoba
Cou
ntR
ow %
Sask
atch
ewan
Cou
ntR
ow %
Alb
erta
Cou
ntR
ow %
Brit
ish
Col
umbi
aC
ount
Row
%To
tal
Cou
ntR
ow %
249
325
2242
124
3255
125
6263
026
3262
126
398.8%
1.2%
100.
0%99.6%
0.4%
100.
0%99.6%
0.4%
100.
0%100.0%
0.0%
100.
0%99.6%
0.4%
100.
0%417
9250
9448
8653
4459
8554
4461
7353
4476
7855
481.9%
18.1%
100.
0%83.9%
16.1%
100.
0%84.4%
15.6%
100.
0%86.3%
13.7%
100.
0%85.9%
14.1%
100.
0%2796
447
3243
3024
453
3477
3177
455
3632
3261
472
3733
3297
461
3758
86.2%
13.8%
100.
0%87.0%
13.0%
100.
0%87.5%
12.5%
100.
0%87.4%
12.6%
100.
0%87.7%
12.3%
100.
0%3863
1722
5585
4132
1673
5805
4339
1722
6061
4507
1805
6312
4689
1907
6596
69.2%
30.8%
100.
0%71.2%
28.8%
100.
0%71.6%
28.4%
100.
0%71.4%
28.6%
100.
0%71.1%
28.9%
100.
0%422
7950
1458
8454
2498
9359
1507
7358
0521
8360
484.2%
15.8%
100.
0%84.5%
15.5%
100.
0%84.3%
15.7%
100.
0%87.4%
12.6%
100.
0%86.3%
13.7%
100.
0%266
4831
4295
4033
5347
3338
0381
2140
2385
1540
084.7%
15.3%
100.
0%88.1%
11.9%
100.
0%91.3%
8.7%
100.
0%94.8%
5.2%
100.
0%96.3%
3.8%
100.
0%1231
301
1532
1292
325
1617
1349
315
1664
1438
342
1780
1527
304
1831
80.4%
19.6%
100.
0%79.9%
20.1%
100.
0%81.1%
18.9%
100.
0%80.8%
19.2%
100.
0%83.4%
16.6%
100.
0%1009
321
1330
1039
320
1359
1084
311
1395
1113
265
1378
1162
315
1477
75.9%
24.1%
100.
0%76.5%
23.5%
100.
0%77.7%
22.3%
100.
0%80.8%
19.2%
100.
0%78.7%
21.3%
100.
0%10
253
3013
1326
610
930
2982
1391
211
508
3015
1452
311
931
3051
1498
212
319
3164
1548
377
.3%
22.7
%10
0.0%
78.6
%21
.4%
100.
0%79
.2%
20.8
%10
0.0%
79.6
%20
.4%
100.
0%79
.6%
20.4
%10
0.0%
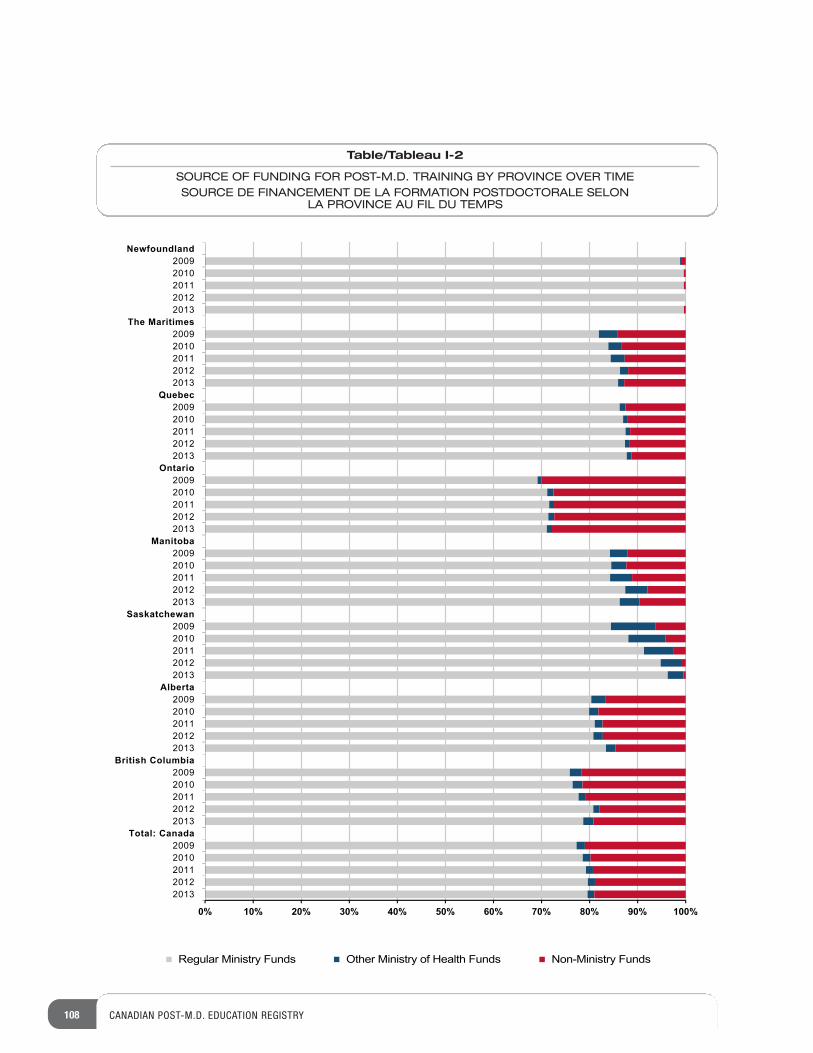
108 CANADIAN POST-M.D. EDUCATION REGISTRY
0% 10% 20% 30% 40% 50% 60% 70% 80% 90% 100%
20132012201120102009
Total: Canada20132012201120102009
British Columbia20132012201120102009
Alberta20132012201120102009
Saskatchewan20132012201120102009
Manitoba20132012201120102009
Ontario20132012201120102009
Quebec20132012201120102009
The Maritimes20132012201120102009
Newfoundland
Regular Ministry Funds Other Ministry of Health Funds Non-Ministry Funds
Table/Tableau I-2
SOURCE OF FUNDING FOR POST-M.D. TRAINING BY PROVINCE OVER TIMESOURCE DE FINANCEMENT DE LA FORMATION POSTDOCTORALE SELON
LA PROVINCE AU FIL DU TEMPS
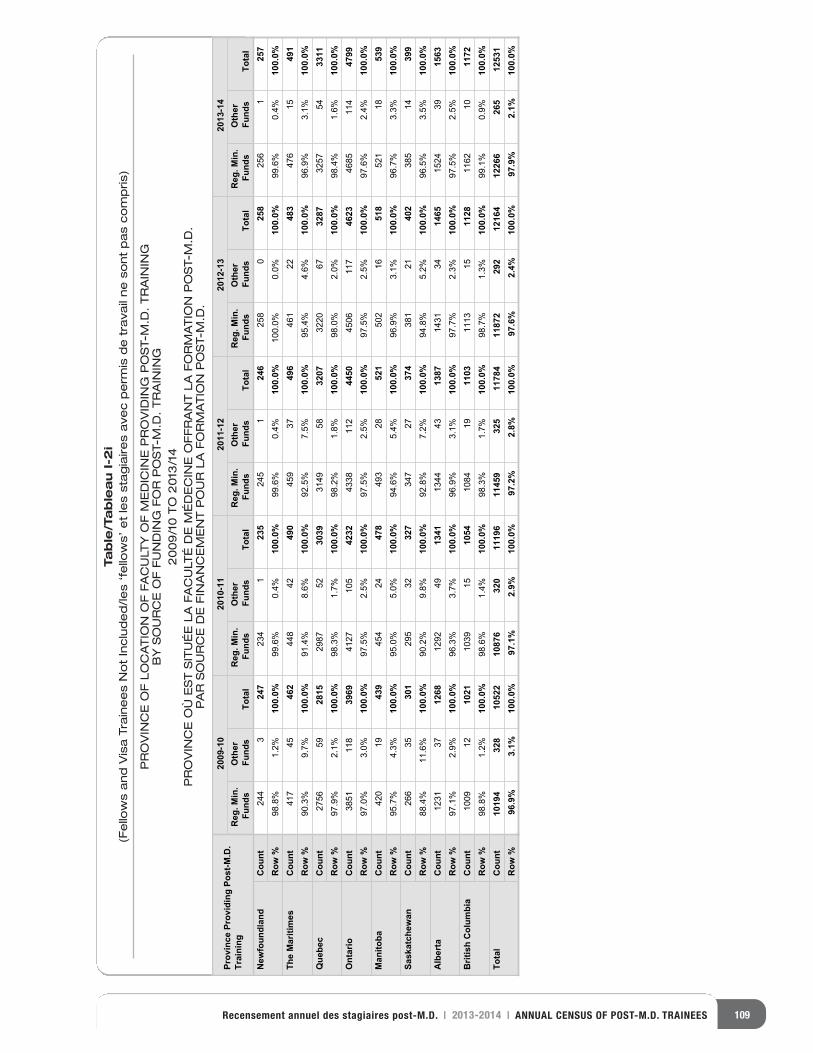
109Recensement annuel des stagiaires post-M.D. | 2013-2014 | ANNUAL CENSUS OF POST-M.D. TRAINEES
Table/Tableau I-2i
(Fellows and Visa Trainees Not Included/les ‘fellows’ et les stagiaires avec permis de travail ne sont pas compris)
PROVINCE OF LOCATION OF FACULTY OF MEDICINE PROVIDING POST-M.D. TRAINING
BY SOURCE OF FUNDING FOR POST-M.D. TRAINING
2009/10 TO 2013/14
PROVINCE OÙ EST SITUÉE LA FACULTÉ DE MÉDECINE OFFRANT LA FORMATION POST-M.D.
PAR SOURCE DE FINANCEMENT POUR LA FORMATION POST-M.D.
Prov
ince
Pro
vidi
ng P
ost-M
.D.
Trai
ning
2009
-10
2010
-11
2011
-12
2012
-13
2013
-14
Reg
. Min
. Fu
nds
Oth
er
Fund
sTo
tal
Reg
. Min
. Fu
nds
Oth
er
Fund
sTo
tal
Reg
. Min
. Fu
nds
Oth
er
Fund
sTo
tal
Reg
. Min
. Fu
nds
Oth
er
Fund
sTo
tal
Reg
. Min
. Fu
nds
Oth
er
Fund
sTo
tal
New
foun
dlan
dC
ount
Row
%Th
e M
ariti
mes
Cou
ntR
ow %
Que
bec
Cou
ntR
ow %
Ont
ario
Cou
ntR
ow %
Man
itoba
Cou
ntR
ow %
Sask
atch
ewan
Cou
ntR
ow %
Alb
erta
Cou
ntR
ow %
Brit
ish
Col
umbi
aC
ount
Row
%To
tal
Cou
ntR
ow %
244
324
7234
123
5245
124
6258
025
8256
125
798.8%
1.2%
100.
0%99.6%
0.4%
100.
0%99.6%
0.4%
100.
0%100.0%
0.0%
100.
0%99.6%
0.4%
100.
0%417
4546
2448
4249
0459
3749
6461
2248
3476
1549
190.3%
9.7%
100.
0%91.4%
8.6%
100.
0%92.5%
7.5%
100.
0%95.4%
4.6%
100.
0%96.9%
3.1%
100.
0%2756
5928
152987
5230
393149
5832
073220
6732
873257
5433
1197.9%
2.1%
100.
0%98.3%
1.7%
100.
0%98.2%
1.8%
100.
0%98.0%
2.0%
100.
0%98.4%
1.6%
100.
0%3851
118
3969
4127
105
4232
4338
112
4450
4506
117
4623
4685
114
4799
97.0%
3.0%
100.
0%97.5%
2.5%
100.
0%97.5%
2.5%
100.
0%97.5%
2.5%
100.
0%97.6%
2.4%
100.
0%420
1943
9454
2447
8493
2852
1502
1651
8521
1853
995.7%
4.3%
100.
0%95.0%
5.0%
100.
0%94.6%
5.4%
100.
0%96.9%
3.1%
100.
0%96.7%
3.3%
100.
0%266
3530
1295
3232
7347
2737
4381
2140
2385
1439
988.4%
11.6%
100.
0%90.2%
9.8%
100.
0%92.8%
7.2%
100.
0%94.8%
5.2%
100.
0%96.5%
3.5%
100.
0%1231
3712
681292
4913
411344
4313
871431
3414
651524
3915
6397.1%
2.9%
100.
0%96.3%
3.7%
100.
0%96.9%
3.1%
100.
0%97.7%
2.3%
100.
0%97.5%
2.5%
100.
0%1009
1210
211039
1510
541084
1911
031113
1511
281162
1011
7298.8%
1.2%
100.
0%98.6%
1.4%
100.
0%98.3%
1.7%
100.
0%98.7%
1.3%
100.
0%99.1%
0.9%
100.
0%10
194
328
1052
210
876
320
1119
611
459
325
1178
411
872
292
1216
412
266
265
1253
196
.9%
3.1%
100.
0%97
.1%
2.9%
100.
0%97
.2%
2.8%
100.
0%97
.6%
2.4%
100.
0%97
.9%
2.1%
100.
0%
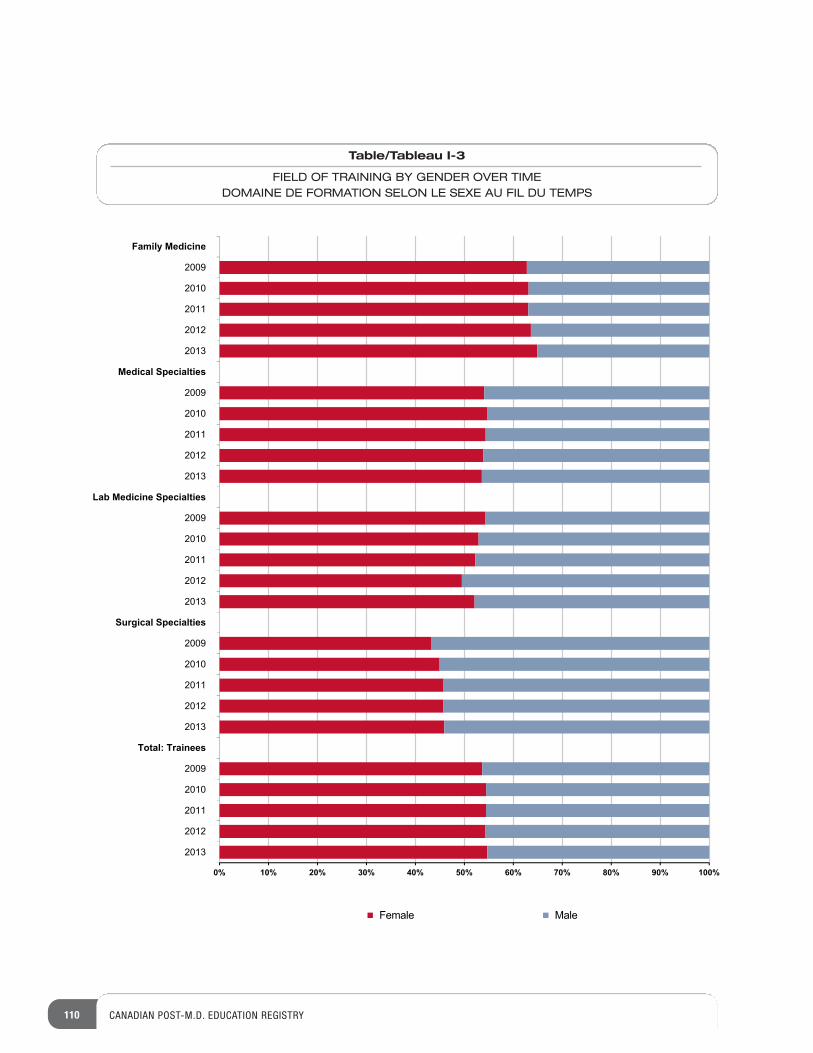
110 CANADIAN POST-M.D. EDUCATION REGISTRY
0% 10% 20% 30% 40% 50% 60% 70% 80% 90% 100%
2013
2012
2011
2010
2009
Total: Trainees
2013
2012
2011
2010
2009
Surgical Specialties
2013
2012
2011
2010
2009
Lab Medicine Specialties
2013
2012
2011
2010
2009
Medical Specialties
2013
2012
2011
2010
2009
Family Medicine
Female Male
Table/Tableau I-3
FIELD OF TRAINING BY GENDER OVER TIMEDOMAINE DE FORMATION SELON LE SEXE AU FIL DU TEMPS
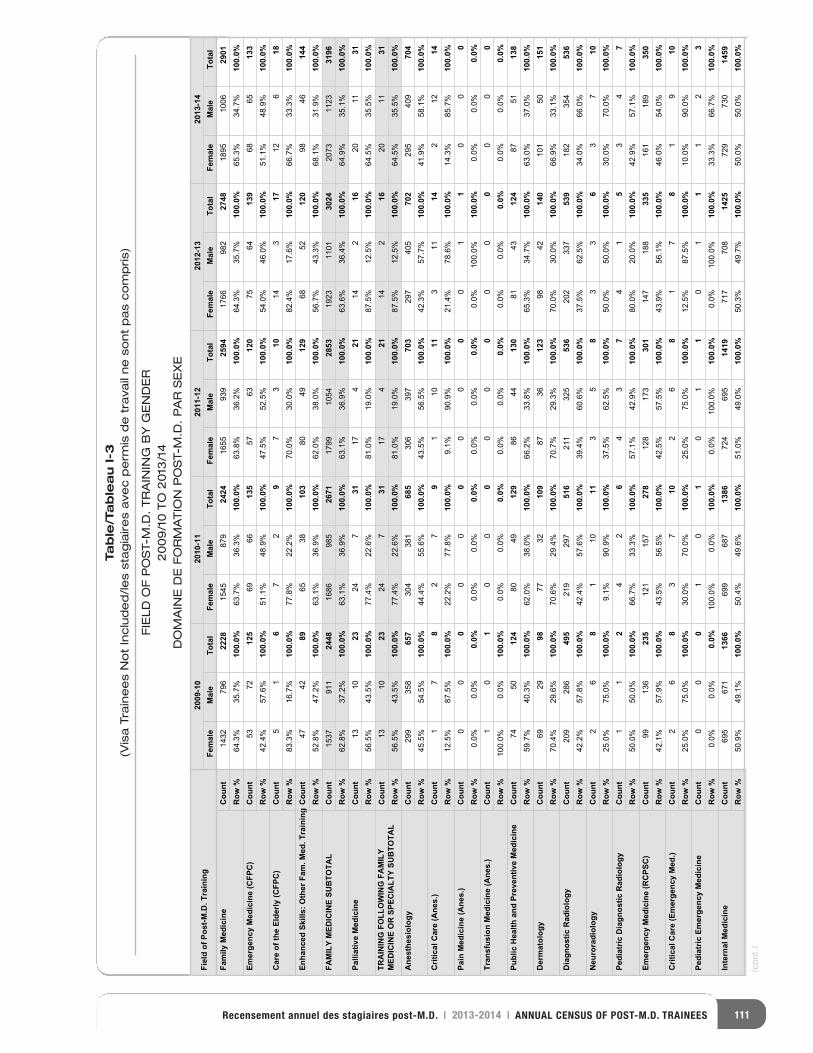
111Recensement annuel des stagiaires post-M.D. | 2013-2014 | ANNUAL CENSUS OF POST-M.D. TRAINEES
Table/Tableau I-3
(Visa Trainees Not Included/les stagiaires avec permis de travail ne sont pas compris)
FIELD OF POST-M.D. TRAINING BY GENDER
2009/10 TO 2013/14
DOMAINE DE FORMATION POST-M.D. PAR SEXE
Fiel
d of
Pos
t-M.D
. Tra
inin
g20
09-1
020
10-1
120
11-1
220
12-1
320
13-1
4Fe
mal
eM
ale
Tota
lFe
mal
eM
ale
Tota
lFe
mal
eM
ale
Tota
lFe
mal
eM
ale
Tota
lFe
mal
eM
ale
Tota
lFa
mily
Med
icin
eC
ount
Row
%Em
erge
ncy
Med
icin
e (C
FPC
)C
ount
Row
%C
are
of th
e El
derly
(CFP
C)
Cou
ntR
ow %
Enha
nced
Ski
lls: O
ther
Fam
. Med
. Tra
inin
gC
ount
Row
%FA
MIL
Y M
EDIC
INE
SUB
TOTA
LC
ount
Row
%Pa
lliat
ive
Med
icin
eC
ount
Row
%TR
AIN
ING
FO
LLO
WIN
G F
AM
ILY
MED
ICIN
E O
R S
PEC
IALT
Y SU
BTO
TAL
Cou
ntR
ow %
Ane
sthe
siol
ogy
Cou
ntR
ow %
Crit
ical
Car
e (A
nes.
)C
ount
Row
%Pa
in M
edic
ine
(Ane
s.)
Cou
ntR
ow %
Tran
sfus
ion
Med
icin
e (A
nes.
)C
ount
Row
%Pu
blic
Hea
lth a
nd P
reve
ntiv
e M
edic
ine
Cou
ntR
ow %
Der
mat
olog
yC
ount
Row
%D
iagn
ostic
Rad
iolo
gyC
ount
Row
%N
euro
radi
olog
yC
ount
Row
%Pe
diat
ric D
iagn
ostic
Rad
iolo
gyC
ount
Row
%Em
erge
ncy
Med
icin
e (R
CPS
C)
Cou
ntR
ow %
Crit
ical
Car
e (E
mer
genc
y M
ed.)
Cou
ntR
ow %
Pedi
atric
Em
erge
ncy
Med
icin
eC
ount
Row
%In
tern
al M
edic
ine
Cou
ntR
ow %
1432
796
2228
1545
879
2424
1655
939
2594
1766
982
2748
1895
1006
2901
64.3%
35.7%
100.
0%63.7%
36.3%
100.
0%63.8%
36.2%
100.
0%64.3%
35.7%
100.
0%65.3%
34.7%
100.
0%53
7212
569
6613
557
6312
075
6413
968
6513
342.4%
57.6%
100.
0%51.1%
48.9%
100.
0%47.5%
52.5%
100.
0%54.0%
46.0%
100.
0%51.1%
48.9%
100.
0%5
16
72
97
310
143
1712
618
83.3%
16.7%
100.
0%77.8%
22.2%
100.
0%70.0%
30.0%
100.
0%82.4%
17.6%
100.
0%66.7%
33.3%
100.
0%47
4289
6538
103
8049
129
6852
120
9846
144
52.8%
47.2%
100.
0%63.1%
36.9%
100.
0%62.0%
38.0%
100.
0%56.7%
43.3%
100.
0%68.1%
31.9%
100.
0%1537
911
2448
1686
985
2671
1799
1054
2853
1923
1101
3024
2073
1123
3196
62.8%
37.2%
100.
0%63.1%
36.9%
100.
0%63.1%
36.9%
100.
0%63.6%
36.4%
100.
0%64.9%
35.1%
100.
0%13
1023
247
3117
421
142
1620
1131
56.5%
43.5%
100.
0%77.4%
22.6%
100.
0%81.0%
19.0%
100.
0%87.5%
12.5%
100.
0%64.5%
35.5%
100.
0%13
1023
247
3117
421
142
1620
1131
56.5%
43.5%
100.
0%77.4%
22.6%
100.
0%81.0%
19.0%
100.
0%87.5%
12.5%
100.
0%64.5%
35.5%
100.
0%299
358
657
304
381
685
306
397
703
297
405
702
295
409
704
45.5%
54.5%
100.
0%44.4%
55.6%
100.
0%43.5%
56.5%
100.
0%42.3%
57.7%
100.
0%41.9%
58.1%
100.
0%1
78
27
91
1011
311
142
1214
12.5%
87.5%
100.
0%22.2%
77.8%
100.
0%9.1%
90.9%
100.
0%21.4%
78.6%
100.
0%14.3%
85.7%
100.
0%0
00
00
00
00
01
10
00
0.0%
0.0%
0.0%
0.0%
0.0%
0.0%
0.0%
0.0%
0.0%
0.0%
100.0%
100.
0%0.0%
0.0%
0.0%
10
10
00
00
00
00
00
0100.0%
0.0%
100.
0%0.0%
0.0%
0.0%
0.0%
0.0%
0.0%
0.0%
0.0%
0.0%
0.0%
0.0%
0.0%
7450
124
8049
129
8644
130
8143
124
8751
138
59.7%
40.3%
100.
0%62.0%
38.0%
100.
0%66.2%
33.8%
100.
0%65.3%
34.7%
100.
0%63.0%
37.0%
100.
0%69
2998
7732
109
8736
123
9842
140
101
5015
170.4%
29.6%
100.
0%70.6%
29.4%
100.
0%70.7%
29.3%
100.
0%70.0%
30.0%
100.
0%66.9%
33.1%
100.
0%209
286
495
219
297
516
211
325
536
202
337
539
182
354
536
42.2%
57.8%
100.
0%42.4%
57.6%
100.
0%39.4%
60.6%
100.
0%37.5%
62.5%
100.
0%34.0%
66.0%
100.
0%2
68
110
113
58
33
63
710
25.0%
75.0%
100.
0%9.1%
90.9%
100.
0%37.5%
62.5%
100.
0%50.0%
50.0%
100.
0%30.0%
70.0%
100.
0%1
12
42
64
37
41
53
47
50.0%
50.0%
100.
0%66.7%
33.3%
100.
0%57.1%
42.9%
100.
0%80.0%
20.0%
100.
0%42.9%
57.1%
100.
0%99
136
235
121
157
278
128
173
301
147
188
335
161
189
350
42.1%
57.9%
100.
0%43.5%
56.5%
100.
0%42.5%
57.5%
100.
0%43.9%
56.1%
100.
0%46.0%
54.0%
100.
0%2
68
37
102
68
17
81
910
25.0%
75.0%
100.
0%30.0%
70.0%
100.
0%25.0%
75.0%
100.
0%12.5%
87.5%
100.
0%10.0%
90.0%
100.
0%0
00
10
10
11
01
11
23
0.0%
0.0%
0.0%
100.0%
0.0%
100.
0%0.0%
100.0%
100.
0%0.0%
100.0%
100.
0%33.3%
66.7%
100.
0%695
671
1366
699
687
1386
724
695
1419
717
708
1425
729
730
1459
50.9%
49.1%
100.
0%50.4%
49.6%
100.
0%51.0%
49.0%
100.
0%50.3%
49.7%
100.
0%50.0%
50.0%
100.
0%
(cont.)
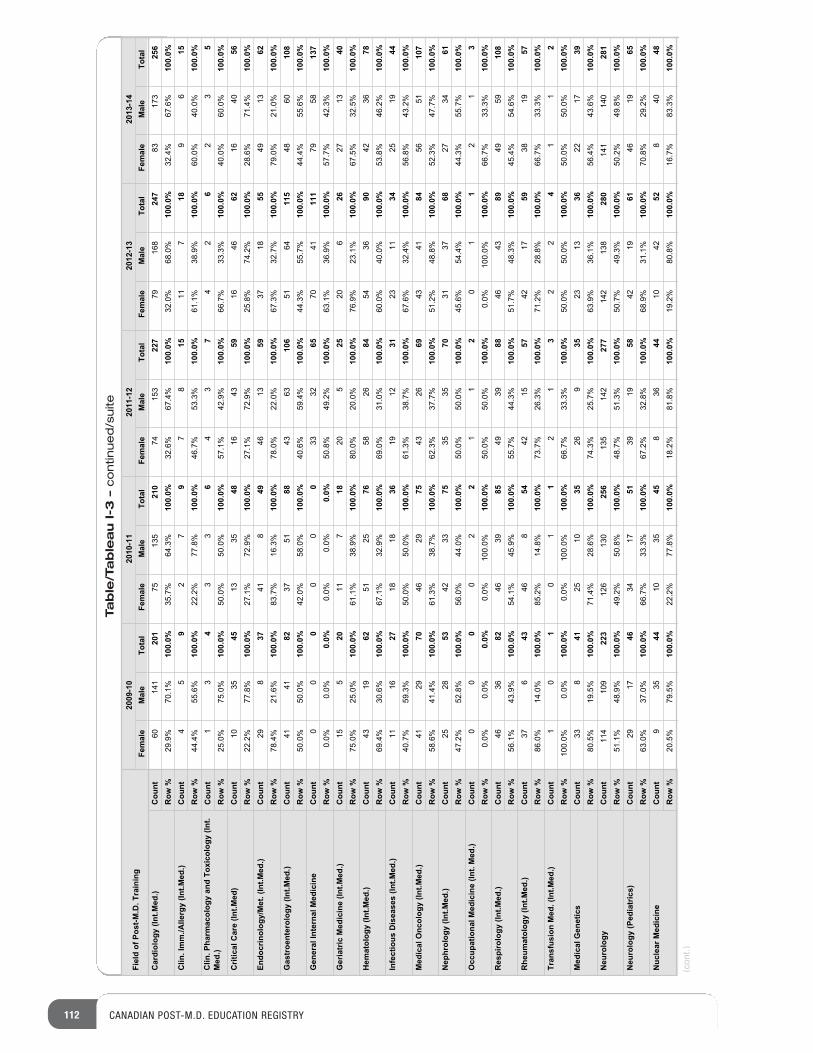
112 CANADIAN POST-M.D. EDUCATION REGISTRY
Table/Tableau I-3 –continued/suite
Fiel
d of
Pos
t-M.D
. Tra
inin
g20
09-1
020
10-1
120
11-1
220
12-1
320
13-1
4Fe
mal
eM
ale
Tota
lFe
mal
eM
ale
Tota
lFe
mal
eM
ale
Tota
lFe
mal
eM
ale
Tota
lFe
mal
eM
ale
Tota
lC
ardi
olog
y (In
t.Med
.)C
ount
Row
%C
lin. I
mm
./Alle
rgy
(Int.M
ed.)
Cou
ntR
ow %
Clin
. Pha
rmac
olog
y an
d To
xico
logy
(Int
.M
ed.)
Cou
ntR
ow %
Crit
ical
Car
e (In
t.Med
)C
ount
Row
%En
docr
inol
ogy/
Met
. (In
t.Med
.)C
ount
Row
%G
astr
oent
erol
ogy
(Int.M
ed.)
Cou
ntR
ow %
Gen
eral
Inte
rnal
Med
icin
eC
ount
Row
%G
eria
tric
Med
icin
e (In
t.Med
.)C
ount
Row
%H
emat
olog
y (In
t.Med
.)C
ount
Row
%In
fect
ious
Dis
ease
s (In
t.Med
.)C
ount
Row
%M
edic
al O
ncol
ogy
(Int.M
ed.)
Cou
ntR
ow %
Nep
hrol
ogy
(Int.M
ed.)
Cou
ntR
ow %
Occ
upat
iona
l Med
icin
e (In
t. M
ed.)
Cou
ntR
ow %
Res
piro
logy
(Int
.Med
.)C
ount
Row
%R
heum
atol
ogy
(Int.M
ed.)
Cou
ntR
ow %
Tran
sfus
ion
Med
. (In
t.Med
.)C
ount
Row
%M
edic
al G
enet
ics
Cou
ntR
ow %
Neu
rolo
gyC
ount
Row
%N
euro
logy
(Ped
iatr
ics)
Cou
ntR
ow %
Nuc
lear
Med
icin
eC
ount
Row
%
60141
201
75135
210
74153
227
79168
247
83173
256
29.9%
70.1%
100.
0%35.7%
64.3%
100.
0%32.6%
67.4%
100.
0%32.0%
68.0%
100.
0%32.4%
67.6%
100.
0%4
59
27
97
815
117
189
615
44.4%
55.6%
100.
0%22.2%
77.8%
100.
0%46.7%
53.3%
100.
0%61.1%
38.9%
100.
0%60.0%
40.0%
100.
0%1
34
33
64
37
42
62
35
25.0%
75.0%
100.
0%50.0%
50.0%
100.
0%57.1%
42.9%
100.
0%66.7%
33.3%
100.
0%40.0%
60.0%
100.
0%10
3545
1335
4816
4359
1646
6216
4056
22.2%
77.8%
100.
0%27.1%
72.9%
100.
0%27.1%
72.9%
100.
0%25.8%
74.2%
100.
0%28.6%
71.4%
100.
0%29
837
418
4946
1359
3718
5549
1362
78.4%
21.6%
100.
0%83.7%
16.3%
100.
0%78.0%
22.0%
100.
0%67.3%
32.7%
100.
0%79.0%
21.0%
100.
0%41
4182
3751
8843
6310
651
6411
548
6010
850.0%
50.0%
100.
0%42.0%
58.0%
100.
0%40.6%
59.4%
100.
0%44.3%
55.7%
100.
0%44.4%
55.6%
100.
0%0
00
00
033
3265
7041
111
7958
137
0.0%
0.0%
0.0%
0.0%
0.0%
0.0%
50.8%
49.2%
100.
0%63.1%
36.9%
100.
0%57.7%
42.3%
100.
0%15
520
117
1820
525
206
2627
1340
75.0%
25.0%
100.
0%61.1%
38.9%
100.
0%80.0%
20.0%
100.
0%76.9%
23.1%
100.
0%67.5%
32.5%
100.
0%43
1962
5125
7658
2684
5436
9042
3678
69.4%
30.6%
100.
0%67.1%
32.9%
100.
0%69.0%
31.0%
100.
0%60.0%
40.0%
100.
0%53.8%
46.2%
100.
0%11
1627
1818
3619
1231
2311
3425
1944
40.7%
59.3%
100.
0%50.0%
50.0%
100.
0%61.3%
38.7%
100.
0%67.6%
32.4%
100.
0%56.8%
43.2%
100.
0%41
2970
4629
7543
2669
4341
8456
5110
758.6%
41.4%
100.
0%61.3%
38.7%
100.
0%62.3%
37.7%
100.
0%51.2%
48.8%
100.
0%52.3%
47.7%
100.
0%25
2853
4233
7535
3570
3137
6827
3461
47.2%
52.8%
100.
0%56.0%
44.0%
100.
0%50.0%
50.0%
100.
0%45.6%
54.4%
100.
0%44.3%
55.7%
100.
0%0
00
02
21
12
01
12
13
0.0%
0.0%
0.0%
0.0%
100.0%
100.
0%50.0%
50.0%
100.
0%0.0%
100.0%
100.
0%66.7%
33.3%
100.
0%46
3682
4639
8549
3988
4643
8949
5910
856.1%
43.9%
100.
0%54.1%
45.9%
100.
0%55.7%
44.3%
100.
0%51.7%
48.3%
100.
0%45.4%
54.6%
100.
0%37
643
468
5442
1557
4217
5938
1957
86.0%
14.0%
100.
0%85.2%
14.8%
100.
0%73.7%
26.3%
100.
0%71.2%
28.8%
100.
0%66.7%
33.3%
100.
0%1
01
01
12
13
22
41
12
100.0%
0.0%
100.
0%0.0%
100.0%
100.
0%66.7%
33.3%
100.
0%50.0%
50.0%
100.
0%50.0%
50.0%
100.
0%33
841
2510
3526
935
2313
3622
1739
80.5%
19.5%
100.
0%71.4%
28.6%
100.
0%74.3%
25.7%
100.
0%63.9%
36.1%
100.
0%56.4%
43.6%
100.
0%114
109
223
126
130
256
135
142
277
142
138
280
141
140
281
51.1%
48.9%
100.
0%49.2%
50.8%
100.
0%48.7%
51.3%
100.
0%50.7%
49.3%
100.
0%50.2%
49.8%
100.
0%29
1746
3417
5139
1958
4219
6146
1965
63.0%
37.0%
100.
0%66.7%
33.3%
100.
0%67.2%
32.8%
100.
0%68.9%
31.1%
100.
0%70.8%
29.2%
100.
0%9
3544
1035
458
3644
1042
528
4048
20.5%
79.5%
100.
0%22.2%
77.8%
100.
0%18.2%
81.8%
100.
0%19.2%
80.8%
100.
0%16.7%
83.3%
100.
0%
(cont.)
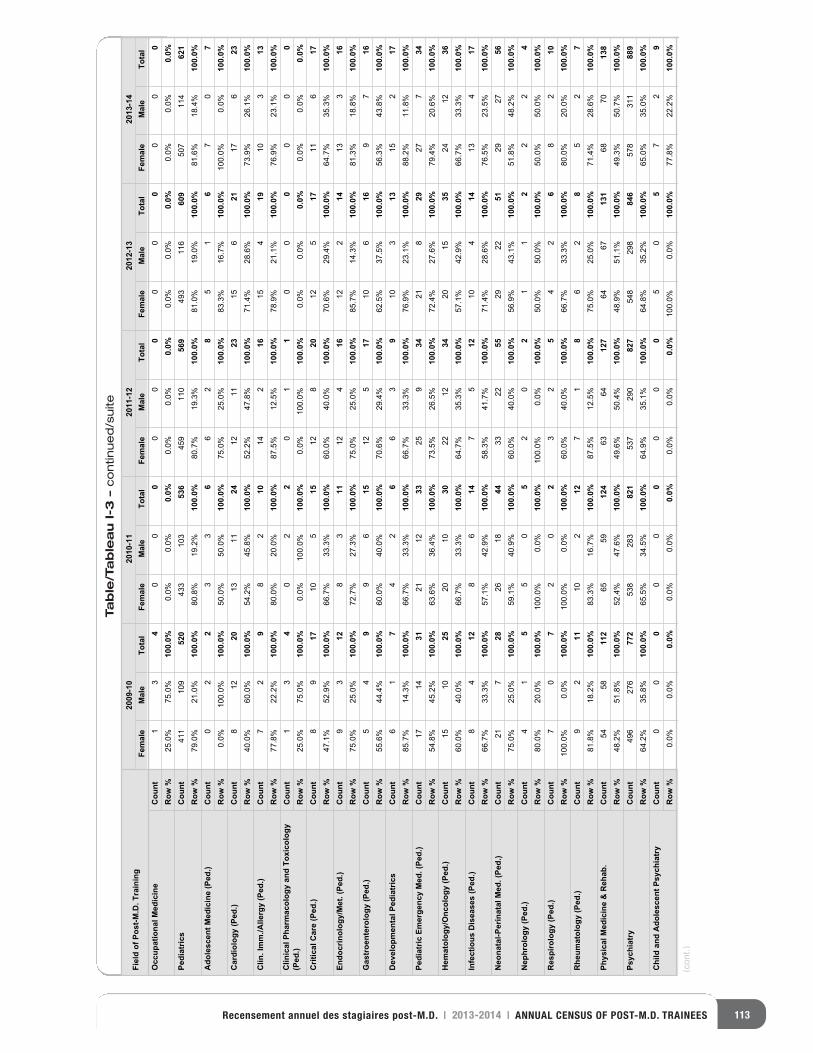
113Recensement annuel des stagiaires post-M.D. | 2013-2014 | ANNUAL CENSUS OF POST-M.D. TRAINEES
Table/Tableau I-3 –continued/suite
Fiel
d of
Pos
t-M.D
. Tra
inin
g20
09-1
020
10-1
120
11-1
220
12-1
320
13-1
4Fe
mal
eM
ale
Tota
lFe
mal
eM
ale
Tota
lFe
mal
eM
ale
Tota
lFe
mal
eM
ale
Tota
lFe
mal
eM
ale
Tota
lO
ccup
atio
nal M
edic
ine
Cou
ntR
ow %
Pedi
atric
sC
ount
Row
%A
dole
scen
t Med
icin
e (P
ed.)
Cou
ntR
ow %
Car
diol
ogy
(Ped
.)C
ount
Row
%C
lin. I
mm
./Alle
rgy
(Ped
.)C
ount
Row
%C
linic
al P
harm
acol
ogy
and
Toxi
colo
gy
(Ped
.)C
ount
Row
%C
ritic
al C
are
(Ped
.)C
ount
Row
%En
docr
inol
ogy/
Met
. (Pe
d.)
Cou
ntR
ow %
Gas
troe
nter
olog
y (P
ed.)
Cou
ntR
ow %
Dev
elop
men
tal P
edia
tric
sC
ount
Row
%Pe
diat
ric E
mer
genc
y M
ed. (
Ped.
)C
ount
Row
%H
emat
olog
y/O
ncol
ogy
(Ped
.)C
ount
Row
%In
fect
ious
Dis
ease
s (P
ed.)
Cou
ntR
ow %
Neo
nata
l-Per
inat
al M
ed. (
Ped.
)C
ount
Row
%N
ephr
olog
y (P
ed.)
Cou
ntR
ow %
Res
piro
logy
(Ped
.)C
ount
Row
%R
heum
atol
ogy
(Ped
.)C
ount
Row
%Ph
ysic
al M
edic
ine
& R
ehab
.C
ount
Row
%Ps
ychi
atry
Cou
ntR
ow %
Chi
ld a
nd A
dole
scen
t Psy
chia
try
Cou
ntR
ow %
13
40
00
00
00
00
00
025.0%
75.0%
100.
0%0.0%
0.0%
0.0%
0.0%
0.0%
0.0%
0.0%
0.0%
0.0%
0.0%
0.0%
0.0%
411
109
520
433
103
536
459
110
569
493
116
609
507
114
621
79.0%
21.0%
100.
0%80.8%
19.2%
100.
0%80.7%
19.3%
100.
0%81.0%
19.0%
100.
0%81.6%
18.4%
100.
0%0
22
33
66
28
51
67
07
0.0%
100.0%
100.
0%50.0%
50.0%
100.
0%75.0%
25.0%
100.
0%83.3%
16.7%
100.
0%100.0%
0.0%
100.
0%8
1220
1311
2412
1123
156
2117
623
40.0%
60.0%
100.
0%54.2%
45.8%
100.
0%52.2%
47.8%
100.
0%71.4%
28.6%
100.
0%73.9%
26.1%
100.
0%7
29
82
1014
216
154
1910
313
77.8%
22.2%
100.
0%80.0%
20.0%
100.
0%87.5%
12.5%
100.
0%78.9%
21.1%
100.
0%76.9%
23.1%
100.
0%1
34
02
20
11
00
00
00
25.0%
75.0%
100.
0%0.0%
100.0%
100.
0%0.0%
100.0%
100.
0%0.0%
0.0%
0.0%
0.0%
0.0%
0.0%
89
1710
515
128
2012
517
116
1747.1%
52.9%
100.
0%66.7%
33.3%
100.
0%60.0%
40.0%
100.
0%70.6%
29.4%
100.
0%64.7%
35.3%
100.
0%9
312
83
1112
416
122
1413
316
75.0%
25.0%
100.
0%72.7%
27.3%
100.
0%75.0%
25.0%
100.
0%85.7%
14.3%
100.
0%81.3%
18.8%
100.
0%5
49
96
1512
517
106
169
716
55.6%
44.4%
100.
0%60.0%
40.0%
100.
0%70.6%
29.4%
100.
0%62.5%
37.5%
100.
0%56.3%
43.8%
100.
0%6
17
42
66
39
103
1315
217
85.7%
14.3%
100.
0%66.7%
33.3%
100.
0%66.7%
33.3%
100.
0%76.9%
23.1%
100.
0%88.2%
11.8%
100.
0%17
1431
2112
3325
934
218
2927
734
54.8%
45.2%
100.
0%63.6%
36.4%
100.
0%73.5%
26.5%
100.
0%72.4%
27.6%
100.
0%79.4%
20.6%
100.
0%15
1025
2010
3022
1234
2015
3524
1236
60.0%
40.0%
100.
0%66.7%
33.3%
100.
0%64.7%
35.3%
100.
0%57.1%
42.9%
100.
0%66.7%
33.3%
100.
0%8
412
86
147
512
104
1413
417
66.7%
33.3%
100.
0%57.1%
42.9%
100.
0%58.3%
41.7%
100.
0%71.4%
28.6%
100.
0%76.5%
23.5%
100.
0%21
728
2618
4433
2255
2922
5129
2756
75.0%
25.0%
100.
0%59.1%
40.9%
100.
0%60.0%
40.0%
100.
0%56.9%
43.1%
100.
0%51.8%
48.2%
100.
0%4
15
50
52
02
11
22
24
80.0%
20.0%
100.
0%100.0%
0.0%
100.
0%100.0%
0.0%
100.
0%50.0%
50.0%
100.
0%50.0%
50.0%
100.
0%7
07
20
23
25
42
68
210
100.0%
0.0%
100.
0%100.0%
0.0%
100.
0%60.0%
40.0%
100.
0%66.7%
33.3%
100.
0%80.0%
20.0%
100.
0%9
211
102
127
18
62
85
27
81.8%
18.2%
100.
0%83.3%
16.7%
100.
0%87.5%
12.5%
100.
0%75.0%
25.0%
100.
0%71.4%
28.6%
100.
0%54
5811
265
5912
463
6412
764
6713
168
7013
848.2%
51.8%
100.
0%52.4%
47.6%
100.
0%49.6%
50.4%
100.
0%48.9%
51.1%
100.
0%49.3%
50.7%
100.
0%496
276
772
538
283
821
537
290
827
548
298
846
578
311
889
64.2%
35.8%
100.
0%65.5%
34.5%
100.
0%64.9%
35.1%
100.
0%64.8%
35.2%
100.
0%65.0%
35.0%
100.
0%0
00
00
00
00
50
57
29
0.0%
0.0%
0.0%
0.0%
0.0%
0.0%
0.0%
0.0%
0.0%
100.0%
0.0%
100.
0%77.8%
22.2%
100.
0%
(cont.)
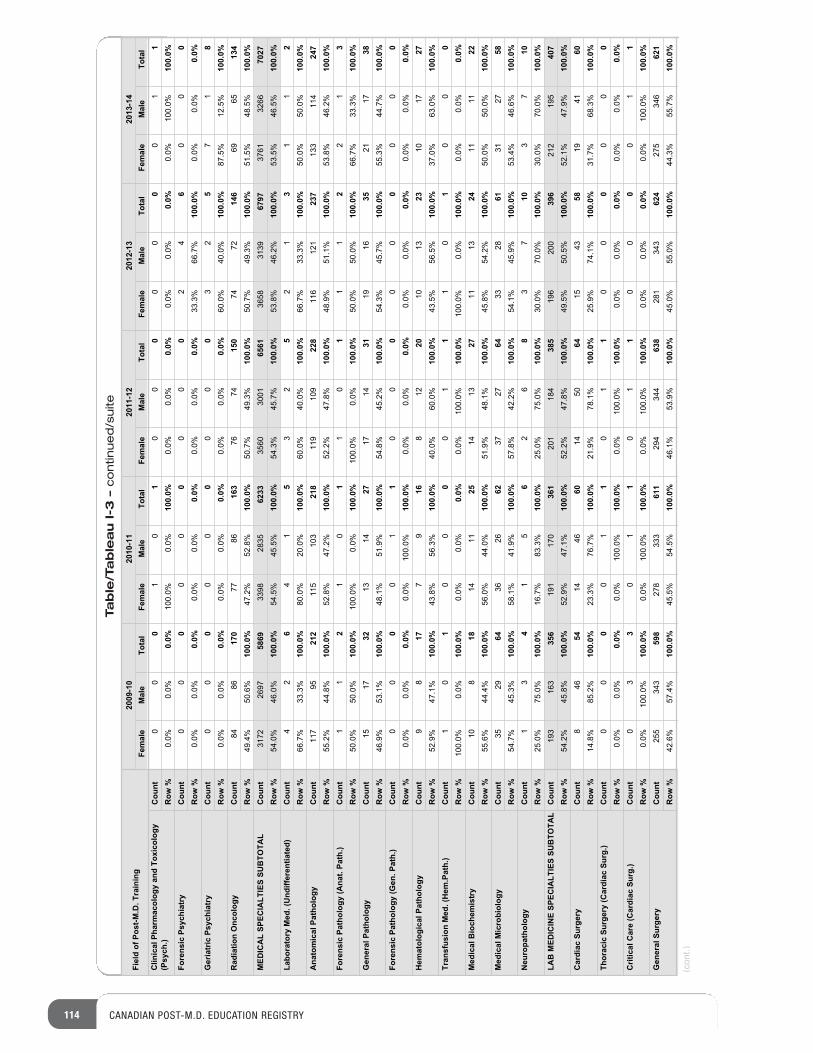
114 CANADIAN POST-M.D. EDUCATION REGISTRY
Table/Tableau I-3 –continued/suite
Fiel
d of
Pos
t-M.D
. Tra
inin
g20
09-1
020
10-1
120
11-1
220
12-1
320
13-1
4Fe
mal
eM
ale
Tota
lFe
mal
eM
ale
Tota
lFe
mal
eM
ale
Tota
lFe
mal
eM
ale
Tota
lFe
mal
eM
ale
Tota
lC
linic
al P
harm
acol
ogy
and
Toxi
colo
gy
(Psy
ch.)
Cou
ntR
ow %
Fore
nsic
Psy
chia
try
Cou
ntR
ow %
Ger
iatr
ic P
sych
iatr
yC
ount
Row
%R
adia
tion
Onc
olog
yC
ount
Row
%M
EDIC
AL
SPEC
IALT
IES
SUB
TOTA
LC
ount
Row
%La
bora
tory
Med
. (U
ndiff
eren
tiate
d)C
ount
Row
%A
nato
mic
al P
atho
logy
Cou
ntR
ow %
Fore
nsic
Pat
holo
gy (A
nat.
Path
.)C
ount
Row
%G
ener
al P
atho
logy
Cou
ntR
ow %
Fore
nsic
Pat
holo
gy (G
en. P
ath.
)C
ount
Row
%H
emat
olog
ical
Pat
holo
gyC
ount
Row
%Tr
ansf
usio
n M
ed. (
Hem
.Pat
h.)
Cou
ntR
ow %
Med
ical
Bio
chem
istr
yC
ount
Row
%M
edic
al M
icro
biol
ogy
Cou
ntR
ow %
Neu
ropa
thol
ogy
Cou
ntR
ow %
LAB
MED
ICIN
E SP
ECIA
LTIE
S SU
BTO
TAL
Cou
ntR
ow %
Car
diac
Sur
gery
Cou
ntR
ow %
Thor
acic
Sur
gery
(Car
diac
Sur
g.)
Cou
ntR
ow %
Crit
ical
Car
e (C
ardi
ac S
urg.
)C
ount
Row
%G
ener
al S
urge
ryC
ount
Row
%
00
01
01
00
00
00
01
10.0%
0.0%
0.0%
100.0%
0.0%
100.
0%0.0%
0.0%
0.0%
0.0%
0.0%
0.0%
0.0%
100.0%
100.
0%0
00
00
00
00
24
60
00
0.0%
0.0%
0.0%
0.0%
0.0%
0.0%
0.0%
0.0%
0.0%
33.3%
66.7%
100.
0%0.0%
0.0%
0.0%
00
00
00
00
03
25
71
80.0%
0.0%
0.0%
0.0%
0.0%
0.0%
0.0%
0.0%
0.0%
60.0%
40.0%
100.
0%87.5%
12.5%
100.
0%84
8617
077
8616
376
7415
074
7214
669
6513
449.4%
50.6%
100.
0%47.2%
52.8%
100.
0%50.7%
49.3%
100.
0%50.7%
49.3%
100.
0%51.5%
48.5%
100.
0%3172
2697
5869
3398
2835
6233
3560
3001
6561
3658
3139
6797
3761
3266
7027
54.0%
46.0%
100.
0%54.5%
45.5%
100.
0%54.3%
45.7%
100.
0%53.8%
46.2%
100.
0%53.5%
46.5%
100.
0%4
26
41
53
25
21
31
12
66.7%
33.3%
100.
0%80.0%
20.0%
100.
0%60.0%
40.0%
100.
0%66.7%
33.3%
100.
0%50.0%
50.0%
100.
0%117
9521
2115
103
218
119
109
228
116
121
237
133
114
247
55.2%
44.8%
100.
0%52.8%
47.2%
100.
0%52.2%
47.8%
100.
0%48.9%
51.1%
100.
0%53.8%
46.2%
100.
0%1
12
10
11
01
11
22
13
50.0%
50.0%
100.
0%100.0%
0.0%
100.
0%100.0%
0.0%
100.
0%50.0%
50.0%
100.
0%66.7%
33.3%
100.
0%15
1732
1314
2717
1431
1916
3521
1738
46.9%
53.1%
100.
0%48.1%
51.9%
100.
0%54.8%
45.2%
100.
0%54.3%
45.7%
100.
0%55.3%
44.7%
100.
0%0
00
01
10
00
00
00
00
0.0%
0.0%
0.0%
0.0%
100.0%
100.
0%0.0%
0.0%
0.0%
0.0%
0.0%
0.0%
0.0%
0.0%
0.0%
98
177
916
812
2010
1323
1017
2752.9%
47.1%
100.
0%43.8%
56.3%
100.
0%40.0%
60.0%
100.
0%43.5%
56.5%
100.
0%37.0%
63.0%
100.
0%1
01
00
00
11
10
10
00
100.0%
0.0%
100.
0%0.0%
0.0%
0.0%
0.0%
100.0%
100.
0%100.0%
0.0%
100.
0%0.0%
0.0%
0.0%
108
1814
1125
1413
2711
1324
1111
2255.6%
44.4%
100.
0%56.0%
44.0%
100.
0%51.9%
48.1%
100.
0%45.8%
54.2%
100.
0%50.0%
50.0%
100.
0%35
2964
3626
6237
2764
3328
6131
2758
54.7%
45.3%
100.
0%58.1%
41.9%
100.
0%57.8%
42.2%
100.
0%54.1%
45.9%
100.
0%53.4%
46.6%
100.
0%1
34
15
62
68
37
103
710
25.0%
75.0%
100.
0%16.7%
83.3%
100.
0%25.0%
75.0%
100.
0%30.0%
70.0%
100.
0%30.0%
70.0%
100.
0%193
163
356
191
170
361
201
184
385
196
200
396
212
195
407
54.2%
45.8%
100.
0%52.9%
47.1%
100.
0%52.2%
47.8%
100.
0%49.5%
50.5%
100.
0%52.1%
47.9%
100.
0%8
4654
1446
6014
5064
1543
5819
4160
14.8%
85.2%
100.
0%23.3%
76.7%
100.
0%21.9%
78.1%
100.
0%25.9%
74.1%
100.
0%31.7%
68.3%
100.
0%0
00
01
10
11
00
00
00
0.0%
0.0%
0.0%
0.0%
100.0%
100.
0%0.0%
100.0%
100.
0%0.0%
0.0%
0.0%
0.0%
0.0%
0.0%
03
30
11
01
10
00
01
10.0%
100.0%
100.
0%0.0%
100.0%
100.
0%0.0%
100.0%
100.
0%0.0%
0.0%
0.0%
0.0%
100.0%
100.
0%255
343
598
278
333
611
294
344
638
281
343
624
275
346
621
42.6%
57.4%
100.
0%45.5%
54.5%
100.
0%46.1%
53.9%
100.
0%45.0%
55.0%
100.
0%44.3%
55.7%
100.
0%
(cont.)
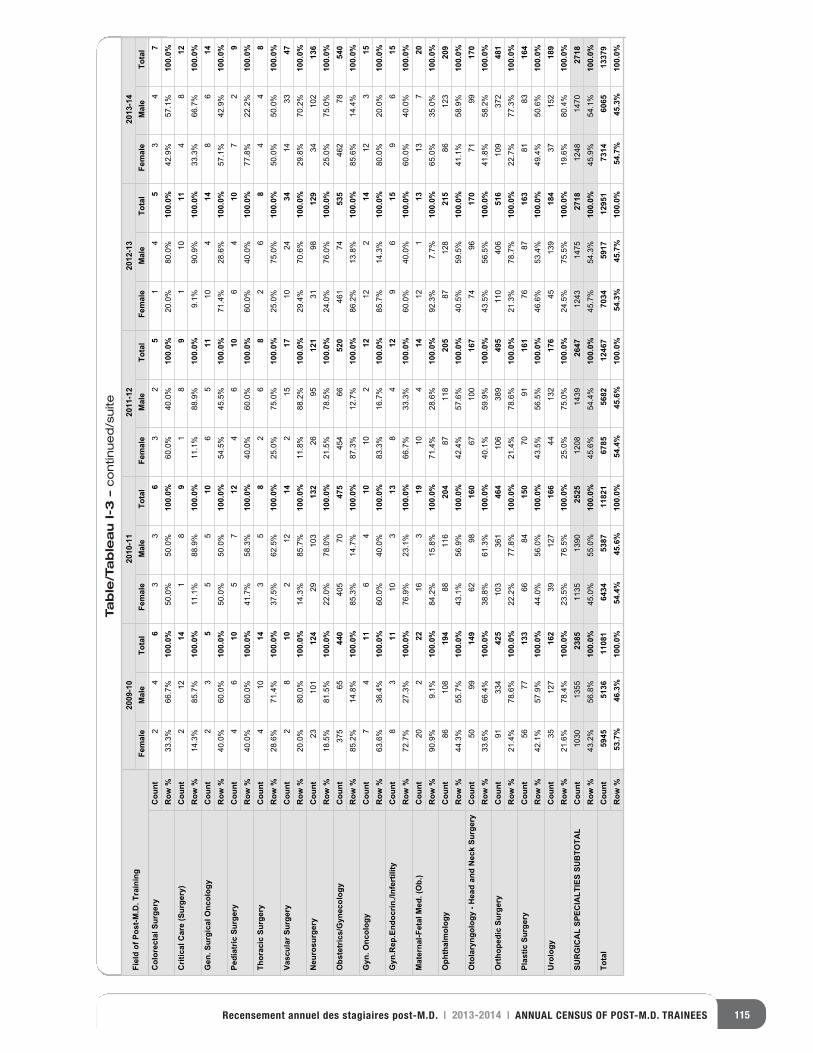
115Recensement annuel des stagiaires post-M.D. | 2013-2014 | ANNUAL CENSUS OF POST-M.D. TRAINEES
Table/Tableau I-3 –continued/suite
Fiel
d of
Pos
t-M.D
. Tra
inin
g20
09-1
020
10-1
120
11-1
220
12-1
320
13-1
4Fe
mal
eM
ale
Tota
lFe
mal
eM
ale
Tota
lFe
mal
eM
ale
Tota
lFe
mal
eM
ale
Tota
lFe
mal
eM
ale
Tota
lC
olor
ecta
l Sur
gery
Cou
ntR
ow %
Crit
ical
Car
e (S
urge
ry)
Cou
ntR
ow %
Gen
. Sur
gica
l Onc
olog
yC
ount
Row
%Pe
diat
ric S
urge
ryC
ount
Row
%Th
orac
ic S
urge
ryC
ount
Row
%Va
scul
ar S
urge
ryC
ount
Row
%N
euro
surg
ery
Cou
ntR
ow %
Obs
tetr
ics/
Gyn
ecol
ogy
Cou
ntR
ow %
Gyn
. Onc
olog
yC
ount
Row
%G
yn.R
ep.E
ndoc
rin./I
nfer
tility
Cou
ntR
ow %
Mat
erna
l-Fet
al M
ed. (
Ob.
)C
ount
Row
%O
phth
alm
olog
yC
ount
Row
%O
tola
ryng
olog
y - H
ead
and
Nec
k Su
rger
yC
ount
Row
%O
rtho
pedi
c Su
rger
yC
ount
Row
%Pl
astic
Sur
gery
Cou
ntR
ow %
Uro
logy
Cou
ntR
ow %
SUR
GIC
AL
SPEC
IALT
IES
SUB
TOTA
LC
ount
Row
%To
tal
Cou
ntR
ow %
24
63
36
32
51
45
34
733.3%
66.7%
100.
0%50.0%
50.0%
100.
0%60.0%
40.0%
100.
0%20.0%
80.0%
100.
0%42.9%
57.1%
100.
0%2
1214
18
91
89
110
114
812
14.3%
85.7%
100.
0%11.1%
88.9%
100.
0%11.1%
88.9%
100.
0%9.1%
90.9%
100.
0%33.3%
66.7%
100.
0%2
35
55
106
511
104
148
614
40.0%
60.0%
100.
0%50.0%
50.0%
100.
0%54.5%
45.5%
100.
0%71.4%
28.6%
100.
0%57.1%
42.9%
100.
0%4
610
57
124
610
64
107
29
40.0%
60.0%
100.
0%41.7%
58.3%
100.
0%40.0%
60.0%
100.
0%60.0%
40.0%
100.
0%77.8%
22.2%
100.
0%4
1014
35
82
68
26
84
48
28.6%
71.4%
100.
0%37.5%
62.5%
100.
0%25.0%
75.0%
100.
0%25.0%
75.0%
100.
0%50.0%
50.0%
100.
0%2
810
212
142
1517
1024
3414
3347
20.0%
80.0%
100.
0%14.3%
85.7%
100.
0%11.8%
88.2%
100.
0%29.4%
70.6%
100.
0%29.8%
70.2%
100.
0%23
101
124
29103
132
2695
121
3198
129
34102
136
18.5%
81.5%
100.
0%22.0%
78.0%
100.
0%21.5%
78.5%
100.
0%24.0%
76.0%
100.
0%25.0%
75.0%
100.
0%375
6544
0405
7047
5454
6652
0461
7453
5462
7854
085.2%
14.8%
100.
0%85.3%
14.7%
100.
0%87.3%
12.7%
100.
0%86.2%
13.8%
100.
0%85.6%
14.4%
100.
0%7
411
64
1010
212
122
1412
315
63.6%
36.4%
100.
0%60.0%
40.0%
100.
0%83.3%
16.7%
100.
0%85.7%
14.3%
100.
0%80.0%
20.0%
100.
0%8
311
103
138
412
96
159
615
72.7%
27.3%
100.
0%76.9%
23.1%
100.
0%66.7%
33.3%
100.
0%60.0%
40.0%
100.
0%60.0%
40.0%
100.
0%20
222
163
1910
414
121
1313
720
90.9%
9.1%
100.
0%84.2%
15.8%
100.
0%71.4%
28.6%
100.
0%92.3%
7.7%
100.
0%65.0%
35.0%
100.
0%86
108
194
88116
204
87118
205
87128
215
86123
209
44.3%
55.7%
100.
0%43.1%
56.9%
100.
0%42.4%
57.6%
100.
0%40.5%
59.5%
100.
0%41.1%
58.9%
100.
0%50
9914
962
9816
067
100
167
7496
170
7199
170
33.6%
66.4%
100.
0%38.8%
61.3%
100.
0%40.1%
59.9%
100.
0%43.5%
56.5%
100.
0%41.8%
58.2%
100.
0%91
334
425
103
361
464
106
389
495
110
406
516
109
372
481
21.4%
78.6%
100.
0%22.2%
77.8%
100.
0%21.4%
78.6%
100.
0%21.3%
78.7%
100.
0%22.7%
77.3%
100.
0%56
7713
366
8415
070
9116
176
8716
381
8316
442.1%
57.9%
100.
0%44.0%
56.0%
100.
0%43.5%
56.5%
100.
0%46.6%
53.4%
100.
0%49.4%
50.6%
100.
0%35
127
162
39127
166
44132
176
45139
184
37152
189
21.6%
78.4%
100.
0%23.5%
76.5%
100.
0%25.0%
75.0%
100.
0%24.5%
75.5%
100.
0%19.6%
80.4%
100.
0%1030
1355
2385
1135
1390
2525
1208
1439
2647
1243
1475
2718
1248
1470
2718
43.2%
56.8%
100.
0%45.0%
55.0%
100.
0%45.6%
54.4%
100.
0%45.7%
54.3%
100.
0%45.9%
54.1%
100.
0%59
4551
3611
081
6434
5387
1182
167
8556
8212
467
7034
5917
1295
173
1460
6513
379
53.7
%46
.3%
100.
0%54
.4%
45.6
%10
0.0%
54.4
%45
.6%
100.
0%54
.3%
45.7
%10
0.0%
54.7
%45
.3%
100.
0%
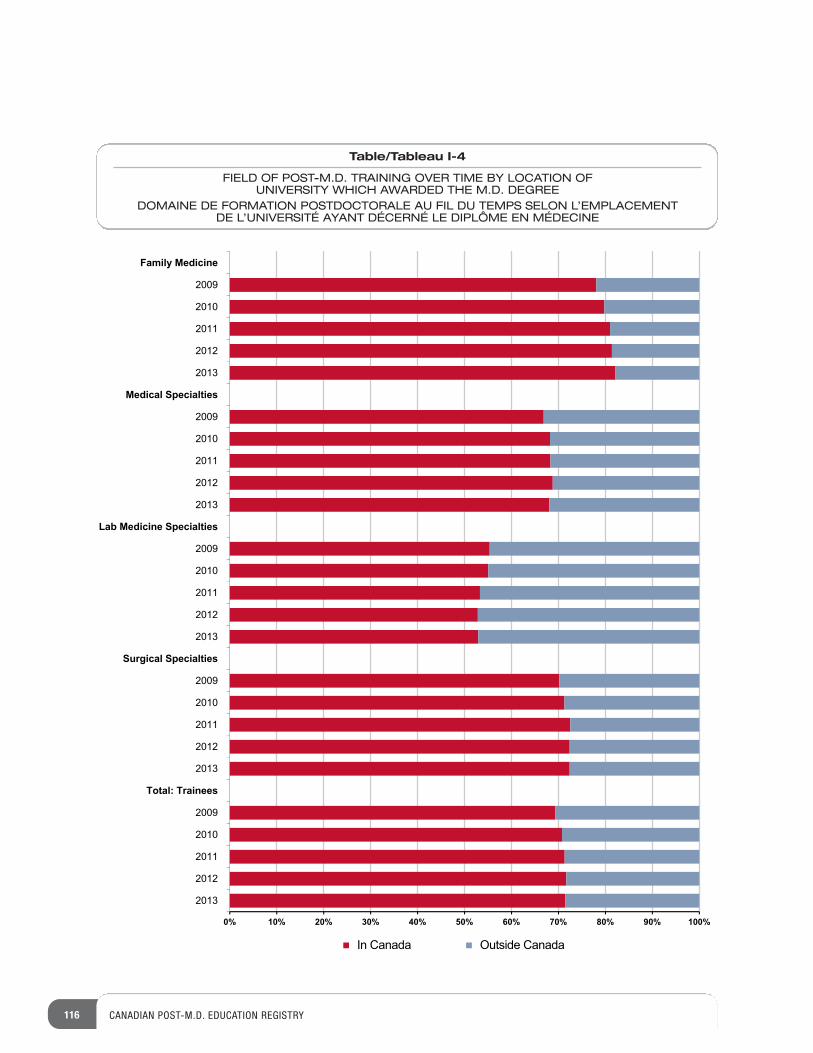
116 CANADIAN POST-M.D. EDUCATION REGISTRY
0% 10% 20% 30% 40% 50% 60% 70% 80% 90% 100%
2013
2012
2011
2010
2009
Total: Trainees
2013
2012
2011
2010
2009
Surgical Specialties
2013
2012
2011
2010
2009
Lab Medicine Specialties
2013
2012
2011
2010
2009
Medical Specialties
2013
2012
2011
2010
2009
Family Medicine
In Canada Outside Canada
Table/Tableau I-4
FIELD OF POST-M.D. TRAINING OVER TIME BY LOCATION OFUNIVERSITY WHICH AWARDED THE M.D. DEGREE
DOMAINE DE FORMATION POSTDOCTORALE AU FIL DU TEMPS SELON L’EMPLACEMENT DE L’UNIVERSITÉ AYANT DÉCERNÉ LE DIPLÔME EN MÉDECINE
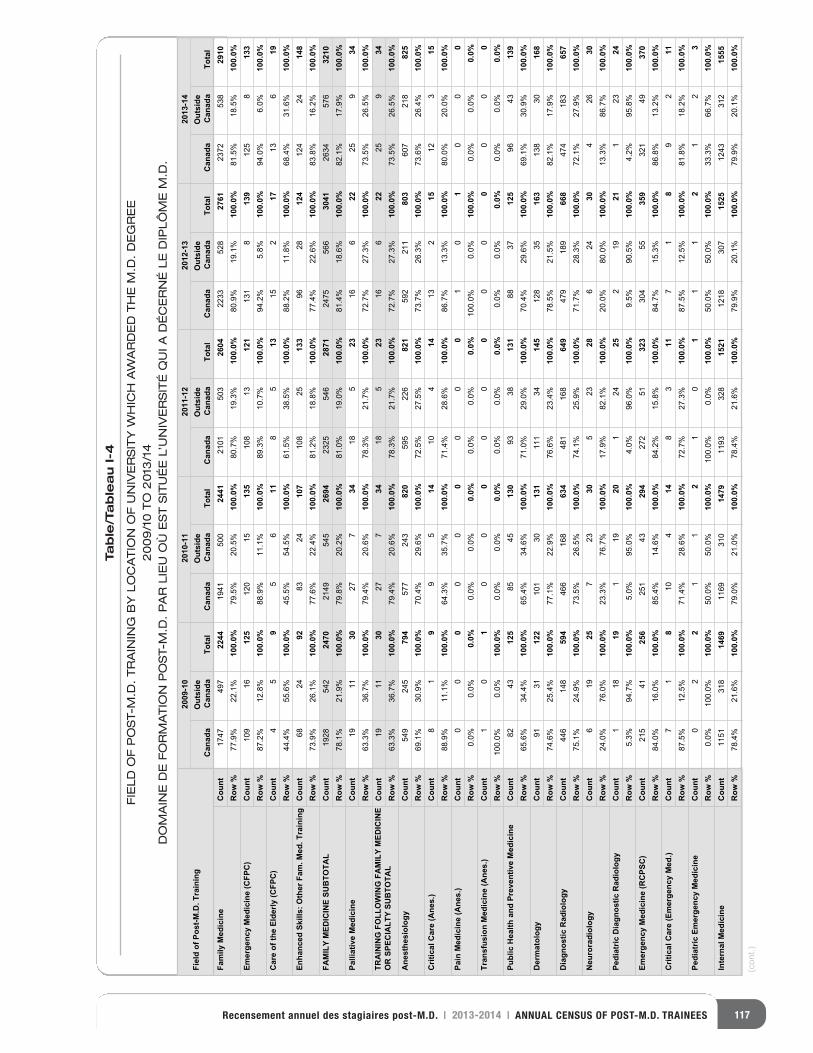
117Recensement annuel des stagiaires post-M.D. | 2013-2014 | ANNUAL CENSUS OF POST-M.D. TRAINEES
Table/Tableau I-4
FIELD OF POST-M.D. TRAINING BY LOCATION OF UNIVERSITY WHICH AWARDED THE M.D. DEGREE
2009/10 TO 2013/14
DOMAINE DE FORMATION POST-M.D. PAR LIEU OÙ EST SITUÉE L’UNIVERSITÉ QUI A DÉCERNÉ LE DIPLÔME M.D.
Fiel
d of
Pos
t-M.D
. Tra
inin
g20
09-1
020
10-1
120
11-1
220
12-1
320
13-1
4
Can
ada
Out
side
C
anad
aTo
tal
Can
ada
Out
side
C
anad
aTo
tal
Can
ada
Out
side
C
anad
aTo
tal
Can
ada
Out
side
C
anad
aTo
tal
Can
ada
Out
side
C
anad
aTo
tal
Fam
ily M
edic
ine
Cou
ntR
ow %
Emer
genc
y M
edic
ine
(CFP
C)
Cou
ntR
ow %
Car
e of
the
Elde
rly (C
FPC
)C
ount
Row
%En
hanc
ed S
kills
: Oth
er F
am. M
ed. T
rain
ing
Cou
ntR
ow %
FAM
ILY
MED
ICIN
E SU
BTO
TAL
Cou
ntR
ow %
Palli
ativ
e M
edic
ine
Cou
ntR
ow %
TRA
ININ
G F
OLL
OW
ING
FA
MIL
Y M
EDIC
INE
OR
SPE
CIA
LTY
SUB
TOTA
LC
ount
Row
%A
nest
hesi
olog
yC
ount
Row
%C
ritic
al C
are
(Ane
s.)
Cou
ntR
ow %
Pain
Med
icin
e (A
nes.
)C
ount
Row
%Tr
ansf
usio
n M
edic
ine
(Ane
s.)
Cou
ntR
ow %
Publ
ic H
ealth
and
Pre
vent
ive
Med
icin
eC
ount
Row
%D
erm
atol
ogy
Cou
ntR
ow %
Dia
gnos
tic R
adio
logy
Cou
ntR
ow %
Neu
rora
diol
ogy
Cou
ntR
ow %
Pedi
atric
Dia
gnos
tic R
adio
logy
Cou
ntR
ow %
Emer
genc
y M
edic
ine
(RC
PSC
)C
ount
Row
%C
ritic
al C
are
(Em
erge
ncy
Med
.)C
ount
Row
%Pe
diat
ric E
mer
genc
y M
edic
ine
Cou
ntR
ow %
Inte
rnal
Med
icin
eC
ount
Row
%
1747
497
2244
1941
500
2441
2101
503
2604
2233
528
2761
2372
538
2910
77.9%
22.1%
100.
0%79.5%
20.5%
100.
0%80.7%
19.3%
100.
0%80.9%
19.1%
100.
0%81.5%
18.5%
100.
0%109
1612
5120
1513
5108
1312
1131
813
9125
813
387.2%
12.8%
100.
0%88.9%
11.1%
100.
0%89.3%
10.7%
100.
0%94.2%
5.8%
100.
0%94.0%
6.0%
100.
0%4
59
56
118
513
152
1713
619
44.4%
55.6%
100.
0%45.5%
54.5%
100.
0%61.5%
38.5%
100.
0%88.2%
11.8%
100.
0%68.4%
31.6%
100.
0%68
2492
8324
107
108
2513
396
2812
4124
2414
873.9%
26.1%
100.
0%77.6%
22.4%
100.
0%81.2%
18.8%
100.
0%77.4%
22.6%
100.
0%83.8%
16.2%
100.
0%1928
542
2470
2149
545
2694
2325
546
2871
2475
566
3041
2634
576
3210
78.1%
21.9%
100.
0%79.8%
20.2%
100.
0%81.0%
19.0%
100.
0%81.4%
18.6%
100.
0%82.1%
17.9%
100.
0%19
1130
277
3418
523
166
2225
934
63.3%
36.7%
100.
0%79.4%
20.6%
100.
0%78.3%
21.7%
100.
0%72.7%
27.3%
100.
0%73.5%
26.5%
100.
0%19
1130
277
3418
523
166
2225
934
63.3%
36.7%
100.
0%79.4%
20.6%
100.
0%78.3%
21.7%
100.
0%72.7%
27.3%
100.
0%73.5%
26.5%
100.
0%549
245
794
577
243
820
595
226
821
592
211
803
607
218
825
69.1%
30.9%
100.
0%70.4%
29.6%
100.
0%72.5%
27.5%
100.
0%73.7%
26.3%
100.
0%73.6%
26.4%
100.
0%8
19
95
1410
414
132
1512
315
88.9%
11.1%
100.
0%64.3%
35.7%
100.
0%71.4%
28.6%
100.
0%86.7%
13.3%
100.
0%80.0%
20.0%
100.
0%0
00
00
00
00
10
10
00
0.0%
0.0%
0.0%
0.0%
0.0%
0.0%
0.0%
0.0%
0.0%
100.0%
0.0%
100.
0%0.0%
0.0%
0.0%
10
10
00
00
00
00
00
0100.0%
0.0%
100.
0%0.0%
0.0%
0.0%
0.0%
0.0%
0.0%
0.0%
0.0%
0.0%
0.0%
0.0%
0.0%
8243
125
8545
130
9338
131
8837
125
9643
139
65.6%
34.4%
100.
0%65.4%
34.6%
100.
0%71.0%
29.0%
100.
0%70.4%
29.6%
100.
0%69.1%
30.9%
100.
0%91
3112
2101
3013
1111
3414
5128
3516
3138
3016
874.6%
25.4%
100.
0%77.1%
22.9%
100.
0%76.6%
23.4%
100.
0%78.5%
21.5%
100.
0%82.1%
17.9%
100.
0%446
148
594
466
168
634
481
168
649
479
189
668
474
183
657
75.1%
24.9%
100.
0%73.5%
26.5%
100.
0%74.1%
25.9%
100.
0%71.7%
28.3%
100.
0%72.1%
27.9%
100.
0%6
1925
723
305
2328
624
304
2630
24.0%
76.0%
100.
0%23.3%
76.7%
100.
0%17.9%
82.1%
100.
0%20.0%
80.0%
100.
0%13.3%
86.7%
100.
0%1
1819
119
201
2425
219
211
2324
5.3%
94.7%
100.
0%5.0%
95.0%
100.
0%4.0%
96.0%
100.
0%9.5%
90.5%
100.
0%4.2%
95.8%
100.
0%215
4125
6251
4329
4272
5132
3304
5535
9321
4937
084.0%
16.0%
100.
0%85.4%
14.6%
100.
0%84.2%
15.8%
100.
0%84.7%
15.3%
100.
0%86.8%
13.2%
100.
0%7
18
104
148
311
71
89
211
87.5%
12.5%
100.
0%71.4%
28.6%
100.
0%72.7%
27.3%
100.
0%87.5%
12.5%
100.
0%81.8%
18.2%
100.
0%0
22
11
21
01
11
21
23
0.0%
100.0%
100.
0%50.0%
50.0%
100.
0%100.0%
0.0%
100.
0%50.0%
50.0%
100.
0%33.3%
66.7%
100.
0%1151
318
1469
1169
310
1479
1193
328
1521
1218
307
1525
1243
312
1555
78.4%
21.6%
100.
0%79.0%
21.0%
100.
0%78.4%
21.6%
100.
0%79.9%
20.1%
100.
0%79.9%
20.1%
100.
0%
(cont.)
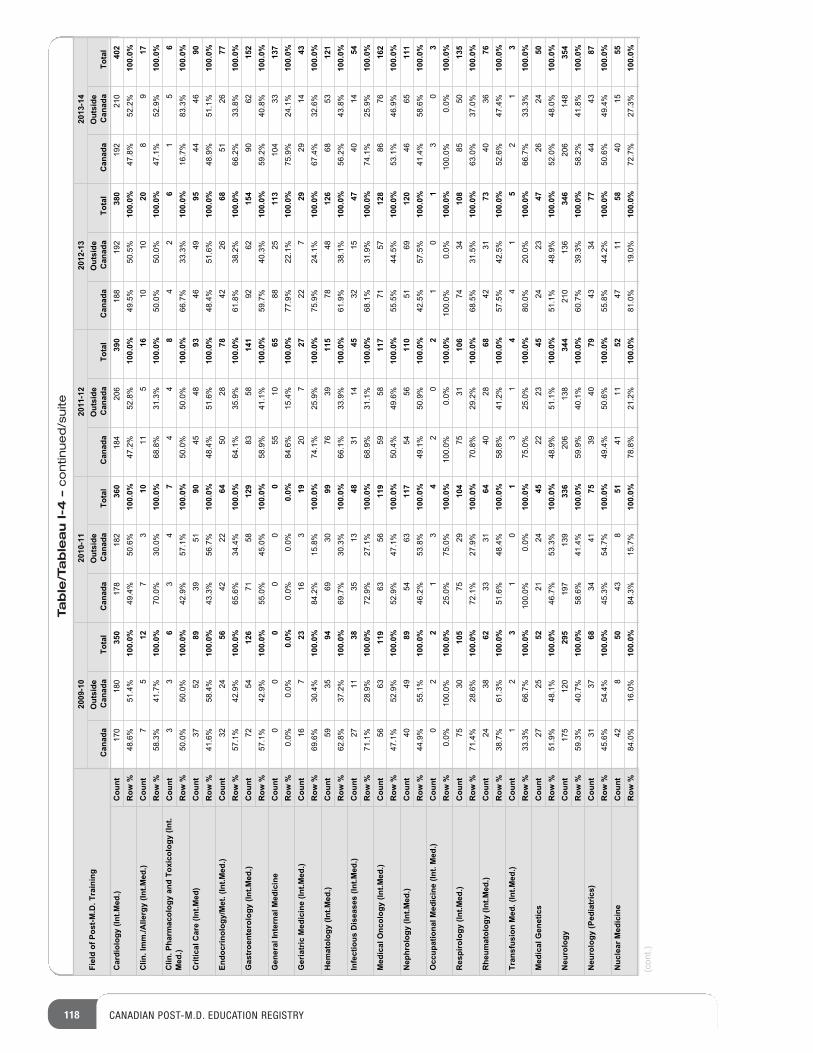
118 CANADIAN POST-M.D. EDUCATION REGISTRY
Table/Tableau I-4 –continued/suite
Fiel
d of
Pos
t-M.D
. Tra
inin
g20
09-1
020
10-1
120
11-1
220
12-1
320
13-1
4
Can
ada
Out
side
C
anad
aTo
tal
Can
ada
Out
side
C
anad
aTo
tal
Can
ada
Out
side
C
anad
aTo
tal
Can
ada
Out
side
C
anad
aTo
tal
Can
ada
Out
side
C
anad
aTo
tal
Car
diol
ogy
(Int.M
ed.)
Cou
ntR
ow %
Clin
. Im
m./A
llerg
y (In
t.Med
.)C
ount
Row
%C
lin. P
harm
acol
ogy
and
Toxi
colo
gy (I
nt.
Med
.)C
ount
Row
%C
ritic
al C
are
(Int.M
ed)
Cou
ntR
ow %
Endo
crin
olog
y/M
et. (
Int.M
ed.)
Cou
ntR
ow %
Gas
troe
nter
olog
y (In
t.Med
.)C
ount
Row
%G
ener
al In
tern
al M
edic
ine
Cou
ntR
ow %
Ger
iatr
ic M
edic
ine
(Int.M
ed.)
Cou
ntR
ow %
Hem
atol
ogy
(Int.M
ed.)
Cou
ntR
ow %
Infe
ctio
us D
isea
ses
(Int.M
ed.)
Cou
ntR
ow %
Med
ical
Onc
olog
y (In
t.Med
.)C
ount
Row
%N
ephr
olog
y (In
t.Med
.)C
ount
Row
%O
ccup
atio
nal M
edic
ine
(Int.
Med
.)C
ount
Row
%R
espi
rolo
gy (I
nt.M
ed.)
Cou
ntR
ow %
Rhe
umat
olog
y (In
t.Med
.)C
ount
Row
%Tr
ansf
usio
n M
ed. (
Int.M
ed.)
Cou
ntR
ow %
Med
ical
Gen
etic
sC
ount
Row
%N
euro
logy
Cou
ntR
ow %
Neu
rolo
gy (P
edia
tric
s)C
ount
Row
%N
ucle
ar M
edic
ine
Cou
ntR
ow %
170
180
350
178
182
360
184
206
390
188
192
380
192
210
402
48.6%
51.4%
100.
0%49.4%
50.6%
100.
0%47.2%
52.8%
100.
0%49.5%
50.5%
100.
0%47.8%
52.2%
100.
0%7
512
73
1011
516
1010
208
917
58.3%
41.7%
100.
0%70.0%
30.0%
100.
0%68.8%
31.3%
100.
0%50.0%
50.0%
100.
0%47.1%
52.9%
100.
0%3
36
34
74
48
42
61
56
50.0%
50.0%
100.
0%42.9%
57.1%
100.
0%50.0%
50.0%
100.
0%66.7%
33.3%
100.
0%16.7%
83.3%
100.
0%37
5289
3951
9045
4893
4649
9544
4690
41.6%
58.4%
100.
0%43.3%
56.7%
100.
0%48.4%
51.6%
100.
0%48.4%
51.6%
100.
0%48.9%
51.1%
100.
0%32
2456
4222
6450
2878
4226
6851
2677
57.1%
42.9%
100.
0%65.6%
34.4%
100.
0%64.1%
35.9%
100.
0%61.8%
38.2%
100.
0%66.2%
33.8%
100.
0%72
5412
671
5812
983
5814
192
6215
490
6215
257.1%
42.9%
100.
0%55.0%
45.0%
100.
0%58.9%
41.1%
100.
0%59.7%
40.3%
100.
0%59.2%
40.8%
100.
0%0
00
00
055
1065
8825
113
104
3313
70.0%
0.0%
0.0%
0.0%
0.0%
0.0%
84.6%
15.4%
100.
0%77.9%
22.1%
100.
0%75.9%
24.1%
100.
0%16
723
163
1920
727
227
2929
1443
69.6%
30.4%
100.
0%84.2%
15.8%
100.
0%74.1%
25.9%
100.
0%75.9%
24.1%
100.
0%67.4%
32.6%
100.
0%59
3594
6930
9976
3911
578
4812
668
5312
162.8%
37.2%
100.
0%69.7%
30.3%
100.
0%66.1%
33.9%
100.
0%61.9%
38.1%
100.
0%56.2%
43.8%
100.
0%27
1138
3513
4831
1445
3215
4740
1454
71.1%
28.9%
100.
0%72.9%
27.1%
100.
0%68.9%
31.1%
100.
0%68.1%
31.9%
100.
0%74.1%
25.9%
100.
0%56
6311
963
5611
959
5811
771
5712
886
7616
247.1%
52.9%
100.
0%52.9%
47.1%
100.
0%50.4%
49.6%
100.
0%55.5%
44.5%
100.
0%53.1%
46.9%
100.
0%40
4989
5463
117
5456
110
5169
120
4665
111
44.9%
55.1%
100.
0%46.2%
53.8%
100.
0%49.1%
50.9%
100.
0%42.5%
57.5%
100.
0%41.4%
58.6%
100.
0%0
22
13
42
02
10
13
03
0.0%
100.0%
100.
0%25.0%
75.0%
100.
0%100.0%
0.0%
100.
0%100.0%
0.0%
100.
0%100.0%
0.0%
100.
0%75
3010
575
2910
475
3110
674
3410
885
5013
571.4%
28.6%
100.
0%72.1%
27.9%
100.
0%70.8%
29.2%
100.
0%68.5%
31.5%
100.
0%63.0%
37.0%
100.
0%24
3862
3331
6440
2868
4231
7340
3676
38.7%
61.3%
100.
0%51.6%
48.4%
100.
0%58.8%
41.2%
100.
0%57.5%
42.5%
100.
0%52.6%
47.4%
100.
0%1
23
10
13
14
41
52
13
33.3%
66.7%
100.
0%100.0%
0.0%
100.
0%75.0%
25.0%
100.
0%80.0%
20.0%
100.
0%66.7%
33.3%
100.
0%27
2552
2124
4522
2345
2423
4726
2450
51.9%
48.1%
100.
0%46.7%
53.3%
100.
0%48.9%
51.1%
100.
0%51.1%
48.9%
100.
0%52.0%
48.0%
100.
0%175
120
295
197
139
336
206
138
344
210
136
346
206
148
354
59.3%
40.7%
100.
0%58.6%
41.4%
100.
0%59.9%
40.1%
100.
0%60.7%
39.3%
100.
0%58.2%
41.8%
100.
0%31
3768
3441
7539
4079
4334
7744
4387
45.6%
54.4%
100.
0%45.3%
54.7%
100.
0%49.4%
50.6%
100.
0%55.8%
44.2%
100.
0%50.6%
49.4%
100.
0%42
850
438
5141
1152
4711
5840
1555
84.0%
16.0%
100.
0%84.3%
15.7%
100.
0%78.8%
21.2%
100.
0%81.0%
19.0%
100.
0%72.7%
27.3%
100.
0%
(cont.)
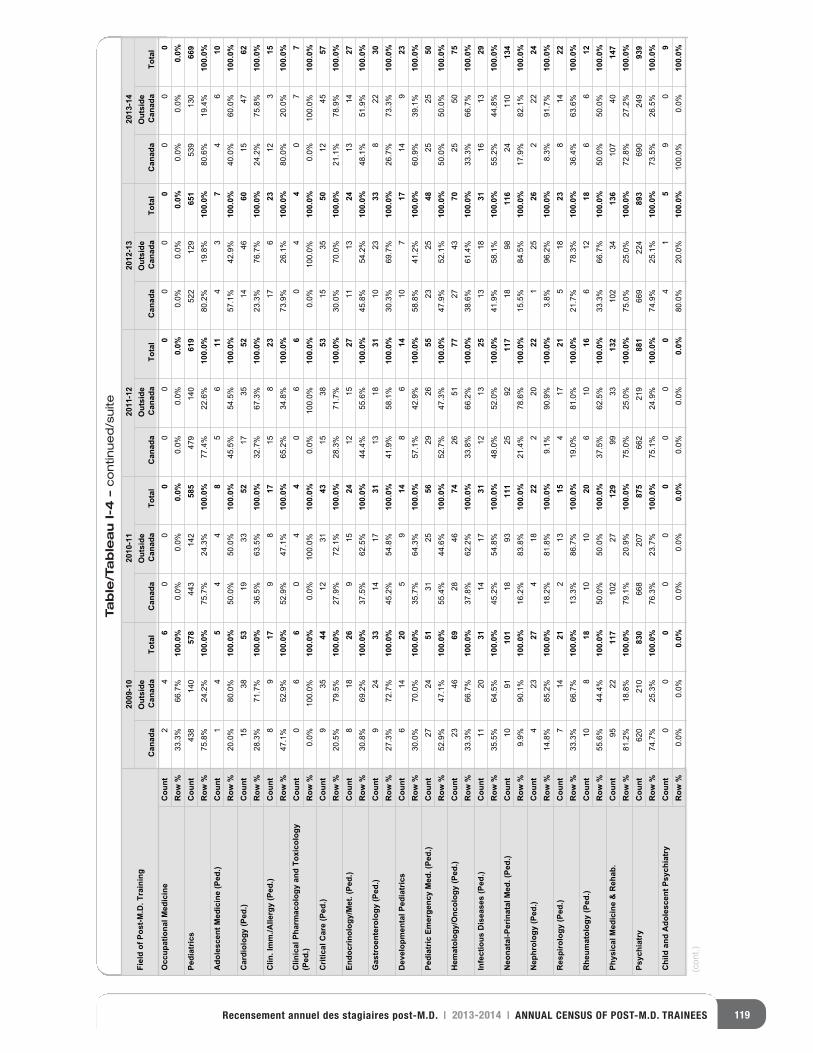
119Recensement annuel des stagiaires post-M.D. | 2013-2014 | ANNUAL CENSUS OF POST-M.D. TRAINEES
Table/Tableau I-4 –continued/suite
Fiel
d of
Pos
t-M.D
. Tra
inin
g20
09-1
020
10-1
120
11-1
220
12-1
320
13-1
4
Can
ada
Out
side
C
anad
aTo
tal
Can
ada
Out
side
C
anad
aTo
tal
Can
ada
Out
side
C
anad
aTo
tal
Can
ada
Out
side
C
anad
aTo
tal
Can
ada
Out
side
C
anad
aTo
tal
Occ
upat
iona
l Med
icin
eC
ount
Row
%Pe
diat
rics
Cou
ntR
ow %
Ado
lesc
ent M
edic
ine
(Ped
.)C
ount
Row
%C
ardi
olog
y (P
ed.)
Cou
ntR
ow %
Clin
. Im
m./A
llerg
y (P
ed.)
Cou
ntR
ow %
Clin
ical
Pha
rmac
olog
y an
d To
xico
logy
(P
ed.)
Cou
ntR
ow %
Crit
ical
Car
e (P
ed.)
Cou
ntR
ow %
Endo
crin
olog
y/M
et. (
Ped.
)C
ount
Row
%G
astr
oent
erol
ogy
(Ped
.)C
ount
Row
%D
evel
opm
enta
l Ped
iatr
ics
Cou
ntR
ow %
Pedi
atric
Em
erge
ncy
Med
. (Pe
d.)
Cou
ntR
ow %
Hem
atol
ogy/
Onc
olog
y (P
ed.)
Cou
ntR
ow %
Infe
ctio
us D
isea
ses
(Ped
.)C
ount
Row
%N
eona
tal-P
erin
atal
Med
. (Pe
d.)
Cou
ntR
ow %
Nep
hrol
ogy
(Ped
.)C
ount
Row
%R
espi
rolo
gy (P
ed.)
Cou
ntR
ow %
Rhe
umat
olog
y (P
ed.)
Cou
ntR
ow %
Phys
ical
Med
icin
e &
Reh
ab.
Cou
ntR
ow %
Psyc
hiat
ryC
ount
Row
%C
hild
and
Ado
lesc
ent P
sych
iatr
yC
ount
Row
%
24
60
00
00
00
00
00
033.3%
66.7%
100.
0%0.0%
0.0%
0.0%
0.0%
0.0%
0.0%
0.0%
0.0%
0.0%
0.0%
0.0%
0.0%
438
140
578
443
142
585
479
140
619
522
129
651
539
130
669
75.8%
24.2%
100.
0%75.7%
24.3%
100.
0%77.4%
22.6%
100.
0%80.2%
19.8%
100.
0%80.6%
19.4%
100.
0%1
45
44
85
611
43
74
610
20.0%
80.0%
100.
0%50.0%
50.0%
100.
0%45.5%
54.5%
100.
0%57.1%
42.9%
100.
0%40.0%
60.0%
100.
0%15
3853
1933
5217
3552
1446
6015
4762
28.3%
71.7%
100.
0%36.5%
63.5%
100.
0%32.7%
67.3%
100.
0%23.3%
76.7%
100.
0%24.2%
75.8%
100.
0%8
917
98
1715
823
176
2312
315
47.1%
52.9%
100.
0%52.9%
47.1%
100.
0%65.2%
34.8%
100.
0%73.9%
26.1%
100.
0%80.0%
20.0%
100.
0%0
66
04
40
66
04
40
77
0.0%
100.0%
100.
0%0.0%
100.0%
100.
0%0.0%
100.0%
100.
0%0.0%
100.0%
100.
0%0.0%
100.0%
100.
0%9
3544
1231
4315
3853
1535
5012
4557
20.5%
79.5%
100.
0%27.9%
72.1%
100.
0%28.3%
71.7%
100.
0%30.0%
70.0%
100.
0%21.1%
78.9%
100.
0%8
1826
915
2412
1527
1113
2413
1427
30.8%
69.2%
100.
0%37.5%
62.5%
100.
0%44.4%
55.6%
100.
0%45.8%
54.2%
100.
0%48.1%
51.9%
100.
0%9
2433
1417
3113
1831
1023
338
2230
27.3%
72.7%
100.
0%45.2%
54.8%
100.
0%41.9%
58.1%
100.
0%30.3%
69.7%
100.
0%26.7%
73.3%
100.
0%6
1420
59
148
614
107
1714
923
30.0%
70.0%
100.
0%35.7%
64.3%
100.
0%57.1%
42.9%
100.
0%58.8%
41.2%
100.
0%60.9%
39.1%
100.
0%27
2451
3125
5629
2655
2325
4825
2550
52.9%
47.1%
100.
0%55.4%
44.6%
100.
0%52.7%
47.3%
100.
0%47.9%
52.1%
100.
0%50.0%
50.0%
100.
0%23
4669
2846
7426
5177
2743
7025
5075
33.3%
66.7%
100.
0%37.8%
62.2%
100.
0%33.8%
66.2%
100.
0%38.6%
61.4%
100.
0%33.3%
66.7%
100.
0%11
2031
1417
3112
1325
1318
3116
1329
35.5%
64.5%
100.
0%45.2%
54.8%
100.
0%48.0%
52.0%
100.
0%41.9%
58.1%
100.
0%55.2%
44.8%
100.
0%10
9110
118
9311
125
9211
718
9811
624
110
134
9.9%
90.1%
100.
0%16.2%
83.8%
100.
0%21.4%
78.6%
100.
0%15.5%
84.5%
100.
0%17.9%
82.1%
100.
0%4
2327
418
222
2022
125
262
2224
14.8%
85.2%
100.
0%18.2%
81.8%
100.
0%9.1%
90.9%
100.
0%3.8%
96.2%
100.
0%8.3%
91.7%
100.
0%7
1421
213
154
1721
518
238
1422
33.3%
66.7%
100.
0%13.3%
86.7%
100.
0%19.0%
81.0%
100.
0%21.7%
78.3%
100.
0%36.4%
63.6%
100.
0%10
818
1010
206
1016
612
186
612
55.6%
44.4%
100.
0%50.0%
50.0%
100.
0%37.5%
62.5%
100.
0%33.3%
66.7%
100.
0%50.0%
50.0%
100.
0%95
2211
7102
2712
999
3313
2102
3413
6107
4014
781.2%
18.8%
100.
0%79.1%
20.9%
100.
0%75.0%
25.0%
100.
0%75.0%
25.0%
100.
0%72.8%
27.2%
100.
0%620
210
830
668
207
875
662
219
881
669
224
893
690
249
939
74.7%
25.3%
100.
0%76.3%
23.7%
100.
0%75.1%
24.9%
100.
0%74.9%
25.1%
100.
0%73.5%
26.5%
100.
0%0
00
00
00
00
41
59
09
0.0%
0.0%
0.0%
0.0%
0.0%
0.0%
0.0%
0.0%
0.0%
80.0%
20.0%
100.
0%100.0%
0.0%
100.
0%
(cont.)
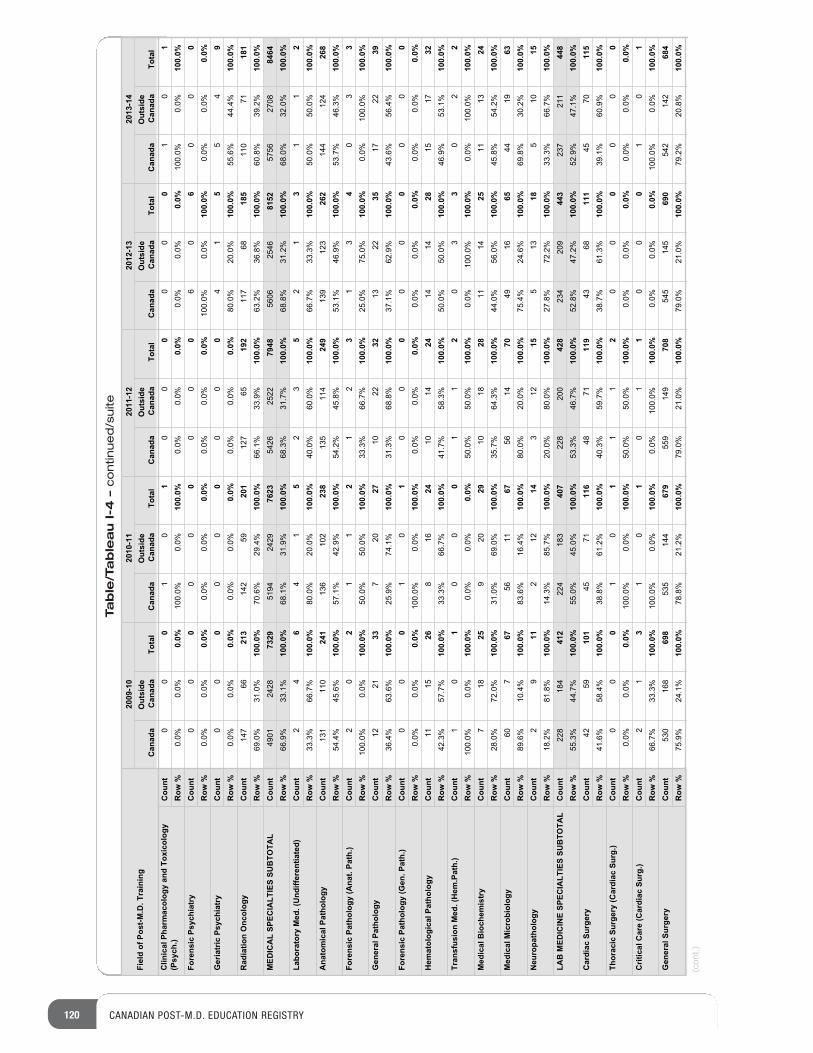
120 CANADIAN POST-M.D. EDUCATION REGISTRY
Table/Tableau I-4 –continued/suite
Fiel
d of
Pos
t-M.D
. Tra
inin
g20
09-1
020
10-1
120
11-1
220
12-1
320
13-1
4
Can
ada
Out
side
C
anad
aTo
tal
Can
ada
Out
side
C
anad
aTo
tal
Can
ada
Out
side
C
anad
aTo
tal
Can
ada
Out
side
C
anad
aTo
tal
Can
ada
Out
side
C
anad
aTo
tal
Clin
ical
Pha
rmac
olog
y an
d To
xico
logy
(P
sych
.)C
ount
Row
%Fo
rens
ic P
sych
iatr
yC
ount
Row
%G
eria
tric
Psy
chia
try
Cou
ntR
ow %
Rad
iatio
n O
ncol
ogy
Cou
ntR
ow %
MED
ICA
L SP
ECIA
LTIE
S SU
BTO
TAL
Cou
ntR
ow %
Labo
rato
ry M
ed. (
Und
iffer
entia
ted)
Cou
ntR
ow %
Ana
tom
ical
Pat
holo
gyC
ount
Row
%Fo
rens
ic P
atho
logy
(Ana
t. Pa
th.)
Cou
ntR
ow %
Gen
eral
Pat
holo
gyC
ount
Row
%Fo
rens
ic P
atho
logy
(Gen
. Pat
h.)
Cou
ntR
ow %
Hem
atol
ogic
al P
atho
logy
Cou
ntR
ow %
Tran
sfus
ion
Med
. (H
em.P
ath.
)C
ount
Row
%M
edic
al B
ioch
emis
try
Cou
ntR
ow %
Med
ical
Mic
robi
olog
yC
ount
Row
%N
euro
path
olog
yC
ount
Row
%LA
B M
EDIC
INE
SPEC
IALT
IES
SUB
TOTA
LC
ount
Row
%C
ardi
ac S
urge
ryC
ount
Row
%Th
orac
ic S
urge
ry (C
ardi
ac S
urg.
)C
ount
Row
%C
ritic
al C
are
(Car
diac
Sur
g.)
Cou
ntR
ow %
Gen
eral
Sur
gery
Cou
ntR
ow %
00
01
01
00
00
00
10
10.0%
0.0%
0.0%
100.0%
0.0%
100.
0%0.0%
0.0%
0.0%
0.0%
0.0%
0.0%
100.0%
0.0%
100.
0%0
00
00
00
00
60
60
00
0.0%
0.0%
0.0%
0.0%
0.0%
0.0%
0.0%
0.0%
0.0%
100.0%
0.0%
100.
0%0.0%
0.0%
0.0%
00
00
00
00
04
15
54
90.0%
0.0%
0.0%
0.0%
0.0%
0.0%
0.0%
0.0%
0.0%
80.0%
20.0%
100.
0%55.6%
44.4%
100.
0%147
6621
3142
5920
1127
6519
2117
6818
5110
7118
169.0%
31.0%
100.
0%70.6%
29.4%
100.
0%66.1%
33.9%
100.
0%63.2%
36.8%
100.
0%60.8%
39.2%
100.
0%4901
2428
7329
5194
2429
7623
5426
2522
7948
5606
2546
8152
5756
2708
8464
66.9%
33.1%
100.
0%68.1%
31.9%
100.
0%68.3%
31.7%
100.
0%68.8%
31.2%
100.
0%68.0%
32.0%
100.
0%2
46
41
52
35
21
31
12
33.3%
66.7%
100.
0%80.0%
20.0%
100.
0%40.0%
60.0%
100.
0%66.7%
33.3%
100.
0%50.0%
50.0%
100.
0%131
110
241
136
102
238
135
114
249
139
123
262
144
124
268
54.4%
45.6%
100.
0%57.1%
42.9%
100.
0%54.2%
45.8%
100.
0%53.1%
46.9%
100.
0%53.7%
46.3%
100.
0%2
02
11
21
23
13
40
33
100.0%
0.0%
100.
0%50.0%
50.0%
100.
0%33.3%
66.7%
100.
0%25.0%
75.0%
100.
0%0.0%
100.0%
100.
0%12
2133
720
2710
2232
1322
3517
2239
36.4%
63.6%
100.
0%25.9%
74.1%
100.
0%31.3%
68.8%
100.
0%37.1%
62.9%
100.
0%43.6%
56.4%
100.
0%0
00
10
10
00
00
00
00
0.0%
0.0%
0.0%
100.0%
0.0%
100.
0%0.0%
0.0%
0.0%
0.0%
0.0%
0.0%
0.0%
0.0%
0.0%
1115
268
1624
1014
2414
1428
1517
3242.3%
57.7%
100.
0%33.3%
66.7%
100.
0%41.7%
58.3%
100.
0%50.0%
50.0%
100.
0%46.9%
53.1%
100.
0%1
01
00
01
12
03
30
22
100.0%
0.0%
100.
0%0.0%
0.0%
0.0%
50.0%
50.0%
100.
0%0.0%
100.0%
100.
0%0.0%
100.0%
100.
0%7
1825
920
2910
1828
1114
2511
1324
28.0%
72.0%
100.
0%31.0%
69.0%
100.
0%35.7%
64.3%
100.
0%44.0%
56.0%
100.
0%45.8%
54.2%
100.
0%60
767
5611
6756
1470
4916
6544
1963
89.6%
10.4%
100.
0%83.6%
16.4%
100.
0%80.0%
20.0%
100.
0%75.4%
24.6%
100.
0%69.8%
30.2%
100.
0%2
911
212
143
1215
513
185
1015
18.2%
81.8%
100.
0%14.3%
85.7%
100.
0%20.0%
80.0%
100.
0%27.8%
72.2%
100.
0%33.3%
66.7%
100.
0%228
184
412
224
183
407
228
200
428
234
209
443
237
211
448
55.3%
44.7%
100.
0%55.0%
45.0%
100.
0%53.3%
46.7%
100.
0%52.8%
47.2%
100.
0%52.9%
47.1%
100.
0%42
5910
145
7111
648
7111
943
6811
145
7011
541.6%
58.4%
100.
0%38.8%
61.2%
100.
0%40.3%
59.7%
100.
0%38.7%
61.3%
100.
0%39.1%
60.9%
100.
0%0
00
10
11
12
00
00
00
0.0%
0.0%
0.0%
100.0%
0.0%
100.
0%50.0%
50.0%
100.
0%0.0%
0.0%
0.0%
0.0%
0.0%
0.0%
21
31
01
01
10
00
10
166.7%
33.3%
100.
0%100.0%
0.0%
100.
0%0.0%
100.0%
100.
0%0.0%
0.0%
0.0%
100.0%
0.0%
100.
0%530
168
698
535
144
679
559
149
708
545
145
690
542
142
684
75.9%
24.1%
100.
0%78.8%
21.2%
100.
0%79.0%
21.0%
100.
0%79.0%
21.0%
100.
0%79.2%
20.8%
100.
0%
(cont.)
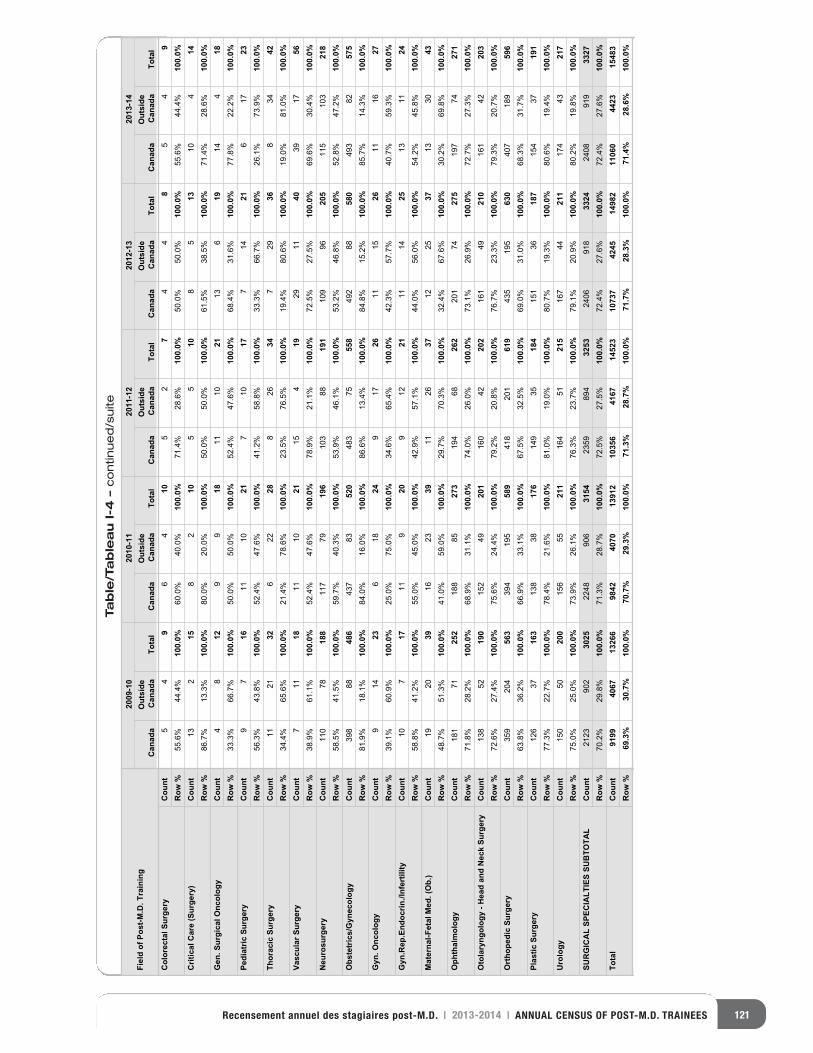
121Recensement annuel des stagiaires post-M.D. | 2013-2014 | ANNUAL CENSUS OF POST-M.D. TRAINEES
Table/Tableau I-4 –continued/suite
Fiel
d of
Pos
t-M.D
. Tra
inin
g20
09-1
020
10-1
120
11-1
220
12-1
320
13-1
4
Can
ada
Out
side
C
anad
aTo
tal
Can
ada
Out
side
C
anad
aTo
tal
Can
ada
Out
side
C
anad
aTo
tal
Can
ada
Out
side
C
anad
aTo
tal
Can
ada
Out
side
C
anad
aTo
tal
Col
orec
tal S
urge
ryC
ount
Row
%C
ritic
al C
are
(Sur
gery
)C
ount
Row
%G
en. S
urgi
cal O
ncol
ogy
Cou
ntR
ow %
Pedi
atric
Sur
gery
Cou
ntR
ow %
Thor
acic
Sur
gery
Cou
ntR
ow %
Vasc
ular
Sur
gery
Cou
ntR
ow %
Neu
rosu
rger
yC
ount
Row
%O
bste
tric
s/G
ynec
olog
yC
ount
Row
%G
yn. O
ncol
ogy
Cou
ntR
ow %
Gyn
.Rep
.End
ocrin
./Inf
ertil
ityC
ount
Row
%M
ater
nal-F
etal
Med
. (O
b.)
Cou
ntR
ow %
Oph
thal
mol
ogy
Cou
ntR
ow %
Oto
lary
ngol
ogy
- Hea
d an
d N
eck
Surg
ery
Cou
ntR
ow %
Ort
hope
dic
Surg
ery
Cou
ntR
ow %
Plas
tic S
urge
ryC
ount
Row
%U
rolo
gyC
ount
Row
%SU
RG
ICA
L SP
ECIA
LTIE
S SU
BTO
TAL
Cou
ntR
ow %
Tota
lC
ount
Row
%
54
96
410
52
74
48
54
955.6%
44.4%
100.
0%60.0%
40.0%
100.
0%71.4%
28.6%
100.
0%50.0%
50.0%
100.
0%55.6%
44.4%
100.
0%13
215
82
105
510
85
1310
414
86.7%
13.3%
100.
0%80.0%
20.0%
100.
0%50.0%
50.0%
100.
0%61.5%
38.5%
100.
0%71.4%
28.6%
100.
0%4
812
99
1811
1021
136
1914
418
33.3%
66.7%
100.
0%50.0%
50.0%
100.
0%52.4%
47.6%
100.
0%68.4%
31.6%
100.
0%77.8%
22.2%
100.
0%9
716
1110
217
1017
714
216
1723
56.3%
43.8%
100.
0%52.4%
47.6%
100.
0%41.2%
58.8%
100.
0%33.3%
66.7%
100.
0%26.1%
73.9%
100.
0%11
2132
622
288
2634
729
368
3442
34.4%
65.6%
100.
0%21.4%
78.6%
100.
0%23.5%
76.5%
100.
0%19.4%
80.6%
100.
0%19.0%
81.0%
100.
0%7
1118
1110
2115
419
2911
4039
1756
38.9%
61.1%
100.
0%52.4%
47.6%
100.
0%78.9%
21.1%
100.
0%72.5%
27.5%
100.
0%69.6%
30.4%
100.
0%110
7818
8117
7919
6103
8819
1109
9620
5115
103
218
58.5%
41.5%
100.
0%59.7%
40.3%
100.
0%53.9%
46.1%
100.
0%53.2%
46.8%
100.
0%52.8%
47.2%
100.
0%398
8848
6437
8352
0483
7555
8492
8858
0493
8257
581.9%
18.1%
100.
0%84.0%
16.0%
100.
0%86.6%
13.4%
100.
0%84.8%
15.2%
100.
0%85.7%
14.3%
100.
0%9
1423
618
249
1726
1115
2611
1627
39.1%
60.9%
100.
0%25.0%
75.0%
100.
0%34.6%
65.4%
100.
0%42.3%
57.7%
100.
0%40.7%
59.3%
100.
0%10
717
119
209
1221
1114
2513
1124
58.8%
41.2%
100.
0%55.0%
45.0%
100.
0%42.9%
57.1%
100.
0%44.0%
56.0%
100.
0%54.2%
45.8%
100.
0%19
2039
1623
3911
2637
1225
3713
3043
48.7%
51.3%
100.
0%41.0%
59.0%
100.
0%29.7%
70.3%
100.
0%32.4%
67.6%
100.
0%30.2%
69.8%
100.
0%181
7125
2188
8527
3194
6826
2201
7427
5197
7427
171.8%
28.2%
100.
0%68.9%
31.1%
100.
0%74.0%
26.0%
100.
0%73.1%
26.9%
100.
0%72.7%
27.3%
100.
0%138
5219
0152
4920
1160
4220
2161
4921
0161
4220
372.6%
27.4%
100.
0%75.6%
24.4%
100.
0%79.2%
20.8%
100.
0%76.7%
23.3%
100.
0%79.3%
20.7%
100.
0%359
204
563
394
195
589
418
201
619
435
195
630
407
189
596
63.8%
36.2%
100.
0%66.9%
33.1%
100.
0%67.5%
32.5%
100.
0%69.0%
31.0%
100.
0%68.3%
31.7%
100.
0%126
3716
3138
3817
6149
3518
4151
3618
7154
3719
177.3%
22.7%
100.
0%78.4%
21.6%
100.
0%81.0%
19.0%
100.
0%80.7%
19.3%
100.
0%80.6%
19.4%
100.
0%150
5020
0156
5521
1164
5121
5167
4421
1174
4321
775.0%
25.0%
100.
0%73.9%
26.1%
100.
0%76.3%
23.7%
100.
0%79.1%
20.9%
100.
0%80.2%
19.8%
100.
0%2123
902
3025
2248
906
3154
2359
894
3253
2406
918
3324
2408
919
3327
70.2%
29.8%
100.
0%71.3%
28.7%
100.
0%72.5%
27.5%
100.
0%72.4%
27.6%
100.
0%72.4%
27.6%
100.
0%91
9940
6713
266
9842
4070
1391
210
356
4167
1452
310
737
4245
1498
211
060
4423
1548
369
.3%
30.7
%10
0.0%
70.7
%29
.3%
100.
0%71
.3%
28.7
%10
0.0%
71.7
%28
.3%
100.
0%71
.4%
28.6
%10
0.0%
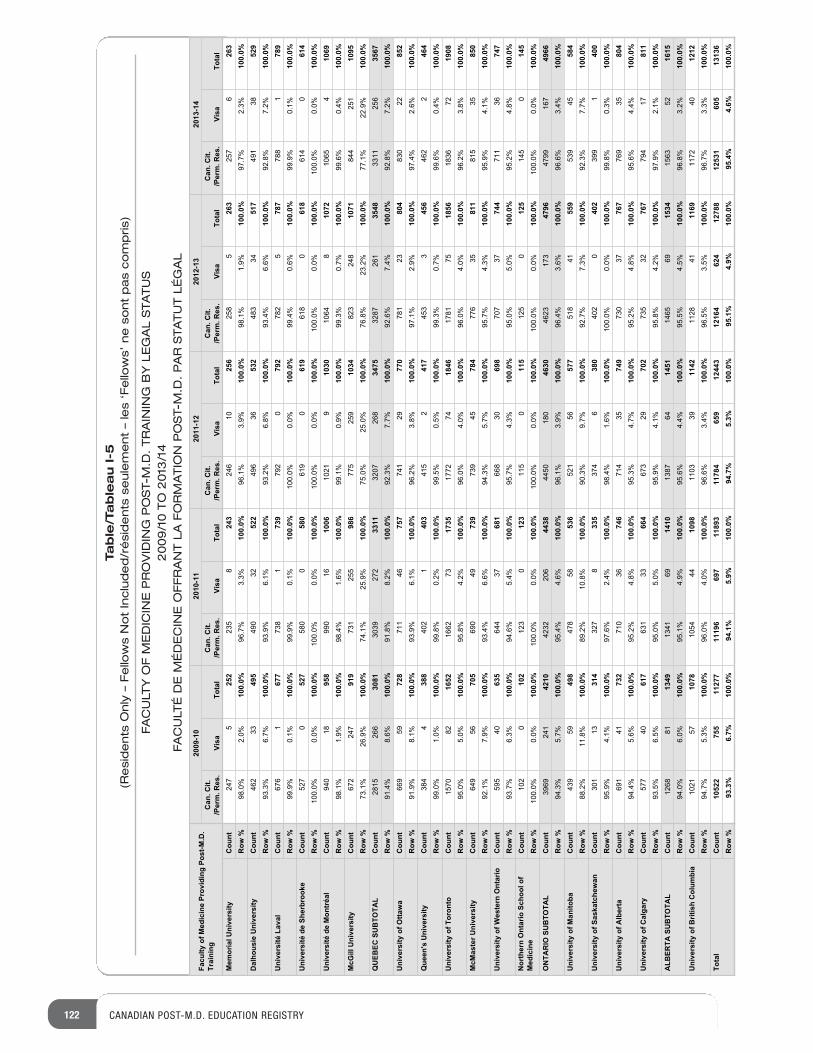
122 CANADIAN POST-M.D. EDUCATION REGISTRY
Table/Tableau I-5
(Residents Only – Fellows Not Included/résidents seulement – les ‘Fellows’ ne sont pas compris)
FACULTY OF MEDICINE PROVIDING POST-M.D. TRAINING BY LEGAL STATUS
2009/10 TO 2013/14
FACULTÉ DE MÉDECINE OFFRANT LA FORMATION POST-M.D. PAR STATUT LÉGAL
Facu
lty o
f Med
icin
e Pr
ovid
ing
Post
-M.D
. Tr
aini
ng
2009
-10
2010
-11
2011
-12
2012
-13
2013
-14
Can
. Cit.
/Per
m. R
es.
Visa
Tota
lC
an. C
it./P
erm
. Res
.Vi
saTo
tal
Can
. Cit.
/Per
m. R
es.
Visa
Tota
lC
an. C
it./P
erm
. Res
.Vi
saTo
tal
Can
. Cit.
/Per
m. R
es.
Visa
Tota
lM
emor
ial U
nive
rsity
Cou
ntR
ow %
Dal
hous
ie U
nive
rsity
Cou
ntR
ow %
Uni
vers
ité L
aval
Cou
ntR
ow %
Uni
vers
ité d
e Sh
erbr
ooke
Cou
ntR
ow %
Uni
vers
ité d
e M
ontr
éal
Cou
ntR
ow %
McG
ill U
nive
rsity
Cou
ntR
ow %
QU
EBEC
SU
BTO
TAL
Cou
ntR
ow %
Uni
vers
ity o
f Otta
wa
Cou
ntR
ow %
Que
en's
Uni
vers
ityC
ount
Row
%U
nive
rsity
of T
oron
toC
ount
Row
%M
cMas
ter U
nive
rsity
Cou
ntR
ow %
Uni
vers
ity o
f Wes
tern
Ont
ario
Cou
ntR
ow %
Nor
ther
n O
ntar
io S
choo
l of
Med
icin
eC
ount
Row
%O
NTA
RIO
SU
BTO
TAL
Cou
ntR
ow %
Uni
vers
ity o
f Man
itoba
Cou
ntR
ow %
Uni
vers
ity o
f Sas
katc
hew
anC
ount
Row
%U
nive
rsity
of A
lber
taC
ount
Row
%U
nive
rsity
of C
alga
ryC
ount
Row
%A
LBER
TA S
UB
TOTA
LC
ount
Row
%U
nive
rsity
of B
ritis
h C
olum
bia
Cou
ntR
ow %
Tota
lC
ount
Row
%
247
525
2235
824
3246
1025
6258
526
3257
626
398.0%
2.0%
100.
0%96.7%
3.3%
100.
0%96.1%
3.9%
100.
0%98.1%
1.9%
100.
0%97.7%
2.3%
100.
0%462
3349
5490
3252
2496
3653
2483
3451
7491
3852
993.3%
6.7%
100.
0%93.9%
6.1%
100.
0%93.2%
6.8%
100.
0%93.4%
6.6%
100.
0%92.8%
7.2%
100.
0%676
167
7738
173
9792
079
2782
578
7788
178
999.9%
0.1%
100.
0%99.9%
0.1%
100.
0%100.0%
0.0%
100.
0%99.4%
0.6%
100.
0%99.9%
0.1%
100.
0%527
052
7580
058
0619
061
9618
061
8614
061
4100.0%
0.0%
100.
0%100.0%
0.0%
100.
0%100.0%
0.0%
100.
0%100.0%
0.0%
100.
0%100.0%
0.0%
100.
0%940
1895
8990
1610
061021
910
301064
810
721065
410
6998.1%
1.9%
100.
0%98.4%
1.6%
100.
0%99.1%
0.9%
100.
0%99.3%
0.7%
100.
0%99.6%
0.4%
100.
0%672
247
919
731
255
986
775
259
1034
823
248
1071
844
251
1095
73.1%
26.9%
100.
0%74.1%
25.9%
100.
0%75.0%
25.0%
100.
0%76.8%
23.2%
100.
0%77.1%
22.9%
100.
0%2815
266
3081
3039
272
3311
3207
268
3475
3287
261
3548
3311
256
3567
91.4%
8.6%
100.
0%91.8%
8.2%
100.
0%92.3%
7.7%
100.
0%92.6%
7.4%
100.
0%92.8%
7.2%
100.
0%669
5972
8711
4675
7741
2977
0781
2380
4830
2285
291.9%
8.1%
100.
0%93.9%
6.1%
100.
0%96.2%
3.8%
100.
0%97.1%
2.9%
100.
0%97.4%
2.6%
100.
0%384
438
8402
140
3415
241
7453
345
6462
246
499.0%
1.0%
100.
0%99.8%
0.2%
100.
0%99.5%
0.5%
100.
0%99.3%
0.7%
100.
0%99.6%
0.4%
100.
0%1570
8216
521662
7317
351772
7418
461781
7518
561836
7219
0895.0%
5.0%
100.
0%95.8%
4.2%
100.
0%96.0%
4.0%
100.
0%96.0%
4.0%
100.
0%96.2%
3.8%
100.
0%649
5670
5690
4973
9739
4578
4776
3581
1815
3585
092.1%
7.9%
100.
0%93.4%
6.6%
100.
0%94.3%
5.7%
100.
0%95.7%
4.3%
100.
0%95.9%
4.1%
100.
0%595
4063
5644
3768
1668
3069
8707
3774
4711
3674
793.7%
6.3%
100.
0%94.6%
5.4%
100.
0%95.7%
4.3%
100.
0%95.0%
5.0%
100.
0%95.2%
4.8%
100.
0%102
010
2123
012
3115
011
5125
012
5145
014
5100.0%
0.0%
100.
0%100.0%
0.0%
100.
0%100.0%
0.0%
100.
0%100.0%
0.0%
100.
0%100.0%
0.0%
100.
0%3969
241
4210
4232
206
4438
4450
180
4630
4623
173
4796
4799
167
4966
94.3%
5.7%
100.
0%95.4%
4.6%
100.
0%96.1%
3.9%
100.
0%96.4%
3.6%
100.
0%96.6%
3.4%
100.
0%439
5949
8478
5853
6521
5657
7518
4155
9539
4558
488.2%
11.8%
100.
0%89.2%
10.8%
100.
0%90.3%
9.7%
100.
0%92.7%
7.3%
100.
0%92.3%
7.7%
100.
0%301
1331
4327
833
5374
638
0402
040
2399
140
095.9%
4.1%
100.
0%97.6%
2.4%
100.
0%98.4%
1.6%
100.
0%100.0%
0.0%
100.
0%99.8%
0.3%
100.
0%691
4173
2710
3674
6714
3574
9730
3776
7769
3580
494.4%
5.6%
100.
0%95.2%
4.8%
100.
0%95.3%
4.7%
100.
0%95.2%
4.8%
100.
0%95.6%
4.4%
100.
0%577
4061
7631
3366
4673
2970
2735
3276
7794
1781
193.5%
6.5%
100.
0%95.0%
5.0%
100.
0%95.9%
4.1%
100.
0%95.8%
4.2%
100.
0%97.9%
2.1%
100.
0%1268
8113
491341
6914
101387
6414
511465
6915
341563
5216
1594.0%
6.0%
100.
0%95.1%
4.9%
100.
0%95.6%
4.4%
100.
0%95.5%
4.5%
100.
0%96.8%
3.2%
100.
0%1021
5710
781054
4410
981103
3911
421128
4111
691172
4012
1294.7%
5.3%
100.
0%96.0%
4.0%
100.
0%96.6%
3.4%
100.
0%96.5%
3.5%
100.
0%96.7%
3.3%
100.
0%10
522
755
1127
711
196
697
1189
311
784
659
1244
312
164
624
1278
812
531
605
1313
693
.3%
6.7%
100.
0%94
.1%
5.9%
100.
0%94
.7%
5.3%
100.
0%95
.1%
4.9%
100.
0%95
.4%
4.6%
100.
0%
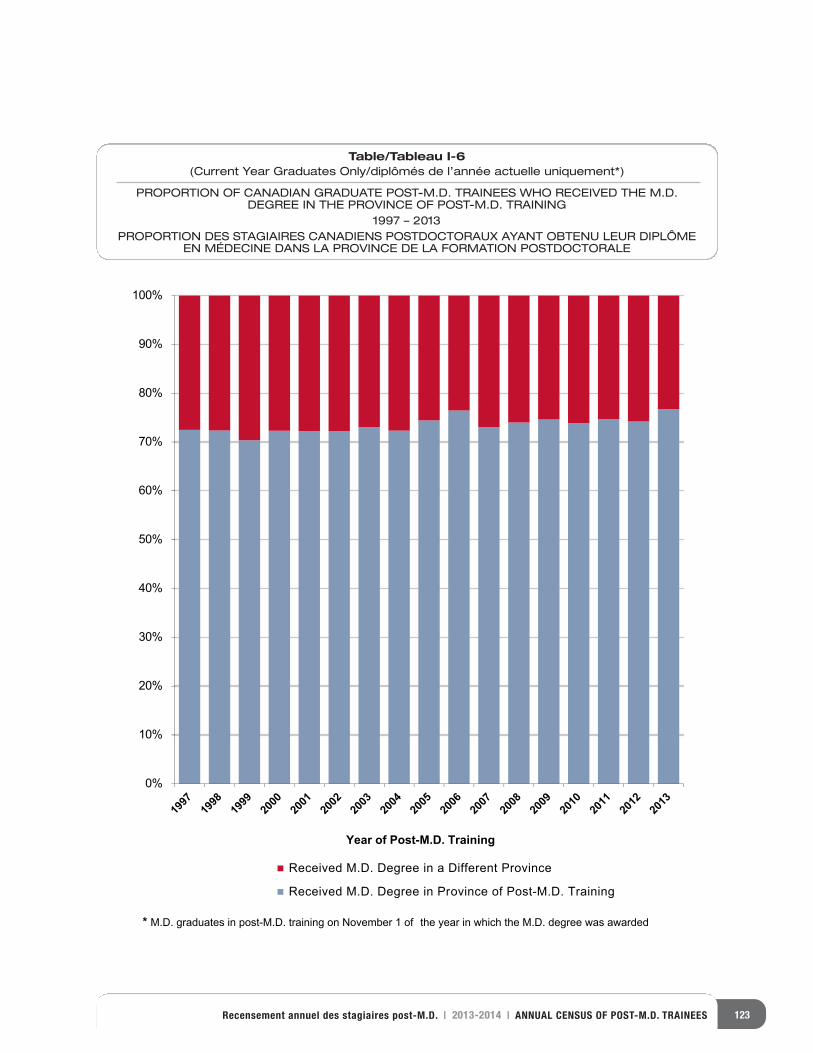
123Recensement annuel des stagiaires post-M.D. | 2013-2014 | ANNUAL CENSUS OF POST-M.D. TRAINEES
0%
10%
20%
30%
40%
50%
60%
70%
80%
90%
100%
Year of Post-M.D. Training
Received M.D. Degree in a Different Province
Received M.D. Degree in Province of Post-M.D. Training
* M.D. graduates in post-M.D. training on November 1 of the year in which the M.D. degree was awarded
Table/Tableau I-6(Current Year Graduates Only/diplômés de l’année actuelle uniquement*)
PROPORTION OF CANADIAN GRADUATE POST-M.D. TRAINEES WHO RECEIVED THE M.D.DEGREE IN THE PROVINCE OF POST-M.D. TRAINING
1997 – 2013PROPORTION DES STAGIAIRES CANADIENS POSTDOCTORAUX AYANT OBTENU LEUR DIPLÔME
EN MÉDECINE DANS LA PROVINCE DE LA FORMATION POSTDOCTORALE
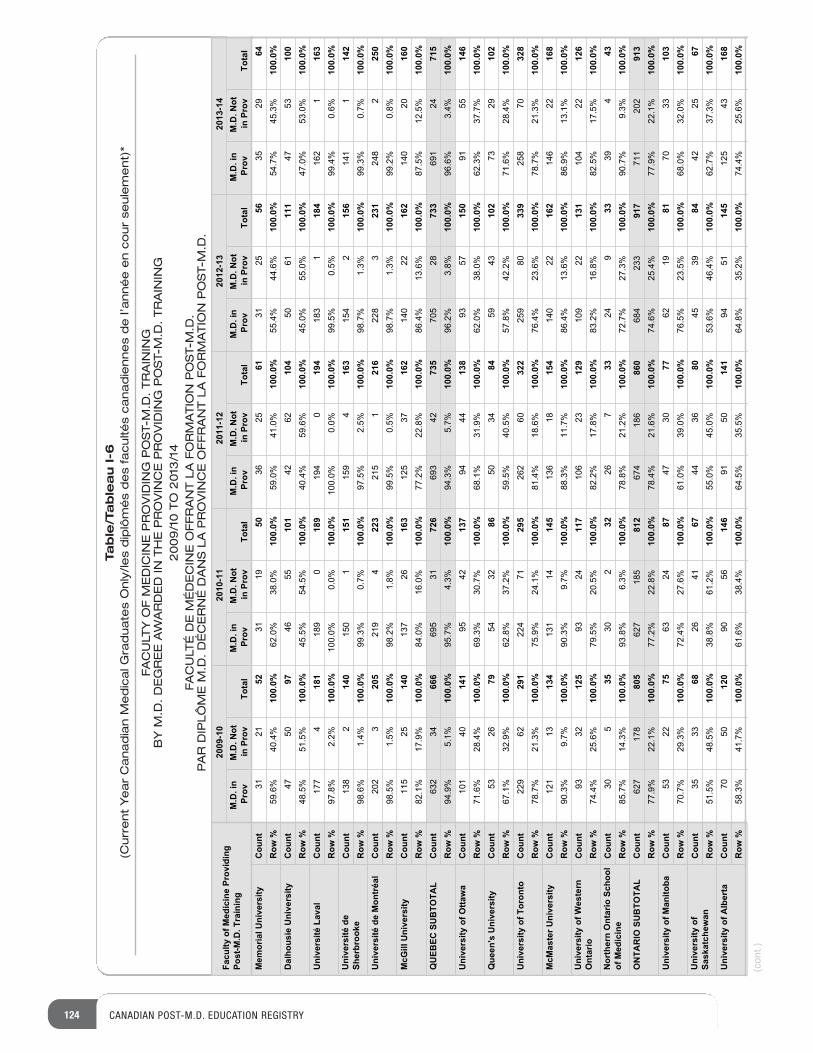
124 CANADIAN POST-M.D. EDUCATION REGISTRY
Table/Tableau I-6
(Current Year Canadian Medical Graduates Only/les diplômés des facultés canadiennes de l’année en cour seulement)*
FACULTY OF MEDICINE PROVIDING POST-M.D. TRAINING
BY M.D. DEGREE AWARDED IN THE PROVINCE PROVIDING POST-M.D. TRAINING
2009/10 TO 2013/14
FACULTÉ DE MÉDECINE OFFRANT LA FORMATION POST-M.D.
PAR DIPLÔME M.D. DÉCERNÉ DANS LA PROVINCE OFFRANT LA FORMATION POST-M.D.
Facu
lty o
f Med
icin
e Pr
ovid
ing
Post
-M.D
. Tra
inin
g
2009
-10
2010
-11
2011
-12
2012
-13
2013
-14
M.D
. in
Prov
M.D
. Not
in
Pro
vTo
tal
M.D
. in
Prov
M.D
. Not
in
Pro
vTo
tal
M.D
. in
Prov
M.D
. Not
in
Pro
vTo
tal
M.D
. in
Prov
M.D
. Not
in
Pro
vTo
tal
M.D
. in
Prov
M.D
. Not
in
Pro
vTo
tal
Mem
oria
l Uni
vers
ityC
ount
Row
%D
alho
usie
Uni
vers
ityC
ount
Row
%U
nive
rsité
Lav
alC
ount
Row
%U
nive
rsité
de
Sher
broo
keC
ount
Row
%U
nive
rsité
de
Mon
tréa
lC
ount
Row
%M
cGill
Uni
vers
ityC
ount
Row
%Q
UEB
EC S
UB
TOTA
LC
ount
Row
%U
nive
rsity
of O
ttaw
aC
ount
Row
%Q
ueen
's U
nive
rsity
Cou
ntR
ow %
Uni
vers
ity o
f Tor
onto
Cou
ntR
ow %
McM
aste
r Uni
vers
ityC
ount
Row
%U
nive
rsity
of W
este
rn
Ont
ario
Cou
ntR
ow %
Nor
ther
n O
ntar
io S
choo
l of
Med
icin
eC
ount
Row
%O
NTA
RIO
SU
BTO
TAL
Cou
ntR
ow %
Uni
vers
ity o
f Man
itoba
Cou
ntR
ow %
Uni
vers
ity o
f Sa
skat
chew
anC
ount
Row
%U
nive
rsity
of A
lber
taC
ount
Row
%
3121
5231
1950
3625
6131
2556
3529
6459.6%
40.4%
100.
0%62.0%
38.0%
100.
0%59.0%
41.0%
100.
0%55.4%
44.6%
100.
0%54.7%
45.3%
100.
0%47
5097
4655
101
4262
104
5061
111
4753
100
48.5%
51.5%
100.
0%45.5%
54.5%
100.
0%40.4%
59.6%
100.
0%45.0%
55.0%
100.
0%47.0%
53.0%
100.
0%177
418
1189
018
9194
019
4183
118
4162
116
397.8%
2.2%
100.
0%100.0%
0.0%
100.
0%100.0%
0.0%
100.
0%99.5%
0.5%
100.
0%99.4%
0.6%
100.
0%138
214
0150
115
1159
416
3154
215
6141
114
298.6%
1.4%
100.
0%99.3%
0.7%
100.
0%97.5%
2.5%
100.
0%98.7%
1.3%
100.
0%99.3%
0.7%
100.
0%202
320
5219
422
3215
121
6228
323
1248
225
098.5%
1.5%
100.
0%98.2%
1.8%
100.
0%99.5%
0.5%
100.
0%98.7%
1.3%
100.
0%99.2%
0.8%
100.
0%115
2514
0137
2616
3125
3716
2140
2216
2140
2016
082.1%
17.9%
100.
0%84.0%
16.0%
100.
0%77.2%
22.8%
100.
0%86.4%
13.6%
100.
0%87.5%
12.5%
100.
0%632
3466
6695
3172
6693
4273
5705
2873
3691
2471
594.9%
5.1%
100.
0%95.7%
4.3%
100.
0%94.3%
5.7%
100.
0%96.2%
3.8%
100.
0%96.6%
3.4%
100.
0%101
4014
195
4213
794
4413
893
5715
091
5514
671.6%
28.4%
100.
0%69.3%
30.7%
100.
0%68.1%
31.9%
100.
0%62.0%
38.0%
100.
0%62.3%
37.7%
100.
0%53
2679
5432
8650
3484
5943
102
7329
102
67.1%
32.9%
100.
0%62.8%
37.2%
100.
0%59.5%
40.5%
100.
0%57.8%
42.2%
100.
0%71.6%
28.4%
100.
0%229
6229
1224
7129
5262
6032
2259
8033
9258
7032
878.7%
21.3%
100.
0%75.9%
24.1%
100.
0%81.4%
18.6%
100.
0%76.4%
23.6%
100.
0%78.7%
21.3%
100.
0%121
1313
4131
1414
5136
1815
4140
2216
2146
2216
890.3%
9.7%
100.
0%90.3%
9.7%
100.
0%88.3%
11.7%
100.
0%86.4%
13.6%
100.
0%86.9%
13.1%
100.
0%93
3212
593
2411
7106
2312
9109
2213
1104
2212
674.4%
25.6%
100.
0%79.5%
20.5%
100.
0%82.2%
17.8%
100.
0%83.2%
16.8%
100.
0%82.5%
17.5%
100.
0%30
535
302
3226
733
249
3339
443
85.7%
14.3%
100.
0%93.8%
6.3%
100.
0%78.8%
21.2%
100.
0%72.7%
27.3%
100.
0%90.7%
9.3%
100.
0%627
178
805
627
185
812
674
186
860
684
233
917
711
202
913
77.9%
22.1%
100.
0%77.2%
22.8%
100.
0%78.4%
21.6%
100.
0%74.6%
25.4%
100.
0%77.9%
22.1%
100.
0%53
2275
6324
8747
3077
6219
8170
3310
370.7%
29.3%
100.
0%72.4%
27.6%
100.
0%61.0%
39.0%
100.
0%76.5%
23.5%
100.
0%68.0%
32.0%
100.
0%35
3368
2641
6744
3680
4539
8442
2567
51.5%
48.5%
100.
0%38.8%
61.2%
100.
0%55.0%
45.0%
100.
0%53.6%
46.4%
100.
0%62.7%
37.3%
100.
0%70
5012
090
5614
691
5014
194
5114
5125
4316
858.3%
41.7%
100.
0%61.6%
38.4%
100.
0%64.5%
35.5%
100.
0%64.8%
35.2%
100.
0%74.4%
25.6%
100.
0%
(cont.)
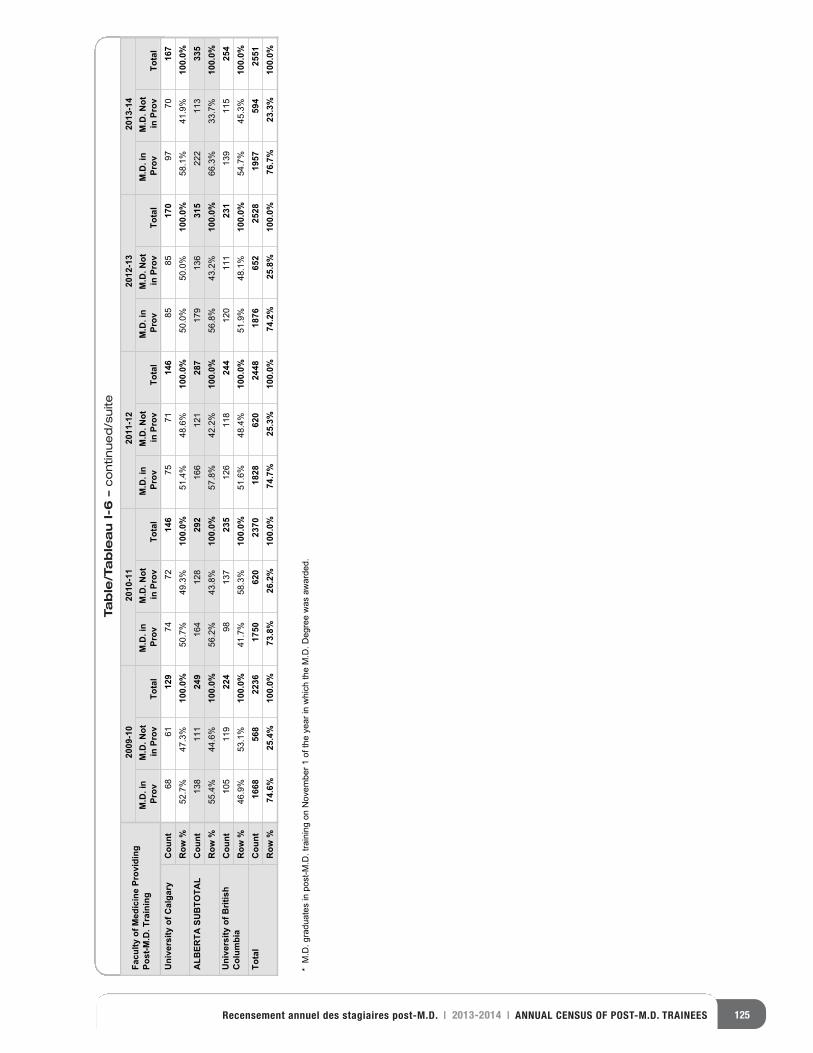
125Recensement annuel des stagiaires post-M.D. | 2013-2014 | ANNUAL CENSUS OF POST-M.D. TRAINEES
Table/Tableau I-6 –continued/suite
Facu
lty o
f Med
icin
e Pr
ovid
ing
Post
-M.D
. Tra
inin
g
2009
-10
2010
-11
2011
-12
2012
-13
2013
-14
M.D
. in
Prov
M.D
. Not
in
Pro
vTo
tal
M.D
. in
Prov
M.D
. Not
in
Pro
vTo
tal
M.D
. in
Prov
M.D
. Not
in
Pro
vTo
tal
M.D
. in
Prov
M.D
. Not
in
Pro
vTo
tal
M.D
. in
Prov
M.D
. Not
in
Pro
vTo
tal
Uni
vers
ity o
f Cal
gary
Cou
ntR
ow %
ALB
ERTA
SU
BTO
TAL
Cou
ntR
ow %
Uni
vers
ity o
f Brit
ish
Col
umbi
aC
ount
Row
%To
tal
Cou
ntR
ow %
6861
129
7472
146
7571
146
8585
170
9770
167
52.7
%47
.3%
100.
0%50
.7%
49.3
%10
0.0%
51.4
%48
.6%
100.
0%50
.0%
50.0
%10
0.0%
58.1
%41
.9%
100.
0%13
811
124
916
412
829
216
612
128
717
913
631
522
211
333
555
.4%
44.6
%10
0.0%
56.2
%43
.8%
100.
0%57
.8%
42.2
%10
0.0%
56.8
%43
.2%
100.
0%66
.3%
33.7
%10
0.0%
105
119
224
9813
723
512
611
824
412
011
123
113
911
525
446
.9%
53.1
%10
0.0%
41.7
%58
.3%
100.
0%51
.6%
48.4
%10
0.0%
51.9
%48
.1%
100.
0%54
.7%
45.3
%10
0.0%
1668
568
2236
1750
620
2370
1828
620
2448
1876
652
2528
1957
594
2551
74.6
%25
.4%
100.
0%73
.8%
26.2
%10
0.0%
74.7
%25
.3%
100.
0%74
.2%
25.8
%10
0.0%
76.7
%23
.3%
100.
0%
* M
.D. g
radu
ates
in p
ost-M
.D. t
rain
ing
on N
ovem
ber 1
of t
he y
ear i
n w
hich
the
M.D
. Deg
ree
was
aw
arde
d.
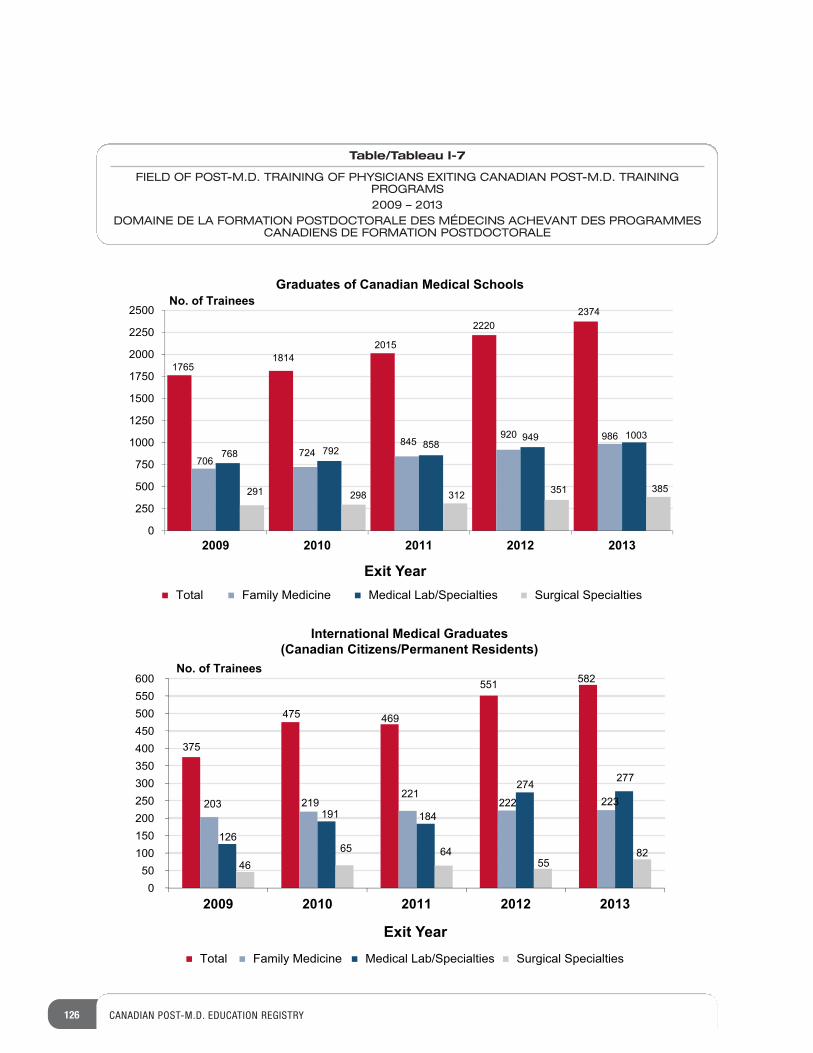
126 CANADIAN POST-M.D. EDUCATION REGISTRY
17651814
2015
22202374
706724
845920 986
768 792 858949 1003
291 298 312 351 385
0
250
500
750
1000
1250
1500
1750
2000
2250
2500
2009 2010 2011 2012 2013
Exit YearTotal Family Medicine Medical Lab/Specialties Surgical Specialties
Graduates of Canadian Medical SchoolsNo. of Trainees
International Medical Graduates(Canadian Citizens/Permanent Residents)
No. of Trainees
375
475 469
551 582
203 219221
222 223
126
191 184
274 277
4665 64
5582
050
100150200250300350400450500550600
2009 2010 2011 2012 2013
Exit YearTotal Family Medicine Medical Lab/Specialties Surgical Specialties
Table/Tableau I-7
FIELD OF POST-M.D. TRAINING OF PHYSICIANS EXITING CANADIAN POST-M.D. TRAININGPROGRAMS2009 – 2013
DOMAINE DE LA FORMATION POSTDOCTORALE DES MÉDECINS ACHEVANT DES PROGRAMMESCANADIENS DE FORMATION POSTDOCTORALE
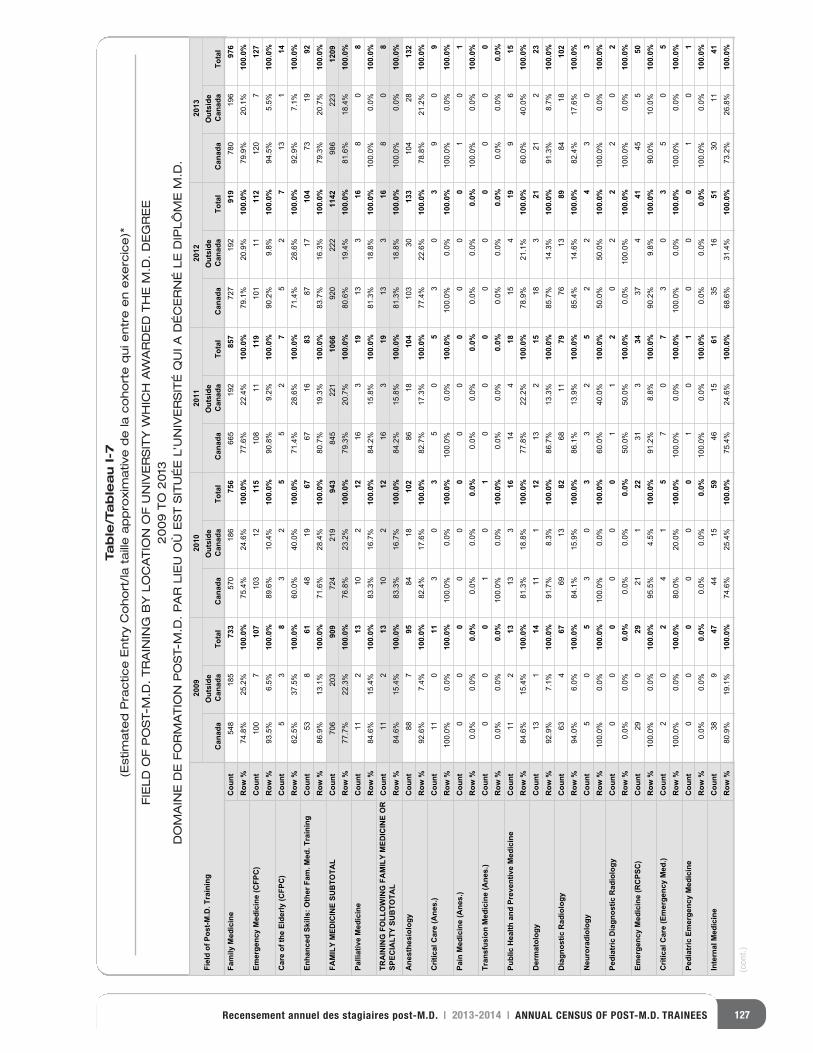
127Recensement annuel des stagiaires post-M.D. | 2013-2014 | ANNUAL CENSUS OF POST-M.D. TRAINEES
Table/Tableau I-7
(Estimated Practice Entry Cohort/la taille approximative de la cohorte qui entre en exercice)*
FIELD OF POST-M.D. TRAINING BY LOCATION OF UNIVERSITY WHICH AWARDED THE M.D. DEGREE
2009 TO 2013
DOMAINE DE FORMATION POST-M.D. PAR LIEU OÙ EST SITUÉE L’UNIVERSITÉ QUI A DÉCERNÉ LE DIPLÔME M.D.
Fiel
d of
Pos
t-M.D
. Tra
inin
g20
0920
1020
1120
1220
13
Can
ada
Out
side
C
anad
aTo
tal
Can
ada
Out
side
C
anad
aTo
tal
Can
ada
Out
side
C
anad
aTo
tal
Can
ada
Out
side
C
anad
aTo
tal
Can
ada
Out
side
C
anad
aTo
tal
Fam
ily M
edic
ine
Cou
ntR
ow %
Emer
genc
y M
edic
ine
(CFP
C)
Cou
ntR
ow %
Car
e of
the
Elde
rly (C
FPC
)C
ount
Row
%En
hanc
ed S
kills
: Oth
er F
am. M
ed. T
rain
ing
Cou
ntR
ow %
FAM
ILY
MED
ICIN
E SU
BTO
TAL
Cou
ntR
ow %
Palli
ativ
e M
edic
ine
Cou
ntR
ow %
TRA
ININ
G F
OLL
OW
ING
FA
MIL
Y M
EDIC
INE
OR
SP
ECIA
LTY
SUB
TOTA
LC
ount
Row
%A
nest
hesi
olog
yC
ount
Row
%C
ritic
al C
are
(Ane
s.)
Cou
ntR
ow %
Pain
Med
icin
e (A
nes.
)C
ount
Row
%Tr
ansf
usio
n M
edic
ine
(Ane
s.)
Cou
ntR
ow %
Publ
ic H
ealth
and
Pre
vent
ive
Med
icin
eC
ount
Row
%D
erm
atol
ogy
Cou
ntR
ow %
Dia
gnos
tic R
adio
logy
Cou
ntR
ow %
Neu
rora
diol
ogy
Cou
ntR
ow %
Pedi
atric
Dia
gnos
tic R
adio
logy
Cou
ntR
ow %
Emer
genc
y M
edic
ine
(RC
PSC
)C
ount
Row
%C
ritic
al C
are
(Em
erge
ncy
Med
.)C
ount
Row
%Pe
diat
ric E
mer
genc
y M
edic
ine
Cou
ntR
ow %
Inte
rnal
Med
icin
eC
ount
Row
%
548
185
733
570
186
756
665
192
857
727
192
919
780
196
976
74.8%
25.2%
100.
0%75.4%
24.6%
100.
0%77.6%
22.4%
100.
0%79.1%
20.9%
100.
0%79.9%
20.1%
100.
0%100
710
7103
1211
5108
1111
9101
1111
2120
712
793.5%
6.5%
100.
0%89.6%
10.4%
100.
0%90.8%
9.2%
100.
0%90.2%
9.8%
100.
0%94.5%
5.5%
100.
0%5
38
32
55
27
52
713
114
62.5%
37.5%
100.
0%60.0%
40.0%
100.
0%71.4%
28.6%
100.
0%71.4%
28.6%
100.
0%92.9%
7.1%
100.
0%53
861
4819
6767
1683
8717
104
7319
9286.9%
13.1%
100.
0%71.6%
28.4%
100.
0%80.7%
19.3%
100.
0%83.7%
16.3%
100.
0%79.3%
20.7%
100.
0%706
203
909
724
219
943
845
221
1066
920
222
1142
986
223
1209
77.7%
22.3%
100.
0%76.8%
23.2%
100.
0%79.3%
20.7%
100.
0%80.6%
19.4%
100.
0%81.6%
18.4%
100.
0%11
213
102
1216
319
133
168
08
84.6%
15.4%
100.
0%83.3%
16.7%
100.
0%84.2%
15.8%
100.
0%81.3%
18.8%
100.
0%100.0%
0.0%
100.
0%11
213
102
1216
319
133
168
08
84.6%
15.4%
100.
0%83.3%
16.7%
100.
0%84.2%
15.8%
100.
0%81.3%
18.8%
100.
0%100.0%
0.0%
100.
0%88
795
8418
102
8618
104
103
3013
3104
2813
292.6%
7.4%
100.
0%82.4%
17.6%
100.
0%82.7%
17.3%
100.
0%77.4%
22.6%
100.
0%78.8%
21.2%
100.
0%11
011
30
35
05
30
39
09
100.0%
0.0%
100.
0%100.0%
0.0%
100.
0%100.0%
0.0%
100.
0%100.0%
0.0%
100.
0%100.0%
0.0%
100.
0%0
00
00
00
00
00
01
01
0.0%
0.0%
0.0%
0.0%
0.0%
0.0%
0.0%
0.0%
0.0%
0.0%
0.0%
0.0%
100.0%
0.0%
100.
0%0
00
10
10
00
00
00
00
0.0%
0.0%
0.0%
100.0%
0.0%
100.
0%0.0%
0.0%
0.0%
0.0%
0.0%
0.0%
0.0%
0.0%
0.0%
112
1313
316
144
1815
419
96
1584.6%
15.4%
100.
0%81.3%
18.8%
100.
0%77.8%
22.2%
100.
0%78.9%
21.1%
100.
0%60.0%
40.0%
100.
0%13
114
111
1213
215
183
2121
223
92.9%
7.1%
100.
0%91.7%
8.3%
100.
0%86.7%
13.3%
100.
0%85.7%
14.3%
100.
0%91.3%
8.7%
100.
0%63
467
6913
8268
1179
7613
8984
1810
294.0%
6.0%
100.
0%84.1%
15.9%
100.
0%86.1%
13.9%
100.
0%85.4%
14.6%
100.
0%82.4%
17.6%
100.
0%5
05
30
33
25
22
43
03
100.0%
0.0%
100.
0%100.0%
0.0%
100.
0%60.0%
40.0%
100.
0%50.0%
50.0%
100.
0%100.0%
0.0%
100.
0%0
00
00
01
12
02
22
02
0.0%
0.0%
0.0%
0.0%
0.0%
0.0%
50.0%
50.0%
100.
0%0.0%
100.0%
100.
0%100.0%
0.0%
100.
0%29
029
211
2231
334
374
4145
550
100.0%
0.0%
100.
0%95.5%
4.5%
100.
0%91.2%
8.8%
100.
0%90.2%
9.8%
100.
0%90.0%
10.0%
100.
0%2
02
41
57
07
30
35
05
100.0%
0.0%
100.
0%80.0%
20.0%
100.
0%100.0%
0.0%
100.
0%100.0%
0.0%
100.
0%100.0%
0.0%
100.
0%0
00
00
01
01
00
01
01
0.0%
0.0%
0.0%
0.0%
0.0%
0.0%
100.0%
0.0%
100.
0%0.0%
0.0%
0.0%
100.0%
0.0%
100.
0%38
947
4415
5946
1561
3516
5130
1141
80.9%
19.1%
100.
0%74.6%
25.4%
100.
0%75.4%
24.6%
100.
0%68.6%
31.4%
100.
0%73.2%
26.8%
100.
0%
(cont.)
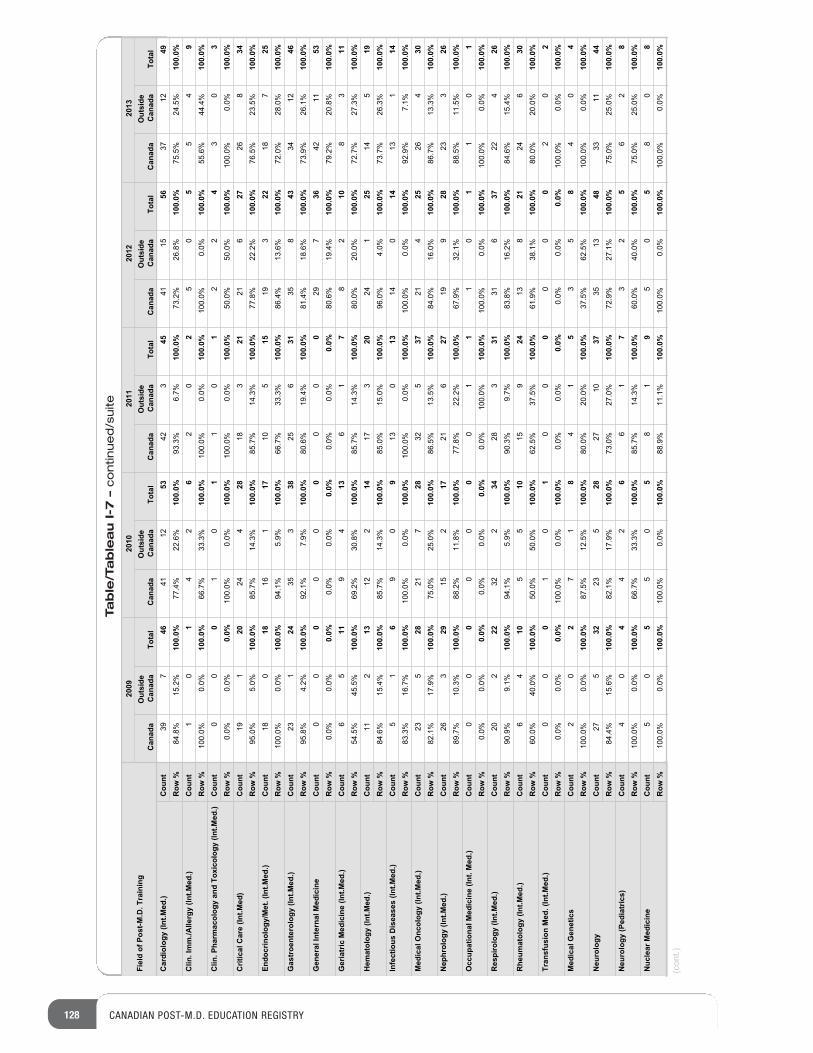
128 CANADIAN POST-M.D. EDUCATION REGISTRY
Table/Tableau I-7 –continued/suite
Fiel
d of
Pos
t-M.D
. Tra
inin
g20
0920
1020
1120
1220
13
Can
ada
Out
side
C
anad
aTo
tal
Can
ada
Out
side
C
anad
aTo
tal
Can
ada
Out
side
C
anad
aTo
tal
Can
ada
Out
side
C
anad
aTo
tal
Can
ada
Out
side
C
anad
aTo
tal
Car
diol
ogy
(Int.M
ed.)
Cou
ntR
ow %
Clin
. Im
m./A
llerg
y (In
t.Med
.)C
ount
Row
%C
lin. P
harm
acol
ogy
and
Toxi
colo
gy (I
nt.M
ed.)
Cou
ntR
ow %
Crit
ical
Car
e (In
t.Med
)C
ount
Row
%En
docr
inol
ogy/
Met
. (In
t.Med
.)C
ount
Row
%G
astr
oent
erol
ogy
(Int.M
ed.)
Cou
ntR
ow %
Gen
eral
Inte
rnal
Med
icin
eC
ount
Row
%G
eria
tric
Med
icin
e (In
t.Med
.)C
ount
Row
%H
emat
olog
y (In
t.Med
.)C
ount
Row
%In
fect
ious
Dis
ease
s (In
t.Med
.)C
ount
Row
%M
edic
al O
ncol
ogy
(Int.M
ed.)
Cou
ntR
ow %
Nep
hrol
ogy
(Int.M
ed.)
Cou
ntR
ow %
Occ
upat
iona
l Med
icin
e (In
t. M
ed.)
Cou
ntR
ow %
Res
piro
logy
(Int
.Med
.)C
ount
Row
%R
heum
atol
ogy
(Int.M
ed.)
Cou
ntR
ow %
Tran
sfus
ion
Med
. (In
t.Med
.)C
ount
Row
%M
edic
al G
enet
ics
Cou
ntR
ow %
Neu
rolo
gyC
ount
Row
%N
euro
logy
(Ped
iatr
ics)
Cou
ntR
ow %
Nuc
lear
Med
icin
eC
ount
Row
%
397
4641
1253
423
4541
1556
3712
4984.8%
15.2%
100.
0%77.4%
22.6%
100.
0%93.3%
6.7%
100.
0%73.2%
26.8%
100.
0%75.5%
24.5%
100.
0%1
01
42
62
02
50
55
49
100.0%
0.0%
100.
0%66.7%
33.3%
100.
0%100.0%
0.0%
100.
0%100.0%
0.0%
100.
0%55.6%
44.4%
100.
0%0
00
10
11
01
22
43
03
0.0%
0.0%
0.0%
100.0%
0.0%
100.
0%100.0%
0.0%
100.
0%50.0%
50.0%
100.
0%100.0%
0.0%
100.
0%19
120
244
2818
321
216
2726
834
95.0%
5.0%
100.
0%85.7%
14.3%
100.
0%85.7%
14.3%
100.
0%77.8%
22.2%
100.
0%76.5%
23.5%
100.
0%18
018
161
1710
515
193
2218
725
100.0%
0.0%
100.
0%94.1%
5.9%
100.
0%66.7%
33.3%
100.
0%86.4%
13.6%
100.
0%72.0%
28.0%
100.
0%23
124
353
3825
631
358
4334
1246
95.8%
4.2%
100.
0%92.1%
7.9%
100.
0%80.6%
19.4%
100.
0%81.4%
18.6%
100.
0%73.9%
26.1%
100.
0%0
00
00
00
00
297
3642
1153
0.0%
0.0%
0.0%
0.0%
0.0%
0.0%
0.0%
0.0%
0.0%
80.6%
19.4%
100.
0%79.2%
20.8%
100.
0%6
511
94
136
17
82
108
311
54.5%
45.5%
100.
0%69.2%
30.8%
100.
0%85.7%
14.3%
100.
0%80.0%
20.0%
100.
0%72.7%
27.3%
100.
0%11
213
122
1417
320
241
2514
519
84.6%
15.4%
100.
0%85.7%
14.3%
100.
0%85.0%
15.0%
100.
0%96.0%
4.0%
100.
0%73.7%
26.3%
100.
0%5
16
90
913
013
140
1413
114
83.3%
16.7%
100.
0%100.0%
0.0%
100.
0%100.0%
0.0%
100.
0%100.0%
0.0%
100.
0%92.9%
7.1%
100.
0%23
528
217
2832
537
214
2526
430
82.1%
17.9%
100.
0%75.0%
25.0%
100.
0%86.5%
13.5%
100.
0%84.0%
16.0%
100.
0%86.7%
13.3%
100.
0%26
329
152
1721
627
199
2823
326
89.7%
10.3%
100.
0%88.2%
11.8%
100.
0%77.8%
22.2%
100.
0%67.9%
32.1%
100.
0%88.5%
11.5%
100.
0%0
00
00
00
11
10
11
01
0.0%
0.0%
0.0%
0.0%
0.0%
0.0%
0.0%
100.0%
100.
0%100.0%
0.0%
100.
0%100.0%
0.0%
100.
0%20
222
322
3428
331
316
3722
426
90.9%
9.1%
100.
0%94.1%
5.9%
100.
0%90.3%
9.7%
100.
0%83.8%
16.2%
100.
0%84.6%
15.4%
100.
0%6
410
55
1015
924
138
2124
630
60.0%
40.0%
100.
0%50.0%
50.0%
100.
0%62.5%
37.5%
100.
0%61.9%
38.1%
100.
0%80.0%
20.0%
100.
0%0
00
10
10
00
00
02
02
0.0%
0.0%
0.0%
100.0%
0.0%
100.
0%0.0%
0.0%
0.0%
0.0%
0.0%
0.0%
100.0%
0.0%
100.
0%2
02
71
84
15
35
84
04
100.0%
0.0%
100.
0%87.5%
12.5%
100.
0%80.0%
20.0%
100.
0%37.5%
62.5%
100.
0%100.0%
0.0%
100.
0%27
532
235
2827
1037
3513
4833
1144
84.4%
15.6%
100.
0%82.1%
17.9%
100.
0%73.0%
27.0%
100.
0%72.9%
27.1%
100.
0%75.0%
25.0%
100.
0%4
04
42
66
17
32
56
28
100.0%
0.0%
100.
0%66.7%
33.3%
100.
0%85.7%
14.3%
100.
0%60.0%
40.0%
100.
0%75.0%
25.0%
100.
0%5
05
50
58
19
50
58
08
100.0%
0.0%
100.
0%100.0%
0.0%
100.
0%88.9%
11.1%
100.
0%100.0%
0.0%
100.
0%100.0%
0.0%
100.
0%
(cont.)
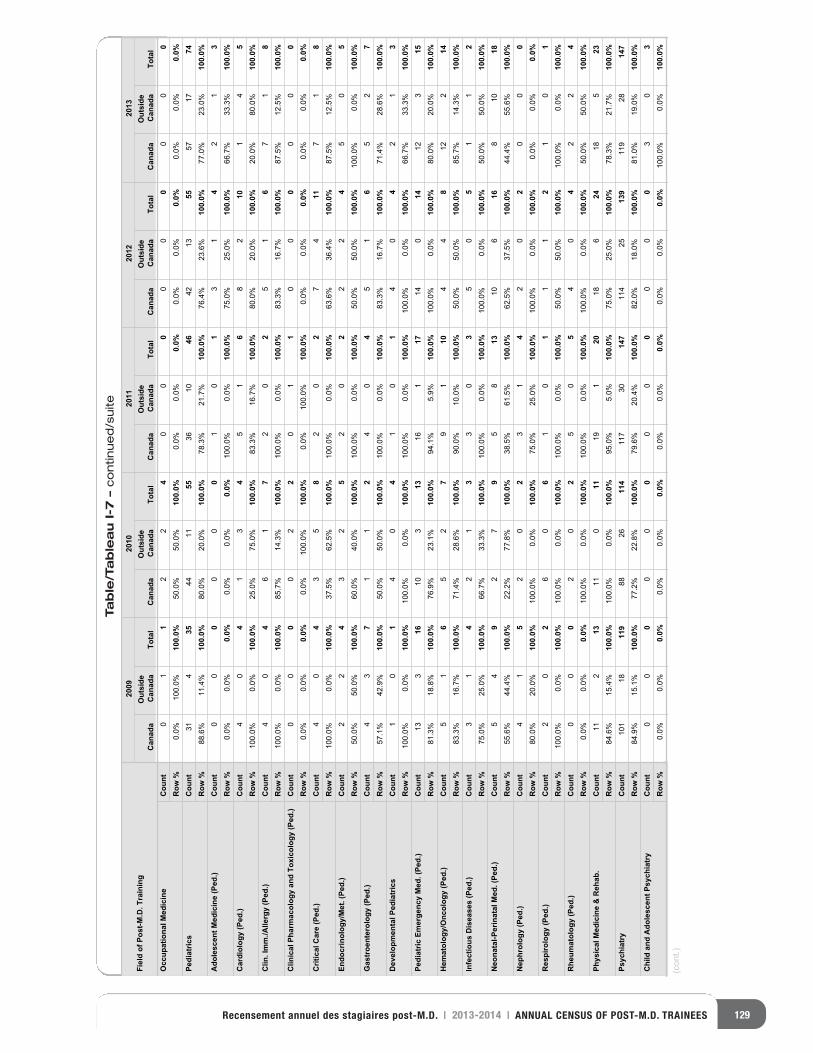
129Recensement annuel des stagiaires post-M.D. | 2013-2014 | ANNUAL CENSUS OF POST-M.D. TRAINEES
Table/Tableau I-7 –continued/suite
Fiel
d of
Pos
t-M.D
. Tra
inin
g20
0920
1020
1120
1220
13
Can
ada
Out
side
C
anad
aTo
tal
Can
ada
Out
side
C
anad
aTo
tal
Can
ada
Out
side
C
anad
aTo
tal
Can
ada
Out
side
C
anad
aTo
tal
Can
ada
Out
side
C
anad
aTo
tal
Occ
upat
iona
l Med
icin
eC
ount
Row
%Pe
diat
rics
Cou
ntR
ow %
Ado
lesc
ent M
edic
ine
(Ped
.)C
ount
Row
%C
ardi
olog
y (P
ed.)
Cou
ntR
ow %
Clin
. Im
m./A
llerg
y (P
ed.)
Cou
ntR
ow %
Clin
ical
Pha
rmac
olog
y an
d To
xico
logy
(Ped
.)C
ount
Row
%C
ritic
al C
are
(Ped
.)C
ount
Row
%En
docr
inol
ogy/
Met
. (Pe
d.)
Cou
ntR
ow %
Gas
troe
nter
olog
y (P
ed.)
Cou
ntR
ow %
Dev
elop
men
tal P
edia
tric
sC
ount
Row
%Pe
diat
ric E
mer
genc
y M
ed. (
Ped.
)C
ount
Row
%H
emat
olog
y/O
ncol
ogy
(Ped
.)C
ount
Row
%In
fect
ious
Dis
ease
s (P
ed.)
Cou
ntR
ow %
Neo
nata
l-Per
inat
al M
ed. (
Ped.
)C
ount
Row
%N
ephr
olog
y (P
ed.)
Cou
ntR
ow %
Res
piro
logy
(Ped
.)C
ount
Row
%R
heum
atol
ogy
(Ped
.)C
ount
Row
%Ph
ysic
al M
edic
ine
& R
ehab
.C
ount
Row
%Ps
ychi
atry
Cou
ntR
ow %
Chi
ld a
nd A
dole
scen
t Psy
chia
try
Cou
ntR
ow %
01
12
24
00
00
00
00
00.0%
100.0%
100.
0%50.0%
50.0%
100.
0%0.0%
0.0%
0.0%
0.0%
0.0%
0.0%
0.0%
0.0%
0.0%
314
3544
1155
3610
4642
1355
5717
7488.6%
11.4%
100.
0%80.0%
20.0%
100.
0%78.3%
21.7%
100.
0%76.4%
23.6%
100.
0%77.0%
23.0%
100.
0%0
00
00
01
01
31
42
13
0.0%
0.0%
0.0%
0.0%
0.0%
0.0%
100.0%
0.0%
100.
0%75.0%
25.0%
100.
0%66.7%
33.3%
100.
0%4
04
13
45
16
82
101
45
100.0%
0.0%
100.
0%25.0%
75.0%
100.
0%83.3%
16.7%
100.
0%80.0%
20.0%
100.
0%20.0%
80.0%
100.
0%4
04
61
72
02
51
67
18
100.0%
0.0%
100.
0%85.7%
14.3%
100.
0%100.0%
0.0%
100.
0%83.3%
16.7%
100.
0%87.5%
12.5%
100.
0%0
00
02
20
11
00
00
00
0.0%
0.0%
0.0%
0.0%
100.0%
100.
0%0.0%
100.0%
100.
0%0.0%
0.0%
0.0%
0.0%
0.0%
0.0%
40
43
58
20
27
411
71
8100.0%
0.0%
100.
0%37.5%
62.5%
100.
0%100.0%
0.0%
100.
0%63.6%
36.4%
100.
0%87.5%
12.5%
100.
0%2
24
32
52
02
22
45
05
50.0%
50.0%
100.
0%60.0%
40.0%
100.
0%100.0%
0.0%
100.
0%50.0%
50.0%
100.
0%100.0%
0.0%
100.
0%4
37
11
24
04
51
65
27
57.1%
42.9%
100.
0%50.0%
50.0%
100.
0%100.0%
0.0%
100.
0%83.3%
16.7%
100.
0%71.4%
28.6%
100.
0%1
01
40
41
01
40
42
13
100.0%
0.0%
100.
0%100.0%
0.0%
100.
0%100.0%
0.0%
100.
0%100.0%
0.0%
100.
0%66.7%
33.3%
100.
0%13
316
103
1316
117
140
1412
315
81.3%
18.8%
100.
0%76.9%
23.1%
100.
0%94.1%
5.9%
100.
0%100.0%
0.0%
100.
0%80.0%
20.0%
100.
0%5
16
52
79
110
44
812
214
83.3%
16.7%
100.
0%71.4%
28.6%
100.
0%90.0%
10.0%
100.
0%50.0%
50.0%
100.
0%85.7%
14.3%
100.
0%3
14
21
33
03
50
51
12
75.0%
25.0%
100.
0%66.7%
33.3%
100.
0%100.0%
0.0%
100.
0%100.0%
0.0%
100.
0%50.0%
50.0%
100.
0%5
49
27
95
813
106
168
1018
55.6%
44.4%
100.
0%22.2%
77.8%
100.
0%38.5%
61.5%
100.
0%62.5%
37.5%
100.
0%44.4%
55.6%
100.
0%4
15
20
23
14
20
20
00
80.0%
20.0%
100.
0%100.0%
0.0%
100.
0%75.0%
25.0%
100.
0%100.0%
0.0%
100.
0%0.0%
0.0%
0.0%
20
26
06
10
11
12
10
1100.0%
0.0%
100.
0%100.0%
0.0%
100.
0%100.0%
0.0%
100.
0%50.0%
50.0%
100.
0%100.0%
0.0%
100.
0%0
00
20
25
05
40
42
24
0.0%
0.0%
0.0%
100.0%
0.0%
100.
0%100.0%
0.0%
100.
0%100.0%
0.0%
100.
0%50.0%
50.0%
100.
0%11
213
110
1119
120
186
2418
523
84.6%
15.4%
100.
0%100.0%
0.0%
100.
0%95.0%
5.0%
100.
0%75.0%
25.0%
100.
0%78.3%
21.7%
100.
0%101
1811
988
2611
4117
3014
7114
2513
9119
2814
784.9%
15.1%
100.
0%77.2%
22.8%
100.
0%79.6%
20.4%
100.
0%82.0%
18.0%
100.
0%81.0%
19.0%
100.
0%0
00
00
00
00
00
03
03
0.0%
0.0%
0.0%
0.0%
0.0%
0.0%
0.0%
0.0%
0.0%
0.0%
0.0%
0.0%
100.0%
0.0%
100.
0%
(cont.)
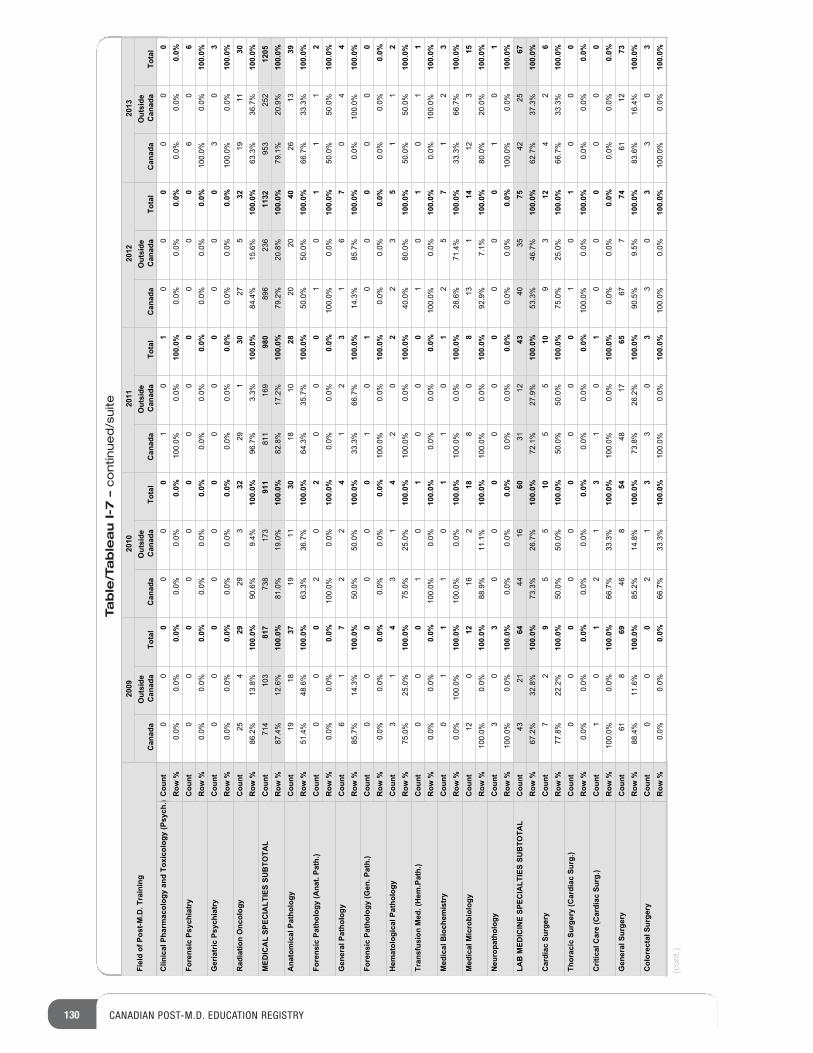
130 CANADIAN POST-M.D. EDUCATION REGISTRY
Table/Tableau I-7 –continued/suite
Fiel
d of
Pos
t-M.D
. Tra
inin
g20
0920
1020
1120
1220
13
Can
ada
Out
side
C
anad
aTo
tal
Can
ada
Out
side
C
anad
aTo
tal
Can
ada
Out
side
C
anad
aTo
tal
Can
ada
Out
side
C
anad
aTo
tal
Can
ada
Out
side
C
anad
aTo
tal
Clin
ical
Pha
rmac
olog
y an
d To
xico
logy
(Psy
ch.)
Cou
ntR
ow %
Fore
nsic
Psy
chia
try
Cou
ntR
ow %
Ger
iatr
ic P
sych
iatr
yC
ount
Row
%R
adia
tion
Onc
olog
yC
ount
Row
%M
EDIC
AL
SPEC
IALT
IES
SUB
TOTA
LC
ount
Row
%A
nato
mic
al P
atho
logy
Cou
ntR
ow %
Fore
nsic
Pat
holo
gy (A
nat.
Path
.)C
ount
Row
%G
ener
al P
atho
logy
Cou
ntR
ow %
Fore
nsic
Pat
holo
gy (G
en. P
ath.
)C
ount
Row
%H
emat
olog
ical
Pat
holo
gyC
ount
Row
%Tr
ansf
usio
n M
ed. (
Hem
.Pat
h.)
Cou
ntR
ow %
Med
ical
Bio
chem
istr
yC
ount
Row
%M
edic
al M
icro
biol
ogy
Cou
ntR
ow %
Neu
ropa
thol
ogy
Cou
ntR
ow %
LAB
MED
ICIN
E SP
ECIA
LTIE
S SU
BTO
TAL
Cou
ntR
ow %
Car
diac
Sur
gery
Cou
ntR
ow %
Thor
acic
Sur
gery
(Car
diac
Sur
g.)
Cou
ntR
ow %
Crit
ical
Car
e (C
ardi
ac S
urg.
)C
ount
Row
%G
ener
al S
urge
ryC
ount
Row
%C
olor
ecta
l Sur
gery
Cou
ntR
ow %
00
00
00
10
10
00
00
00.0%
0.0%
0.0%
0.0%
0.0%
0.0%
100.0%
0.0%
100.
0%0.0%
0.0%
0.0%
0.0%
0.0%
0.0%
00
00
00
00
00
00
60
60.0%
0.0%
0.0%
0.0%
0.0%
0.0%
0.0%
0.0%
0.0%
0.0%
0.0%
0.0%
100.0%
0.0%
100.
0%0
00
00
00
00
00
03
03
0.0%
0.0%
0.0%
0.0%
0.0%
0.0%
0.0%
0.0%
0.0%
0.0%
0.0%
0.0%
100.0%
0.0%
100.
0%25
429
293
3229
130
275
3219
1130
86.2%
13.8%
100.
0%90.6%
9.4%
100.
0%96.7%
3.3%
100.
0%84.4%
15.6%
100.
0%63.3%
36.7%
100.
0%714
103
817
738
173
911
811
169
980
896
236
1132
953
252
1205
87.4%
12.6%
100.
0%81.0%
19.0%
100.
0%82.8%
17.2%
100.
0%79.2%
20.8%
100.
0%79.1%
20.9%
100.
0%19
1837
1911
3018
1028
2020
4026
1339
51.4%
48.6%
100.
0%63.3%
36.7%
100.
0%64.3%
35.7%
100.
0%50.0%
50.0%
100.
0%66.7%
33.3%
100.
0%0
00
20
20
00
10
11
12
0.0%
0.0%
0.0%
100.0%
0.0%
100.
0%0.0%
0.0%
0.0%
100.0%
0.0%
100.
0%50.0%
50.0%
100.
0%6
17
22
41
23
16
70
44
85.7%
14.3%
100.
0%50.0%
50.0%
100.
0%33.3%
66.7%
100.
0%14.3%
85.7%
100.
0%0.0%
100.0%
100.
0%0
00
00
01
01
00
00
00
0.0%
0.0%
0.0%
0.0%
0.0%
0.0%
100.0%
0.0%
100.
0%0.0%
0.0%
0.0%
0.0%
0.0%
0.0%
31
43
14
20
22
35
11
275.0%
25.0%
100.
0%75.0%
25.0%
100.
0%100.0%
0.0%
100.
0%40.0%
60.0%
100.
0%50.0%
50.0%
100.
0%0
00
10
10
00
10
10
11
0.0%
0.0%
0.0%
100.0%
0.0%
100.
0%0.0%
0.0%
0.0%
100.0%
0.0%
100.
0%0.0%
100.0%
100.
0%0
11
10
11
01
25
71
23
0.0%
100.0%
100.
0%100.0%
0.0%
100.
0%100.0%
0.0%
100.
0%28.6%
71.4%
100.
0%33.3%
66.7%
100.
0%12
012
162
188
08
131
1412
315
100.0%
0.0%
100.
0%88.9%
11.1%
100.
0%100.0%
0.0%
100.
0%92.9%
7.1%
100.
0%80.0%
20.0%
100.
0%3
03
00
00
00
00
01
01
100.0%
0.0%
100.
0%0.0%
0.0%
0.0%
0.0%
0.0%
0.0%
0.0%
0.0%
0.0%
100.0%
0.0%
100.
0%43
2164
4416
6031
1243
4035
7542
2567
67.2%
32.8%
100.
0%73.3%
26.7%
100.
0%72.1%
27.9%
100.
0%53.3%
46.7%
100.
0%62.7%
37.3%
100.
0%7
29
55
105
510
93
124
26
77.8%
22.2%
100.
0%50.0%
50.0%
100.
0%50.0%
50.0%
100.
0%75.0%
25.0%
100.
0%66.7%
33.3%
100.
0%0
00
00
00
00
10
10
00
0.0%
0.0%
0.0%
0.0%
0.0%
0.0%
0.0%
0.0%
0.0%
100.0%
0.0%
100.
0%0.0%
0.0%
0.0%
10
12
13
10
10
00
00
0100.0%
0.0%
100.
0%66.7%
33.3%
100.
0%100.0%
0.0%
100.
0%0.0%
0.0%
0.0%
0.0%
0.0%
0.0%
618
6946
854
4817
6567
774
6112
7388.4%
11.6%
100.
0%85.2%
14.8%
100.
0%73.8%
26.2%
100.
0%90.5%
9.5%
100.
0%83.6%
16.4%
100.
0%0
00
21
33
03
30
33
03
0.0%
0.0%
0.0%
66.7%
33.3%
100.
0%100.0%
0.0%
100.
0%100.0%
0.0%
100.
0%100.0%
0.0%
100.
0%
(cont.)
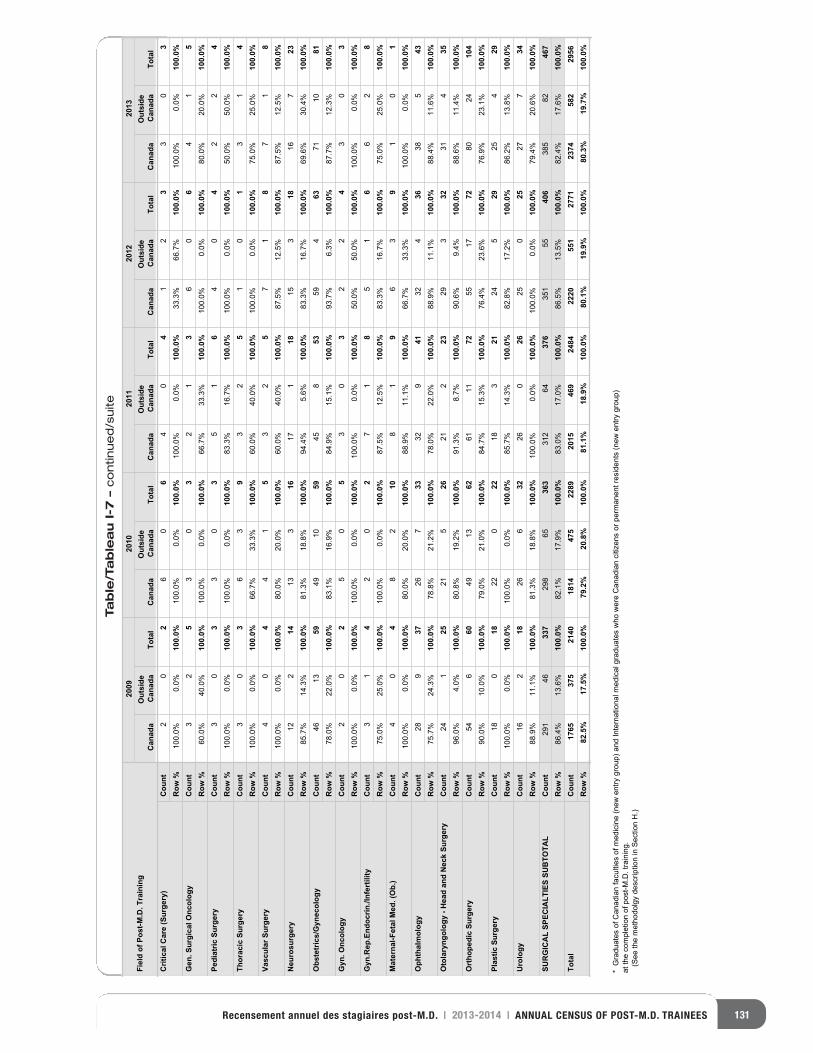
131Recensement annuel des stagiaires post-M.D. | 2013-2014 | ANNUAL CENSUS OF POST-M.D. TRAINEES
Table/Tableau I-7 –continued/suite
Fiel
d of
Pos
t-M.D
. Tra
inin
g20
0920
1020
1120
1220
13
Can
ada
Out
side
C
anad
aTo
tal
Can
ada
Out
side
C
anad
aTo
tal
Can
ada
Out
side
C
anad
aTo
tal
Can
ada
Out
side
C
anad
aTo
tal
Can
ada
Out
side
C
anad
aTo
tal
Crit
ical
Car
e (S
urge
ry)
Cou
ntR
ow %
Gen
. Sur
gica
l Onc
olog
yC
ount
Row
%Pe
diat
ric S
urge
ryC
ount
Row
%Th
orac
ic S
urge
ryC
ount
Row
%Va
scul
ar S
urge
ryC
ount
Row
%N
euro
surg
ery
Cou
ntR
ow %
Obs
tetr
ics/
Gyn
ecol
ogy
Cou
ntR
ow %
Gyn
. Onc
olog
yC
ount
Row
%G
yn.R
ep.E
ndoc
rin./I
nfer
tility
Cou
ntR
ow %
Mat
erna
l-Fet
al M
ed. (
Ob.
)C
ount
Row
%O
phth
alm
olog
yC
ount
Row
%O
tola
ryng
olog
y - H
ead
and
Nec
k Su
rger
yC
ount
Row
%O
rtho
pedi
c Su
rger
yC
ount
Row
%Pl
astic
Sur
gery
Cou
ntR
ow %
Uro
logy
Cou
ntR
ow %
SUR
GIC
AL
SPEC
IALT
IES
SUB
TOTA
LC
ount
Row
%To
tal
Cou
ntR
ow %
20
26
06
40
41
23
30
310
0.0%
0.0%
100.
0%10
0.0%
0.0%
100.
0%10
0.0%
0.0%
100.
0%33
.3%
66.7
%10
0.0%
100.
0%0.
0%10
0.0%
32
53
03
21
36
06
41
560
.0%
40.0
%10
0.0%
100.
0%0.
0%10
0.0%
66.7
%33
.3%
100.
0%10
0.0%
0.0%
100.
0%80
.0%
20.0
%10
0.0%
30
33
03
51
64
04
22
410
0.0%
0.0%
100.
0%10
0.0%
0.0%
100.
0%83
.3%
16.7
%10
0.0%
100.
0%0.
0%10
0.0%
50.0
%50
.0%
100.
0%3
03
63
93
25
10
13
14
100.
0%0.
0%10
0.0%
66.7
%33
.3%
100.
0%60
.0%
40.0
%10
0.0%
100.
0%0.
0%10
0.0%
75.0
%25
.0%
100.
0%4
04
41
53
25
71
87
18
100.
0%0.
0%10
0.0%
80.0
%20
.0%
100.
0%60
.0%
40.0
%10
0.0%
87.5
%12
.5%
100.
0%87
.5%
12.5
%10
0.0%
122
1413
316
171
1815
318
167
2385
.7%
14.3
%10
0.0%
81.3
%18
.8%
100.
0%94
.4%
5.6%
100.
0%83
.3%
16.7
%10
0.0%
69.6
%30
.4%
100.
0%46
1359
4910
5945
853
594
6371
1081
78.0
%22
.0%
100.
0%83
.1%
16.9
%10
0.0%
84.9
%15
.1%
100.
0%93
.7%
6.3%
100.
0%87
.7%
12.3
%10
0.0%
20
25
05
30
32
24
30
310
0.0%
0.0%
100.
0%10
0.0%
0.0%
100.
0%10
0.0%
0.0%
100.
0%50
.0%
50.0
%10
0.0%
100.
0%0.
0%10
0.0%
31
42
02
71
85
16
62
875
.0%
25.0
%10
0.0%
100.
0%0.
0%10
0.0%
87.5
%12
.5%
100.
0%83
.3%
16.7
%10
0.0%
75.0
%25
.0%
100.
0%4
04
82
108
19
63
91
01
100.
0%0.
0%10
0.0%
80.0
%20
.0%
100.
0%88
.9%
11.1
%10
0.0%
66.7
%33
.3%
100.
0%10
0.0%
0.0%
100.
0%28
937
267
3332
941
324
3638
543
75.7
%24
.3%
100.
0%78
.8%
21.2
%10
0.0%
78.0
%22
.0%
100.
0%88
.9%
11.1
%10
0.0%
88.4
%11
.6%
100.
0%24
125
215
2621
223
293
3231
435
96.0
%4.
0%10
0.0%
80.8
%19
.2%
100.
0%91
.3%
8.7%
100.
0%90
.6%
9.4%
100.
0%88
.6%
11.4
%10
0.0%
546
6049
1362
6111
7255
1772
8024
104
90.0
%10
.0%
100.
0%79
.0%
21.0
%10
0.0%
84.7
%15
.3%
100.
0%76
.4%
23.6
%10
0.0%
76.9
%23
.1%
100.
0%18
018
220
2218
321
245
2925
429
100.
0%0.
0%10
0.0%
100.
0%0.
0%10
0.0%
85.7
%14
.3%
100.
0%82
.8%
17.2
%10
0.0%
86.2
%13
.8%
100.
0%16
218
266
3226
026
250
2527
734
88.9
%11
.1%
100.
0%81
.3%
18.8
%10
0.0%
100.
0%0.
0%10
0.0%
100.
0%0.
0%10
0.0%
79.4
%20
.6%
100.
0%29
146
337
298
6536
331
264
376
351
5540
638
582
467
86.4
%13
.6%
100.
0%82
.1%
17.9
%10
0.0%
83.0
%17
.0%
100.
0%86
.5%
13.5
%10
0.0%
82.4
%17
.6%
100.
0%17
6537
521
4018
1447
522
8920
1546
924
8422
2055
127
7123
7458
229
5682
.5%
17.5
%10
0.0%
79.2
%20
.8%
100.
0%81
.1%
18.9
%10
0.0%
80.1
%19
.9%
100.
0%80
.3%
19.7
%10
0.0%
* G
radu
ates
of C
anad
ian
facu
lties
of m
edic
ine
(new
ent
ry g
roup
) and
Inte
rnat
iona
l med
ical
gra
duat
es w
ho w
ere
Can
adia
n ci
tizen
s or
per
man
ent r
esid
ents
(new
ent
ry g
roup
) at
the
com
plet
ion
of p
ost-M
.D. t
rain
ing.
(S
ee th
e m
etho
dolg
y de
scrip
tion
in S
ectio
n H
.)
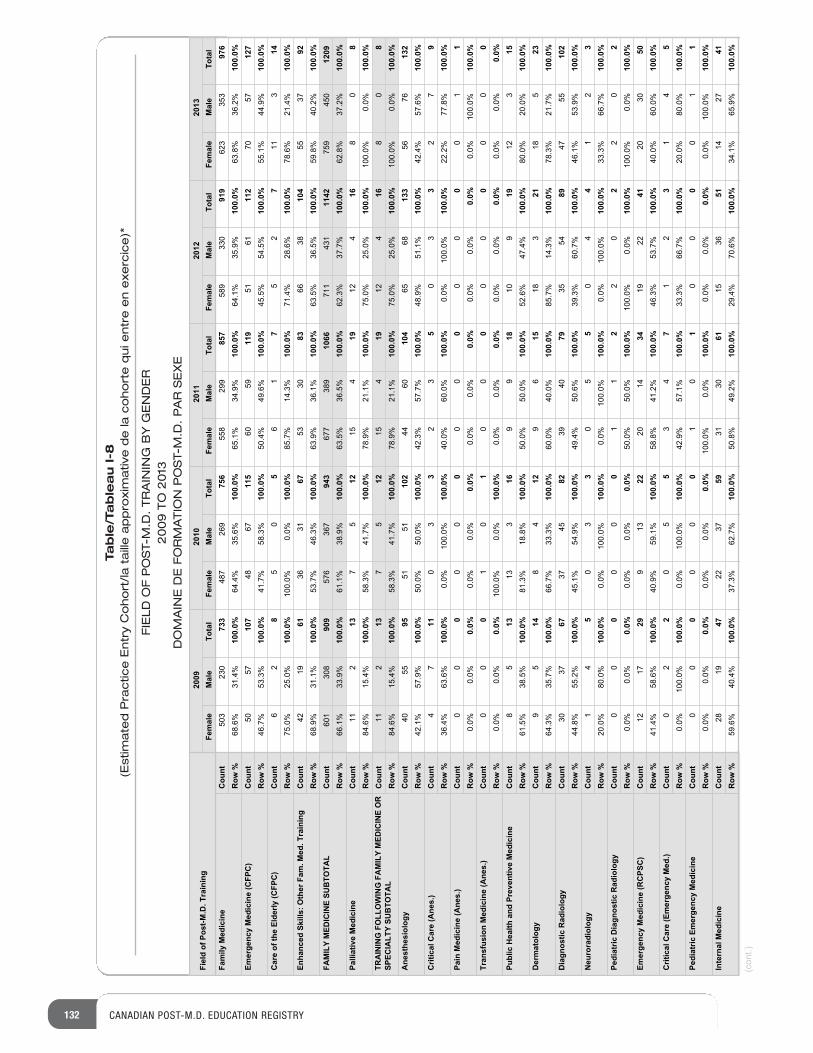
132 CANADIAN POST-M.D. EDUCATION REGISTRY
Table/Tableau I-8
(Estimated Practice Entry Cohort/la taille approximative de la cohorte qui entre en exercice)*
FIELD OF POST-M.D. TRAINING BY GENDER
2009 TO 2013
DOMAINE DE FORMATION POST-M.D. PAR SEXE
Fiel
d of
Pos
t-M.D
. Tra
inin
g20
0920
1020
1120
1220
13Fe
mal
eM
ale
Tota
lFe
mal
eM
ale
Tota
lFe
mal
eM
ale
Tota
lFe
mal
eM
ale
Tota
lFe
mal
eM
ale
Tota
lFa
mily
Med
icin
eC
ount
Row
%Em
erge
ncy
Med
icin
e (C
FPC
)C
ount
Row
%C
are
of th
e El
derly
(CFP
C)
Cou
ntR
ow %
Enha
nced
Ski
lls: O
ther
Fam
. Med
. Tra
inin
gC
ount
Row
%FA
MIL
Y M
EDIC
INE
SUB
TOTA
LC
ount
Row
%Pa
lliat
ive
Med
icin
eC
ount
Row
%TR
AIN
ING
FO
LLO
WIN
G F
AM
ILY
MED
ICIN
E O
R
SPEC
IALT
Y SU
BTO
TAL
Cou
ntR
ow %
Ane
sthe
siol
ogy
Cou
ntR
ow %
Crit
ical
Car
e (A
nes.
)C
ount
Row
%Pa
in M
edic
ine
(Ane
s.)
Cou
ntR
ow %
Tran
sfus
ion
Med
icin
e (A
nes.
)C
ount
Row
%Pu
blic
Hea
lth a
nd P
reve
ntiv
e M
edic
ine
Cou
ntR
ow %
Der
mat
olog
yC
ount
Row
%D
iagn
ostic
Rad
iolo
gyC
ount
Row
%N
euro
radi
olog
yC
ount
Row
%Pe
diat
ric D
iagn
ostic
Rad
iolo
gyC
ount
Row
%Em
erge
ncy
Med
icin
e (R
CPS
C)
Cou
ntR
ow %
Crit
ical
Car
e (E
mer
genc
y M
ed.)
Cou
ntR
ow %
Pedi
atric
Em
erge
ncy
Med
icin
eC
ount
Row
%In
tern
al M
edic
ine
Cou
ntR
ow %
503
230
733
487
269
756
558
299
857
589
330
919
623
353
976
68.6%
31.4%
100.
0%64.4%
35.6%
100.
0%65.1%
34.9%
100.
0%64.1%
35.9%
100.
0%63.8%
36.2%
100.
0%50
5710
748
6711
560
5911
951
6111
270
5712
746.7%
53.3%
100.
0%41.7%
58.3%
100.
0%50.4%
49.6%
100.
0%45.5%
54.5%
100.
0%55.1%
44.9%
100.
0%6
28
50
56
17
52
711
314
75.0%
25.0%
100.
0%100.0%
0.0%
100.
0%85.7%
14.3%
100.
0%71.4%
28.6%
100.
0%78.6%
21.4%
100.
0%42
1961
3631
6753
3083
6638
104
5537
9268.9%
31.1%
100.
0%53.7%
46.3%
100.
0%63.9%
36.1%
100.
0%63.5%
36.5%
100.
0%59.8%
40.2%
100.
0%601
308
909
576
367
943
677
389
1066
711
431
1142
759
450
1209
66.1%
33.9%
100.
0%61.1%
38.9%
100.
0%63.5%
36.5%
100.
0%62.3%
37.7%
100.
0%62.8%
37.2%
100.
0%11
213
75
1215
419
124
168
08
84.6%
15.4%
100.
0%58.3%
41.7%
100.
0%78.9%
21.1%
100.
0%75.0%
25.0%
100.
0%100.0%
0.0%
100.
0%11
213
75
1215
419
124
168
08
84.6%
15.4%
100.
0%58.3%
41.7%
100.
0%78.9%
21.1%
100.
0%75.0%
25.0%
100.
0%100.0%
0.0%
100.
0%40
5595
5151
102
4460
104
6568
133
5676
132
42.1%
57.9%
100.
0%50.0%
50.0%
100.
0%42.3%
57.7%
100.
0%48.9%
51.1%
100.
0%42.4%
57.6%
100.
0%4
711
03
32
35
03
32
79
36.4%
63.6%
100.
0%0.0%
100.0%
100.
0%40.0%
60.0%
100.
0%0.0%
100.0%
100.
0%22.2%
77.8%
100.
0%0
00
00
00
00
00
00
11
0.0%
0.0%
0.0%
0.0%
0.0%
0.0%
0.0%
0.0%
0.0%
0.0%
0.0%
0.0%
0.0%
100.0%
100.
0%0
00
10
10
00
00
00
00
0.0%
0.0%
0.0%
100.0%
0.0%
100.
0%0.0%
0.0%
0.0%
0.0%
0.0%
0.0%
0.0%
0.0%
0.0%
85
1313
316
99
1810
919
123
1561.5%
38.5%
100.
0%81.3%
18.8%
100.
0%50.0%
50.0%
100.
0%52.6%
47.4%
100.
0%80.0%
20.0%
100.
0%9
514
84
129
615
183
2118
523
64.3%
35.7%
100.
0%66.7%
33.3%
100.
0%60.0%
40.0%
100.
0%85.7%
14.3%
100.
0%78.3%
21.7%
100.
0%30
3767
3745
8239
4079
3554
8947
5510
244.8%
55.2%
100.
0%45.1%
54.9%
100.
0%49.4%
50.6%
100.
0%39.3%
60.7%
100.
0%46.1%
53.9%
100.
0%1
45
03
30
55
04
41
23
20.0%
80.0%
100.
0%0.0%
100.0%
100.
0%0.0%
100.0%
100.
0%0.0%
100.0%
100.
0%33.3%
66.7%
100.
0%0
00
00
01
12
20
22
02
0.0%
0.0%
0.0%
0.0%
0.0%
0.0%
50.0%
50.0%
100.
0%100.0%
0.0%
100.
0%100.0%
0.0%
100.
0%12
1729
913
2220
1434
1922
4120
3050
41.4%
58.6%
100.
0%40.9%
59.1%
100.
0%58.8%
41.2%
100.
0%46.3%
53.7%
100.
0%40.0%
60.0%
100.
0%0
22
05
53
47
12
31
45
0.0%
100.0%
100.
0%0.0%
100.0%
100.
0%42.9%
57.1%
100.
0%33.3%
66.7%
100.
0%20.0%
80.0%
100.
0%0
00
00
01
01
00
00
11
0.0%
0.0%
0.0%
0.0%
0.0%
0.0%
100.0%
0.0%
100.
0%0.0%
0.0%
0.0%
0.0%
100.0%
100.
0%28
1947
2237
5931
3061
1536
5114
2741
59.6%
40.4%
100.
0%37.3%
62.7%
100.
0%50.8%
49.2%
100.
0%29.4%
70.6%
100.
0%34.1%
65.9%
100.
0%
(cont.)
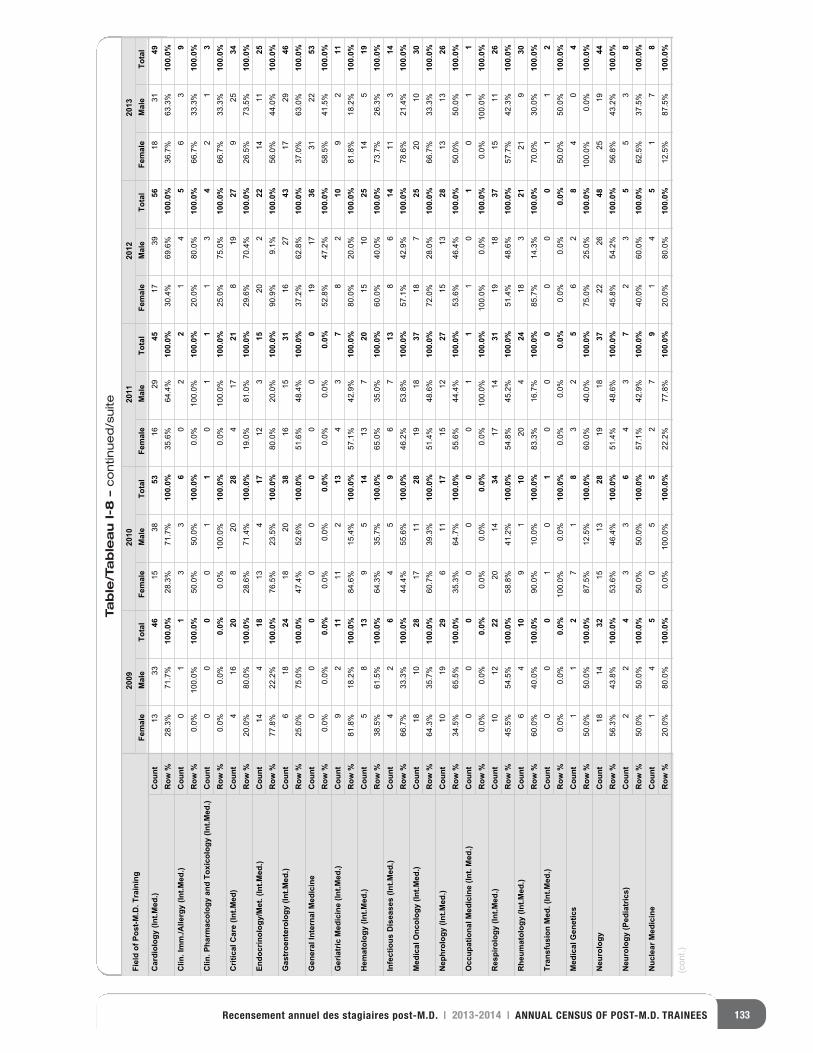
133Recensement annuel des stagiaires post-M.D. | 2013-2014 | ANNUAL CENSUS OF POST-M.D. TRAINEES
Table/Tableau I-8 –continued/suite
Fiel
d of
Pos
t-M.D
. Tra
inin
g20
0920
1020
1120
1220
13Fe
mal
eM
ale
Tota
lFe
mal
eM
ale
Tota
lFe
mal
eM
ale
Tota
lFe
mal
eM
ale
Tota
lFe
mal
eM
ale
Tota
lC
ardi
olog
y (In
t.Med
.)C
ount
Row
%C
lin. I
mm
./Alle
rgy
(Int.M
ed.)
Cou
ntR
ow %
Clin
. Pha
rmac
olog
y an
d To
xico
logy
(Int
.Med
.)C
ount
Row
%C
ritic
al C
are
(Int.M
ed)
Cou
ntR
ow %
Endo
crin
olog
y/M
et. (
Int.M
ed.)
Cou
ntR
ow %
Gas
troe
nter
olog
y (In
t.Med
.)C
ount
Row
%G
ener
al In
tern
al M
edic
ine
Cou
ntR
ow %
Ger
iatr
ic M
edic
ine
(Int.M
ed.)
Cou
ntR
ow %
Hem
atol
ogy
(Int.M
ed.)
Cou
ntR
ow %
Infe
ctio
us D
isea
ses
(Int.M
ed.)
Cou
ntR
ow %
Med
ical
Onc
olog
y (In
t.Med
.)C
ount
Row
%N
ephr
olog
y (In
t.Med
.)C
ount
Row
%O
ccup
atio
nal M
edic
ine
(Int.
Med
.)C
ount
Row
%R
espi
rolo
gy (I
nt.M
ed.)
Cou
ntR
ow %
Rhe
umat
olog
y (In
t.Med
.)C
ount
Row
%Tr
ansf
usio
n M
ed. (
Int.M
ed.)
Cou
ntR
ow %
Med
ical
Gen
etic
sC
ount
Row
%N
euro
logy
Cou
ntR
ow %
Neu
rolo
gy (P
edia
tric
s)C
ount
Row
%N
ucle
ar M
edic
ine
Cou
ntR
ow %
1333
4615
3853
1629
4517
3956
1831
4928.3%
71.7%
100.
0%28.3%
71.7%
100.
0%35.6%
64.4%
100.
0%30.4%
69.6%
100.
0%36.7%
63.3%
100.
0%0
11
33
60
22
14
56
39
0.0%
100.0%
100.
0%50.0%
50.0%
100.
0%0.0%
100.0%
100.
0%20.0%
80.0%
100.
0%66.7%
33.3%
100.
0%0
00
01
10
11
13
42
13
0.0%
0.0%
0.0%
0.0%
100.0%
100.
0%0.0%
100.0%
100.
0%25.0%
75.0%
100.
0%66.7%
33.3%
100.
0%4
1620
820
284
1721
819
279
2534
20.0%
80.0%
100.
0%28.6%
71.4%
100.
0%19.0%
81.0%
100.
0%29.6%
70.4%
100.
0%26.5%
73.5%
100.
0%14
418
134
1712
315
202
2214
1125
77.8%
22.2%
100.
0%76.5%
23.5%
100.
0%80.0%
20.0%
100.
0%90.9%
9.1%
100.
0%56.0%
44.0%
100.
0%6
1824
1820
3816
1531
1627
4317
2946
25.0%
75.0%
100.
0%47.4%
52.6%
100.
0%51.6%
48.4%
100.
0%37.2%
62.8%
100.
0%37.0%
63.0%
100.
0%0
00
00
00
00
1917
3631
2253
0.0%
0.0%
0.0%
0.0%
0.0%
0.0%
0.0%
0.0%
0.0%
52.8%
47.2%
100.
0%58.5%
41.5%
100.
0%9
211
112
134
37
82
109
211
81.8%
18.2%
100.
0%84.6%
15.4%
100.
0%57.1%
42.9%
100.
0%80.0%
20.0%
100.
0%81.8%
18.2%
100.
0%5
813
95
1413
720
1510
2514
519
38.5%
61.5%
100.
0%64.3%
35.7%
100.
0%65.0%
35.0%
100.
0%60.0%
40.0%
100.
0%73.7%
26.3%
100.
0%4
26
45
96
713
86
1411
314
66.7%
33.3%
100.
0%44.4%
55.6%
100.
0%46.2%
53.8%
100.
0%57.1%
42.9%
100.
0%78.6%
21.4%
100.
0%18
1028
1711
2819
1837
187
2520
1030
64.3%
35.7%
100.
0%60.7%
39.3%
100.
0%51.4%
48.6%
100.
0%72.0%
28.0%
100.
0%66.7%
33.3%
100.
0%10
1929
611
1715
1227
1513
2813
1326
34.5%
65.5%
100.
0%35.3%
64.7%
100.
0%55.6%
44.4%
100.
0%53.6%
46.4%
100.
0%50.0%
50.0%
100.
0%0
00
00
00
11
10
10
11
0.0%
0.0%
0.0%
0.0%
0.0%
0.0%
0.0%
100.0%
100.
0%100.0%
0.0%
100.
0%0.0%
100.0%
100.
0%10
1222
2014
3417
1431
1918
3715
1126
45.5%
54.5%
100.
0%58.8%
41.2%
100.
0%54.8%
45.2%
100.
0%51.4%
48.6%
100.
0%57.7%
42.3%
100.
0%6
410
91
1020
424
183
2121
930
60.0%
40.0%
100.
0%90.0%
10.0%
100.
0%83.3%
16.7%
100.
0%85.7%
14.3%
100.
0%70.0%
30.0%
100.
0%0
00
10
10
00
00
01
12
0.0%
0.0%
0.0%
100.0%
0.0%
100.
0%0.0%
0.0%
0.0%
0.0%
0.0%
0.0%
50.0%
50.0%
100.
0%1
12
71
83
25
62
84
04
50.0%
50.0%
100.
0%87.5%
12.5%
100.
0%60.0%
40.0%
100.
0%75.0%
25.0%
100.
0%100.0%
0.0%
100.
0%18
1432
1513
2819
1837
2226
4825
1944
56.3%
43.8%
100.
0%53.6%
46.4%
100.
0%51.4%
48.6%
100.
0%45.8%
54.2%
100.
0%56.8%
43.2%
100.
0%2
24
33
64
37
23
55
38
50.0%
50.0%
100.
0%50.0%
50.0%
100.
0%57.1%
42.9%
100.
0%40.0%
60.0%
100.
0%62.5%
37.5%
100.
0%1
45
05
52
79
14
51
78
20.0%
80.0%
100.
0%0.0%
100.0%
100.
0%22.2%
77.8%
100.
0%20.0%
80.0%
100.
0%12.5%
87.5%
100.
0%
(cont.)
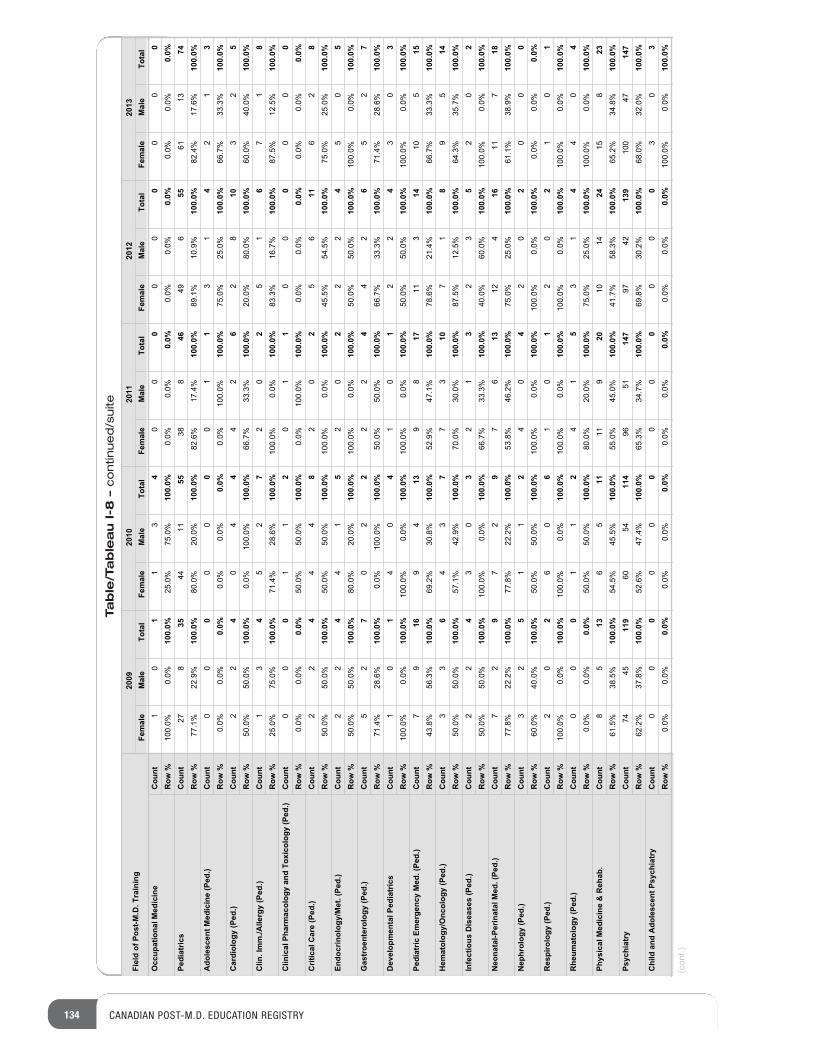
134 CANADIAN POST-M.D. EDUCATION REGISTRY
Table/Tableau I-8 –continued/suite
Fiel
d of
Pos
t-M.D
. Tra
inin
g20
0920
1020
1120
1220
13Fe
mal
eM
ale
Tota
lFe
mal
eM
ale
Tota
lFe
mal
eM
ale
Tota
lFe
mal
eM
ale
Tota
lFe
mal
eM
ale
Tota
lO
ccup
atio
nal M
edic
ine
Cou
ntR
ow %
Pedi
atric
sC
ount
Row
%A
dole
scen
t Med
icin
e (P
ed.)
Cou
ntR
ow %
Car
diol
ogy
(Ped
.)C
ount
Row
%C
lin. I
mm
./Alle
rgy
(Ped
.)C
ount
Row
%C
linic
al P
harm
acol
ogy
and
Toxi
colo
gy (P
ed.)
Cou
ntR
ow %
Crit
ical
Car
e (P
ed.)
Cou
ntR
ow %
Endo
crin
olog
y/M
et. (
Ped.
)C
ount
Row
%G
astr
oent
erol
ogy
(Ped
.)C
ount
Row
%D
evel
opm
enta
l Ped
iatr
ics
Cou
ntR
ow %
Pedi
atric
Em
erge
ncy
Med
. (Pe
d.)
Cou
ntR
ow %
Hem
atol
ogy/
Onc
olog
y (P
ed.)
Cou
ntR
ow %
Infe
ctio
us D
isea
ses
(Ped
.)C
ount
Row
%N
eona
tal-P
erin
atal
Med
. (Pe
d.)
Cou
ntR
ow %
Nep
hrol
ogy
(Ped
.)C
ount
Row
%R
espi
rolo
gy (P
ed.)
Cou
ntR
ow %
Rhe
umat
olog
y (P
ed.)
Cou
ntR
ow %
Phys
ical
Med
icin
e &
Reh
ab.
Cou
ntR
ow %
Psyc
hiat
ryC
ount
Row
%C
hild
and
Ado
lesc
ent P
sych
iatr
yC
ount
Row
%
10
11
34
00
00
00
00
0100.0%
0.0%
100.
0%25.0%
75.0%
100.
0%0.0%
0.0%
0.0%
0.0%
0.0%
0.0%
0.0%
0.0%
0.0%
278
3544
1155
388
4649
655
6113
7477.1%
22.9%
100.
0%80.0%
20.0%
100.
0%82.6%
17.4%
100.
0%89.1%
10.9%
100.
0%82.4%
17.6%
100.
0%0
00
00
00
11
31
42
13
0.0%
0.0%
0.0%
0.0%
0.0%
0.0%
0.0%
100.0%
100.
0%75.0%
25.0%
100.
0%66.7%
33.3%
100.
0%2
24
04
44
26
28
103
25
50.0%
50.0%
100.
0%0.0%
100.0%
100.
0%66.7%
33.3%
100.
0%20.0%
80.0%
100.
0%60.0%
40.0%
100.
0%1
34
52
72
02
51
67
18
25.0%
75.0%
100.
0%71.4%
28.6%
100.
0%100.0%
0.0%
100.
0%83.3%
16.7%
100.
0%87.5%
12.5%
100.
0%0
00
11
20
11
00
00
00
0.0%
0.0%
0.0%
50.0%
50.0%
100.
0%0.0%
100.0%
100.
0%0.0%
0.0%
0.0%
0.0%
0.0%
0.0%
22
44
48
20
25
611
62
850.0%
50.0%
100.
0%50.0%
50.0%
100.
0%100.0%
0.0%
100.
0%45.5%
54.5%
100.
0%75.0%
25.0%
100.
0%2
24
41
52
02
22
45
05
50.0%
50.0%
100.
0%80.0%
20.0%
100.
0%100.0%
0.0%
100.
0%50.0%
50.0%
100.
0%100.0%
0.0%
100.
0%5
27
02
22
24
42
65
27
71.4%
28.6%
100.
0%0.0%
100.0%
100.
0%50.0%
50.0%
100.
0%66.7%
33.3%
100.
0%71.4%
28.6%
100.
0%1
01
40
41
01
22
43
03
100.0%
0.0%
100.
0%100.0%
0.0%
100.
0%100.0%
0.0%
100.
0%50.0%
50.0%
100.
0%100.0%
0.0%
100.
0%7
916
94
139
817
113
1410
515
43.8%
56.3%
100.
0%69.2%
30.8%
100.
0%52.9%
47.1%
100.
0%78.6%
21.4%
100.
0%66.7%
33.3%
100.
0%3
36
43
77
310
71
89
514
50.0%
50.0%
100.
0%57.1%
42.9%
100.
0%70.0%
30.0%
100.
0%87.5%
12.5%
100.
0%64.3%
35.7%
100.
0%2
24
30
32
13
23
52
02
50.0%
50.0%
100.
0%100.0%
0.0%
100.
0%66.7%
33.3%
100.
0%40.0%
60.0%
100.
0%100.0%
0.0%
100.
0%7
29
72
97
613
124
1611
718
77.8%
22.2%
100.
0%77.8%
22.2%
100.
0%53.8%
46.2%
100.
0%75.0%
25.0%
100.
0%61.1%
38.9%
100.
0%3
25
11
24
04
20
20
00
60.0%
40.0%
100.
0%50.0%
50.0%
100.
0%100.0%
0.0%
100.
0%100.0%
0.0%
100.
0%0.0%
0.0%
0.0%
20
26
06
10
12
02
10
1100.0%
0.0%
100.
0%100.0%
0.0%
100.
0%100.0%
0.0%
100.
0%100.0%
0.0%
100.
0%100.0%
0.0%
100.
0%0
00
11
24
15
31
44
04
0.0%
0.0%
0.0%
50.0%
50.0%
100.
0%80.0%
20.0%
100.
0%75.0%
25.0%
100.
0%100.0%
0.0%
100.
0%8
513
65
1111
920
1014
2415
823
61.5%
38.5%
100.
0%54.5%
45.5%
100.
0%55.0%
45.0%
100.
0%41.7%
58.3%
100.
0%65.2%
34.8%
100.
0%74
4511
960
5411
496
5114
797
4213
9100
4714
762.2%
37.8%
100.
0%52.6%
47.4%
100.
0%65.3%
34.7%
100.
0%69.8%
30.2%
100.
0%68.0%
32.0%
100.
0%0
00
00
00
00
00
03
03
0.0%
0.0%
0.0%
0.0%
0.0%
0.0%
0.0%
0.0%
0.0%
0.0%
0.0%
0.0%
100.0%
0.0%
100.
0%
(cont.)
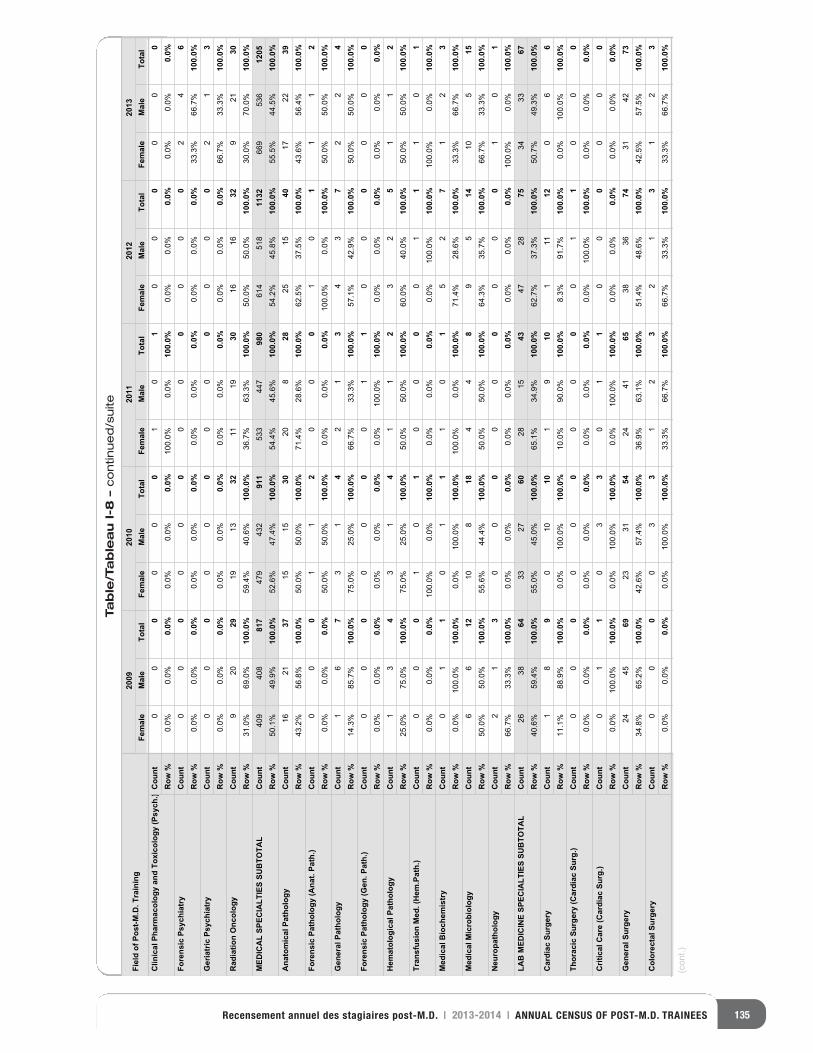
135Recensement annuel des stagiaires post-M.D. | 2013-2014 | ANNUAL CENSUS OF POST-M.D. TRAINEES
Table/Tableau I-8 –continued/suite
Fiel
d of
Pos
t-M.D
. Tra
inin
g20
0920
1020
1120
1220
13Fe
mal
eM
ale
Tota
lFe
mal
eM
ale
Tota
lFe
mal
eM
ale
Tota
lFe
mal
eM
ale
Tota
lFe
mal
eM
ale
Tota
lC
linic
al P
harm
acol
ogy
and
Toxi
colo
gy (P
sych
.)C
ount
Row
%Fo
rens
ic P
sych
iatr
yC
ount
Row
%G
eria
tric
Psy
chia
try
Cou
ntR
ow %
Rad
iatio
n O
ncol
ogy
Cou
ntR
ow %
MED
ICA
L SP
ECIA
LTIE
S SU
BTO
TAL
Cou
ntR
ow %
Ana
tom
ical
Pat
holo
gyC
ount
Row
%Fo
rens
ic P
atho
logy
(Ana
t. Pa
th.)
Cou
ntR
ow %
Gen
eral
Pat
holo
gyC
ount
Row
%Fo
rens
ic P
atho
logy
(Gen
. Pat
h.)
Cou
ntR
ow %
Hem
atol
ogic
al P
atho
logy
Cou
ntR
ow %
Tran
sfus
ion
Med
. (H
em.P
ath.
)C
ount
Row
%M
edic
al B
ioch
emis
try
Cou
ntR
ow %
Med
ical
Mic
robi
olog
yC
ount
Row
%N
euro
path
olog
yC
ount
Row
%LA
B M
EDIC
INE
SPEC
IALT
IES
SUB
TOTA
LC
ount
Row
%C
ardi
ac S
urge
ryC
ount
Row
%Th
orac
ic S
urge
ry (C
ardi
ac S
urg.
)C
ount
Row
%C
ritic
al C
are
(Car
diac
Sur
g.)
Cou
ntR
ow %
Gen
eral
Sur
gery
Cou
ntR
ow %
Col
orec
tal S
urge
ryC
ount
Row
%
00
00
00
10
10
00
00
00.0%
0.0%
0.0%
0.0%
0.0%
0.0%
100.0%
0.0%
100.
0%0.0%
0.0%
0.0%
0.0%
0.0%
0.0%
00
00
00
00
00
00
24
60.0%
0.0%
0.0%
0.0%
0.0%
0.0%
0.0%
0.0%
0.0%
0.0%
0.0%
0.0%
33.3%
66.7%
100.
0%0
00
00
00
00
00
02
13
0.0%
0.0%
0.0%
0.0%
0.0%
0.0%
0.0%
0.0%
0.0%
0.0%
0.0%
0.0%
66.7%
33.3%
100.
0%9
2029
1913
3211
1930
1616
329
2130
31.0%
69.0%
100.
0%59.4%
40.6%
100.
0%36.7%
63.3%
100.
0%50.0%
50.0%
100.
0%30.0%
70.0%
100.
0%409
408
817
479
432
911
533
447
980
614
518
1132
669
536
1205
50.1%
49.9%
100.
0%52.6%
47.4%
100.
0%54.4%
45.6%
100.
0%54.2%
45.8%
100.
0%55.5%
44.5%
100.
0%16
2137
1515
3020
828
2515
4017
2239
43.2%
56.8%
100.
0%50.0%
50.0%
100.
0%71.4%
28.6%
100.
0%62.5%
37.5%
100.
0%43.6%
56.4%
100.
0%0
00
11
20
00
10
11
12
0.0%
0.0%
0.0%
50.0%
50.0%
100.
0%0.0%
0.0%
0.0%
100.0%
0.0%
100.
0%50.0%
50.0%
100.
0%1
67
31
42
13
43
72
24
14.3%
85.7%
100.
0%75.0%
25.0%
100.
0%66.7%
33.3%
100.
0%57.1%
42.9%
100.
0%50.0%
50.0%
100.
0%0
00
00
00
11
00
00
00
0.0%
0.0%
0.0%
0.0%
0.0%
0.0%
0.0%
100.0%
100.
0%0.0%
0.0%
0.0%
0.0%
0.0%
0.0%
13
43
14
11
23
25
11
225.0%
75.0%
100.
0%75.0%
25.0%
100.
0%50.0%
50.0%
100.
0%60.0%
40.0%
100.
0%50.0%
50.0%
100.
0%0
00
10
10
00
01
11
01
0.0%
0.0%
0.0%
100.0%
0.0%
100.
0%0.0%
0.0%
0.0%
0.0%
100.0%
100.
0%100.0%
0.0%
100.
0%0
11
01
11
01
52
71
23
0.0%
100.0%
100.
0%0.0%
100.0%
100.
0%100.0%
0.0%
100.
0%71.4%
28.6%
100.
0%33.3%
66.7%
100.
0%6
612
108
184
48
95
1410
515
50.0%
50.0%
100.
0%55.6%
44.4%
100.
0%50.0%
50.0%
100.
0%64.3%
35.7%
100.
0%66.7%
33.3%
100.
0%2
13
00
00
00
00
01
01
66.7%
33.3%
100.
0%0.0%
0.0%
0.0%
0.0%
0.0%
0.0%
0.0%
0.0%
0.0%
100.0%
0.0%
100.
0%26
3864
3327
6028
1543
4728
7534
3367
40.6%
59.4%
100.
0%55.0%
45.0%
100.
0%65.1%
34.9%
100.
0%62.7%
37.3%
100.
0%50.7%
49.3%
100.
0%1
89
010
101
910
111
120
66
11.1%
88.9%
100.
0%0.0%
100.0%
100.
0%10.0%
90.0%
100.
0%8.3%
91.7%
100.
0%0.0%
100.0%
100.
0%0
00
00
00
00
01
10
00
0.0%
0.0%
0.0%
0.0%
0.0%
0.0%
0.0%
0.0%
0.0%
0.0%
100.0%
100.
0%0.0%
0.0%
0.0%
01
10
33
01
10
00
00
00.0%
100.0%
100.
0%0.0%
100.0%
100.
0%0.0%
100.0%
100.
0%0.0%
0.0%
0.0%
0.0%
0.0%
0.0%
2445
6923
3154
2441
6538
3674
3142
7334.8%
65.2%
100.
0%42.6%
57.4%
100.
0%36.9%
63.1%
100.
0%51.4%
48.6%
100.
0%42.5%
57.5%
100.
0%0
00
03
31
23
21
31
23
0.0%
0.0%
0.0%
0.0%
100.0%
100.
0%33.3%
66.7%
100.
0%66.7%
33.3%
100.
0%33.3%
66.7%
100.
0%
(cont.)
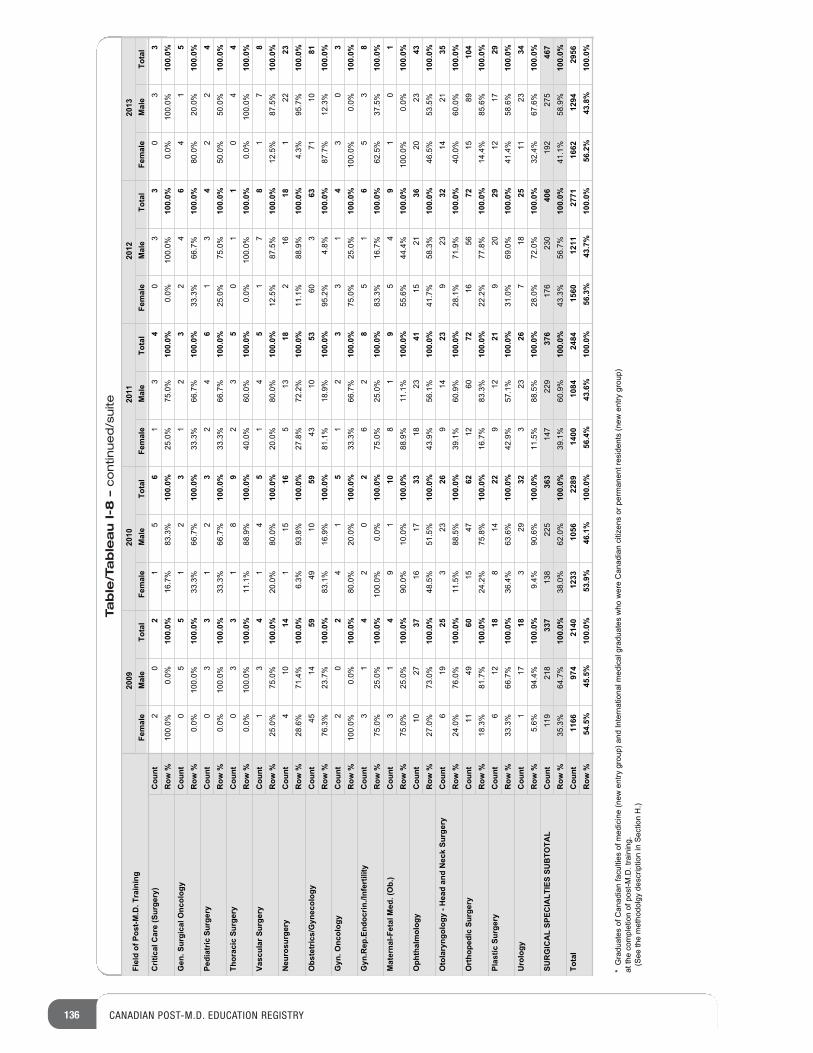
136 CANADIAN POST-M.D. EDUCATION REGISTRY
Table/Tableau I-8 –continued/suite
Fiel
d of
Pos
t-M.D
. Tra
inin
g20
0920
1020
1120
1220
13Fe
mal
eM
ale
Tota
lFe
mal
eM
ale
Tota
lFe
mal
eM
ale
Tota
lFe
mal
eM
ale
Tota
lFe
mal
eM
ale
Tota
lC
ritic
al C
are
(Sur
gery
)C
ount
Row
%G
en. S
urgi
cal O
ncol
ogy
Cou
ntR
ow %
Pedi
atric
Sur
gery
Cou
ntR
ow %
Thor
acic
Sur
gery
Cou
ntR
ow %
Vasc
ular
Sur
gery
Cou
ntR
ow %
Neu
rosu
rger
yC
ount
Row
%O
bste
tric
s/G
ynec
olog
yC
ount
Row
%G
yn. O
ncol
ogy
Cou
ntR
ow %
Gyn
.Rep
.End
ocrin
./Inf
ertil
ityC
ount
Row
%M
ater
nal-F
etal
Med
. (O
b.)
Cou
ntR
ow %
Oph
thal
mol
ogy
Cou
ntR
ow %
Oto
lary
ngol
ogy
- Hea
d an
d N
eck
Surg
ery
Cou
ntR
ow %
Ort
hope
dic
Surg
ery
Cou
ntR
ow %
Plas
tic S
urge
ryC
ount
Row
%U
rolo
gyC
ount
Row
%SU
RG
ICA
L SP
ECIA
LTIE
S SU
BTO
TAL
Cou
ntR
ow %
Tota
lC
ount
Row
%
20
21
56
13
40
33
03
310
0.0%
0.0%
100.
0%16
.7%
83.3
%10
0.0%
25.0
%75
.0%
100.
0%0.
0%10
0.0%
100.
0%0.
0%10
0.0%
100.
0%0
55
12
31
23
24
64
15
0.0%
100.
0%10
0.0%
33.3
%66
.7%
100.
0%33
.3%
66.7
%10
0.0%
33.3
%66
.7%
100.
0%80
.0%
20.0
%10
0.0%
03
31
23
24
61
34
22
40.
0%10
0.0%
100.
0%33
.3%
66.7
%10
0.0%
33.3
%66
.7%
100.
0%25
.0%
75.0
%10
0.0%
50.0
%50
.0%
100.
0%0
33
18
92
35
01
10
44
0.0%
100.
0%10
0.0%
11.1
%88
.9%
100.
0%40
.0%
60.0
%10
0.0%
0.0%
100.
0%10
0.0%
0.0%
100.
0%10
0.0%
13
41
45
14
51
78
17
825
.0%
75.0
%10
0.0%
20.0
%80
.0%
100.
0%20
.0%
80.0
%10
0.0%
12.5
%87
.5%
100.
0%12
.5%
87.5
%10
0.0%
410
141
1516
513
182
1618
122
2328
.6%
71.4
%10
0.0%
6.3%
93.8
%10
0.0%
27.8
%72
.2%
100.
0%11
.1%
88.9
%10
0.0%
4.3%
95.7
%10
0.0%
4514
5949
1059
4310
5360
363
7110
8176
.3%
23.7
%10
0.0%
83.1
%16
.9%
100.
0%81
.1%
18.9
%10
0.0%
95.2
%4.
8%10
0.0%
87.7
%12
.3%
100.
0%2
02
41
51
23
31
43
03
100.
0%0.
0%10
0.0%
80.0
%20
.0%
100.
0%33
.3%
66.7
%10
0.0%
75.0
%25
.0%
100.
0%10
0.0%
0.0%
100.
0%3
14
20
26
28
51
65
38
75.0
%25
.0%
100.
0%10
0.0%
0.0%
100.
0%75
.0%
25.0
%10
0.0%
83.3
%16
.7%
100.
0%62
.5%
37.5
%10
0.0%
31
49
110
81
95
49
10
175
.0%
25.0
%10
0.0%
90.0
%10
.0%
100.
0%88
.9%
11.1
%10
0.0%
55.6
%44
.4%
100.
0%10
0.0%
0.0%
100.
0%10
2737
1617
3318
2341
1521
3620
2343
27.0
%73
.0%
100.
0%48
.5%
51.5
%10
0.0%
43.9
%56
.1%
100.
0%41
.7%
58.3
%10
0.0%
46.5
%53
.5%
100.
0%6
1925
323
269
1423
923
3214
2135
24.0
%76
.0%
100.
0%11
.5%
88.5
%10
0.0%
39.1
%60
.9%
100.
0%28
.1%
71.9
%10
0.0%
40.0
%60
.0%
100.
0%11
4960
1547
6212
6072
1656
7215
8910
418
.3%
81.7
%10
0.0%
24.2
%75
.8%
100.
0%16
.7%
83.3
%10
0.0%
22.2
%77
.8%
100.
0%14
.4%
85.6
%10
0.0%
612
188
1422
912
219
2029
1217
2933
.3%
66.7
%10
0.0%
36.4
%63
.6%
100.
0%42
.9%
57.1
%10
0.0%
31.0
%69
.0%
100.
0%41
.4%
58.6
%10
0.0%
117
183
2932
323
267
1825
1123
345.
6%94
.4%
100.
0%9.
4%90
.6%
100.
0%11
.5%
88.5
%10
0.0%
28.0
%72
.0%
100.
0%32
.4%
67.6
%10
0.0%
119
218
337
138
225
363
147
229
376
176
230
406
192
275
467
35.3
%64
.7%
100.
0%38
.0%
62.0
%10
0.0%
39.1
%60
.9%
100.
0%43
.3%
56.7
%10
0.0%
41.1
%58
.9%
100.
0%11
6697
421
4012
3310
5622
8914
0010
8424
8415
6012
1127
7116
6212
9429
5654
.5%
45.5
%10
0.0%
53.9
%46
.1%
100.
0%56
.4%
43.6
%10
0.0%
56.3
%43
.7%
100.
0%56
.2%
43.8
%10
0.0%
* G
radu
ates
of C
anad
ian
facu
lties
of m
edic
ine
(new
ent
ry g
roup
) and
Inte
rnat
iona
l med
ical
gra
duat
es w
ho w
ere
Can
adia
n ci
tizen
s or
per
man
ent r
esid
ents
(new
ent
ry g
roup
) at
the
com
plet
ion
of p
ost-M
.D. t
rain
ing.
(S
ee th
e m
etho
dolg
y de
scrip
tion
in S
ectio
n H
.)
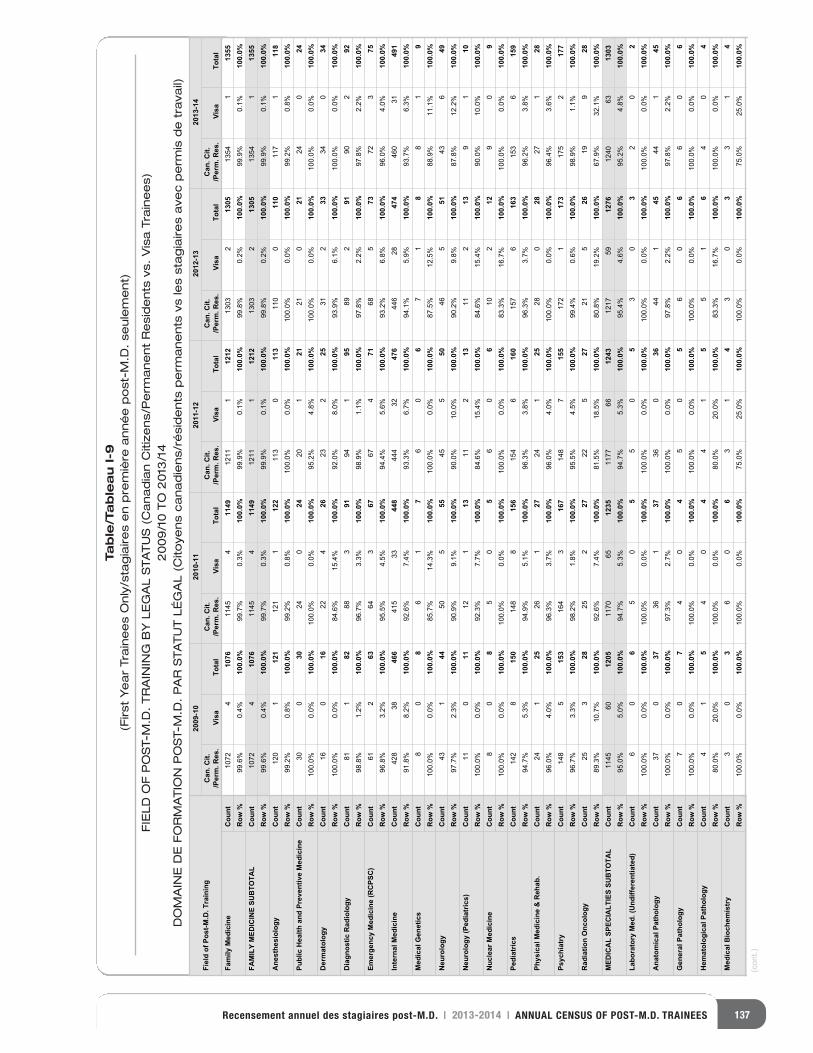
137Recensement annuel des stagiaires post-M.D. | 2013-2014 | ANNUAL CENSUS OF POST-M.D. TRAINEES
Table/Tableau I-9
(First Year Trainees Only/stagiaires en première année post-M.D. seulement)
FIELD OF POST-M.D. TRAINING BY LEGAL STATUS (Canadian Citizens/Permanent Residents vs. Visa Trainees)
2009/10 TO 2013/14
DOMAINE DE FORMATION POST-M.D. PAR STATUT LÉGAL (Citoyens canadiens/résidents permanents vs les stagiaires avec permis de travail)
Fiel
d of
Pos
t-M.D
. Tra
inin
g20
09-1
020
10-1
120
11-1
220
12-1
320
13-1
4C
an. C
it./P
erm
. Res
.Vi
saTo
tal
Can
. Cit.
/Per
m. R
es.
Visa
Tota
lC
an. C
it./P
erm
. Res
.Vi
saTo
tal
Can
. Cit.
/Per
m. R
es.
Visa
Tota
lC
an. C
it./P
erm
. Res
.Vi
saTo
tal
Fam
ily M
edic
ine
Cou
ntR
ow %
FAM
ILY
MED
ICIN
E SU
BTO
TAL
Cou
ntR
ow %
Ane
sthe
siol
ogy
Cou
ntR
ow %
Publ
ic H
ealth
and
Pre
vent
ive
Med
icin
eC
ount
Row
%D
erm
atol
ogy
Cou
ntR
ow %
Dia
gnos
tic R
adio
logy
Cou
ntR
ow %
Emer
genc
y M
edic
ine
(RC
PSC
)C
ount
Row
%In
tern
al M
edic
ine
Cou
ntR
ow %
Med
ical
Gen
etic
sC
ount
Row
%N
euro
logy
Cou
ntR
ow %
Neu
rolo
gy (P
edia
tric
s)C
ount
Row
%N
ucle
ar M
edic
ine
Cou
ntR
ow %
Pedi
atric
sC
ount
Row
%Ph
ysic
al M
edic
ine
& R
ehab
.C
ount
Row
%Ps
ychi
atry
Cou
ntR
ow %
Rad
iatio
n O
ncol
ogy
Cou
ntR
ow %
MED
ICA
L SP
ECIA
LTIE
S SU
BTO
TAL
Cou
ntR
ow %
Labo
rato
ry M
ed. (
Und
iffer
entia
ted)
Cou
ntR
ow %
Ana
tom
ical
Pat
holo
gyC
ount
Row
%G
ener
al P
atho
logy
Cou
ntR
ow %
Hem
atol
ogic
al P
atho
logy
Cou
ntR
ow %
Med
ical
Bio
chem
istr
yC
ount
Row
%
1072
410
761145
411
491211
112
121303
213
051354
113
5599.6%
0.4%
100.
0%99.7%
0.3%
100.
0%99.9%
0.1%
100.
0%99.8%
0.2%
100.
0%99.9%
0.1%
100.
0%1072
410
761145
411
491211
112
121303
213
051354
113
5599.6%
0.4%
100.
0%99.7%
0.3%
100.
0%99.9%
0.1%
100.
0%99.8%
0.2%
100.
0%99.9%
0.1%
100.
0%120
112
1121
112
2113
011
3110
011
0117
111
899.2%
0.8%
100.
0%99.2%
0.8%
100.
0%100.0%
0.0%
100.
0%100.0%
0.0%
100.
0%99.2%
0.8%
100.
0%30
030
240
2420
121
210
2124
024
100.0%
0.0%
100.
0%100.0%
0.0%
100.
0%95.2%
4.8%
100.
0%100.0%
0.0%
100.
0%100.0%
0.0%
100.
0%16
016
224
2623
225
312
3334
034
100.0%
0.0%
100.
0%84.6%
15.4%
100.
0%92.0%
8.0%
100.
0%93.9%
6.1%
100.
0%100.0%
0.0%
100.
0%81
182
883
9194
195
892
9190
292
98.8%
1.2%
100.
0%96.7%
3.3%
100.
0%98.9%
1.1%
100.
0%97.8%
2.2%
100.
0%97.8%
2.2%
100.
0%61
263
643
6767
471
685
7372
375
96.8%
3.2%
100.
0%95.5%
4.5%
100.
0%94.4%
5.6%
100.
0%93.2%
6.8%
100.
0%96.0%
4.0%
100.
0%428
3846
6415
3344
8444
3247
6446
2847
4460
3149
191.8%
8.2%
100.
0%92.6%
7.4%
100.
0%93.3%
6.7%
100.
0%94.1%
5.9%
100.
0%93.7%
6.3%
100.
0%8
08
61
76
06
71
88
19
100.0%
0.0%
100.
0%85.7%
14.3%
100.
0%100.0%
0.0%
100.
0%87.5%
12.5%
100.
0%88.9%
11.1%
100.
0%43
144
505
5545
550
465
5143
649
97.7%
2.3%
100.
0%90.9%
9.1%
100.
0%90.0%
10.0%
100.
0%90.2%
9.8%
100.
0%87.8%
12.2%
100.
0%11
011
121
1311
213
112
139
110
100.0%
0.0%
100.
0%92.3%
7.7%
100.
0%84.6%
15.4%
100.
0%84.6%
15.4%
100.
0%90.0%
10.0%
100.
0%8
08
50
56
06
102
129
09
100.0%
0.0%
100.
0%100.0%
0.0%
100.
0%100.0%
0.0%
100.
0%83.3%
16.7%
100.
0%100.0%
0.0%
100.
0%142
815
0148
815
6154
616
0157
616
3153
615
994.7%
5.3%
100.
0%94.9%
5.1%
100.
0%96.3%
3.8%
100.
0%96.3%
3.7%
100.
0%96.2%
3.8%
100.
0%24
125
261
2724
125
280
2827
128
96.0%
4.0%
100.
0%96.3%
3.7%
100.
0%96.0%
4.0%
100.
0%100.0%
0.0%
100.
0%96.4%
3.6%
100.
0%148
515
3164
316
7148
715
5172
117
3175
217
796.7%
3.3%
100.
0%98.2%
1.8%
100.
0%95.5%
4.5%
100.
0%99.4%
0.6%
100.
0%98.9%
1.1%
100.
0%25
328
252
2722
527
215
2619
928
89.3%
10.7%
100.
0%92.6%
7.4%
100.
0%81.5%
18.5%
100.
0%80.8%
19.2%
100.
0%67.9%
32.1%
100.
0%1145
6012
051170
6512
351177
6612
431217
5912
761240
6313
0395.0%
5.0%
100.
0%94.7%
5.3%
100.
0%94.7%
5.3%
100.
0%95.4%
4.6%
100.
0%95.2%
4.8%
100.
0%6
06
50
55
05
30
32
02
100.0%
0.0%
100.
0%100.0%
0.0%
100.
0%100.0%
0.0%
100.
0%100.0%
0.0%
100.
0%100.0%
0.0%
100.
0%37
037
361
3736
036
441
4544
145
100.0%
0.0%
100.
0%97.3%
2.7%
100.
0%100.0%
0.0%
100.
0%97.8%
2.2%
100.
0%97.8%
2.2%
100.
0%7
07
40
45
05
60
66
06
100.0%
0.0%
100.
0%100.0%
0.0%
100.
0%100.0%
0.0%
100.
0%100.0%
0.0%
100.
0%100.0%
0.0%
100.
0%4
15
40
44
15
51
64
04
80.0%
20.0%
100.
0%100.0%
0.0%
100.
0%80.0%
20.0%
100.
0%83.3%
16.7%
100.
0%100.0%
0.0%
100.
0%3
03
60
63
14
30
33
14
100.0%
0.0%
100.
0%100.0%
0.0%
100.
0%75.0%
25.0%
100.
0%100.0%
0.0%
100.
0%75.0%
25.0%
100.
0%
(cont.)
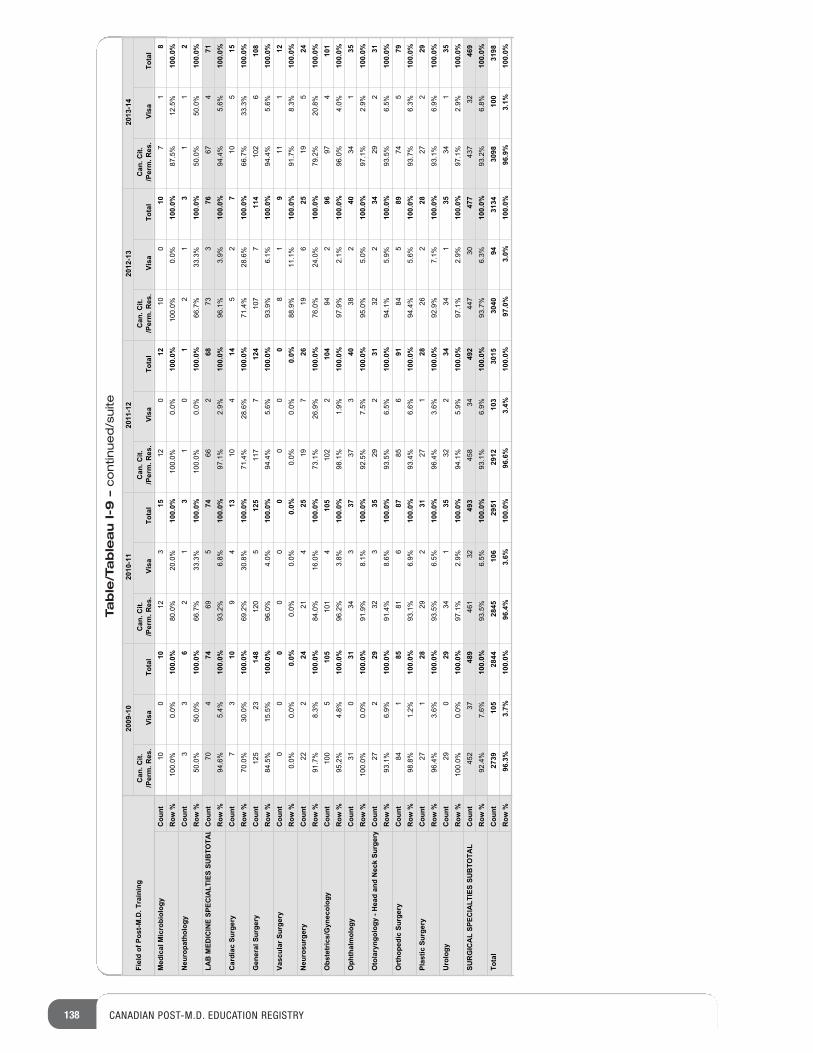
138 CANADIAN POST-M.D. EDUCATION REGISTRY
Table/Tableau I-9 –continued/suite
Fiel
d of
Pos
t-M.D
. Tra
inin
g20
09-1
020
10-1
120
11-1
220
12-1
320
13-1
4C
an. C
it./P
erm
. Res
.Vi
saTo
tal
Can
. Cit.
/Per
m. R
es.
Visa
Tota
lC
an. C
it./P
erm
. Res
.Vi
saTo
tal
Can
. Cit.
/Per
m. R
es.
Visa
Tota
lC
an. C
it./P
erm
. Res
.Vi
saTo
tal
Med
ical
Mic
robi
olog
yC
ount
Row
%N
euro
path
olog
yC
ount
Row
%LA
B M
EDIC
INE
SPEC
IALT
IES
SUB
TOTA
LC
ount
Row
%C
ardi
ac S
urge
ryC
ount
Row
%G
ener
al S
urge
ryC
ount
Row
%Va
scul
ar S
urge
ryC
ount
Row
%N
euro
surg
ery
Cou
ntR
ow %
Obs
tetr
ics/
Gyn
ecol
ogy
Cou
ntR
ow %
Oph
thal
mol
ogy
Cou
ntR
ow %
Oto
lary
ngol
ogy
- Hea
d an
d N
eck
Surg
ery
Cou
ntR
ow %
Ort
hope
dic
Surg
ery
Cou
ntR
ow %
Plas
tic S
urge
ryC
ount
Row
%U
rolo
gyC
ount
Row
%SU
RG
ICA
L SP
ECIA
LTIE
S SU
BTO
TAL
Cou
ntR
ow %
Tota
lC
ount
Row
%
100
1012
315
120
1210
010
71
8100.0%
0.0%
100.
0%80.0%
20.0%
100.
0%100.0%
0.0%
100.
0%100.0%
0.0%
100.
0%87.5%
12.5%
100.
0%3
36
21
31
01
21
31
12
50.0%
50.0%
100.
0%66.7%
33.3%
100.
0%100.0%
0.0%
100.
0%66.7%
33.3%
100.
0%50.0%
50.0%
100.
0%70
474
695
7466
268
733
7667
471
94.6%
5.4%
100.
0%93.2%
6.8%
100.
0%97.1%
2.9%
100.
0%96.1%
3.9%
100.
0%94.4%
5.6%
100.
0%7
310
94
1310
414
52
710
515
70.0%
30.0%
100.
0%69.2%
30.8%
100.
0%71.4%
28.6%
100.
0%71.4%
28.6%
100.
0%66.7%
33.3%
100.
0%125
2314
8120
512
5117
712
4107
711
4102
610
884.5%
15.5%
100.
0%96.0%
4.0%
100.
0%94.4%
5.6%
100.
0%93.9%
6.1%
100.
0%94.4%
5.6%
100.
0%0
00
00
00
00
81
911
112
0.0%
0.0%
0.0%
0.0%
0.0%
0.0%
0.0%
0.0%
0.0%
88.9%
11.1%
100.
0%91.7%
8.3%
100.
0%22
224
214
2519
726
196
2519
524
91.7%
8.3%
100.
0%84.0%
16.0%
100.
0%73.1%
26.9%
100.
0%76.0%
24.0%
100.
0%79.2%
20.8%
100.
0%100
510
5101
410
5102
210
494
296
974
101
95.2%
4.8%
100.
0%96.2%
3.8%
100.
0%98.1%
1.9%
100.
0%97.9%
2.1%
100.
0%96.0%
4.0%
100.
0%31
031
343
3737
340
382
4034
135
100.0%
0.0%
100.
0%91.9%
8.1%
100.
0%92.5%
7.5%
100.
0%95.0%
5.0%
100.
0%97.1%
2.9%
100.
0%27
229
323
3529
231
322
3429
231
93.1%
6.9%
100.
0%91.4%
8.6%
100.
0%93.5%
6.5%
100.
0%94.1%
5.9%
100.
0%93.5%
6.5%
100.
0%84
185
816
8785
691
845
8974
579
98.8%
1.2%
100.
0%93.1%
6.9%
100.
0%93.4%
6.6%
100.
0%94.4%
5.6%
100.
0%93.7%
6.3%
100.
0%27
128
292
3127
128
262
2827
229
96.4%
3.6%
100.
0%93.5%
6.5%
100.
0%96.4%
3.6%
100.
0%92.9%
7.1%
100.
0%93.1%
6.9%
100.
0%29
029
341
3532
234
341
3534
135
100.0%
0.0%
100.
0%97.1%
2.9%
100.
0%94.1%
5.9%
100.
0%97.1%
2.9%
100.
0%97.1%
2.9%
100.
0%452
3748
9461
3249
3458
3449
2447
3047
7437
3246
992.4%
7.6%
100.
0%93.5%
6.5%
100.
0%93.1%
6.9%
100.
0%93.7%
6.3%
100.
0%93.2%
6.8%
100.
0%27
3910
528
4428
4510
629
5129
1210
330
1530
4094
3134
3098
100
3198
96.3
%3.
7%10
0.0%
96.4
%3.
6%10
0.0%
96.6
%3.
4%10
0.0%
97.0
%3.
0%10
0.0%
96.9
%3.
1%10
0.0%
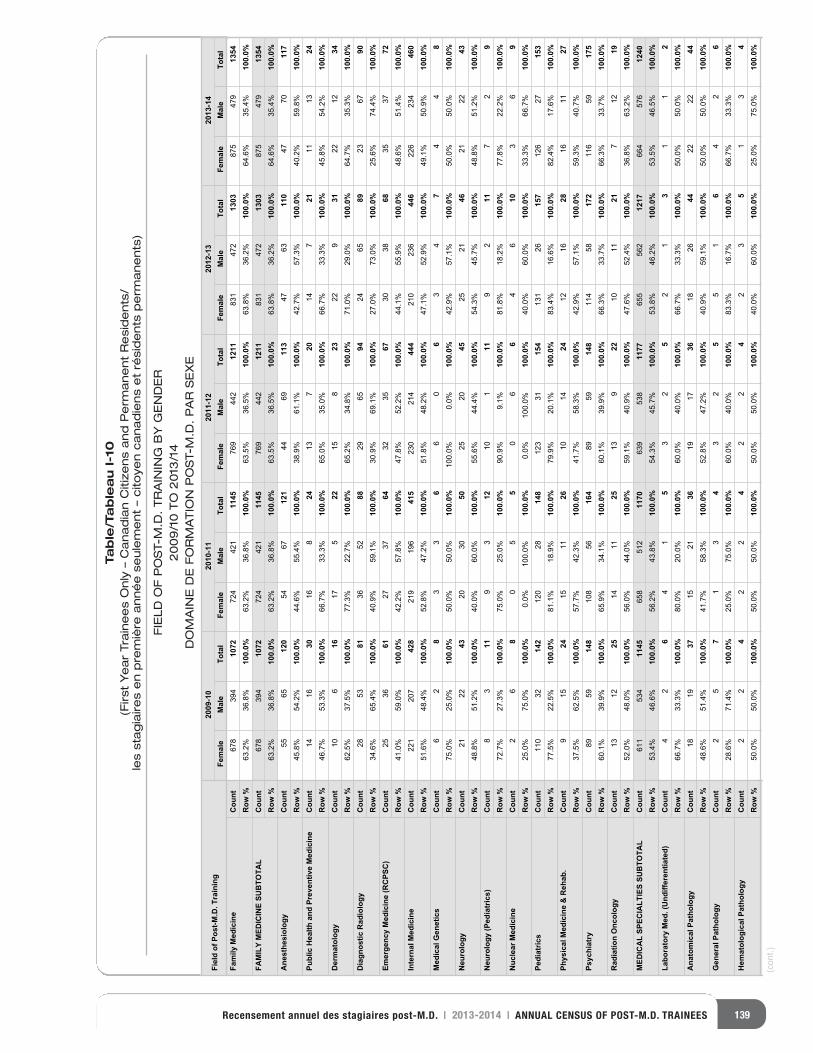
139Recensement annuel des stagiaires post-M.D. | 2013-2014 | ANNUAL CENSUS OF POST-M.D. TRAINEES
Table/Tableau I-10
(First Year Trainees Only – Canadian Citizens and Permanent Residents/
les stagiaires en première année seulement – citoyen canadiens et résidents permanents)
FIELD OF POST-M.D. TRAINING BY GENDER
2009/10 TO 2013/14
DOMAINE DE FORMATION POST-M.D. PAR SEXE
Fiel
d of
Pos
t-M.D
. Tra
inin
g20
09-1
020
10-1
120
11-1
220
12-1
320
13-1
4Fe
mal
eM
ale
Tota
lFe
mal
eM
ale
Tota
lFe
mal
eM
ale
Tota
lFe
mal
eM
ale
Tota
lFe
mal
eM
ale
Tota
lFa
mily
Med
icin
eC
ount
Row
%FA
MIL
Y M
EDIC
INE
SUB
TOTA
LC
ount
Row
%A
nest
hesi
olog
yC
ount
Row
%Pu
blic
Hea
lth a
nd P
reve
ntiv
e M
edic
ine
Cou
ntR
ow %
Der
mat
olog
yC
ount
Row
%D
iagn
ostic
Rad
iolo
gyC
ount
Row
%Em
erge
ncy
Med
icin
e (R
CPS
C)
Cou
ntR
ow %
Inte
rnal
Med
icin
eC
ount
Row
%M
edic
al G
enet
ics
Cou
ntR
ow %
Neu
rolo
gyC
ount
Row
%N
euro
logy
(Ped
iatr
ics)
Cou
ntR
ow %
Nuc
lear
Med
icin
eC
ount
Row
%Pe
diat
rics
Cou
ntR
ow %
Phys
ical
Med
icin
e &
Reh
ab.
Cou
ntR
ow %
Psyc
hiat
ryC
ount
Row
%R
adia
tion
Onc
olog
yC
ount
Row
%M
EDIC
AL
SPEC
IALT
IES
SUB
TOTA
LC
ount
Row
%La
bora
tory
Med
. (U
ndiff
eren
tiate
d)C
ount
Row
%A
nato
mic
al P
atho
logy
Cou
ntR
ow %
Gen
eral
Pat
holo
gyC
ount
Row
%H
emat
olog
ical
Pat
holo
gyC
ount
Row
%
678
394
1072
724
421
1145
769
442
1211
831
472
1303
875
479
1354
63.2%
36.8%
100.
0%63.2%
36.8%
100.
0%63.5%
36.5%
100.
0%63.8%
36.2%
100.
0%64.6%
35.4%
100.
0%678
394
1072
724
421
1145
769
442
1211
831
472
1303
875
479
1354
63.2%
36.8%
100.
0%63.2%
36.8%
100.
0%63.5%
36.5%
100.
0%63.8%
36.2%
100.
0%64.6%
35.4%
100.
0%55
6512
054
6712
144
6911
347
6311
047
7011
745.8%
54.2%
100.
0%44.6%
55.4%
100.
0%38.9%
61.1%
100.
0%42.7%
57.3%
100.
0%40.2%
59.8%
100.
0%14
1630
168
2413
720
147
2111
1324
46.7%
53.3%
100.
0%66.7%
33.3%
100.
0%65.0%
35.0%
100.
0%66.7%
33.3%
100.
0%45.8%
54.2%
100.
0%10
616
175
2215
823
229
3122
1234
62.5%
37.5%
100.
0%77.3%
22.7%
100.
0%65.2%
34.8%
100.
0%71.0%
29.0%
100.
0%64.7%
35.3%
100.
0%28
5381
3652
8829
6594
2465
8923
6790
34.6%
65.4%
100.
0%40.9%
59.1%
100.
0%30.9%
69.1%
100.
0%27.0%
73.0%
100.
0%25.6%
74.4%
100.
0%25
3661
2737
6432
3567
3038
6835
3772
41.0%
59.0%
100.
0%42.2%
57.8%
100.
0%47.8%
52.2%
100.
0%44.1%
55.9%
100.
0%48.6%
51.4%
100.
0%221
207
428
219
196
415
230
214
444
210
236
446
226
234
460
51.6%
48.4%
100.
0%52.8%
47.2%
100.
0%51.8%
48.2%
100.
0%47.1%
52.9%
100.
0%49.1%
50.9%
100.
0%6
28
33
66
06
34
74
48
75.0%
25.0%
100.
0%50.0%
50.0%
100.
0%100.0%
0.0%
100.
0%42.9%
57.1%
100.
0%50.0%
50.0%
100.
0%21
2243
2030
5025
2045
2521
4621
2243
48.8%
51.2%
100.
0%40.0%
60.0%
100.
0%55.6%
44.4%
100.
0%54.3%
45.7%
100.
0%48.8%
51.2%
100.
0%8
311
93
1210
111
92
117
29
72.7%
27.3%
100.
0%75.0%
25.0%
100.
0%90.9%
9.1%
100.
0%81.8%
18.2%
100.
0%77.8%
22.2%
100.
0%2
68
05
50
66
46
103
69
25.0%
75.0%
100.
0%0.0%
100.0%
100.
0%0.0%
100.0%
100.
0%40.0%
60.0%
100.
0%33.3%
66.7%
100.
0%110
3214
2120
2814
8123
3115
4131
2615
7126
2715
377.5%
22.5%
100.
0%81.1%
18.9%
100.
0%79.9%
20.1%
100.
0%83.4%
16.6%
100.
0%82.4%
17.6%
100.
0%9
1524
1511
2610
1424
1216
2816
1127
37.5%
62.5%
100.
0%57.7%
42.3%
100.
0%41.7%
58.3%
100.
0%42.9%
57.1%
100.
0%59.3%
40.7%
100.
0%89
5914
8108
5616
489
5914
8114
5817
2116
5917
560.1%
39.9%
100.
0%65.9%
34.1%
100.
0%60.1%
39.9%
100.
0%66.3%
33.7%
100.
0%66.3%
33.7%
100.
0%13
1225
1411
2513
922
1011
217
1219
52.0%
48.0%
100.
0%56.0%
44.0%
100.
0%59.1%
40.9%
100.
0%47.6%
52.4%
100.
0%36.8%
63.2%
100.
0%611
534
1145
658
512
1170
639
538
1177
655
562
1217
664
576
1240
53.4%
46.6%
100.
0%56.2%
43.8%
100.
0%54.3%
45.7%
100.
0%53.8%
46.2%
100.
0%53.5%
46.5%
100.
0%4
26
41
53
25
21
31
12
66.7%
33.3%
100.
0%80.0%
20.0%
100.
0%60.0%
40.0%
100.
0%66.7%
33.3%
100.
0%50.0%
50.0%
100.
0%18
1937
1521
3619
1736
1826
4422
2244
48.6%
51.4%
100.
0%41.7%
58.3%
100.
0%52.8%
47.2%
100.
0%40.9%
59.1%
100.
0%50.0%
50.0%
100.
0%2
57
13
43
25
51
64
26
28.6%
71.4%
100.
0%25.0%
75.0%
100.
0%60.0%
40.0%
100.
0%83.3%
16.7%
100.
0%66.7%
33.3%
100.
0%2
24
22
42
24
23
51
34
50.0%
50.0%
100.
0%50.0%
50.0%
100.
0%50.0%
50.0%
100.
0%40.0%
60.0%
100.
0%25.0%
75.0%
100.
0%
(cont.)
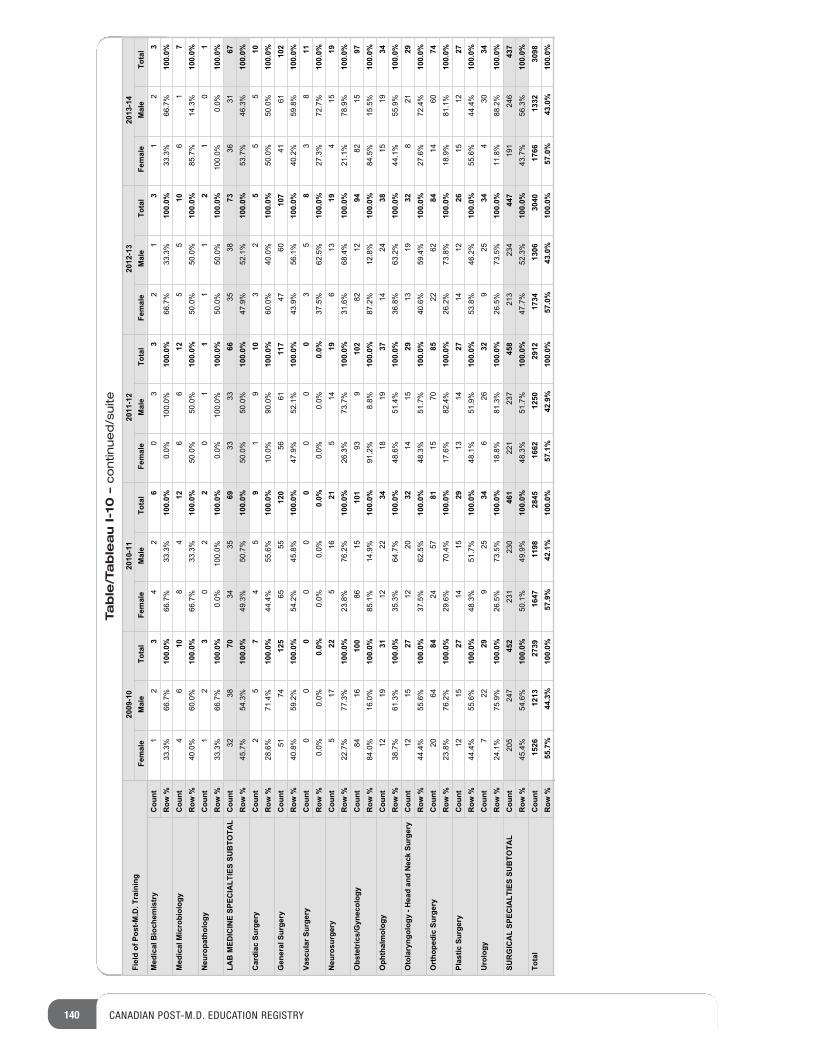
140 CANADIAN POST-M.D. EDUCATION REGISTRY
Table/Tableau I-10 –continued/suite
Fiel
d of
Pos
t-M.D
. Tra
inin
g20
09-1
020
10-1
120
11-1
220
12-1
320
13-1
4Fe
mal
eM
ale
Tota
lFe
mal
eM
ale
Tota
lFe
mal
eM
ale
Tota
lFe
mal
eM
ale
Tota
lFe
mal
eM
ale
Tota
lM
edic
al B
ioch
emis
try
Cou
ntR
ow %
Med
ical
Mic
robi
olog
yC
ount
Row
%N
euro
path
olog
yC
ount
Row
%LA
B M
EDIC
INE
SPEC
IALT
IES
SUB
TOTA
LC
ount
Row
%C
ardi
ac S
urge
ryC
ount
Row
%G
ener
al S
urge
ryC
ount
Row
%Va
scul
ar S
urge
ryC
ount
Row
%N
euro
surg
ery
Cou
ntR
ow %
Obs
tetr
ics/
Gyn
ecol
ogy
Cou
ntR
ow %
Oph
thal
mol
ogy
Cou
ntR
ow %
Oto
lary
ngol
ogy
- Hea
d an
d N
eck
Surg
ery
Cou
ntR
ow %
Ort
hope
dic
Surg
ery
Cou
ntR
ow %
Plas
tic S
urge
ryC
ount
Row
%U
rolo
gyC
ount
Row
%SU
RG
ICA
L SP
ECIA
LTIE
S SU
BTO
TAL
Cou
ntR
ow %
Tota
lC
ount
Row
%
12
34
26
03
32
13
12
333.3%
66.7%
100.
0%66.7%
33.3%
100.
0%0.0%
100.0%
100.
0%66.7%
33.3%
100.
0%33.3%
66.7%
100.
0%4
610
84
126
612
55
106
17
40.0%
60.0%
100.
0%66.7%
33.3%
100.
0%50.0%
50.0%
100.
0%50.0%
50.0%
100.
0%85.7%
14.3%
100.
0%1
23
02
20
11
11
21
01
33.3%
66.7%
100.
0%0.0%
100.0%
100.
0%0.0%
100.0%
100.
0%50.0%
50.0%
100.
0%100.0%
0.0%
100.
0%32
3870
3435
6933
3366
3538
7336
3167
45.7%
54.3%
100.
0%49.3%
50.7%
100.
0%50.0%
50.0%
100.
0%47.9%
52.1%
100.
0%53.7%
46.3%
100.
0%2
57
45
91
910
32
55
510
28.6%
71.4%
100.
0%44.4%
55.6%
100.
0%10.0%
90.0%
100.
0%60.0%
40.0%
100.
0%50.0%
50.0%
100.
0%51
7412
565
5512
056
6111
747
6010
741
6110
240.8%
59.2%
100.
0%54.2%
45.8%
100.
0%47.9%
52.1%
100.
0%43.9%
56.1%
100.
0%40.2%
59.8%
100.
0%0
00
00
00
00
35
83
811
0.0%
0.0%
0.0%
0.0%
0.0%
0.0%
0.0%
0.0%
0.0%
37.5%
62.5%
100.
0%27.3%
72.7%
100.
0%5
1722
516
215
1419
613
194
1519
22.7%
77.3%
100.
0%23.8%
76.2%
100.
0%26.3%
73.7%
100.
0%31.6%
68.4%
100.
0%21.1%
78.9%
100.
0%84
1610
086
1510
193
910
282
1294
8215
9784.0%
16.0%
100.
0%85.1%
14.9%
100.
0%91.2%
8.8%
100.
0%87.2%
12.8%
100.
0%84.5%
15.5%
100.
0%12
1931
1222
3418
1937
1424
3815
1934
38.7%
61.3%
100.
0%35.3%
64.7%
100.
0%48.6%
51.4%
100.
0%36.8%
63.2%
100.
0%44.1%
55.9%
100.
0%12
1527
1220
3214
1529
1319
328
2129
44.4%
55.6%
100.
0%37.5%
62.5%
100.
0%48.3%
51.7%
100.
0%40.6%
59.4%
100.
0%27.6%
72.4%
100.
0%20
6484
2457
8115
7085
2262
8414
6074
23.8%
76.2%
100.
0%29.6%
70.4%
100.
0%17.6%
82.4%
100.
0%26.2%
73.8%
100.
0%18.9%
81.1%
100.
0%12
1527
1415
2913
1427
1412
2615
1227
44.4%
55.6%
100.
0%48.3%
51.7%
100.
0%48.1%
51.9%
100.
0%53.8%
46.2%
100.
0%55.6%
44.4%
100.
0%7
2229
925
346
2632
925
344
3034
24.1%
75.9%
100.
0%26.5%
73.5%
100.
0%18.8%
81.3%
100.
0%26.5%
73.5%
100.
0%11.8%
88.2%
100.
0%205
247
452
231
230
461
221
237
458
213
234
447
191
246
437
45.4%
54.6%
100.
0%50.1%
49.9%
100.
0%48.3%
51.7%
100.
0%47.7%
52.3%
100.
0%43.7%
56.3%
100.
0%15
2612
1327
3916
4711
9828
4516
6212
5029
1217
3413
0630
4017
6613
3230
9855
.7%
44.3
%10
0.0%
57.9
%42
.1%
100.
0%57
.1%
42.9
%10
0.0%
57.0
%43
.0%
100.
0%57
.0%
43.0
%10
0.0%
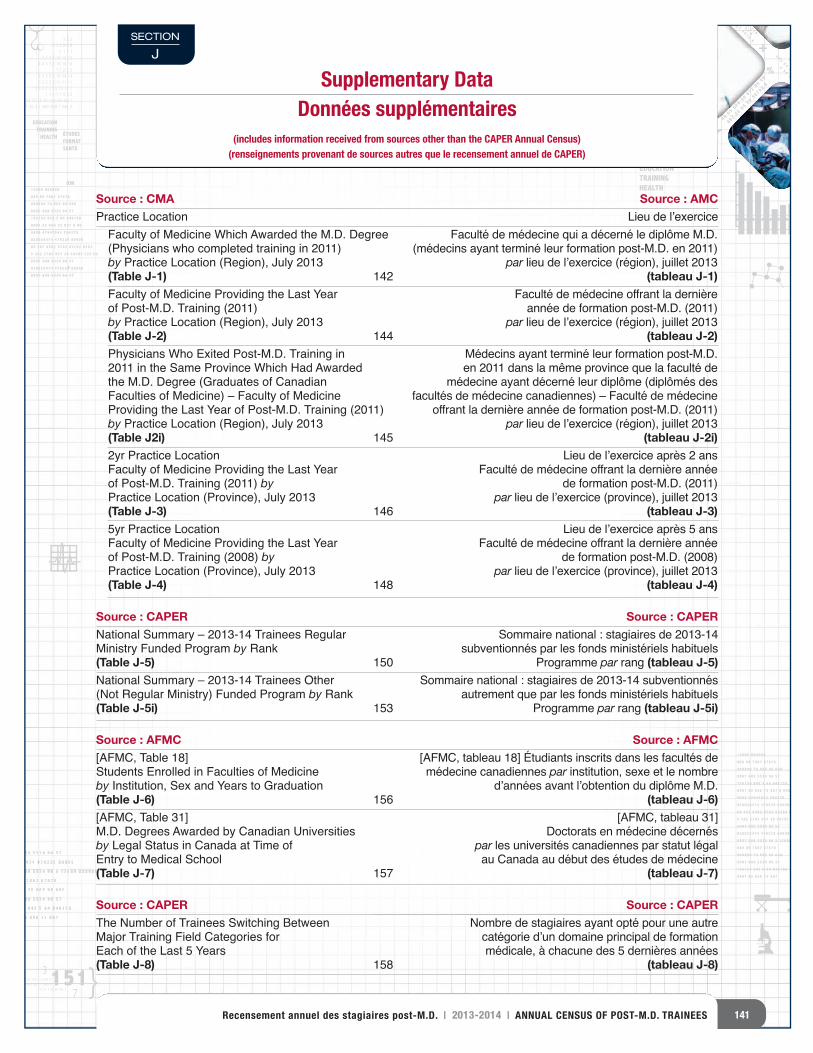
8989077 68686868689 9 5535535535534 969696 5 57
02028028402840284028474 4747479229229229 8090909009
89898989890007777 68686868689 9 9 9 5535535535534 4 4 96969696 5 5 5 12121266668989 U U U889888988898999
08089 8989 7 7 7 7867867 6 676776788
89890890890890 78 6666665 969696 680
89898989000777 68686868689 9 9 5535535535534 4 4 96969696 5 5 5777
15156154154154 845 55 64 88846156156158
898907 656565 656 7 75 8686867
45 50 261857 63 100
12689 U88989089 89 7867 67678
890890 78 665 96 6808907 689 5534 96 57
156154 845 5 64 8461588907 65 656 75 867 8 908
9809 4794Y943 Y943Y9028028474 479229 80909
89 367 9562 6782 83292 83625 382 2782 937 38 38792 723 02
4850 480 4980 890 904 60 540
3 3 32 3 3 8 8 81 1 1 13 3 3 3 12 12 124 4 3 3 2 16 16 161 1 2 2 23 3 3 3 2 14 14 142 2 2 2 3 11 11 113 3 3 2 2 13 13 12 11 1 1 1 1 5 5 513 13 12 11 11 1 61 61 60 1103 107 59 41 35 3 1 349 348 1 346 3
3 3 32 3 3 8 8 8
1 1 1 13 3 3 3 12 12 12
4 4 3 3 2 16 16 161 1 2 2 2
3 3 3 3 2 14 14 142 2 2 2 3 11 11 11
3 3 3 2 2 13 13 12 11 1 1 1 1 5 5 5
13 13 12 11 11 1 61 61 60 1103 107 59 41 35 3 1 349 348 1 346 3
2 2 13 13 12 11 1 1 1 1 5 5 5
13 13 12 11 11 1 61 61 60 1103 107 59 41 35 3 1 349 348 1 346 3
75 79 064 20 379 07 590 3 2 8
48 05 8
56 40 6
72 90 4
6
892 3
4 04 0
4 90792 6
4 8 5 8 5 8 5 4 9 3 7 0 1
4 5 0 4 5 0 1 9 7 3
EDUCATIONTRAINING
HEALTH ÉTUDESFORMAT
ION
SANTÉ
758 64 26 12
03 13 015 23
12689 U88989089 89 7867 67678
890890 78 665 96 6808907 689 5534 96 57
156154 845 5 64 8461588907 65 656 75 867 8 908
9809 4794Y943 Y943Y9028028474 479229 80909
89 367 9562 6782 83292 83625 382 2782 937 38 38792 723 02
1103 1078
%+
+ 781 5413 9
405540 466
0 1533 8
18 387
9 41 3
5 3 1
34
12689 U88989
089 89 7867 67678
890890 78 665 96 680
8907 689 5534 96 57
156154 845 5 64 846158
8907 65 656 75 867 8 90
8
9809 4794Y943 Y943Y9
028028474 479229 80909
89 367 9562 6782 83292 8362
5 382 2782 937 38 38792 723 02
8907 689 5534 96 57
028028474 479229 80909
8907 689 5534 96 57
4
{ {7
7
3
4 15103 107 59 41 35 3 1 349 303 107 59 41 35 3 1 349 3
11 11 1 61 61 60 1
1 5 2 1 5 2 1 6
4 4 5 1 5 2 8
6 4 8 2 4 6 1 2 6
12689 u88989089 89 7867 67678890890 78 665 96 6808907 689 5534 96 57156154 845 5 64 8461588907 65 656 75 867 8 9089809 4794y943 y943y9
T O
T A L
H E A L T H S A N T É
EDUCATIONÉTUDES
EDUCATIONTRAININGHEALTH
" " "" "
" "A
8
2 2 2 2 3 11 11 113 3 3 2 2 13 13 12 11 1 1 1 1 5 5 513 13 12 11 11 1 61 650 640 75 056 06 6890780 9029 068 0690667890 0 49 0463 0492
12689 U88989
089 89 7867 67678
890890 78 665 96 680
8907 689 5534 96 57
156154 845 5 64 846158
8907 65 656 75 867 8 908
9809 4794Y943 Y943Y9
028028474 479229 80909
89 367 9562 6782 83292 8362
5 382 2782 937 38 38792 723 02
8907 689 5534 96 57
028028474 479229 80909
8907 689 5534 96 5 12689 U88989
089 89 7867 67678
890890 78 665 96 680
8907 689 5534 96 57
156154 845 5 64 846158
8907 65 656 75 867
EDUCATION REGISTRY ENREGISTREMENT
D’ÉDUCATION
EDUCAT
ION REGISTRY
ENREGISTREMENT D’ÉDUCATION
Supplementary DataDonnées supplémentaires
(includes information received from sources other than the CAPER Annual Census)(renseignements provenant de sources autres que le recensement annuel de CAPER)
Source : CMAPractice LocationFaculty of Medicine Which Awarded the M.D. Degree (Physicians who completed training in 2011)by Practice Location (Region), July 2013(Table J-1) 142Faculty of Medicine Providing the Last Year of Post-M.D. Training (2011)by Practice Location (Region), July 2013(Table J-2) 144Physicians Who Exited Post-M.D. Training in 2011 in the Same Province Which Had Awarded the M.D. Degree (Graduates of Canadian Faculties of Medicine) – Faculty of Medicine Providing the Last Year of Post-M.D. Training (2011) by Practice Location (Region), July 2013(Table J2i) 1452yr Practice LocationFaculty of Medicine Providing the Last Year of Post-M.D. Training (2011) byPractice Location (Province), July 2013 (Table J-3) 1465yr Practice LocationFaculty of Medicine Providing the Last Year of Post-M.D. Training (2008) byPractice Location (Province), July 2013 (Table J-4) 148
Source : CAPERNational Summary – 2013-14 Trainees Regular Ministry Funded Program by Rank (Table J-5) 150National Summary – 2013-14 Trainees Other (Not Regular Ministry) Funded Program by Rank (Table J-5i) 153
Source : AFMC [AFMC, Table 18]Students Enrolled in Faculties of Medicine by Institution, Sex and Years to Graduation (Table J-6) 156[AFMC, Table 31]M.D. Degrees Awarded by Canadian Universities by Legal Status in Canada at Time of Entry to Medical School (Table J-7) 157
Source : CAPERThe Number of Trainees Switching Between Major Training Field Categories for Each of the Last 5 Years(Table J-8) 158
Source : AMCLieu de l’exercice
Faculté de médecine qui a décerné le diplôme M.D. (médecins ayant terminé leur formation post-M.D. en 2011)
par lieu de l’exercice (région), juillet 2013 (tableau J-1)
Faculté de médecine offrant la dernière année de formation post-M.D. (2011)
par lieu de l’exercice (région), juillet 2013 (tableau J-2)
Médecins ayant terminé leur formation post-M.D. en 2011 dans la même province que la faculté de
médecine ayant décerné leur diplôme (diplômés des facultés de médecine canadiennes) – Faculté de médecine
offrant la dernière année de formation post-M.D. (2011) par lieu de l’exercice (région), juillet 2013
(tableau J-2i)Lieu de l’exercice après 2 ans
Faculté de médecine offrant la dernière année de formation post-M.D. (2011)
par lieu de l’exercice (province), juillet 2013(tableau J-3)
Lieu de l’exercice après 5 ansFaculté de médecine offrant la dernière année
de formation post-M.D. (2008) par lieu de l’exercice (province), juillet 2013
(tableau J-4)
Source : CAPERSommaire national : stagiaires de 2013-14
subventionnés par les fonds ministériels habituelsProgramme par rang (tableau J-5)
Sommaire national : stagiaires de 2013-14 subventionnésautrement que par les fonds ministériels habituels
Programme par rang (tableau J-5i)
Source : AFMC[AFMC, tableau 18] Étudiants inscrits dans les facultés demédecine canadiennes par institution, sexe et le nombre
d’années avant l’obtention du diplôme M.D. (tableau J-6)
[AFMC, tableau 31] Doctorats en médecine décernés
par les universités canadiennes par statut légal au Canada au début des études de médecine
(tableau J-7)
Source : CAPERNombre de stagiaires ayant opté pour une autre catégorie d’un domaine principal de formation médicale, à chacune des 5 dernières années
(tableau J-8)
SECTION
J
141Recensement annuel des stagiaires post-M.D. | 2013-2014 | ANNUAL CENSUS OF POST-M.D. TRAINEES
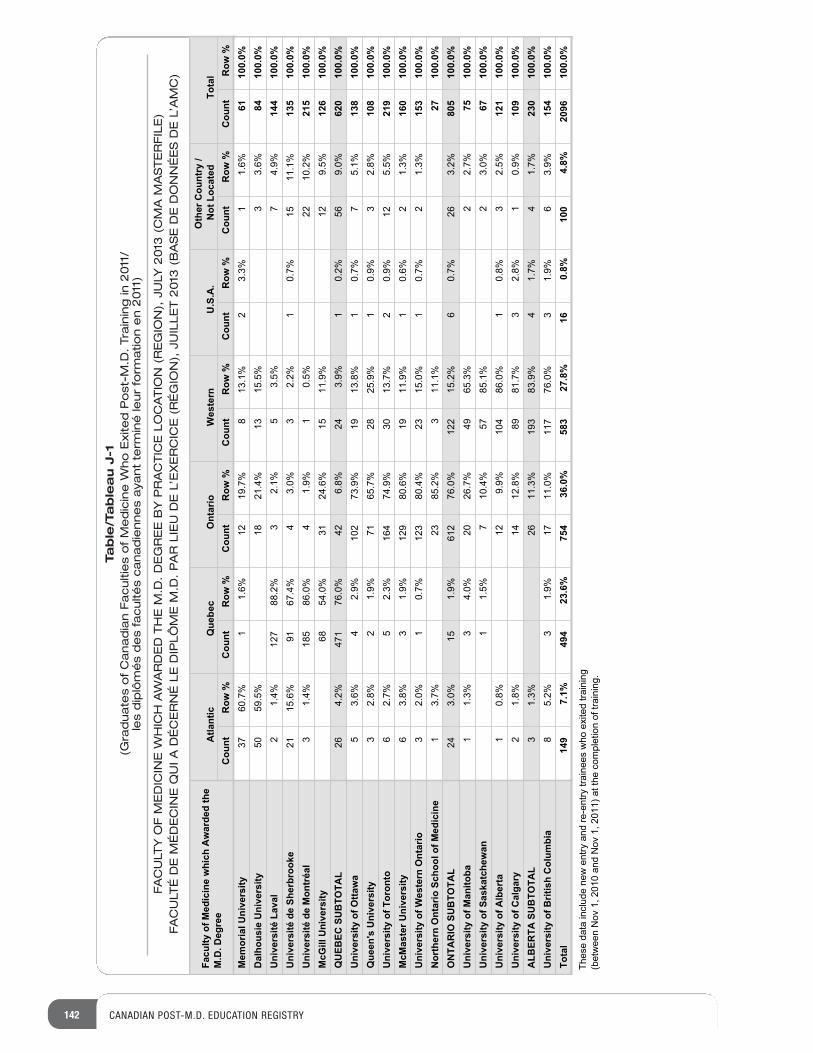
142 CANADIAN POST-M.D. EDUCATION REGISTRY
Table/Tableau J-1
(Graduates of Canadian Faculties of Medicine Who Exited Post-M.D. Training in 2011/
les diplômés des facultés canadiennes ayant terminé leur formation en 2011)
FACULTY OF MEDICINE WHICH AWARDED THE M.D. DEGREE BY PRACTICE LOCATION (REGION), JULY 2013 (CMA MASTERFILE)
FACULTÉ DE MÉDECINE QUI A DÉCERNÉ LE DIPLÔME M.D. PAR LIEU DE L’EXERCICE (RÉGION), JUILLET 2013 (BASE DE DONNÉES DE L’AMC)
Facu
lty o
f Med
icin
e w
hich
Aw
arde
d th
e M
.D. D
egre
eA
tlant
icQ
uebe
cO
ntar
ioW
este
rnU
.S.A
.O
ther
Cou
ntry
/ N
ot L
ocat
edTo
tal
Cou
ntR
ow %
Cou
ntR
ow %
Cou
ntR
ow %
Cou
ntR
ow %
Cou
ntR
ow %
Cou
ntR
ow %
Cou
ntR
ow %
Mem
oria
l Uni
vers
ityD
alho
usie
Uni
vers
ityU
nive
rsité
Lav
alU
nive
rsité
de
Sher
broo
keU
nive
rsité
de
Mon
tréa
lM
cGill
Uni
vers
ityQ
UEB
EC S
UB
TOTA
LU
nive
rsity
of O
ttaw
aQ
ueen
's U
nive
rsity
Uni
vers
ity o
f Tor
onto
McM
aste
r Uni
vers
ityU
nive
rsity
of W
este
rn O
ntar
ioN
orth
ern
Ont
ario
Sch
ool o
f Med
icin
eO
NTA
RIO
SU
BTO
TAL
Uni
vers
ity o
f Man
itoba
Uni
vers
ity o
f Sas
katc
hew
anU
nive
rsity
of A
lber
taU
nive
rsity
of C
alga
ryA
LBER
TA S
UB
TOTA
LU
nive
rsity
of B
ritis
h C
olum
bia
Tota
l
3760
.7%
11.
6%12
19.7
%8
13.1
%2
3.3%
11.
6%61
100.
0%%6.3
3%5.51
31%4.12
81%5.95
0584
100.
0%%9.4
7%5.3
5%1.2
3%2.88
721%4.1
214
410
0.0%
2115
.6%
9167
.4%
43.
0%3
2.2%
10.
7%15
11.1
%13
510
0.0%
%2.0122
%5.01
%9.14
%0.68581
%4.13
215
100.
0%%5.9
21%9.11
51%6.42
13%0.45
8612
610
0.0%
264.
2%47
176
.0%
426.
8%24
3.9%
10.
2%56
9.0%
620
100.
0%5
3.6%
42.
9%10
273
.9%
1913
.8%
10.
7%7
5.1%
138
100.
0%3
2.8%
21.
9%71
65.7
%28
25.9
%1
0.9%
32.
8%10
810
0.0%
62.
7%5
2.3%
164
74.9
%30
13.7
%2
0.9%
125.
5%21
910
0.0%
63.
8%3
1.9%
129
80.6
%19
11.9
%1
0.6%
21.
3%16
010
0.0%
32.
0%1
0.7%
123
80.4
%23
15.0
%1
0.7%
21.
3%15
310
0.0%
%1.113
%2.5832
%7.31
2710
0.0%
243.
0%15
1.9%
612
76.0
%12
215
.2%
60.
7%26
3.2%
805
100.
0%%7.2
2%3.56
94%7.62
02%0.4
3%3.1
175
100.
0%%0.3
2%1.58
75%4.01
7%5.1
167
100.
0%%5.2
3%8.0
1%0.68
401%9.9
21%8.0
112
110
0.0%
%9.01
%8.23
%7.1898
%8.2141
%8.12
109
100.
0%3
1.3%
2611
.3%
193
83.9
%4
1.7%
41.
7%23
010
0.0%
85.
2%3
1.9%
1711
.0%
117
76.0
%3
1.9%
63.
9%15
410
0.0%
149
7.1%
494
23.6
%75
436
.0%
583
27.8
%16
0.8%
100
4.8%
2096
100.
0%
Thes
e da
ta in
clud
e ne
w e
ntry
and
re-e
ntry
trai
nees
who
exi
ted
train
ing
(bet
wee
n N
ov 1
, 201
0 an
d N
ov 1
, 201
1) a
t the
com
plet
ion
of tr
aini
ng.
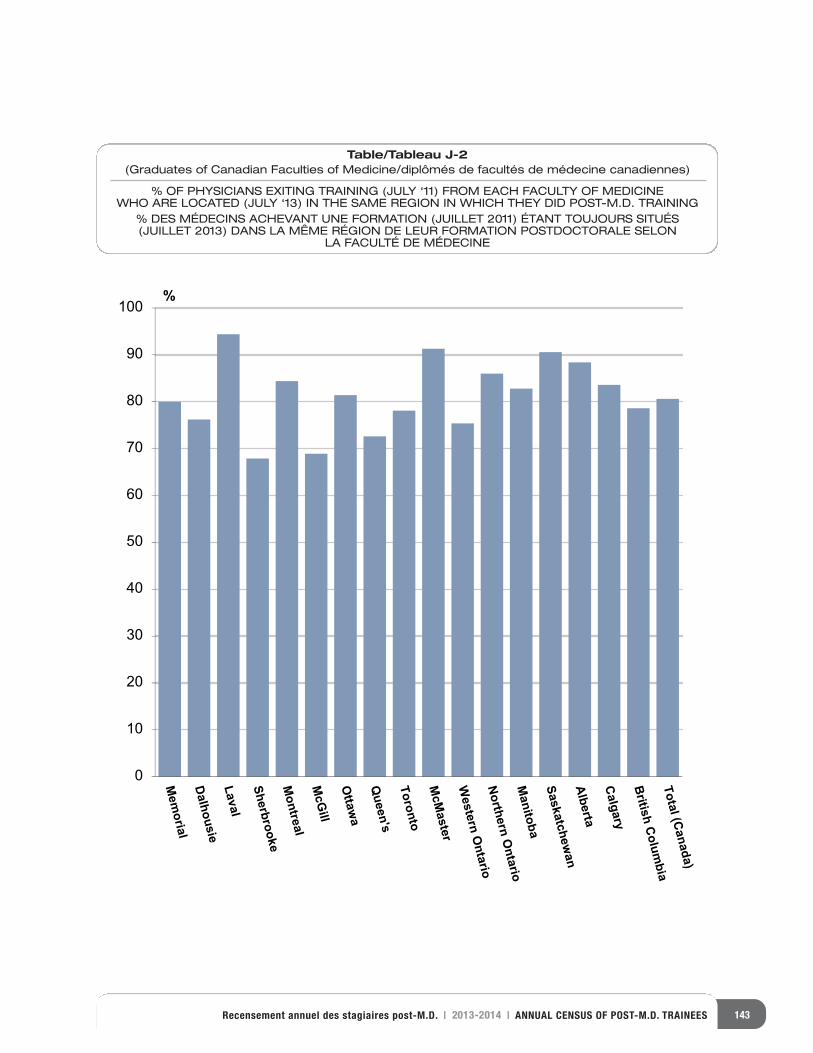
143Recensement annuel des stagiaires post-M.D. | 2013-2014 | ANNUAL CENSUS OF POST-M.D. TRAINEES
0
10
20
30
40
50
60
70
80
90
100%
Table/Tableau J-2(Graduates of Canadian Faculties of Medicine/diplômés de facultés de médecine canadiennes)
% OF PHYSICIANS EXITING TRAINING (JULY ‘11) FROM EACH FACULTY OF MEDICINEWHO ARE LOCATED (JULY ‘13) IN THE SAME REGION IN WHICH THEY DID POST-M.D. TRAINING
% DES MÉDECINS ACHEVANT UNE FORMATION (JUILLET 2011) ÉTANT TOUJOURS SITUÉS (JUILLET 2013) DANS LA MÊME RÉGION DE LEUR FORMATION POSTDOCTORALE SELON
LA FACULTÉ DE MÉDECINE
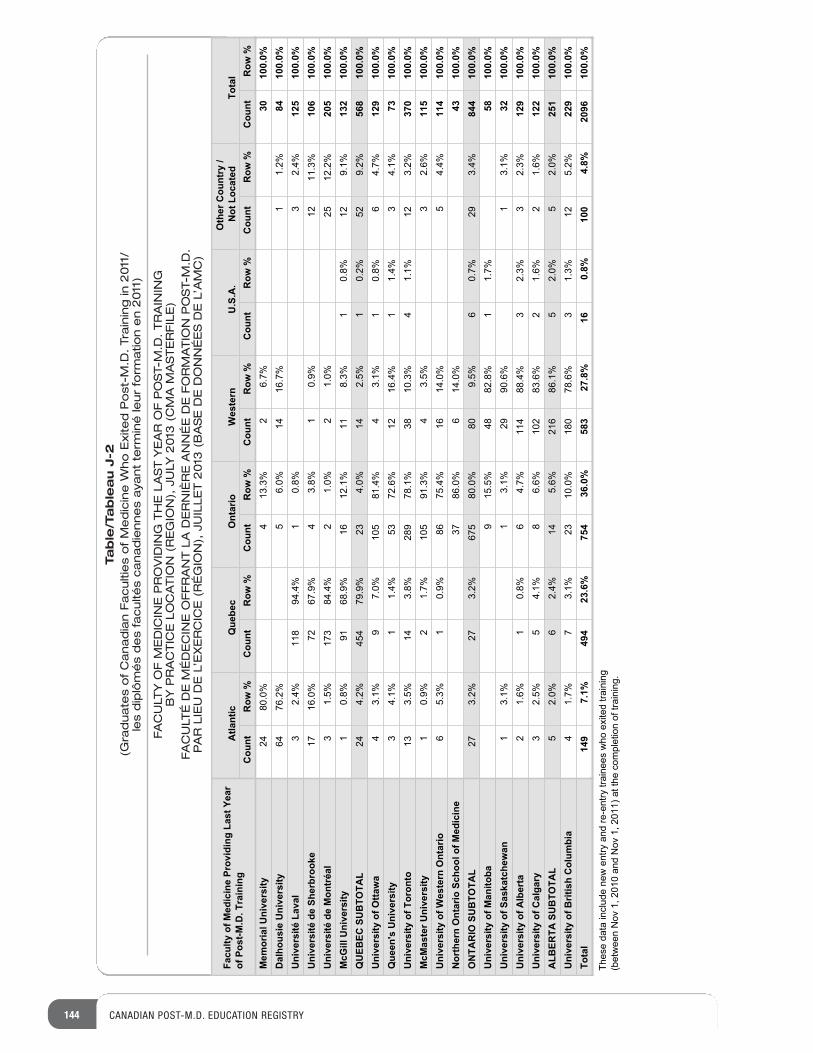
144 CANADIAN POST-M.D. EDUCATION REGISTRY
Table/Tableau J-2
(Graduates of Canadian Faculties of Medicine Who Exited Post-M.D. Training in 2011/
les diplômés des facultés canadiennes ayant terminé leur formation en 2011)
FACULTY OF MEDICINE PROVIDING THE LAST YEAR OF POST-M.D. TRAINING
BY PRACTICE LOCATION (REGION), JULY 2013 (CMA MASTERFILE)
FACULTÉ DE MÉDECINE OFFRANT LA DERNIÈRE ANNÉE DE FORMATION POST-M.D.
PAR LIEU DE L’EXERCICE (RÉGION), JUILLET 2013 (BASE DE DONNÉES DE L’AMC)
Facu
lty o
f Med
icin
e Pr
ovid
ing
Last
Yea
r of
Pos
t-M.D
. Tra
inin
gA
tlant
icQ
uebe
cO
ntar
ioW
este
rnU
.S.A
.O
ther
Cou
ntry
/ N
ot L
ocat
edTo
tal
Cou
ntR
ow %
Cou
ntR
ow %
Cou
ntR
ow %
Cou
ntR
ow %
Cou
ntR
ow %
Cou
ntR
ow %
Cou
ntR
ow %
Mem
oria
l Uni
vers
ityD
alho
usie
Uni
vers
ityU
nive
rsité
Lav
alU
nive
rsité
de
Sher
broo
keU
nive
rsité
de
Mon
tréa
lM
cGill
Uni
vers
ityQ
UEB
EC S
UB
TOTA
LU
nive
rsity
of O
ttaw
aQ
ueen
's U
nive
rsity
Uni
vers
ity o
f Tor
onto
McM
aste
r Uni
vers
ityU
nive
rsity
of W
este
rn O
ntar
ioN
orth
ern
Ont
ario
Sch
ool o
f Med
icin
eO
NTA
RIO
SU
BTO
TAL
Uni
vers
ity o
f Man
itoba
Uni
vers
ity o
f Sas
katc
hew
anU
nive
rsity
of A
lber
taU
nive
rsity
of C
alga
ryA
LBER
TA S
UB
TOTA
LU
nive
rsity
of B
ritis
h C
olum
bia
Tota
l
%7.62
%3.314
%0.0842
3010
0.0%
%2.11
%7.6141
%0.65
%2.6746
8410
0.0%
%4.23
%8.01
%4.49811
%4.23
125
100.
0%%3.11
21%9.0
1%8.3
4%9.76
27%0.61
7110
610
0.0%
%2.2152
%0.12
%0.12
%4.48371
%5.13
205
100.
0%1
0.8%
9168
.9%
1612
.1%
118.
3%1
0.8%
129.
1%13
210
0.0%
244.
2%45
479
.9%
234.
0%14
2.5%
10.
2%52
9.2%
568
100.
0%4
3.1%
97.
0%10
581
.4%
43.
1%1
0.8%
64.
7%12
910
0.0%
34.
1%1
1.4%
5372
.6%
1216
.4%
11.
4%3
4.1%
7310
0.0%
133.
5%14
3.8%
289
78.1
%38
10.3
%4
1.1%
123.
2%37
010
0.0%
%6.23
%5.34
%3.19501
%7.12
%9.01
115
100.
0%%4.4
5%0.41
61%4.57
68%9.0
1%3.5
611
410
0.0%
3786
.0%
614
.0%
4310
0.0%
273.
2%27
3.2%
675
80.0
%80
9.5%
60.
7%29
3.4%
844
100.
0%9
15.5
%48
82.8
%1
1.7%
5810
0.0%
%1.31
%6.0992
%1.31
%1.31
3210
0.0%
21.
6%1
0.8%
64.
7%11
488
.4%
32.
3%3
2.3%
129
100.
0%3
2.5%
54.
1%8
6.6%
102
83.6
%2
1.6%
21.
6%12
210
0.0%
52.
0%6
2.4%
145.
6%21
686
.1%
52.
0%5
2.0%
251
100.
0%4
1.7%
73.
1%23
10.0
%18
078
.6%
31.
3%12
5.2%
229
100.
0%14
97.
1%49
423
.6%
754
36.0
%58
327
.8%
160.
8%10
04.
8%20
9610
0.0%
Thes
e da
ta in
clud
e ne
w e
ntry
and
re-e
ntry
trai
nees
who
exi
ted
train
ing
(bet
wee
n N
ov 1
, 201
0 an
d N
ov 1
, 201
1) a
t the
com
plet
ion
of tr
aini
ng.
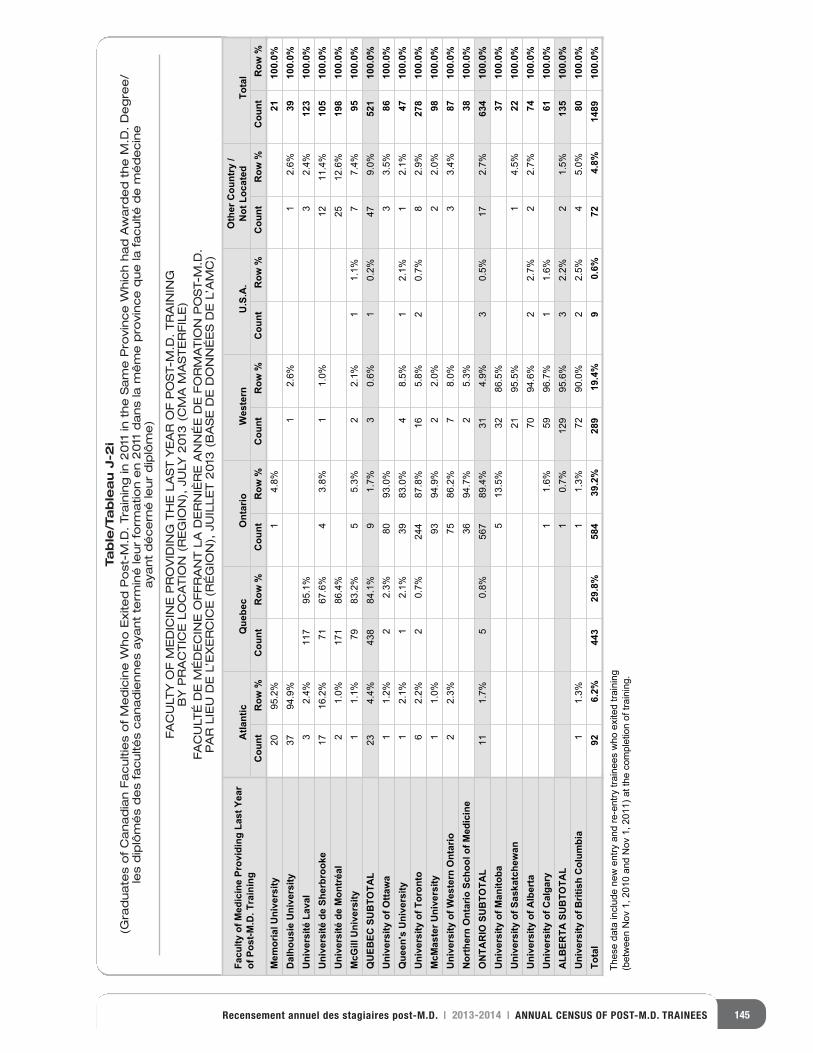
145Recensement annuel des stagiaires post-M.D. | 2013-2014 | ANNUAL CENSUS OF POST-M.D. TRAINEES
Table/Tableau J-2i
(Graduates of Canadian Faculties of Medicine Who Exited Post-M.D. Training in 2011 in the Same Province Which had Awarded the M.D. Degree/
les diplômés des facultés canadiennes ayant terminé leur formation en 2011 dans la même province que la faculté de médecine
ayant décerné leur diplôme)
FACULTY OF MEDICINE PROVIDING THE LAST YEAR OF POST-M.D. TRAINING
BY PRACTICE LOCATION (REGION), JULY 2013 (CMA MASTERFILE)
FACULTÉ DE MÉDECINE OFFRANT LA DERNIÈRE ANNÉE DE FORMATION POST-M.D.
PAR LIEU DE L’EXERCICE (RÉGION), JUILLET 2013 (BASE DE DONNÉES DE L’AMC)
Facu
lty o
f Med
icin
e Pr
ovid
ing
Last
Yea
r of
Pos
t-M.D
. Tra
inin
gA
tlant
icQ
uebe
cO
ntar
ioW
este
rnU
.S.A
.O
ther
Cou
ntry
/N
ot L
ocat
edTo
tal
Cou
ntR
ow %
Cou
ntR
ow %
Cou
ntR
ow %
Cou
ntR
ow %
Cou
ntR
ow %
Cou
ntR
ow %
Cou
ntR
ow %
Mem
oria
l Uni
vers
ityD
alho
usie
Uni
vers
ityU
nive
rsité
Lav
alU
nive
rsité
de
Sher
broo
keU
nive
rsité
de
Mon
tréa
lM
cGill
Uni
vers
ityQ
UEB
EC S
UB
TOTA
LU
nive
rsity
of O
ttaw
aQ
ueen
's U
nive
rsity
Uni
vers
ity o
f Tor
onto
McM
aste
r Uni
vers
ityU
nive
rsity
of W
este
rn O
ntar
ioN
orth
ern
Ont
ario
Sch
ool o
f Med
icin
eO
NTA
RIO
SU
BTO
TAL
Uni
vers
ity o
f Man
itoba
Uni
vers
ity o
f Sas
katc
hew
anU
nive
rsity
of A
lber
taU
nive
rsity
of C
alga
ryA
LBER
TA S
UB
TOTA
LU
nive
rsity
of B
ritis
h C
olum
bia
Tota
l
%8.41
%2.5902
2110
0.0%
%6.21
%6.21
%9.4973
3910
0.0%
32.
4%11
795
.1%
32.
4%12
310
0.0%
%4.1121
%0.11
%8.34
%6.7617
%2.6171
105
100.
0%2
1.0%
171
86.4
%25
12.6
%19
810
0.0%
11.
1%79
83.2
%5
5.3%
22.
1%1
1.1%
77.
4%95
100.
0%23
4.4%
438
84.1
%9
1.7%
30.
6%1
0.2%
479.
0%52
110
0.0%
%5.33
%0.3908
%3.22
%2.11
8610
0.0%
12.
1%1
2.1%
3983
.0%
48.
5%1
2.1%
12.
1%47
100.
0%6
2.2%
20.
7%24
487
.8%
165.
8%2
0.7%
82.
9%27
810
0.0%
%0.22
%0.22
%9.4939
%0.11
9810
0.0%
%4.33
%0.87
%2.6857
%3.22
8710
0.0%
3694
.7%
25.
3%38
100.
0%11
1.7%
50.
8%56
789
.4%
314.
9%3
0.5%
172.
7%63
410
0.0%
513
.5%
3286
.5%
3710
0.0%
%5.41
%5.5912
2210
0.0%
7094
.6%
22.
7%2
2.7%
7410
0.0%
11.
6%59
96.7
%1
1.6%
6110
0.0%
10.
7%12
995
.6%
32.
2%2
1.5%
135
100.
0%%0.5
4%5.2
2%0.09
27%3.1
1%3.1
180
100.
0%92
6.2%
443
29.8
%58
439
.2%
289
19.4
%9
0.6%
724.
8%14
8910
0.0%
Thes
e da
ta in
clud
e ne
w e
ntry
and
re-e
ntry
trai
nees
who
exi
ted
train
ing
(bet
wee
n N
ov 1
, 201
0 an
d N
ov 1
, 201
1) a
t the
com
plet
ion
of tr
aini
ng.
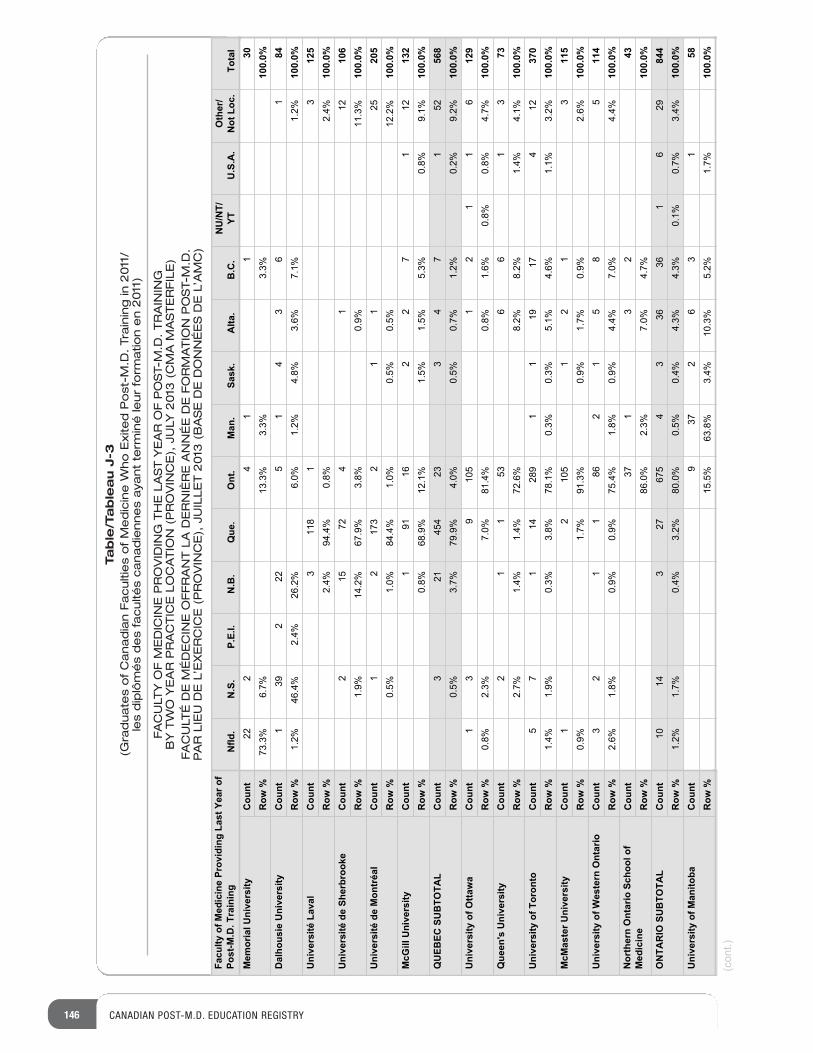
146 CANADIAN POST-M.D. EDUCATION REGISTRY
Table/Tableau J-3
(Graduates of Canadian Faculties of Medicine Who Exited Post-M.D. Training in 2011/
les diplômés des facultés canadiennes ayant terminé leur formation en 2011)
FACULTY OF MEDICINE PROVIDING THE LAST YEAR OF POST-M.D. TRAINING
BY TWO YEAR PRACTICE LOCATION (PROVINCE), JULY 2013 (CMA MASTERFILE)
FACULTÉ DE MÉDECINE OFFRANT LA DERNIÈRE ANNÉE DE FORMATION POST-M.D.
PAR LIEU DE L’EXERCICE (PROVINCE), JUILLET 2013 (BASE DE DONNÉES DE L’AMC)
Facu
lty o
f Med
icin
e Pr
ovid
ing
Last
Yea
r of
Post
-M.D
. Tra
inin
gN
fld.
N.S
.P.
E.I.
N.B
.Q
ue.
Ont
.M
an.
Sask
.A
lta.
B.C
.N
U/N
T/YT
U.S
.A.
Oth
er/
Not
Loc
.To
tal
Mem
oria
l Uni
vers
ityC
ount
Row
%D
alho
usie
Uni
vers
ityC
ount
Row
%U
nive
rsité
Lav
alC
ount
Row
%U
nive
rsité
de
Sher
broo
keC
ount
Row
%U
nive
rsité
de
Mon
tréa
lC
ount
Row
%M
cGill
Uni
vers
ityC
ount
Row
%Q
UEB
EC S
UB
TOTA
LC
ount
Row
%U
nive
rsity
of O
ttaw
aC
ount
Row
%Q
ueen
's U
nive
rsity
Cou
ntR
ow %
Uni
vers
ity o
f Tor
onto
Cou
ntR
ow %
McM
aste
r Uni
vers
ityC
ount
Row
%U
nive
rsity
of W
este
rn O
ntar
ioC
ount
Row
%N
orth
ern
Ont
ario
Sch
ool o
f M
edic
ine
Cou
ntR
ow %
ON
TAR
IO S
UB
TOTA
LC
ount
Row
%U
nive
rsity
of M
anito
baC
ount
Row
%
11
42
2230
%3.3%3.3
%3.31%7.6
%3.3710
0.0%
16
34
15
222
931
84%2.1
%1.7%6.3
%8.4%2.1
%0.6%2.62
%4.2%4.64
%2.110
0.0%
3118
13
125
2.4%
94.4%
0.8%
2.4%
100.
0%21
14
2751
210
6%3.11
%9.0%8.3
%9.76%2.41
%9.110
0.0%
521
12
3712
120
5%2.21
%5.0%5.0
%0.1%4.48
%0.1%5.0
100.
0%21
17
22
6119
113
20.8%
68.9%
12.1%
1.5%
1.5%
5.3%
0.8%
9.1%
100.
0%3
21454
233
47
152
568
0.5%
3.7%
79.9%
4.0%
0.5%
0.7%
1.2%
0.2%
9.2%
100.
0%6
11
21
5019
31
129
%7.4%8.0
%8.0%6.1
%8.0%4.18
%0.7%3.2
%8.010
0.0%
31
66
351
12
73%1.4
%4.1%2.8
%2.8%6.27
%4.1%4.1
%7.210
0.0%
214
7191
11
98241
17
537
01.4%
1.9%
0.3%
3.8%
78.1%
0.3%
0.3%
5.1%
4.6%
1.1%
3.2%
100.
0%3
12
1501
21
115
%6.2%9.0
%7.1%9.0
%3.19%7.1
%9.010
0.0%
58
51
268
11
23
114
%4.4%0.7
%4.4%9.0
%8.1%4.57
%9.0%9.0
%8.1%6.2
100.
0%2
31
7343
86.0%
2.3%
7.0%
4.7%
100.
0%10
143
27675
43
3636
16
2984
41.2%
1.7%
0.4%
3.2%
80.0%
0.5%
0.4%
4.3%
4.3%
0.1%
0.7%
3.4%
100.
0%1
36
273
958
15.5%
63.8%
3.4%
10.3%
5.2%
1.7%
100.
0%
(cont.)
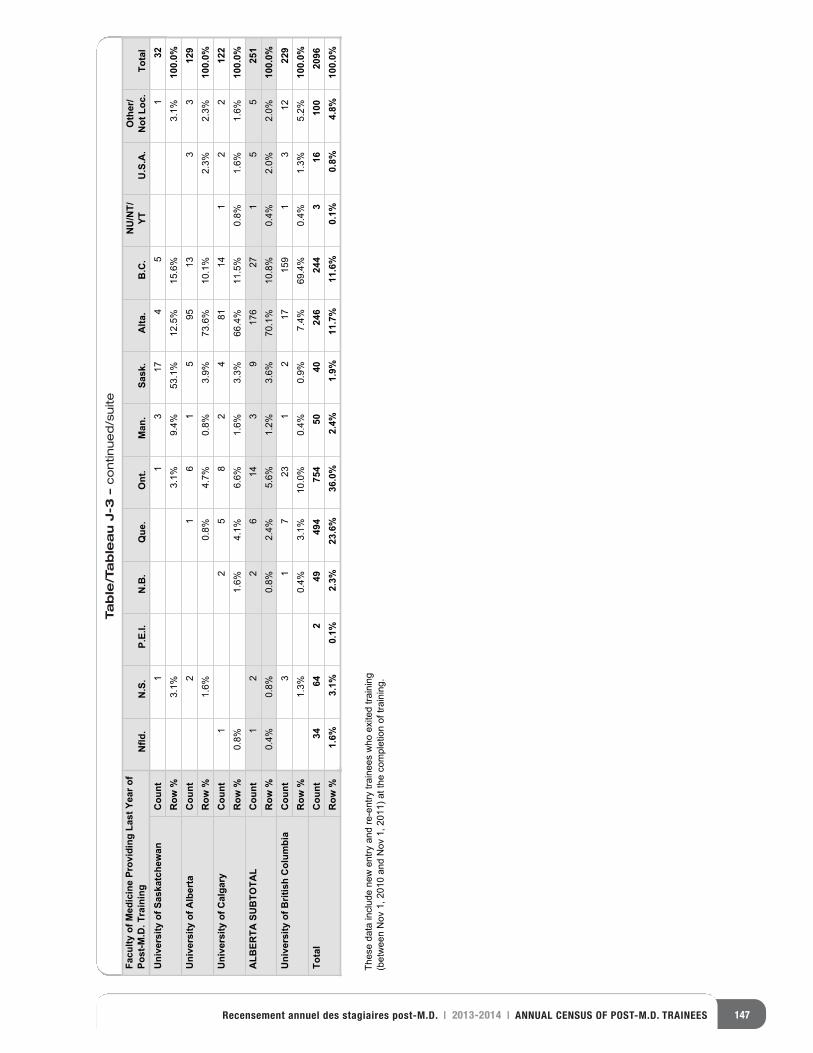
147Recensement annuel des stagiaires post-M.D. | 2013-2014 | ANNUAL CENSUS OF POST-M.D. TRAINEES
Table/Tableau J-3 –continued/suite
Facu
lty o
f Med
icin
e Pr
ovid
ing
Last
Yea
r of
Post
-M.D
. Tra
inin
gN
fld.
N.S
.P.
E.I.
N.B
.Q
ue.
Ont
.M
an.
Sask
.A
lta.
B.C
.N
U/N
T/YT
U.S
.A.
Oth
er/
Not
Loc
.To
tal
Uni
vers
ity o
f Sas
katc
hew
anC
ount
Row
%U
nive
rsity
of A
lber
taC
ount
Row
%U
nive
rsity
of C
alga
ryC
ount
Row
%A
LBER
TA S
UB
TOTA
LC
ount
Row
%U
nive
rsity
of B
ritis
h C
olum
bia
Cou
ntR
ow %
Tota
lC
ount
Row
%
15
471
31
132
%1.3%6.51
%5.21%1.35
%4.9%1.3
%1.310
0.0%
33
3159
51
61
212
9%3.2
%3.2%1.01
%6.37%9.3
%8.0%7.4
%8.0%6.1
100.
0%2
21
4118
42
85
21
122
%6.1%6.1
%8.0%5.11
%4.66%3.3
%6.1%6.6
%1.4%6.1
%8.010
0.0%
12
26
143
917
627
15
525
10.
4%0.
8%0.
8%2.
4%5.
6%1.
2%3.
6%70
.1%
10.8
%0.
4%2.
0%2.
0%10
0.0%
213
1951
712
132
71
322
91.
3%0.
4%3.
1%10
.0%
0.4%
0.9%
7.4%
69.4
%0.
4%1.
3%5.
2%10
0.0%
3464
249
494
754
5040
246
244
316
100
2096
1.6%
3.1%
0.1%
2.3%
23.6
%36
.0%
2.4%
1.9%
11.7
%11
.6%
0.1%
0.8%
4.8%
100.
0%
Thes
e da
ta in
clud
e ne
w e
ntry
and
re-e
ntry
trai
nees
who
exi
ted
train
ing
(bet
wee
n N
ov 1
, 201
0 an
d N
ov 1
, 201
1) a
t the
com
plet
ion
of tr
aini
ng.
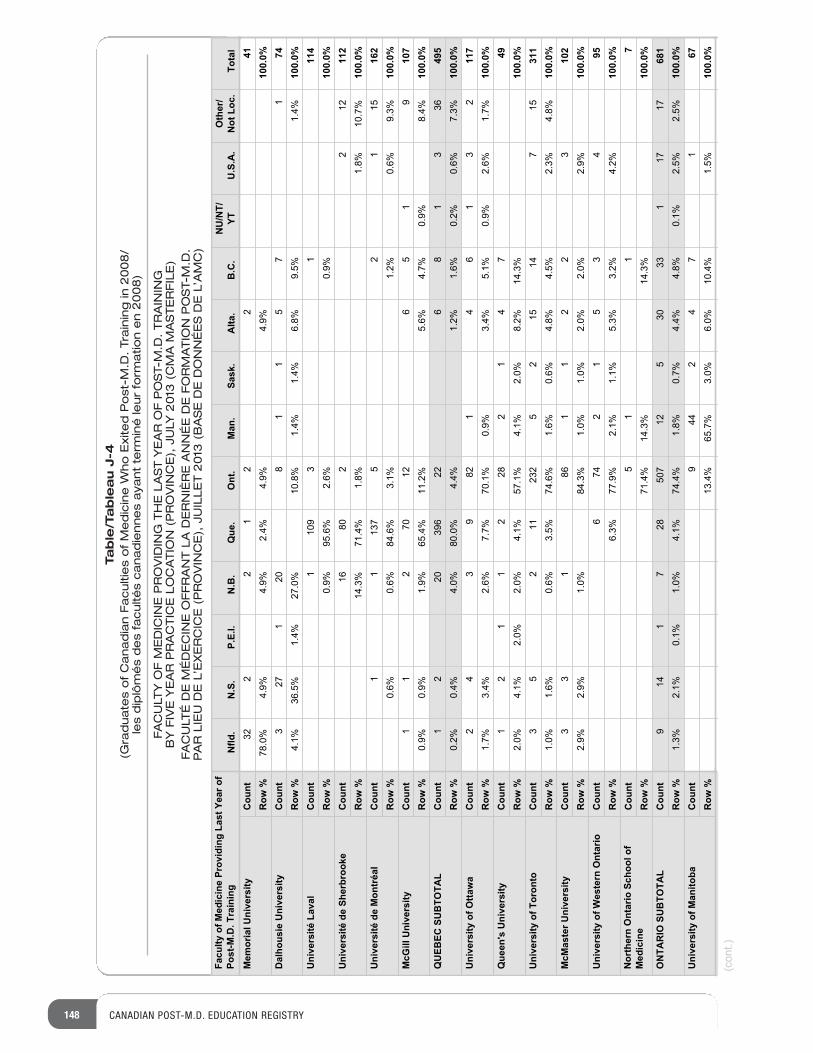
148 CANADIAN POST-M.D. EDUCATION REGISTRY
Table/Tableau J-4
(Graduates of Canadian Faculties of Medicine Who Exited Post-M.D. Training in 2008/
les diplômés des facultés canadiennes ayant terminé leur formation en 2008)
FACULTY OF MEDICINE PROVIDING THE LAST YEAR OF POST-M.D. TRAINING
BY FIVE YEAR PRACTICE LOCATION (PROVINCE), JULY 2013 (CMA MASTERFILE)
FACULTÉ DE MÉDECINE OFFRANT LA DERNIÈRE ANNÉE DE FORMATION POST-M.D.
PAR LIEU DE L’EXERCICE (PROVINCE), JUILLET 2013 (BASE DE DONNÉES DE L’AMC)
Facu
lty o
f Med
icin
e Pr
ovid
ing
Last
Yea
r of
Post
-M.D
. Tra
inin
gN
fld.
N.S
.P.
E.I.
N.B
.Q
ue.
Ont
.M
an.
Sask
.A
lta.
B.C
.N
U/N
T/YT
U.S
.A.
Oth
er/
Not
Loc
.To
tal
Mem
oria
l Uni
vers
ityC
ount
Row
%D
alho
usie
Uni
vers
ityC
ount
Row
%U
nive
rsité
Lav
alC
ount
Row
%U
nive
rsité
de
Sher
broo
keC
ount
Row
%U
nive
rsité
de
Mon
tréa
lC
ount
Row
%M
cGill
Uni
vers
ityC
ount
Row
%Q
UEB
EC S
UB
TOTA
LC
ount
Row
%U
nive
rsity
of O
ttaw
aC
ount
Row
%Q
ueen
's U
nive
rsity
Cou
ntR
ow %
Uni
vers
ity o
f Tor
onto
Cou
ntR
ow %
McM
aste
r Uni
vers
ityC
ount
Row
%U
nive
rsity
of W
este
rn O
ntar
ioC
ount
Row
%N
orth
ern
Ont
ario
Sch
ool o
f M
edic
ine
Cou
ntR
ow %
ON
TAR
IO S
UB
TOTA
LC
ount
Row
%U
nive
rsity
of M
anito
baC
ount
Row
%
22
12
223
41%9.4
%9.4%4.2
%9.4%9.4
%0.8710
0.0%
17
51
18
021
723
74%4.1
%5.9%8.6
%4.1%4.1
%8.01%0.72
%4.1%5.63
%1.410
0.0%
13
9011
114
%9.0%6.2
%6.59%9.0
100.
0%16
802
212
112
%7.01%8.1
%8.1%4.17
%3.4110
0.0%
511
25
7311
116
2%3.9
%6.0%2.1
%1.3%6.48
%6.0%6.0
100.
0%9
15
621
072
11
107
%4.8%9.0
%7.4%6.5
%2.11%4.56
%9.1%9.0
%9.010
0.0%
12
20396
226
81
336
495
0.2%
0.4%
4.0%
80.0%
4.4%
1.2%
1.6%
0.2%
0.6%
7.3%
100.
0%2
31
64
128
93
42
117
1.7%
3.4%
2.6%
7.7%
70.1%
0.9%
3.4%
5.1%
0.9%
2.6%
1.7%
100.
0%1
21
12
282
14
749
2.0%
4.1%
2.0%
2.0%
4.1%
57.1%
4.1%
2.0%
8.2%
14.3%
100.
0%51
741
512
5232
112
53
311
1.0%
1.6%
0.6%
3.5%
74.6%
1.6%
0.6%
4.8%
4.5%
2.3%
4.8%
100.
0%3
22
11
681
33
102
2.9%
2.9%
1.0%
84.3%
1.0%
1.0%
2.0%
2.0%
2.9%
100.
0%4
35
12
476
956.3%
77.9%
2.1%
1.1%
5.3%
3.2%
4.2%
100.
0%1
15
7%3.41
%3.41%4.17
100.
0%9
141
728
507
125
3033
117
1768
11.3%
2.1%
0.1%
1.0%
4.1%
74.4%
1.8%
0.7%
4.4%
4.8%
0.1%
2.5%
2.5%
100.
0%1
74
244
967
13.4%
65.7%
3.0%
6.0%
10.4%
1.5%
100.
0%
(cont.)
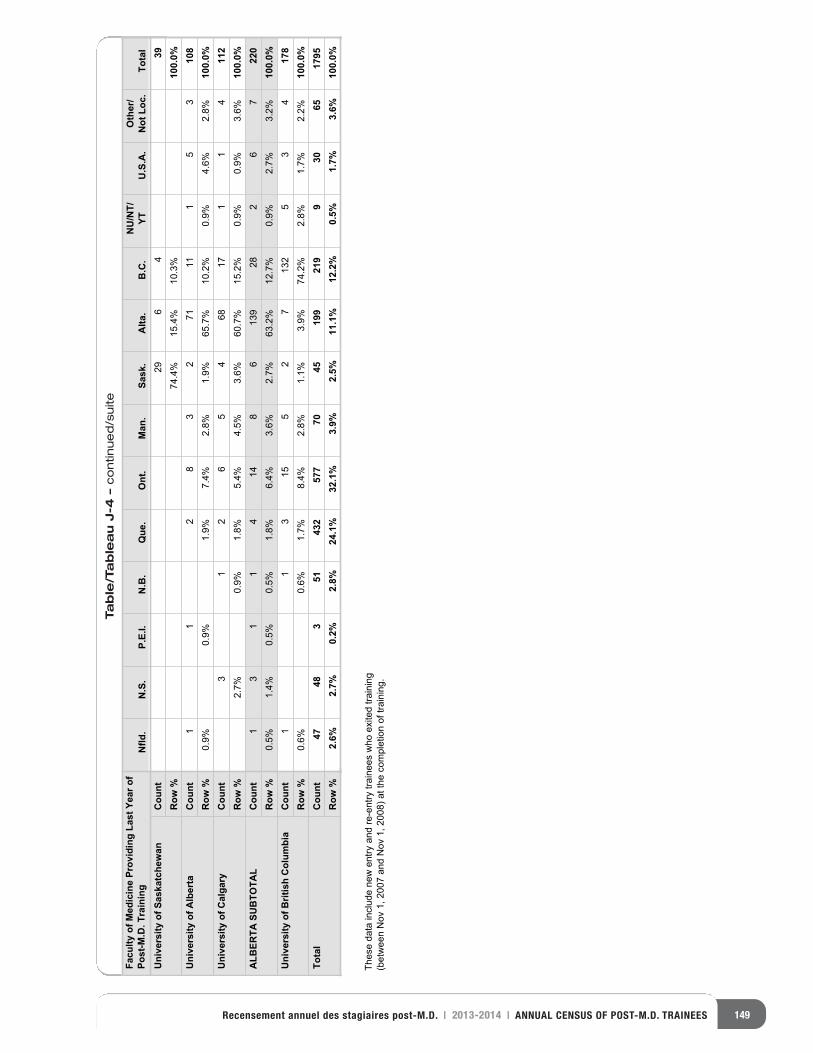
149Recensement annuel des stagiaires post-M.D. | 2013-2014 | ANNUAL CENSUS OF POST-M.D. TRAINEES
Table/Tableau J-4 –continued/suite
Facu
lty o
f Med
icin
e Pr
ovid
ing
Last
Yea
r of
Post
-M.D
. Tra
inin
gN
fld.
N.S
.P.
E.I.
N.B
.Q
ue.
Ont
.M
an.
Sask
.A
lta.
B.C
.N
U/N
T/YT
U.S
.A.
Oth
er/
Not
Loc
.To
tal
Uni
vers
ity o
f Sas
katc
hew
anC
ount
Row
%U
nive
rsity
of A
lber
taC
ount
Row
%U
nive
rsity
of C
alga
ryC
ount
Row
%A
LBER
TA S
UB
TOTA
LC
ount
Row
%U
nive
rsity
of B
ritis
h C
olum
bia
Cou
ntR
ow %
Tota
lC
ount
Row
%
296
439
74.4
%15
.4%
10.3
%10
0.0%
35
111
172
38
21
110
80.
9%0.
9%1.
9%7.
4%2.
8%1.
9%65
.7%
10.2
%0.
9%4.
6%2.
8%10
0.0%
41
171
864
56
21
311
22.
7%0.
9%1.
8%5.
4%4.
5%3.
6%60
.7%
15.2
%0.
9%0.
9%3.
6%10
0.0%
13
11
414
86
139
282
67
220
0.5%
1.4%
0.5%
0.5%
1.8%
6.4%
3.6%
2.7%
63.2
%12
.7%
0.9%
2.7%
3.2%
100.
0%4
35
2317
25
513
11
178
%2.2%7.1
%8.2%2.47
%9.3%1.1
%8.2%4.8
%7.1%6.0
%6.010
0.0%
4748
351
432
577
7045
199
219
930
6517
952.
6%2.
7%0.
2%2.
8%24
.1%
32.1
%3.
9%2.
5%11
.1%
12.2
%0.
5%1.
7%3.
6%10
0.0%
Thes
e da
ta in
clud
e ne
w e
ntry
and
re-e
ntry
trai
nees
who
exi
ted
train
ing
(bet
wee
n N
ov 1
, 200
7 an
d N
ov 1
, 200
8) a
t the
com
plet
ion
of tr
aini
ng.
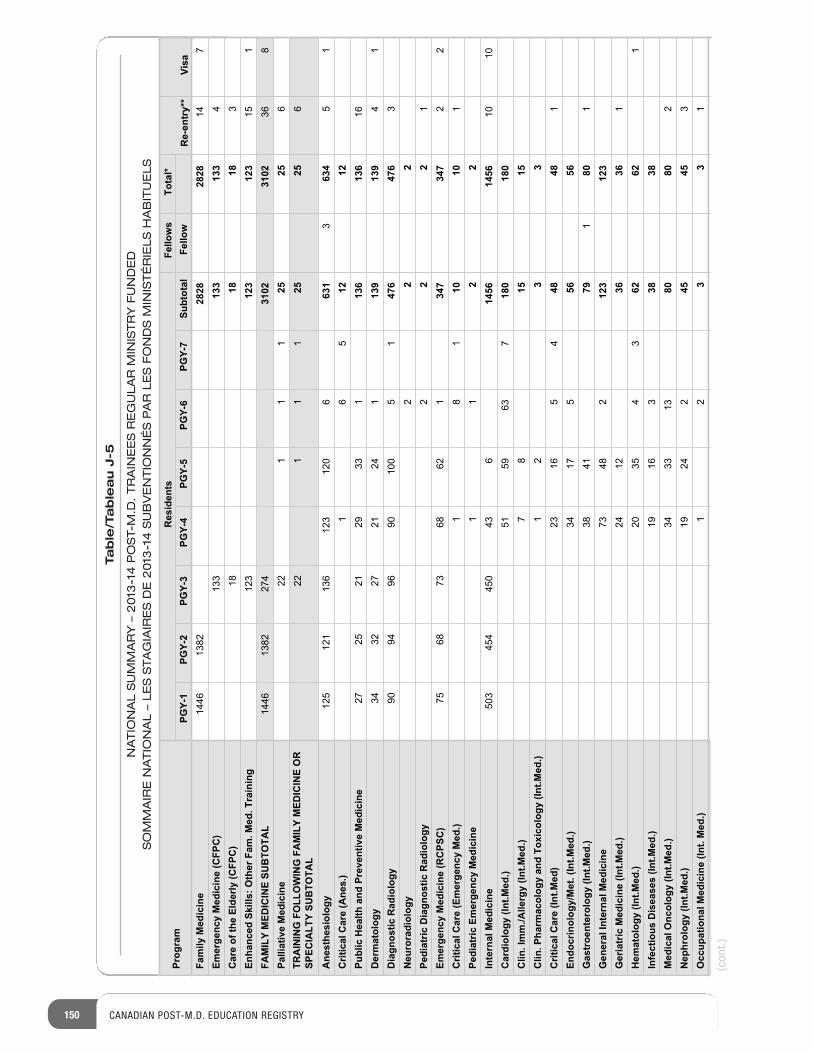
150 CANADIAN POST-M.D. EDUCATION REGISTRY
Table/Tableau J-5
NATIONAL SUMMARY –2013-14 POST-M.D. TRAINEES REGULAR MINISTRY FUNDED
SOMMAIRE NATIONAL –LES STAGIAIRES DE 2013-14 SUBVENTIONNÉS PAR LES FONDS MINISTÉRIELS HABITUELS
Prog
ram
Res
iden
tsFe
llow
sTo
tal*
Re-
entr
y**
Visa
PGY-
1PG
Y-2
PGY-
3PG
Y-4
PGY-
5PG
Y-6
PGY-
7Su
btot
alFe
llow
Fam
ily M
edic
ine
Emer
genc
y M
edic
ine
(CFP
C)
Car
e of
the
Elde
rly (C
FPC
)En
hanc
ed S
kills
: Oth
er F
am. M
ed. T
rain
ing
FAM
ILY
MED
ICIN
E SU
BTO
TAL
Palli
ativ
e M
edic
ine
TRA
ININ
G F
OLL
OW
ING
FA
MIL
Y M
EDIC
INE
OR
SP
ECIA
LTY
SUB
TOTA
L
Ane
sthe
siol
ogy
Crit
ical
Car
e (A
nes.
)Pu
blic
Hea
lth a
nd P
reve
ntiv
e M
edic
ine
Der
mat
olog
yD
iagn
ostic
Rad
iolo
gyN
euro
radi
olog
yPe
diat
ric D
iagn
ostic
Rad
iolo
gyEm
erge
ncy
Med
icin
e (R
CPS
C)
Crit
ical
Car
e (E
mer
genc
y M
ed.)
Pedi
atric
Em
erge
ncy
Med
icin
eIn
tern
al M
edic
ine
Car
diol
ogy
(Int.M
ed.)
Clin
. Im
m./A
llerg
y (In
t.Med
.)C
lin. P
harm
acol
ogy
and
Toxi
colo
gy (I
nt.M
ed.)
Crit
ical
Car
e (In
t.Med
)En
docr
inol
ogy/
Met
. (In
t.Med
.)G
astr
oent
erol
ogy
(Int.M
ed.)
Gen
eral
Inte
rnal
Med
icin
eG
eria
tric
Med
icin
e (In
t.Med
.)H
emat
olog
y (In
t.Med
.)In
fect
ious
Dis
ease
s (In
t.Med
.)M
edic
al O
ncol
ogy
(Int.M
ed.)
Nep
hrol
ogy
(Int.M
ed.)
Occ
upat
iona
l Med
icin
e (In
t. M
ed.)
1446
1382
2828
2828
147
133
133
133
418
1818
3
123
123
123
151
1446
1382
274
3102
3102
368
11
122
2525
6
221
11
2525
6
125
121
136
123
120
663
13
634
51
56
112
1227
2521
2933
113
613
616
3432
2721
241
139
139
41
9094
9690
100
51
476
476
3
22
22
22
1
7568
7368
621
347
347
22
18
110
101
11
22
503
454
450
436
1456
1456
1010
5159
637
180
180
78
1515
12
33
2316
54
4848
1
3417
556
5638
4179
180
1
7348
212
312
324
1236
361
2035
43
6262
1
1916
338
3834
3313
8080
2
1924
245
453
21
33
1
(cont.)
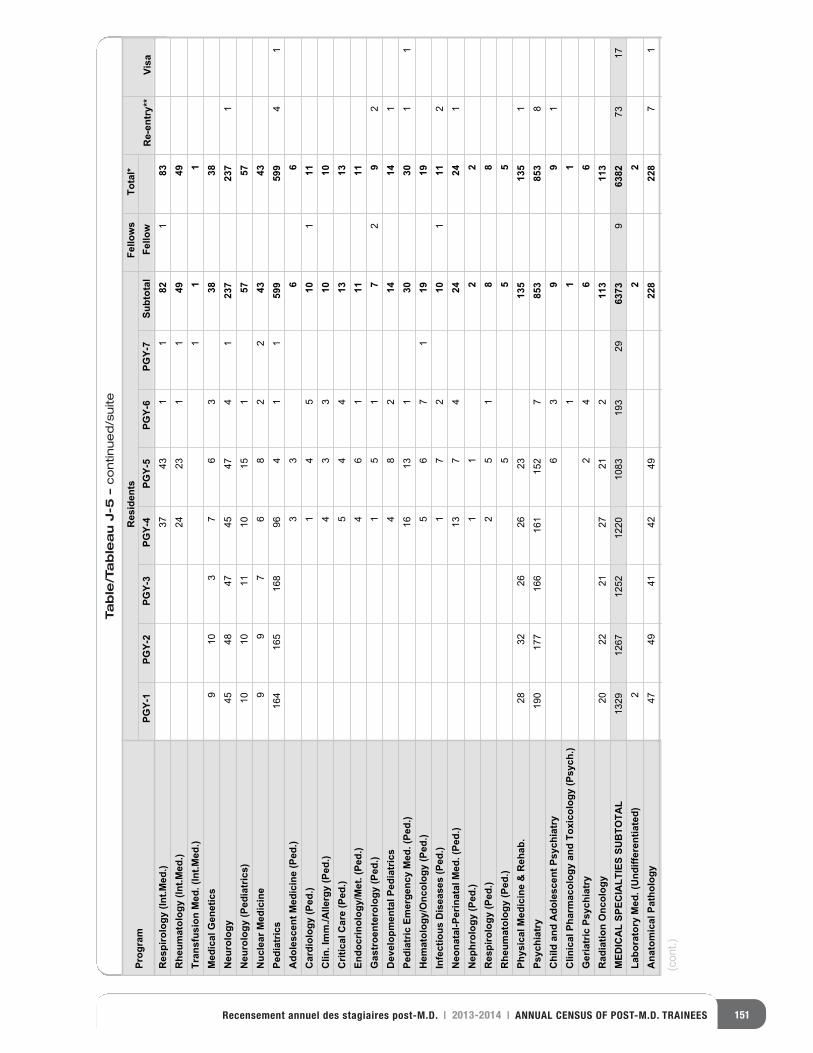
151Recensement annuel des stagiaires post-M.D. | 2013-2014 | ANNUAL CENSUS OF POST-M.D. TRAINEES
Table/Tableau J-5 –continued/suite
Prog
ram
Res
iden
tsFe
llow
sTo
tal*
Re-
entr
y**
Visa
PGY-
1PG
Y-2
PGY-
3PG
Y-4
PGY-
5PG
Y-6
PGY-
7Su
btot
alFe
llow
Res
piro
logy
(Int
.Med
.)R
heum
atol
ogy
(Int.M
ed.)
Tran
sfus
ion
Med
. (In
t.Med
.)M
edic
al G
enet
ics
Neu
rolo
gyN
euro
logy
(Ped
iatr
ics)
Nuc
lear
Med
icin
ePe
diat
rics
Ado
lesc
ent M
edic
ine
(Ped
.)C
ardi
olog
y (P
ed.)
Clin
. Im
m./A
llerg
y (P
ed.)
Crit
ical
Car
e (P
ed.)
Endo
crin
olog
y/M
et. (
Ped.
)G
astr
oent
erol
ogy
(Ped
.)D
evel
opm
enta
l Ped
iatr
ics
Pedi
atric
Em
erge
ncy
Med
. (Pe
d.)
Hem
atol
ogy/
Onc
olog
y (P
ed.)
Infe
ctio
us D
isea
ses
(Ped
.)N
eona
tal-P
erin
atal
Med
. (Pe
d.)
Nep
hrol
ogy
(Ped
.)R
espi
rolo
gy (P
ed.)
Rhe
umat
olog
y (P
ed.)
Phys
ical
Med
icin
e &
Reh
ab.
Psyc
hiat
ryC
hild
and
Ado
lesc
ent P
sych
iatr
yC
linic
al P
harm
acol
ogy
and
Toxi
colo
gy (P
sych
.)G
eria
tric
Psy
chia
try
Rad
iatio
n O
ncol
ogy
MED
ICA
L SP
ECIA
LTIE
S SU
BTO
TAL
Labo
rato
ry M
ed. (
Und
iffer
entia
ted)
Ana
tom
ical
Pat
holo
gy
3743
11
821
8324
231
149
491
11
910
37
63
3838
4548
4745
474
123
723
71
1010
1110
151
5757
99
76
82
243
43164
165
168
964
11
599
599
41
33
66
14
510
111
43
310
105
44
1313
46
111
111
51
72
92
48
214
141
1613
130
301
1
56
71
1919
17
210
111
2
137
424
241
11
22
25
18
85
55
2832
2626
2313
513
51
190
177
166
161
152
785
385
38
63
99
1
11
12
46
620
2221
2721
211
311
31329
1267
1252
1220
1083
193
2963
739
6382
7317
22
247
4941
4249
228
228
71
(cont.)
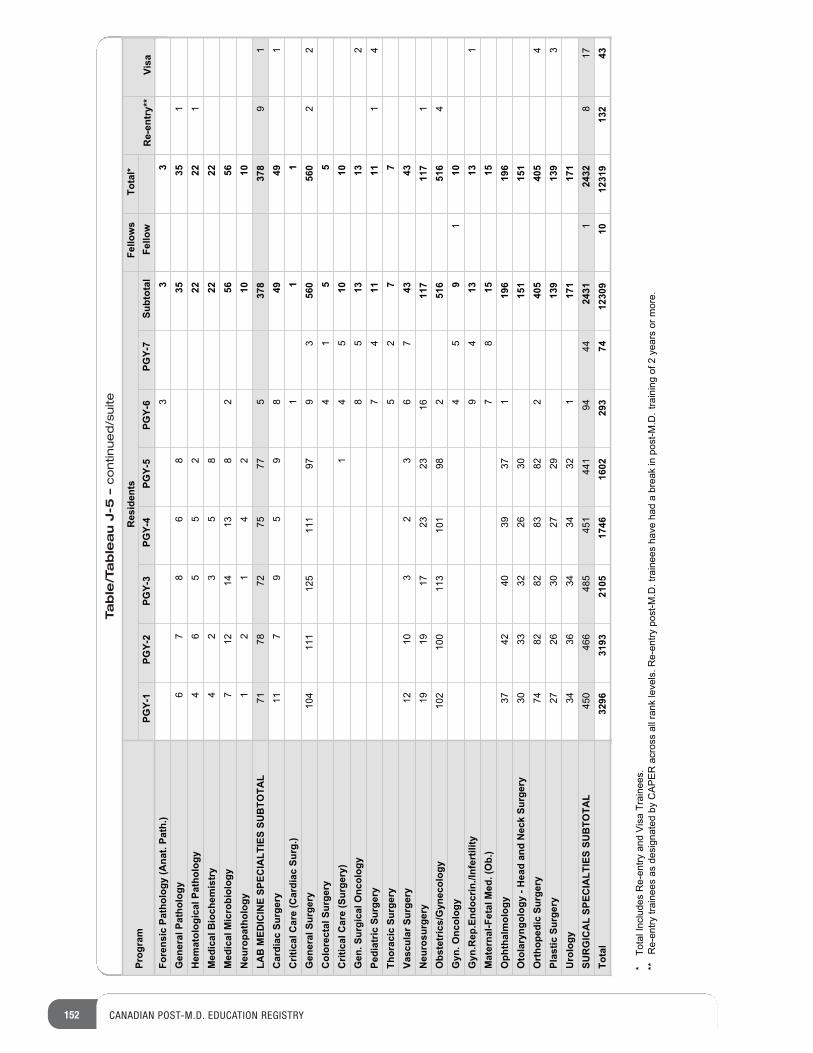
152 CANADIAN POST-M.D. EDUCATION REGISTRY
Table/Tableau J-5 –continued/suite
Prog
ram
Res
iden
tsFe
llow
sTo
tal*
Re-
entr
y**
Visa
PGY-
1PG
Y-2
PGY-
3PG
Y-4
PGY-
5PG
Y-6
PGY-
7Su
btot
alFe
llow
Fore
nsic
Pat
holo
gy (A
nat.
Path
.)G
ener
al P
atho
logy
Hem
atol
ogic
al P
atho
logy
Med
ical
Bio
chem
istr
yM
edic
al M
icro
biol
ogy
Neu
ropa
thol
ogy
LAB
MED
ICIN
E SP
ECIA
LTIE
S SU
BTO
TAL
Car
diac
Sur
gery
Crit
ical
Car
e (C
ardi
ac S
urg.
)G
ener
al S
urge
ryC
olor
ecta
l Sur
gery
Crit
ical
Car
e (S
urge
ry)
Gen
. Sur
gica
l Onc
olog
yPe
diat
ric S
urge
ryTh
orac
ic S
urge
ryVa
scul
ar S
urge
ryN
euro
surg
ery
Obs
tetr
ics/
Gyn
ecol
ogy
Gyn
. Onc
olog
yG
yn.R
ep.E
ndoc
rin./I
nfer
tility
Mat
erna
l-Fet
al M
ed. (
Ob.
)O
phth
alm
olog
yO
tola
ryng
olog
y - H
ead
and
Nec
k Su
rger
yO
rtho
pedi
c Su
rger
yPl
astic
Sur
gery
Uro
logy
SUR
GIC
AL
SPEC
IALT
IES
SUB
TOTA
LTo
tal
33
36
78
68
3535
14
65
52
2222
1
42
35
822
227
1214
138
256
561
21
42
1010
7178
7275
775
378
378
91
117
95
98
4949
1
11
110
411
112
511
197
93
560
560
22
41
55
14
510
108
513
132
74
1111
14
52
77
1210
32
36
743
4319
1917
2323
1611
711
71
102
100
113
101
982
516
516
4
45
91
109
413
131
78
1515
3742
4039
371
196
196
3033
3226
3015
115
174
8282
8382
240
540
54
2726
3027
2913
913
93
3436
3434
321
171
171
450
466
485
451
441
9444
2431
124
328
1732
9631
9321
0517
4616
0229
374
1230
910
1231
913
243
*
Tota
l Inc
lude
s R
e-en
try a
nd V
isa
Trai
nees
.**
R
e-en
try tr
aine
es a
s de
sign
ated
by
CA
PE
R a
cros
s al
l ran
k le
vels
. Re-
entry
pos
t-M.D
. tra
inee
s ha
ve h
ad a
bre
ak in
pos
t-M.D
. tra
inin
g of
2 y
ears
or m
ore.
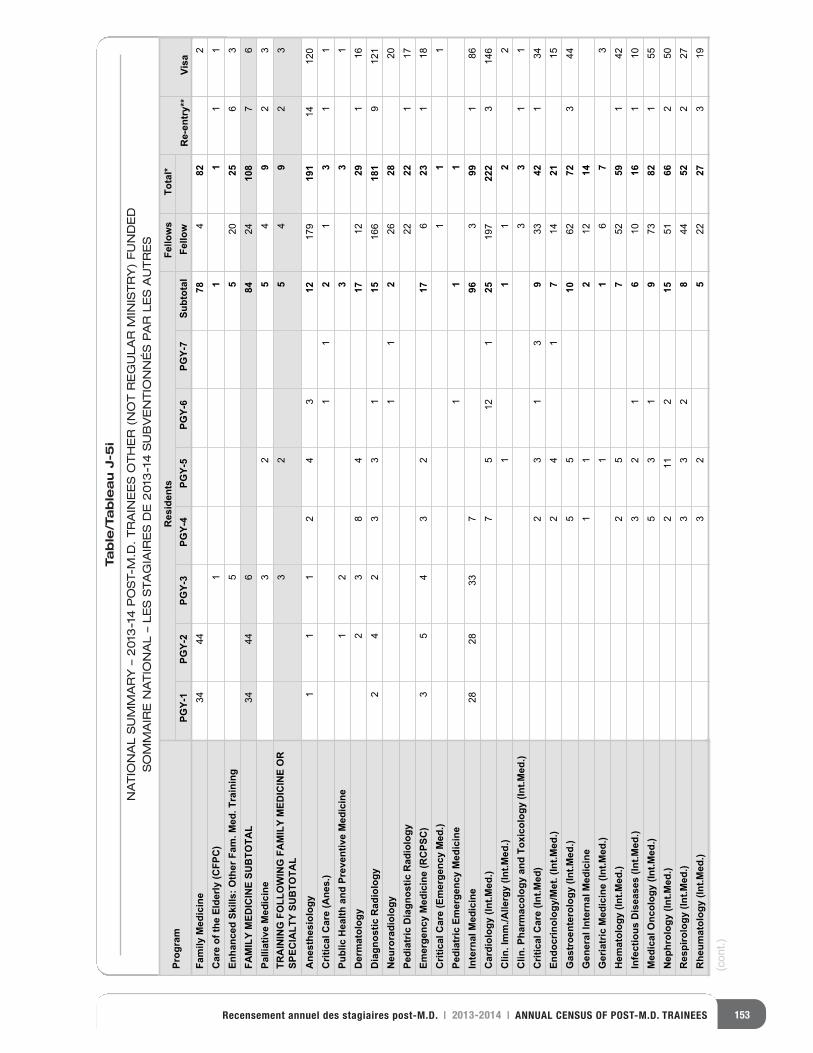
153Recensement annuel des stagiaires post-M.D. | 2013-2014 | ANNUAL CENSUS OF POST-M.D. TRAINEES
Table/Tableau J-5i
NATIONAL SUMMARY –2013-14 POST-M.D. TRAINEES OTHER (NOT REGULAR MINISTRY) FUNDED
SOMMAIRE NATIONAL –LES STAGIAIRES DE 2013-14 SUBVENTIONNÉS PAR LES AUTRES
Prog
ram
Res
iden
tsFe
llow
sTo
tal*
Re-
entr
y**
Visa
PGY-
1PG
Y-2
PGY-
3PG
Y-4
PGY-
5PG
Y-6
PGY-
7Su
btot
alFe
llow
Fam
ily M
edic
ine
Car
e of
the
Elde
rly (C
FPC
)En
hanc
ed S
kills
: Oth
er F
am. M
ed. T
rain
ing
FAM
ILY
MED
ICIN
E SU
BTO
TAL
Palli
ativ
e M
edic
ine
TRA
ININ
G F
OLL
OW
ING
FA
MIL
Y M
EDIC
INE
OR
SP
ECIA
LTY
SUB
TOTA
L
Ane
sthe
siol
ogy
Crit
ical
Car
e (A
nes.
)Pu
blic
Hea
lth a
nd P
reve
ntiv
e M
edic
ine
Der
mat
olog
yD
iagn
ostic
Rad
iolo
gyN
euro
radi
olog
yPe
diat
ric D
iagn
ostic
Rad
iolo
gyEm
erge
ncy
Med
icin
e (R
CPS
C)
Crit
ical
Car
e (E
mer
genc
y M
ed.)
Pedi
atric
Em
erge
ncy
Med
icin
eIn
tern
al M
edic
ine
Car
diol
ogy
(Int.M
ed.)
Clin
. Im
m./A
llerg
y (In
t.Med
.)C
lin. P
harm
acol
ogy
and
Toxi
colo
gy (I
nt.M
ed.)
Crit
ical
Car
e (In
t.Med
)En
docr
inol
ogy/
Met
. (In
t.Med
.)G
astr
oent
erol
ogy
(Int.M
ed.)
Gen
eral
Inte
rnal
Med
icin
eG
eria
tric
Med
icin
e (In
t.Med
.)H
emat
olog
y (In
t.Med
.)In
fect
ious
Dis
ease
s (In
t.Med
.)M
edic
al O
ncol
ogy
(Int.M
ed.)
Nep
hrol
ogy
(Int.M
ed.)
Res
piro
logy
(Int
.Med
.)R
heum
atol
ogy
(Int.M
ed.)
3444
784
822
11
11
1
55
2025
63
3444
684
2410
87
6
23
54
92
3
32
54
92
3
11
12
43
12179
191
14120
11
21
31
11
23
31
23
84
1712
291
16
24
23
31
15166
181
9121
11
226
2820
2222
117
35
43
217
623
118
11
1
11
128
2833
796
399
186
75
121
25197
222
3146
11
12
23
31
1
23
13
933
421
341
42
714
2115
55
1062
723
44
11
212
141
16
73
25
752
591
42
32
16
1016
110
53
19
7382
155
211
215
5166
250
33
28
4452
227
32
522
273
19
(cont.)
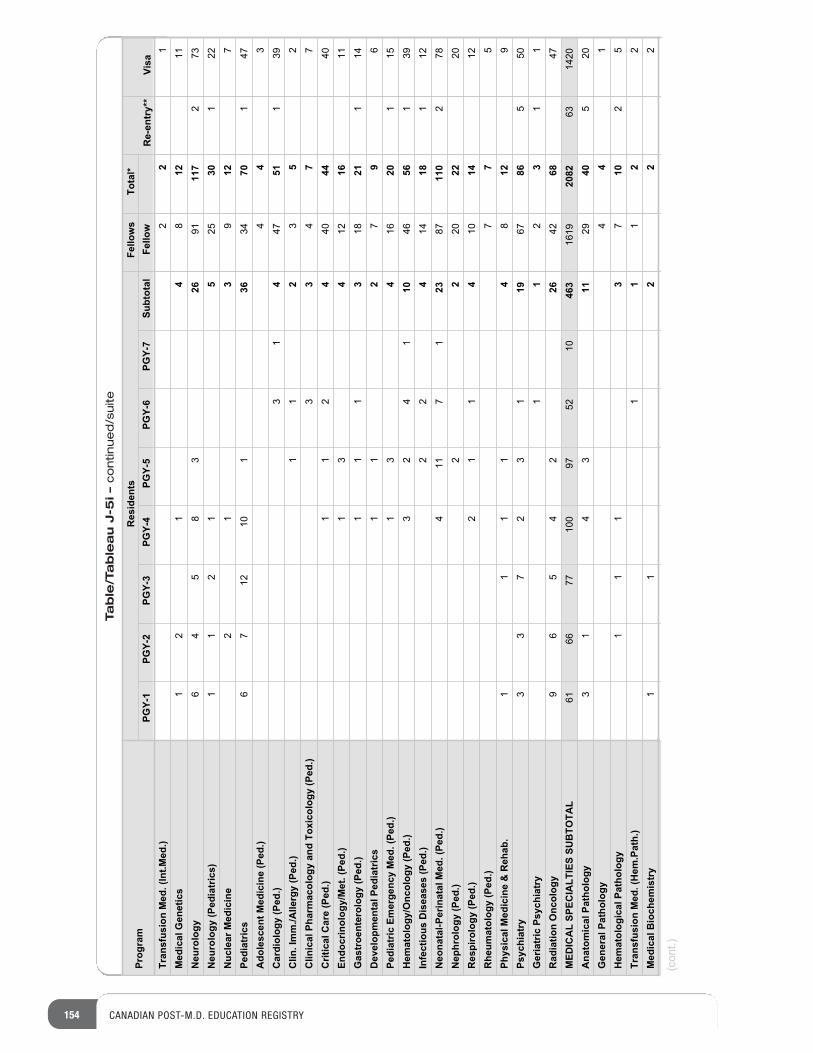
154 CANADIAN POST-M.D. EDUCATION REGISTRY
Table/Tableau J-5i –continued/suite
Prog
ram
Res
iden
tsFe
llow
sTo
tal*
Re-
entr
y**
Visa
PGY-
1PG
Y-2
PGY-
3PG
Y-4
PGY-
5PG
Y-6
PGY-
7Su
btot
alFe
llow
Tran
sfus
ion
Med
. (In
t.Med
.)M
edic
al G
enet
ics
Neu
rolo
gyN
euro
logy
(Ped
iatr
ics)
Nuc
lear
Med
icin
ePe
diat
rics
Ado
lesc
ent M
edic
ine
(Ped
.)C
ardi
olog
y (P
ed.)
Clin
. Im
m./A
llerg
y (P
ed.)
Clin
ical
Pha
rmac
olog
y an
d To
xico
logy
(Ped
.)C
ritic
al C
are
(Ped
.)En
docr
inol
ogy/
Met
. (Pe
d.)
Gas
troe
nter
olog
y (P
ed.)
Dev
elop
men
tal P
edia
tric
sPe
diat
ric E
mer
genc
y M
ed. (
Ped.
)H
emat
olog
y/O
ncol
ogy
(Ped
.)In
fect
ious
Dis
ease
s (P
ed.)
Neo
nata
l-Per
inat
al M
ed. (
Ped.
)N
ephr
olog
y (P
ed.)
Res
piro
logy
(Ped
.)R
heum
atol
ogy
(Ped
.)Ph
ysic
al M
edic
ine
& R
ehab
.Ps
ychi
atry
Ger
iatr
ic P
sych
iatr
yR
adia
tion
Onc
olog
yM
EDIC
AL
SPEC
IALT
IES
SUB
TOTA
LA
nato
mic
al P
atho
logy
Gen
eral
Pat
holo
gyH
emat
olog
ical
Pat
holo
gyTr
ansf
usio
n M
ed. (
Hem
.Pat
h.)
Med
ical
Bio
chem
istr
y
22
1
12
14
812
11
64
58
326
9111
72
731
12
15
2530
122
12
39
127
67
1210
136
3470
147
44
3
31
447
511
391
12
35
2
33
47
7
11
24
4044
401
34
1216
11
11
13
1821
114
11
27
96
13
416
201
15
32
41
1046
561
392
24
1418
112
411
71
2387
110
278
22
2022
202
11
410
1412
77
5
11
11
48
129
33
72
31
1967
865
50
11
23
11
96
54
226
4268
47
6166
77100
9752
1046
31619
2082
631420
34
13
1129
405
204
41
11
13
710
25
11
12
21
12
22
(cont.)
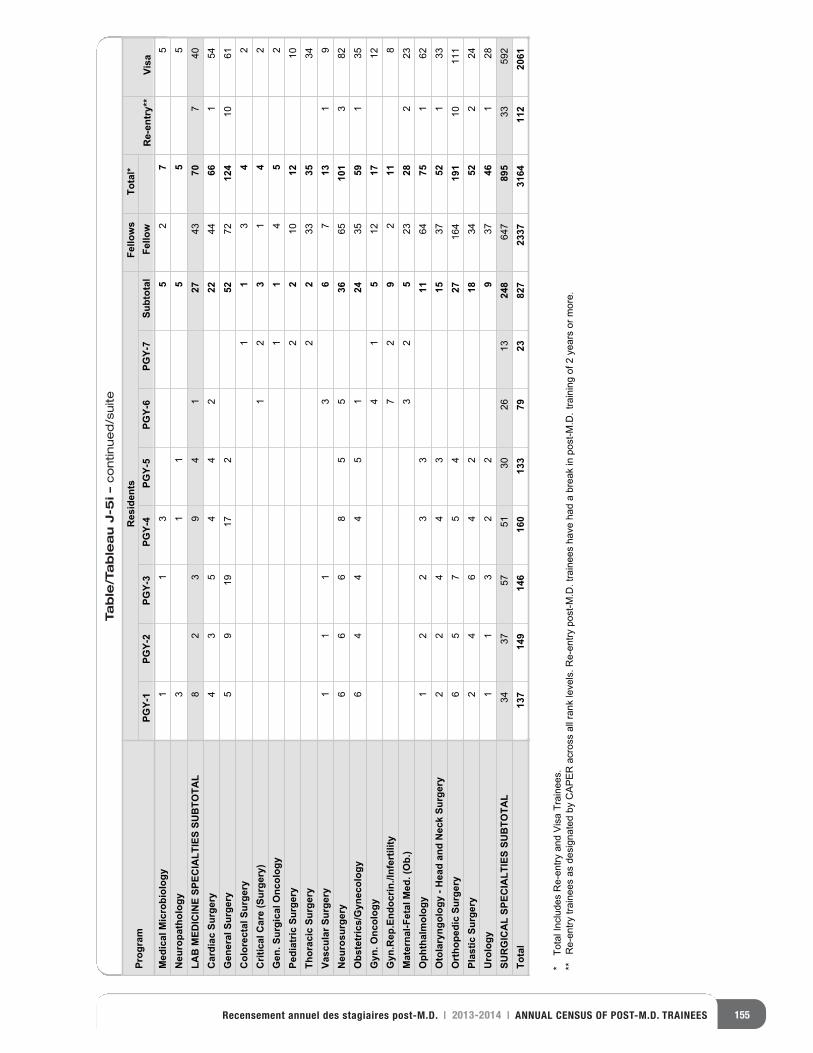
155Recensement annuel des stagiaires post-M.D. | 2013-2014 | ANNUAL CENSUS OF POST-M.D. TRAINEES
Table/Tableau J-5i –continued/suite
Prog
ram
Res
iden
tsFe
llow
sTo
tal*
Re-
entr
y**
Visa
PGY-
1PG
Y-2
PGY-
3PG
Y-4
PGY-
5PG
Y-6
PGY-
7Su
btot
alFe
llow
Med
ical
Mic
robi
olog
yN
euro
path
olog
yLA
B M
EDIC
INE
SPEC
IALT
IES
SUB
TOTA
LC
ardi
ac S
urge
ryG
ener
al S
urge
ryC
olor
ecta
l Sur
gery
Crit
ical
Car
e (S
urge
ry)
Gen
. Sur
gica
l Onc
olog
yPe
diat
ric S
urge
ryTh
orac
ic S
urge
ryVa
scul
ar S
urge
ryN
euro
surg
ery
Obs
tetr
ics/
Gyn
ecol
ogy
Gyn
. Onc
olog
yG
yn.R
ep.E
ndoc
rin./I
nfer
tility
Mat
erna
l-Fet
al M
ed. (
Ob.
)O
phth
alm
olog
yO
tola
ryng
olog
y - H
ead
and
Nec
k Su
rger
yO
rtho
pedi
c Su
rger
yPl
astic
Sur
gery
Uro
logy
SUR
GIC
AL
SPEC
IALT
IES
SUB
TOTA
LTo
tal
31
15
27
5
11
35
55
82
39
41
2743
707
404
35
44
222
4466
154
59
1917
252
7212
410
61
11
34
21
23
14
2
11
45
22
210
1210
22
3335
34
31
11
67
131
96
66
85
536
6510
13
82
64
44
51
2435
591
35
41
512
1712
72
92
118
32
523
282
231
22
33
1164
751
62
22
44
315
3752
133
65
75
427
164
191
1011
12
46
42
1834
522
24
11
32
29
3746
128
3437
5751
3026
1324
864
789
533
592
137
149
146
160
133
7923
827
2337
3164
112
2061
*
Tota
l Inc
lude
s R
e-en
try a
nd V
isa
Trai
nees
.**
R
e-en
try tr
aine
es a
s de
sign
ated
by
CA
PE
R a
cros
s al
l ran
k le
vels
. Re-
entry
pos
t-M.D
. tra
inee
s ha
ve h
ad a
bre
ak in
pos
t-M.D
. tra
inin
g of
2 y
ears
or m
ore.
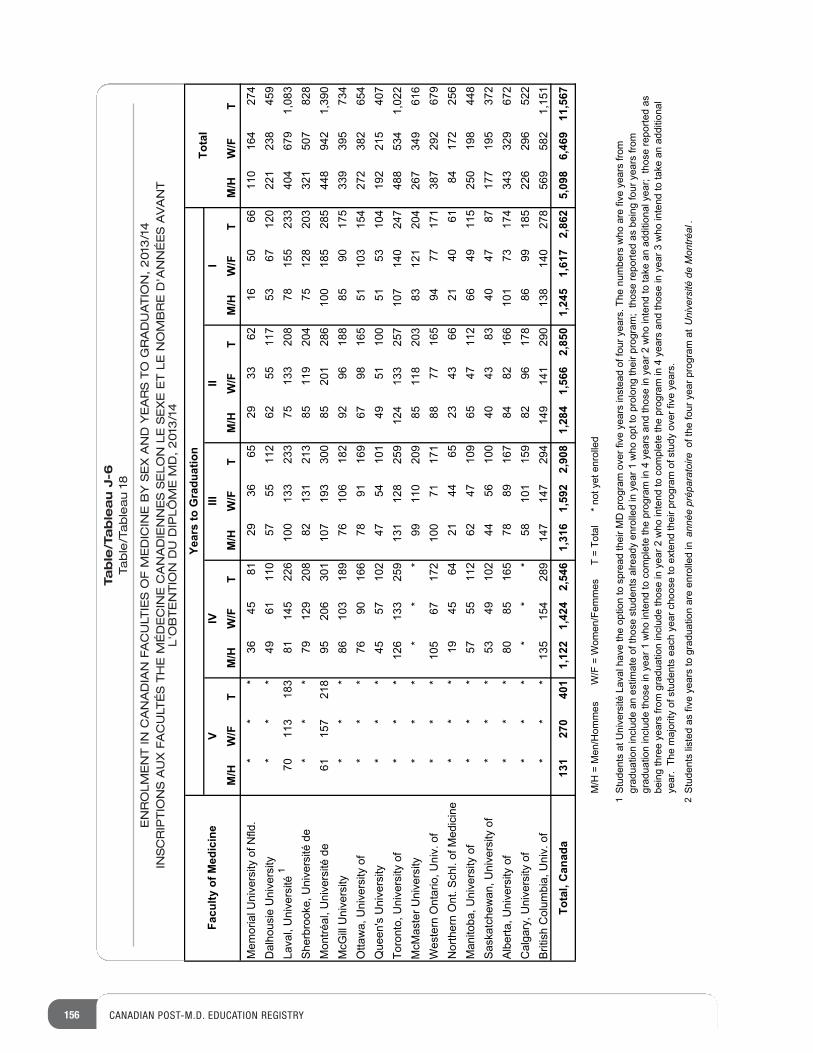
156 CANADIAN POST-M.D. EDUCATION REGISTRY
Table/Tableau J-6
Table/Tableau 18
ENROLMENT IN CANADIAN FACULTIES OF MEDICINE BY SEX AND YEARS TO GRADUATION, 2013/14
INSCRIPTIONS AUX FACULTÉS THE MÉDECINE CANADIENNES SELON LE SEXE ET LE NOMBRE D'ANNÉES AVANT
L'OBTENTION DU DIPLÔME MD, 2013/14
M/H
W/F
TM
/HW
/FT
M/H
W/F
TM
/HW
/FT
M/H
W/F
TM
/HW
/FT
Mem
oria
l Uni
vers
ity o
f Nfld
.*
**
3645
8129
3665
2933
6216
5066
110
164
274
Dal
hous
ie U
nive
rsity
**
*49
6111
057
5511
262
5511
753
6712
022
123
845
9La
val,
Uni
vers
ité 1
7011
318
381
145
226
100
133
233
7513
320
878
155
233
404
679
1,08
3S
herb
rook
e, U
nive
rsité
de
**
*79
129
208
8213
121
385
119
204
7512
820
332
150
782
8M
ontré
al, U
nive
rsité
de
6115
721
895
206
301
107
193
300
8520
128
610
018
528
544
894
21,
390 437
593933
57109
58881
6929
281601
67981
30168
**
*ytisrevin
U lliGc
M Otta
wa,
Uni
vers
ity o
f*
**
7690
166
7891
169
6798
165
5110
315
427
238
265
4Q
ueen
's U
nive
rsity
**
*45
5710
247
5410
149
5110
051
5310
419
221
540
7To
ront
o, U
nive
rsity
of
**
*12
613
325
913
112
825
912
413
325
710
714
024
748
853
41,
022
McM
aste
r Uni
vers
ity*
**
**
*99
110
209
8511
820
383
121
204
267
349
616
Wes
tern
Ont
ario
, Uni
v. o
f*
**
105
6717
210
071
171
8877
165
9477
171
387
292
679
Nor
ther
n O
nt. S
chl.
of M
edic
ine
**
*19
4564
2144
6523
4366
2140
6184
172
256
Man
itoba
, Uni
vers
ity o
f*
**
5755
112
6247
109
6547
112
6649
115
250
198
448
Sas
katc
hew
an, U
nive
rsity
of
**
*53
4910
244
5610
040
4383
4047
8717
719
537
2A
lber
ta, U
nive
rsity
of
**
*80
8516
578
8916
784
8216
610
173
174
343
329
672
Cal
gary
, Uni
vers
ity o
f*
**
**
*58
101
159
8296
178
8699
185
226
296
522
Brit
ish
Col
umbi
a, U
niv.
of
**
*13
515
428
914
714
729
414
914
129
013
814
027
856
958
21,
151
Tota
l, C
anad
a13
127
040
11,
122
1,42
42,
546
1,31
61,
592
2,90
81,
284
1,56
62,
850
1,24
51,
617
2,86
25,
098
6,46
911
,567
1 2
I
M/H
= M
en/H
omm
es
W
/F =
Wom
en/F
emm
es
T =
Tot
al
* n
ot y
et e
nrol
led
Stu
dent
s at
Uni
vers
ité L
aval
hav
e th
e op
tion
to s
prea
d th
eir M
D p
rogr
am o
ver f
ive
year
s in
stea
d of
four
yea
rs. T
he n
umbe
rs w
ho a
re fi
ve y
ears
from
gr
adua
tion
incl
ude
an e
stim
ate
of th
ose
stud
ents
alre
ady
enro
lled
in y
ear 1
who
opt
to p
rolo
ng th
eir p
rogr
am;
thos
e re
porte
d as
bei
ng fo
ur y
ears
from
gr
adua
tion
incl
ude
thos
e in
yea
r 1 w
ho in
tend
to c
ompl
ete
the
prog
ram
in 4
yea
rs a
nd th
ose
in y
ear 2
who
inte
nd to
take
an
addi
tiona
l yea
r; th
ose
repo
rted
as
bein
g th
ree
year
s fro
m g
radu
atio
n in
clud
e th
ose
in y
ear 2
who
inte
nd to
com
plet
e th
e pr
ogra
m in
4 y
ears
and
thos
e in
yea
r 3 w
ho in
tend
to ta
ke a
n ad
ditio
nal
year
. Th
e m
ajor
ity o
f stu
dent
s ea
ch y
ear c
hoos
e to
ext
end
thei
r pro
gram
of s
tudy
ove
r fiv
e ye
ars.
Stu
dent
s lis
ted
as fi
ve y
ears
to g
radu
atio
n ar
e en
rolle
d in
ann
ée p
répa
rato
ire o
f the
four
yea
r pro
gram
at U
nive
rsité
de
Mon
tréal
.
Facu
lty o
f Med
icin
eYe
ars
to G
radu
atio
nTo
tal
VIV
IIIII
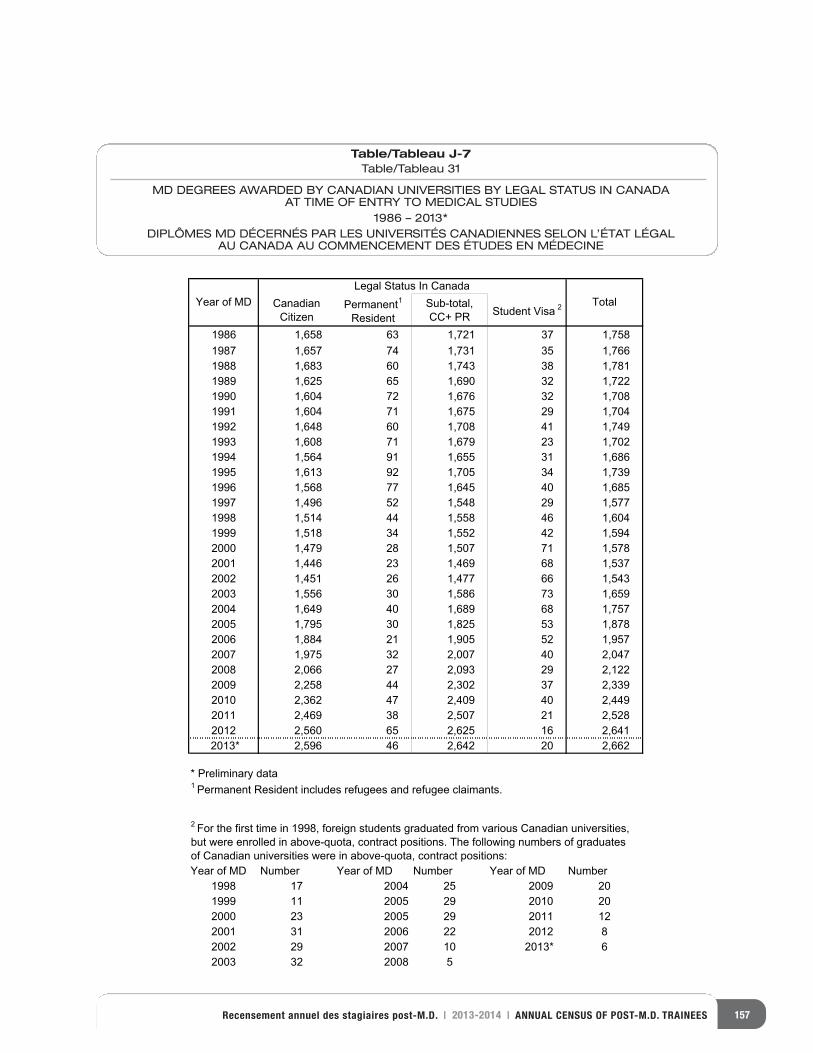
157Recensement annuel des stagiaires post-M.D. | 2013-2014 | ANNUAL CENSUS OF POST-M.D. TRAINEES
CanadianCitizen
Permanent1
ResidentSub-total,CC+ PR Student Visa 2
1986 1,658 63 1,721 37 1,7581987 1,657 74 1,731 35 1,7661988 1,683 60 1,743 38 1,7811989 1,625 65 1,690 32 1,7221990 1,604 72 1,676 32 1,7081991 1,604 71 1,675 29 1,7041992 1,648 60 1,708 41 1,7491993 1,608 71 1,679 23 1,7021994 1,564 91 1,655 31 1,6861995 1,613 92 1,705 34 1,7391996 1,568 77 1,645 40 1,6851997 1,496 52 1,548 29 1,5771998 1,514 44 1,558 46 1,6041999 1,518 34 1,552 42 1,5942000 1,479 28 1,507 71 1,5782001 1,446 23 1,469 68 1,5372002 1,451 26 1,477 66 1,5432003 1,556 30 1,586 73 1,6592004 1,649 40 1,689 68 1,7572005 1,795 30 1,825 53 1,8782006 1,884 21 1,905 52 1,9572007 1,975 32 2,007 40 2,0472008 2,066 27 2,093 29 2,1222009 2,258 44 2,302 37 2,3392010 2,362 47 2,409 40 2,4492011 2,469 38 2,507 21 2,5282012 2,560 65 2,625 16 2,641
2013* 2,596 46 2,642 20 2,662
Year of MD Number Year of MD Number Year of MD Number1998 17 2004 25 2009 201999 11 2005 29 2010 202000 23 2005 29 2011 122001 31 2006 22 2012 82002 29 2007 10 2013* 62003 32 2008 5
* Preliminary data1 Permanent Resident includes refugees and refugee claimants.
2 For the first time in 1998, foreign students graduated from various Canadian universities, but were enrolled in above-quota, contract positions. The following numbers of graduates of Canadian universities were in above-quota, contract positions:
Year of MDLegal Status In Canada
Total
Table/Tableau J-7Table/Tableau 31
MD DEGREES AWARDED BY CANADIAN UNIVERSITIES BY LEGAL STATUS IN CANADAAT TIME OF ENTRY TO MEDICAL STUDIES
1986 – 2013*DIPLÔMES MD DÉCERNÉS PAR LES UNIVERSITÉS CANADIENNES SELON L’ÉTAT LÉGAL
AU CANADA AU COMMENCEMENT DES ÉTUDES EN MÉDECINE
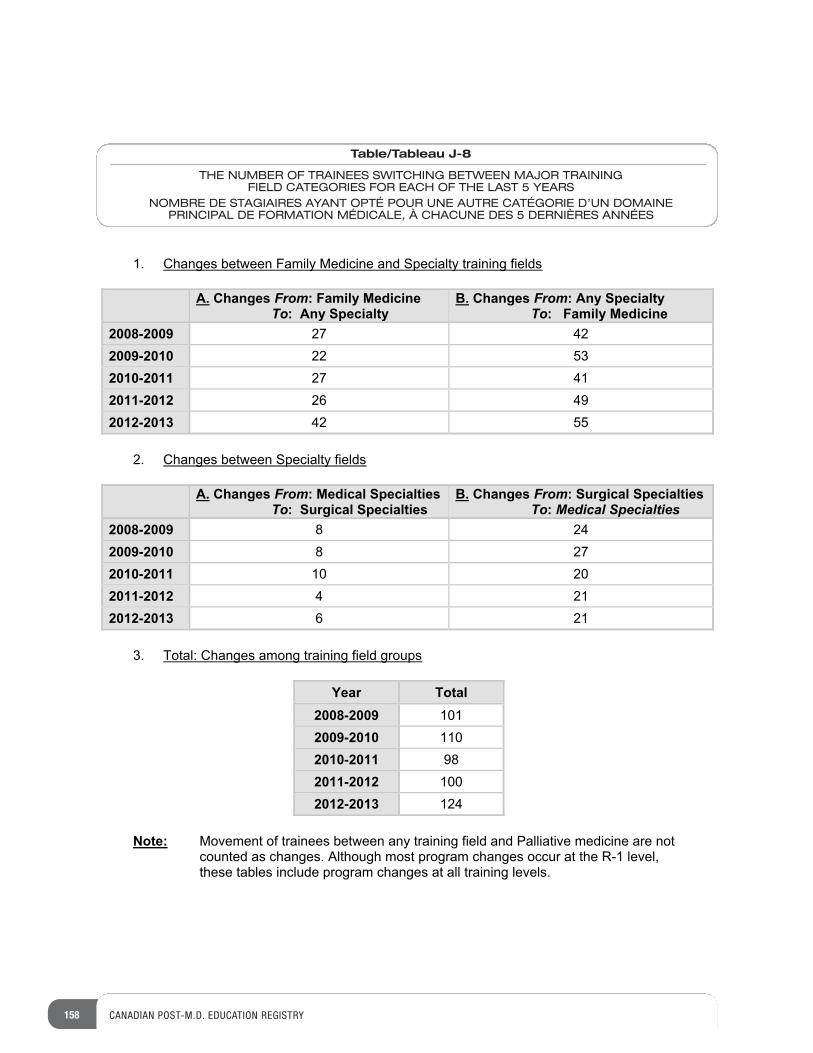
158 CANADIAN POST-M.D. EDUCATION REGISTRY
1. Changes between Family Medicine and Specialty training fields
A. Changes From: Family Medicine To: Any Specialty
B. Changes From: Any Specialty To: Family Medicine
2008-2009 24 722009-2010 35 222010-2011 14 722011-2012 94 622012-2013 55 24
2. Changes between Specialty fields
A. Changes From: Medical Specialties To: Surgical Specialties
B. Changes From: Surgical Specialties To: Medical Specialties
2008-2009 42 82009-2010 72 82010-2011 02 012011-2012 12 42012-2013 12 6
3. Total: Changes among training field groups
Year Total2008-2009 1012009-2010 1102010-2011 982011-2012 1002012-2013 124
Note: Movement of trainees between any training field and Palliative medicine are not counted as changes. Although most program changes occur at the R-1 level, these tables include program changes at all training levels.
Table/Tableau J-8
THE NUMBER OF TRAINEES SWITCHING BETWEEN MAJOR TRAININGFIELD CATEGORIES FOR EACH OF THE LAST 5 YEARS
NOMBRE DE STAGIAIRES AYANT OPTÉ POUR UNE AUTRE CATÉGORIE D’UN DOMAINEPRINCIPAL DE FORMATION MÉDICALE, À CHACUNE DES 5 DERNIÈRES ANNÉES


265 Carling Ave, Suite 800
Ottawa, ON Canada K1S 2E1
613-730-1204
613-730-1196
I SS N 1712-9 184
www.caper.ca