PDF (1765 KB) - World Bank eLibrary
36
Policy Research Working Paper 5565 Why Does Cargo Spend Weeks in African Ports? e Case of Douala, Cameroon Salim Refas omas Cantens e World Bank Africa Region Transport Department February 2011 WPS5565 Public Disclosure Authorized Public Disclosure Authorized Public Disclosure Authorized Public Disclosure Authorized
Transcript of PDF (1765 KB) - World Bank eLibrary

Policy Research Working Paper 5565
Why Does Cargo Spend Weeksin African Ports?
The Case of Douala, Cameroon
Salim RefasThomas Cantens
The World BankAfrica RegionTransport DepartmentFebruary 2011
WPS5565P
ublic
Dis
clos
ure
Aut
horiz
edP
ublic
Dis
clos
ure
Aut
horiz
edP
ublic
Dis
clos
ure
Aut
horiz
edP
ublic
Dis
clos
ure
Aut
horiz
ed

Produced by the Research Support Team
Abstract
The Policy Research Working Paper Series disseminates the findings of work in progress to encourage the exchange of ideas about development issues. An objective of the series is to get the findings out quickly, even if the presentations are less than fully polished. The papers carry the names of the authors and should be cited accordingly. The findings, interpretations, and conclusions expressed in this paper are entirely those of the authors. They do not necessarily represent the views of the International Bank for Reconstruction and Development/World Bank and its affiliated organizations, or those of the Executive Directors of the World Bank or the governments they represent.
Policy Research Working Paper 5565
This paper investigates the main factors explaining long container dwell times in African Ports. Using original and extensive data on container imports in the Port of Douala, it seeks to provide a basic understanding of why containers stay on average more than two weeks in gateway ports in Africa while long dwell times are widely recognized as a critical hindrance to economic development. It also demonstrates the interrelationships that exist between logistics performance of consignees, operational performance of port operators and efficiency of customs clearance operations. Shipment level analysis is used to identify the main determinants of long cargo
This paper is a product of the Transport Department, Africa Region. It is part of a larger effort by the World Bank to provide open access to its research and make a contribution to development policy discussions around the world. Policy Research Working Papers are also posted on the Web at http://econ.worldbank.org. Authors may be contacted through Gael Raballand ([email protected]).
dwell times and the impact of shipment characteristics such as fiscal regime, density of value, bulking and packaging type, last port of call, and region of origin or commodity group on cargo dwell time in ports is tested. External factors, such as performance of clearing and forwarding agents, shippers and shipping line strategies, also play an important role in the determination of long dwell times. Cargo dwell time distribution has many specificities, including broad-tail, high variance or right-censoring, which requires in-depth statistical analysis prior to any design of policy recommendations.

Why Does Cargo Spend Weeks in African Ports?
The Case of Douala, Cameroon
Salim Refas
Thomas Cantens1
Keywords: dwell time, ports, Sub-Saharan Africa, logistics.
1 Salim Refas, consultant, e-mail: [email protected] (corresponding author), Thomas Cantens, World Customs
Organization. This paper has been prepared within the framework of the World Bank regional economic sector work on cargo dwell time in Sub-Saharan Africa. The authors would like to particularly thank the Cameroonian Customs for having shared data, which has made possible the case study and Jean-Francois Marteau and Gaël Raballand for comments and suggestions.

2
INTRODUCTION
Africa’s ports are vital to the continent’s domestic economies. Maritime trade
accounts for more than 90 percent of the continent’s imports and exports and ports
therefore play a fundamental role in facilitating Africa’s integration to international trade.
However both importers and exporters face high costs for sea tr ansport and substantial
inefficiencies in port clearance operations. UNCTAD reports that the average freight rate
for imports for example is 47 percent higher than in other developing countries and twice
the rate in developed countries, estimated at 5.21 percent (UNCTAD, 2003). For
containerized imports, cargo dwell time - defined as the time between vessel arrival and
container exit from the port facilities - exceeds 20 days in average for most ports in the
continent which makes African ports the most time-inefficient ports in the world. This is an
added burden on business as compared to other regions in the world, as businesses relying
on just in time shipment are less likely to develop in such environment, and local importers
need to integrate higher storage and inventory costs. This paper aims at understanding the
long cargo dwell time issue in Sub-Saharan African ports. It focuses on containerized
imports through the port of Doula in Cameroon and leans upon extensive customs and port data
collected locally. It also seeks to provide some theoretical background and methodological tools to
address a crucial obstacle to Africa’s international trade.
The choice of Douala as a case study builds on its critical position as the gateway to several
Central African countries and as one of the largest ports in Western and Central Africa. Thanks to a
longstanding partnership between Cameroon (and especially the Cameroon Customs, the Facilitation
Committee and the Single Window for External trade), World Customs Organization (WCO) and the
World Bank, the port platform performance including cargo dwell time has been long monitored
(tracking of delays within the logistics chain in Douala have been thoroughly monitored by several
sources since the end of the 1990’s, first as part of adjustment and debt reduction initiatives and
then at the initiative of Cameroonian stakeholders).
The methodology used has been to combine readily available data from the business and
port community in Douala, with statistical analysis from ASYCUDA data provided by Cameroon
Customs and analyzed at WCO headquarters. To our knowledge, this had never been carried out as
comprehensively in developing countries. Cameroon is a specific case since ASYCUDA has been
implemented for all customs procedures, from the manifest lodging to the exit note, which enables a
very complete follow-up of import processes. These analyses have been complemented by
interviews with consignees, port operators, clearing and forwarding (C&F) agents and shippers. It is

3
part of an Africa-wide study currently carried out by the World Bank in relation to the determinants
of Port delays in Africa, which also comprises case studies in several other Sub-Saharan African
countries.
After a review of alternative perspectives on the issue of cargo dwell time in ports in section
1, we describe the importance of the issue in the Port of Douala in section 2 and formulate early
conclusions on main patterns observed. Using conclusions of qualitative research in Cameroon we
identify in section 3 structural and behavioral grounds to long cargo dwell time in the Port of Douala.
Explanatory statistics are then used in section 4 to test the early conclusions formulated in section 2
and identify lines of inquiry for further statistical modeling. We finish by few recommendations on
alternative ways to tackle the long cargo dwell time issue in Sub-Saharan African ports.
1. LONG CONTAINER DWELL TIME2 IN PORTS, THEORETICAL
BACKGROUND
A transport perspective
From a transport science perspective, container terminals are nothing more than intermodal
nodes in global transport chains. Their basic function is then to transfer efficiently unitized cargo
from a maritime transport mode (container ship) to a land transport mode (rail or truck) and vice-
versa. The efficiency of this transfer operation is then assessed against performance objectives which
are in general berth, yard and gate productivity objectives. If we focus specifically on time
performance of gateway ports for containerized imports we can however simply look at the rapidity
at which containers are physically transferred from the containership to the land transport mode via
the container yard. And this total time for the physical transfers only plus the necessary idle time
between operations is defined as operational dwell time.
Political economy perspective
From a political economy perspective however, gateway ports are also the place where the
customs clearance process is completed to allow goods to enter definitively or temporarily into the
2 We define container dwell time in ports as the total time lapse between the maritime and the land transport moves of an
imported or an exported container through SSA gateway ports. We focus in this paper on containerized imports for domestic consumption (as opposed to transit to third countries). Dwell time lapses therefore between containership arrival and exit of the truck or train from the port area.

4
country. For SSA countries it is a critical function as duties and taxes collected in ports are a very
important contributor to state revenues3. The efficiency of customs clearance in ports is then closely
monitored with a focus mostly on revenue collection performance. There is however a growing
awareness of the importance of customs clearance time efficiency to facilitate international trade. In
theory the time to perform import clearance formalities starts much before containership arrival and
is not therefore strictly related to cargo dwell time.
But in fact the bulk of formalities are still performed after ship arrival in most SSA ports
despite trade facilitation initiatives. Customs clearance and cargo dwell time are therefore closely
related. Customs take (sometimes rightly) a large share of the blame for long delays, but they are not
alone. For some operations, customs clearance is efficiently managed by shippers and C&F agents,
and transactional dwell time is not a major contributor to total dwell time. For others however the
time lost in the clearance process because of missing documents, errors in the declaration or simply
lack of anticipation is so important that it is explains an important proportion of long delays.
Moreover, customs administrations are just one agent among others who manage official formalities.
Some of them are public (sanitary services), others are para-public and have a delegated monopoly
on public missions (Terminal Operating company, Port authority, Inspection company). Besides, some
official processes may be intertwined, others not. This distinction among public and para-public
agents and the analysis of the dependency links between them may be relevant when analyzing the
causes of delays and/or proposing new procedures. Nevertheless, in terms of dwell time, customs
processes still usually “mark” the beginning and the end of most of the processes. We then define a
transactional dwell time that would be the administrative counterpart to the operational dwell time
defined above and that extends from containership arrival to the issue of the port exit note by
customs administration.
Supply chain and logistics perspective
A third perspective on the role of ports, actually complementary to the first two ones, is the
supply chain and logistics perspective. Here we are interested by the storage function of container
terminals and the linkages with production or distribution strategies of cargo owners. In theory
transit storage in the container terminal is not decided by the cargo owner but is rather as explained
above a consequence of either the discontinuity of physical transfers or the waiting time before
completion of customs clearance formalities. But in reality a significant proportion of containers that
3 In Cameroon, Customs duties accounted for 27% of state revenues in 2009 (Source: Cameroon Customs)

5
transit through ports remain in the container terminal much longer than customs formalities or
physical transfers would need.
The main reason for this is that the container terminal is in fact a warehousing option for
cargo owners and is therefore used to meet some of their temporary or long term storage needs.
These needs derive from a set of constraints - such as availability of cash flow, warehousing capacity
outside the port, current inventory levels or cargo time sensitivity - as well as from strategic choices
on risk exposure or inventory coverage that we will refer to as inventory management decisions. For
example a shipper may leave his cargo in the yard because he has got no other warehousing
possibility outside the port or he may leave it there because this would delay the payment of charges
and duties and reduce hence temporarily the pressure on his cash flow. For the purpose of the study
we will then define a discretionary dwell time as the sum of all idle times between vessel arrival and
exit from container yard that are strictly storage times (no clearance process or handling operation is
performed).
The complexity of research on dwell time is that these three constituents of total dwell time
– operational dwell time, transactional dwell time and discretionary dwell time – are actually
intertwined and overlaid. Yet we can proceed to a thorough analysis of total dwell time by taking two
complementary approaches:
The independent analysis of each of the three components defined here before to identify
the structural bottlenecks and improvement prospects
The analysis of interrelationships between the three dwell time constituents using shipment
level data and the identification of behavioral patterns
Figure 1 – The components of cargo dwell time: sequence of operational, transactional and logistics operations
Operational dwell time
Vessel arrival at buoy
Vessel berthing & container discharge
Transfer to the yard or ODCY
Delivery onto truck
Exit from yard
Transactional dwell time
Domiciliation & Pre-shipment inspection process
Establishment and Lodging of Customs declaration
Payment of NVOCCs, port authority & inspection bodies
Completion of clearance procedures & payment of taxes & duties
Discretionary dwell time
Storage in the container terminal

6
2. LONG DWELL TIME IN THE PORT OF DOUALA: FACTS AND
FIGURES
The various perceptions of long cargo dwell time in the port of Douala
Container dwell time is one of the many performance indicators to assess port performance.
As compared to standard indicators such as ship turnaround time or productivity indicators it is
however not yet widely used for global benchmarking purposes. It is therefore challenging to define
standard limits above which dwell time would be considered too long in any given port. Sector
experts tend to agree however on a 3 to 4 days representative mean value.4
From a national perspective, the issue of dwell time has been specifically identified as a
major hindrance to Cameroon economic development for a long time. In November 1997 a dwell
time target of 7 days for container imports has been officially defined5. This objective has however
not been adopted by all port stakeholders to date notably because it did not take into account
shippers and C&F behaviors, as we will demonstrate later.
On the other hand gateways ports are not only gateways, they are also a place of interaction
between a number of agents: port operators, public administration and authorities, brokers or
intermediaries and shippers. Each of this group has a specific use of the port that conditions its
perception of the long dwell time issue.
For the terminal operating company (TOC) - which is called Douala International Terminal
(DIT) in Douala - there is a direct relationship between distribution of dwell times and terminal
occupancy. It therefore needs to precisely evaluate a standard dwell time beyond which the
performance of the terminal is negatively affected. This standard is the free time period defined “as
the period during which a container can reside in the container yard without being assessed a
demurrage fee” (Huynh, 2006). According UNCTAD it should correspond from a user perspective to
the “sufficient time to allow efficient importers to clear their cargo” (UNCTAD, 1995). But in practice
the port authority and the TOC define this free time according capacity constraints, profit
maximization, container traffic patterns or other consideration (for example differentiation between
transit and domestic goods), and they tend to reduce it for example when facing high congestion
patterns. Free time in DIT has been set at 11 days since the signature of the concession contract in
2005, a somewhat long free time given congestion patterns in the port.
4 See for example, Benchmarking of container terminals, Gordon Rankine, Container Port Conference – Rotterdam,
February 2003 at http://www.beckettrankine.com/downloads/BCT.PDF 5 Roundtable on the Douala port reform, Douala, November 1997

7
As for shippers (importers or exporters) dwell time in ports can be assimilated to a temporary
storage period which is justified either by the time necessary to complete cargo clearance formalities
(transactional dwell time) or by a decision to leave cargo in the port for a defined number of days
superior to that clearance delay (discretionary dwell time). Field investigations have revealed that
the latter case is frequent and that inventory management strategies coupled to negotiations of
demurrage costs with shipping carriers6 cause shippers to use the port as a relatively cheap long term
warehouse. The desired cargo dwell time for most shippers would range today from 5 to 30 days for
imports7.
Lastly, customs administration is also concerned by container dwell time because of
important tax avoidance or cargo abandonment risks associated to long dwell times. Article 108 of
the CEMAC customs code defines a maximum clearance delay beyond which cargo is confiscated and
put under customs bonded storage. This delay is currently of 90 days in Douala and cargo is then to
be auctioned.
Parameters and benchmarks used for the analysis of cargo dwell time
In conclusion long dwell time perception varies according stakeholders. Optimal dwell time
perceptions range from 5 to 90 days today in the Port of Douala and a segment approach is to our
opinion much more relevant than a standardized objective hardly applicable for all cargo. In this
paper we will adopt the 11 days median limit to distinguish between short and long dwell times for
two reasons:
- it is DIT’s official free time period and is therefore formally adopted by all agents
- we estimate it as the limit value to avoid congestion in the terminal for at least 5 years8.
We then define three categories to specifically analyze the long dwell time population:
- from 11 days to 30 days: long delay
- from 30 days to 90 days: very long delay
- over 90 days: abnormal delay (customs bonded storage limit)
The importance and impact of each category is described in the next section. It is worth
noting that we are talking at this stage about median value to have a benchmark for segmentation
6 Free time before demurrage costs is generally of 10 days but some importers have negotiated a 20 days free time.
Terminal storage costs between the 12th
and 20th
days only accrue to $12 for a 20ft container and are therefore neglected. 7 The case of exports is different, as some commodities require very short transit time in ports, such as perishable, while
some seasonal or speculative commodities can stay for months in bonded warehouse in ports. This is however usually not the case for containerized goods. 8 Given the current container throughput patterns and the stated capacity of 7800 TEU for container imports occupancy
ratio will exceed 70% if average container dwell time is superior to 11 days, which will cause congestion before 2015.

8
and analysis. But we will dive into distribution patterns and shipment-level analysis of dwell time in
later sections because defining a standardized objective is by no mean the right way of tackling the
long dwell time issue.
Designation Stakeholder Dwell time objective
Global benchmark All 3 to 4 days “7 jours à l’import” objective All – Facilitation Committee 7 days Free time DIT / PAD 11 days Desired storage time Shippers 5 to 35 days
Maximum clearance delay Customs administration 90 days Proposed benchmark All 11 days Table 1 –Alternative long dwell time definitions for the Douala Port
Importance of the long cargo dwell time issue in Douala
Container traffic represents about 45% of the total tonnage that transits through the Port of
Douala annually9. Containers are also the primary mode for Cameroonian exports representing about
75% of total traffic in tons while they account for about 45% of Cameroonian imports.
Graph 1 – Container imports traffic and dwell time in the Port of Douala (2005-2009) Source: Port Autonome de Douala
Most recent DIT statistics indicate an average dwell time of 19.3 days for the first semester of
2010 while means of 18 days and 20 days respectively have been observed in July and August10. This
value has been quite stable in the last few years despite strong and consistent growth in traffic.
9 Source : Annual statistics, Port Autonome de Douala
10 Source: DIT
94.631101.384
112.671
138.475 143.882
0
5
10
15
20
25
0
20
40
60
80
100
120
140
160
Dwell time in DIT (days)
Import traffic(TEU '000)
Import volume dwell time

9
Traffic growth has slowed down with the international crisis but it is expected to increase at a fast
pace in the upcoming years together with the economy and containerization levels.
According to customs data11, the distribution of dwell times is indicated in graph 2.12
Graph 2 - Dwell time distribution in the Port of Douala in 2009 (time between vessel discharge and gate exit) Source: Cameroonian Customs data
An important observation is that dwell time variance is quite significant, with a standard
deviation equal to 160% of the mean value. A sequential analysis of delays shows this variance is
mainly the consequence of variance between vessel arrival and customs declaration lodging (referred
to as “Arrival to Lodging” delay). Delay between payment of customs dues and gate exit (“Payment
to Gate”) does also largely vary according shipment. These two intermediary delays account for
about 75% of the total dwell time (“Arrival to gate”) in average. In contrast delay between lodging
and payment of customs dues (“Lodging to payment”) is quite low and homogeneous in the whole
sample.
Arrival to gate Arrival to lodging Lodging to payment Payment to gate
Min 1 1 1 1
1st
quartile 8 3 1 1
Median 14 7 3 4
Mean 24,0 13,0 4,7 11,4
3rd
quartile 26 15 5 8
Max 566 446 340 387
Inter quartile range 18 12 4 7
Table 2 – Quartile distrib ution of cargo dwell time sequential components (container imports in Douala, 2009) Source: CAMEROONIAN CUSTOMS, 2009 – Values in days
11
Data set of all containerized imports through the port of Douala in 2009 destined to local consumption (regime IM4). 12
In addition to the different long dwell times categories observed in graph 1 there are a few hundred containers that do not appear in statistics which were already in the terminal as of January 1st, 2009 but have not been cleared before December 31st, 2009 (Source: Interview with DIT, October 2010.)
0%
5%
10%
15%
20%
25%
30%
35%
0-5 days 6-10 days
11-20 days
21-30 days
31-40 days
41-50 days
51-60 days
61-70 days
71-80 days
81-90 days
> 90 days

10
Graph 3 – Boxplot analysis of cargo dwell time sequential components (container imports in Douala, 2009)13
Souce: CAMEROONIAN CUSTOMS, 2009 – Values in days
For all these steps however the fact that median values are 40 to 65% lower than means
demonstrates the substantial impact of a minority of very long or abnormal delays. A specific look
into the determinants of these very long delays is then necessary, and we recommend using the
median rather than the mean (traditionally used in Douala and other ports) as the benchmark for
long delays.
Shipment level analysis and the need for segmentation
Main conclusions from shipment level analysis
Since the dwell time issue came to the forefront in 199714 local stakeholders in the Port of
Douala have implemented multiple monitoring tools that provide extensive shipment level data.
Preliminary analysis of these data lead to conclusions that are consistent with previous research
findings (notably Arvis et al.,2010):
Broad-tailed multimodal distribution
The first observation is that there is a large dispersion of values in the distribution of dwell
times), with a broad-tailed shape quite specific to developing regions. This is symptomatic of the long
storage patterns and opportunistic behaviors mentioned here before. This also reflects that the
13
For a better visibility whiskers have been limited to 1.5 times the Inter-quartile range. 14
Mostly because of a very serious deterioration of import conditions in Douala, leading to quasi paralysis and overwhelming complains from the business community, mainly targeted towards the Port Authority and to a lesser extent Customs.
0
5
10
15
20
25
30
35
40
45
50
55
60
Arrival to gate arrrival to lodging lodging to payment payment to gate
11
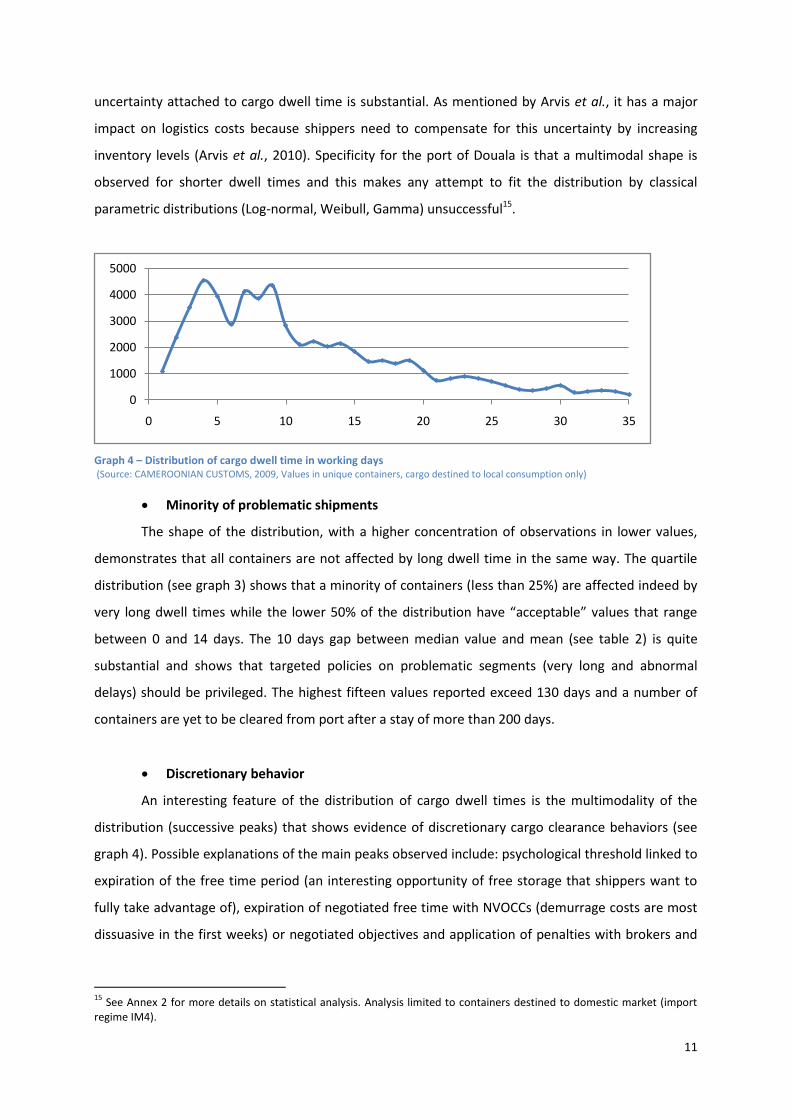
uncertainty attached to cargo dwell time is substantial. As mentioned by Arvis et al., it has a major
impact on logistics costs because shippers need to compensate for this uncertainty by increasing
inventory levels (Arvis et al., 2010). Specificity for the port of Douala is that a multimodal shape is
observed for shorter dwell times and this makes any attempt to fit the distribution by classical
parametric distributions (Log-normal, Weibull, Gamma) unsuccessful15.
Graph 4 – Distribution of cargo dwell time in working days (Source: CAMEROONIAN CUSTOMS, 2009, Values in unique containers, cargo destined to local consumption only)
Minority of problematic shipments
The shape of the distribution, with a higher concentration of observations in lower values,
demonstrates that all containers are not affected by long dwell time in the same way. The quartile
distribution (see graph 3) shows that a minority of containers (less than 25%) are affected indeed by
very long dwell times while the lower 50% of the distribution have “acceptable” values that range
between 0 and 14 days. The 10 days gap between median value and mean (see table 2) is quite
substantial and shows that targeted policies on problematic segments (very long and abnormal
delays) should be privileged. The highest fifteen values reported exceed 130 days and a number of
containers are yet to be cleared from port after a stay of more than 200 days.
Discretionary behavior
An interesting feature of the distribution of cargo dwell times is the multimodality of the
distribution (successive peaks) that shows evidence of discretionary cargo clearance behaviors (see
graph 4). Possible explanations of the main peaks observed include: psychological threshold linked to
expiration of the free time period (an interesting opportunity of free storage that shippers want to
fully take advantage of), expiration of negotiated free time with NVOCCs (demurrage costs are most
dissuasive in the first weeks) or negotiated objectives and application of penalties with brokers and
15
See Annex 2 for more details on statistical analysis. Analysis limited to containers destined to domestic market (import regime IM4).
0
1000
2000
3000
4000
5000
0 5 10 15 20 25 30 35

12
agents (clearance in less than two weeks, in less than a month, etc16 .). Some seasonality has been
observed in these discretionary trends, with a more significant peak around 11 days in the second
trimester of the year and conversely a dominance of short dwell times in the last trimester, but the
general observance of discrete behaviors is consistent throughout the year17. Strata analysis will help
better interpret the peaks and test these assumptions.
The need to build logistics families
In addition to the latter observation about likely presence of discretionary behavior,
shipment level analysis also demonstrates that dwell time averages vary across the sample according
to cargo characteristics such as fiscal regime, bulking, density of value and cargo type. Explanatory
statistics will later help us measure this correlation, but the main assumption from the following
summaries is that logistic families based on cargo characteristics can be defined to explain significant
variation of clearance patterns according cargo and shipper characteristics.
Fiscal regime
Fiscal pressure seems to play an important role in cargo dwell time. The trend observed is a
positive correlation: higher fiscal pressure leads to higher dwell time, with a noticeable exception
however for duty free items that have a somewhat high average dwell time despite the absence of
dues.
Fiscal pressure average dwell time # of containers
0% (Duty free) 21.6 5,101
0 to 27,8% (necessity goods or duty free) 18.9 3,613
27,8% to 33,7 % (raw materials) 19.2 6,676
33,7% to 45,7% (semi-finished goods) 21.3 11,992
Over 45,7% (finished goods) 22.1 19,119 Table 3 – Distribution of average dwell time with respect to Fiscal pressure (Source: CAMEROONIAN CUSTOMS, 2009)
Bulking of containers
Bulking of containers seems to play a role also in cargo dwell time patterns: Less-than-
container load containers take about 3 more days than Full-container-load containers to be cleared
from the port. This is paradoxical in the sense that bulking is usually performed by logistics providers
that have storage facilities outside the port and who would in theory intend to minimize cargo stay in
16
Field investigations have proved this threshold to be the most significant for financial managers and supply chain managers and it is indeed the highest peak. While parking fees (charged by DIT) are quite modest in the first 20 days (5,200 FCFA for a 20 feet container) demurrage costs quickly accrue to more than 50,000 FCFA and most managers aiming at cutting logistics costs set therefore a “0 demurrage fee” objective for their C&F agents and employees. 17
There seems to be a better efficiency for Customs operations in the last month of the year, which is consistent with shippers’ feedbacks.

13
the port to maximize cargo stay in their own facilities. A better understanding of the operational
strategies of these bulking operators is needed.
Consignment type # of containers average dwell time
FCL 29,698 19,8 LCL 26,524 22,6
Table 4 - Distribution of average dwell time with respect to bulking type (Source: CAMEROONIAN CUSTOMS, 2009)
Density of value
Density of value is an important determinant of logistics strategies since it is a leading driver
of holding and transportation costs and serves therefore as a control variable for the dimensioning of
economic order quantities and inventory levels. An ABC analysis of cargo dwell times vs. density of
value confirms the crucial importance of this variable. The correlation is positive: higher cargo value
leads to higher dwell times.
The analysis of gaps between the three categories leads to the conclusions that low value
goods are declared faster than high value goods (about 2 days less in average) which would be
representative of a better performance of both shippers and brokers. A detailed analysis of
performance by good type (HS code) will be done later on to better understand this fact. Another
distinction is then to be made between categories B and C in the payment to gate dwell time. This
specific feature of discretionary dwell time needs to be analyzed.
Density of value # of containers
average dwell time
arrival to lodging
lodging to payment
payment to gate
less than 1000 FCFA/kg 38,432 20.3 10.4 4.3 5.9
from 1000 to 6500 FCFA/kg 15,092 22.8 12.1 4.4 6.6
More than 6500 FCFA/kg 2,318 24.7 12.4 4.9 7.5 Table 5 - Distribution of average dwell time with respect to density of value (Source: CAMEROONIAN CUSTOMS, 2009)
Commodity type
The variety of imports is significant at a country level and thorough commodity analysis of
cargo dwell time is therefore difficult. By looking at cargo categories however - using 2-figure HS
code - we can get a broad sense of clearance patterns with respect to cargo type. We use 15
categories which account for most of them for at least 5% of total volume of imports. The table
below shows the important variance of average dwell time across different categories. While
chemicals and allied industries inputs are cleared in 16 days in average, finished goods such as
machinery, foodstuffs or transport vehicles and parts remain in the port terminal for more than 24
days in average. Further understanding of these differences is needed, and one needs to look at
inventory management strategy in particular, but this brief analysis confirms that commodity type is
a crucial determinant of cargo dwell time.
14
Product category average dwell time # of containers proportion (containers)
Chemicals& Allied Industries 16,4 5945 13%
Foodstuffs 24,2 5744 12%
Plastics/rubbers 21,5 4883 11%
Machinery/Electrical 24,3 4773 10%
Stone/Glass 22,9 4036 9%
Metals 19,9 3589 8%
Textiles 19,9 3571 8%
Vegetable products 21,4 3430 7%
Miscellaneous 23,1 2646 6%
Wood & Wooden products 18,0 2431 5%
Mineral Products 18,0 2418 5%
Transportation 26,2 1623 3%
Footwear/Headgear 16,2 593 1%
Raw Hides, Skins, Leather & Furs 18,4 558 1%
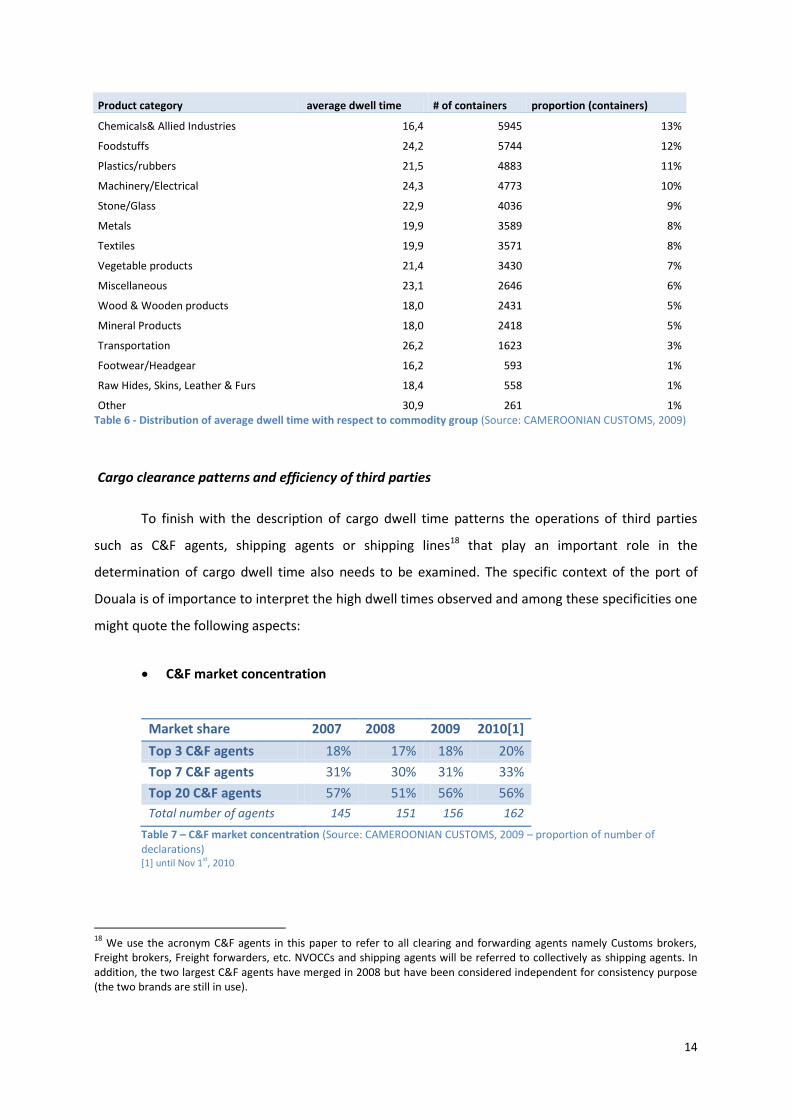
Other 30,9 261 1% Table 6 - Distribution of average dwell time with respect to commodity group (Source: CAMEROONIAN CUSTOMS, 2009)
Cargo clearance patterns and efficiency of third parties
To finish with the description of cargo dwell time patterns the operations of third parties
such as C&F agents, shipping agents or shipping lines18 that play an important role in the
determination of cargo dwell time also needs to be examined. The specific context of the port of
Douala is of importance to interpret the high dwell times observed and among these specificities one
might quote the following aspects:
C&F market concentration
Market share 2007 2008 2009 2010[1]
Top 3 C&F agents 18% 17% 18% 20%
Top 7 C&F agents 31% 30% 31% 33%
Top 20 C&F agents 57% 51% 56% 56%
Total number of agents 145 151 156 162
Table 7 – C&F market concentration (Source: CAMEROONIAN CUSTOMS, 2009 – proportion of number of declarations) [1] until Nov 1st, 2010
18
We use the acronym C&F agents in this paper to refer to all clearing and forwarding agents namely Customs brokers, Freight brokers, Freight forwarders, etc. NVOCCs and shipping agents will be referred to collectively as shipping agents. In addition, the two largest C&F agents have merged in 2008 but have been considered independent for consistency purpose (the two brands are still in use).
15
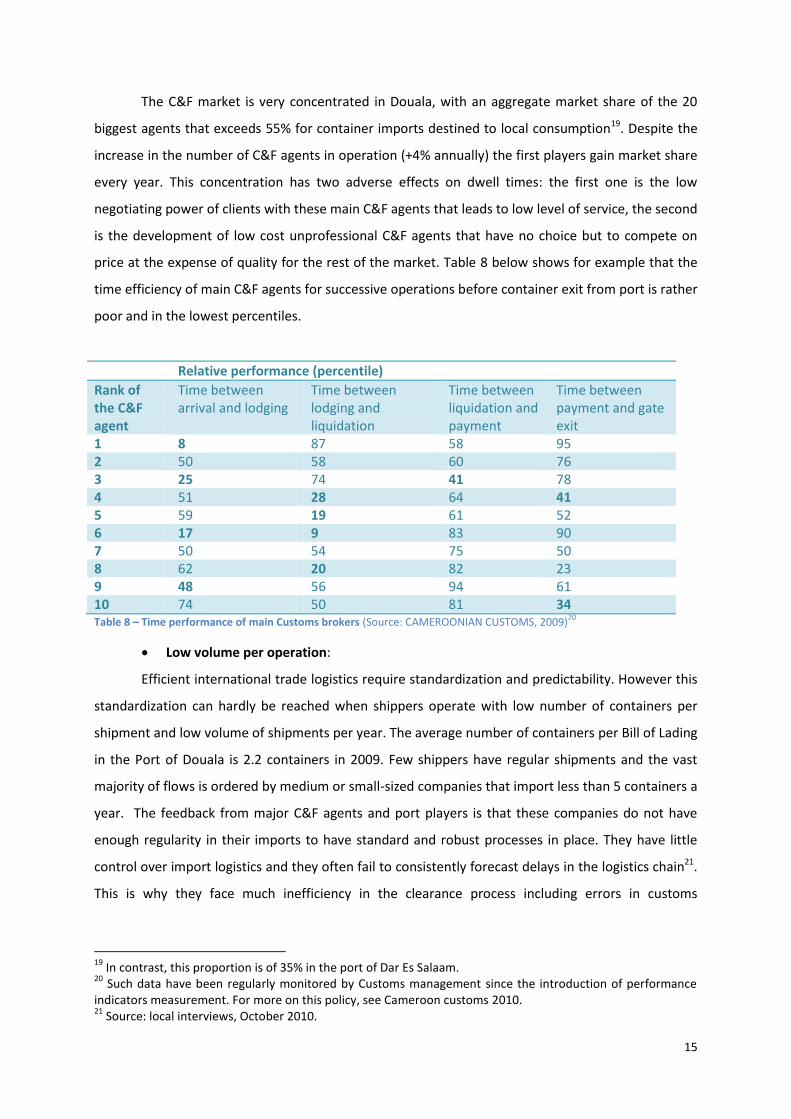
The C&F market is very concentrated in Douala, with an aggregate market share of the 20
biggest agents that exceeds 55% for container imports destined to local consumption19. Despite the
increase in the number of C&F agents in operation (+4% annually) the first players gain market share
every year. This concentration has two adverse effects on dwell times: the first one is the low
negotiating power of clients with these main C&F agents that leads to low level of service, the second
is the development of low cost unprofessional C&F agents that have no choice but to compete on
price at the expense of quality for the rest of the market. Table 8 below shows for example that the
time efficiency of main C&F agents for successive operations before container exit from port is rather
poor and in the lowest percentiles.
Relative performance (percentile)
Rank of the C&F agent
Time between arrival and lodging
Time between lodging and liquidation
Time between liquidation and payment
Time between payment and gate exit
1 8 87 58 95 2 50 58 60 76 3 25 74 41 78 4 51 28 64 41 5 59 19 61 52 6 17 9 83 90 7 50 54 75 50 8 62 20 82 23 9 48 56 94 61 10 74 50 81 34 Table 8 – Time performance of main Customs brokers (Source: CAMEROONIAN CUSTOMS, 2009)
20
Low volume per operation:
Efficient international trade logistics require standardization and predictability. However this
standardization can hardly be reached when shippers operate with low number of containers per
shipment and low volume of shipments per year. The average number of containers per Bill of Lading
in the Port of Douala is 2.2 containers in 2009. Few shippers have regular shipments and the vast
majority of flows is ordered by medium or small-sized companies that import less than 5 containers a
year. The feedback from major C&F agents and port players is that these companies do not have
enough regularity in their imports to have standard and robust processes in place. They have little
control over import logistics and they often fail to consistently forecast delays in the logistics chain21.
This is why they face much inefficiency in the clearance process including errors in customs
19
In contrast, this proportion is of 35% in the port of Dar Es Salaam. 20
Such data have been regularly monitored by Customs management since the introduction of performance indicators measurement. For more on this policy, see Cameroon customs 2010. 21
Source: local interviews, October 2010.

16
declarations, delays in transmission of import documents by suppliers or shortage of liquidity, and
this inefficiency is in general synonymous of long delays and high import costs.
The impact of unpredictability over logistics costs has been estimated to 25 or 30% of factory
price (Arvis et al., 2010) while the impact on delays is in days.22
Concentration of shipping flows
Another significant pattern for containers imports to the port of Douala is the concentration
of shipping flows along a few main shipping routes. The top 3 shipping routes account for example
for 70% of total imports. This creates disruption in the pattern of arrivals and punctual congestion at
the later clearance steps (transfer to the yard, customs clearance formalities, etc.) that generate
serial delay in the whole chain of operations. This is also a main driver of discretionary clearance
behaviors as will be shown later.
Port of origin Proportion of container imports Cumulative proportion
Algéciras 34% 34%
Las Palmas 22% 56%
Antwerp 14% 70%
Singapore 11% 81%
Dubai 3% 84%
Genoa 3% 87%
Table 9 – Concentration of container imports along main shipping routes (Source: CAMEROONIAN CUSTOMS, 2009)
3. BEYOND FIGURES: STRUCTURAL GROUNDS OR ADVERSE
BEHAVIORS?
Structural inefficiencies
Operational inefficiencies
Figure 2 – Sequence of operations in the Port of Douala and typical times (Source: DIT)
The operational inefficiencies of port operators are often identified as major hindrances to
the achievement of the “7 days” dwell time objective set in 1997 for the Port of Douala community.
22
Further research is probably needed to estimate the impact of regularity on dwell time and Customs clearance efficiency.
Operational dwell time
Vessel arrival
at buoy
Vessel berthing & container discharge
24 to 48h
Transfer to the yard or ODCY
<1h
Delivery onto truck
<2h
Exit from yard
1 to 8h

17
But if we look in detail at successive operations and typical delays, in Figure 4 we become aware that
the operational dwell time in the Port of Douala ranges between 2 and 4 days today and is therefore
far from being the main contributor to the long cargo dwell times observed23.
There is however scope for improvement. The two bottlenecks identified today are the
congestion at berth and the time to exit from yard.24
As for berth congestion, the main issue is a shortage of capacity given average berth
occupancy of 60%. Net crane productivity could be improved through better maintenance of the two
gantry cranes that have not yet reached half of their lifetime. The investment into a third gantry
crane is not yet economically justified but should be envisaged in case of traffic increase. Efficient
dredging is also a way of improving berth productivity through longer berth availability.
As for yard productivity the main issue today is the very high occupancy rate (88%). Physical
extension of yard area seems difficult given the shortage of available land in the port outskirts and
would require either additional movements or much longer distances between the peers and storage
places. The pavement of a small area in the import yard is expected to increase yard capacity by a
few hundred TEUs and the transfer of very long stay containers and confiscated containers to a
separate storage area could also release some capacity. A substantial capacity increase is however
only achievable through investment in more intensive storage configuration and a transfer from
current reach stacker configuration to straddle carrier configuration seems today indispensable
(capacity increase of 40 to 50%).
Figure 3 – Practical storage capacity according yard equipment Source: http://www.kalmarind.com accessed on November 15, 2010
Another issue that has been spotted by comité FAL and DIT is the undertaking of customs
physical inspections inside the port terminal. The layout of the port platform is ill-adapted to the
23
The Guichet Unique du Commerce Extérieur (GUCE) has estimated the operational time after completion of all clearance formalities to 3.7 days in 2009, 3.76 days in 2008 and 2.99 days in 2008 in a recent evaluation of port delays (Synthèse sur les délais de passage portuaire, GUCE, Direction générale des études et pilotage de la performance, Septembre 2010). 24
Delivery onto truck use to be a bottleneck but the introduction of a modern Terminal Operating System in 2009 has much improved yard productivity.

18
physical role of a container terminal (transfer area) and the creation of an independent customs area
dedicated to physical/scanning inspections is being discussed. The comité FAL advocates in addition
the performance of physical inspections on the truck to avoid double re-handling but this would
probably immobilize trucks to the detriment of trucking companies. Obstacles to an efficient gate
exit also include poor connectivity of customs booth and redundancy in document controls after the
release has been issued.
Cumbersome clearance procedure: not anymore an issue?
Figure 4 - Sequence of port clearance operations in the Port of Douala and typical times (derived from reference times, Source: GUCE)
Trade facilitation has been at the forefront of trade policy in Cameroon for almost ten years
with initiatives and investments aimed at increasing trade performance through improvement of
transport infrastructure, removal of corruption and informal practices, modernization of customs
administration, reduction of non-tariff trade barriers, improvement of revenue collection
performance and border controls, and in wider terms reduction of transaction and administrative
costs. A multi-donor transit and transport facilitation project is being co-financed by the World Bank,
the African Development Bank and the European Commission to help Cameroon, Central African
Republic and Chad address these trade facilitation challenges.
Much has been achieved in the course of last ten years. The modernization of customs
administration and the introduction of a one-stop shop for clearance procedures (the GUCE, Guichet
Unique du Commerce Extérieur) have arguably led for example to a saving of more than 11 days in
the average clearance time as can be seen in graph 7.
Transactional dwell time
Domiciliation & Pre-shipment
inspection process
1 to 3 days
Establishment and Lodging of
Customs declaration
1h to 1day 1/2
Payment of port charges
and inspection bodies
<6h
Completion of clearance
procedures & payment of
taxes & duties
<2h

19
Figure 5 – Time necessary to perform Customs clearance formalities in the port of Douala Source: Synthèse sur les délais de passage portuaire, GUCE, Direction générale des études et pilotage de la performance, Septembre 2010
A threshold of three days seems to be a down limit for time efficiency of manual procedures
and the GUCE is aiming today for a full dematerialization of procedures to achieve better
performance. In parallel the customs administration has recently introduced performance contracts
to ensure better efficiency of customs operations in the Port and one indicator (time release) tracks
the time period between broker’s registration and customs officer’s assessment. From 70%
declarations assessed the day it is lodged, the percentage increased to 90%.
All these observations make us conclude that customs clearance performance does not
seems to be a priority issue anymore in the reduction of dwell time in Douala. Of course there is still
way for improvement, in particular in the pre-shipment inspection process or the establishment and
lodging of customs declaration.25 A major step would be to encourage wide use of pre-arrival
declaration that is still far from being widely practiced by brokers and shippers.
Other areas of improvement include the efficient connection of Port authority to the
electronic GUCE, the introduction of a single payment and the training of customs brokers to avoid
errors in declaration. There are also many operational issues with the current pre-inspection system
with long delays before validation of pre-inspection and collection of statements at the pre-
inspection service office in Douala. This paper does not examine these issues currently discussed by
all port stakeholders and customs administration. The point is that all IT investments (and
infrastructure or equipment investment in port operations) will only result in improvement if
behavioral inefficiencies are effectively tackled.
25
An action plan to reduce processing time at SGS, the pre-shipment inspection service, is in place. Reference time of 8h30 is much exceeded today (1 day and 5h on average in 2009 according GUCE).
14.8
7.68
5.35 5.544.83
4.163.03
3.83 3.72 3.31
0
2
4
6
8
10
12
14
16
18
2000 2001 2002 2003 2004 2005 2006 2007 2008 2009
Customs clearance time (days)

20
Behavioral inefficiencies and inventory management strategies
Because structural inefficiencies only explain a minor proportion of dwell time (1 to 3 days
for operational inefficiencies and 1 to 2 days for customs inefficiencies) the justification of very long
dwell times is to be found elsewhere. We aim to analyze here the interrelationships between the
three dwell time components presented in section 1b and identify determinant behavioral patterns
to the long dwell times observed.
A first pattern readily observable is the high level of inventory coverage that leads to long
port storage times. As demonstrated in section 3, port storage is indeed the cheapest warehousing
option until 22 or 23 days. As soon as parking fees and demurrage charges do not offset storage costs
in the shippers’ facilities, there is then no incentive other than urgent demand that would justify an
early clearance of cargo from the port. As long as the majority of shippers do not intend to sharply
reduce inventory levels, we unfortunately expect cargo dwell times to remain very high in the Port of
Douala.
The situation would still slightly improve if shippers had full awareness of total logistics costs
associated to long cargo dwell times. We have noticed however that few operators give value to
hedging costs or financial charges in the calculation of their factory prices and even fewer do actually
envisage actions to reduce dwell times with the objective of reducing inventory levels. As a
consequence, dwell time in ports appears simply as an alternative to dwell time in private facilities
and no comprehensive analysis of lead time and inventory levels is done26.
Another symptom of this lack of awareness of total logistics costs is the indifference to
variability of arrival day. Maersk Line is the only shipping line that has implemented for a few years
fixed weekly schedules on its main route that in theory help shippers to improve quality of forecasts
and hence reduce inventory levels. MSC has also implemented a fixed schedule for one of its main
connection more recently. For all other regular calls the arrival day is variable which introduces
uncertainty and variability in operational schedules, to the benefit of the shipping line but to the
detriment of shippers and the terminal operating company.
26
With the noticeable exception of FMCG multinationals which tend to implement advanced inventory management standards in all subsidiaries with weekly re-forecasting cycle. Other companies work generally with fixed quantities fixed delays replenishment plans with some correction of delays in the end of terms (semesters or years) to cope with latest forecasting variations.

21
Shipping route # of calls/month Average vessel size Schedule
Mainline Eur-Af-Eur 18 826 Variable
Mainline Asia-Africa-Asia 13 1 899 Variable
Feeder intra Af 6 510 Variable
Am-Eur-Af 4 624 variable
Mainline Af-Med-Eur-Med-Af 4 2 474 fixed
Med-Af-Med 4 2 248 fixed
Feeder Af-Eur-Af 3 711 variable
Mainline IndSub-ME-Af -IndSub 3 1 903 variable
Am-Af 2 800 variable
Mainline intra Af 2 1 608 variable
Af-Med-Af 1 188 variable
Feeder Asia-Af-Asia 1 954 variable
Mainline North Am-Eur-Af 1 925 variable
Total 62 1 205
Table 10 – Regular calls in the port of Douala (Source: Containerization international – 2010)
Contracting patterns of C&F agents also exhibit some revealing peculiarities. The
introduction of a time efficiency indicator with a weight of 30% in the national evaluation framework
of C&F agents (Label Qualité des Commissionnaires Agréés en Douane) tends to prove that there is a
good awareness of the importance of time efficiency in the satisfaction of shippers. However few
shippers actually manage to introduce compelling time efficiency terms in the contracts with their
C&F agents, especially dominant C&F agents that have a very strong supplier power. Those shippers
that manage to include performance conditions in their C&F contracts actually formulate them in a
way that leaves room for argument (e.g. maximum clearance time to the condition that all
documents are submitted correctly and in a timely manner by shippers). This is why the largest
brokers maintain very high market shares despite poor time performance.27 There are good reasons
to believe that the wider recognition of the national brokers’ label will slowly increase requirements
towards customs brokers but shippers would have to envisage replacing brokers that they have
contracted for years. This seems improbable due to very strong straight re-buy patterns (loyalty of
shippers).
Another major issue is the cash availability issue and shippers’ strategies to reduce financial
exposure. Because of costly trade loans and limited import financing tools shippers are often short in
cash in their daily operations and this is a major hindrance to the reduction of dwell times. In Table 3
we show the bulk of customs declaration lodging is done in the second or third week after container
discharge, while customs clearance process does not take more than 3 days in average. The first
potential saving in first step that takes 13 days in average today and a key element to achieve shorter
27
See table 9.
22
processing is arguably to facilitate the financing of customs dues payment, as it is believed that in
many cases finding the money to pay customs due is the first reason for delaying this step. Savings in
opportunity costs and financial charges associated to delayed clearance are most probably
underestimated in section 3 because this severe cash availability issue and very high opportunity cost
would sometimes offset high demurrage charges after an extended stay in the terminal. Shippers
facing extreme cash availability issues have no choice sometimes but to abandon cargo in the port
because of the incapacity to pay customs dues and clearance charges, which does explain in part the
large number of abnormal delays, or to wait until part of the shipment is sold to pay customs dues.
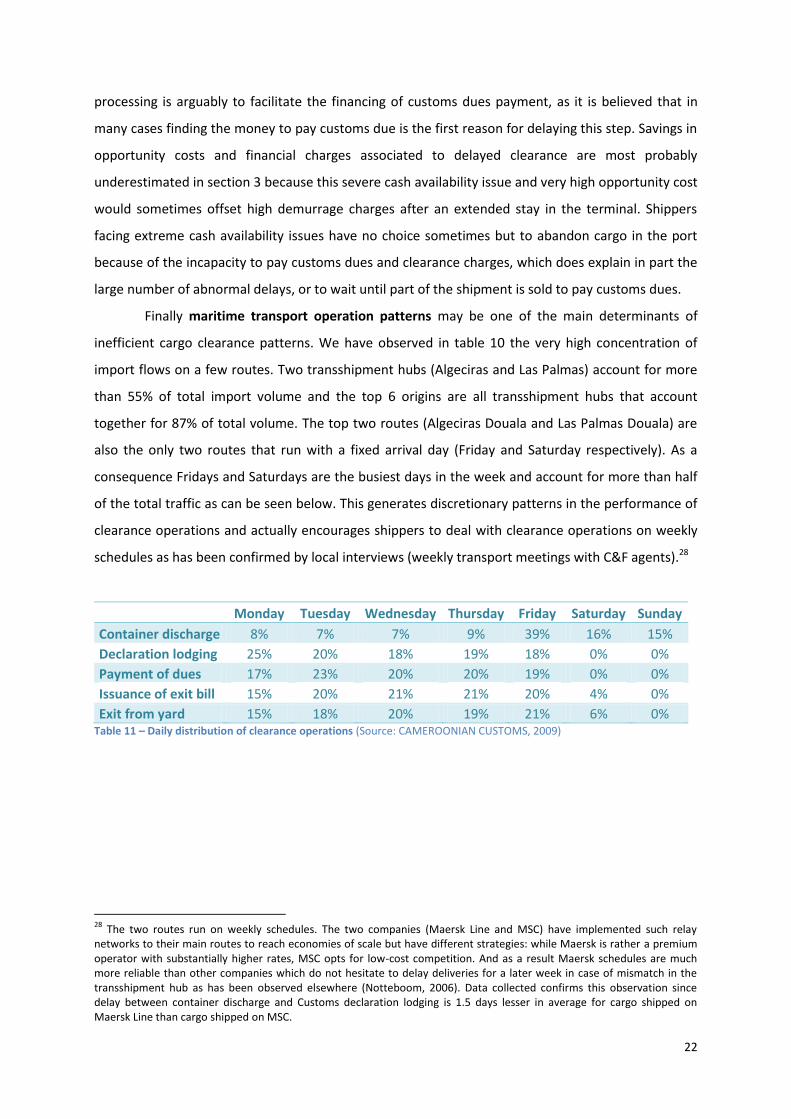
Finally maritime transport operation patterns may be one of the main determinants of
inefficient cargo clearance patterns. We have observed in table 10 the very high concentration of
import flows on a few routes. Two transshipment hubs (Algeciras and Las Palmas) account for more
than 55% of total import volume and the top 6 origins are all transshipment hubs that account
together for 87% of total volume. The top two routes (Algeciras Douala and Las Palmas Douala) are
also the only two routes that run with a fixed arrival day (Friday and Saturday respectively). As a
consequence Fridays and Saturdays are the busiest days in the week and account for more than half
of the total traffic as can be seen below. This generates discretionary patterns in the performance of
clearance operations and actually encourages shippers to deal with clearance operations on weekly
schedules as has been confirmed by local interviews (weekly transport meetings with C&F agents).28
Monday Tuesday Wednesday Thursday Friday Saturday Sunday
Container discharge 8% 7% 7% 9% 39% 16% 15%
Declaration lodging 25% 20% 18% 19% 18% 0% 0%
Payment of dues 17% 23% 20% 20% 19% 0% 0%
Issuance of exit bill 15% 20% 21% 21% 20% 4% 0%
Exit from yard 15% 18% 20% 19% 21% 6% 0% Table 11 – Daily distribution of clearance operations (Source: CAMEROONIAN CUSTOMS, 2009)
28
The two routes run on weekly schedules. The two companies (Maersk Line and MSC) have implemented such relay networks to their main routes to reach economies of scale but have different strategies: while Maersk is rather a premium operator with substantially higher rates, MSC opts for low-cost competition. And as a result Maersk schedules are much more reliable than other companies which do not hesitate to delay deliveries for a later week in case of mismatch in the transshipment hub as has been observed elsewhere (Notteboom, 2006). Data collected confirms this observation since delay between container discharge and Customs declaration lodging is 1.5 days lesser in average for cargo shipped on Maersk Line than cargo shipped on MSC.

23
Graph 5 - Daily distribution of clearance operations (Source: CAMEROONIAN CUSTOMS, 2009)
Further investigation is needed to understand the impact of concentrated container arrivals
on performance of clearance operations. No visible impact is observed in the daily distribution of
other operations29 but such concentration has most probably an important impact on the multimodal
pattern of the dwell time distribution observed in graph 4 (e.g. what may be important to measure in
the Cameroonian context may be the percentage in the week after arrival, two weeks after arrival,
etc…). To finish with maritime transport operations, the vast majority of shippers import their
containers under CIF Incoterms. They have therefore a very low control over container arrival times
which impedes development of pre-clearance habits and adds uncertainty in their planning
processes.
4. USING STATISTICAL ANALYSIS TO VALIDATE SOME OF THE
DETERMINANTS OF DWELL TIME PATTERNS
The automated customs declaration system ASYCUDA has been implemented in Cameroon
for all customs procedures, from manifest lodging to issuance of exit bill. This is quite unique in the
region and offers significant means to improve customs clearance efficiency. It also provides a
consistent database that stakeholders may take advantage of to better understand inefficiencies in
29
Except for a lower frequency of clearance operations on Mondays, which would correspond to a lower productivity of staff on that day.
0
5000
10000
15000
20000
25000
30000
35000
Monday Tuesday Wednesday Thursday Friday Saturday Sunday
Container discharge Declaration lodging Payment of dues
Issuance of exit bill Exit from yard

24
the customs duties collection (which is primarily of interest to customs) but indirectly in the whole
port clearance processes.
In this section we intend to make use of explanatory statistics to analyze shipment level data
collected through ASYCUDA by customs administration and test the assumptions and findings
presented in previous sections and recalled in table 12 below. Different models are tested and areas
for further research are identified.
Factor Type Impact
Fiscal regime Shipment specific High fiscal pressure leads to high dwell time
Bulking of containers Shipment specific LCL containers stay longer in the port
Density of value Shipment specific Higher value leads to higher dwell time
Commodity type Shipment specific Commodity category is a crucial determinant
Concentration of C&F market External Factor Dominant C&F players have a low performance
Low volume per operation External Factor Lack of regularity leads to poor performance
Concentration of shipping flows External Factor Disruption in ship arrivals leads to discrete behaviors
Table 12 – Early assumptions about determinants of long dwell times
Parametric fit using continuous distributions We first attempt to fit the distribution of container dwell times using parametric asymmetric
distributions of continuous data with positive values. The analysis of cargo dwell time qualifies as
survival analysis since the research output is the expected time at which cargo will exit the port
(continuous positive values with right-censoring patterns30). Such methods have not been successful
however at this stage.
Univariate analysis shows for example that standard parametric distributions (Gamma,
Lognormal, and Weibull) are not fitting the dwell time data well. Data is processed to try and attempt
to reduce some discrete patterns but neither seasonality nor simple stratification improves
distribution fit. We also fit a Cox Proportional Hazard (PH) model (refer to Hosmer, Lemeshow 1999
for details) - a semi-parametric model – to Cargo Dwell Time (CDT) with help of covariates identified
in earlier sections (e.g. fiscal regime, full-container-load, density of value, cargo type, C&F agents
30
Survival techniques enable the consistent analysis of expected time before occurrence of a discrete event such as illness, death or in our case, exit from port terminal. They have not been use yet to our knowledge for the analysis of cargo dwell time in ports and further research would be very useful to make use of the powerful scope of analysis. In particular, survival theory copes with biases attached to right or left censoring. In the case of cargo dwell time right censoring is needed since many containers in the sample are not cleared before cut-off date but have to be included in the modeling structure.

25
etc.). However, the model assumption of proportional hazard is not satisfied. The main issue at this
stage is that CDT data population presents discrete variability patterns that are hardly modeled by
parametric or semi-parametric methods.
Stratification can be used for a better fit of parametric or semi-parametric models.
Moreover, other treatments (e.g. using time dependent covariate (Collett 2003)) can be applied.
Parametric fit using discrete models: Logistic regression
Continuous models being unsuccessful in modeling CDT data, discrete analysis of CDT is
attempted. The objective is to identify which are the most significant determinants of very long and
abnormal CDT in the list of variables identified in earlier sections. We transform first the CDT into
three discrete levels (categories); (1) CDT less than or equal to 30 days, (2) CDT between 31 and 90
days, and (3) CDT greater than 90 days. An (Ordinal/Multinomial) Logistic regression model is then
fitted with the CDT as categorical dependent variable (see Annex for details).
Interpretation of modeling results
Container type is significant in both sub-models (level 2 vs. level 1 and level 3 vs. level 1).
This demonstrates that “last-trip” containers, i.e. those containers that are purchased with cargo at a
negotiated rate with shipping line (about $2,000 for a twenty feet container) are expected to stay
longer in the port with a significant confidence level.
Last ports of call are also significant in both models. Cargos originating from Dubai for
example are likely to stay longer as compared with other ports with a justification that needs to be
further investigated.
Fiscal regime is also significant: Containers with finished goods and semi-finished goods are
expected to have longer dwell time as compared to other categories of goods, which is probably to
be linked to the high cost of customs duties that need to be paid as compared to lower fiscal
pressure for raw materials for example.
Containers with higher density of value are also likely to stay longer than containers with
lower density value probably for similar reasons. It is worth noting that the consideration of logistics
cost would lead to the inverse relationship since cargo with high density of value are also those with
highest inventory costs, which corroborates our earlier comment on low awareness of total logistics
cost.

26
To finish with LCL containers are likely to stay longer than FCL containers but they are less
likely to be cleared in more than 90 days. This is probably linked to the more complex clearance
process that implies multiple declarations for the same container and multiple payments of customs
duties (one for each separate declaration) and generates some delay. This delay is less likely to
extend to 90 days since it is very unlikely that all shippers sharing an LCL container face clearance or
payment issues that lead to such dwell time.
Table 13 below gives the estimated beta parameters using the logistic regression model.
Results are very consistent with preliminary conclusions and observed values. In fact for most
covariates, the estimated odds ratio is superior to the observed value, which reinforces the
pertinence of the use of such model: for some covariate categories such as “Last trip container”,
“Finished goods” or “Density of value superior to 6500 FCFA/kg” there are 50% more chances or
more to be a very long dwell time which would justify a separate treatment in the container yard. To
the contrary some categories such as “Last port of call = Singapore”, “Region of origin = Europe” or
“Region of origin = MENA” have about 40% less chances of being very long dwell time containers
than reference. It is more difficult to identify significant categories for abnormal delays but the last
trip category or cargo transshipped through Dubai category are much more likely to be abnormal
delays and this should add understanding to the abnormal delay issue.

27
CDT between 31 and 90 days
CDT > 90 days
Observed odds ratio
Estimated odds ratio
Observed odds ratio
Estimated odds ratio
Container type = Last trip 1.56 1.74 1.82 1.57
Container type = Others Ref Cat Ref Cat Ref Cat Ref Cat
Last port of call = Antwerp 0.93 0.84 0.95 0.95²
Last port of call = Dubai 1.48 1.30 1.94 1.93
Last port of call = Algeciras 1.02 0.90 0.72 0.72
Last port of call = Singapore 0.80 0.63 0.75 0.73
Last port of call = Others Ref Cat Ref Cat Ref Cat Ref Cat
Region of origin = Europe 0.60 0.55 1.29 1.08²
Region of origin = Asia 0.68 0.69 1.20 1.08²
Region of origin = MENA 0.66 0.60 1.28 1.06²
Region of origin = Sub-Saharan Africa 0.61 0.67 1.11 0.93²
Region of origin = others Ref Cat Ref Cat Ref Cat Ref Cat
Fiscal regime = Finished goods 1.35 1.51 1.23 1.26
Fiscal regime = Semi-finished goods 1.16 1.23 1.14 1.13
Fiscal regime = Raw materials 0.88 0.98² 1.24 1.19
Fiscal regime = Necessity goods or duty free 0.96 1.04² 1.06 1.02²
Fiscal regime = duty free Ref Cat Ref Cat Ref Cat Ref Cat
Density of value superior to 6500 FCFA/kg 1.46 1.66 0.87 0.91²
Density of value from 1000 to 6500 FCFA/kg 1.12 1.12 1.12 1.13
Density of value inferior to 1000 FCFA/kg Ref Cat Ref Cat Ref Cat Ref Cat
Full container load 1.56 1.07 1.82 0.93
Less than container load Ref Cat Ref Cat Ref Cat Ref Cat
² Model estimates are not significant at 5% level
Table 13– Observed and estimated Odds ratio using logistic regression model Source: Cameroonian Customs data- statistical analysis using SAS Software
5. CONCLUSION AND POLICY RECOMMENDATIONS
The variety and thoroughness of databases and statistical elements made available in
Cameroon both in customs and with terminal operators for this study is such that only a fraction of
what can be analyzed has been summarized above. The main findings of the study comprise both
elements related to the specific Douala situation and to the methodology used.
Cargo dwell time in the port of Douala for containerized imports is very significant. An
aggregate analysis shows that cargo dwell time exceeds 20 days for a significant proportion of traffic
and average dwell time has been consistently about 20 days in the last 10 years. From a customs
clearance standpoint, the two main contributors to long dwell times are time between ship arrival
and lodging of declaration, and time between payment of customs dues and gate exit. The payment
28
of customs dues itself and the physical submission of documents seem to be time efficient
operations today in Douala thanks to recent reforms. Another approach is to distinguish operational
dwell time (physical operations), transactional dwell time (customs clearance) and discretionary
dwell time (storage). Data consistently show that operational (2-3 days) and transactional (2-4 days)
dwell times are relatively limited and predictable in Douala, which seem to imply that most of the
dwell time can be attributed to « discretionary » time by the C&F or the shippers.
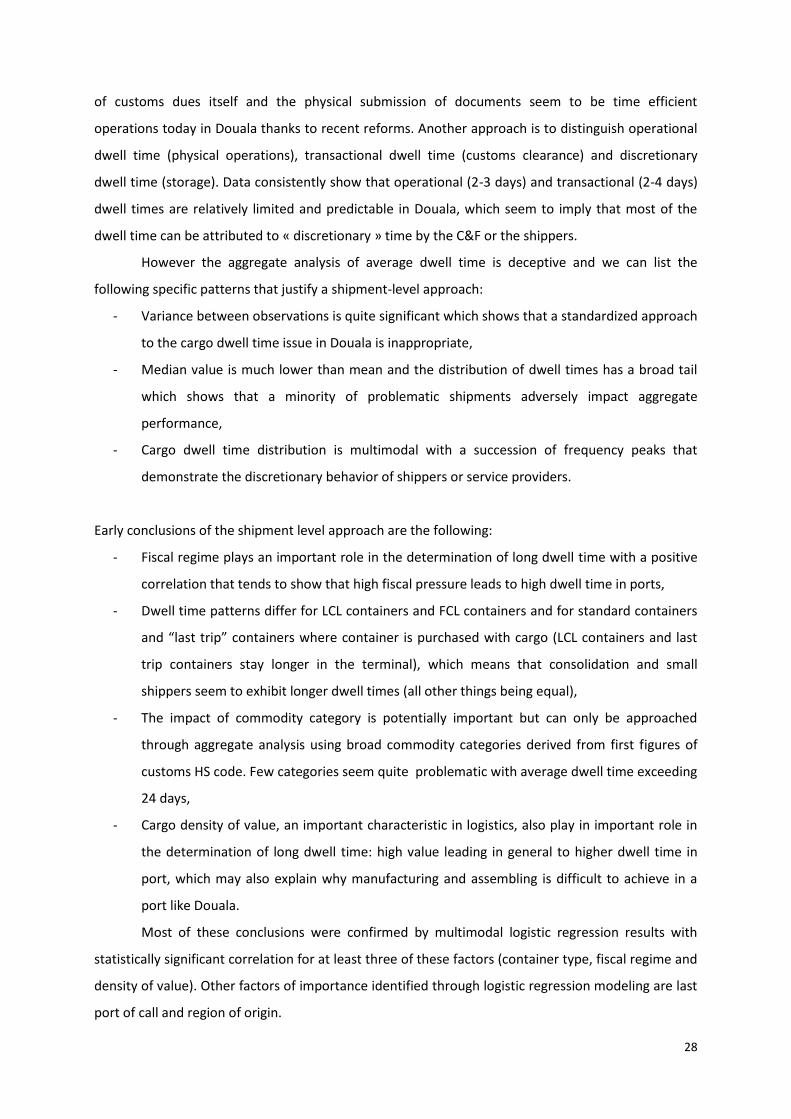
However the aggregate analysis of average dwell time is deceptive and we can list the
following specific patterns that justify a shipment-level approach:
- Variance between observations is quite significant which shows that a standardized approach
to the cargo dwell time issue in Douala is inappropriate,
- Median value is much lower than mean and the distribution of dwell times has a broad tail
which shows that a minority of problematic shipments adversely impact aggregate
performance,
- Cargo dwell time distribution is multimodal with a succession of frequency peaks that
demonstrate the discretionary behavior of shippers or service providers.
Early conclusions of the shipment level approach are the following:
- Fiscal regime plays an important role in the determination of long dwell time with a positive
correlation that tends to show that high fiscal pressure leads to high dwell time in ports,
- Dwell time patterns differ for LCL containers and FCL containers and for standard containers
and “last trip” containers where container is purchased with cargo (LCL containers and last
trip containers stay longer in the terminal), which means that consolidation and small
shippers seem to exhibit longer dwell times (all other things being equal),
- The impact of commodity category is potentially important but can only be approached
through aggregate analysis using broad commodity categories derived from first figures of
customs HS code. Few categories seem quite problematic with average dwell time exceeding
24 days,
- Cargo density of value, an important characteristic in logistics, also play in important role in
the determination of long dwell time: high value leading in general to higher dwell time in
port, which may also explain why manufacturing and assembling is difficult to achieve in a
port like Douala.
Most of these conclusions were confirmed by multimodal logistic regression results with
statistically significant correlation for at least three of these factors (container type, fiscal regime and
density of value). Other factors of importance identified through logistic regression modeling are last
port of call and region of origin.

29
These conclusions led us to propose the following policy recommendations:
- General average dwell time objective at platform level, in a not congested context, should be
dropped. The objectives to be set in relation to dwell time would need to be revisited with
differentiated targets according shipper and shipment characteristics (e.g. clearance in less
than 4 days is a reasonable objective for some industrial companies),
- Target shippers and C&F to encourage more efficient behaviors. Reforms would indeed only
be useful if shippers and C&F agents share the common objective of making dwell time in
ports minimum. They need to have incentives to do that and awareness campaigns on the
potential impact of fast clearance on factory prices or customer service level should be
organized. The calculation of full logistics cost should replace the evaluation of demurrage
and parking costs currently used to assess port transit costs. The use of pre-arrival clearance
or best practices in logistics management (such as reduction of inventory level) should be
encouraged.
- An alternative position is to adopt a demand-driven approach where short dwell time is no
longer an objective as such but rather a mean to meet expectations of those shippers that
want to keep cargo dwell time in ports minimal. Setting an overambitious and unattainable
dwell time for all shippers seems indeed pointless and setting differentiated targets to
maximize port user satisfaction appears a more sensible objective. Main industrial
companies for example are more likely to adopt short dwell time objectives because of the
high regularity of their imports (same materials, fixed replenishment intervals) while small
commercial companies will probably need support to keep dwell time in ports minimal for
the few containers they order every year.
- Available statistical tools can help customs profile shippers’ behaviors and help terminal
operators improve yard productivity therefore delaying capacity investments. However, the
latter is only possible if data on cargo characteristics is made available to terminal operating
companies and used to segregate full containers according expected dwell time. In that
respect this study has only used very partially the potential of data available in ASYCUDA and
Cameroon customs are encouraged to further the investigation of databases.
Further research is needed to better address the long cargo dwell time issue in Sub-Saharan African
ports:
- Further research is needed to investigate governance issues, for example to see if long delays
between arrival and lodging can be interpreted because of ongoing negotiations with agents
with a view to lower overall import cost for shipment. Likewise, long time between duties
payment and exit may be related to redundant controls.

30
- The role of shipping lines in the determination of port dwell time needs to be analyzed,
probably at a regional level because of interrelationships between successive ports in same
services, and a specific focus on demurrage policies, container selling policies, or network
design will help better understand the specific context of African shipping market (70% of
import traffic uses one of the two main weekly calls in Douala). The reengineering of liner
shipping networks is expected to have a major impact on port performance and shippers’
behaviors and upcoming developments (port extensions, transshipment hub developments,
competition between shipping lines, etc.) need to be closely looked at.
- The use of explanatory statistics does call for more work related to data mining, survival
analysis and risk analysis (for container terminal operators and customs organization).
Comparable data should be generated in other countries for regional comparison and time
series are needed for consistent recommendations. Modern reforms such as the
implementation of performance-based contracts or segregation storage strategies in
terminals could be appraised using statistical models.
- As mentioned earlier, if the government wants to attract/generate manufacturing goods
investments, there is a need to assess investment elasticity to cargo dwell time (probably
taking as a reference achievable dwell time rather than median or mean dwell time). The role
of dwell time in the determination of trade flows is yet to be analyzed.

31
BIBLIOGRAPHY
Agresti, A., 2002, Categorical Data Analysis. John Wiley & Sons, New York, 2nd edition. Arvis, J.--F., Raballand, G. and Marteau, J.-F., 2010, “The Cost of Being Landlocked:”, Washington D.C.: The World Bank. Cameroon customs, 2010, Customs and Business Challenge, accessible online at http://www.douanescustoms-cm.net/fr/espace-media/publications.html Collett D., 2003, Modelling Survival Data in Medical Research. London: Chapman & Hall, 146 pp. Dally, H. K. 1983, Container Handling and Transport— A Manual of Current Practice, London: Cargo Systems IIR Publications Ltd. Dharmalingam, K. 1987, Design of Storage Facilities for Containers — a Case Study of Port Louis Harbour, Mauritius, Ports and Harbors. Djankov, S., Freund, C. and Pham, C. 2006, “Trading on Time.” Policy Research Working Paper 3909. Washington D.C. : The World Bank. Hosmer JR. D.W., Lemeshow, S., 1999, Applied Survival Analysis; Regression Modeling of Time to Event Data. New York: John Wiley & Sons. Hosmer, D.W. and Lemeshow, S., 2000, Applied Logistic Regression. New York: John Wiley & Sons, 2nd edition. Huynh, N. 2006, “Boosting Marine Container Terminals Throughput – A Survey of Strategies”. Proceedings of the Transportation Research Board Annual Meeting, paper 06-2744. Long, J. S. (1997). Regression Models of Categorical and Limited Dependent Variables. Sage, Thousand Oaks, CA. United Nations Conference on Trade and Development (UNCTAD), 1995, Strategic Port Pricing, Report by the UNCTAD secretariat, accessible online at www.unctad.org UNCTAD, 2003, African Ports: Reform and the Role of the Private Sector, Report by the UNCTAD secretariat, accessible online at www.unctad.org UNCTAD, 2009, Review of Maritime Transport, Report by the UNCTAD Secretariat, 2009 edition, accessible online at www.unctad.org

32
Annex – Logistic regression analysis of cargo dwell time observations
The objective of logistic regression is to model a dependent variable (DV) in terms of one or more covariates. Logistic regression is used when the DV is categorical. The DV may have two or more categories. For example, default/good (customers), low/medium/high, unsatisfied/satisfied/ very satisfied. Dependent variables can be ordered (e.g. low/medium/high) or unordered (married/single/others). Ordinary least square cannot be applied to these models as the assumption of normally distributed residuals is not satisfied. Logistic regression is fitted by transforming the DV into log of the odds ratio of being in a particular category for given values of covariates. The odds ratios are used in order to allow linear relationship between log of the odds ratio and covariates31.
Ordinal Logistic regression model is fitted when categories in DV are ordered and the proportional odds assumption is satisfied (Hosmer and Lemeshow 2000). However, in case of CDT levels, this assumption is violated, as we reject the null hypothesis (p-value < 0.05) that location parameters are same across three CDT levels (Annex - Table 1). Hence, we fit a Multinomial Logistic (ML) regression model to CDT levels as proportional odds assumption is not required for this model.
When a DV has M categories, one value of the DV is designated as the reference category. Typically, the first, the last, or the value with the highest frequency is taken as the reference category. The probability of membership in other categories is compared to the probability of membership in the reference category. In order to describe the relationship between the DV and the covariates, the calculation of M-1 equations (sub models), one for each category relative to the reference category is required. Taking the first category as reference we then have, for m = 2, …, M,
1
( )ln
( 1)
Ki
m mk ik
ki
P Y mX
P Y
Where Xik, βmk, and αm are kth covariate (from K number of covariates in this model) for observation i, regression parameter (slope) corresponding to covariate Xk and DV level m, and intercept for DV level m, respectively. For each observation, there will be M-1 predicted log odds, one for each category relative to the reference category.
Results Effect Model Fitting Criteria Likelihood Ratio Tests
-2 Log Likelihood of Reduced Model Chi-Square df Sig. (p-value)
Intercept 6.788E3 .000 0 . container type 6.827E3 39.156 2 .000 Last port of call 7.196E3 407.861 8 .000 Region of origin 6.924E3 136.183 8 .000 fiscal regime 6.975E3 186.797 8 .000 dens_val 6.851E3 62.863 4 .000 FCL_ind 6.804E3 16.021 2 .000
Table 14 - – Likelihood Ratio Test ML regression model was fitted with CDT levels (1, 2, and 3 with level 1 as the reference
category) as a DV and covariates such as fiscal regime, container load (FCL or LCL), density of value, cargo type, container type, C&F agents, Region of origin, and Last port of call. Two sub models are fitted in this ML regression model for every additional category of CDT (CDT <30 days taken as reference): Sub model 1: Log odds ratio of CDT between 30 and 90 days with respect to CDT <= 30 days
31
Please refer to Hosmer and Lemeshow (2000), Agresti (2002), or Long (1997) for further details on Logistic regression.

33
Sub model 2: Log odds ratio of CDT > 90 days with respect to CDT <= 30 days
Likelihood ratio test (Table 14) is used to select significant covariates. Among all covariates tested, container type (rented container or container with cargo), Last port of call (Algeciras, Las Palmas, Antwerp, Singapore, others), Region of Origin (Europe, Asia, Middle-East and North Africa, Sub-Saharan Africa and other regions), fiscal regime (see table 4), density of value (…) and FCL indice (Full container load or Less than container load) are the statistically significant covariates kept for modeling at 5% level (p-value<0.05)32. Multinomial Logistic Regression Output
N Marginal Percentage
CDT Level CDT <= 30 days 35832 69.3% CDT between 31 and 90 days 5457 10.6% CDT > 90 days 10400 20.1%
Cargo Container Type Last trip 730 1.4% Others 50959 98.6%
Last port of call Antwerp 7307 14.1% Dubai 1577 3.1% Algeciras 17616 34.1% Singapore 5626 10.9% Others 19563 37.8%
Region of origin Europe 28254 54.7% Asia 13679 26.5% Middle East and North Africa 3465 6.7% Africa 3201 6.2% Others 3090 6.0%
Fiscal regime Over 45,7% (finished goods) 20708 40.1%
33,7% to 45,7% (semi-finished goods) 5545 10.7% 27,8% to 33,7 % (raw materials) 13406 25.9% 0 to 27,8% (necessity goods or duty free 7809 15.1% 0% (duty free) 4221 8.2%
Density of value Superior to 6500 FCFA/kg 1308 2.5%
From 1000 to 6500 FCFA/kg 13079 25.3% Inferior to 1000 FCFA/fg 37302 72.2%
Full-container-load LCL 22296 43.1%
FCL 29393 56.9% Valid 51689 100.0%
Missing 0
Total 51689
Subpopulation 536a
Table 15 – Observed frequencies for CDT data (Source: Cameroonian Customs data, 2009).
Model Model Fitting Criteria Likelihood Ratio Tests
-2 Log Likelihood Chi-Square df Sig. (p-value)
Intercept Only 7.666E3 Final 6.788E3 878.201 32 .000
Table 16 - Model Fitting Information
CDT Levela B Std.
Error Wald df Sig. (p-
value) Exp(B) 95% Confidence
Interval for Exp(B) Lower Bound
Upper Bound
32
However, some covariates are significant only in one of the sub models (e.g., Region of origin is significant in the first model but not in the second model as p-value > 0.05 See Annex 2 for detailed results.
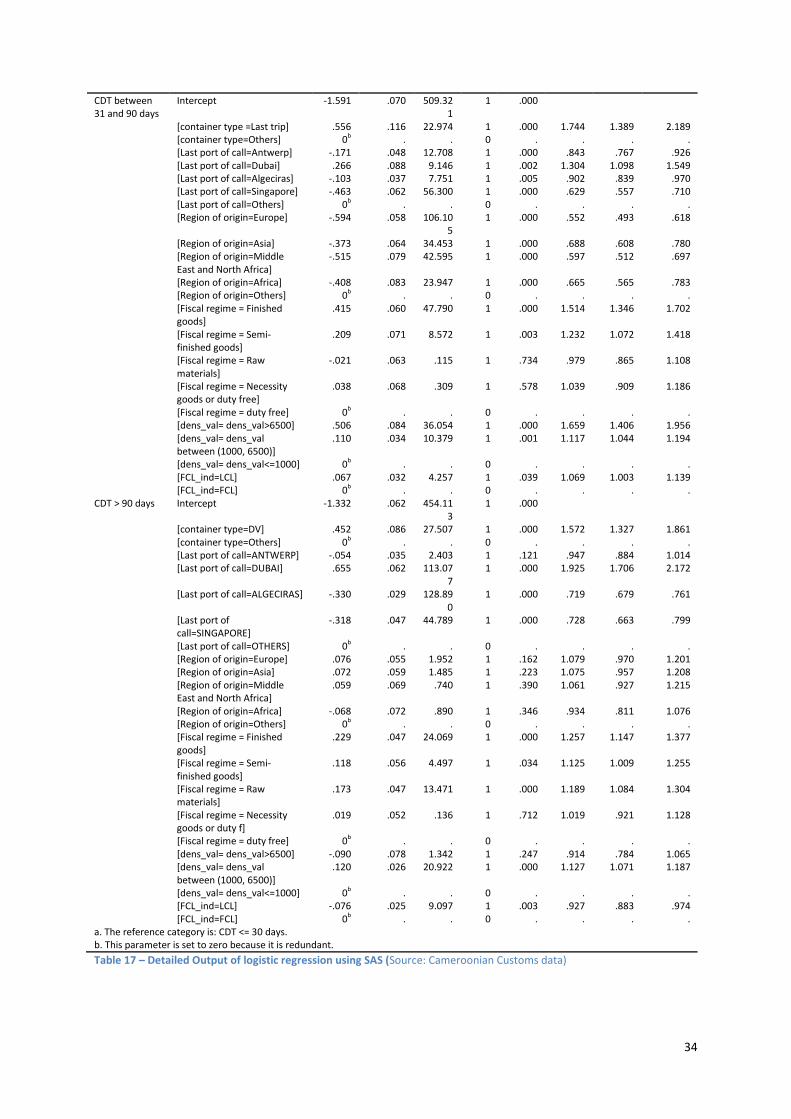
34
CDT between 31 and 90 days
Intercept -1.591 .070 509.321
1 .000
[container type =Last trip] .556 .116 22.974 1 .000 1.744 1.389 2.189 [container type=Others] 0b . . 0 . . . . [Last port of call=Antwerp] -.171 .048 12.708 1 .000 .843 .767 .926 [Last port of call=Dubai] .266 .088 9.146 1 .002 1.304 1.098 1.549 [Last port of call=Algeciras] -.103 .037 7.751 1 .005 .902 .839 .970 [Last port of call=Singapore] -.463 .062 56.300 1 .000 .629 .557 .710 [Last port of call=Others] 0b . . 0 . . . . [Region of origin=Europe] -.594 .058 106.10
5 1 .000 .552 .493 .618
[Region of origin=Asia] -.373 .064 34.453 1 .000 .688 .608 .780 [Region of origin=Middle East and North Africa]
-.515 .079 42.595 1 .000 .597 .512 .697
[Region of origin=Africa] -.408 .083 23.947 1 .000 .665 .565 .783 [Region of origin=Others] 0b . . 0 . . . . [Fiscal regime = Finished goods]
.415 .060 47.790 1 .000 1.514 1.346 1.702
[Fiscal regime = Semi-finished goods]
.209 .071 8.572 1 .003 1.232 1.072 1.418
[Fiscal regime = Raw materials]
-.021 .063 .115 1 .734 .979 .865 1.108
[Fiscal regime = Necessity goods or duty free]
.038 .068 .309 1 .578 1.039 .909 1.186
[Fiscal regime = duty free] 0b . . 0 . . . . [dens_val= dens_val>6500] .506 .084 36.054 1 .000 1.659 1.406 1.956 [dens_val= dens_val between (1000, 6500)]
.110 .034 10.379 1 .001 1.117 1.044 1.194
[dens_val= dens_val<=1000] 0b . . 0 . . . . [FCL_ind=LCL] .067 .032 4.257 1 .039 1.069 1.003 1.139 [FCL_ind=FCL] 0b . . 0 . . . .
CDT > 90 days Intercept -1.332 .062 454.113
1 .000
[container type=DV] .452 .086 27.507 1 .000 1.572 1.327 1.861 [container type=Others] 0b . . 0 . . . . [Last port of call=ANTWERP] -.054 .035 2.403 1 .121 .947 .884 1.014 [Last port of call=DUBAI] .655 .062 113.07
7 1 .000 1.925 1.706 2.172
[Last port of call=ALGECIRAS] -.330 .029 128.890
1 .000 .719 .679 .761
[Last port of call=SINGAPORE]
-.318 .047 44.789 1 .000 .728 .663 .799
[Last port of call=OTHERS] 0b . . 0 . . . . [Region of origin=Europe] .076 .055 1.952 1 .162 1.079 .970 1.201 [Region of origin=Asia] .072 .059 1.485 1 .223 1.075 .957 1.208 [Region of origin=Middle East and North Africa]
.059 .069 .740 1 .390 1.061 .927 1.215
[Region of origin=Africa] -.068 .072 .890 1 .346 .934 .811 1.076 [Region of origin=Others] 0b . . 0 . . . . [Fiscal regime = Finished goods]
.229 .047 24.069 1 .000 1.257 1.147 1.377
[Fiscal regime = Semi-finished goods]
.118 .056 4.497 1 .034 1.125 1.009 1.255
[Fiscal regime = Raw materials]
.173 .047 13.471 1 .000 1.189 1.084 1.304
[Fiscal regime = Necessity goods or duty f]
.019 .052 .136 1 .712 1.019 .921 1.128
[Fiscal regime = duty free] 0b . . 0 . . . . [dens_val= dens_val>6500] -.090 .078 1.342 1 .247 .914 .784 1.065 [dens_val= dens_val between (1000, 6500)]
.120 .026 20.922 1 .000 1.127 1.071 1.187
[dens_val= dens_val<=1000] 0b . . 0 . . . . [FCL_ind=LCL] -.076 .025 9.097 1 .003 .927 .883 .974 [FCL_ind=FCL] 0b . . 0 . . . .
a. The reference category is: CDT <= 30 days. b. This parameter is set to zero because it is redundant.
Table 17 – Detailed Output of logistic regression using SAS (Source: Cameroonian Customs data)