PDF (1.127 MB)
14
Knowledge and Management of Aquatic Ecosystems (2013) 411, 06 http://www.kmae-journal.org c ONEMA, 2013 DOI: 10.1051/kmae/2013073 Phytoplankton community and limnology of Chatla floodplain wetland of Barak valley, Assam, North-East India H. Sultana Laskar (1) , S. Gupta (1), Received February 20, 2013 Revised July 6, 2013 Accepted July 15, 2013 ABSTRACT Key-words: limnology, habitats, phyotplankton, community, Chatla floodplain wetland Phytoplankton diversity was investigated over a period of two years (2006 to 2008) in Chatla floodplain wetland in Barak valley, Assam, North-East India. Site 1 and site 2 are two inlets and site 3 is a lentic system associ- ated with vegetation cover of Calamus tenuis and Baringtonia acutangula. The floodplain has a unique hydrology because of the presence of differ- ent types of habitats (inlets, fisheries, beels and outlets) which maintains a network among the floodplains, rivers and streams. Phytoplankton com- munity composition, density and diversity were studied in relation to envi- ronmental variables. All the variables were estimated by following standard methods. Phytoplankton was collected by plankton net and quantitative estimation was made by using Sedgwick Rafter counting cell. Phytoplank- ton community comprised 53 taxa represented by Chlorophyceae (31), Cyanophyceae (11), Bacillariophyceae (7), Euglenophyceae (1) and Dino- phyceae (3). Phytoplankton taxa was dominated by Volvox sp., Nostoc sp., Eunotia sp., Navicula sp., Euglena spp. and density was found highest in site 3 and lowest in site 1. Shannon diversity index (H ) for phytoplank- ton community varied between 2.4 to 2.65 indicating fairly high species diversity. The varying magnitude of correlationship among environmen- tal variables and phytoplankton species density as shown by Canonical correspondence analysis (CCA) indicated that some of the environmental variables (water temperature, transparency, rainfall, nitrate and ammonia) are the driving factors for governing the phytoplankton species assem- blages in Chatla floodplain wetland. Fluctuation of phytoplankton density and community composition in different habitats indicated various niche apportionment as well as anthropogenic influences. RÉSUMÉ La communauté phytoplanctonique et la limnologie de la zone humide de la plaine d’inon- dation Chatla dans la vallée de Barak, Assam, nord-est de l’Inde Mots-clés : habitats, limnologie, phytoplancton, communauté, La diversité du phytoplancton a été étudiée sur une période de deux ans (2006 à 2008) dans la zone humide de la plaine d’inondation Chatla dans la vallée de Barak, dans l’Assam, au nord-est de l’Inde. Le site 1 et le site 2 sont deux arri- vées d’eau et le site 3 est un système lentique associé à la couverture végétale de Calamus tenuis et Baringtonia acutangula. La plaine alluviale a une hydrologie unique en raison de la présence de différents types d’habitats, qui maintiennent un réseau entre les plaines inondables, les rivières et les fleuves. La composition (1) Department of Ecology and Environmental Science, Assam University, Silchar – 788011, India Corresponding author: [email protected] Article published by EDP Sciences
Transcript of PDF (1.127 MB)

Knowledge and Management of Aquatic Ecosystems (2013) 411, 06 http://www.kmae-journal.orgc© ONEMA, 2013
DOI: 10.1051/kmae/2013073
Phytoplankton community and limnology of Chatlafloodplain wetland of Barak valley, Assam,North-East IndiaH. Sultana Laskar(1), S. Gupta(1),�
Received February 20, 2013
Revised July 6, 2013
Accepted July 15, 2013
ABSTRACT
Key-words:limnology,habitats,phyotplankton,community,Chatla floodplainwetland
Phytoplankton diversity was investigated over a period of two years (2006to 2008) in Chatla floodplain wetland in Barak valley, Assam, North-EastIndia. Site 1 and site 2 are two inlets and site 3 is a lentic system associ-ated with vegetation cover of Calamus tenuis and Baringtonia acutangula.The floodplain has a unique hydrology because of the presence of differ-ent types of habitats (inlets, fisheries, beels and outlets) which maintains anetwork among the floodplains, rivers and streams. Phytoplankton com-munity composition, density and diversity were studied in relation to envi-ronmental variables. All the variables were estimated by following standardmethods. Phytoplankton was collected by plankton net and quantitativeestimation was made by using Sedgwick Rafter counting cell. Phytoplank-ton community comprised 53 taxa represented by Chlorophyceae (31),Cyanophyceae (11), Bacillariophyceae (7), Euglenophyceae (1) and Dino-phyceae (3). Phytoplankton taxa was dominated by Volvox sp., Nostoc sp.,Eunotia sp., Navicula sp., Euglena spp. and density was found highest insite 3 and lowest in site 1. Shannon diversity index (H′) for phytoplank-ton community varied between 2.4 to 2.65 indicating fairly high speciesdiversity. The varying magnitude of correlationship among environmen-tal variables and phytoplankton species density as shown by Canonicalcorrespondence analysis (CCA) indicated that some of the environmentalvariables (water temperature, transparency, rainfall, nitrate and ammonia)are the driving factors for governing the phytoplankton species assem-blages in Chatla floodplain wetland. Fluctuation of phytoplankton densityand community composition in different habitats indicated various nicheapportionment as well as anthropogenic influences.
RÉSUMÉ
La communauté phytoplanctonique et la limnologie de la zone humide de la plaine d’inon-dation Chatla dans la vallée de Barak, Assam, nord-est de l’Inde
Mots-clés :habitats,limnologie,phytoplancton,communauté,
La diversité du phytoplancton a été étudiée sur une période de deux ans (2006à 2008) dans la zone humide de la plaine d’inondation Chatla dans la vallée deBarak, dans l’Assam, au nord-est de l’Inde. Le site 1 et le site 2 sont deux arri-vées d’eau et le site 3 est un système lentique associé à la couverture végétalede Calamus tenuis et Baringtonia acutangula. La plaine alluviale a une hydrologieunique en raison de la présence de différents types d’habitats, qui maintiennentun réseau entre les plaines inondables, les rivières et les fleuves. La composition
(1) Department of Ecology and Environmental Science, Assam University, Silchar – 788011, India� Corresponding author: [email protected]
Article published by EDP Sciences
H. Sultana Laskar and S. Gupta : Knowl. Managt. Aquatic Ecosyst. (2013) 411, 06
plained’inondationChatla
de la communauté phytoplanctonique, la densité et la diversité ont été étudiéesen fonction des variables d’environnement. Toutes les variables ont été estiméesen suivant des méthodes standard. Le phytoplancton a été recueilli par un fi-let à plancton et l’estimation quantitative a été réalisée en utilisant une cellulede comptage Sedgwick Rafter. La communauté phytoplanctonique comprend53 taxons représentés par des Chlorophyceae (31), Cyanophycées (11), Bacilla-riophyceae (7), Euglenophyceae (1) et Dinophyceae (3). Les taxons phytoplanc-toniques sont dominés par Volvox sp., Nostoc sp., Eunotia sp., Navicula sp.,Euglena sp. et la densité est la plus forte dans le site 3 et la plus faible dansle site 1. L’indice de diversité de Shannon (H′) pour la communauté phytoplanc-tonique varie entre 2,4 à 2,65 indiquant une diversité spécifique assez grande.L’ampleur variable de la corrélation entre les variables environnementales et ladensité des espèces de phytoplancton, comme indiqué par l’analyse canoniquede correspondance (CCA), indique que certaines des variables environnementales(température de l’eau, la transparence, la pluie, le nitrate et l’ammoniac) sont lesfacteurs déterminant les assemblages d’espèces de phytoplancton dans la plained’inondation Chatla. La variation de la densité du phytoplancton et de la compo-sition de la communauté dans les différents habitats indique diverses répartitionsde niche ainsi que les influences anthropiques.
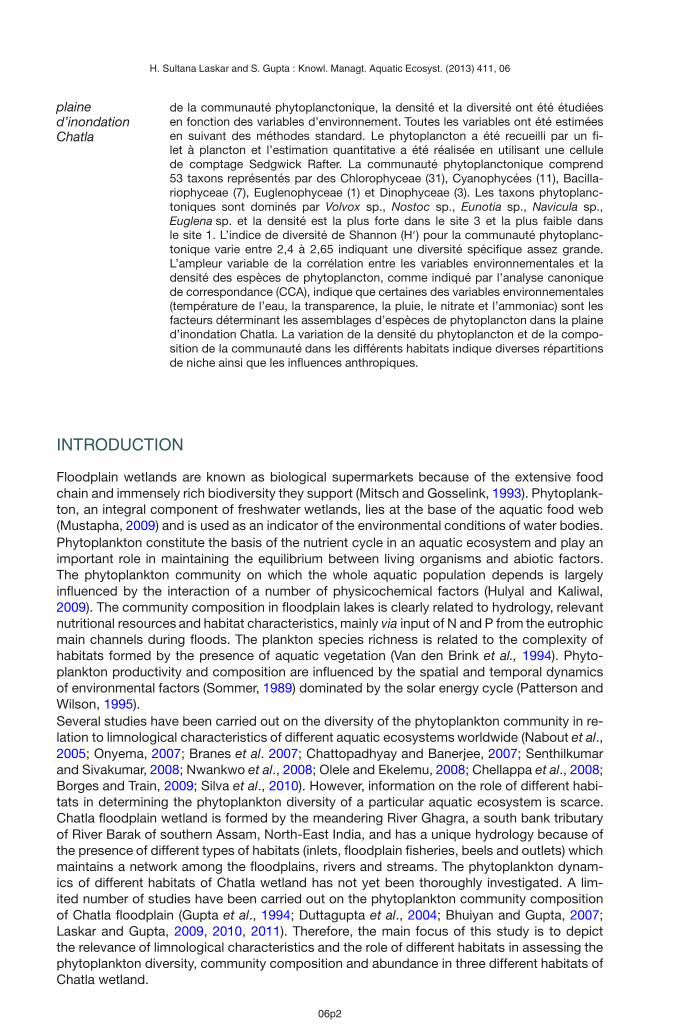
INTRODUCTION
Floodplain wetlands are known as biological supermarkets because of the extensive foodchain and immensely rich biodiversity they support (Mitsch and Gosselink, 1993). Phytoplank-ton, an integral component of freshwater wetlands, lies at the base of the aquatic food web(Mustapha, 2009) and is used as an indicator of the environmental conditions of water bodies.Phytoplankton constitute the basis of the nutrient cycle in an aquatic ecosystem and play animportant role in maintaining the equilibrium between living organisms and abiotic factors.The phytoplankton community on which the whole aquatic population depends is largelyinfluenced by the interaction of a number of physicochemical factors (Hulyal and Kaliwal,2009). The community composition in floodplain lakes is clearly related to hydrology, relevantnutritional resources and habitat characteristics, mainly via input of N and P from the eutrophicmain channels during floods. The plankton species richness is related to the complexity ofhabitats formed by the presence of aquatic vegetation (Van den Brink et al., 1994). Phyto-plankton productivity and composition are influenced by the spatial and temporal dynamicsof environmental factors (Sommer, 1989) dominated by the solar energy cycle (Patterson andWilson, 1995).Several studies have been carried out on the diversity of the phytoplankton community in re-lation to limnological characteristics of different aquatic ecosystems worldwide (Nabout et al.,2005; Onyema, 2007; Branes et al. 2007; Chattopadhyay and Banerjee, 2007; Senthilkumarand Sivakumar, 2008; Nwankwo et al., 2008; Olele and Ekelemu, 2008; Chellappa et al., 2008;Borges and Train, 2009; Silva et al., 2010). However, information on the role of different habi-tats in determining the phytoplankton diversity of a particular aquatic ecosystem is scarce.Chatla floodplain wetland is formed by the meandering River Ghagra, a south bank tributaryof River Barak of southern Assam, North-East India, and has a unique hydrology because ofthe presence of different types of habitats (inlets, floodplain fisheries, beels and outlets) whichmaintains a network among the floodplains, rivers and streams. The phytoplankton dynam-ics of different habitats of Chatla wetland has not yet been thoroughly investigated. A lim-ited number of studies have been carried out on the phytoplankton community compositionof Chatla floodplain (Gupta et al., 1994; Duttagupta et al., 2004; Bhuiyan and Gupta, 2007;Laskar and Gupta, 2009, 2010, 2011). Therefore, the main focus of this study is to depictthe relevance of limnological characteristics and the role of different habitats in assessing thephytoplankton diversity, community composition and abundance in three different habitats ofChatla wetland.
06p2

H. Sultana Laskar and S. Gupta : Knowl. Managt. Aquatic Ecosyst. (2013) 411, 06
Figure 1Map showing different sampling sites of Chatla floodplain wetland, Cachar, Assam, North-East India.
MATERIALS AND METHODS
Water samples in three replicates were collected seasonally (in PET bottles) from 3 (three)selected sampling sites of Chatla floodplain from September 2006 to August 2008 wheresite 1, Baluchuri (BC), and site 2, Dargakona (DGK), are lotic systems and site 3, an areawith Calamus tenuis-Baringtonia acutangula associations (RB), is a lentic system (Figure 1).Surface water temperature and transparency were measured in situ by using a mercury ther-mometer and a Secchi disc, respectively. Turbidity was measured by a Turbidimeter (Systron-ics). Samples for dissolved oxygen (DO) were fixed in the field and estimated by Winkler’s
06p3

H. Sultana Laskar and S. Gupta : Knowl. Managt. Aquatic Ecosyst. (2013) 411, 06
method (Winkler, 1888). Total alkalinity (TA), pH, electrical conductivity (EC), total dissolvedsolids (TDS), free carbon dioxide (FCO2), chloride content (Cl−2 ) and biochemical oxygen de-mand (BOD) were measured by standard methods (APHA, 2005). Total hardness (TH) wasdetermined by the EDTA titration method (Romesh and Anbu, 1996). Nutrients such as nitrate-nitrogen (NO−3 ), phosphate-phosphorus (PO3−
4 ) and ammonium-nitrogen (NH+4) were deter-
mined by the spectrophotometric method (Golterman et al., 1978; Michael, 1984; APHA,2005).For phytoplankton collection, 20 (twenty) litres of water sample in three replicates from eachsite was filtered through a standard plankton net (mesh size 40 µm) and preserved in 4%formaldehyde solution (Van Den Brink et al., 1992; Lund and Davies, 2000). Qualitative andquantitative estimation of phytoplankton was carried out with the help of a “Sedgwick Rafter”counting cell and identified using the standard literature (Edmondson, 1959; Anand, 1998).The phytoplankton community structure was analysed using the Shannon-Wiener Index ofDiversity (H/), Margalef’s species richness index (d), the Evenness index (J/) and the Berger-Parker index of dominance (DBP) (Magurran, 2004). One-way analysis of variance (ANOVA)was performed using SPSS v. 12.0. CCA (Canonical correspondence analysis) was performedusing CANOCO v. 4.5.
RESULTS AND DISCUSSION
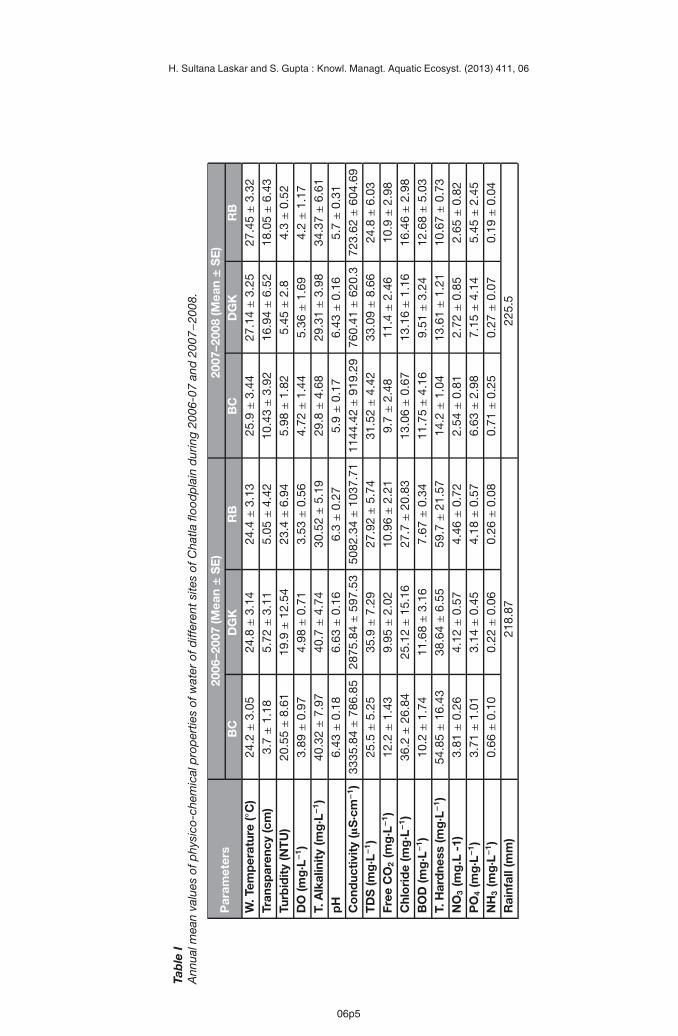
The limnological characteristics of different habitats of Chatla floodplain wetland are shownin Table I. Water temperature did not show much variation, ranging between 24.2 ◦C–24.8 ◦C(2006−2007) and 25.9 ◦C−27.45 ◦C (2007−2008). Low transparency was found in 2006−2007(range: 3.7−5.72 cm), indicating high density of phytoplankton, and higher values in2007−2008 (10.43−18.05 cm) indicated lower density of phytoplankton. The range of tur-bidity was found to be higher in 2006−2007 (19.9−23.4 NTU) than that of 2007−2008(4.3−5.98 NTU), indicating higher abundance of phytoplankton in the previous year of study.DO concentration ranged between 3.52 mg·L−1 and 4.98 mg·L−1 (2006−2007) and 4.2 mg·L−1
and 5.36 mg·L−1 (2007−2008), with the highest mean DO concentration in site 2 (DGK) inboth the cycles. This suggested that oxygen saturation increased due to thorough mixing ofwater due to the favourable impact of the monsoon rains (Thomaz et al., 2007) because thisinlet is connected with Chatla floodplain wetland during monsoon. TA was found to be belowthe optimum level (<50.0 mg·L−1) (30.52−40.7 mg·L−1 in 2006−2007 and 29.3−34.4 mg·L−1 in2007−2008) and pH of different sites was found to be in the range of 6.3−6.63 (slightly acidicto nearly neutral) in 2006−2007 and acidic to nearly neutral (5.7−6.43) in 2007−2008, whichcould be due to digging of sediment for construction of RCC bridges over the inlets. HighEC values in all the sites indicated a high concentration of salts present in the water bodies.However, the range of TH and Cl−2 concentrations were well within the permissible limit, whichabruptly declined in 2007−2008, suggesting wash-out during the large flood event of 2007.Similarly, NO−3 concentration ranged from 3.81 mg·L−1 to 4.46 mg·L−1 and 2.54 mg·L−1 to2.72 mg·L−1 in 2006−2007 and in 2007−2008, respectively, much lower than the permissiblelimit (45.0 mg·L−1). However, the range of PO3−
4 (3.14−4.18 mg·L−1 and 5.45−7.15 mg·L−1) andNH+
4 (0.22–0.66 mg·L−1 and 0.19−0.79 mg·L−1) concentrations in different habitats of Chatlawetland was found to be higher and was several times higher than the optimum value in site 1(BC), indicating the eutrophic nature of the water body. This is further confirmed by the rangeof high BOD (7.67−11.68 mg·L−1 and 9.51−12.68 mg·L−1) in both the cycles, suggesting highorganic load due to accumulation of dead organic matter from nearby areas and increase inmicrobial activity.A total of 53 phytoplankton taxa were identified belonging to Chlorophyceae (31),Cyanophyceae (11), Bacillariophyceae (7), Euglenophyceae (1) and Dinophyceae (3). Out ofthese, 38 and 45 taxa of phytoplankton were recorded during 2006−2007 and 2007−2008,respectively, of which site 3 (RB) contributed the highest relative abundance (44.3% and65.6%), followed by site 2 (DGK –33.9% and 19.73%). Site 1 (BC –21.84% and 14.72%) wasthe lowest contributor of phytoplankton density in both the years of study (Table II and III).
06p4
H. Sultana Laskar and S. Gupta : Knowl. Managt. Aquatic Ecosyst. (2013) 411, 06
Tab
leI
Ann
ualm
ean
valu
esof
phy
sico
-che
mic
alp
rop
ertie
sof
wat
erof
diff
eren
tsi
tes
ofC
hatla
flood
pla
ind
urin
g20
06-0
7an
d20
07−2
008.
Par
amet
ers
2006
–200
7(M
ean±
SE
)20
07–2
008
(Mea
n±
SE
)B
CD
GK
RB
BC
DG
KR
BW
.Tem
per
atur
e(◦
C)
24.2±
3.05
24.8±
3.14
24.4±
3.13
25.9±
3.44
27.1
4±
3.25
27.4
5±
3.32
Tran
spar
ency
(cm
)3.
7±
1.18
5.72±
3.11
5.05±
4.42
10.4
3±
3.92
16.9
4±
6.52
18.0
5±
6.43
Turb
idit
y(N
TU
)20
.55±
8.61
19.9±
12.5
423
.4±
6.94
5.98±
1.82
5.45±
2.8
4.3±
0.52
DO
(mg·L−
1)
3.89±
0.97
4.98±
0.71
3.53±
0.56
4.72±
1.44
5.36±
1.69
4.2±
1.17
T.A
lkal
init
y(m
g·L−
1)
40.3
2±
7.97
40.7±
4.74
30.5
2±
5.19
29.8±
4.68
29.3
1±
3.98
34.3
7±
6.61
pH
6.43±
0.18
6.63±
0.16
6.3±
0.27
5.9±
0.17
6.43±
0.16
5.7±
0.31
Co
nduc
tivi
ty(µ
S·cm
−1)
3335
.84±
786.
8528
75.8
4±
597.
5350
82.3
4±
1037
.71
1144
.42±
919.
2976
0.41±
620.
372
3.62±
604.
69T
DS
(mg·L−
1)
25.5±
5.25
35.9±
7.29
27.9
2±
5.74
31.5
2±
4.42
33.0
9±
8.66
24.8±
6.03
Free
CO
2(m
g·L−
1)
12.2±
1.43
9.95±
2.02
10.9
6±
2.21
9.7±
2.48
11.4±
2.46
10.9±
2.98
Chl
ori
de
(mg·L−
1)
36.2±
26.8
425
.12±
15.1
627
.7±
20.8
313
.06±
0.67
13.1
6±
1.16
16.4
6±
2.98
BO
D(m
g·L−
1)
10.2±
1.74
11.6
8±
3.16
7.67±
0.34
11.7
5±
4.16
9.51±
3.24
12.6
8±
5.03
T.H
ard
ness
(mg·L−
1)
54.8
5±
16.4
338
.64±
6.55
59.7±
21.5
714
.2±
1.04
13.6
1±
1.21
10.6
7±
0.73
NO
3(m
g.L
-1)
3.81±
0.26
4.12±
0.57
4.46±
0.72
2.54±
0.81
2.72±
0.85
2.65±
0.82
PO
4(m
g·L−
1)
3.71±
1.01
3.14±
0.45
4.18±
0.57
6.63±
2.98
7.15±
4.14
5.45±
2.45
NH
3(m
g·L−
1)
0.66±
0.10
0.22±
0.06
0.26±
0.08
0.71±
0.25
0.27±
0.07
0.19±
0.04
Rai
nfal
l(m
m)
218.
8722
5.5
06p5

H. Sultana Laskar and S. Gupta : Knowl. Managt. Aquatic Ecosyst. (2013) 411, 06
Table IIMean density (no·L−1 × 10²) of phytoplankton taxa recorded in Chatla floodplain during September 2006to August 2007 (Mean ± SE).
Sl. No. Genus/ Species Species code BC DGK RB1 Actinastrum sp. Acti 0.17 ± 0.17 0.3 ± 0.3 0.94 ± 0.652 Chlorella sp. Chlo 0.54 ± 0.32 3.38 ± 1.92 0.69 ± 0.363 Chlamydomonas sp. Chla 1.16 ± 0.42 1.33 ± 0.24 0.5 ± 0.354 Cladophora sp. Clad 1.19 ± 0.4 0.6 ± 0.35 1.5 ± 1.025 Closterium sp. Clos – – 0.94 ± 0.716 Cosmarium sp. Cosm 1.07 ± 0.09 1.03 ± 0.73 1.5 ± 0.467 Cylindrocapsa sp. Cyli 0.47 ± 0.47 0.86 ± 0.29 0.38 ± 0.388 Desmidium sp. Desm 0.93 ± 0.31 0.65 ± 0.38 0.34 ± 0.349 Golenkinia sp. Gole 0.96 ± 0.35 – 4.44 ± 1.310 Microspora sp. Micr 0.67 ± 0.38 2.21 ± 0.32 1.19 ± 0.5711 Maugeotia sp. Maug 0.34 ± 0.34 0.57 ± 0.33 3.29 ± 1.2312 Spirogyra sp. Spiro 1.62 ± 0.2 2.13 ± 0.43 1.85 ± 0.7513 S. indica Sind 0.55 ± 0.34 1.49 ± 0.33 1.25 ± 0.6314 Sphaerozosma sp. Spha 0.47 ± 0.47 1.04 ± 0.63 0.75 ± 0.4715 Scenedesmus quadricauda Scen – 0.73 ± 0.47 0.9 ± 0.3416 Triploceros sp. Trip 0.16 ± 0.16 0.51 ± 0.32 0.63 ± 0.6317 Ulothrix sp. Ulot 1.26 ± 0.55 0.94 ± 0.31 0.5 ± 0.518 Volvox sp. Volv 1.79 ± 0.61 1.87 ± 0.43 4.4 ± 3.6619 Zygnema sp. Zygn 0.58 ± 0.36 1.18 ± 0.25 0.94 ± 0.41
Chlorophyceae 13.93 ± 1.1 20.82 ± 4.4 26.93 ± 11.120 Anabaena sp. Anab 1.02 ± 0.67 2.25 ± 0.84 0.71 ± 0.2921 Aulosira fertilissima Aulo 0.35 ± 0.35 1.19 ± 0.08 1.13 ± 0.7222 Chlorococcus sp. Chlc 0.59 ± 0.35 1.3 ± 0.45 1.13 ± 1.1323 Lyngbya sp. Lyng 0.47 ± 0.29 0.5 ± 0.29 0.5 ± 0.3524 Microcoleus acutissimus Micl 0.33 ± 0.33 – 1.06 ± 0.2125 Nostoc sp. Nost 1.48 ± 0.57 2.72 ± 1.19 2.15 ± 0.6326 Oscillatoria sp. Oscl 1.34 ± 0.21 0.86 ± 0.3 0.71 ± 0.3527 Rivularia sp. Rivu – 0.65 ± 0.39 1.1 ± 0.5228 Scytonema sp. Scyt 1.48 ± 0.19 0.54 ± 0.54 1.56 ± 1.029 Spirulina sp. Spir 0.21 ± 0.21 1.03 ± 0.39 0.5 ± 0.35
Cyanophyceae 7.27 ± 1.35 11.04 ± 1.67 10.55 ± 2.430 Cymbella sp. Cymb 0.57 ± 0.33 1.22 ± 0.29 1.08 ± 0.4831 Fragillaria sp. Frag 0.71 ± 0.42 0.35 ± 0.35 1.08 ± 0.6832 Gyrosigma sp. Gyro – 1.02 ± 0.59 0.92 ± 0.3433 Navicula sp. Navi 1.72 ± 0.21 2.81 ± 0.52 4.0 ± 1.3534 Nitzschia sp. Nitz 1.0 ± 0.4 1.58 ± 0.17 2.71 ± 1.0935 Synedra sp. Synd 1.27 ± 0.5 0.84 ± 0.3 1.42 ± 0.28
Bacillariophyceae 5.27 ± 1.21 7.82 ± 1.21 11.21 ± 3.3436 Euglena sp. Eugl 0.31 ± 0.31 1.07 ± 0.18 4.34 ± 0.91
Euglenophyceae 0.31 ± 0.31 1.07 ± 0.18 4.34 ± 0.9137 Amphidinium sp. Amph – 0.77 ± 0.46 0.56 ± 0.3638 Glenodinium sp. Gleno – – 0.71 ± 0.47
Dinophyceae – 0.77 ± 0.46 1.27 ± 0.83Total 26.78 ± 2.13 41.52 ± 5.02 54.3 ± 15.18
Percentage composition (%) 21.84 33.87 44.3Total No. taxa 32 34 38
The relative abundance of different groups of phytoplankton revealed that Chlorophyceaewas the most diversified and abundant group of phytoplankton, contributing around 50% oftotal species (52.02%, 52.14% and 49.6%) in all the sites during 2006−2007 and more than60% in sites 1 and 2 (60.3% and 61.13%) during 2007−2008. In site 3 (RB) it was 37.9%,followed by the Cyanophyceae and Bacillariophyceae (Figure 2). Sharma (2009) also reportedChlorophyta as the sole dominant quantitative component of phytoplankton in Loktak Lake,Manipur, India. Some authors also reported that Chlorophyceae have short life cycles and
06p6

H. Sultana Laskar and S. Gupta : Knowl. Managt. Aquatic Ecosyst. (2013) 411, 06
Table IIIMean density (no·L−1 × 10²) of phytoplankton taxa recorded in Chatla floodplain during September 2007to August 2008 (Mean ± SE).
Sl. No. Genus/ Species Species code BC DGK RB1 Actinastrum falcatus Actn – – 0.19 ± 0.192 Actidesmium Reinsh Actd – 0.29 ± 0.17 0.54 ± 0.333 Apicystis sp. Apis 0.31 ± 0.31 0.4 ± 0.23 0.63 ± 0.474 Chara (Valliant) sp. Char – – 0.13 ± 0.135 Chlorella sp. Chlo 0.54 ± 0.36 0.83 ± 0.31 2.67 ± 1.216 Chlamydomonas sp. Chla 0.25 ± 0.25 0.34 ± 0.2 1.31 ± 0.577 Chlorococcum sp. Chlr – – 0.81 ± 0.348 Cladophora sp. Clad 0.63 ± 0.63 –9 Closterium sp. Clos – – 3.08 ± 1.8410 Cosmarium sp. Cosm 0.31 ± 0.31 –11 Cylindrocystis sp. Cyli – 0.17 ± 0.17 0.13 ± 0.1312 Desmidium sp. Desm 0.31 ± 0.31 0.81 ± 0.31 0.13 ± 0.1313 Microspora sp. Micr 1.63 ± 0.42 0.69 ± 0.43 0.25 ± 0.2514 Maugeotia sp. Maug 0.5 ± 0.5 0.13 ± 0.13 –15 Pandorina sp. Pand – – 0.31 ± 0.3116 Pleodorina sp. Pleo – – 0.13 ± 0.1317 Pediastrum sp. Pedi – – 0.46 ± 0.4618 Spirogyra sp. Spiro 0.52 ± 0.31 2.79 ± 1.72 2.42 ± 0.1719 S. indica Sind 0.25 ± 0.25 –20 Sphaerozosma sp. Spha – – 0.31 ± 0.3121 Scenedesmus sp. Scen – – 0.13 ± 0.1322 Schizogonium Kutzing Schi – – 0.42 ± 0.2523 Schroederia sp. Schr – – 0.88 ± 0.8824 Ulothrix zonata Ulot 0.65 ± 0.37 0.67 ± 0.67 0.63 ± 0.2425 Volvox sp. Volv 1.79 ± 1.79 3.34 ± 3.34 6.21 ± 1.0926 Zygnema sp. Zygn 0.19 ± 0.19 0.25 ± 0.25 0.29 ± 0.29
Chlorophyceae 7.88 ± 1.68 10.71 ± 3.01 22.06 ± 2.5427 Anabaena sp. Anab 0.63 ± 0.38 2.0 ± 0.84 2.08 ± 0.7328 Aulosira fertilissima Aulo – 0.25 ± 0.25 –29 Lyngbya sp. Lyng 0.13 ± 0.13 –30 Microcoleus sp. Micl – – 0.13 ± 0.1331 Microcystis sp. Micy 0.5 ± 0.5 –32 Nostoc sp. Nost 0.42 ± 0.42 3.0 ± 1.74 2.29 ± 0.7933 Oscillatoria sp. Osci 0.5 ± 0.5 0.31 ± 0.31 0.58 ± 0.3634 Scytonema sp. Scyt – – 0.38 ± 0.2435 Spirulina sp. Spirul – – 0.58 ± 0.34
Cyanophyceae 2.18 ± 0.46 5.56 ± 2 6.04 ± 2.1636 Cymbella sp. Cymb 0.19 ± 0.19 – 0.21 ± 0.2137 Eunotia sp. Euno – – 16.13 ± 16.1338 Fragillaria sp. Frag – – 1.17 ± 0.3939 Navicula sp. Navi 0.63 ± 0.38 0.5 ± 0.1840 Nitzschia sp. Nitz – – 2.04 ± 0.3641 Synedra sp. Synd – – 2.67 ± 2.5
Bacillariophyceae 0.82 ± 0.53 – 22.72 ± 18.9342 Euglena sp. Eugl 2.0 ± 1.31 1.25 ± 0.73 6.08 ± 2.37
Euglenophyceae 2.0 ± 1.31 1.25 ± 0.73 6.08 ± 2.3743 Amphidinium sp. Amph – – 0.19 ± 0.1944 Ceratium sp. Cera 0.19 ± 0.19 0.81 ± 0.2945 Glenodinium sp. Glen – – 0.31 ± 0.18
Dinophyceae 0.19 ± 0.19 - 1.31 ± 0.94Total 13.07 ± 2.29 17.52 ± 5.26 58.21 ± 18.5
Percentage composition (%) 14.72 19.73 65.6Total No. of taxa 22 17 38
06p7

H. Sultana Laskar and S. Gupta : Knowl. Managt. Aquatic Ecosyst. (2013) 411, 06
0%10%20%30%40%50%60%70%80%90%
100%
BC DGK RB BC DGK RB
Rel
ativ
e ab
unda
nce
(%)
Site
2006-07 2007-08
Chlorophyceae Cyanophyceae Bacillariophyceae
Euglenophyceae Dinophyceae
Figure 2Relative abundance of different groups of phytoplankton community in different sites of Chatla floodplainduring 2006–2007 and 2007–2008.
are opportunistic, reaching fast growth rates when nutrient availability is adjusted (Happey-Wood, 1988; Vermaat, 2005). However, in site 3 (RB) Bacillariophyceae (39.03%) dominatedover Chlorophyceae (37.9%) and Cyanophyceae (10.4%) during 2007−2008, which couldbe due to the presence of vegetation cover of Calamus tennis-Baringtonia acutangula alongwith belts of macrophytes (Nymphaea sp., Utricularia sp. and Polygonum hydropiper) in sta-tion 3 (RB). It provided a specialised niche for various phytoplankton taxa, particularly Eunotia,the most dominant taxon. Chlorococcum sp., Closterium sp., Pediastrum sp., etc. (Tables IIand III) did not occur in sites 1 and 2 during 2007−2008. Euglenophyceae dominated overBacillariophyceae in site 1. Bacillariophyceae and Dinophyceae were totally absent in site 2(2007−2008), while Euglenophyceae and Dinophyceae were the least abundant groups (<5%of total taxa) in sites 1 and 2 during 2006−2007.
Analysis of the phytoplankton community in different habitats of Chatla wetland revealedsome similarities with phytoplankton studies in Calabar River, Imo River Estuary, Nigeria(Uttah et al., 2008; Akoma, 2008), where the predominance of Chlorophyceae in lotic systemswith flowing water and Cyanophyceae bloom in eutrophic and polluted water was described.Laskar and Gupta (2009, 2010 and 2011) reported similar trends of phytoplankton communitycomposition in terms of density and abundance.
The mean density of total phytoplankton in Chatla floodplain ranged from 26.78 to54.3 no·L−1 × 10² and 13.7 to 58.21 no·L−1 × 10² during 2006−2007 and 2007−2008, respec-tively (Table II and III). Hulyal and Kaliwal (2009) reported that the density of total phytoplank-ton ranged from 110 org·L−1 to 555 org·L−1 in 2003 and 95 org·L−1 to 564 org·L−1 during 2004in the Almatti reservoir of Bijapur District, Karnataka State, India, which was much lower thanthe density obtained in the present study. They suggested that the variation in phytoplanktondensity was influenced by temperature and pH, as they found the maximum population in thesummer season. In the present study, the maximum density of phytoplankton was influencedby temperature, along with heavy rainfall and alteration of nutrient dynamics during monsoon,because most of the phytoplankton taxa were recruited by surface runoff from nearby fish-eries and other freshwater ecosystems. This agreed with the findings of Oliveira and Calheiros(2000) in a study on the south Pantanal floodplain, Brazil, where the highest phytoplanktondensity was recorded in the rising water period.
06p8

H. Sultana Laskar and S. Gupta : Knowl. Managt. Aquatic Ecosyst. (2013) 411, 06
Table IVOne way analysis of variance (ANOVA) for phytoplankton density and species diversity among differentsites of Chatla floodplain during 2006–2007 and 2007−2008.
Parameters 2006–2007 2007–2008Phytoplankton density F = 6.51∗, p < 0.004 F = 15.98∗∗, p < 0.000Species diversity F = 10.72∗∗, p < 0.000 F = 74.03∗∗, p < 0.000
∗ Significant at 5% level, ∗∗ significant at 1% level.
One-way analysis of variance (ANOVA) showed the significant site-wise variation of phyto-plankton density and species diversity (p < 0.01) during both the years of study (Table IV).Although in site 3 species richness was found to be higher than that of the other sites withan equal no. of taxa (38) in both the years, species richness drastically declined from theprevious year in sites 2 and 1 (17 and 22 taxa) during 2007−2008 (Table III). This could belinked to the disturbances caused by the construction of RCC bridges over the inlets. Further,in lentic systems, phytoplankton species diversity was always found to be higher than that oflotic systems (Rodrigues and Bicudo, 2001; Laskar, 2012).In contrast to the highest number of taxa in site 3 in both the years, we recorded the high-est values of H/ and d (2.65 and 2.22) in site 2, followed by site 3 (2.52 and 2.0) during2006−2007, while during 2007−2008 the highest values of H/ and d (2.17 and 1.3) for thephytoplankton community were recorded in site 3 (RB) (Figure 3a and 3b) despite its lowdepth (∼5−6 feet). This might be due to the fact that site 3 is located in the midst of vegeta-tion cover of Calamus tennis-Baringtonia acutangula. According to Van den Brink et al. (1994),phytoplankton species richness is related to the complexity of habitats formed by the pres-ence of aquatic vegetation. During 2007−2008, the relatively low values of diversity indices(<1.5) and species richness (22 and 17) in sites 1 and 2 clearly indicated that disturbancecaused by the construction of RCC bridges eliminated the sensitive phytoplankton such asBacillariophyceae and Dinophyceae in site 2. Occurrence of Microcystis blooms (probablyrecruited during seasonal inundation) in site 1 indicated their tolerance and differential strate-gies for survival in polluted environmental conditions, particularly at very high concentrationof NH+
4 (0.66 mg·L−1 and 0.71 mg·L−1). Junk et al. (1989) suggested that the great diversity ofhabitats in floodplain systems probably allows the co-occurrence of many species with dif-fering strategies and levels of adaptation as a result of cyclical changes caused by the floodpulse.Figures 4a and 4b show the CCA scores with phytoplankton species density and environmentvariable data for 2006−2007 and 2007−2008 in Chatla floodplain. CCA is a direct gradientanalysis technique, and represents a special case of multivariate regression where speciescomposition is directly and immediately related to measured environmental variables (Palmer,1993). Further, CCA performs quite well with skewed species distributions, with quantitativenoise in species abundance data, with samples taken from unusual sampling designs, andwith highly intercorrelated environmental variables (Palmer, 1993). CCA extracts synthetic gra-dients from the biotic and environmental matrices, which are quantitatively represented by ar-rows in graphical biplots (ter Braak and Verdonschot, 1995). The length of the arrow is relativeto the importance of the explanatory variable in the ordination, and arrow direction indicatespositive and negative correlations (Jasprica et al., 2012).In the present study, for the first cycle (2006−2007), the eigenvalues were 0.188 and 0.170for axis 1 and axis 2, respectively, and the variance explained by the first two axes was24.4%. Similarly, for the second cycle (2007−2008), the eigenvalues for axis 1 and axis 2were 0.405 and 0.324, respectively, and the variance explained by the first two axes was23.6%. The cumulative percentage variance of species-environment relationships was 19.6for axis 1 and 37.3 for axis 2 in the first cycle, while in the second cycle it was 19.2 and 34.5.The variance explained by the CCA in the first cycle was found to be 65.5%, and for thesecond cycle it was 68.4%. The species-environment correlations of the first two axes ( 0.943for both in 2006−2007) and ( 0.946 and 0.899 in 2007−2008) indicated a strong relationshipamong all species and environmental variables, suggesting the importance of these variables
06p9

H. Sultana Laskar and S. Gupta : Knowl. Managt. Aquatic Ecosyst. (2013) 411, 06
0
0.05
0.1
0.15
0.2
0.25
0
0.5
1
1.5
2
2.5
3
BC DGK RB
Dom
inan
ce In
dex
Div
ersi
ty In
dice
s
Site
2006-07 H/ d J/ DBP
3A
(a)
0
0,05
0,1
0,15
0,2
0,25
0,3
0,35
0,4
0,45
0,5
0
0,5
1
1,5
2
2,5
3
BC DGK RB
Dom
inan
ce In
dex
Div
ersi
ty In
dice
s
Site
2007-08
H/ d J/ DBP
(b)
Figure 3Seasonal variation of phytoplankton density (no·L−1 × 10²) in different sites of Chatla floodplain dur-ing 2006–2007 and 2007–2008. (a) Diversity indices for phytoplankton community in different sites ofChatla floodplain during 2006–2007. (b) Diversity indices for phytoplankton community in different sitesof Chatla floodplain during 2007–2008. H/ = Shannon-Wiener Diversity Index, d = Margalef’s index ofspecies richness, J/ = Evenness Index and DBP = Berger-Parker Index of dominance.
in explaining plankton distribution. To evaluate the significance of the CCA axes and of thevariables which defined these axes Monte Carlo tests were performed with 499 unrestrictedpermutations and were proved significant for both the cycles (p < 0.002: Table V).The CCA ordination diagram (Figures 4a and 4b) revealed that during 2006−2007 both theaxes were found to be highly positively correlated with TRN and WT and negatively relatedto TDS. Axis 1 showed a negative relationship with RF, while axis 2 was found to have astrong positive relationship with RF and TUR. Volvox was strongly influenced by TRN, Mau-geotia by WT and Navicula by RF. During the second cycle (2007−2008) the importance ofTRN was less pronounced, with a concomitant increase in the influence of NO3. WT showeda negative relationship with both the axes. Ulothrix, Zygnema, Navicula, Spirogyra and Oscil-latoria were found to be highly positively correlated with NH3 and negatively correlated withWT. NO3, TH and pH showed a positive relationship with axis 2 but a negative relationship
06p10

H. Sultana Laskar and S. Gupta : Knowl. Managt. Aquatic Ecosyst. (2013) 411, 06
(a)
(b)
Figure 4(a) Canorical correspondence analysis (CCA) of the phytoplankton samples collected from Chatla flood-plain lake during 2006–2007 and associated environmental variables (bioplots of the species and envi-ronmental variables). (b) Canorical correspondence analysis (CCA) among the phytoplankton samplescolletcted from Chatla floodplain lake during 2007–2008 and associated environmental variables (bio-plots of the species and environmental variables). Abbreviations: species names were listed in Table III,WT = water temperature, TRN = transparency, TUR = turbidity, DO = dissolved oxygen, TA = total alka-linity, EC = electrical conductivity, TDS = total dissolved solids, FC = free carbon-di-xoide, CI = chloride,BOD = biological oxygen demand, TH = total hardness, NO3 = nitrate, PO4 = phosphate, NH3 = am-monia and RF = rainfall.
06p11

H. Sultana Laskar and S. Gupta : Knowl. Managt. Aquatic Ecosyst. (2013) 411, 06
Table VSummary statistics of CCA between phytoplankton species and environmental variables for first twoaxes in Chatla floodplain for the year 2006–2007 and 2007–2008.
2006–2007 2007–2008Axis 1 Axis 2 Axis 1 Axis 2
Eigenvalues 0.188 0.170 0.405 0.324Species-environment correlations 0.943 0.943 0.946 0.899Cumulative percentage variance of species data 12.8 24.4 13.1 23.6Cumulative percentage variance of species-environment
19.6 37.3 19.2 34.5relationSum of all unconstrained eigenvalues 1.468 3.087Sum of all canonical eigenvalues 0.961 2.111Variance explained by the CCA 65.5% 68.4%Variance explained by the first two axes 24.4% 23.6%Monte Carlo test Test of significance of all
0.002 0.002canonical axes: p – values
with axis 1. RF showed a negative relationship with axis 2 and a positive relationship withaxis 1. Thus, according to CCA, during 2006−2007 phytoplankton species distribution wasinfluenced by the environmental variables TRN, WT, TDS, RF and TUR, while in 2007−2008it was influenced by NH3, WT, NO3, TH, RF and pH. The influence of RF and WT in boththe years confirmed that in floodplain lakes they are very important and instrumental in theplankton community distribution.
CONCLUSION
Fluctuation of phytoplankton density and community composition in different habitats indi-cated various niche apportionment models as well as anthropogenic influences mainly drivenby rainfall.
ACKNOWLEDGEMENTS
We thank Dr. Dibyojyoti Bhattacharjee and Mr. Hemanta Saikia, Department of Business Ad-ministration, Assam University, Silchar, Assam, India, and Mr. Aribam Satish Chandra Sharma,Dept. of Ecology and Environmental Science, Assam University, Silchar, Assam, India, for theirhelp with statistical analyses. The first author wishes to thank the University Grants Commis-sion, New Delhi, India, for financial assistance.
REFERENCES
Akoma O.C., 2008. Phytoplankton and nutrient dynamics of a tropical estuarine system, Imo RiverEstuary, Nigeria. African Res. Rev., 2, 253−264.
Anand N., 1998. Indian Freshwater Microalgae. Bishen Singh Mahendra Pal Singh, Dehradun, India,94 p.
APHA, 2005. Standard Methods for the Examination of Water and Wastewater. 21st edn. APHA, AWWA,WPCF, Washington DC, USA.
Bhuiyan J.R. and Gupta S., 2007. A comparative hydrobiological study of a few ponds of Barak Valley,Assam, and their role as sustainable water resources. J. Environ. Biol., 28, 799–802.
Borges P.A.F. and Train S., 2009. Phytoplankton diversity in the Upper Paraná River floodplain duringtwo years of drought (2000 and 2001). Braz. J. Biol. (Suppl.), 69, 637–647.
Branes Z., Ounissi M., Sargos D. and Amblard C., 2007. Density and biomass of phytoplankton in theOubeira Lake (North-East Algeria). J. Fisher. Intern., 2, 200–206.
06p12

H. Sultana Laskar and S. Gupta : Knowl. Managt. Aquatic Ecosyst. (2013) 411, 06
Chattopadhyay C. and Banerjee T.C., 2007. Temporal changes in environmental characteristics anddiversity of net phytoplankton in a freshwater lake. Turk. J. Bot., 31, 287–296.
Chellappa N.T., Borba J.M. and Rocha O., 2008. Phytoplankton community and physical-chemical char-acteristics of water in the public reservoir of Cruzeta, RN, Brazil. Braz. J. Biol., 68, 477–494.
Duttagupta S., Gupta S. and Gupta A., 2004. Euglenoid blooms in the floodplain wetlands of BarakValley, Assam, North eastern India. J. Environ. Biol., 25, 369–373.
Edmondson W.T., 1959. Freshwater Biology. 2nd edn. John Wiley and Sons, New York.
Golterman H.L., Clymo R.S. and Ohnstad M.A.M., 1978. Methods for Physical and Chemical Analysis ofFreshwaters. 2nd edn. Blackwell Scientific Publishers, Oxford London.
Gupta A., Gupta S. and Michael R.G., 1994. Seasonal abundance and diet of Cloeon sp.(Ephemeroptera: Baetidae) in a northeast Indian lake. Arch. Hydrobiol., 130, 349–357.
Happey-Wood C.M., 1988. Ecology of freshwater planktonic green algae. In: Sandgren C.D. (ed.),Growth and reproductive strategies of freshwater phytoplankton. Cambridge Univ. Press,175−226.
Hulyal S.B. and Kaliwal B.B., 2009. Dynamics of phytoplankton in relation to physico-chemical factorsof Almatti reservoir of Bijapur District, Karnataka State. Environ. Monit. Assess., 153, 45–59.
Jasprica N, Caric, M., Kršinic, F., Kapetanovic, T., Batistic M. and Njire J., 2012. Planktonic diatoms andtheir environment in the lower Neretva River estuary (Eastern Adriatic Sea, NE Mediterranean),Nova Hedwigia, Beiheft, 141, 405–430.
Junk W.J., Bayley P.B., and Sparks R.F., 1989. The flood-pulse concept in river floodplain sys-tems. In: Dodge D.P. (ed.), Proceeding of the International Large River Symposium Toronto,Ontario. September, 14−21, 1986. Canadian Publication of Fisheries and Aquatic Sciences -106Department of Fisheries and Oceans, Ottawa, Ontario, Canada, 110−127.
Laskar H.S., 2012. Flood impulse, nutrient and plankton dynamics of a floodplain lake, Chatla Haor inBarak Valley of Assam, North-East India, Ph. D. Thesis, Assam University, Silchar, Assam, India.
Laskar H.S. and Gupta S., 2009. Phytoplankton diversity and dynamics of Chatla floodplain lake, BarakValley, Assam, North Eastern India-a seasonal study. J. Environ. Biol., 30, 1007–1012.
Laskar H.S. and Gupta S., 2010. Ecology of a Marsh in Chatla floodplain, Barak Valley, North EasternIndia. Eco. Env. Consv., 16, 9–15.
Laskar H.S. and Gupta S., 2011. Water quality of two small streams Jalingachhara and Baluchuri ofdistrict Cachar, Assam. Assam Univ. J. Sci. Technol., 7, 1–9.
Lund M.A. and Davies J.A., 2000. Seasonal dynamics of plankton communities and water chemistry in aeutrophic lake (Lake Monger, Western Australia): Implications for biomanipulation. Mar. FreshwaterRes., 51, 321–332.
Magurran A.E., 2004. Measuring Biological Diversity. Blackwell Publishing, USA, 255 p.
Michael P., 1984. Ecological Methods for Field and Laboratory Investigations. Tata McGraw–Hill,New Delhi, 404 p.
Mitsch W.J. and Gosselink J.G., 1993. Wetlands. 2nd edn. Van Nostrand Reinhold, New York. 722 p.
Mustapha M.K., 2009. Phytoplankton assemblage of a small, shallow, tropical African reservoir. Rev.Biol. Trop., 57, 1009–1025.
Nabout J.C., Nogueira I.S. and Oliveira L.G., 2005. Phytoplankton community of floodplain lakes of theAraguaia River, Brazil in the rainy and dry seasons J. Plankton Res., Advance Access publishedDecember 1, 2005.
Nwankwo D.I., Owoseni T.I., Usilo D.A., Obinyan I., Uche A.C. and Onyema I.C., 2008. Hydrochemistryand plankton dynamics of Kuramo lagoon. Life Sci. J., 5, 83–88.
Olele N.F. and Ekelemu J.K., 2008. Physicochemical and periphyton/phytoplankton study of Onah Lake,Asaba, Nigeria. African J. Gen. Agri., 4, 183–193.
Oliveira M.D. and Calheiros D.F., 2000. Flood pulse influence on phytoplankton communities of thesouth Pantanal floodplain, Brazil. Hydrobiol., 427, 101–112.
Onyema I.C., 2007. The phytoplankton composition, abundance and temporal variation of a pollutedestuarine Creek in Lagos, Nigeria. Turk. J. Fisher. Aqua. Sci., 7, 89–96.
Palmer M.W., 1993. Putting Things in Even Better Order: The Advantages of Canonical CorrespondenceAnalysis, Ecology, 74, 2215–2230.
06p13

H. Sultana Laskar and S. Gupta : Knowl. Managt. Aquatic Ecosyst. (2013) 411, 06
Patterson G. and Wilson K.K., 1995. The influence of diel climatic cycle on the depth-time distribution ofphytoplankton and photosynthesis in a shallow equatorial lake (Lake Baringo, Kenya). Hydrobiol.,304, 1–8.
Pielou E.C., 1984. The Interpretation of Ecological Data: A Primer on Classification and Ordination. Wiley,New York, New York, USA.
Ramesh R. and Anbu M., 1996. Chemical Methods for Environmental Analysis: Water and Sediment.Macmillan India Ltd, 161 p.
Rodrigues L. and Bicudo D.C., 2001. Similarity among periphyton algal communities in a lentic-loticgradient of the upper Paraná river floodplain, Brazil. Revta Brasil. Bot., São Paulo, 24, 235–248.
Senthilkumar R. and Sivakumar K., 2008. Studies on phytoplankton diversity in response to abioticfactors in Veeranam Lake in the Cuddalore district of Tamil Nadu. J. Environ. Biol., 29, 747–752.
Sharma B.K., 2009. Composition, abundance and ecology of phytoplankton communities of LoktakLake, Manipur, India. J. Threat. Taxa, 1, 401–410.
Silva I.G., Moura A.N., Dantas E.W. and Bittencourt-Oliveira M.C., 2010. Structure and dynamics ofphytoplankton in an Amazon lake, Brazil. Rev. Biol. Trop., 58, 1421–1436.
Sommer U., 1989. The role of competition for resources in phytoplankton succession. In: Sommer U.(ed.), Plankton Ecology: Succession is Plankton Communities. Springer, Berlin, 57–106.
ter Braak C.J.F. and Verdonschot P.F.M. 1995. Canonical correspondence analysis and related multivari-ate methods in aquatic ecology. Aquat. Sci. 57, 255–289.
Thomaz S.M., Bini L.M. and Bozelli R.L., 2007. Floods increase similarity among aquatic habitats inriver-floodplain systems. Hydrobiol., 579, 1–13.
Uttah E.C., Uttah C., Akpan P.A., Mikpeme E., Ogbeche J., Usip L. and Asor J., 2008. Bio-survey ofPlankton as indicators of water quality for recreational activities in Calabar River, Nigeria. J. Appl.Sci. Environ. Manage., 12, 35–42.
Van den Brink F.W.B., de Leeuw J.P.H.. Van der Velde G. and Verheggen G.M. 1992−1993. Impact ofhydrology on the chemistry and phytoplankton development in floodplain lakes along the LowerRhine and Meuse. Biogeochem., 19, 103–128.
Van den Brink F.W.B., Van Katwijk M.M. and Van der Velde G., 1994. Impact of hydrology on phytoand zooplankton community composition in floodplain lakes along the Lower Rhine and Meuse.J. Plankton Res., 16, 351–373.
Vermaat J.E., 2005. Periphyton dynamics and influencing factors. In: Azim M.E., Verdegem M.C.J.,Van Dam A.A. and Bederidge M.C.M. (eds.), Periphyton ecology, exploitation and management.Cambridge: CABI Publishing, 35–49.
Winkler L.W., 1888. Die Bestimmung des in Wasser gelösten Sauerstoffen. Berichte der DeutschenChemischen Gesellschaft, 21, 2843–2855.
06p14