PDF (1096 KB)
7
Measuring Severity of Illness: Comparisons Across Institutions SUSAN DADAKIS HORN, PHD Abstract: Conventional methods for classifying patients with respect to utilization of health care resources are based almost exclusively on diagnostic criteria. We review a new severity of illness index which is generic to most medical and surgical condi- tions in a hospital, and which has been found to produce subgroups of patients more homogeneous with respect to hospital resource use (as assessed by total charges, length of stay, routine charges, and Introduction As medical costs continue to rise alarmingly, govern- ment and other third party payors have sought ways to control them. A fundamental requirement for the control of inpatient hospital costs is a means of classifying patients admitted to a hospital by a standard which accurately reflects patients' use of health care resources. The conven- tional approach to this requirement has been classification of patients into diagnosis-related groups (DRGs) such as acute myocardial infarction (AMI), congestive heart failure (CHF) with and without a surgical procedure, etc.' Such conventional classification systems, which are based primarily on diagnostic criteria, fail to take into account the great range of severity of illness that exists within each diagnostic category, hence they may not accu- rately reflect a patient's use of expensive care modalities. This problem might be expected to be particularly trouble- some when a diagnosis-based classification system is used to compare outputs from different hospitals. For example, an academic teaching hospital in a large city may be expected to Address reprint requests to Dr. Susan D. Horn, Associate Director, Center for Hospital Finance and Management, Division of Health Care Organization, Department of Health Services Adminis- tration, Johns Hopkins University, 624 N. Broadway, 3rd floor, Hampton House, Baltimore, MD 21205. This paper, submitted to the Journal May 20, 1982, was revised and accepted for publication August 5, 1982. Editor's Note: See also related editorial p 14 this issue. © 1982 American Journal of Public Health laboratory charges) than diagnostic-related groups, staging, and generalized patient management paths. We use the severity of illness groups to compare total charges and length of stay across hospitals. We find that charges and length of stay in an academic teaching hospital are similar to those in community hospitals with and without teaching programs when controlling for severity of illness. (Am J Public Health 1983; 73:25-31.) see a different distribution of severity of illness in its patient population from that seen in a smaller private hospital located in a wealthy suburban area. Within a given diagnos- tic category, these two hospitals may have very different profiles of patient charges or length of stay; these may be inadequately summarized by simply reporting an average for the whole category. Thus, it is important to be able to characterize accurate- ly the differences in patient severity of illness and use of resources. We have found that a new severity of illness index produces case mix groups which are more homoge- neous with respect to resource consumption2 than case mix groups formed by such commonly used methods as DRGs,' New Jersey (NJ) DRGs,3 staging,4 and generalized patient management paths.5 In this study, we have applied the new severity of illness index to patient populations in four different types of hospi- tals and have compared total charges and length of stay (LOS) across these institutions. We find that when we control for severity of illness, the academic teaching hospital does not have significantly higher charges than the other hospitals in our study. Methods The severity of illness index used in our study has been defined elsewhere.6 It is a generic (i.e., not disease-specific) four-level index which can be added to other case mix grouping methods. The overall four-level severity score for an individual patient's hospital stay is determined from the scores for each of seven variables which were chosen to reflect burden of illness (Table 1). The first four variables AJPH January 1983, Vol. 73, No. 1 25
Transcript of PDF (1096 KB)
Measuring Severity of Illness:Comparisons Across Institutions
SUSAN DADAKIS HORN, PHD
Abstract: Conventional methods for classifyingpatients with respect to utilization of health careresources are based almost exclusively on diagnosticcriteria. We review a new severity of illness indexwhich is generic to most medical and surgical condi-tions in a hospital, and which has been found toproduce subgroups of patients more homogeneouswith respect to hospital resource use (as assessed bytotal charges, length of stay, routine charges, and
Introduction
As medical costs continue to rise alarmingly, govern-ment and other third party payors have sought ways tocontrol them. A fundamental requirement for the control ofinpatient hospital costs is a means of classifying patientsadmitted to a hospital by a standard which accuratelyreflects patients' use of health care resources. The conven-tional approach to this requirement has been classification ofpatients into diagnosis-related groups (DRGs) such as acutemyocardial infarction (AMI), congestive heart failure (CHF)with and without a surgical procedure, etc.'
Such conventional classification systems, which arebased primarily on diagnostic criteria, fail to take intoaccount the great range of severity of illness that existswithin each diagnostic category, hence they may not accu-rately reflect a patient's use of expensive care modalities.This problem might be expected to be particularly trouble-some when a diagnosis-based classification system is used tocompare outputs from different hospitals. For example, anacademic teaching hospital in a large city may be expected to
Address reprint requests to Dr. Susan D. Horn, AssociateDirector, Center for Hospital Finance and Management, Division ofHealth Care Organization, Department of Health Services Adminis-tration, Johns Hopkins University, 624 N. Broadway, 3rd floor,Hampton House, Baltimore, MD 21205. This paper, submitted tothe Journal May 20, 1982, was revised and accepted for publicationAugust 5, 1982.Editor's Note: See also related editorial p 14 this issue.
© 1982 American Journal of Public Health
laboratory charges) than diagnostic-related groups,staging, and generalized patient management paths.We use the severity of illness groups to compare totalcharges and length of stay across hospitals. We findthat charges and length of stay in an academic teachinghospital are similar to those in community hospitalswith and without teaching programs when controllingfor severity of illness. (Am J Public Health 1983;73:25-31.)
see a different distribution of severity of illness in its patientpopulation from that seen in a smaller private hospitallocated in a wealthy suburban area. Within a given diagnos-tic category, these two hospitals may have very differentprofiles of patient charges or length of stay; these may beinadequately summarized by simply reporting an average forthe whole category.
Thus, it is important to be able to characterize accurate-ly the differences in patient severity of illness and use ofresources. We have found that a new severity of illnessindex produces case mix groups which are more homoge-neous with respect to resource consumption2 than case mixgroups formed by such commonly used methods as DRGs,'New Jersey (NJ) DRGs,3 staging,4 and generalized patientmanagement paths.5
In this study, we have applied the new severity of illnessindex to patient populations in four different types of hospi-tals and have compared total charges and length of stay(LOS) across these institutions. We find that when wecontrol for severity of illness, the academic teaching hospitaldoes not have significantly higher charges than the otherhospitals in our study.
Methods
The severity of illness index used in our study has beendefined elsewhere.6 It is a generic (i.e., not disease-specific)four-level index which can be added to other case mixgrouping methods. The overall four-level severity score foran individual patient's hospital stay is determined from thescores for each of seven variables which were chosen toreflect burden of illness (Table 1). The first four variables
AJPH January 1983, Vol. 73, No. 1 25
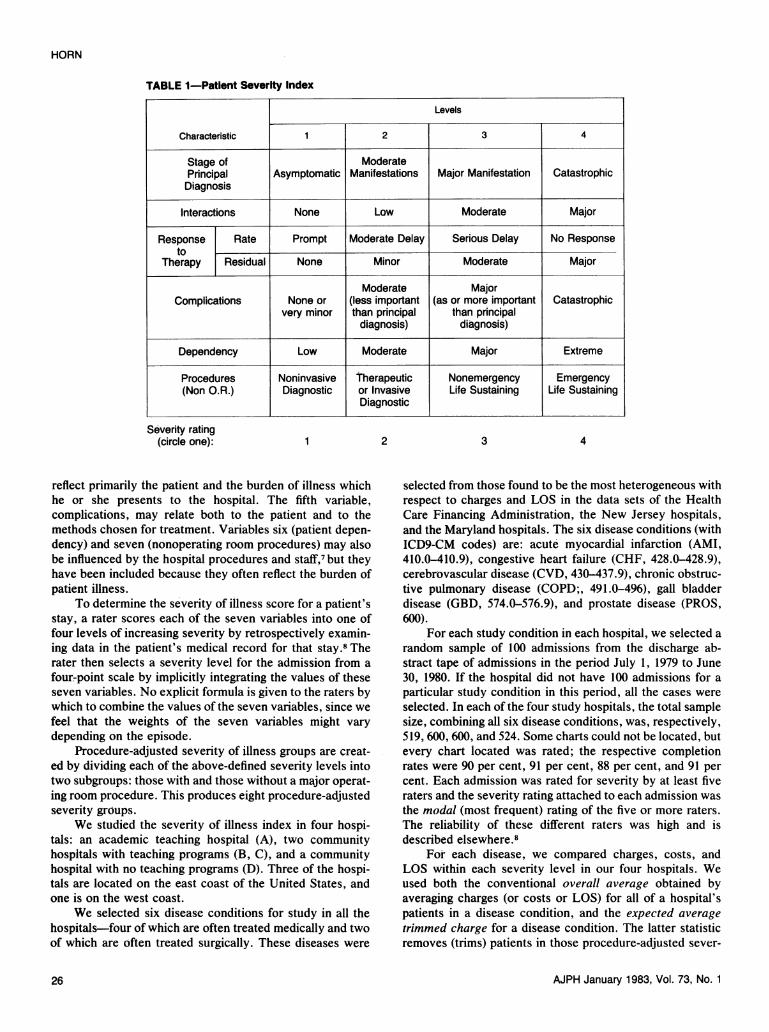
TABLE 1-Patient Severity Index
Levels
Characteristic 2 3 4
Stage of ModeratePrincipal Asymptomatic Manifestations Major Manifestation CatastrophicDiagnosis
Interactions None Low Moderate Major
Response Rate Prompt Moderate Delay Serious Delay No Responseto
Therapy Residual None Minor Moderate Major
Moderate MajorComplications None or (less important (as or more important Catastrophic
very minor than principal than principaldiagnosis) diagnosis)
Dependency Low Moderate Major Extreme
Procedures Noninvasive Therapeutic Nonemergency Emergency(Non O.R.) Diagnostic or Invasive Life Sustaining Life Sustaining
Diagnostic
Severity rating(circle one): 2 3 4
reflect primarily the patient and the burden of illness whichhe or she presents to the hospital. The fifth variable,complications, may relate both to the patient and to themethods chosen for treatment. Variables six (patient depen-dency) and seven (nonoperating room procedures) may alsobe influenced by the hospital procedures and staff,7 but theyhave been included because they often reflect the burden ofpatient illness.
To determine the severity of illness score for a patient'sstay, a rater scores each of the seven variables into one offour levels of increasing severity by retrospectively examin-ing data in the patient's medical record for that stay.8 Therater then selects a severity level for the admission from a
four:point scale by implicitly integrating the values of theseseven variables. No explicit formula is given to the raters bywhich to combine the values of the seven variables, since wefeel that the weights of the seven variables might vary
depending on the episode.Procedure-adjusted severity of illness groups are creat-
ed by dividing each of the above-defined severity levels intotwo subgroups: those with and those without a major operat-ing room procedure. This produces eight procedure-adjustedseverity groups.
We studied the severity of illness index in four hospi-tals: an academic teaching hospital (A), two communityhospitals with teaching programs (B, C), and a communityhospital with no teaching programs (D). Three of the hospi-tals are located on the east coast of the United States, andone is on the west coast.
We selected six disease conditions for study in all thehospitals-four of which are often treated medically and twoof which are often treated surgically. These diseases were
selected from those found to be the most heterogeneous withrespect to charges and LOS in the data sets of the HealthCare Financing Administration, the New Jersey hospitals,and the Maryland hospitals. The six disease conditions (withICD9-CM codes) are: acute myocardial infarction (AMI,410.0-410.9), congestive heart failure (CHF, 428.0-428.9),cerebrovascular disease (CVD, 430-437.9), chronic obstruc-tive pulmonary disease (COPD;, 491.0-496), gall bladderdisease (GBD, 574.0-576.9), and prostate disease (PROS,600).
For each study condition in each hospital, we selected a
random sample of 100 admissions from the discharge ab-stract tape of admissions in the period July 1, 1979 to June30, 1980. If the hospital did not have 100 admissions for a
particular study condition in this period, all the cases were
selected. In each of the four study hospitals, the total samplesize, combining all six disease conditions, was, respectively,519, 600, 600, and 524. Some charts could not be located, butevery chart located was rated; the respective completionrates were 90 per cent, 91 per cent, 88 per cent, and 91 percent. Each admission was rated for severity by at least fiveraters and the severity rating attached to each admission was
the modal (most frequent) rating of the five or more raters.The reliability of these different raters was high and isdescribed elsewhere 8
For each disease, we compared charges, costs, andLOS within each severity level in our four hospitals. Weused both the conventional overall average obtained byaveraging charges (or costs or LOS) for all of a hospital'spatients in a disease condition, and the expected averagetrimmed charge for a disease condition. The latter statisticremoves (trims) patients in those procedure-adjusted sever-
AJPH January 1983, Vol. 73, No. 1
HORN
1
26
COMPARISONS ACROSS INSTITUTIONS
ity levels which are not treated in all hospitals and alsoapplies a common distribution of procedure-adjusted sever-ity for each disease condition in each hospital. In this way,we obtain one statistic (expected average trimmed charge orLOS) for a disease condition in a hospital which adjusts fordifferences in severity distributions and permits meaningfulcomparisons across hospitals. For each disease condition, ahospital's expected average trimmed charge (or cost or LOS)is computed as follows: For each of the four severity levels,take the product of a particular hospital's average charge (orcost or LOS) and the total number of such patients in allhospitals; sum these products over the four severity levels;then divide by the total number of patients in all hospitals inall the severity levels in which each hospital has at least onepatient. *
If all the patients in a disease condition from all thestudy hospitals are grouped together, and if those patientsfrom the severity index levels not represented in all hospitalsare deleted from the group, one obtains a (trimmed) refer-ence population of patients which can be used to compareoutputs among the hospitals. The fraction of patients in eachof the four severity levels in the reference population can beused as weights to compute a weighted average charge for ahospital, using its own average charges for each of the fourseverity levels. This weighted average is exactly the expect-ed average trimmed charge for the disease condition for thehospital. Each hospital's own charge structure is used withthe same reference population to give the average chargewhich would be expected if they had all treated the sameseverity distribution of patients.
If a hospital's charges are monotonically increasing withincreasing severity level (as is usually the case), and if itsown patient population is more severely ill than the refer-ence population, then its overall average charges will behigher than its expected average trimmed charges. If its ownpatient population is less severely ill than the referencepopulation, then its overall average charges will be less thanits expected average trimmed charges.
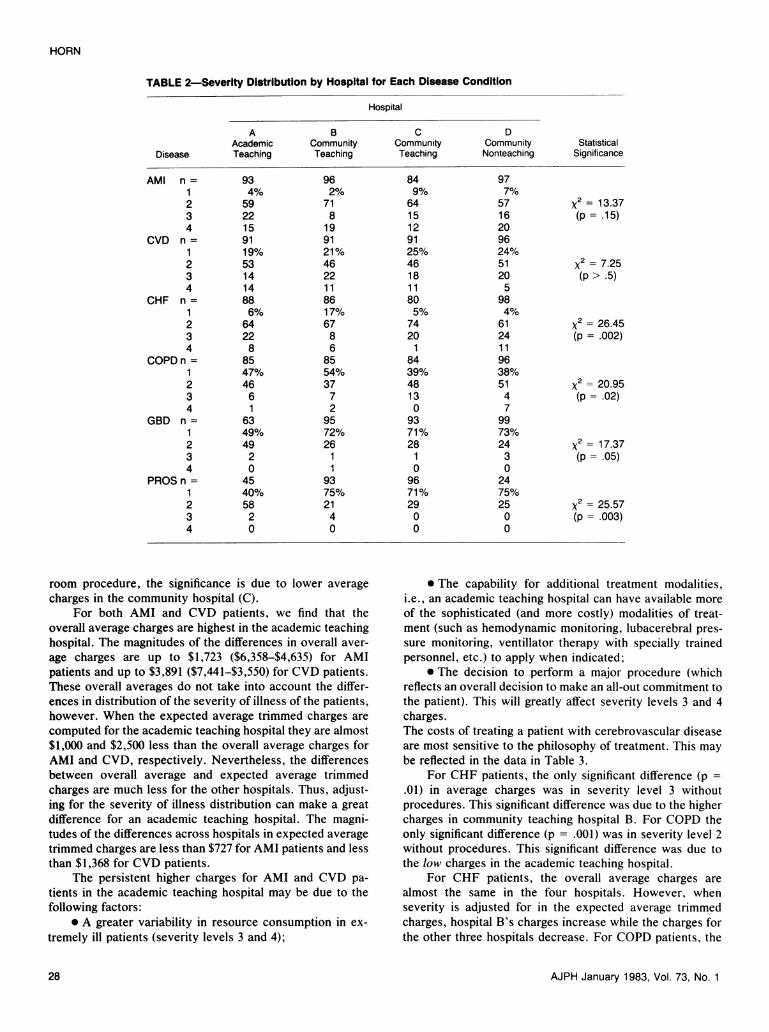
ResultsDistribution of Severity of Illness
In Table 2 we present the severity distributions for eachof our four study hospitals and for each of the six diseaseconditions. For acute myocardial infarction (AMI) and cere-brovascular disease (CVD), there is no statistically signifi-cant difference in distributions of severity of illness amongthe four hospitals. For the four remaining disease conditions,we found statistically significant differences in severity dis-tributions. For CHF, the community teaching hospital (B)had significantly fewer severely ill patients than the otherthree hospitals. For COPD, the community non-teachinghospital (D) had a more severe distribution than the commu-nity teaching hospital (B). For GBD and PROS, the academ-
*For example, in Table 3, the expected average trimmed chargefor AMI patients in the academic teaching hospital is ($2028 x 13 +$4784 x 202 + $9538 x 43)/258 = $5437.
ic teaching hospital (A) had a significantly more severedistribution.
At the beginning of our study, we hypothesized that theacademic teaching hospital (A) would see a more severely illdistribution of patients than the two community hospitalswith teaching programs (B, C), and that the least severedistribution would be in the community hospital with noteaching programs (D). The data in Table 2 show that thefirst part of the hypothesis was confirmed for the twosurgical conditions which we studied GBD and PROS.However, for CHF and COPD, hospital D had a more severedistribution than hospitals B and C.
The severity index measures the burden of illness of thepatient during the whole hospitalization. Patients may beplaced in higher severity levels if they enter the hospitalmore severely ill or if they become more severely ill while inthe hospital. Patients may become more severely ill throughthe natural course of their illness (despite the best possiblecare) or they can become more severely ill because of a lackof sufficiently vigorous treatment. We do not know whateffect quality of care may have had on our data. This is anarea which deserves further research.
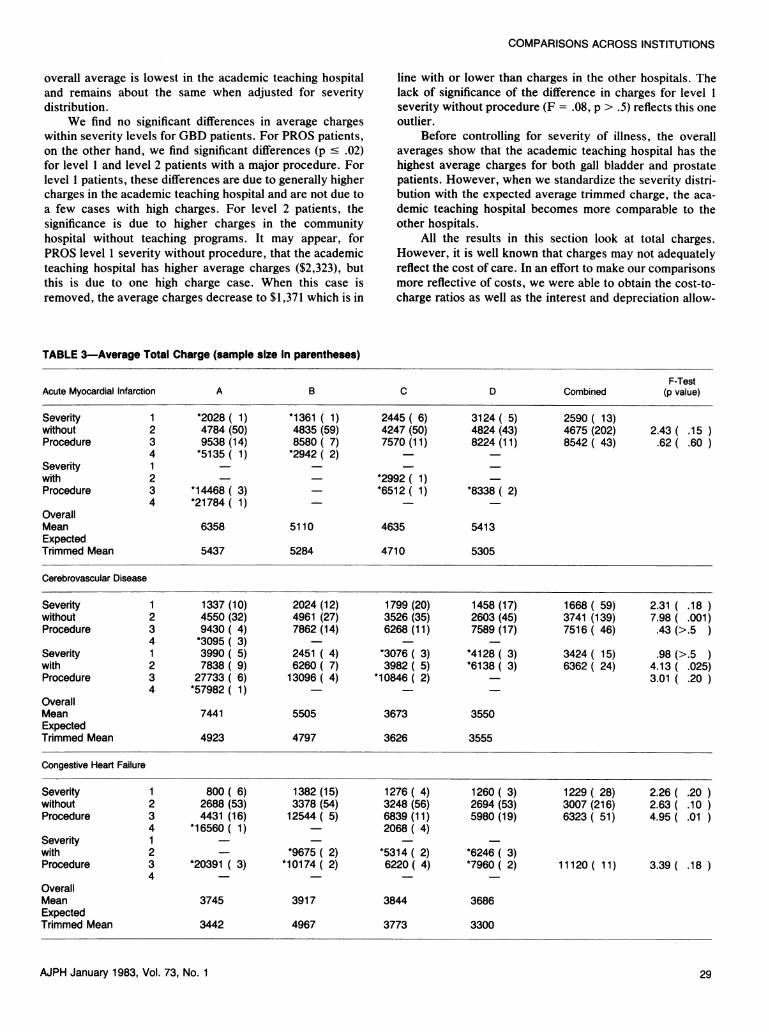
Comparison of Total Charges
In Table 3, we show the comparison of total charges inour four study hospitals for each of the six disease condi-tions, controlled for severity of illness and adjusted forprocedure. We have tried to make the data more comparableby removing deaths, miscodes, and transferred out casesfrom these analyses. For all six disease conditions we foundthat as severity increases so does the average charge, exceptin the four medical conditions for level 4 severity patientswithout procedure. This may reflect the fact that many suchpatients are perceived and treated as hopeless, and aredischarged to home or a nursing home to die. For example,two of the three patients in the academic teaching hospitalwith CVD in severity level 4 without procedure had a oneday length of stay.
Note, in Table 3, that for AMI patients within eachseverity level where there were enough cases, there were nosignificant differences (p > .05, one way analysis of varianceF test9) in average charges in our four study hospitals.Although for patients in severity level 3 with no proceduresthe average charge in the academic teaching hospital was$9,538 (higher than the averages in the other hospitals), theaverage was not significantly higher because this high aver-age was caused by only two of the 14 cases. When these twooutlier cases are removed, the average charge decreased to$8,072. The low value of the F test reflects the effect of thesetwo outliers and yields a non-significant difference in chargesfor level 3 AMI patients with no procedures among the fourhospitals.
On the other hand, we found that the CVD patients inseverity level 2, both with and without a major operatingroom procedure, had significantly different average charges(p < .025, one-way analysis of variance F test) across ourfour study hospitals. For level 2 patients without procedure,the significance is due to lower average charges in hospitalsC and D, while for level 2 patients with a major operating
AJPH January 1983, Vol. 73, No. 1 27
HORN
TABLE 2-Severity Distribution by Hospital for Each Disease Condition
Hospital
A B C DAcademic Community Community Community Statistical
Disease Teaching Teaching Teaching Nonteaching Significance
AMI n= 93 96 84 971 4% 2% 9% 7%2 59 71 64 57 x2= 13.373 22 8 15 16 (p=.15)4 15 19 12 20
CVD n= 91 91 91 961 19% 21% 25% 24%2 53 46 46 51 x2= 7.253 14 22 18 20 (p > .5)4 14 11 11 5
CHF n= 88 86 80 981 6% 17% 5% 4%2 64 67 74 61 x2= 26.453 22 8 20 24 (p=.002)4 8 6 1 11
COPD n= 85 85 84 961 47% 54% 39% 38%2 46 37 48 51 x2= 20.953 6 7 13 4 (p=.02)4 1 2 0 7
GBD n= 63 95 93 991 49% 72% 71% 73%2 49 26 28 24 x2= 17.373 2 1 1 3 (p=.05)4 0 1 0 0
PROS n= 45 93 96 241 40% 75% 71% 75%2 58 21 29 25 x2= 25.573 2 4 0 0 (p=.003)4 0 0 0 0
room procedure, the significance is due to lower averagecharges in the community hospital (C).
For both AMI and CVD patients, we find that theoverall average charges are highest in the academic teachinghospital. The magnitudes of the differences in overall aver-age charges are up to $1,723 ($6,358-$4,635) for AMIpatients and up to $3,891 ($7,441-$3,550) for CVD patients.These overall averages do not take into account the differ-ences in distribution of the severity of illness of the patients,however. When the expected average trimmed charges arecomputed for the academic teaching hospital they are almost$1,000 and $2,500 less than the overall average charges forAMI and CVD, respectively. Nevertheless, the differencesbetween overall average and expected average trimmedcharges are much less for the other hospitals. Thus, adjust-ing for the severity of illness distribution can make a greatdifference for an academic teaching hospital. The magni-tudes of the differences across hospitals in expected averagetrimmed charges are less than $727 for AMI patients and lessthan $1,368 for CVD patients.
The persistent higher charges for AMI and CVD pa-tients in the academic teaching hospital may be due to thefollowing factors:
* A greater variability in resource consumption in ex-tremely ill patients (severity levels 3 and 4);
* The capability for additional treatment modalities,i.e., an academic teaching hospital can have available moreof the sophisticated (and more costly) modalities of treat-ment (such as hemodynamic monitoring, lubacerebral pres-sure monitoring, ventillator therapy with specially trainedpersonnel, etc.) to apply when indicated;
* The decision to perform a major procedure (whichreflects an overall decision to make an all-out commitment tothe patient). This will greatly affect severity levels 3 and 4charges.The costs of treating a patient with cerebrovascular diseaseare most sensitive to the philosophy of treatment. This maybe reflected in the data in Table 3.
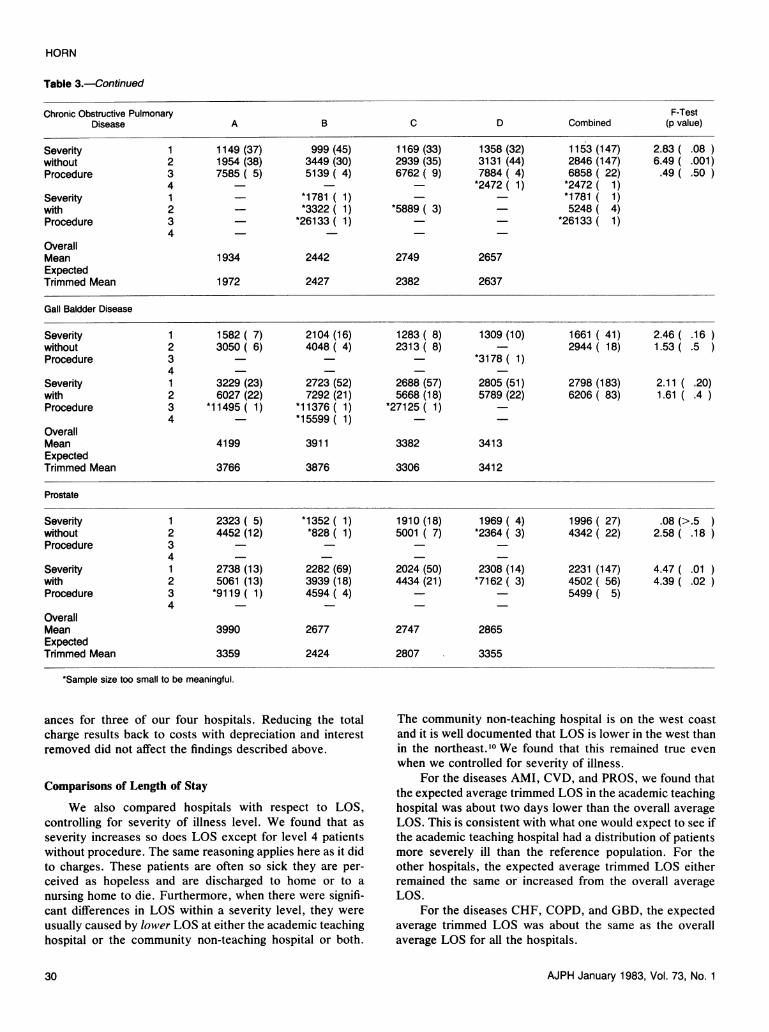
For CHF patients, the only significant difference (p =.01) in average charges was in severity level 3 withoutprocedures. This significant difference was due to the highercharges in community teaching hospital B. For COPD theonly significant difference (p = .001) was in severity level 2without procedures. This significant difference was due tothe low charges in the academic teaching hospital.
For CHF patients, the overall average charges arealmost the same in the four hospitals. However, whenseverity is adjusted for in the expected average trimmedcharges, hospital B's charges increase while the charges forthe other three hospitals decrease. For COPD patients, the
AJPH January 1983, Vol. 73, No. 128
COMPARISONS ACROSS INSTITUTIONS
overall average is lowest in the academic teaching hospitaland remains about the same when adjusted for severitydistribution.
We find no significant differences in average chargeswithin severity levels for GBD patients. For PROS patients,on the other hand, we find significant differences (p c .02)for level 1 and level 2 patients with a major procedure. Forlevel 1 patients, these differences are due to generally highercharges in the academic teaching hospital and are not due toa few cases with high charges. For level 2 patients, thesignificance is due to higher charges in the communityhospital without teaching programs. It may appear, forPROS level 1 severity without procedure, that the academicteaching hospital has higher average charges ($2,323), butthis is due to one high charge case. When this case isremoved, the average charges decrease to $1,371 which is in
line with or lower than charges in the other hospitals. Thelack of significance of the difference in charges for level 1severity without procedure (F = .08, p > .5) reflects this oneoutlier.
Before controlling for severity of illness, the overallaverages show that the academic teaching hospital has thehighest average charges for both gall bladder and prostatepatients. However, when we standardize the severity distri-bution with the expected average trimmed charge, the aca-demic teaching hospital becomes more comparable to theother hospitals.
All the results in this section look at total charges.However, it is well known that charges may not adequatelyreflect the cost of care. In an effort to make our comparisonsmore reflective of costs, we were able to obtain the cost-to-charge ratios as well as the interest and depreciation allow-
TABLE 3-Average Total Charge (sample size In parentheses)
F-TestAcute Myocardial Infarction A B C D Combined (p value)
Severity 1 *2028 ( 1) *1361 ( 1) 2445 ( 6) 3124 ( 5) 2590 ( 13)without 2 4784 (50) 4835 (59) 4247 (50) 4824 (43) 4675 (202) 2.43 ( .15Procedure 3 9538 (14) 8580( 7) 7570 (11) 8224 (11) 8542 ( 43) .62( .60
4 *5135( 1) *2942 (2)Severity 1with 2 *2992 (1)Procedure 3 *14468 ( 3) *6512 (1) *8338 ( 2)
4 *21784( 1) - -OverallMean 6358 5110 4635 5413ExpectedTrimmed Mean 5437 5284 4710 5305
Cerebrovascular Disease
Severity 1 1337 (10) 2024 (12) 1799 (20) 1458 (17) 1668 ( 59) 2.31 ( .18without 2 4550 (32) 4961 (27) 3526 (35) 2603 (45) 3741 (139) 7.98 ( .001)Procedure 3 9430 ( 4) 7862 (14) 6268 (11) 7589 (17) 7516 ( 46) .43 (>.5
4 *3095 (3)Severity 1 3990( 5) 2451 ( 4) *3076 ( 3) *4128 ( 3) 3424( 15) .98 (>.5with 2 7838 ( 9) 6260 ( 7) 3982 ( 5) *6138 ( 3) 6362 ( 24) 4.13 ( .025)Procedure 3 27733 ( 6) 13096 ( 4) *10846 ( 2) - 3.01 ( .20
4 *57982(1) - _OverallMean 7441 5505 3673 3550ExpectedTrimmed Mean 4923 4797 3626 3555
Congestive Heart Failure
Severity 1 800 ( 6) 1382 (15) 1276 ( 4) 1260 ( 3) 1229 ( 28) 2.26 ( .20without 2 2688 (53) 3378 (54) 3248 (56) 2694 (53) 3007 (216) 2.63 ( .10Procedure 3 4431 (16) 12544( 5) 6839 (11) 5980 (19) 6323( 51) 4.95( .01
4 *16560 1) 2068 (4)Severity 1with 2 - *9675 ( 2) *5314 ( 2) *6246 ( 3)Procedure 3 *20391 ( 3) *10174( 2) 6220( 4) *7960( 2) 11120( 11) 3.39( .18
4 _OverallMean 3745 3917 3844 3686ExpectedTrimmed Mean 3442 4967 3773 3300
AJPH January 1983, Vol. 73, No. 1 29
HORN
Table 3.-Continued
Chronic Obstructive Pulmonary F-TestDisease A B C D Combined (p value)
Severity 1 1149 (37) 999 (45) 1169 (33) 1358 (32) 1153 (147) 2.83 ( .08without 2 1954 (38) 3449 (30) 2939 (35) 3131 (44) 2846 (147) 6.49 ( .001)Procedure 3 7585 ( 5) 5139 ( 4) 6762 ( 9) 7884 ( 4) 6858 ( 22) .49 ( .50
4 - *2472 (1) *2472( 1)Severity 1 - *1781 ( 1) *1781 ( 1)with 2 - *3322 (1) *5889 ( 3) 5248 ( 4)Procedure 3 *26133 (1) *26133 ( 1)
4OverallMean 1934 2442 2749 2657ExpectedTrimmed Mean 1972 2427 2382 2637
Gall Baldder Disease
Severity 1 1582 ( 7) 2104 (16) 1283 ( 8) 1309 (10) 1661 ( 41) 2.46 ( .16without 2 3050 ( 6) 4048 ( 4) 2313 ( 8) - 2944 ( 18) 1.53 ( .5Procedure 3 *3178 ( 1)
4Severity 1 3229 (23) 2723 (52) 2688 (57) 2805 (51) 2798 (183) 2.11 ( .20)with 2 6027 (22) 7292 (21) 5668 (18) 5789 (22) 6206 ( 83) 1.61 ( .4Procedure 3 *11495 ( 1) *11376( 1) *27125 ( 1)
4 *15599 (1)OverallMean 4199 3911 3382 3413ExpectedTrimmed Mean 3766 3876 3306 3412
Prostate
Severity 1 2323 ( 5) *1352 ( 1) 1910 (18) 1969 ( 4) 1996 ( 27) .08 (>.5without 2 4452 (12) *828 ( 1) 5001 ( 7) *2364 ( 3) 4342 ( 22) 2.58 ( .18Procedure 3
4Severity 1 2738 (13) 2282 (69) 2024 (50) 2308 (14) 2231 (147) 4.47 ( .01with 2 5061 (13) 3939 (18) 4434 (21) *7162 ( 3) 4502 ( 56) 4.39 ( .02Procedure 3 *9119( 1) 4594( 4) - - 5499( 5)
4 -
OverallMean 3990 2677 2747 2865ExpectedTrimmed Mean 3359 2424 2807 3355
*Sample size too small to be meaningful.
ances for three of our four hospitals. Reducing the totalcharge results back to costs with depreciation and interestremoved did not affect the findings described above.
Comparisons of Length of Stay
We also compared hospitals with respect to LOS,controlling for severity of illness level. We found that asseverity increases so does LOS except for level 4 patientswithout procedure. The same reasoning applies here as it didto charges. These patients are often so sick they are per-ceived as hopeless and are discharged to home or to anursing home to die. Furthermore, when there were signifi-cant differences in LOS within a severity level, they wereusually caused by lower LOS at either the academic teachinghospital or the community non-teaching hospital or both.
The community non-teaching hospital is on the west coastand it is well documented that LOS is lower in the west thanin the northeast.10 We found that this remained true evenwhen we controlled for severity of illness.
For the diseases AMI, CVD, and PROS, we found thatthe expected average trimmed LOS in the academic teachinghospital was about two days lower than the overall averageLOS. This is consistent with what one would expect to see ifthe academic teaching hospital had a distribution of patientsmore severely ill than the reference population. For theother hospitals, the expected average trimmed LOS eitherremained the same or increased from the overall averageLOS.
For the diseases CHF, COPD, and GBD, the expectedaverage trimmed LOS was about the same as the overallaverage LOS for all the hospitals.
AJPH January 1983, Vol. 73, No. 130
COMPARISONS ACROSS INSTITUTIONS
Discussion
We have described a new severity of illness index whichis generic and has been used to classify medical and surgicalinpatients. We have found that, when we control for severityof illness and adjust for major operating room procedure, thedifferences in total charges, total costs, and LOS acrossvarious types of hospitals frequently disappear.
Both federal and state governments are now beginningto use discharge abstract data to form case mix groups tocompare resource consumption across hospitals. Majorteaching hospitals are often found to have the highestresource consumption using these techniques and the opin-ion has been expressed that the health care industry cannotafford the luxury of the expensive care offered in teachinghospitals. Our results show that when resource consumptionis adjusted for severity of illness, the wide differences amongmajor teaching hospitals and other community hospitals inour study disappear or become much smaller.
If severity of illness is not taken into account whendeveloping prospective reimbursement policies, detrimentaleffects may occur which could impact the whole medicalcare system in the United States. For example, it has beenproposed that medical insurance be adjusted to cover onlythe average charge for a principal diagnosis or DRG in theleast expensive hospital in a community. Under such apolicy, as our data in Table 3 illustrate, a patient who went tothe academic teaching hospital for an acute myocardialinfarction would be reimbursed $4,635 (lowest overall aver-age charge for AMI) but would have to pay out-of-pocket thedifference, $1,723 ($6,358-$4,635), or the academic teachinghospital would have to write off the difference or not take thepatient. However, when the distribution of severity of illnessis adjusted for by using the expected average trimmedcharge, the difference is only $727 ($5,437-$4,710), almost$1,000 less.
With increasing scrutiny of hospital costs, it is impor-tant to be able to analyze the output of a hospital so that aninstitution which provides care to severely ill patients can bedifferentiated from an institution which provides care to lessseverely ill patients; intrinsically higher costs for the formerinstitution may not be unreasonable. Attempts have beenmade in the past to differentiate institutions using case mixmethods which many hospital administrators and physicians
have felt were insufficiently sensitive to real differences inburden of illness. The severity of illness index is an attemptto correct this problem; it is now being used successfully byseveral hospitals in the United States.
If a prospective reimbursement system is not institutedin a way which adjusts for the severity of case mix, then wemay see the academic teaching hospitals selectively refusingto take federally insured patients who do not have anotherform of health insurance. As a result, we could see anamplification of the two-tiered system of health care deliveryin this country.
REFERENCES1. Fetter RB, Shin Y, Freeman JL, et al: Case mix definitions by
diagnosis-related groups. Med Care 1980; 18:1-53.2. Horn SD, Sharkey PD, Bertram DA: Measuring severity of
illness: homogeneous case mix groups. Med Care (in press).3. A Prospective Reimbursement System Based on Patient Case-
Mix for New Jersey Hospitals. 1976-1983. Trenton: New JerseyState Dept of Health, September 30, 1980.
4. Garg, ML, Louis DZ, Gliebe WA, et al: Evaluating inpatientcosts: the staging mechanism. Med Care 1978; 16:191-201.
5. Young WW: Measuring the cost of care using generalizedpatient management paths. Year I Final Report. Pittsburgh:Blue Cross of Western Pennsylvania, November 1979.
6. Horn SD: The role of severity-adjusted case mix in hospitalmanagement. Hospitals (in press).
7. Draper E, Wagner D, Knaus W: The use of intensive care: acomparison of a university and community hospital. HealthCare Financing Review 1981; 3:49-64.
8. Horn SD, Chan C, Chachich B, Clopton C: Measuring severityof illness: a reliability study. Med Care (in press).
9. Zar JH: Biostatistical Analysis. Englewood Cliffs, NJ: Prentice-Hall Inc., 1974.
10. Bertram DA, Schumacher DN, Horn SD, Clopton CJ, Lord JG,Chan C: Hospital case mix groupings and generic algorithms.QRB 1982; 8:24-30.
ACKNOWLEDGMENTSIt is a pleasure to acknowledge Gregory B. Bulkley, MD for his
valuable comments, Phoebe D. Sharkey for computer analyses,Kathleen O'Boyle as research assistant, and Susan Stern for techni-cal administration of this study. We also acknowledge the help ofRichard Gross, MD, ScD, Gregory B. Bulkley, MD, George Roveti,MD, FACP, Sharon Kreitzer, RN, Dale N. Schumacher, MD, MEd,and Dennis Bertram, MD, MPH, ScD, in conceptualizing theseverity of illness index. This work was funded in part by the HealthCare Financing Administration, Grant 18P-97045.
ADDENDUM
The current version of the Severity of Illness Index is now being used by many institutions acrossthe United States. These institutions are collecting Severity of Illness data for purposes such as internalhospital management, examination of differences in physician practice patterns, strategic planning, andcross hospital comparisons. In California and Maryland there are plans to use the Severity of IllnessIndex for prospective reimbursement purposes. Instead of using a case mix grouping system such asDRGs, 19 diagnostic codes, or the CPHA-PAS A list to define the group into which a patient is placedto set a reimbursement level, the Severity of Illness Index is used within groups of diagnostic codesrelated to an organ system or to a service such as obstetrics, gynecology, or pediatrics; reimbursementwill be based on the severity level within that group.
AJPH January 1983, Vol. 73, No. 1 31