PCT – Statistics
41
PCT – Statistics Patent Cooperation Treaty (PCT) Working Group Fifth Session Geneva, May 29 to June 1, 2012
-
Upload
laura-myers -
Category
Documents
-
view
35 -
download
0
description
PCT – Statistics. Patent Cooperation Treaty (PCT) Working Group Fifth Session Geneva, May 29 to June 1, 2012. Outline. PCT International Filings Trends and Forecasts Origin of Applicants – Country, Region, Type of Applicant Field of Technology Medium of Filing Languages - PowerPoint PPT Presentation
Transcript of PCT – Statistics

PCT – Statistics
Patent Cooperation Treaty (PCT) Working Group
Fifth Session
Geneva, May 29 to June 1, 2012

Outline1) PCT International Filings
1) Trends and Forecasts2) Origin of Applicants – Country, Region, Type of Applicant3) Field of Technology4) Medium of Filing5) Languages
2) PCT National Phase Entries1) Trends and Comparison with Direct “Paris” Filings2) Origin of Applicants3) Offices
3) Receiving Offices4) International Authorities5) PCT – Patent Prosecution Highway
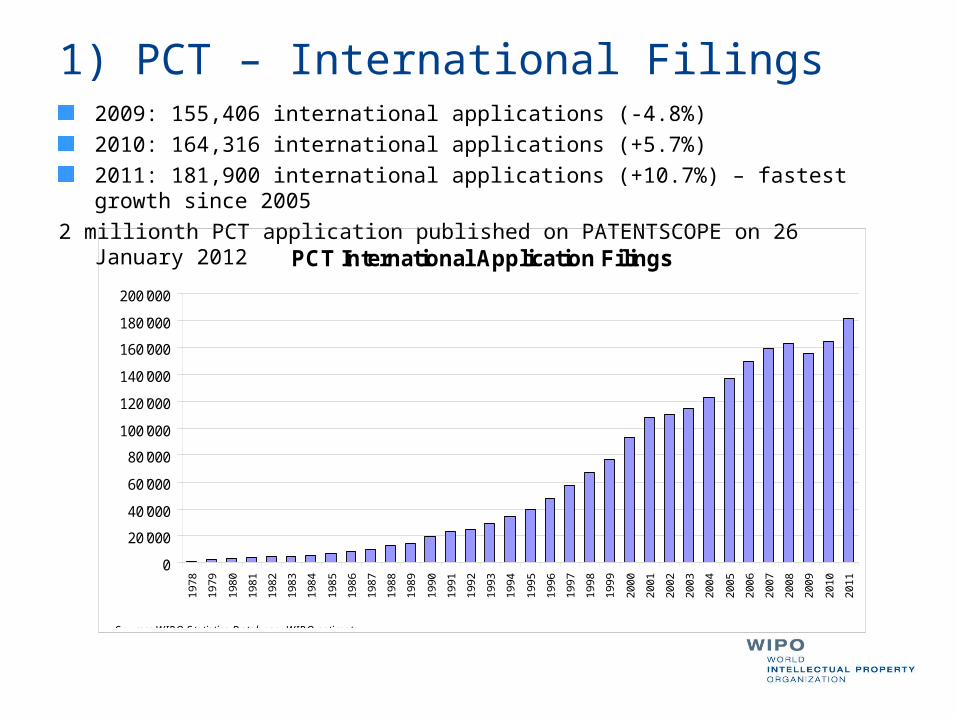
1) PCT – International Filings2009: 155,406 international applications (-4.8%)
2010: 164,316 international applications (+5.7%)
2011: 181,900 international applications (+10.7%) – fastest growth since 2005
2 millionth PCT application published on PATENTSCOPE on 26 January 2012
PCT International Application Filings
0
20'000
40'000
60'000
80'000
100'000
120'000
140'000
160'000
180'000
200'000
1978
1979
1980
1981
1982
1983
1984
1985
1986
1987
1988
1989
1990
1991
1992
1993
1994
1995
1996
1997
1998
1999
2000
2001
2002
2003
2004
2005
2006
2007
2008
2009
2010
2011
Source: WIPO Statistics Database; WIPO estimate

Trends in PCT Applications
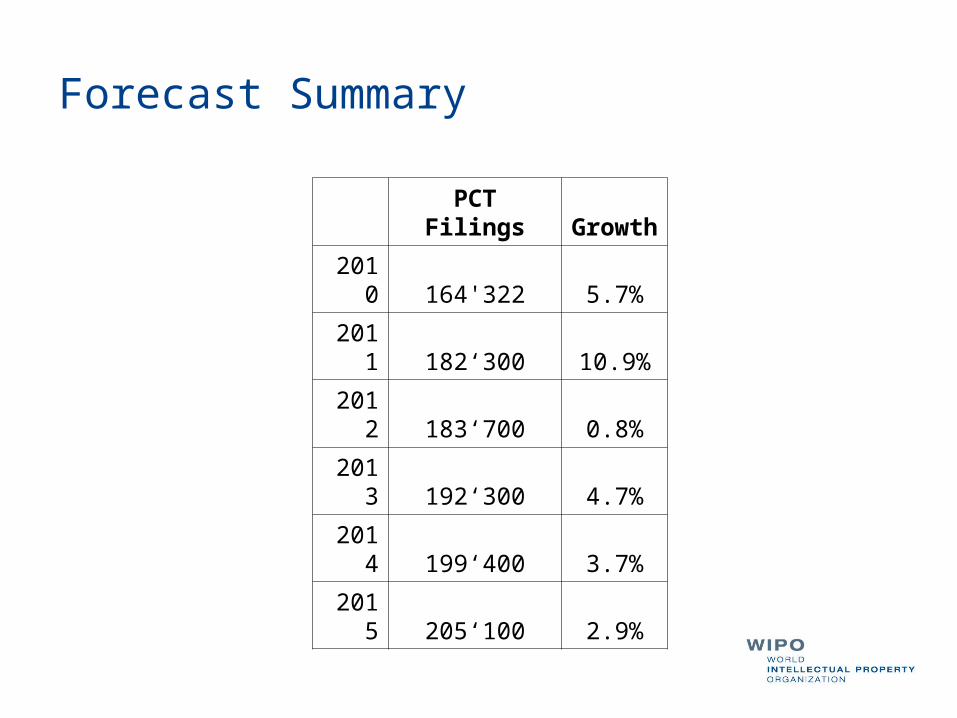
Forecast Summary
PCT Filings Growth
2010 164'322 5.7%
2011 182‘300 10.9%
2012 183‘700 0.8%
2013 192‘300 4.7%
2014 199‘400 3.7%
2015 205‘100 2.9%
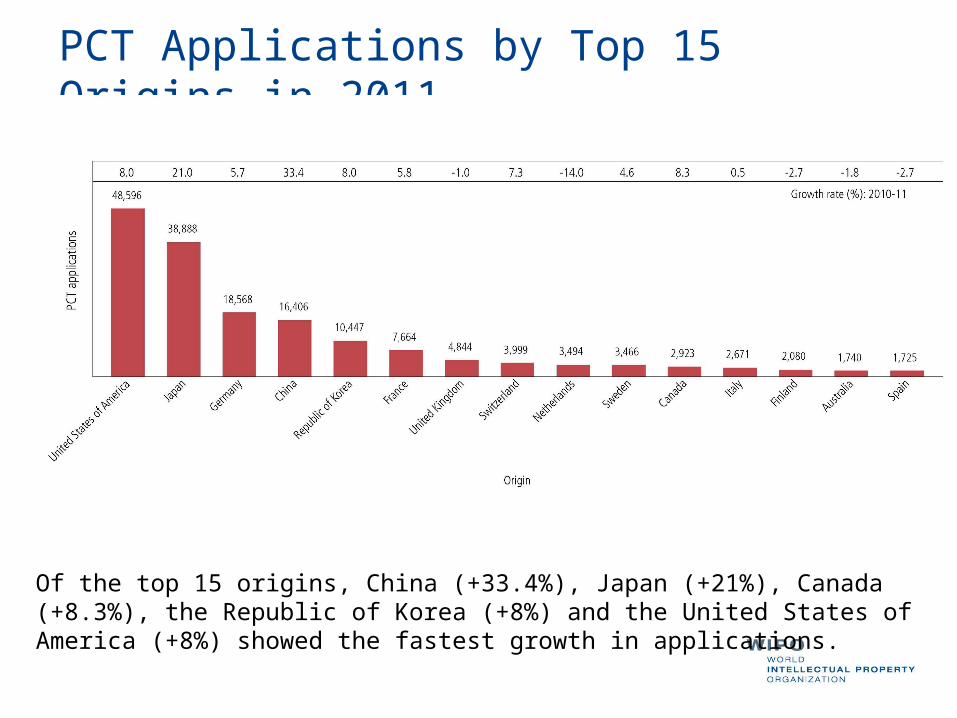
PCT Applications by Top 15 Origins in 2011
Of the top 15 origins, China (+33.4%), Japan (+21%), Canada (+8.3%), the Republic of Korea (+8%) and the United States of America (+8%) showed the fastest growth in applications.
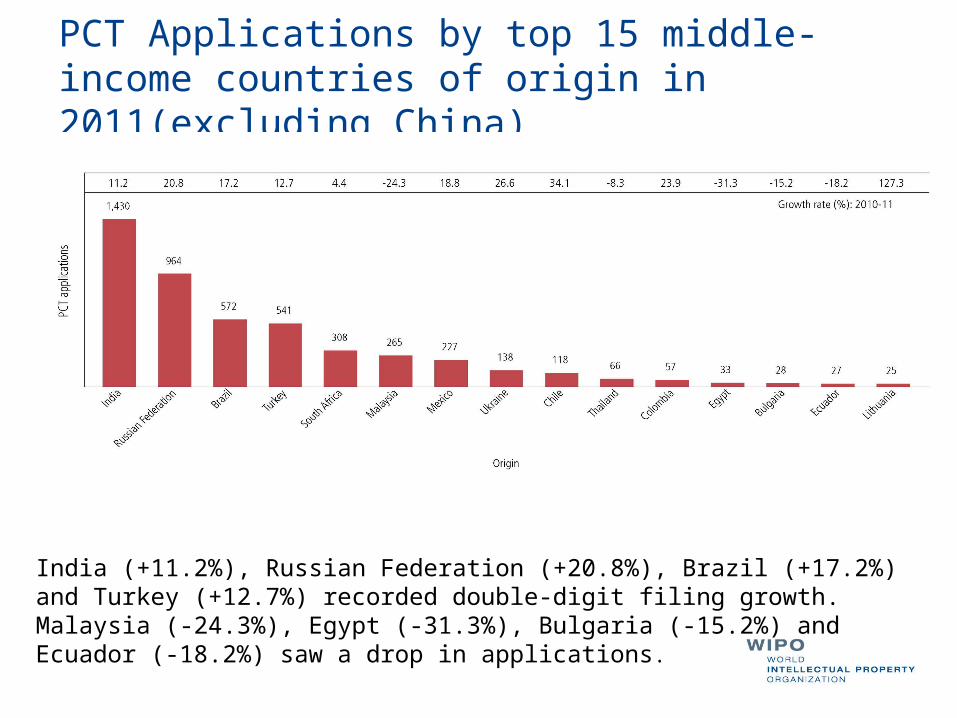
PCT Applications by top 15 middle-income countries of origin in 2011(excluding China)
India (+11.2%), Russian Federation (+20.8%), Brazil (+17.2%) and Turkey (+12.7%) recorded double-digit filing growth. Malaysia (-24.3%), Egypt (-31.3%), Bulgaria (-15.2%) and Ecuador (-18.2%) saw a drop in applications.
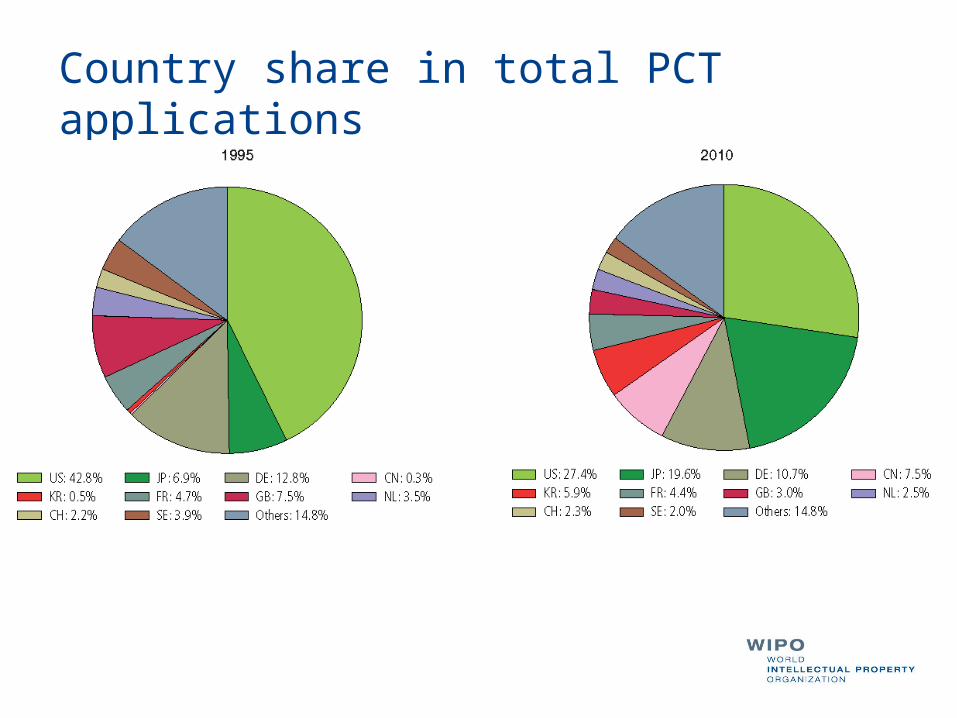
Country share in total PCT applications
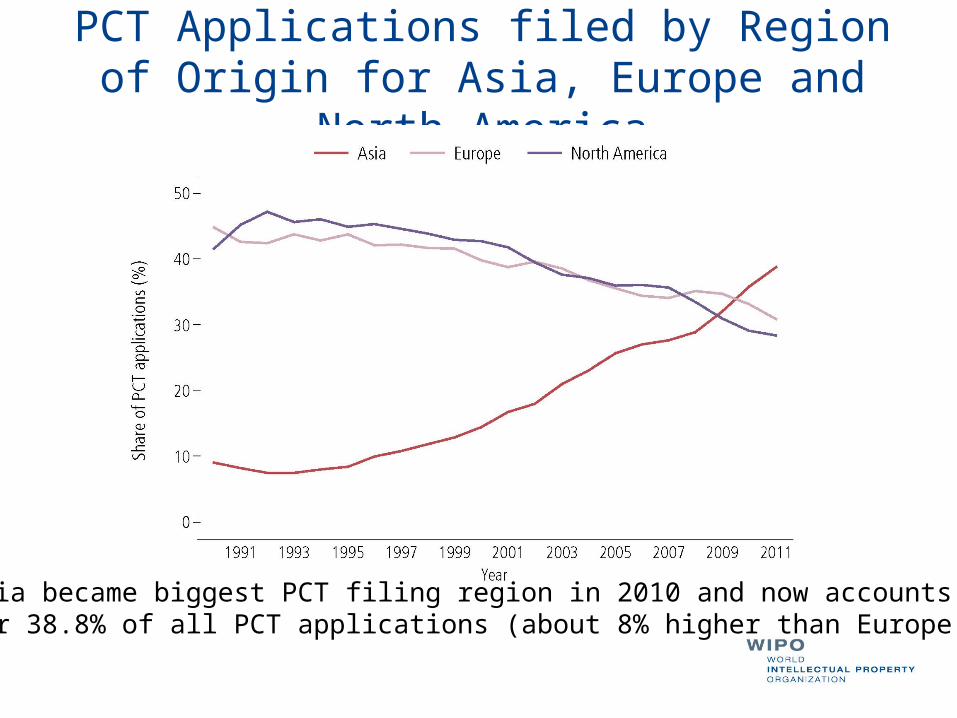
PCT Applications filed by Region of Origin for Asia, Europe and North America
Asia became biggest PCT filing region in 2010 and now accountsfor 38.8% of all PCT applications (about 8% higher than Europe)
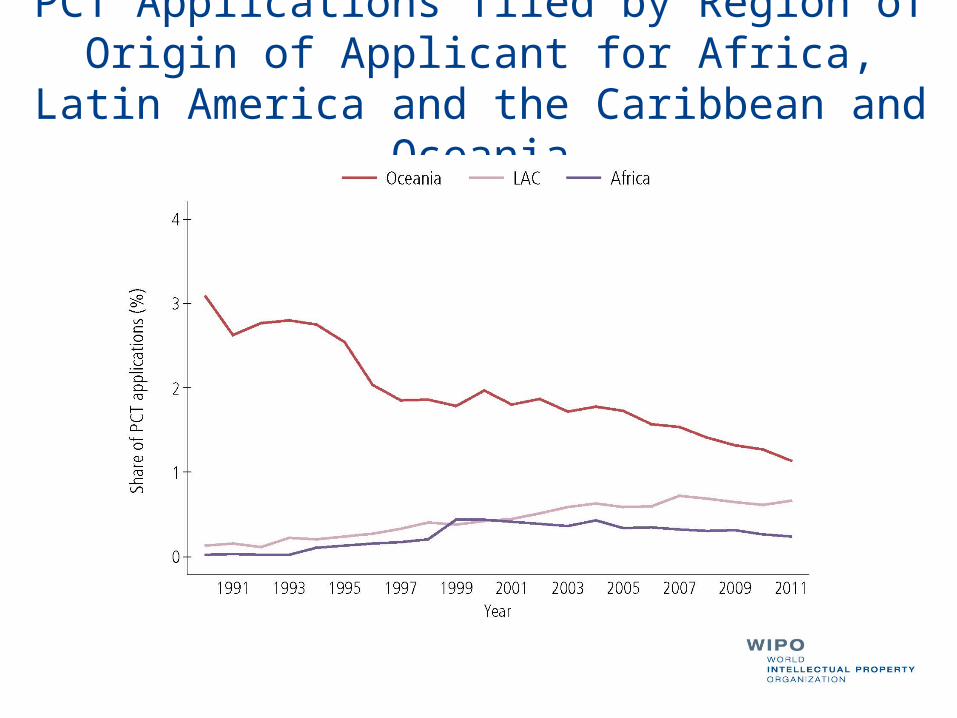
PCT Applications filed by Region of Origin of Applicant for Africa, Latin America and the
Caribbean and Oceania
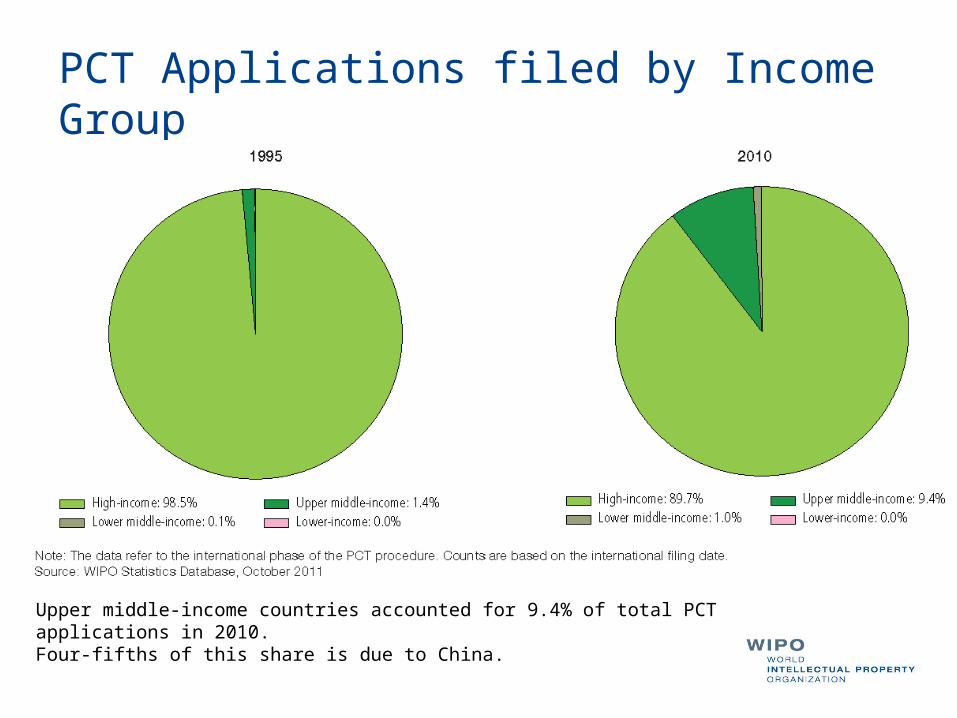
PCT Applications filed by Income Group
Upper middle-income countries accounted for 9.4% of total PCT applications in 2010. Four-fifths of this share is due to China.
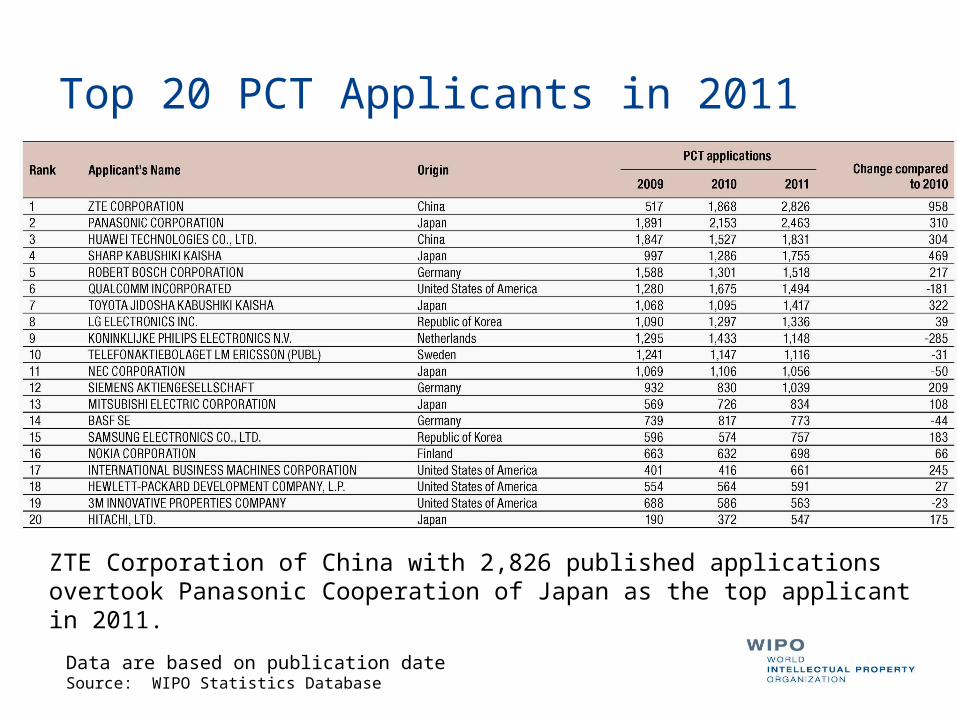
Top 20 PCT Applicants in 2011
Data are based on publication dateSource: WIPO Statistics Database
ZTE Corporation of China with 2,826 published applications overtook Panasonic Cooperation of Japan as the top applicant in 2011.
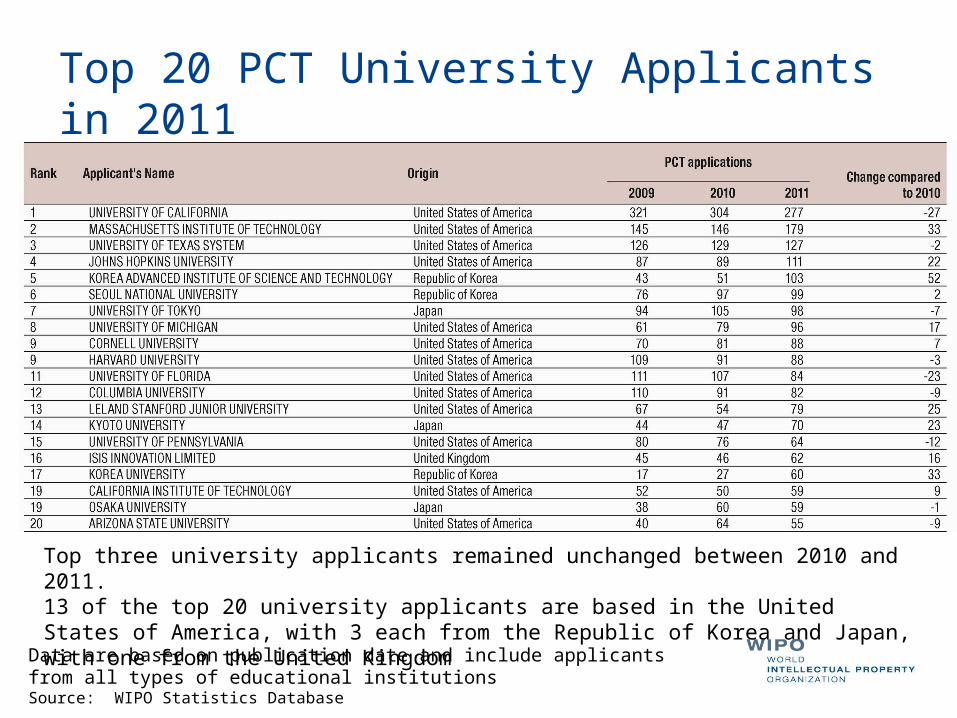
Top 20 PCT University Applicants in 2011
Data are based on publication date and include applicants from all types of educational institutionsSource: WIPO Statistics Database
Top three university applicants remained unchanged between 2010 and 2011.13 of the top 20 university applicants are based in the United States of America, with 3 each from the Republic of Korea and Japan, with one from the United Kingdom
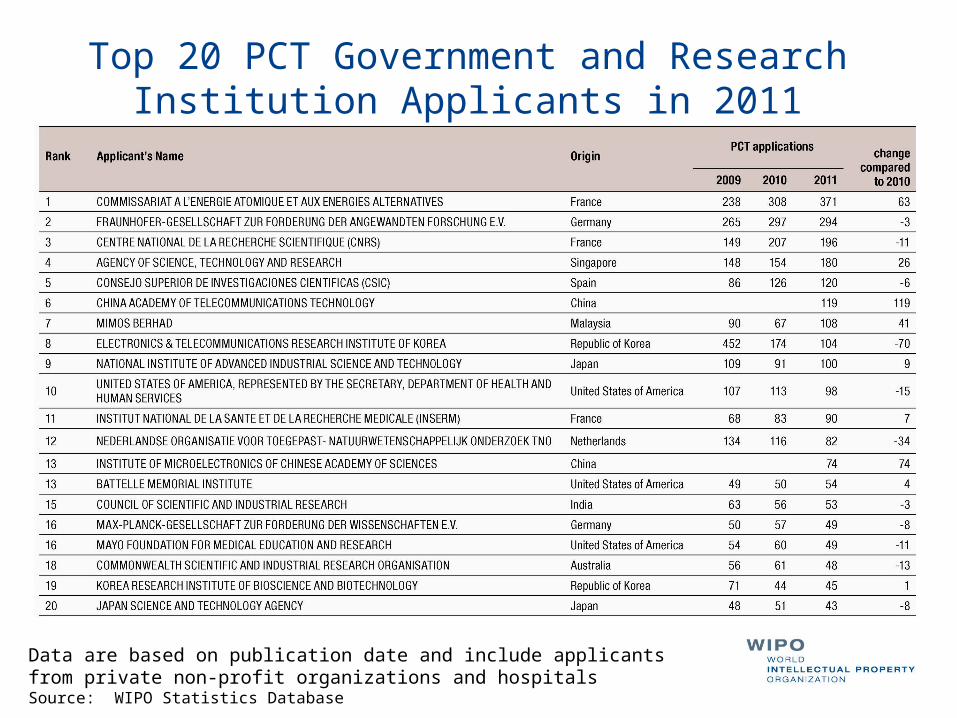
Top 20 PCT Government and Research Institution Applicants in 2011
Data are based on publication date and include applicants from private non-profit organizations and hospitalsSource: WIPO Statistics Database
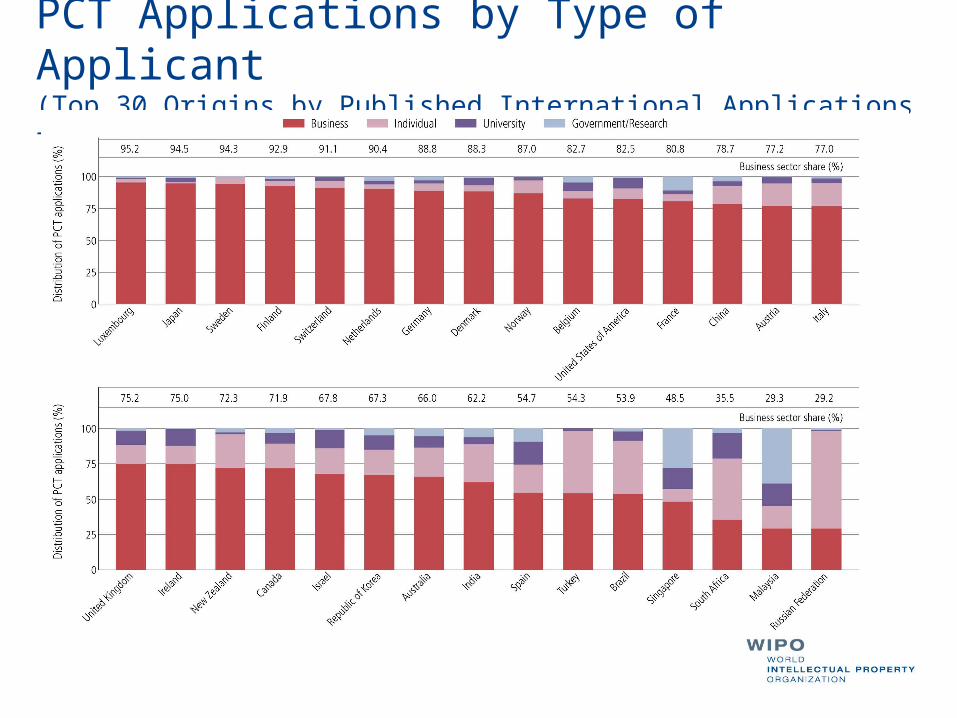
PCT Applications by Type of Applicant (Top 30 Origins by Published International Applications for 2011)
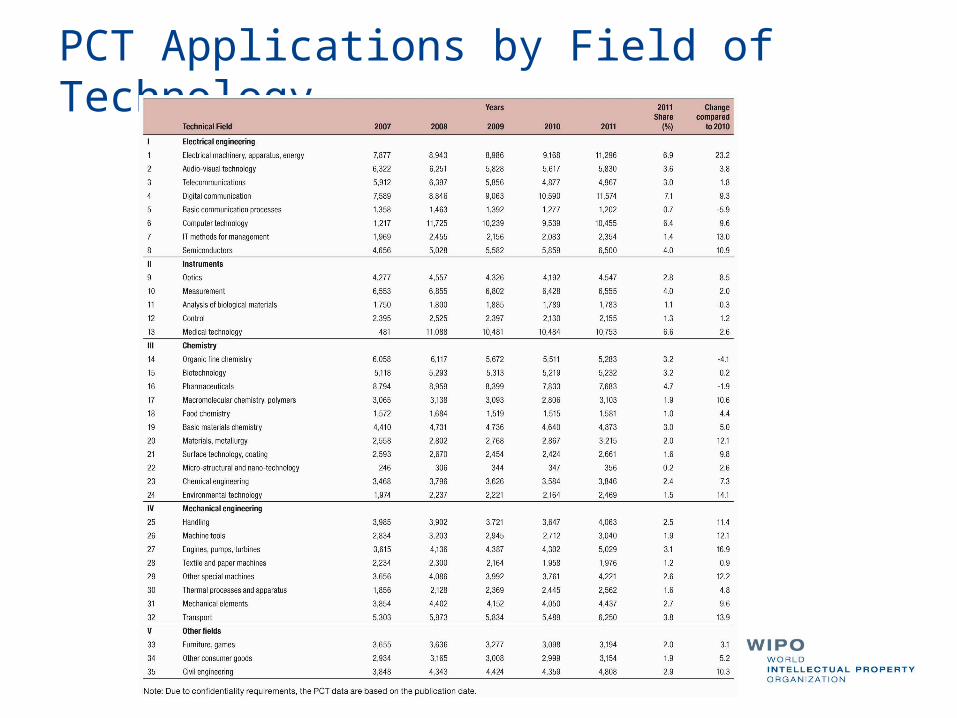
PCT Applications by Field of Technology
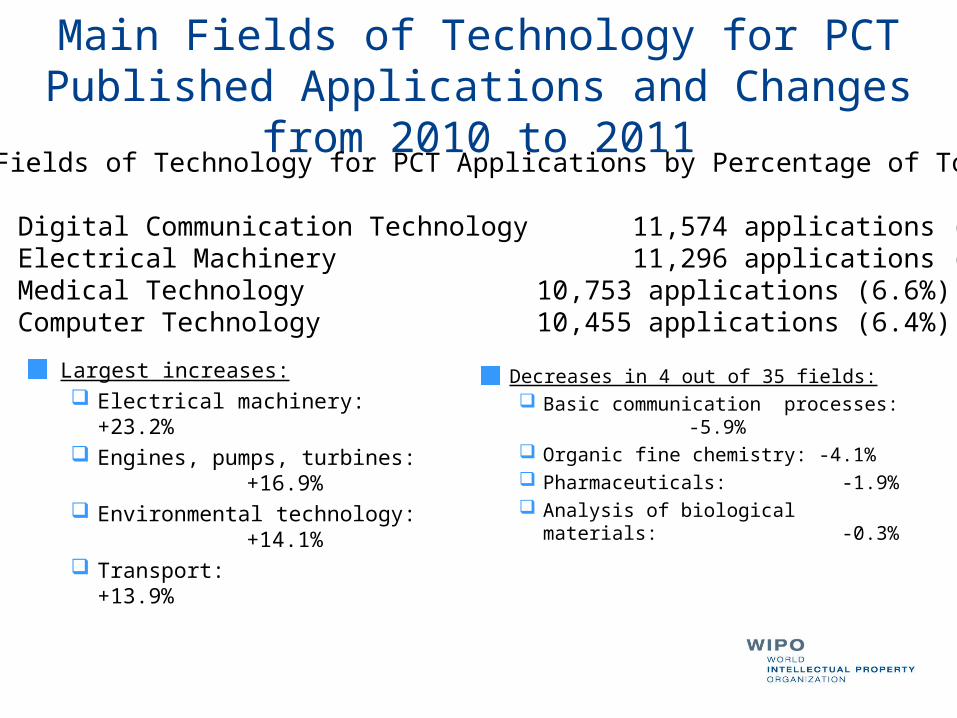
Main Fields of Technology for PCT Published Applications and Changes from 2010 to 2011
Largest increases: Electrical machinery: +23.2% Engines, pumps, turbines:
+16.9%
Environmental technology:
+14.1% Transport: +13.9%
Decreases in 4 out of 35 fields: Basic communication processes:
-5.9% Organic fine chemistry: -4.1% Pharmaceuticals: -1.9% Analysis of biological materials:
-0.3%
Main Fields of Technology for PCT Applications by Percentage of Total:
Digital Communication Technology 11,574 applications (7.1%) Electrical Machinery 11,296 applications (6.9%) Medical Technology 10,753 applications (6.6%) Computer Technology 10,455 applications (6.4%)
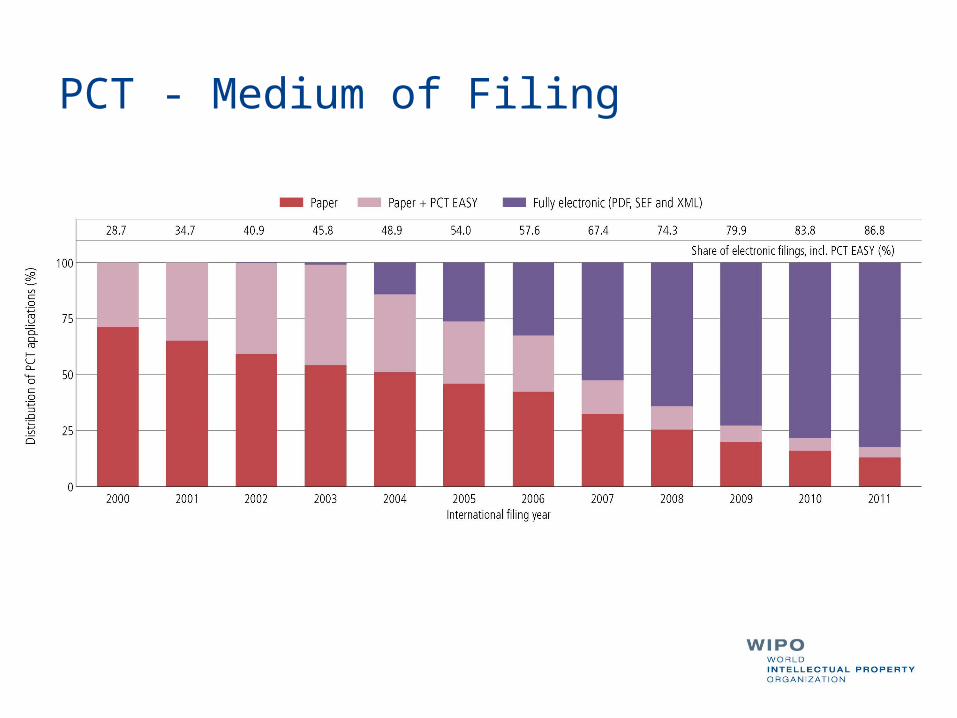
PCT - Medium of Filing
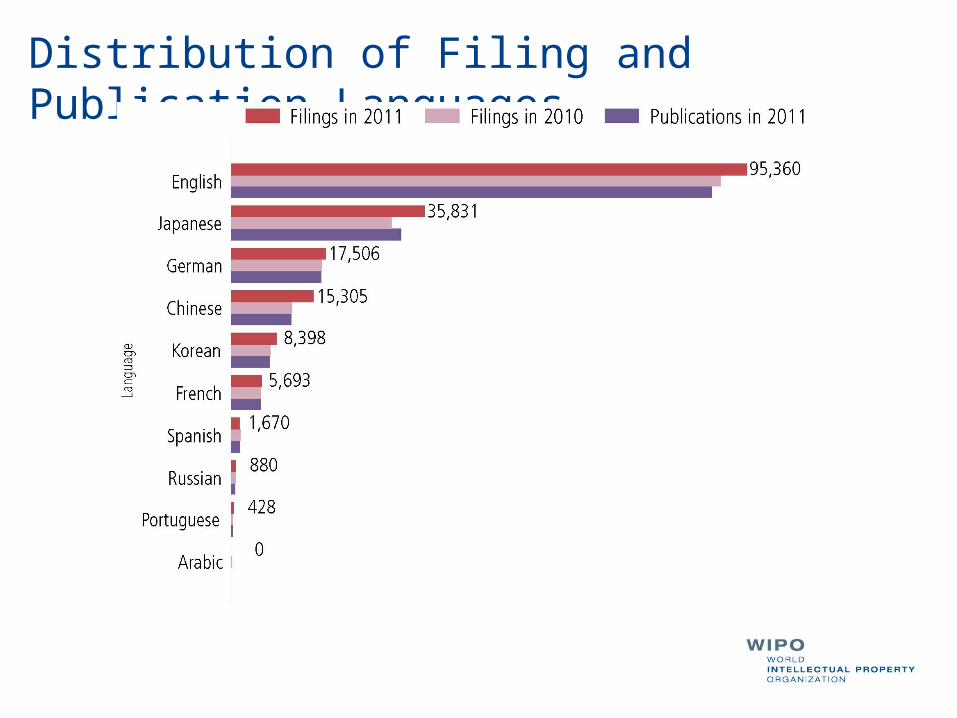
Distribution of Filing and Publication Languages
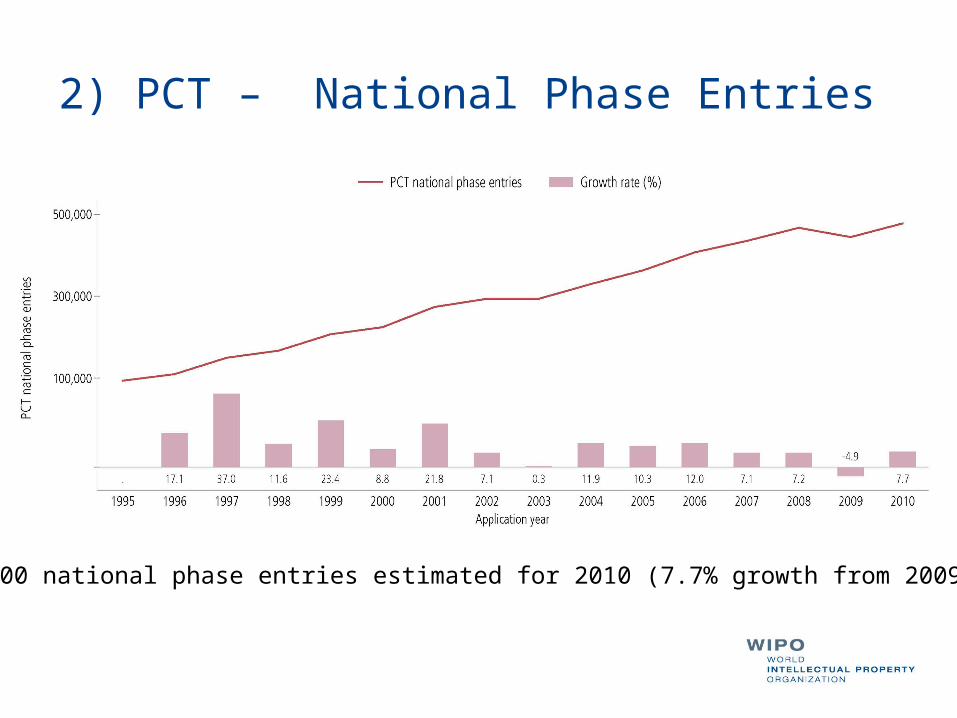
2) PCT – National Phase Entries
477,500 national phase entries estimated for 2010 (7.7% growth from 2009)

PCT National Phase Entries for Top 15 Origins 2010
All top 15 origins except the Netherlands saw growth in National Phase Entries.China witnessed the highest growth in National Phase Entries of 46.8%.
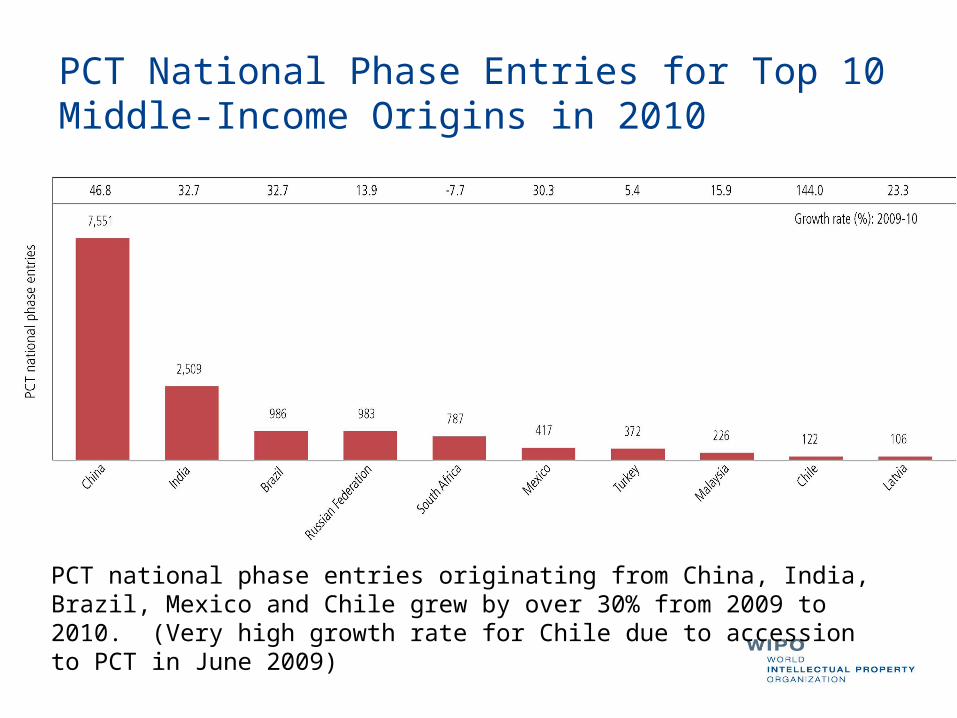
PCT National Phase Entries for Top 10 Middle-Income Origins in 2010
PCT national phase entries originating from China, India, Brazil, Mexico and Chile grew by over 30% from 2009 to 2010. (Very high growth rate for Chile due to accession to PCT in June 2009)
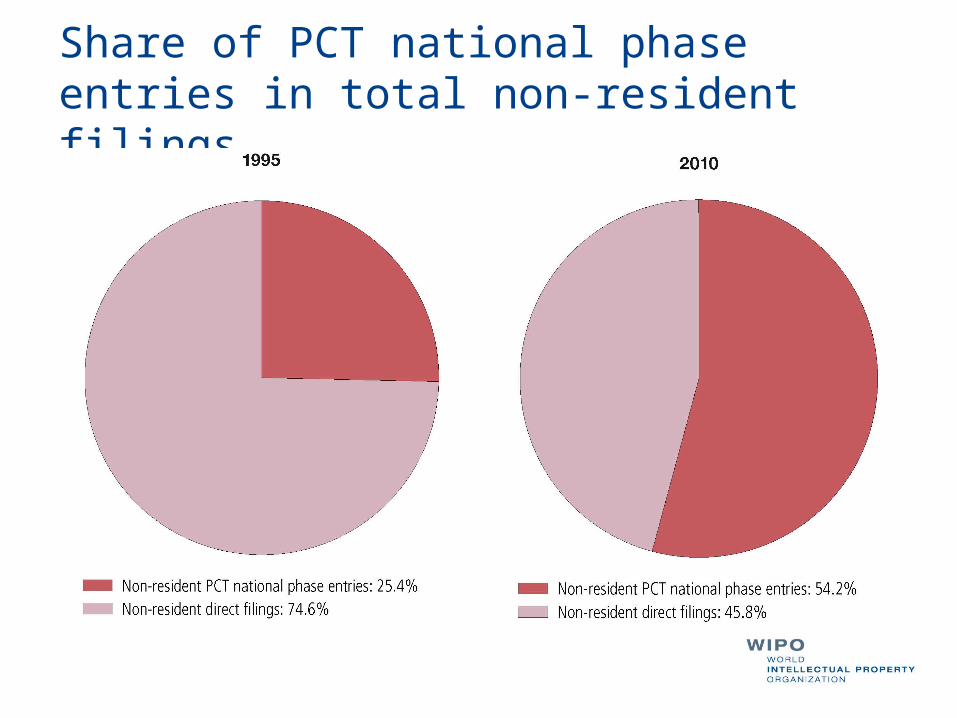
Share of PCT national phase entries in total non-resident filings
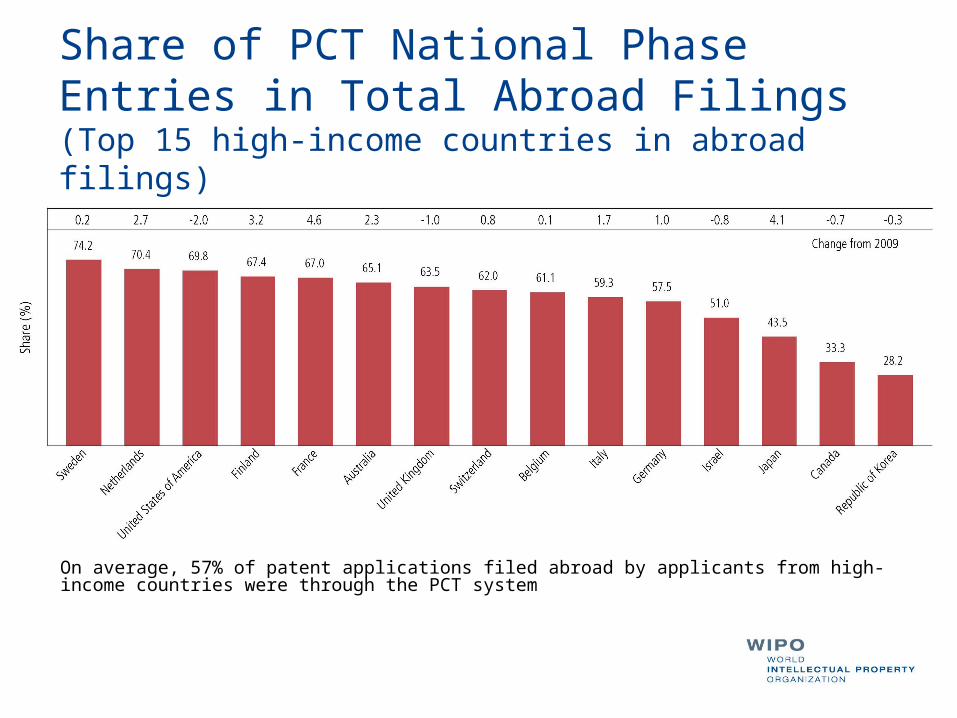
Share of PCT National Phase Entries in Total Abroad Filings(Top 15 high-income countries in abroad filings)
On average, 57% of patent applications filed abroad by applicants from high-income countries were through the PCT system
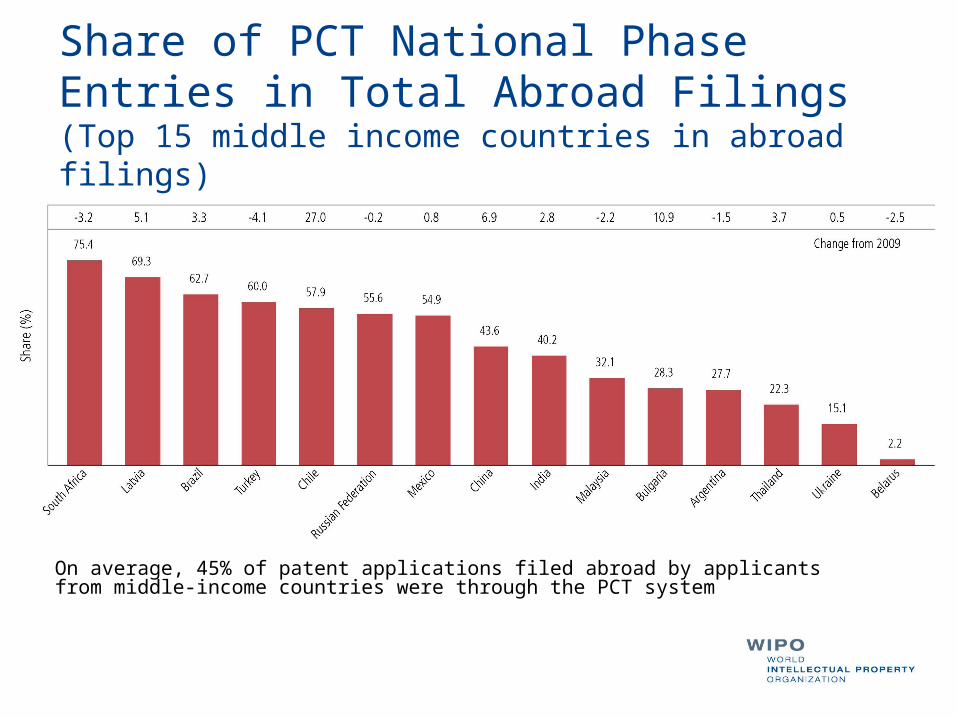
Share of PCT National Phase Entries in Total Abroad Filings(Top 15 middle income countries in abroad filings)
On average, 45% of patent applications filed abroad by applicants from middle-income countries were through the PCT system

PCT National Phase Entries for Top 10 Offices 2010
Top 10 Offices accounted for 86% of total national phase entries in 2010.16.3% growth in national phase entries at USPTO in 2010 to become most preferred Office by destination (previously EPO since at least 1995). * Figures for India are for 2009 data.
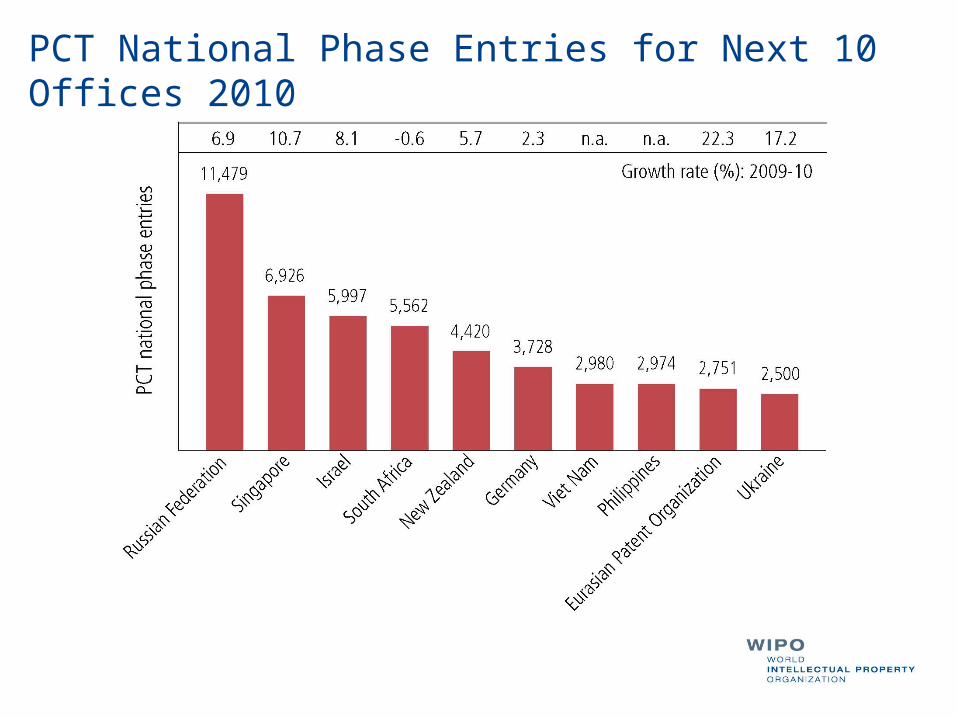
PCT National Phase Entries for Next 10 Offices 2010
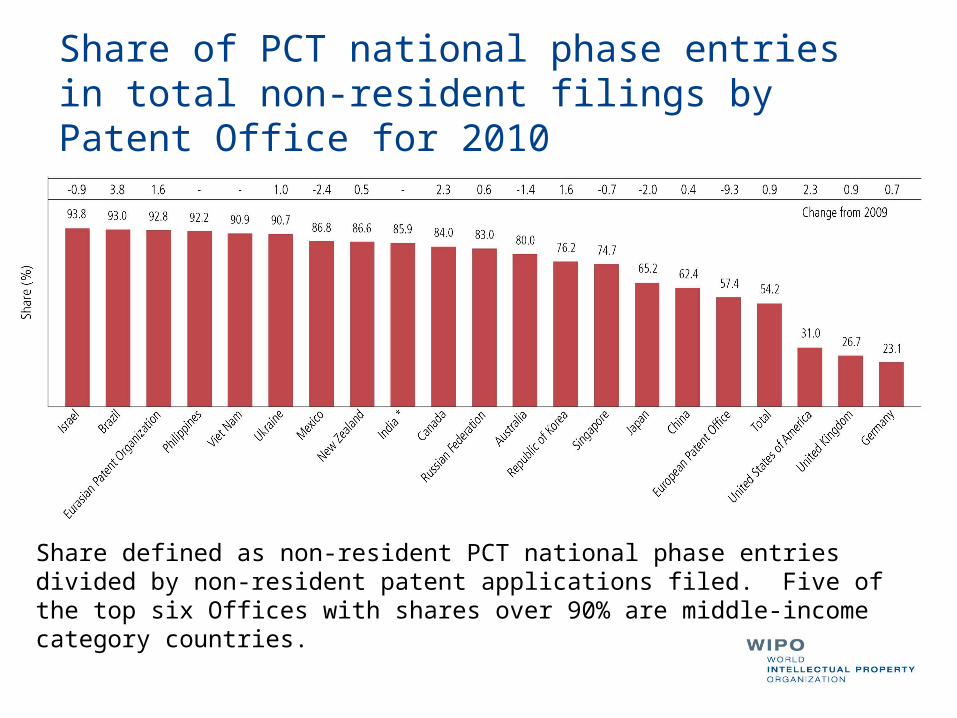
Share of PCT national phase entries in total non-resident filings by Patent Office for 2010
Share defined as non-resident PCT national phase entries divided by non-resident patent applications filed. Five of the top six Offices with shares over 90% are middle-income category countries.
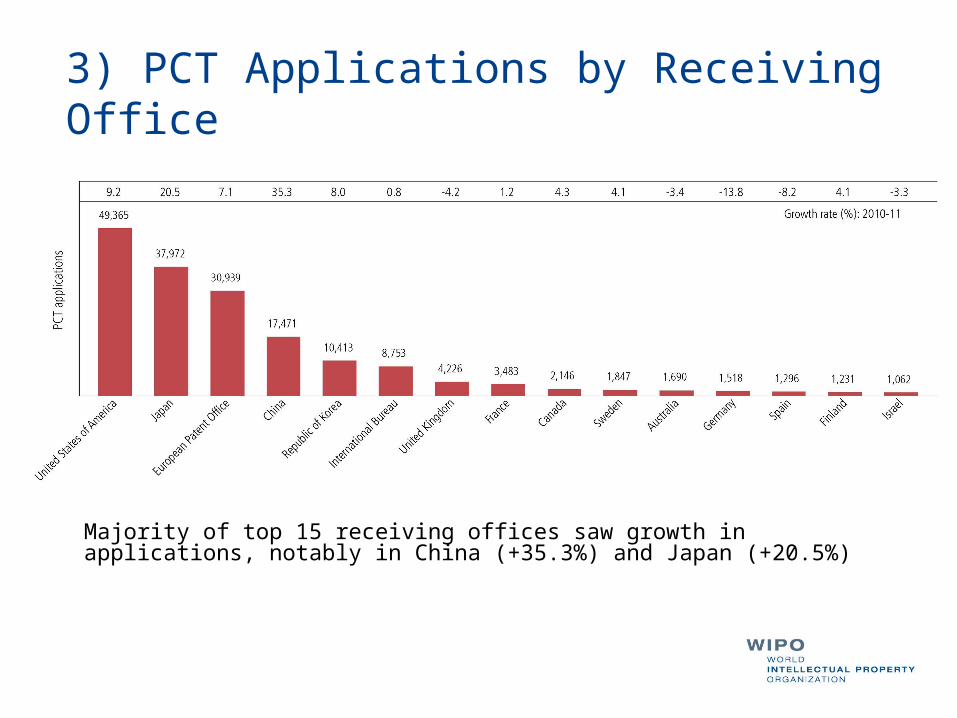
3) PCT Applications by Receiving Office
Majority of top 15 receiving offices saw growth in applications, notably in China (+35.3%) and Japan (+20.5%)
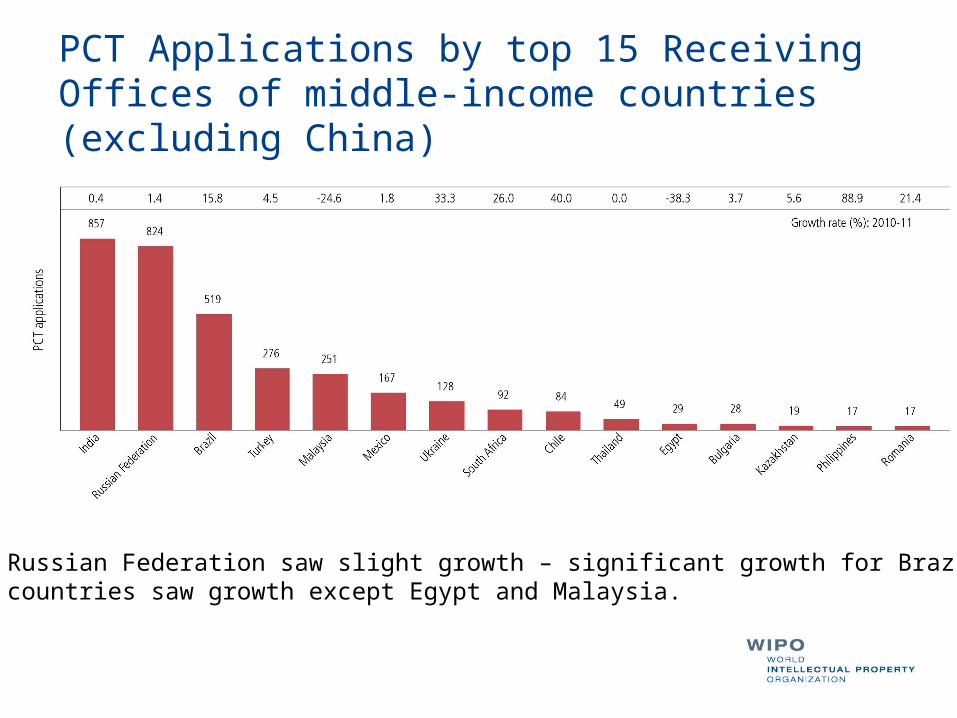
PCT Applications by top 15 Receiving Offices of middle-income countries (excluding China)
India and Russian Federation saw slight growth – significant growth for Brazil (+15.8%)All other countries saw growth except Egypt and Malaysia.
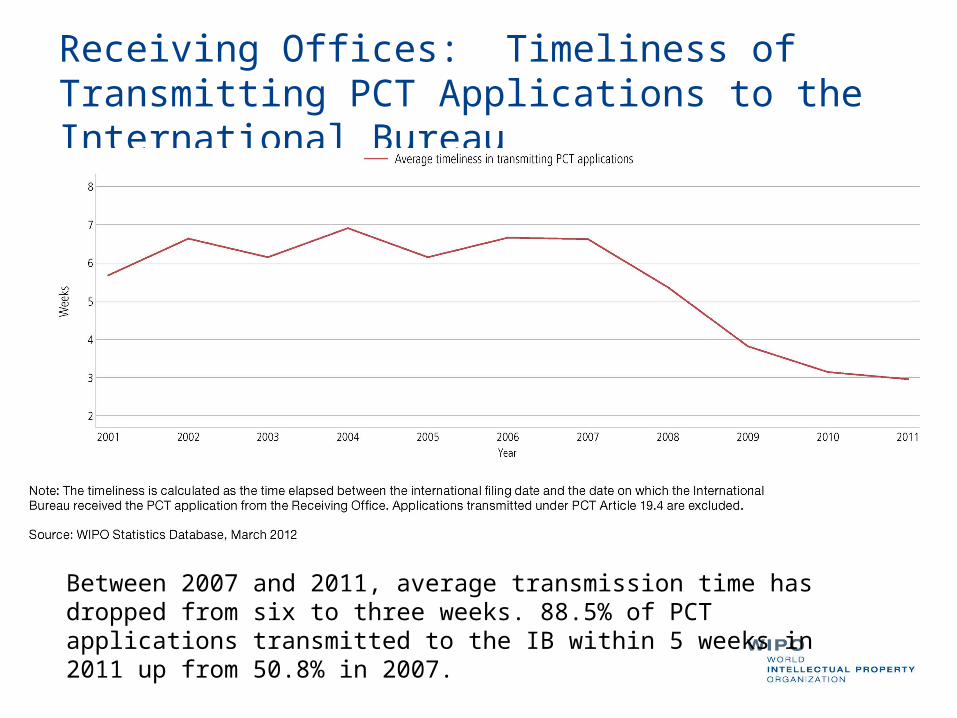
Receiving Offices: Timeliness of Transmitting PCT Applications to the International Bureau
Between 2007 and 2011, average transmission time has dropped from six to three weeks. 88.5% of PCT applications transmitted to the IB within 5 weeks in 2011 up from 50.8% in 2007.

4) International AuthoritiesInternational Search ReportsDistribution by International AuthorityTimeliness of Transmission to International Bureau
Supplementary International Search Reports
International Preliminary Examination ReportsDemandDistribution by International AuthorityTimeliness of Transmission to International Bureau

Distribution of International Search Reports by International Searching Authority
71'432
27'03418'091
16'2853'1392'3551'9491'4491'008932436277251
37'262European Patent Office
Japan
Republic of Korea
China
United States of America
Australia
Canada
Sweden
Spain
Russian Federation
Finland
Brazil
Nordic Patent Institute
Austria
2011
2010
2009
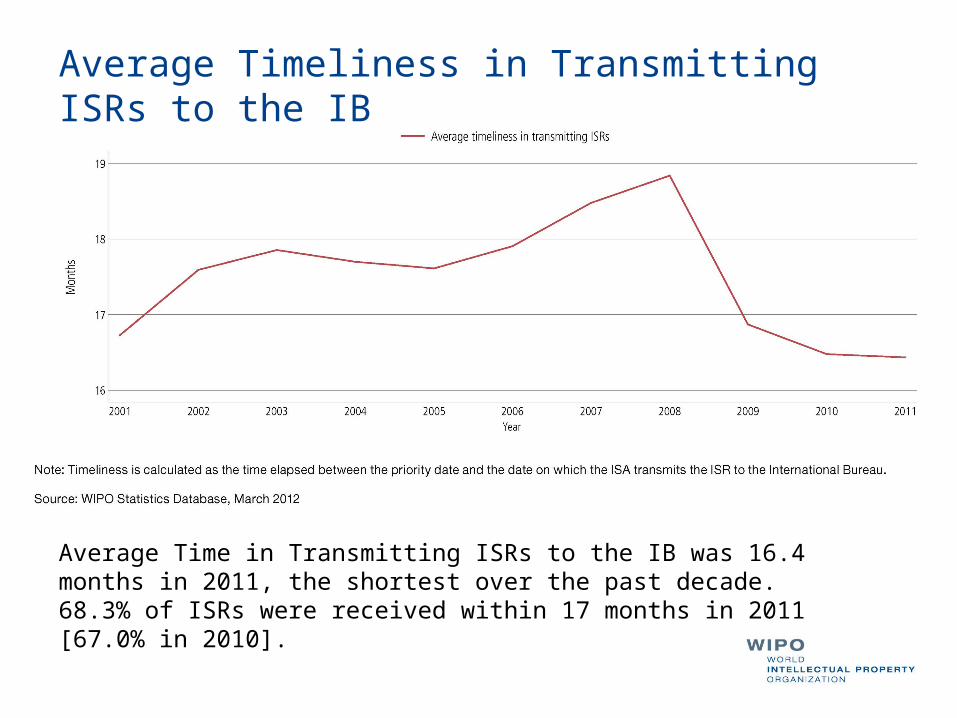
Average Timeliness in Transmitting ISRs to the IB
Average Time in Transmitting ISRs to the IB was 16.4 months in 2011, the shortest over the past decade. 68.3% of ISRs were received within 17 months in 2011 [67.0% in 2010].

Distribution of SISRs by SISA
222Sweden
313523Russian Federation
1Nordic Patent Institute
73European Patent Office
1Austria
414124Total
201120102009
Supplementary International Searching Authority
Year
222Sweden
313523Russian Federation
1Nordic Patent Institute
73European Patent Office
1Austria
414124Total
201120102009
Supplementary International Searching Authority
Year
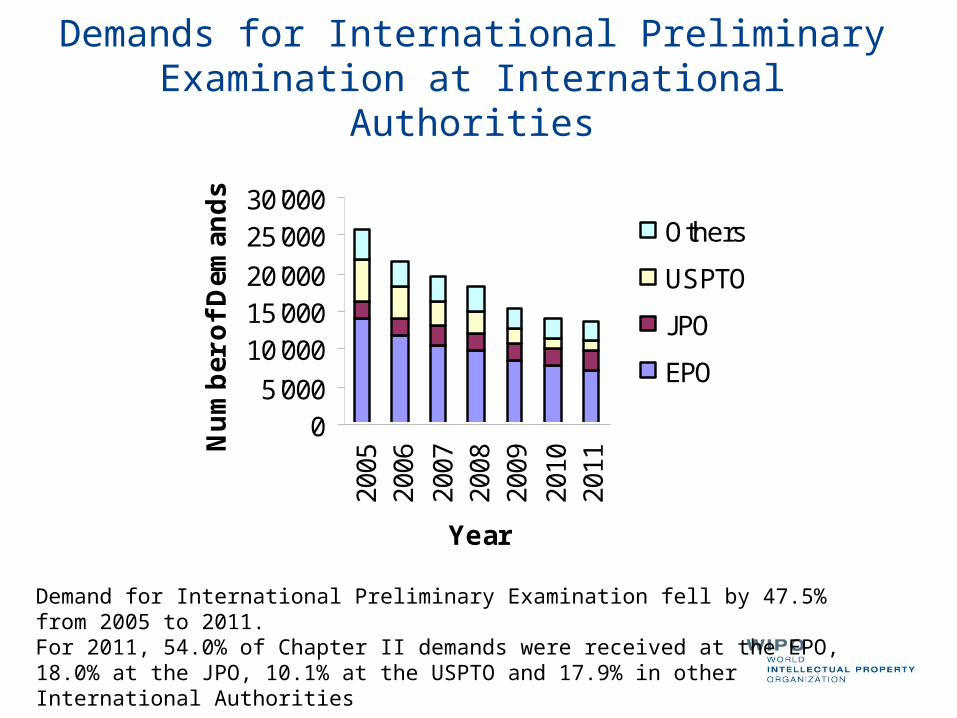
Demands for International Preliminary Examination at International Authorities
Demand for International Preliminary Examination fell by 47.5% from 2005 to 2011.For 2011, 54.0% of Chapter II demands were received at the EPO, 18.0% at the JPO, 10.1% at the USPTO and 17.9% in other International Authorities
05'000
10'00015'00020'000
25'00030'000
2005
2006
2007
2008
2009
2010
2011
Year
Nu
mb
er o
f D
eman
ds
Others
USPTO
JPO
EPO
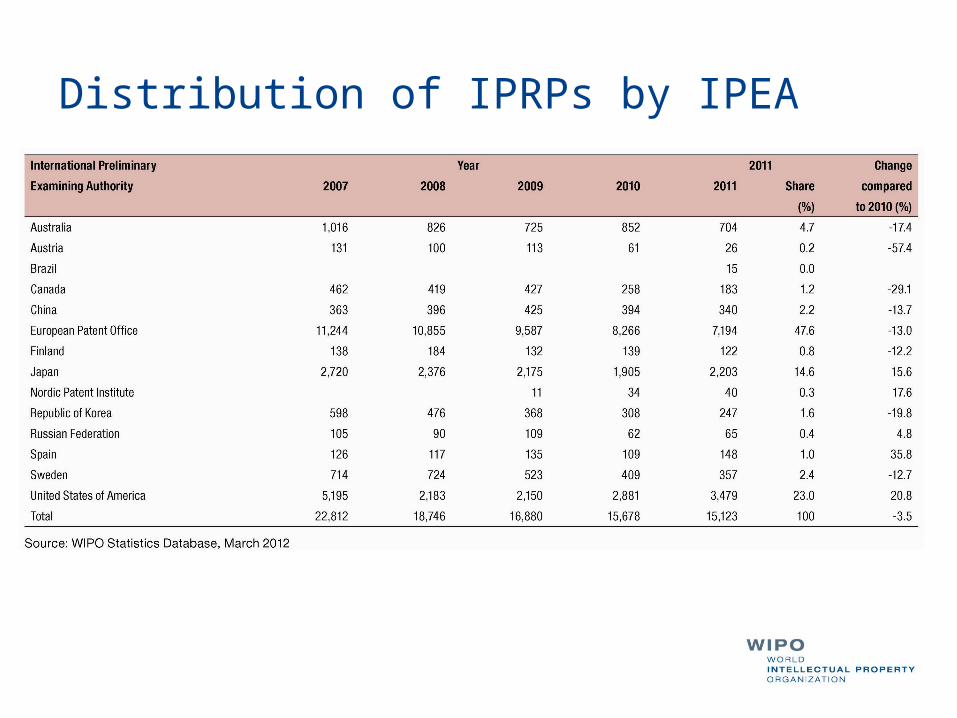
Distribution of IPRPs by IPEA
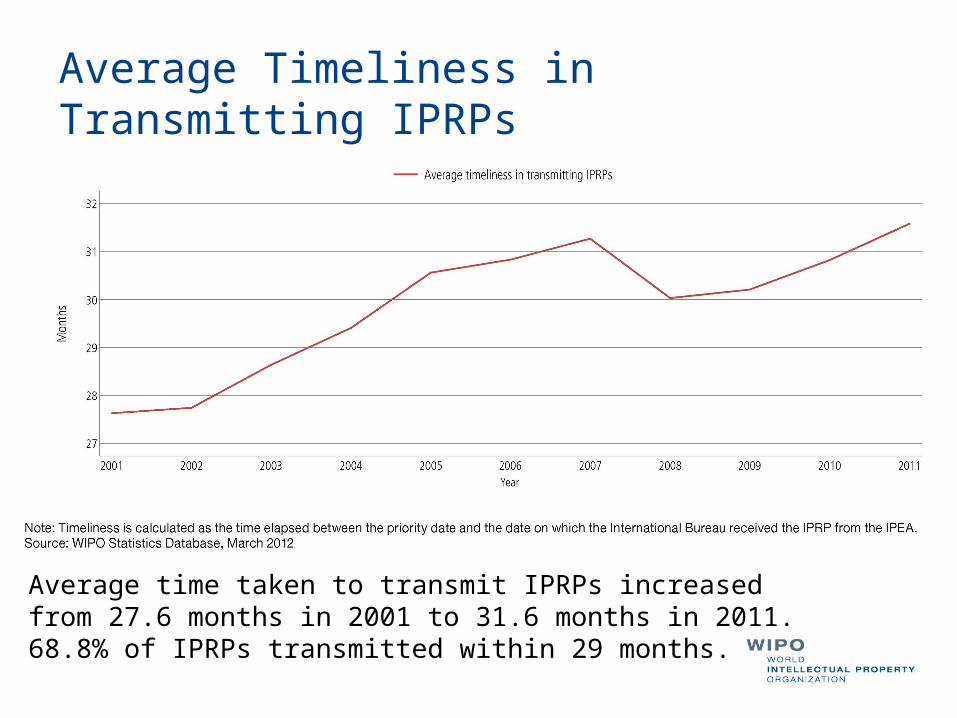
Average Timeliness in Transmitting IPRPs
Average time taken to transmit IPRPs increased from 27.6 months in 2001 to 31.6 months in 2011. 68.8% of IPRPs transmitted within 29 months.

5) PCT-Patent Prosecution Highway
In 2011, 27 PCT-PPH pilots were active, including the participation of 17 Offices and 13 International Authorities.

Summary for 2011477,500 National Phase Entries (+7.7%)
181,900 Applications Filed (+10.7%) – 86.8% fully electronic
163,670 Published Applications (+7.7%)
13,567 Chapter II demands (-0.02%)
2,850 PCT Patent Prosecution Highway Requests
Improvements in average timeliness for transmission to the IB of application by RO and transmission of International Search Report,
Longer average transmission time to IB for International Preliminary Examination Report

Further information:2012 PCT Yearly Review
The International Patent SystemWIPO Publication No:901E/2012
(English version on WIPO WebsiteFrench and Spanish available soon)
Thank you for your attention
![Issue Tables: A Profile of Military Servicemembers and ... · National Center for Education Statistics Demographic characteristics Pct. 95% CI Pct. 95% CI Pct. 95% CI Total 100.0[†]](https://static.fdocuments.in/doc/165x107/5fd94e264619685f4f16f279/issue-tables-a-profile-of-military-servicemembers-and-national-center-for-education.jpg)