PCM-Air Heat Exchangers: Slab Geometry · PCM-Air Heat Exchangers: Slab Geometry 431 The set of...
34
16 PCM-Air Heat Exchangers: Slab Geometry Pablo Dolado, Ana Lázaro, José María Marín and Belén Zalba University of Zaragoza / I3A - GITSE Spain 1. Introduction Energy efficiency and the search for new energy sources and uses are becoming main objectives for the scientific community as well as for society in general. This search is due to various environmental issues and shortages of conventional and non-sustainable energy resources, for example fossil fuels, that are essential to industrial development and to daily life. Free-cooling in buildings, bioclimatic architecture applications, demand and production coupling in renewable energy sources, as solar energy, are examples of thermal energy storage contributions to achieve these objectives. The application of Phase Change Materials (hereafter PCM) in Thermal Energy Storage (hereafter TES) is an expanding field due to the variety of materials being developed. There are four critical considerations for the technical viability of these applications: 1) The features of both the PCM and the encapsulation material must be stable during the system lifetime; 2) A reliable numerical model of the system to simulate different operational conditions; 3) The thermophysical properties of the PCM; 4) The cost of the system. Specifically, the solid-liquid phase change phenomenon of the PCM is being widely studied in the field of TES, both experimentally and numerically, because this technology is of great interest among different fields: from applications in electronics, textile, transport... to applications in aerospace or thermo-solar power plants. The incorporation of these materials on the market, as stated before, is conditioned partly by its price. To cope with this situation, manufacturers often sell PCM as non-pure substances or mixtures which, on the one hand, lower their costs but, on the other hand, condition its thermophysical properties so that they are not as well established as in pure substances. Generally, this determining factor leads to a nonlinearity of the temperature dependence of the thermophysical properties of the PCM. This issue is another aspect to consider when simulating the thermal behaviour of these substances. Therefore, it is essential a good determination of these properties as they are input values to the theoretical models that simulate the thermal performance of devices based on these materials, some of which may strongly condition the results of the simulations. When working at ambient temperatures, there are different situations where TES with PCM can be applied. Zalba et al., 2003, presented a comprehensive review on latent heat TES and its applications. The authors remarked that low values of λ PCM can lead to real problems in the systems since there could be insufficient capacity to dispose of the stored energy quickly enough. Later, Sharma et al., 2009, presented another review highlighting that there was www.intechopen.com
Transcript of PCM-Air Heat Exchangers: Slab Geometry · PCM-Air Heat Exchangers: Slab Geometry 431 The set of...
16
PCM-Air Heat Exchangers: Slab Geometry
Pablo Dolado, Ana Lázaro, José María Marín and Belén Zalba University of Zaragoza / I3A - GITSE
Spain
1. Introduction
Energy efficiency and the search for new energy sources and uses are becoming main
objectives for the scientific community as well as for society in general. This search is due to
various environmental issues and shortages of conventional and non-sustainable energy
resources, for example fossil fuels, that are essential to industrial development and to daily
life. Free-cooling in buildings, bioclimatic architecture applications, demand and production
coupling in renewable energy sources, as solar energy, are examples of thermal energy
storage contributions to achieve these objectives. The application of Phase Change Materials
(hereafter PCM) in Thermal Energy Storage (hereafter TES) is an expanding field due to the
variety of materials being developed. There are four critical considerations for the technical
viability of these applications: 1) The features of both the PCM and the encapsulation
material must be stable during the system lifetime; 2) A reliable numerical model of the
system to simulate different operational conditions; 3) The thermophysical properties of the
PCM; 4) The cost of the system.
Specifically, the solid-liquid phase change phenomenon of the PCM is being widely studied in the field of TES, both experimentally and numerically, because this technology is of great interest among different fields: from applications in electronics, textile, transport... to applications in aerospace or thermo-solar power plants. The incorporation of these materials on the market, as stated before, is conditioned partly by its price. To cope with this situation, manufacturers often sell PCM as non-pure substances or mixtures which, on the one hand, lower their costs but, on the other hand, condition its thermophysical properties so that they are not as well established as in pure substances. Generally, this determining factor leads to a nonlinearity of the temperature dependence of the thermophysical properties of the PCM. This issue is another aspect to consider when simulating the thermal behaviour of these substances. Therefore, it is essential a good determination of these properties as they are input values to the theoretical models that simulate the thermal performance of devices based on these materials, some of which may strongly condition the results of the simulations.
When working at ambient temperatures, there are different situations where TES with PCM can be applied. Zalba et al., 2003, presented a comprehensive review on latent heat TES and its applications. The authors remarked that low values of λPCM can lead to real problems in the systems since there could be insufficient capacity to dispose of the stored energy quickly enough. Later, Sharma et al., 2009, presented another review highlighting that there was
www.intechopen.com
Heat Exchangers – Basics Design Applications
428
scarce literature on the melt fraction studies of PCM used in the various applications for storage systems. Many of these applications have been studied widely in the last years; most are related to buildings and several to heat exchange between PCM and air as the heat transfer fluid:
Ceiling cooling systems and floor heating systems including a PCM storage device were studied by authors like Turnpenny et al., 2001, and Yanbing & Yinping, 2003.
Free-cooling has demonstrated to be an attractive application for latent heat storage using PCM. This application is reported in the work carried out by Butala & Stritih, 2009, and Lazaro et al., 2009a.
Solar air heating systems are important in many industrial and agricultural applications, such as those reported in the papers by Kürklü, 1998.
Other interesting possibilities are temperature maintenance/control in rooms with computers or electrical devices, and the pre-cooling of inlet air in a gas turbine (Bakenhus, 2000).
In any case, it is crucial to achieve efficient heat exchange between the heat transfer fluid
and the PCM. This point is strongly affected by the heat exchanger geometry, as the TES
unit has limited periods of time to solidify. Lazaro, 2009, compared the PCM-air heat
exchange geometries studied by different researchers (Arkar et al., 2007; Turnpenny et al.,
2000; Zalba et al., 2004; Zukowsky 2007). The author pointed out the difficulty of comparing
between the different results provided by the authors, since each one show the results in its
own way. Therefore, Lazaro concluded the need to standardize for proper comparison.
Lazaro et al., 2009b, also presented experimental results for melting stage of real PCM-air
heat exchangers pointing out the importance of the geometry. Geometry issues also affect
the pressure drop of the TES unit and the air pumping requirements of the system, i.e., the
electrical energy consumption. Regarding experimental studies, the evaluation of the
thermal behaviour of the TES unit under statistical approaches or mathematical fitting leads
to expressions that are very useful tools when designing such units. Among others, Butala &
Stritih, 2009, and Lazaro et al., 2009b, followed this methodology when they evaluated their
results.
In this chapter, a specific case study on slab geometry of a PCM-air heat exchanger is presented for temperature maintenance in rooms. However, the methodology posed here can be extrapolated to other different PCM geometries and system setups.
2. Pre-design: important factors
Since non-pure substances have lower costs than pure materials, they are used in commercial PCM. The characterization of the PCM and its encapsulation material are required to choose the optimal PCM and to design the heat exchanger for each application. The thermophysical properties of the PCM as a function of temperature are essential to the numerical model. Such information is not available for commercial PCM. This section therefore aims at the development of an adequate methodology to characterize PCM. Subsequently, the design of an experimental setup is explained, directed towards the determination of the enthalpy vs. temperature curves, by using the T-history method. The setup was built and a methodology was proposed to verify the T-history setups. The same methodology is applied to determine thermal conductivity, another essential thermal
www.intechopen.com
PCM-Air Heat Exchangers: Slab Geometry
429
property regarding heat transfer. As a result of the application of the existing methods to analyze the liquid and solid phases, the most suitable method is chosen and the setup was started up. Besides the energy storage capacity and the thermal conductivity as a function of temperature, other properties are also important to be known, such as the compatibility of the PCM with the encapsulation material.
2.1 Determination of enthalpy as a function of temperature
In order to obtain the most suitable method to determine enthalpy as a function of temperature during the solid-liquid phase change, two main thermal analysis methods were studied: differential scanning calorimetry (DSC) and adiabatic calorimetry. In addition, a customized method was studied: the T-history method. A complex review of the work on thermophysical properties was carried out with some conclusions being (Lazaro, 2009):
DSC is the most used method for determining the storage capacity because it is the most common commercial device (Zhang D. et al., 2007).
There are several problems with using DSC for non pure and low thermal conductivity substances (Arkar & Medved, 2005).
The number of authors that use the enthalpy vs. temperature curves to express the storage capacity of PCM is increasing (Zalba et al., 2003).
DSC, adiabatic calorimetry and T-history method were studied and compared. Factors considered in the method selection are: sample size, heating and cooling rate, obtainability of the h-T curve, introduction to the market, easiness to build, cost, use, maintenance. The T-history method was selected as it provides the enthalpy vs. temperature curves and also uses sample sizes and heating/cooling rates similar to those used in real applications.
2.1.1 The T-history method
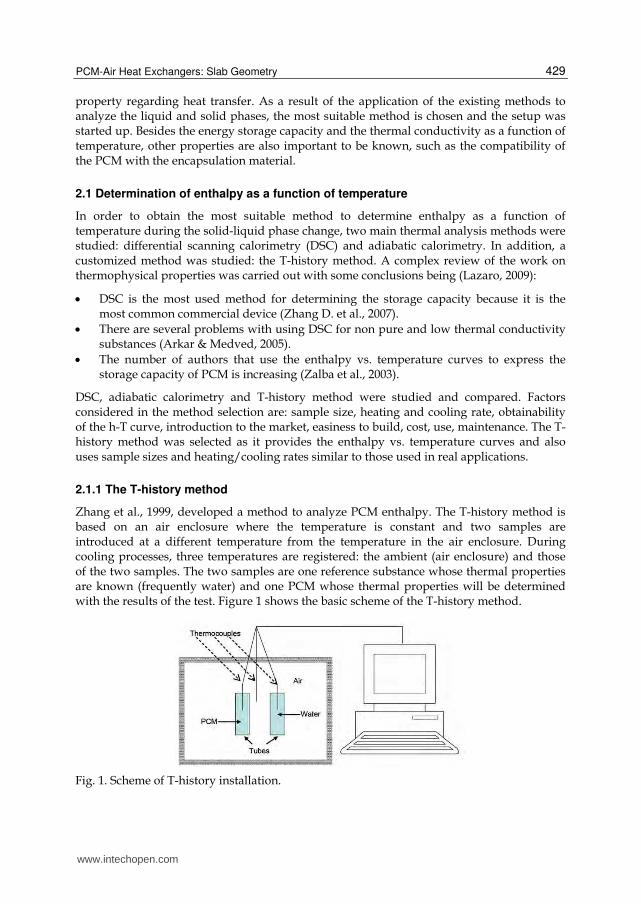
Zhang et al., 1999, developed a method to analyze PCM enthalpy. The T-history method is based on an air enclosure where the temperature is constant and two samples are introduced at a different temperature from the temperature in the air enclosure. During cooling processes, three temperatures are registered: the ambient (air enclosure) and those of the two samples. The two samples are one reference substance whose thermal properties are known (frequently water) and one PCM whose thermal properties will be determined with the results of the test. Figure 1 shows the basic scheme of the T-history method.
Fig. 1. Scheme of T-history installation.
www.intechopen.com
Heat Exchangers – Basics Design Applications
430
The basic aspects of the T-history method are (Zhang et al., 1999):
Heat transfer is one-dimensional in the radial direction since the samples containers are long cylinders.
Containers with water and PCM samples are designed with Bi<0.1 and therefore are considered capacity systems.
Heat transfer occurs by free convection between the samples and air. Containers must be identical in order to have a very low and almost the same free convection coefficient.
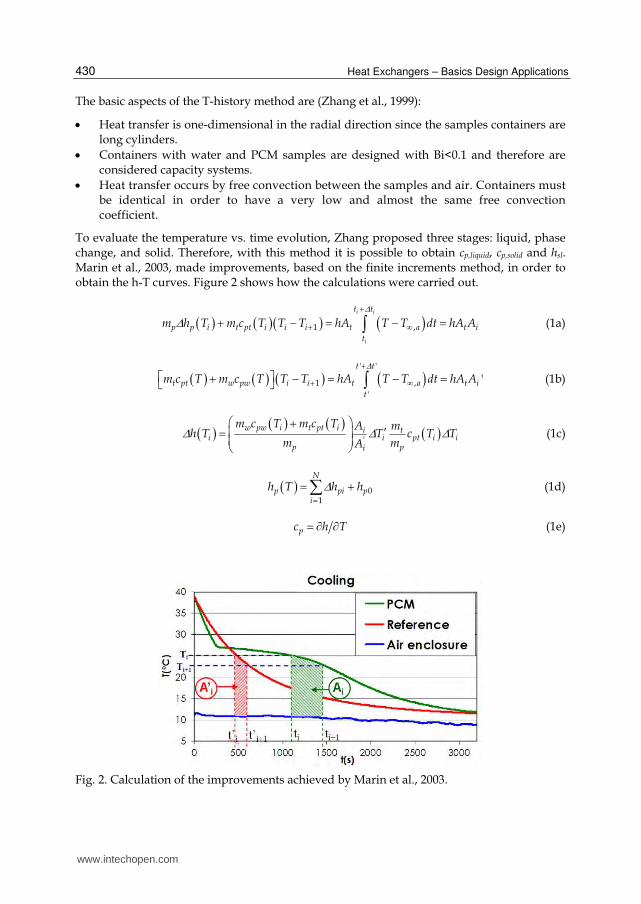
To evaluate the temperature vs. time evolution, Zhang proposed three stages: liquid, phase change, and solid. Therefore, with this method it is possible to obtain cp,liquid, cp,solid and hsl. Marin et al., 2003, made improvements, based on the finite increments method, in order to obtain the h-T curves. Figure 2 shows how the calculations were carried out.
1 ,
i i
i
t t
p p i t pt i i i t a t i
t
m h T m c T T T hA T T dt hA A
(1a)
' '
1 ,
'
't t
t pt w pw i i t a t i
t
m c T m c T T T hA T T dt hA A
(1b)
'
w pw i t pt i i ti i pt i i
p pi
m c T m c T A mh T T c T T
m mA (1c)
01
N
p pi pi
h T h h
(1d)
pc h T (1e)
Fig. 2. Calculation of the improvements achieved by Marin et al., 2003.
www.intechopen.com

PCM-Air Heat Exchangers: Slab Geometry
431
The set of equations 1 summarize the calculations considering the improvements. There At denotes the tube lateral area, mp the PCM mass, mt the tube mass, cpt the specific heat of the tube, cpw the specific heat of water, h the convection coefficient whereas h(T) denotes enthalpy. The little temperature steps, ΔTi, varies in accord to the corresponding time intervals for the PCM (Δti=ti+1-ti) and for water (Δt’i=t’i+1-t’i). The integral of the temperature difference against time, is the area under the curve in Figure 2 for the PCM (Ai) and for water (Ai’).
2.1.2 Design of a new installation to implement the T-history method
When analyzing errors with T-history, the most important factor is the precision in the temperature measurement. Thermal sensors used in previous implementations have been thermocouples, while Pt-100 was chosen for this new installation due to the higher precision: ±0.05ºC with a 4 threads assembly. However, Pt-100 has a longer response time, but will not affect the results provided that the response time is the same for all temperature measurements. This objective is achieved by using Pt-100 of the same manufacture set, and characteristics will be identical. Enthalpy is expressed in a mass unit basis; therefore the precision in mass measurements is as important as the precision in temperature measurements. A 0.1 mg precision scale is used to measure the mass of samples. The sample containers have been designed so that the method standards are fulfilled (Bi<0.1). Churchill-Chu (Marin & Monne, 1998) natural convection correlations for cylinders were used to calculate the suitable radius/length rate of the tubes. The chosen material was glass, since it allows the observation of the phase change process. Cylinders of 13 cm in length and 1 cm in diameter were used. A data logger was used with a RS-232 connection with 22 bits and 6 ½ resolution. A thermostatic bath (0.1 K precision) was used to fix the initial temperature of the samples. A calculation software, especially developed in Labview, was used to obtain the h-T curves. The new T-history implementation based its improvements on:
Obtainability of the h-T curves during cooling and heating.
Horizontal position of samples in the air enclosure, minimizing convective movements.
Utilization of more precise instrumentation.
A program designed (Labview) for calculations and real time view of the measurements.
A guarantee that there is no contribution of heat transfer by radiation.
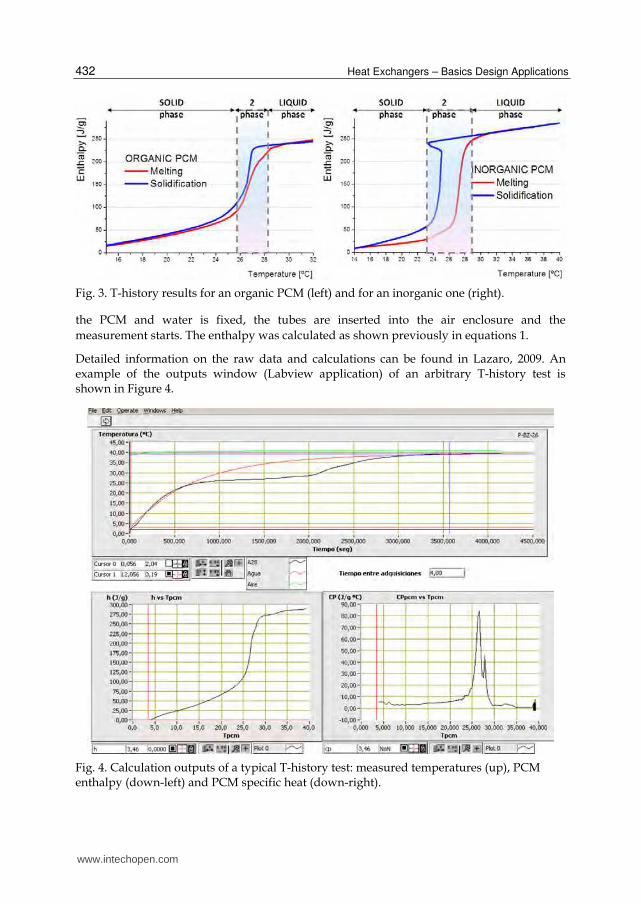
Examples of T-history analysis applied to two typical PCM (organic and inorganic) are
shown in Figure 3. Typical phenomena as hysteresis or sub-cooling can also be observed.
The objective of analyzing organic and inorganic substances is to confirm the expected
differences in behaviour: the inorganic PCM presents the sub-cooling phenomenon that
occurs during cooling, presenting more hysteresis and quite higher stored energy density
when compared to organic PCM.
The procedure used was: mass measurements of the samples and sample containers using a
precision scale, then the Pt-100 were introduced into the samples (one into the PCM and one
into the water), and the tubes were inserted into the thermostatic bath at the desired initial
temperature. The initial temperature depends on the PCM to be tested as well as if it is for a
heating or a cooling test. For a heating test, the initial temperature must be lower than the
phase change temperature. For a cooling test, it must be higher. Once the temperature inside
www.intechopen.com
Heat Exchangers – Basics Design Applications
432
Fig. 3. T-history results for an organic PCM (left) and for an inorganic one (right).
the PCM and water is fixed, the tubes are inserted into the air enclosure and the
measurement starts. The enthalpy was calculated as shown previously in equations 1.
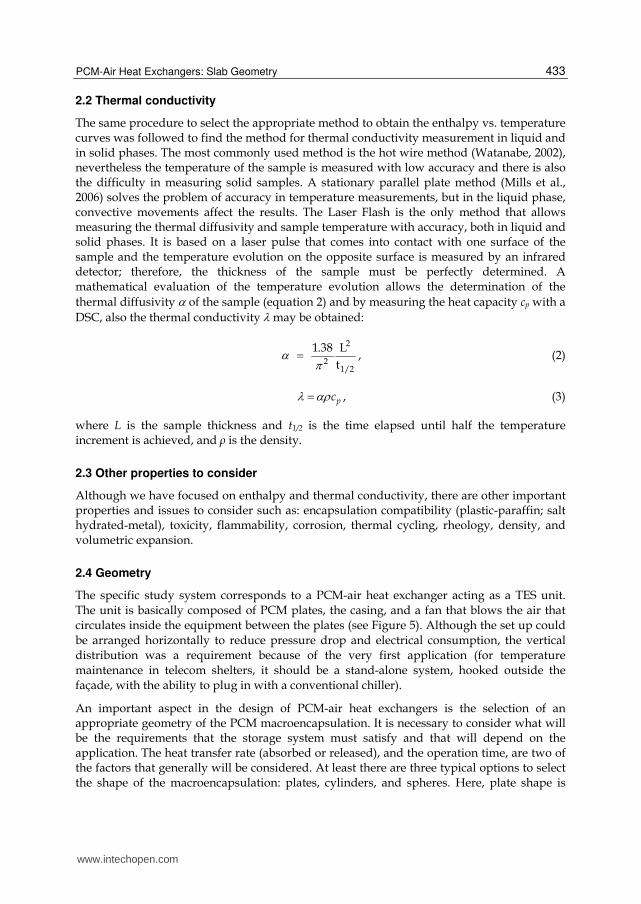
Detailed information on the raw data and calculations can be found in Lazaro, 2009. An example of the outputs window (Labview application) of an arbitrary T-history test is shown in Figure 4.
Fig. 4. Calculation outputs of a typical T-history test: measured temperatures (up), PCM enthalpy (down-left) and PCM specific heat (down-right).
www.intechopen.com
PCM-Air Heat Exchangers: Slab Geometry
433
2.2 Thermal conductivity
The same procedure to select the appropriate method to obtain the enthalpy vs. temperature curves was followed to find the method for thermal conductivity measurement in liquid and in solid phases. The most commonly used method is the hot wire method (Watanabe, 2002), nevertheless the temperature of the sample is measured with low accuracy and there is also the difficulty in measuring solid samples. A stationary parallel plate method (Mills et al., 2006) solves the problem of accuracy in temperature measurements, but in the liquid phase, convective movements affect the results. The Laser Flash is the only method that allows measuring the thermal diffusivity and sample temperature with accuracy, both in liquid and solid phases. It is based on a laser pulse that comes into contact with one surface of the sample and the temperature evolution on the opposite surface is measured by an infrared detector; therefore, the thickness of the sample must be perfectly determined. A mathematical evaluation of the temperature evolution allows the determination of the
thermal diffusivity of the sample (equation 2) and by measuring the heat capacity cp with a
DSC, also the thermal conductivity may be obtained:
2
21/2
1.38 L
t , (2)
pc , (3)
where L is the sample thickness and t1/2 is the time elapsed until half the temperature increment is achieved, and ρ is the density.
2.3 Other properties to consider
Although we have focused on enthalpy and thermal conductivity, there are other important properties and issues to consider such as: encapsulation compatibility (plastic-paraffin; salt hydrated-metal), toxicity, flammability, corrosion, thermal cycling, rheology, density, and volumetric expansion.
2.4 Geometry
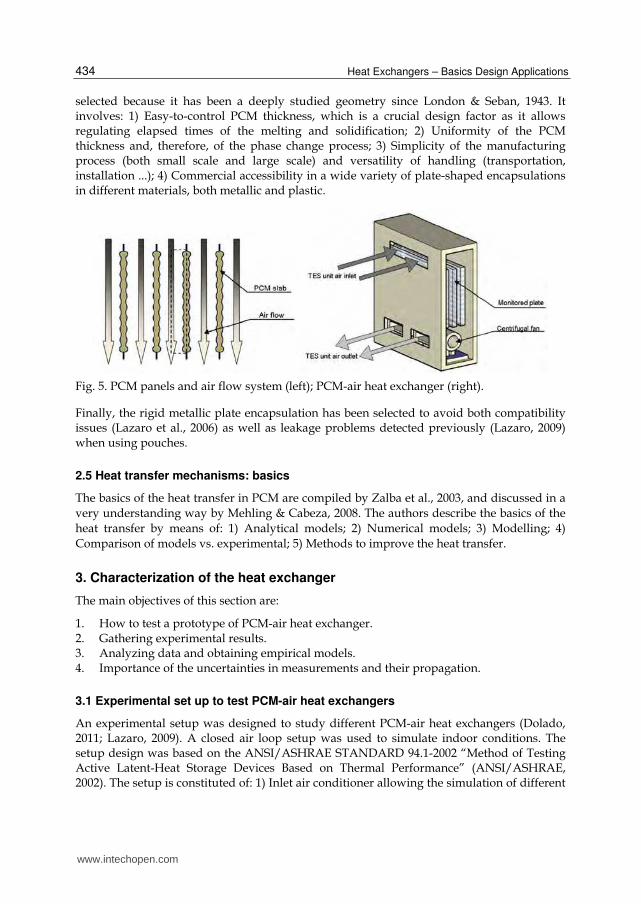
The specific study system corresponds to a PCM-air heat exchanger acting as a TES unit. The unit is basically composed of PCM plates, the casing, and a fan that blows the air that circulates inside the equipment between the plates (see Figure 5). Although the set up could be arranged horizontally to reduce pressure drop and electrical consumption, the vertical distribution was a requirement because of the very first application (for temperature maintenance in telecom shelters, it should be a stand-alone system, hooked outside the façade, with the ability to plug in with a conventional chiller).
An important aspect in the design of PCM-air heat exchangers is the selection of an appropriate geometry of the PCM macroencapsulation. It is necessary to consider what will be the requirements that the storage system must satisfy and that will depend on the application. The heat transfer rate (absorbed or released), and the operation time, are two of the factors that generally will be considered. At least there are three typical options to select the shape of the macroencapsulation: plates, cylinders, and spheres. Here, plate shape is
www.intechopen.com
Heat Exchangers – Basics Design Applications
434
selected because it has been a deeply studied geometry since London & Seban, 1943. It involves: 1) Easy-to-control PCM thickness, which is a crucial design factor as it allows regulating elapsed times of the melting and solidification; 2) Uniformity of the PCM thickness and, therefore, of the phase change process; 3) Simplicity of the manufacturing process (both small scale and large scale) and versatility of handling (transportation, installation ...); 4) Commercial accessibility in a wide variety of plate-shaped encapsulations in different materials, both metallic and plastic.
Fig. 5. PCM panels and air flow system (left); PCM-air heat exchanger (right).
Finally, the rigid metallic plate encapsulation has been selected to avoid both compatibility issues (Lazaro et al., 2006) as well as leakage problems detected previously (Lazaro, 2009) when using pouches.
2.5 Heat transfer mechanisms: basics
The basics of the heat transfer in PCM are compiled by Zalba et al., 2003, and discussed in a
very understanding way by Mehling & Cabeza, 2008. The authors describe the basics of the
heat transfer by means of: 1) Analytical models; 2) Numerical models; 3) Modelling; 4)
Comparison of models vs. experimental; 5) Methods to improve the heat transfer.
3. Characterization of the heat exchanger
The main objectives of this section are:
1. How to test a prototype of PCM-air heat exchanger. 2. Gathering experimental results. 3. Analyzing data and obtaining empirical models. 4. Importance of the uncertainties in measurements and their propagation.
3.1 Experimental set up to test PCM-air heat exchangers
An experimental setup was designed to study different PCM-air heat exchangers (Dolado, 2011; Lazaro, 2009). A closed air loop setup was used to simulate indoor conditions. The setup design was based on the ANSI/ASHRAE STANDARD 94.1-2002 “Method of Testing Active Latent-Heat Storage Devices Based on Thermal Performance” (ANSI/ASHRAE, 2002). The setup is constituted of: 1) Inlet air conditioner allowing the simulation of different
www.intechopen.com

PCM-Air Heat Exchangers: Slab Geometry
435
operating modes (5 kW air chiller and 4.4 kW electrical resistance); 2) Air flow measurements; 3) Difference between inlet and outlet air temperature measurements (thermopile); 4) Inlet and outlet air temperature and humidity measurements; 5) PCM and air channels temperature measurements (31 thermocouples); 6) Data logger and data screening; 7) Air ducts and gates; 8) PID controller.
The energy balance of air between the prototype’s inlet and outlet is utilized to evaluate the cooling (equation 4). As the main parameters are the air flow and the air temperature difference between the inlet and the outlet, the accuracy depends on the precision when measuring these parameters. The methods used are:
airair through HX air air through HX p· · ·Q m h m c T (4)
Air temperature difference: thermopile. There were difficulties to overcome in this measurement: a long period of time with little temperature difference; the temperature distributions along the air ducts due of its dimensions; and accuracy, which is required since it is a main parameter of evaluation. A thermopile was chosen as it is recommended by the ANSI/ASHRAE standard to overcome those difficulties.
Air flow: energy balance of electrical resistances. The air temperature changes during tests, therefore most of air flow measurement methods are not suitable for transitory measurements. Mass flows depend only on the fan velocity; therefore they are measured by applying an energy balance to the electrical resistances.
Air humidity: 2 sensors were used to measure air humidity at the inlet and outlet. Latent energy variation was negligible in the air energy balance for cooling power evaluation.
The reader can find more information on the experimental setup in Lazaro, 2009.
3.2 Two prototypes
Two real-scale prototypes of PCM-air heat exchangers were constructed and incorporated
into the experimental setup to characterize them. Initially tests were conducted with the
equipment filled with bags of a hydrated salt PCM (prototype 1). Subsequently, the bags
were replaced by plates of a paraffin based PCM, and the unit was tested filled with plates.
These two geometries were arranged vertically and parallel to the airflow. The casing of the
heat exchanger unit used in both cases was the same. PCM thickness was a critical
parameter to obtain the required cooling rates (Dolado et al., 2007). Vertical position was a
requirement; therefore a metallic grid was used to force PCM thickness below a maximum
in vertical position. The experimental setup built to test this kind of heat exchangers is
shown in Figure 6. Tests using a constant inlet air temperature setpoint were accomplished.
Figure 7 (left) shows the cooling power evolution in prototype 1. Results showed that the
cooling rates were very low and the total melting times were double the melting design time
(2h). Different air flow rates were tested. As it can be seen in figure 8 (left), the air flow
influence on melting times and cooling rates were negligible (in the figure HH:mm denotes
time, hours:minutes). Cooling power does not increase by a rise of air flow rates. Indicating
that, contrary to what was at first designed, heat transfer by conduction inside the PCM
resistance is dominant. The prototype was opened to confirm the diagnosis, and PCM
www.intechopen.com
Heat Exchangers – Basics Design Applications
436
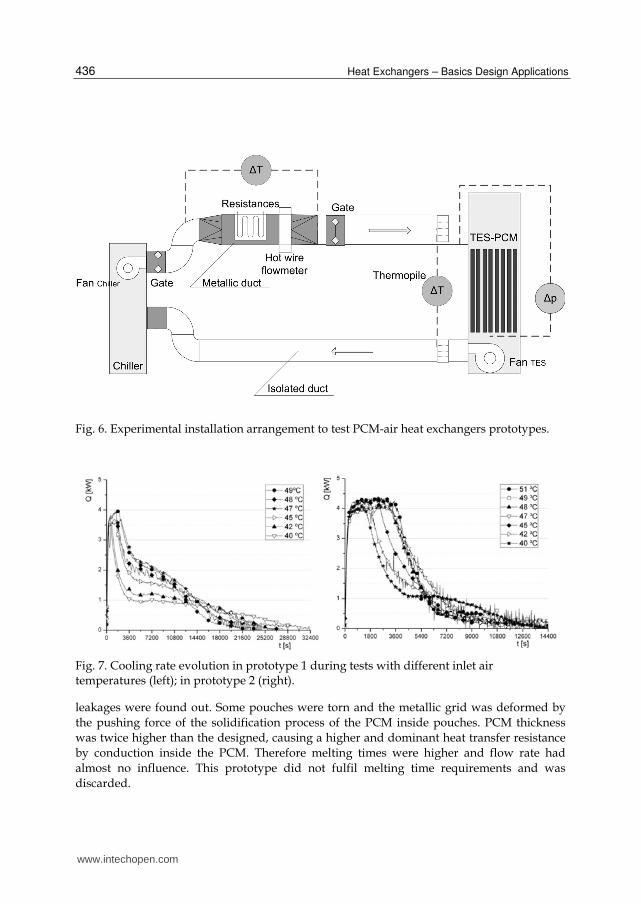
Fig. 6. Experimental installation arrangement to test PCM-air heat exchangers prototypes.
Fig. 7. Cooling rate evolution in prototype 1 during tests with different inlet air temperatures (left); in prototype 2 (right).
leakages were found out. Some pouches were torn and the metallic grid was deformed by
the pushing force of the solidification process of the PCM inside pouches. PCM thickness
was twice higher than the designed, causing a higher and dominant heat transfer resistance
by conduction inside the PCM. Therefore melting times were higher and flow rate had
almost no influence. This prototype did not fulfil melting time requirements and was
discarded.
www.intechopen.com
PCM-Air Heat Exchangers: Slab Geometry
437
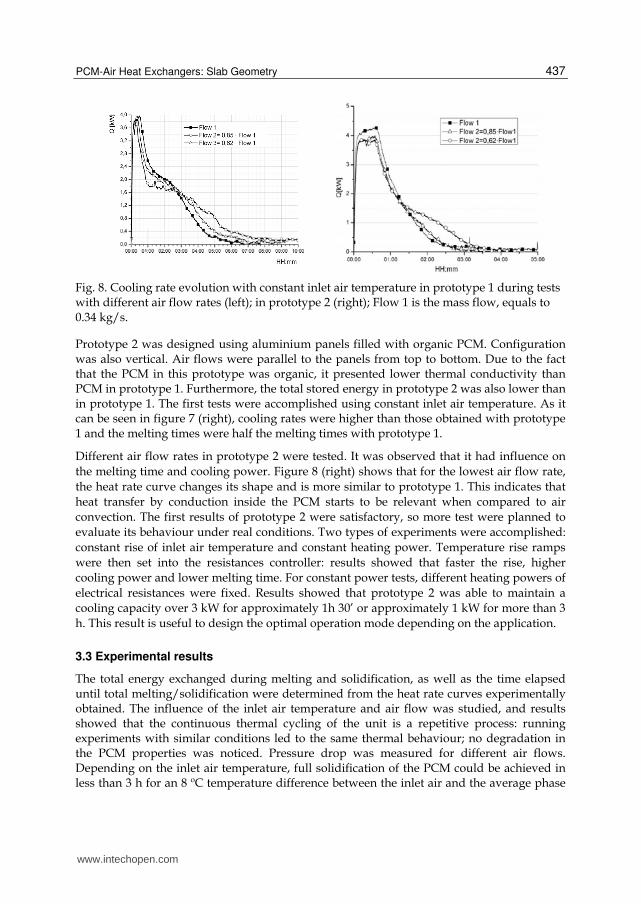
Fig. 8. Cooling rate evolution with constant inlet air temperature in prototype 1 during tests with different air flow rates (left); in prototype 2 (right); Flow 1 is the mass flow, equals to 0.34 kg/s.
Prototype 2 was designed using aluminium panels filled with organic PCM. Configuration was also vertical. Air flows were parallel to the panels from top to bottom. Due to the fact that the PCM in this prototype was organic, it presented lower thermal conductivity than PCM in prototype 1. Furthermore, the total stored energy in prototype 2 was also lower than in prototype 1. The first tests were accomplished using constant inlet air temperature. As it can be seen in figure 7 (right), cooling rates were higher than those obtained with prototype 1 and the melting times were half the melting times with prototype 1.
Different air flow rates in prototype 2 were tested. It was observed that it had influence on
the melting time and cooling power. Figure 8 (right) shows that for the lowest air flow rate,
the heat rate curve changes its shape and is more similar to prototype 1. This indicates that
heat transfer by conduction inside the PCM starts to be relevant when compared to air
convection. The first results of prototype 2 were satisfactory, so more test were planned to
evaluate its behaviour under real conditions. Two types of experiments were accomplished:
constant rise of inlet air temperature and constant heating power. Temperature rise ramps
were then set into the resistances controller: results showed that faster the rise, higher
cooling power and lower melting time. For constant power tests, different heating powers of
electrical resistances were fixed. Results showed that prototype 2 was able to maintain a
cooling capacity over 3 kW for approximately 1h 30’ or approximately 1 kW for more than 3
h. This result is useful to design the optimal operation mode depending on the application.
3.3 Experimental results
The total energy exchanged during melting and solidification, as well as the time elapsed until total melting/solidification were determined from the heat rate curves experimentally obtained. The influence of the inlet air temperature and air flow was studied, and results showed that the continuous thermal cycling of the unit is a repetitive process: running experiments with similar conditions led to the same thermal behaviour; no degradation in the PCM properties was noticed. Pressure drop was measured for different air flows. Depending on the inlet air temperature, full solidification of the PCM could be achieved in less than 3 h for an 8 ºC temperature difference between the inlet air and the average phase
www.intechopen.com
Heat Exchangers – Basics Design Applications
438
change of the PCM. Average heat rates of up to 4.5 kW and 3.5 kW for 1 h were obtained for melting and solidification stages, respectively (Dolado et al., 2011b; Dolado, 2011; Lazaro, 2009; Lazaro et al., 2009a).
3.4 Empirical models
From experimental results, the empirical models were built aimed at simulating the thermal behaviour in the tested heat exchanger in different cases. These simulations were used to evaluate the technical viability of its application. Since the thermal properties of PCM vary with temperature, a PCM-air heat exchanger works as a transitory system and therefore, its design must be based on transitory analysis. This section shows that PCM selection criteria must include the power demand. The conclusions obtained for the PCM-air heat exchange can be useful for selecting PCM for other heat exchanger applications that use the tested geometry as well as for applications that use such technology: green housing, curing and drying processes, industrial plant production, HVAC, free-cooling.
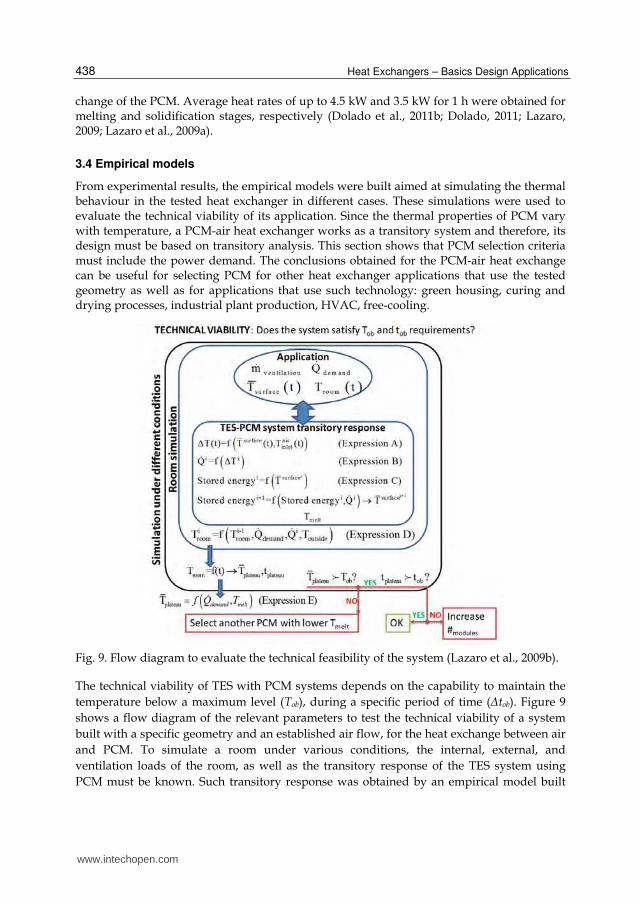
Fig. 9. Flow diagram to evaluate the technical feasibility of the system (Lazaro et al., 2009b).
The technical viability of TES with PCM systems depends on the capability to maintain the
temperature below a maximum level (Tob), during a specific period of time (Δtob). Figure 9
shows a flow diagram of the relevant parameters to test the technical viability of a system
built with a specific geometry and an established air flow, for the heat exchange between air
and PCM. To simulate a room under various conditions, the internal, external, and
ventilation loads of the room, as well as the transitory response of the TES system using
PCM must be known. Such transitory response was obtained by an empirical model built
www.intechopen.com
PCM-Air Heat Exchangers: Slab Geometry
439
from all experimental outcomes under real conditions. The results to test prototype 2 with
constant heating power were evaluated and an average temperature was obtained for the air
temperature plateau ( plateauT ). There was obtained a linear correlation (equation 5) between
the average plateau temperatures and the heating power of the electrical resistances
( resistancesQ ). The origin ordinate was the average phase change temperature of the PCM
used.
plateau resistancesT =26.6+1.58·Q (5)
surface airinletΔT K =-1.4683-1.10943·T ºC +1.10706·T ºC (6)
The temperature on the surface of the PCM encapsulation was measured at 20 locations,
distributed in such a way that the melting evolution can be studied and that any cold point
can be detected. For each measurement, the average surface temperatures were obtained, as
well as the plotting of the temperature difference between the inlet and the outlet (ΔT), the
air temperature at the inlet of the TES unit (Tinletair) and the average surface temperatures
( surfaceT ). All locations come from experiments with the same airflow rate and heat
exchange geometry. All measured locations were contained in a plane. A fitting tool was
used to obtain the equation adjustment (equation 6). For the tested heat exchanger,
expression A in figure 9 corresponds to equation 6. As it has been detailed, the heat
exchanged with air was evaluated by an energy balance. The stored energy was then
obtained for each measurement time step, as an accumulative result from the exchanged
energy between air and PCM. The relationship between the stored energy and the average
surface temperatures ( surfaceT ) corresponds to expression C in figure 9. Using the empirical
model, different conditions were simulated, and the equations for the expressions shown in
figure 9 were obtained, as well as various conclusions concerning PCM selection criteria
(Lazaro et al., 2009b).
3.5 Uncertainties propagation
The guide EA-4/02 Expression of the Uncertainty of Measurement in Calibration, 1999, has
been followed to estimate the uncertainty of measurements. Air flow was determined using
an energy balance method that consists in applying an energy balance to the air flow that
passes through the electrical resistances (equation 7). The air flow is measured with an
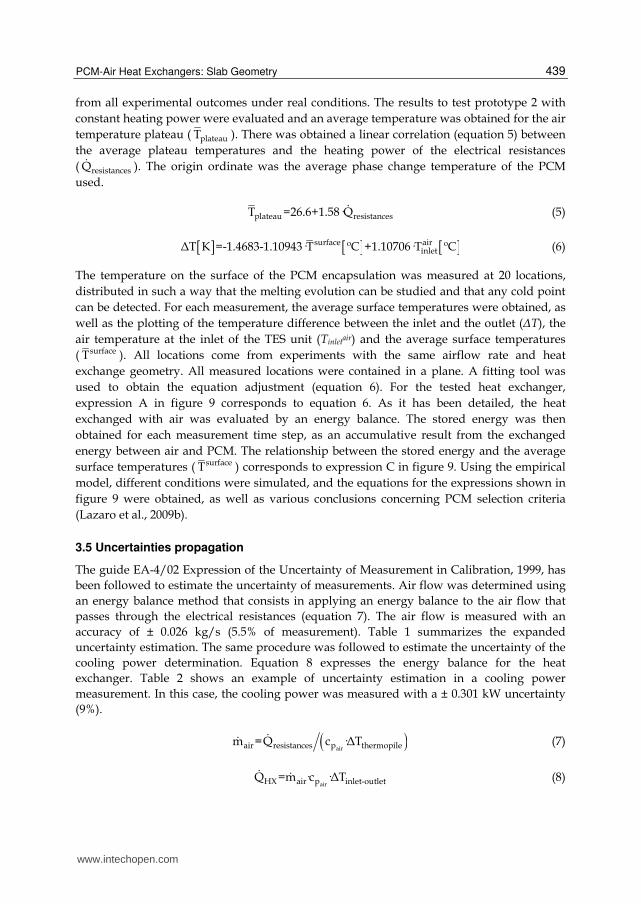
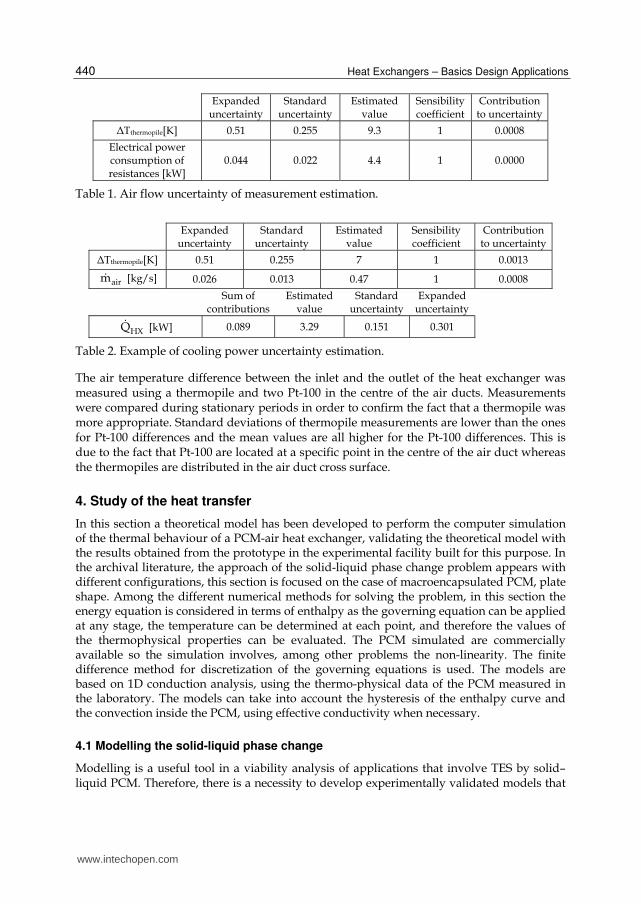
accuracy of ± 0.026 kg/s (5.5% of measurement). Table 1 summarizes the expanded
uncertainty estimation. The same procedure was followed to estimate the uncertainty of the
cooling power determination. Equation 8 expresses the energy balance for the heat
exchanger. Table 2 shows an example of uncertainty estimation in a cooling power
measurement. In this case, the cooling power was measured with a ± 0.301 kW uncertainty
(9%).
airair resistances p thermopilem =Q c ·ΔT (7)
airHX air p inlet-outletQ =m ·c ·ΔT
(8)
www.intechopen.com
Heat Exchangers – Basics Design Applications
440
Expanded
uncertainty Standard
uncertainty Estimated
value Sensibility coefficient
Contribution to uncertainty
ΔTthermopile[K] 0.51 0.255 9.3 1 0.0008
Electrical power consumption of resistances [kW]
0.044 0.022 4.4 1 0.0000
Table 1. Air flow uncertainty of measurement estimation.
Expanded
uncertainty Standard
uncertainty Estimated
value Sensibility coefficient
Contribution to uncertainty
ΔTthermopile[K] 0.51 0.255 7 1 0.0013
airm [kg/s] 0.026 0.013 0.47 1 0.0008
Sum of
contributionsEstimated
value Standard
uncertaintyExpanded
uncertainty
HXQ [kW] 0.089 3.29 0.151 0.301
Table 2. Example of cooling power uncertainty estimation.
The air temperature difference between the inlet and the outlet of the heat exchanger was measured using a thermopile and two Pt-100 in the centre of the air ducts. Measurements were compared during stationary periods in order to confirm the fact that a thermopile was more appropriate. Standard deviations of thermopile measurements are lower than the ones for Pt-100 differences and the mean values are all higher for the Pt-100 differences. This is due to the fact that Pt-100 are located at a specific point in the centre of the air duct whereas the thermopiles are distributed in the air duct cross surface.
4. Study of the heat transfer
In this section a theoretical model has been developed to perform the computer simulation of the thermal behaviour of a PCM-air heat exchanger, validating the theoretical model with the results obtained from the prototype in the experimental facility built for this purpose. In the archival literature, the approach of the solid-liquid phase change problem appears with different configurations, this section is focused on the case of macroencapsulated PCM, plate shape. Among the different numerical methods for solving the problem, in this section the energy equation is considered in terms of enthalpy as the governing equation can be applied at any stage, the temperature can be determined at each point, and therefore the values of the thermophysical properties can be evaluated. The PCM simulated are commercially available so the simulation involves, among other problems the non-linearity. The finite difference method for discretization of the governing equations is used. The models are based on 1D conduction analysis, using the thermo-physical data of the PCM measured in the laboratory. The models can take into account the hysteresis of the enthalpy curve and the convection inside the PCM, using effective conductivity when necessary.
4.1 Modelling the solid-liquid phase change
Modelling is a useful tool in a viability analysis of applications that involve TES by solid–liquid PCM. Therefore, there is a necessity to develop experimentally validated models that
www.intechopen.com
PCM-Air Heat Exchangers: Slab Geometry
441
are rigorous and flexible to simulate heat exchangers of air and PCMs. When developing a model, the trade-off between rigour and computational cost is crucial. There are many options reported in scientific literature to face the mathematical problem of phase change as well as to solve specific particularities such as hysteresis phenomena (Bony & Citherlet, 2007) or sub-cooling (Günther et al., 2007). In the review by Zalba et al., 2003, the authors presented a comprehensive compilation of TES with PCM. The authors remarked that although there is a huge amount of published articles dealing with the heat transfer analysis of the phase change, the modelling of latent heat TES systems still remains a challenging task. When working with commercially available PCM (or mixtures or impure materials), the phase change takes place over a temperature range and therefore a two-phase zone appears between the solid and liquid phases. In these cases, it is appropriate to consider the energy equation in terms of enthalpy (Zukowsky, 2007b). When the advective movements within the liquid are negligible, the energy equation is expressed as follows:
· ·h t T (9)
The solution of this equation requires knowledge of the h-T functional dependency and the λ-T curve. The advantage of this methodology is that the equation is applicable to every phase; the temperature is determined at each point and the value of the thermo-physical properties can then be evaluated. In thermal simulations of PCM, the accuracy of the results relies on the material properties’ data (Arkar & Medved, 2005). In the geometry studied in this work, the main properties were enthalpy and thermal conductivity, but notice that the rate of melting/solidification can also depend on other material properties such as viscosity or density (Hamdan & Elwerr, 1996). In the models developed here the variation of thermophysical properties with temperature in all phases was considered.
4.2 Development of a 1D finite differences equations model for PCM plates
A PCM plate model was developed with finite differences, one-dimensional, implicit formulation. Implicit formulation was selected because of its unconditional stability. The basis model assumed only conduction heat transfer inside the PCM plate, in a normal direction to the air flow. The model analyzed the temperature of the airflow in a one-dimensional way. Due to its symmetry, the analyzed system was a division of the prototype. In the present work, the model was implemented in Matlab R2008b. The software implements direct methods, variants of Gaussian elimination, through the matrix division operators, which can be used to solve linear systems.
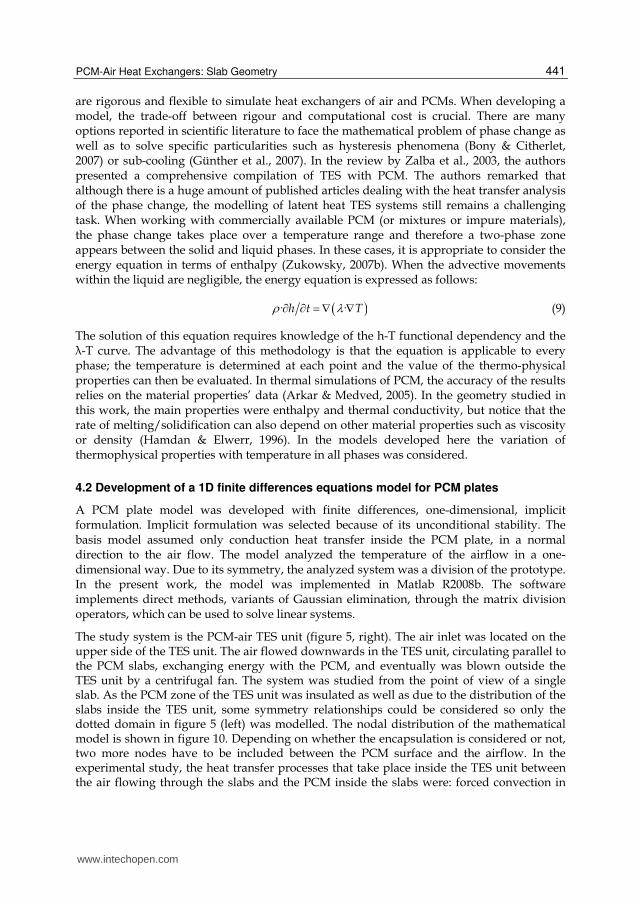
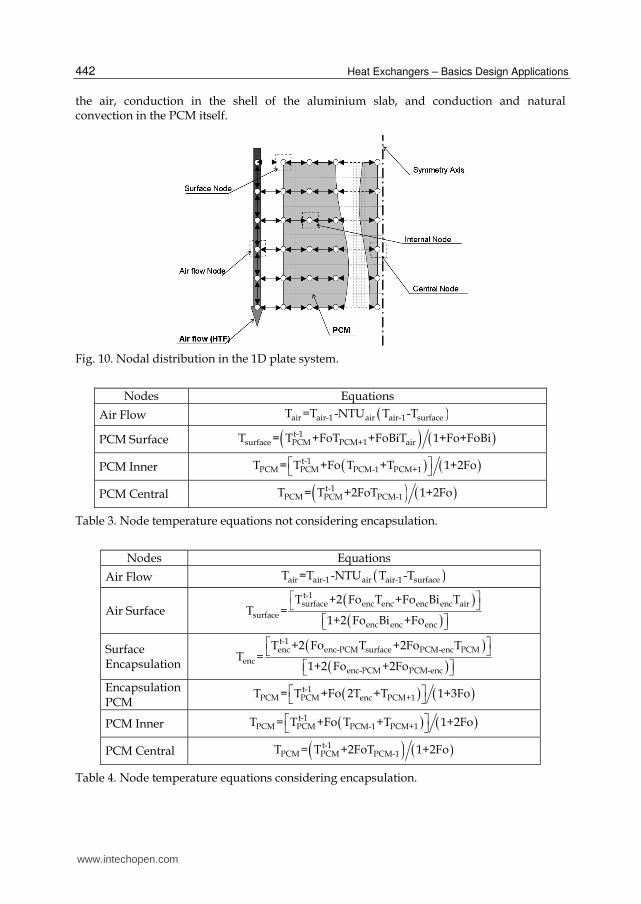
The study system is the PCM-air TES unit (figure 5, right). The air inlet was located on the upper side of the TES unit. The air flowed downwards in the TES unit, circulating parallel to the PCM slabs, exchanging energy with the PCM, and eventually was blown outside the TES unit by a centrifugal fan. The system was studied from the point of view of a single slab. As the PCM zone of the TES unit was insulated as well as due to the distribution of the slabs inside the TES unit, some symmetry relationships could be considered so only the dotted domain in figure 5 (left) was modelled. The nodal distribution of the mathematical model is shown in figure 10. Depending on whether the encapsulation is considered or not, two more nodes have to be included between the PCM surface and the airflow. In the experimental study, the heat transfer processes that take place inside the TES unit between the air flowing through the slabs and the PCM inside the slabs were: forced convection in
www.intechopen.com
Heat Exchangers – Basics Design Applications
442
the air, conduction in the shell of the aluminium slab, and conduction and natural convection in the PCM itself.
Fig. 10. Nodal distribution in the 1D plate system.
Nodes Equations
Air Flow air air-1 air air-1 surfaceT =T -NTU T -T
PCM Surface t-1surface PCM PCM+1 airT = T +FoT +FoBiT 1+Fo+FoBi
PCM Inner t-1PCM PCM PCM-1 PCM+1T = T +Fo T +T 1+2Fo
PCM Central t-1PCM PCM PCM-1T = T +2FoT 1+2Fo
Table 3. Node temperature equations not considering encapsulation.
Nodes Equations
Air Flow air air-1 air air-1 surfaceT =T -NTU T -T
Air Surface
t-1surface enc enc enc enc air
surfaceenc enc enc
T +2 Fo T +Fo Bi TT =
1+2 Fo Bi +Fo
Surface Encapsulation
t-1enc enc-PCM surface PCM-enc PCM
encenc-PCM PCM-enc
T +2 Fo T +2Fo TT =
1+2 Fo +2Fo
Encapsulation PCM
t-1PCM PCM enc PCM+1T = T +Fo 2T +T 1+3Fo
PCM Inner t-1PCM PCM PCM-1 PCM+1T = T +Fo T +T 1+2Fo
PCM Central t-1PCM PCM PCM-1T = T +2FoT 1+2Fo
Table 4. Node temperature equations considering encapsulation.
www.intechopen.com
PCM-Air Heat Exchangers: Slab Geometry
443
The dominant resistance of the process could be convection on the air side and not always conduction–convection in the PCM. In this case the thermal resistance of the encapsulation was very low, and therefore it was not necessary to consider encapsulation in the node system, as the heat transfer process was controlled by the convection on the air side and/or by the conduction–natural convection in the PCM. However, in other cases it is not always possible to disregard the thermal influence of the encapsulation, and therefore two models were developed: the first model did not take into account the thermal behaviour of the encapsulation and the second model did, and it was developed in order to be used for general purposes. The node equations of the two models are summarized in tables 3 and 4. Important aspects to consider when dealing with the simulation of this type of heat exchanger are as follows: friction factor (rugosity of the encapsulation surface), convection coefficient, thermophysical properties of the PCM (as functions of temperature), hysteresis, natural convection inside the PCM, thermal losses/gains through the TES casing, etc. More detailed information can be found in Dolado et al., 2011a, and Dolado, 2011.
4.3 Experimental validation: applying the uncertainties propagation approach to the model
The validation stage of a theoretical model has become a fundamental objective to evaluate
the precision, accuracy and reliability of computer simulations used in design. Uncertainties
can be associated with the own theoretical model, as well as with the measurement systems
used to characterize the process of interest or even with the manufacturing process of the
equipment. Therefore, assessing the validity of an approximation of a theoretical model
must be carried out based on stochastic measurements to ensure the trust of designers in the
use of the model. This improved knowledge of the theoretical model helps to know what are
the most critical factors as model inputs and, therefore, indicates what should be more
controlled in its determination or measurement. It also allows establishing an uncertainty
band set around the solution bringing more rigor to the model simulations. The
methodology of uncertainties propagation is an external method used to analyze the system
by means of the input-output analysis, instead of the traditional equation of uncertainties
propagation applied to a known function. The whole methodology followed in is
summarized in the next steps: 1) To select the variables under study; 2) To allocate the
probability distributions of each variable; 3) To generate samples for the different runs of the
theoretical model (by means of Latin hypercube sampling); 4) To run the program once per
sample; 5) To analyze the relations between the inputs and the outputs; 6) To classify the
variables; 7) To determine the uncertainty of the theoretical model results.
For the current study, the following parameters that introduce uncertainty in the results, were considered and classified into three groups:
Material properties (parameterized enthalpy-temperature curve, h-T, and thermal conductivity curve, λ-T);
Air conditions at the inlet of the TES unit (temperature and airflow);
Geometric parameters (PCM plate thickness and width of the air gap between plates).
The parameterization and the range of uncertainty assumed for all these parameters are detailed in Dolado, 2011. The confidence level is 97.5%. Furthermore, as the probability distribution of the different parameters is unknown, a normal distribution is taken in all
www.intechopen.com

Heat Exchangers – Basics Design Applications
444
cases. The study of uncertainties propagation is performed by numerical simulation of sets of input values of those parameters. Traditionally the random sampling technique has been used, which was followed by an improved version as the stratified sampling and subsequently the Latin hypercube (McKay et al., 1979) which is a valid technique used here. The variation range of the studied variable was analyzed. This result provides an estimate of the uncertainty range that would result as the TES unit is designed. This analysis sets the interval for the output variable of interest. For every particular time of the simulation the error was calculated as: 1) Histogram to the corresponding time of the results set of all simulations (the difference between the value in the current simulation and the reference case); 2) Function of the cumulative probability distribution; 3) Error in the given time at a certain confidence level; 4) Graphical representation of the reference case and of the error.
Parameter b ΔT hl Tsl
Related with
Slope of the sensible heat
Thermal window
Latent heat Average temperature of phase change
Reference value
3 kJ/(kg·K) 0.9 ºC 170 kJ/kg 27 ºC
Uncertainty ± 15 % ± 0.2 ºC ± 20 kJ/kg ± 1 ºC
Effect on h-T curve
Y
X
yt
yo
xo
Y
X
yt
yo
xo
Y
X
yt
yo
xo
Y
X
yt
yo
xo
Table 5. Parameters setting of the enthalpy-temperature curve.
Variable Reference value Uncertainty
V 1400 m3/h ± 86 m3/h
T experimental curve of Tair,in, ºC ± 0.6 ºC
Table 6. Parameters setting of the inlet air.
The corresponding value for a cumulative relative frequency of 97.5% was taken as the
uncertainty range in this approach. Running the theoretical model with the reference case
conditions (tables 5 and 6) yielded to the results shown in figure 11. The figure shows that
the heat rate has an initial plateau of about 4500 W, with a duration of 40 minutes, which
reduces while reaching the complete melting of the PCM. The full melting takes place two
hours after the start of the process. From these graphical results, the responses of interest
were obtained. Among the responses of interest provided by the theoretical model, the
analysis was focused on the following responses: average heat rate in the first hour
( Q average,1h), and time until the air reaches 32 ºC at the outlet (tTair,out=32ºC), as both responses
pose a greater interest in practical operation of the TES unit. Immediately afterwards,
applying the Latin hypercube sampling to run the numerical simulations, instead of getting
a single result of Q average,1h, a complete distribution was obtained. Figure 11 shows the
www.intechopen.com
PCM-Air Heat Exchangers: Slab Geometry
445
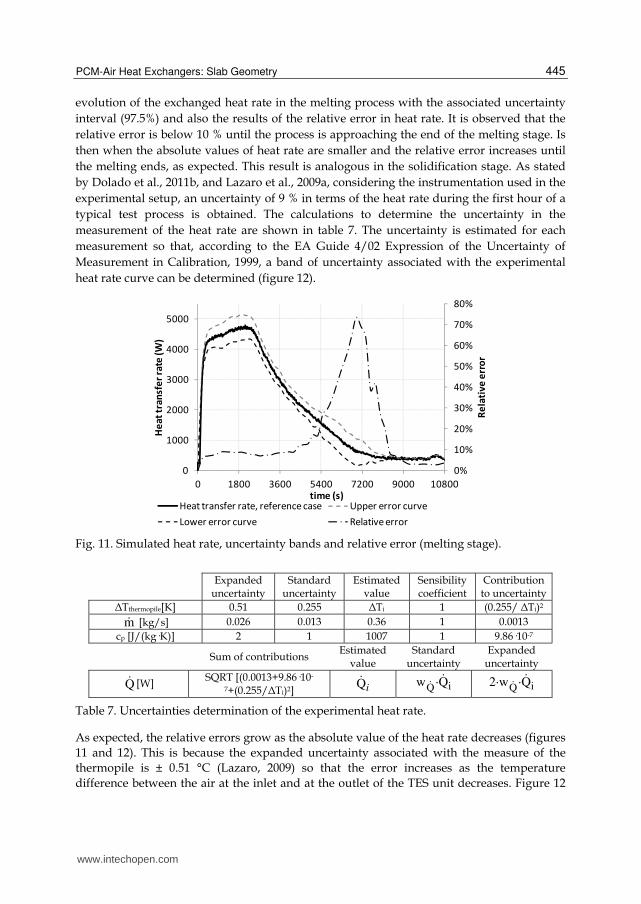
evolution of the exchanged heat rate in the melting process with the associated uncertainty
interval (97.5%) and also the results of the relative error in heat rate. It is observed that the
relative error is below 10 % until the process is approaching the end of the melting stage. Is
then when the absolute values of heat rate are smaller and the relative error increases until
the melting ends, as expected. This result is analogous in the solidification stage. As stated
by Dolado et al., 2011b, and Lazaro et al., 2009a, considering the instrumentation used in the
experimental setup, an uncertainty of 9 % in terms of the heat rate during the first hour of a
typical test process is obtained. The calculations to determine the uncertainty in the
measurement of the heat rate are shown in table 7. The uncertainty is estimated for each
measurement so that, according to the EA Guide 4/02 Expression of the Uncertainty of
Measurement in Calibration, 1999, a band of uncertainty associated with the experimental
heat rate curve can be determined (figure 12).
0%
10%
20%
30%
40%
50%
60%
70%
80%
0
1000
2000
3000
4000
5000
0 1800 3600 5400 7200 9000 10800R
ela
tiv
e e
rro
r
He
at
tra
nsf
er
rate
(W
)
time (s)Heat transfer rate, reference case Upper error curve
Lower error curve Relative error
Fig. 11. Simulated heat rate, uncertainty bands and relative error (melting stage).
Expanded
uncertainty Standard
uncertainty Estimated
value Sensibility coefficient
Contribution to uncertainty
ΔTthermopile[K] 0.51 0.255 ΔTi 1 (0.255/ ΔTi)2
m [kg/s] 0.026 0.013 0.36 1 0.0013
cp [J/(kg·K)] 2 1 1007 1 9.86·10-7
Sum of contributions Estimated
value Standard
uncertainty Expanded
uncertainty
Q [W] SQRT [(0.0013+9.86·10-
7+(0.255/ΔTi)2] Qi iQ
w ·Q iQ
2·w ·Q
Table 7. Uncertainties determination of the experimental heat rate.
As expected, the relative errors grow as the absolute value of the heat rate decreases (figures
11 and 12). This is because the expanded uncertainty associated with the measure of the
thermopile is ± 0.51 °C (Lazaro, 2009) so that the error increases as the temperature
difference between the air at the inlet and at the outlet of the TES unit decreases. Figure 12
www.intechopen.com

Heat Exchangers – Basics Design Applications
446
shows the overlap between the experimental curve (including the lower and upper limits
associated with its uncertainty) and the simulation (including the uncertainty of the
response heat rate calculated applying the reported technique). The agreement is significant
in most of the process, finding the more relevant discrepancies as the curve reaches the end
of the corresponding stage of the cycle (i.e. as the heat rate values are smaller).
0
500
1000
1500
2000
2500
3000
3500
4000
4500
5000
0.00 1.00 2.00 3.00 4.00
He
at
tra
nsf
er
rate
(W
)
time (s)Experimental upper limit Simulation upper limitExperimental lower limit Simulation lower limitExperimental Simulation
-4500
-4000
-3500
-3000
-2500
-2000
-1500
-1000
-500
0
500
5.00 6.00 7.00 8.00 9.00
He
at
tra
nsf
er
rate
(W
)
time (s)Experimental upper limit Simulation upper limit
Experimental lower limit Simulation lower limit
Experimental Simulation
Fig. 12. Comparison of experimental and simulated results (including their corresponding uncertainty bands) for the melting (up) and solidification (down) of a thermal cycle.
5. Design focused on applications. Feasibility
This section will describe how to design the heat exchanger once an application is specified. Free-cooling and temperature maintenance in rooms with special requirements possess high potential for PCM application in different countries according to their climate. Until now, the low thermal conductivity of PCM and air hindered the development of suitable heat exchangers. This section has as the overall objective to apply methodologies to study PCM and PCM-air heat exchangers that allow the development of applications with technical and economical viability. Finally, using the combined technique of design of experiments (hereafter DOE) and simulations, the feasibility of the possible application of this type of equipment is studied for temperature maintenance in rooms. Because the simulation itself is
www.intechopen.com
PCM-Air Heat Exchangers: Slab Geometry
447
not a design tool, this methodology is proposed to size the equipment. This technique greatly reduces the time spent in performing the simulations required to find the optimal equipment (Del Coz Díaz et al., 2010) as well as and a potential cost saving on the experimental (Del Coz Díaz et al., 2010; Gunasegaram et al., 2009) if the prototype-model similarity relations are met. Moreover, contrary to a sequential analysis, it is reasonable to use a mathematical and statistical methodology that allows planning the sequence of experiments on the philosophy of maximum information with minimum effort.
5.1 Empirical model: simulations of a case study and modular design
An empirical model was built from the experimental results described in the previous section. The aim was to simulate the thermal behaviour of the tested heat exchanger in different cases. These simulations were used to evaluate the technical viability of application. The model describes the temperature evolution of a room with an internal
cooling demand ( Q demand), where the PCM-air heat exchanger is operating and there is a
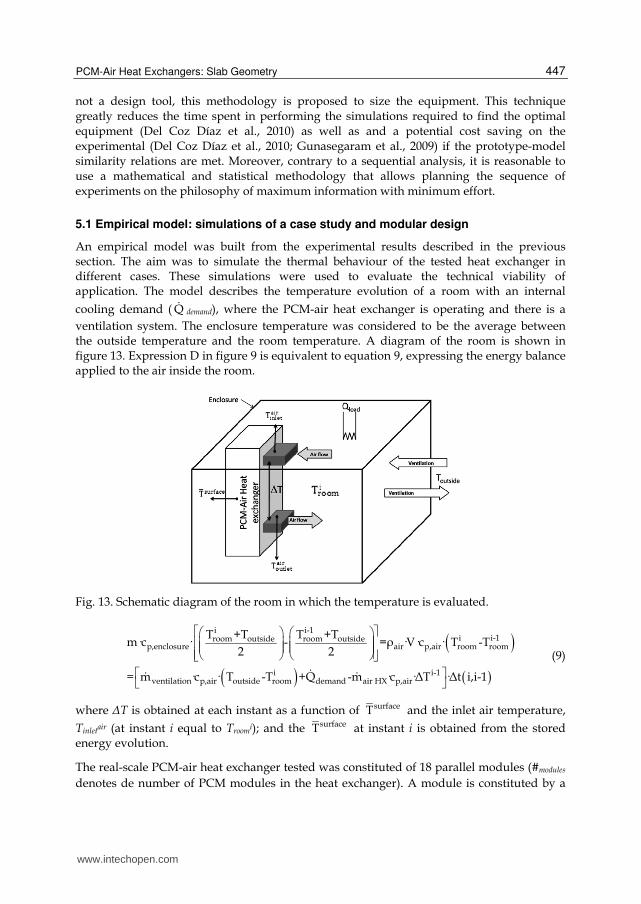
ventilation system. The enclosure temperature was considered to be the average between the outside temperature and the room temperature. A diagram of the room is shown in figure 13. Expression D in figure 9 is equivalent to equation 9, expressing the energy balance applied to the air inside the room.
Fig. 13. Schematic diagram of the room in which the temperature is evaluated.
i i-1
i i-1room outside room outsidep,enclosure air p,air room room
i i-1ventilation p,air outside room demand air HX p,air
T +T T +Tm·c · - =ρ ·V·c · T -T
2 2
= m ·c · T -T +Q -m ·c ·ΔT ·Δt i,i-1
(9)
where ΔT is obtained at each instant as a function of surfaceT and the inlet air temperature,
Tinletair (at instant i equal to Troomi); and the surfaceT at instant i is obtained from the stored energy evolution.
The real-scale PCM-air heat exchanger tested was constituted of 18 parallel modules (#modules
denotes de number of PCM modules in the heat exchanger). A module is constituted by a
www.intechopen.com
Heat Exchangers – Basics Design Applications
448
metallic PCM container between two air channels. The pressure drop is the same for each
module, and the air distribution through the air channels can be considered uniform. The
unitary air flow through a module is the mass air flow ( air HXm ) divided by 18. Since the
geometry and the air flow were maintained identical, the total stored energy for one module
(Etmod) between two temperatures is the stored energy for the real-scale PCM-air heat
exchanger between the two temperatures divided by 18 (equation 10). The total melting time
depends on Etmod and on the cooling power demand (equation 11).
modmodules tStored energy=# ·E (10)
modmelt demand modules t demandt =Stored energy Q = # ·E Q (11)
plateau melt resistances melt demand modulesT =T +1.58·Q =T +1.58·Q · 18 # (12)
The 1.58 value in equation 13 comes from the linear correlation between the average plateau
temperatures and the heating power ( Q resistances) data obtained experimentally. The origin
ordinate is the average phase change temperature of the PCM used. The relationship between the average phase change temperature (Tmelt) and the cooling power demand (expression E in figure 9) is described in equation 12. Assuming that the origin ordinate in the adjustment equation 13 is Tmelt , it is possible to define the number of modules and the Tmelt needed for a given cooling power demand, as well as the Tob and Δtob to maintain such a level (equations 14 and 15).
surface airinletΔT K =-1.4683-1.10943·T ºC +1.10706·T ºC (13)
melt ob demand modulesT =T -1.58·Q · 18 # (14)
mod
modules demand ob t# =Q ·Δt E (15)
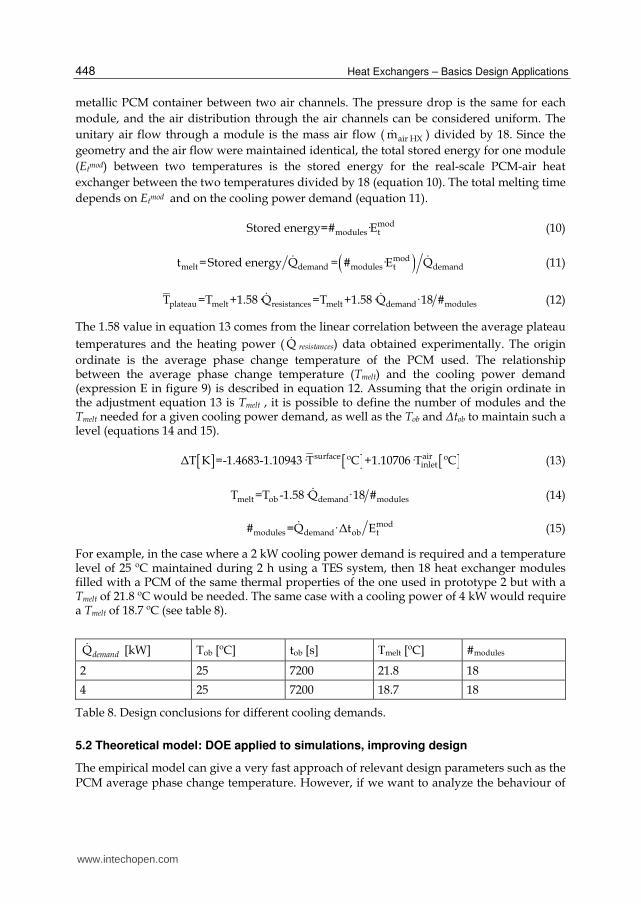
For example, in the case where a 2 kW cooling power demand is required and a temperature level of 25 ºC maintained during 2 h using a TES system, then 18 heat exchanger modules filled with a PCM of the same thermal properties of the one used in prototype 2 but with a Tmelt of 21.8 ºC would be needed. The same case with a cooling power of 4 kW would require a Tmelt of 18.7 ºC (see table 8).
Qdemand [kW] Tob [ºC] tob [s] Tmelt [ºC] #modules
2 25 7200 21.8 18
4 25 7200 18.7 18
Table 8. Design conclusions for different cooling demands.
5.2 Theoretical model: DOE applied to simulations, improving design
The empirical model can give a very fast approach of relevant design parameters such as the PCM average phase change temperature. However, if we want to analyze the behaviour of
www.intechopen.com

PCM-Air Heat Exchangers: Slab Geometry
449
the equipment when modifying any other parameter or variable, or if we need to improve/optimize the design, we have to move to the numerical model.
As a starting point we will continue using the case brought by Lazaro, 2009, which provides that, for proper running of the electronic equipment, the maximum air temperature in the room should be between 38 ºC and 48 °C, in particular we will establish it at 44 °C. The heat generation of the electronic equipment is 5 kW. For the evolution of temperature inside the room, an energy balance was stated with the following simplifications: 1) the cooling effect of the terrain was not considered. The ground floor area is supposed to be occupied by the equipment; 2) exterior ventilation is introduced only when it is favourable, and considering that the environment outside the house is 40 ° C (worst case).
The idea behind this system is that after a failure of the conventional cooling system, the TES unit is intended to smooth the evolution of the temperature of the room so that it extends the time to reach a certain threshold temperature value. The aim is this period to be about two hours, so technicians have sufficient time to reach the place where the room is located and to repair the damage of the cooling system without having to stop the electronic equipment. A series of restrictions put on the TES system follow:
Dimensions limitation due to the telecommunications shelter: the maximum length of the system is limited to 2.5 m (height of the shelter) which limits the section of the PCM to 1.25 m. Likewise, the width of the unit is also limited to 5 m due to the wall;
Electrical power consumption limitation of the fan, so it can be supplied by batteries without being essential a connection to the grid. Pressure drop should be less than 30 Pa.
MPCM [kg] V [m3/h] eplate [mm] eair [mm] Finishing
132 1340 6.5 12 3
Table 9. Operating conditions.
The operating conditions are shown in table 9 and the simulation results with the theoretical model of the unit proposed by Lazaro, 2009, are shown in figure 14.
-500
0
500
1000
1500
2000
2500
3000
3500
202224262830323436384042444648
0 1 2 3 4
He
at
rate
(W
)
Tem
pe
ratu
re (
ºC)
time (h)
TPCM in TPCM mid TPCM out
Tair out Troom w TES Troom w/o TES
Heat rate
Fig. 14. Theoretical model simulated results of Lazaro’s case (2009).
www.intechopen.com
Heat Exchangers – Basics Design Applications
450
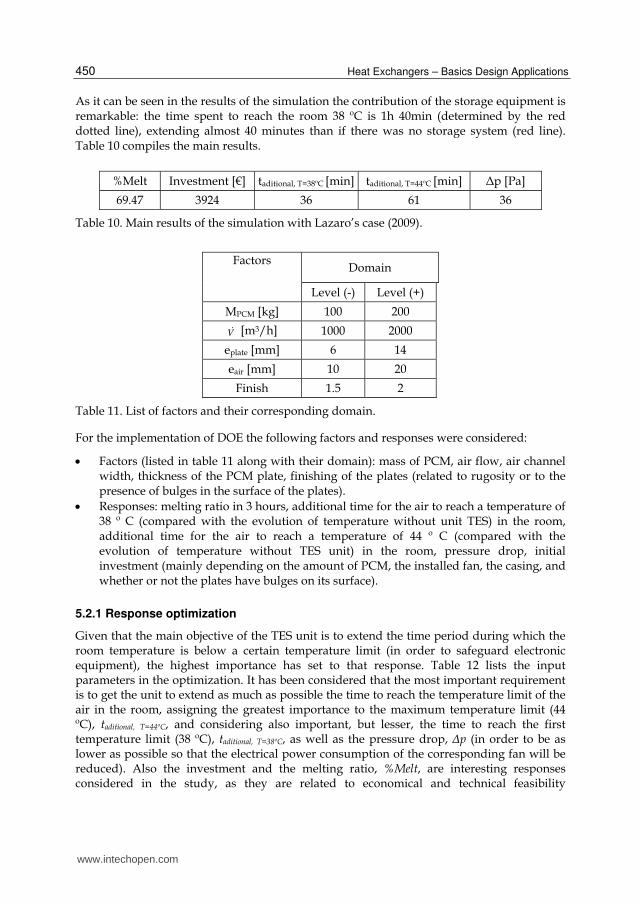
As it can be seen in the results of the simulation the contribution of the storage equipment is remarkable: the time spent to reach the room 38 ºC is 1h 40min (determined by the red dotted line), extending almost 40 minutes than if there was no storage system (red line). Table 10 compiles the main results.
%Melt Investment [€] taditional, T=38ºC [min] taditional, T=44ºC [min] Δp [Pa]
69.47 3924 36 61 36
Table 10. Main results of the simulation with Lazaro’s case (2009).
Factors
Domain
Level (-) Level (+)
MPCM [kg] 100 200
V [m3/h] 1000 2000
eplate [mm] 6 14
eair [mm] 10 20
Finish 1.5 2
Table 11. List of factors and their corresponding domain.
For the implementation of DOE the following factors and responses were considered:
Factors (listed in table 11 along with their domain): mass of PCM, air flow, air channel width, thickness of the PCM plate, finishing of the plates (related to rugosity or to the presence of bulges in the surface of the plates).
Responses: melting ratio in 3 hours, additional time for the air to reach a temperature of 38 º C (compared with the evolution of temperature without unit TES) in the room, additional time for the air to reach a temperature of 44 º C (compared with the evolution of temperature without TES unit) in the room, pressure drop, initial investment (mainly depending on the amount of PCM, the installed fan, the casing, and whether or not the plates have bulges on its surface).
5.2.1 Response optimization
Given that the main objective of the TES unit is to extend the time period during which the room temperature is below a certain temperature limit (in order to safeguard electronic equipment), the highest importance has set to that response. Table 12 lists the input parameters in the optimization. It has been considered that the most important requirement is to get the unit to extend as much as possible the time to reach the temperature limit of the air in the room, assigning the greatest importance to the maximum temperature limit (44 ºC), taditional, T=44ºC, and considering also important, but lesser, the time to reach the first temperature limit (38 ºC), taditional, T=38ºC, as well as the pressure drop, Δp (in order to be as lower as possible so that the electrical power consumption of the corresponding fan will be reduced). Also the investment and the melting ratio, %Melt, are interesting responses considered in the study, as they are related to economical and technical feasibility
www.intechopen.com
PCM-Air Heat Exchangers: Slab Geometry
451
respectively. Once the objectives are defined, each variable is assigned a weight (between 0.1 and 10) and an importance (also between 0.1 and 10).
In this approach to the optimization, each of the values of the responses is transformed using a desirability function. The weight defines the shape of this function for each response and is related to the emphasis on achieving the target:
- A value greater than one emphasizes the importance of achieving the goal; - A unit value gives equal importance to the objective and the limits; - A value less than one puts less emphasis on the goal.
After calculating the desirability for each response, the desirability composite is calculated (weighted geometric mean of the single ones) that allows to obtain the optimal solution.
In this case, the same weight is set to each of the answers assuming a unit value. This will set the target as important as any value within the limits for the corresponding answer.
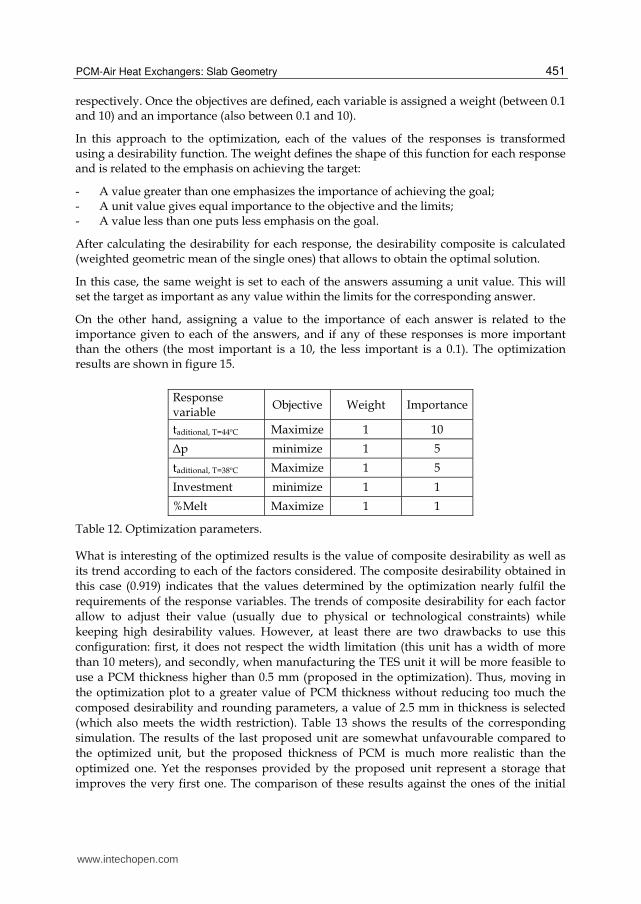
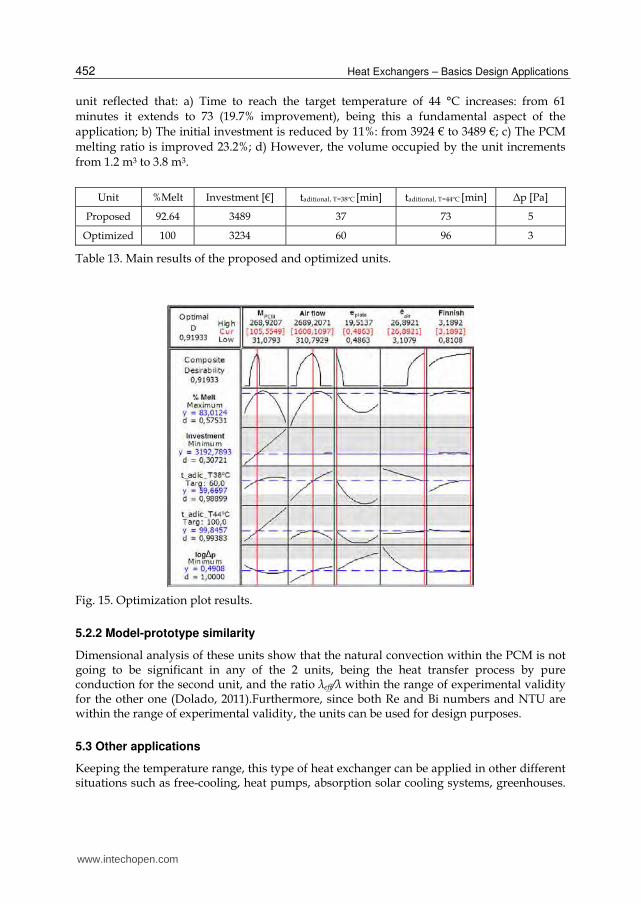
On the other hand, assigning a value to the importance of each answer is related to the importance given to each of the answers, and if any of these responses is more important than the others (the most important is a 10, the less important is a 0.1). The optimization results are shown in figure 15.
Response variable
Objective Weight Importance
taditional, T=44ºC Maximize 1 10
Δp minimize 1 5
taditional, T=38ºC Maximize 1 5
Investment minimize 1 1
%Melt Maximize 1 1
Table 12. Optimization parameters.
What is interesting of the optimized results is the value of composite desirability as well as
its trend according to each of the factors considered. The composite desirability obtained in
this case (0.919) indicates that the values determined by the optimization nearly fulfil the
requirements of the response variables. The trends of composite desirability for each factor
allow to adjust their value (usually due to physical or technological constraints) while
keeping high desirability values. However, at least there are two drawbacks to use this
configuration: first, it does not respect the width limitation (this unit has a width of more
than 10 meters), and secondly, when manufacturing the TES unit it will be more feasible to
use a PCM thickness higher than 0.5 mm (proposed in the optimization). Thus, moving in
the optimization plot to a greater value of PCM thickness without reducing too much the
composed desirability and rounding parameters, a value of 2.5 mm in thickness is selected
(which also meets the width restriction). Table 13 shows the results of the corresponding
simulation. The results of the last proposed unit are somewhat unfavourable compared to
the optimized unit, but the proposed thickness of PCM is much more realistic than the
optimized one. Yet the responses provided by the proposed unit represent a storage that
improves the very first one. The comparison of these results against the ones of the initial
www.intechopen.com
Heat Exchangers – Basics Design Applications
452
unit reflected that: a) Time to reach the target temperature of 44 °C increases: from 61
minutes it extends to 73 (19.7% improvement), being this a fundamental aspect of the
application; b) The initial investment is reduced by 11%: from 3924 € to 3489 €; c) The PCM
melting ratio is improved 23.2%; d) However, the volume occupied by the unit increments
from 1.2 m3 to 3.8 m3.
Unit %Melt Investment [€] taditional, T=38ºC [min] taditional, T=44ºC [min] Δp [Pa]
Proposed 92.64 3489 37 73 5
Optimized 100 3234 60 96 3
Table 13. Main results of the proposed and optimized units.
Fig. 15. Optimization plot results.
5.2.2 Model-prototype similarity
Dimensional analysis of these units show that the natural convection within the PCM is not going to be significant in any of the 2 units, being the heat transfer process by pure conduction for the second unit, and the ratio λeff/λ within the range of experimental validity for the other one (Dolado, 2011).Furthermore, since both Re and Bi numbers and NTU are within the range of experimental validity, the units can be used for design purposes.
5.3 Other applications
Keeping the temperature range, this type of heat exchanger can be applied in other different situations such as free-cooling, heat pumps, absorption solar cooling systems, greenhouses.
www.intechopen.com
PCM-Air Heat Exchangers: Slab Geometry
453
In any case, the DOE methodology proposed above could be followed to design a proper TES unit to the corresponding application (Dolado, 2011).
6. Conclusion
Methods to obtain enthalpy as well as the curves of thermal conductivity in the solid and liquid phases vs. temperature were proposed as a result of a critical analysis of the existing methods. A setup based on the T-history method was designed and built with significant improvements: 1) The possibility of measuring, for both organic and inorganic materials, cooling processes, therefore hysteresis and sub-cooling can also be studied; 2) The horizontal position decreases the error on enthalpy values since the liquid phase movements are minimized; 3) A Labview application allows the h-T curves to be directly obtained.
Results show that a heat exchanger using a PCM with lower thermal conductivity and lower total stored energy, but adequately designed, has higher cooling power and can be applied for free-cooling. Pressure drop is a key factor when designing any type of heat exchanger as it will determine the electrical energy consumption of the device. In the PCM-air heat exchangers with plates studied here, the pressure drop is ranged from 5 to 25 Pa. The analysis of the experimental data gathered accomplishes two aims: to develop empirical models of the TES unit and to come to a series of rules of thumb. Both are useful tools to design such kind of heat exchangers. For total energy storage strategy, the duration time of the cooling capacity of PCM heat exchanger depends on the cooling power demand. To validate the theoretical model developed, an uncertainties propagation analysis is proposed; here, the difference between the experimental and the simulation is less than 10% in terms of heat rate. The combined methodology of Design of Experiments applied to the numerical simulations seems to be a valid tool for design this kind of heat exchangers. When applied to the case study of temperature maintenance in a room, time to reach the maximum air temperature in the room was increased (19.7%), the initial investment was reduced by 11% and the PCM melting ratio was improved by 23.2%, as a drawback, the volume occupied by the unit was increased around 3 times.
7. Acknowledgment
The authors would like to thank the Spanish Government for the partial funding of this work within the framework of research projects ENE2005-08256-C02-02 and ENE2008-06687-C02-02. Pablo Dolado would specially like to thank the former Spanish Ministry of Education and Science for his FPI grant associated with the research project. The authors also wish to thank the company CIAT for the support given in the early stages of the experimental work. Special thanks are extended to Mr. Miguel Zamora, CIAT R&D Manager, for his collaboration.
8. Nomenclature
A [m2] heat exchange area At [m2] tube lateral area Ai [m2] area under the T-t curve, for the PCM Ai’ [m2] area under the T-t curve, for water b [J/(g·K)] parameter associated with the slope of the curve in all- liquid phase and all-solid phase, sensible heat, heat capacity
www.intechopen.com
Heat Exchangers – Basics Design Applications
454
· ·2·
airair air air
walls
VC Cp
N
[J/(s·K)] heat capacity
cp [J/(kg·K)] effective specific heat cp, air [J/(kg·K)] specific heat of air cp, liquid [J/(kg·K)] PCM effective specific heat in liquid phase cp, solid [J/(kg·K)] PCM effective specific heat in solid phase cpt [J/(kg·K)] specific heat of the tube cpw [J/(kg·K)] specific heat of water d desirability parameter (ranges from 0 to 1) e [m] thickness eplate [m] thickness of the PCM plate eair [m] thickness of the air gap between two PCM plates Etmod [kJ] total stored thermal energy for one module h [W/(m2·K)] convection coefficient (when standing alone) h [J/g] enthalpy hsl [J/g] PCM solid-liquid phase change enthalpy hl [J/g] enthalpy value in liquid phase, just after finishing the solid-liquid phase change hs [J/g] enthalpy value in solid phase, just before the start of the solid- liquid phase change L [m] sample thickness mp [kg] PCM mass mt [kg] tube mass
m [kg/s] mass flow
air through HXm [kg/s] air mass flowing through the heat exchanger
ventilationm [kg/s] ventilation air mass flow
MPCM [kg] PCM mass N number of elements · ·air airNTU h x w C
number of transfer units
Q [W] thermal power, heat transfer rate
average, 1hQ [W] average heat transfer rate in the first hour of storage unit
operation
demandQ [kW] internal cooling demand
HXQ [kW] heat transfer rate in the heat exchanger
resistancesQ [kW] heating power of the electrical resistances used in the
experimental setup t [s] time tmelt [s] total melting time tadditional, T=38ºC [s] elapsed time to reach 38ºC in the room tadditional, T=44ºC [s] elapsed time to reach 44ºC in the room [s] time until the air reaches 32ºC at the outlet of the storage unit t1/2 [s] time elapsed until half the temperature increment is achieved T [K, ºC] temperature
www.intechopen.com
PCM-Air Heat Exchangers: Slab Geometry
455
surfaceT [ºC] average surface temperature of the PCM
plateauT [ºC] average of air temperature during the plateau, obtained either
from the evolution of room temperature when it is simulated or from the air temperature at the heat exchanger outlet when it is measured on the experimental setup Troomi [ºC] room temperature at i instant Toutside [ºC] outdoors air temperature Tmelt [ºC] average PCM melting temperature Tob [ºC] air temperature plateau objective [ºC] air temperature at the inlet of the storage unit Tsl [ºC] average phase change temperature of PCM
V [m3/h] volumetric flow
w uncertainty contribution #modules number of PCM modules in the storage unit %Melt ratio of PCM melted, percentage
Greek symbols:
[m2/s] thermal diffusivity λ [W/(m·K)] thermal conductivity λeff [W/(m·K)] effective thermal conductivity ρ [kg/m3] density Δh [J/g] enthalpy difference Δp [Pa] pressure difference ΔT [K] temperature difference ΔTi [K] temperature step ΔTthermopile [K] temperature difference of air between the inlet and outlet, measured using a thermopile Δti=ti+1-ti [s] time interval for the PCM Δt’i=t’i+1-t’i [s] time interval for water Δtob [s] plateau time objective Δx, Δy [m] node length and height respectively
Acronyms and definitions:
Bi Biot number Fo Fourier number Re Reynolds number
enc 2
·Fo
· ·enc
enc enc
t
Cp e
PCM 2
·Fo
· ·
PCM
PCM PCM
T t
T Cp T y
PCM enc
·Fo
( · · · · )·PCM
enc enc PCM PCM
t
Cp e Cp y y
enc PCM
·Fo
( · · · · )·enc
enc enc PCM PCM
t
Cp e Cp y e
www.intechopen.com
Heat Exchangers – Basics Design Applications
456
encBi ·air ench e
DOE Design of Experiments DSC Differential Scanning Calorimetry HTF Heat Transfer Fluid HVAC Heating, Ventilation, and Air Conditioning PCM Phase Change Material PID Proportional Integral Derivative TES Thermal Energy Storage 1D One Dimensional
9. References
ANSI/ASHRAE STANDARD 94.1-2002. (2006). Method of Testing Active Latent-Heat Storage Devices Based on Thermal Performance (ANSI approved), recently replaced by ASHRAE 94.1-2010.
Arkar, C. & Medved, S. (2005). Influence of accuracy of thermal property data of a phase change material on the result of a numerical model of a packed bed latent heat storage with spheres. Thermochim Acta, (Aug 2005), Vol. 438, No. 1–2, pp. 192–201, 0040-6031.
Arkar, C.; Vidrih, B. & Medved, S. (2007). Efficiency of free cooling using latent heat storage integrated into the ventilation system of a low energy building. Int J Refrig, (Jan 2007), Vol. 30, No. 1, pp. 134-143, 0140-7007.
Bakenhus, B.H. (2000). Ice storage project. ASHRAE J, (May 2000), Vol. 42, No. 5, pp. 64-66, 0001-2491.
Bony, J. & Citherlet, S. (2007). Numerical model and experimental validation of heat storage with phase change materials. Energy Build, (Oct 2006), Vol. 39, No. 10, pp. 1065–1072, 0378-7788.
Butala, V. & Stritih, U. (2009). Experimental investigation of PCM cold storage. Energy Build, (Mar 2009), Vol. 41, No. 3, pp. 354-359, 0378-7788.
Del Coz Díaz, J.J.; García Nieto, P.J.; Lozano Martínez-Luengas, A. & Suárez Sierra, J.L. (2010). A study of the collapse of a WWII communications antenna using numerical simulations based on design of experiments by FEM. Eng Struct, (Jul 2010), Vol. 32, No. 7,pp. 1792-1800, 0141-0296.
Dolado, P.; Lazaro, A.; Zalba, B. & Marín, J.M. (2007). Numerical simulation of heat transfer in phase change materials (PCM) for building applications. Proceedings of Heat transfer in components and systems for sustainable energy technologies, 2-9502555-3-1, Chambery, France, April 2007.
Dolado, P.; Lazaro, A.; Marin, J.M. & Zalba, B. (2011a). Characterization of melting and solidification in a real-scale PCM-air heat exchanger: Numerical model and experimental validation. Energy Conv Manag, (Nov 2010), Vol. 52, pp. 1890-1907, 0196-8904.
Dolado, P.; Lazaro, A.; Marin, J.M. & Zalba, B. (2011b). Characterization of melting and solidification in a real-scale PCM-air heat exchanger: Experimental results and empirical model. Renew Energy, (Apr 2011), Vol. 36, pp. 2906-2917, 0960-1481.
www.intechopen.com

PCM-Air Heat Exchangers: Slab Geometry
457
Dolado, P. (2011). Thermal Energy Storage with phase change. Design and modelling of storage equipment to exchange heat with air. Thesis, University of Zaragoza, 978-84-694-6103-7, Zaragoza, Spain. Access by (in Spanish): http://zaguan.unizar.es/record/6153
EA-4/02. (1999). Expression of the Uncertainty of Measurement in Calibration. European co-operation for Acreditation.
Gunasegaram, D.R.; Farnsworth, D.J. & Nguyen, T.T. (2009). Identification of critical factors affecting shrinkage porosity in permanent mold casting using numerical simulations based on design of experiments. J Mater Process Technol, (Feb 2009), Vol. 209, No. 3, pp. 1209–1219, 0924-0136.
Günther, E.; Mehling, H. & Hiebler, S. (2007). Modeling of subcooling and solidification of phase change materials. Modell Simulat Mater Sci Eng, (Dec 2007), Vol. 15, No. 7, pp. 879–892, 0965-0393.
Hamdan, M.A. & Elwerr, F.A. (1996). Thermal energy storage using a phase change material. Sol Energy, (Feb 1996), Vol. 56, No. 2, pp.183–189, 0038-092X.
Kürklü, A. (1998). Energy storage applications in greenhouses by means of phase change materials (PCMs): a review. Renew Energy, (Jan 1998), Vol. 13, No. 1, pp. 89-103, 0960-1481.
Lazaro, A.; Dolado, P.; Marín, J.M. & Zalba, B. (2009a). PCM-air heat exchangers for freecooling applications in buildings: experimental results of two real-scale prototypes. Energy Conv Manag, (Mar 2009), Vol. 50, pp. 439-443, 0196-8904.
Lazaro, A.; Dolado, P.; Marin, J.M. & Zalba, B. (2009b). PCM-air heat exchangers for freecooling applications in buildings: empirical model and application to design. Energy Conv Manag, (Mar 2009), Vol. 50, pp. 444-449, 0196-8904.
Lazaro, A. (2009). Thermal energy storage with phase change materials. Building applications: materials characterization and experimental installation to test PCM to air heat exchanger prototypes. Thesis, University of Zaragoza, Zaragoza, Spain.
Lazaro, A.; Zalba, B.; Bobi, M. & Castellón, C. (2006). Experimental Study on Phase Change Materials and Plastics Compatibility. AIChE J, (Feb 2006), Vol. 52, No. 2, pp. 804-808, 0001-1541.
London, A.L. & Seban, R.A. (1943). Rate of ice formation. Transactions of the ASME, Vol. 65, pp. 771–778.
Marin, J. M. & Monne, C. (1998). Transferencia de calor (Heat transfer), Kronos, 8488502729, Zaragoza, Spain.
Marin, J.M.; Zalba, B.; Cabeza, L.F. & Mehling, H. (2003). Determination of enthalpy-temperature curves of phase change materials with the temperature-history method: improvement to temperature dependent properties. Meas Sci Techno, (Feb 2003), Vol. 14, No. 2, pp. 184-189, 0957-0233.
McKay, M.D.; Conover, W.J. & Beckman, R.J. (1979). A comparison of three methods for selecting values of input variables in the analysis of output from a computer code. Technometrics, Vol. 21, No. 2, pp. 239–245, 0040-1706.
Mehling, H. & Cabeza, L.F. (2008). Heat and cold storage with PCM. An up to date introduction into basics and applications, Springer-Verlag, 978-3-540- 68556-2, Berlin-Heidelberg, Germany.
Mills, A.; Farid, M.; Selman, J.R. & Al-Hallaj, S. (2006). Thermal conductivity enhancement of phase change materials using a graphite matrix. Appl Therm Eng, (Oct 2006), Vol. 26, No. 14-15, pp. 1652-1661, 1359-4311.
www.intechopen.com
Heat Exchangers – Basics Design Applications
458
Pérez Vergara, I.G.; Díaz Batista J.A. & Díaz Mijares, E. (2001). Simulation experiments optimized by response surfaces, Centro Azucar, (Jan 2001), Vol. 2, pp. 68-74.
Sharma, A.; Tyagi, V.V.; Chen, C.R. & Buddhi, D. (2009). Review on thermal energy storage with phase change materials and applications. Renew Sust Energ Rev, (Feb 2009), Vol. 13, pp. 318-345, 1364-0321.
Turnpenny, J.R.; Etheridge, D.W. & Reay, D.A. (2001). Novel ventilation system for reducing air conditioning in buildings. Part II: testing of prototype. Appl Therm Eng, (Aug 2001), Vol. 21, No. 12, pp. 1203-1217, 1359-4311.
Watanabe, H. (2002). Further examination of the transient hot-wire method for the simultaneous measurement of thermal conductivity and thermal diffusivity. Metrologia, Vol. 39, No. 1, pp. 65-81, 0026-1394.
Yanbing, K.; Yi, J. & Yinping, Z. (2003). Modeling and experimental study on an innovative passive cooling system e NVP system. Energy Build, (May 2003), Vol. 35, No. 4, pp. 417-425, 0378-7788.
Zalba, B.; Marín, J.M.; Cabeza, L.F. & Mehling, H. (2004). Free-cooling of buildings with phase change materials. Int J Refrig, (Dec 2004), Vol. 27, No. 8, pp. 839-849, 0140-7007.
Zalba, B.; Marín, J.M.; Cabeza, L. & Mehling, H. (2003). Review on thermal energy storage with phase change: materials, heat transfer analysis and applications. Appl Therm Eng, (Feb 2003), Vol. 23, No. 3, pp. 251–283, 1359-4311.
Zhang, Y.; Jiang, Y. & Jiang, Y. (1999) A simple method, the T-history method, of determining the heat of fusion, specific heat and thermal conductivity of phase-change materials. Meas Sci Techno, (Mar 1999), Vol. 10, No. 3, pp. 201-205, 0957-0233.
Zhang, D.; Tian, S.L. & Xiao, D.Y. (2007). Experimental study on the phase change behavior of phase change material confined in pores. Sol Energy, Vol. 81, No. 5, pp. 653-660, 0038-092X.
Zukowski, M. (2007a). Experimental study of short term thermal energy storage unit based on enclosed phase change material in polyethylene film bag. Energy Conv Manag, (Jan 2007), Vol. 48, No. 1, pp. 166-173, 0196-8904.
Zukowski, M. (2007b). Mathematical modeling and numerical simulation of a short term thermal energy storage system using phase change material for heating applications. Energy Conv Manag, (Jan 2007), Vol. 48, No. 1, pp.155–65, 0196-8904.
www.intechopen.com
Heat Exchangers - Basics Design ApplicationsEdited by Dr. Jovan Mitrovic
ISBN 978-953-51-0278-6Hard cover, 586 pagesPublisher InTechPublished online 09, March, 2012Published in print edition March, 2012
InTech EuropeUniversity Campus STeP Ri Slavka Krautzeka 83/A 51000 Rijeka, Croatia Phone: +385 (51) 770 447 Fax: +385 (51) 686 166www.intechopen.com
InTech ChinaUnit 405, Office Block, Hotel Equatorial Shanghai No.65, Yan An Road (West), Shanghai, 200040, China
Phone: +86-21-62489820 Fax: +86-21-62489821
Selecting and bringing together matter provided by specialists, this project offers comprehensive informationon particular cases of heat exchangers. The selection was guided by actual and future demands of appliedresearch and industry, mainly focusing on the efficient use and conversion energy in changing environment.Beside the questions of thermodynamic basics, the book addresses several important issues, such asconceptions, design, operations, fouling and cleaning of heat exchangers. It includes also storage of thermalenergy and geothermal energy use, directly or by application of heat pumps. The contributions arethematically grouped in sections and the content of each section is introduced by summarising the mainobjectives of the encompassed chapters. The book is not necessarily intended to be an elementary source ofthe knowledge in the area it covers, but rather a mentor while pursuing detailed solutions of specific technicalproblems which face engineers and technicians engaged in research and development in the fields of heattransfer and heat exchangers.
How to referenceIn order to correctly reference this scholarly work, feel free to copy and paste the following:
Pablo Dolado, Ana Lázaro, José María Marín and Belén Zalba (2012). PCM-Air Heat Exchangers: SlabGeometry, Heat Exchangers - Basics Design Applications, Dr. Jovan Mitrovic (Ed.), ISBN: 978-953-51-0278-6,InTech, Available from: http://www.intechopen.com/books/heat-exchangers-basics-design-applications/pcm-air-heat-exchangers-slab-geometry

© 2012 The Author(s). Licensee IntechOpen. This is an open access articledistributed under the terms of the Creative Commons Attribution 3.0License, which permits unrestricted use, distribution, and reproduction inany medium, provided the original work is properly cited.