PCI vs. CABG From BARI to Syntax, Is The Game Over Park.pdf · PCI vs CABG Multi-Vessel Disease...
45
Seung-Jung Park, MD, PhD Professor of Medicine, University of Ulsan College of Medicine Asan Medical Center, Seoul, Korea PCI vs. CABG From BARI to Syntax, Is The Game Over ?
Transcript of PCI vs. CABG From BARI to Syntax, Is The Game Over Park.pdf · PCI vs CABG Multi-Vessel Disease...

Seung-Jung Park, MD, PhD Professor of Medicine, University of Ulsan College of Medicine
Asan Medical Center, Seoul, Korea
PCI vs. CABG From BARI to Syntax,
Is The Game Over ?

PCI vs CABG
Multi-Vessel Disease
Meta-Analysis of RCTs
BARI 2D
FREEDOM
SYNTAX

Risk difference (95% CI)Study, year PCI CABG
BARI, 1996 790/915 816/914
EAST, 2000 153/174 161/177
GABI, 2005 164/177 157/165
RITA, 1998 483/510 474/501
French Monocentric Study, 199766/76 68/76
Balloon overall 1,656/1,852 1,676/1,833
ARTS, 2005 542/590 538/584
AWESOME, 2001 30/38 19/26
ERACI II, 2005 209/225 199/225
MASS II, 2006 177/205 171/203
BMS overall 958/1,058 927/1,038
MVD overall 2,614/2,910 2,603/2,871
Surviving patients/all patients
CABG betterPCI better
Meta-analysis of 23 RCTS, 9,963 patients treated with PTCA or BMS vs CABG
-0.15 -0.08 0.00 0.08 0.15
Ann Int Med 147:708, 2007 P=NS
5 Year Survival

More Strokes in CABG
Study, year Risk difference (95% CI)PCI CABG
ARTS, 2001 590/600 592/605
AWESOME, 2001 220/222 229/232
BARI, 1996 913/915 907/914
EAST, 1994 197/198 191/194
ERACI II,2001 225/225 223/225
GABI, 1994 182/182 175/177
Drenth et al, 2002 50/51 51/51
Diegeler et al, 2002 110/110 109/110
MASS, 1995 72/72 70/70
MASS II, 2004 203/205 197/203
Octostent, 2003 138/138 142/142
Cisowski et al, 2002 50/50 50/50
RITA, 1992 509/510 496/501
Hong et al, 2005 119/119 69/70
SIMA, 2000 62/63 60/60
Overall 3,640/3,660 3,561/3,604
Surviving patients/all patients
P=0.002 CABG betterPCI better Ann Int Med 147:708, 2007

Total mortality* (n/N) 5-year mortality (%)† Hazard ratio (95% CI)* P value‡
CABG PCI CABG PCI
Age<55 years 107/1063 88/1122 5.5% 5.0% 1.25 (0.94/1.66)
0.002Age 55-64 years 201/1477 220/1456 8.0% 9.4% 0.90 (0.75-1.09)
267/1347 319/1341 11.0% 14.7% 0.82 (0.70-0.97)
Women 162/909 164/922 9.6% 12.0% 1.02 (0.82-1.27)0.25
Men 413/2980 464/3001 8.0% 9.4% 0.88 (0.77-1.00)
No diabetes 432/3263 448/3298 7.6% 8.1% 0.98 (0.86-1.12)0.014
143/615 179/618 12.3% 20.0% 0.70 (0.56-0.87)
Not smoking 393/2558 440/2526 7.9% 9.5% 0.87 (0.76-1.00)0.073
Smoking 158/816 149/849 10.4% 10.9% 1.11 (0.89-1.39)
No hypertension 268/2128 299/2167 7.1% 8.7% 0.90 (0.76-1.06)0.73
Hypertension 306/1750 329/1753 9.9% 11.5% 0.93 (0.79-1.11)
Normal cholesterol 236/1559 273/1588 9.0 11.0% 0.84 (0.71-1.00)0.46
hypercholeserolaemia 221/1667 247/1719 8.4 9.8% 0.93 (0.77-1.11)
No PVD 374/2841 408/2872 8.1% 9.1% 0.92 (0.80-1.06)0.33
PVD 91/334 110/331 15.0% 22.1% 0.78 (0.59-1.03)
Treatment Effect in Subgroups
CABG better PCI better
Age>65 yeas
Diabetes
Hlatky MA et al. Lancet 2009;373:1190

1. No Difference in Mortality and Death or MI between the two group.
2. TVR is Higher in PCI group.
3. Stoke is Higher in CABG group.
4. Better Survival, in Diabetics and Older Age (>65year) in CABG group.
PCI (Balloon PTCA and BMS) vs. CABG
In Multi-Vessel Disease

Diabetic
Concerns,

BARI 10-Year Survival
100
80
60
40
20
00 1 2 3 4 5 6 7 8 9 10
No Diabetes CABG vs PTCA: p = 0.50
Diabetes CABG vs PTCA: p = 0.012
ND CABG 78.2%
ND PTCA 76.8%
DM, CABG 57.1%
DM, PTCA 44.1%
Su
rviv
al (%
)
Diabetes CABG (n=180)
No diabetes CABG (n=734)
Diabetes PTCA (n=173)
No diabetes PTCA (n=742)
Years
“Unsuspected” Finding
in Patients with Diabetes
PTCA vs. CABG in Multi-Vessel DiseaseFrom 1988 to 1991

Syntax, Diabetic Subgroup
No Diabetes
n=1348
Diabetes*
n=452 P value
Age, yrs 65.0 + 9.9 65.4 + 9.2 0.41
Male, % 79.9 71.0 <0.001
Body Mass Index (Kg/m2) 27.5 + 4.4 29.5 + 5.2 <0.001
Metabolic Syndrome % 37.4 69.9 <0.001
Increased waist circumference 42 60.6 <0.001
Hypertension, % 72.6 84.1 <0.001
Hyperlipidemia, % 76.7 81.5 0.03
Current smoker, % 21.7 15.8 0.006
Congestive heart failure, % 3.7 7.4 0.001
Peripheral vascular disease, % 8.2 14.6 <0.001
Prior stroke, % 3.8 6.0 0.046
Creatinine >200 µmol/L 1.0 2.9 0.003
EuroSCORE 3.7 + 2.6 4.0 + 2.7 <0.03
Parsonnet score 7.5 + 6.8 11.3 + 6.4 <0.001
Clinical Baseline Risk Increased

No Diabetes
n=1348
Diabetes*
n=452 P value
Lesion Complexity
Diffuse disease or small vessel % 10.2 13.4 0.06
Average implanted stent diameter, mm 3.5 + 0.5 3.4 + 0.5 <0.001
Total stent length, mm 85.3 + 47.5 86.6 + 49.0 0.37
SYNTAX score 28.6 + 11.5 29.0 + 11.2 0.52
Number of lesions 4.3 + 1.8 4.6 + 1.8 0.003
Left main, any % 35.9 29 0.007
3 vessel disease only 64.1 71 0.007
Angiographic Baseline Risk Increased
Syntax, Diabetic Subgroup

Death/stroke/MI Revasc MACCE
P=0.53 P<0.001 P=0.002
TAXUSCABG
%
Banning AP et al, JACC 2010;55:1067–75
Syntax, Diabetic Subgroup (n=452),
3 Year Outcomes

1. Diabetes was associated with more metabolic risk
factors and more co-morbidities status.
2. Diabetes was associated more complex coronary lesion
morphology which tended to have increased repeat
revascularization rates with PCI.
3. Diabetic injury responses of stented segment should be
more exaggerated with accelerated atherogenesis and
active inflammatory process, which may be related with
higher rate of MACE.
Banning AP et al, JACC 2010;55:1067–75
Diabetes,
Why Problem ?

BARI 2D
Bypass Angioplasty Revascularization
Investigation 2 Diabetes ;
Focused on the Diabetes

Prompt Revascularization (PCI or CABG)
vs. Medical Therapy (n=1,185)
(%)
100
80
60
40
20
00 1 2 3 4 5
Years Since Randomization
Su
rviv
al
All-cause Mortality
88.3% Rev
87.8% Med
P=0.97
Prompt Revascularization
Intensive Medical
(%)
100
80
60
40
20
00 1 2 3 4 5
Years Since Randomization
Eve
nt F
ree
Death/MI/Stroke
77.2% Rev
75.9% Med
P=0.70
Prompt Revascularization
Intensive Medical

BARI 2D: PCI vs. Medical Treatment (Lower Risk Patients)
SurvivalFreedom from MACE
(death, MI, or stroke)
Diff [95%CI] =
0.5% [-2.0%, 3.1%]
P=0.97
Surv
ival (%
)
Years
0 1 2 3 4 50
20
40
60
80Medical Therapy
PCI
87.8
88.3100
Diff [95%CI] =
1.3% [-2.2%, 4.9%]
P=0.70Even
t-fr
ee S
urv
ival (%
)
Years
0 1 2 3 4 50
20
40
60
80
Medical Therapy
PCI
75.9
77.2
100
The BARI 2D Study Group.NEJM 2009;360:2503-15

Surv
ival (%
)
YearsE
ven
t-fr
ee S
urv
ival (%
)
Years
P=0.33
0 1 2 3 4 50
20
40
60
80Medical Therapy
CABG
83.6
86.4100
P=0.01
0 1 2 3 4 50
20
40
60
80
Medical Therapy
CABG
69.5
77.6
100
BARI 2D: CABG vs. Medical Treatment (Higher Risk Patients)
The BARI 2D Study Group.NEJM 2009;360:2503-15
SurvivalFreedom from MACE
(death, MI, or stroke)
Among high risk patients, CABG reduces MACE
compared with medical therapy, mainly related
with lower rate of myocardial infarction.

FREEDOM
Future REvascularization Evaluation in
Patients with Diabetes Mellitus: Optimal
Management of Multivessel Disease

PCI CABG P value
No. of Patients 953 947
Age, yrs 63.2 + 8.9 63.1 + 9.2 0.78
Male, % 73 70 0.08
Body Mass Index (Kg/m2) 29.7 + 5.4 29.8 + 5.3 0.08
Hypertension, % 85% 85% 0.75
Hyperlipidemia, % 84% 83% 0.66
Current smoker, % 15% 17% 0.31
Congestive heart failure, % 26% 28% 0.25
Prior Stoke 4% 3% 0.31
LV EF <40% 3% 2% 0.07
EuroScore 2.7 + 2.4 2.8 + 2.5 0.52
Syntax Score 26.2 + 8.4 26.1 + 8.8 0.77
Three vessel disease 82.3 84.5 0.22
No.of lesion 5.7 + 2.2 5.7 + 2.2 0.33
No.of stented lesion or graft vessel 3.5 + 1.4 2.9 + 0.8 NA
CTO lesion 6% 6% 0.99
Bifurcation lesion 22% 21% 0.06
BASELINE CHARACTERISTICS

Primary Endpoint, Death / MI / Stroke
30
20
10
0
De
ath
/Str
ok
e/M
I, %
Log-rank P=0.005
CABG
PCI/DES
0 1 2 3 4 5 6
Years
PCI/DES N 953 848 788 625 416 219 40CABG N 943 814 758 613 422 221 44
26.6%
18.7%
Farkouh et al, NEJM 2012 November 4

Years post-randomization0 1 2 3 4 5
0
10
20
30A
ll-C
ause M
ort
alit
y, %
CABG 10.9%
PCI/DES 16.3%
953 897 845 685 466 243PCI/DES N
947 855 806 655 449 238CABG N
Log-rank P=0.049
Years post-randomization
0 1 2 3 4 5
0
10
20
30
Myo
ca
rdia
l In
farc
tion, %
CABG
PCI/DES
953 853 798 636 422 220PCI/DES N
947 824 772 629 432 229
Log-rank P<0.0001
CABG N
13.9 %
6.0%
PCI/DES
2.4%
Years post-randomization
0 1 2 3 4 5
0
10
20
30
Str
oke, %
953 891 833 673 460 241PCI/DES N
947 844 791 640 439 230CABG N
Log-rank
P=0.034
CABG
5.2%
0
10
20
30
0 1 2 3 4 5 6 7 8 9 10 11 12
Months post-procedure
Repe
at R
evascu
larizatio
n, %
CABG
PCI/DES
944 887 856 818 792PCI/DES N
911 858 836 825 806CABG N
Log-rank
P<0.0001 13%
5%
Death MI
Stroke Repeat Revascularization

Clinical Outcomes at 2 and 5 Years,
FREEDOM
2 year 5 year P value
Number (%) PCI CABG PCI CABG
Primary
Composite121 (13.0) 108 (11.9) 200 (25.5) 146 (18.7) 0.005
Any Death 62 (6.7) 57 (6.3) 114 (16.3) 83 (10.9) 0.049
MI 62 (6.7) 42 (4.7) 98 (13.9) 48 (6.0) <0.001
Stroke 14 (1.5) 24 (2.7) 20 (2.4) 37 (5.2) 0.03
CV Death 9 (0.9) 12 (1.3) 73 (10.9) 52 (6.8) 0.12
>
>
>
<
CABG was superior to PCI with DESs
In patients with diabetes and advanced CAD
(predominantly, 3 vessel).

SYNTAX
5 Year Outcomes

CABG RCTN=897
PCI RCTN=903
P value
Age* (y) 65.0± 9.8 65.2± 9.7 0.55
Male, % 78.9 76.4 0.20
Diabetes*†, % 24.6 25.6 0.64
Additive euroSCORE* 3.8± 2.7 3.8± 2.6 0.78
Total Parsonnet score* 8.4± 6.8 8.5± 7.0 0.76
Total SYNTAX Score 29.1± 11.4 28.4± 11.5 0.19
Mean # of lesions 4.4± 1.8 4.3± 1.8 0.44
3VD only, % 66.3 65.4 0.70
Left main, any, % 33.7 34.6 0.70
Total occlusion, % 22.2 24.2 0.33
Complete revasc, % 63.2 56.7 0.005
Patient Characteristics
Values are mean±SD or %. Core laboratory reported unless *Site-reported †Medically treated

SYNTAX 3 VD,
5 Year Outcomes
CABG PCI P value
MACCE 24.2% 37.5% <0.001
All-cause mortality 9.2% 14.6% 0.006
Cardiac mortality 4.0% 9.0% 0.001
MI 3.3% 10.6% <0.001
Death/CVA/MI 14.0% 22.0% <0.001
Repeat
revascularization
12.6% 25.4% <0.001
CVA 3.4% 3.04% 0.66
CABG is Better !!Is the Game Over ?

SYNTAX Trial
Complete Revascularization,
Small Vessel Included (<1.5 mm)
Average Number of Stents
4.6 + 2.3

1. Complete Revascularization of All vessel,
2. Small Vessel (1.5 mm in Diameter) included,
3. Only Angio-Guided (>50%),
4. Using Too Many Ugly DES (TAXUS 4.6/pt)
5. Can Make a Worst Clinical Outcomes.
Syntax Concept of PCI is
Outdated from Current Practice !
Message from
SYNTAX, 5 Year Outcomes

1. Smart “New DES”
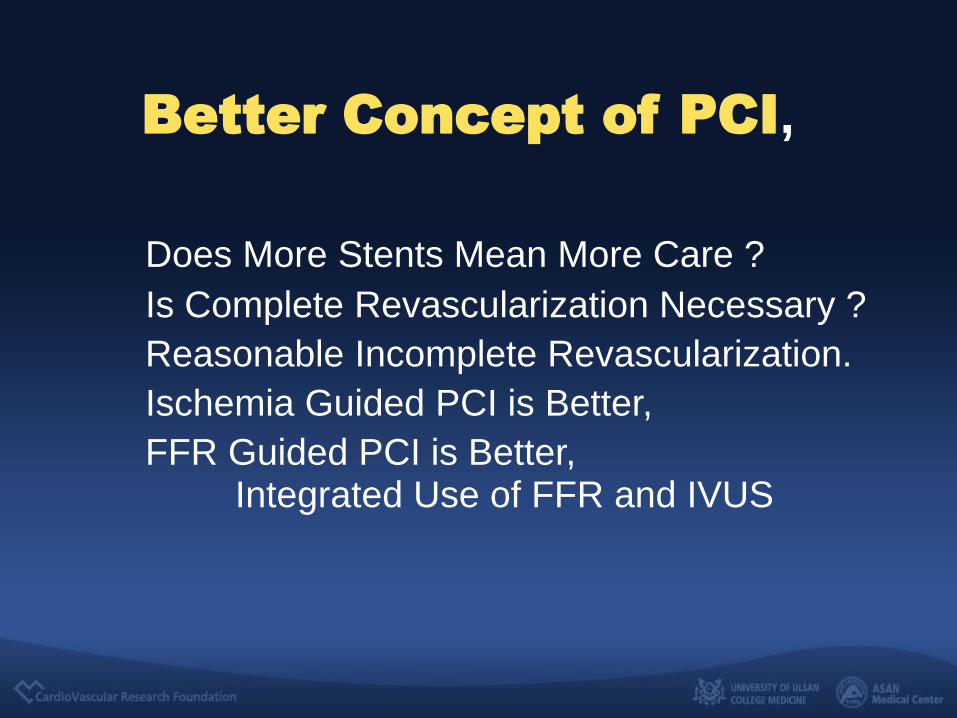
2. Better Concept of PCI,
Does More Stents Mean More Care ?
Is Complete Revascularization Necessary ?
Reasonable Incomplete Revascularization.
Ischemia Guided PCI is Better,
FFR Guided PCI is Better, Integrated Use of FFR and IVUS
We Are Evolving Now, 2013

Past Story,
BARI 2D
FREEDOM
SYNTAX
Old DES,
DES 35%, BMS 56%, Others 9%
SES 49%, PES 41%, Others 10%
PES 100%,

Sarno et al, Eur Heart J 2012
New DES is Clearly Better !
“New DES”
Restenosis
BMS
“Old DES”
0.060
0.040
0.020
0.000
0 3 6 9 12 15 18 21 24
Time after PCI (months)
Cu
mula
tive
risk
o
f re
sten
osis
Definite ST
BMS
“Old DES”
“New DES”
Time after PCI (months)
Cu
mula
tive
risk
o
f S
te
nt T
hro
mbo
sis
0.010
0.006
0.004
0.000
0 3 6 9 12 15 18 21 24
0.012
0.008
0.002
SCAAR Registry (94,384 pts)
Better Concept of PCI,
Does More Stents Mean More Care ?
Is Complete Revascularization Necessary ?
Reasonable Incomplete Revascularization.
Ischemia Guided PCI is Better,
FFR Guided PCI is Better, Integrated Use of FFR and IVUS

1 Y
ear
Rep
eat
Re
va
scu
lari
zati
on
, %
Stent Number
ASAN Multivessel Registry (n=2.8)
FAME
FFR guided
(n=1.9)
Dejan et al. (n=3.3)
AUTAX (n=3.2)
SYNTAX:Registry (n=3.1)
Li Y et al.
(n=2.7)
FAME, Angio guided, (n=2.7)
PRECOMBAT(n=2.7)
SYNTAX: RCT (n=4.6)
More Stents Means Just More MACCE !

Kim YH et al, Circulation. 2011;123:2373-2381
Incomplete
Revascularization
Complete
Revascularization
11.9
12.1
MACE
P=0.91
00
10
360
20
30
40%
720 1080 1440 1800
IR
CR
997
917
939
871
904
850
878
821
834
782
526
581
0 360 720 1080 1440 1800
24.9
22.4
MACCE
P=0.21
997
917
876
821
821
787
787
744
731
698
444
520
At risk
Impact of Complete RevascularizationUnadjusted Outcomes of MACCE

Definitions
Multivariate adjustment IPTW
HR95% CI
p HR95% CI
pLL UL LL UL
All
Angiographic CR-1 0.90 0.75 1.09 0.29 0.91 0.75 1.10 0.32
Angiographic CR-2 0.89 0.73 1.07 0.21 0.92 0.76 1.12 0.40
Proximal CR 0.92 0.76 1.12 0.40 0.90 0.74 1.10 0.30
PCI
Angiographic CR-1 0.95 0.76 1.18 0.62 0.94 0.75 1.18 0.61
Angiographic CR-2 0.99 0.80 1.22 0.90 1.00 0.81 1.25 0.99
Proximal CR 1.01 0.82 1.26 0.90 1.04 0.83 1.30 0.73
Impact of Complete RevascularizationAdjusted Outcomes of MACCE
Kim YH et al, Circulation. 2011;123:2373-2381
No Different Clinical Outcomes
Between Complete vs. Incomplete Revascularization
in DES era with Optimal Medical Treatment

Very small vessels
Jailed asymptomatic
side branch
Not culprit artery
Anatomy
Non-viable myocardium
< 5% residual ischemic area,
Small ischemic area
Function
FFR > 0.80
Physiology
Reasonable Incomplete RevascularizationWith Optimal Medical Treatment
These Are Cosmetic Angioplasty !
Optimal Medical Treatment is Very Enough.

Ischemia* Guided PCI Has Better
Clinical Outcomes
Kim YH et al, JACC 2012;60: 181–90
At risk
IG- 2265 1523 638
IG+ 322 246 92
22.8 %
17.4 %
MonthsCum
ula
tive S
urv
ival (%
)
P=0.006
0 360 720 1080 1440 1800
0
10
20
30Non-IG Ischemia Guided
Thallium Perfusion Scan (+)*
MACCE at 5 Years

Meta-Analysis FFR vs. CAG Guided PCI
A total of 9,301 patients
(1 randomized trial and 4 observational studies)
Park SJ, Ahn JM, Unpublished Data, 2013
FFR Guided PCI is Better,

I2=0
Death
Odds
Ratio
Lower
Limit
Upper
Limit
Z-
Value
P-Value
Wongpraparut 2005 1.25 0.24 6.59 0.26 0.80
Pijls 2010 0.68 0.33 1.38 -1.08 0.28
Angkananard 2011 2.09 0.36 12.16 0.82 0.41
Puymirat 2012 0.61 0.30 1.20 -1.44 0.15
Lerman 2013 0.56 0.48 0.66 -7.22 0.00
Random pooled
estimate
0.58 0.50 0.67 -724 <0.001
Odds ratio and 95% CI
0.01 0.1 1 10 100
Favor FFR Favor CAG
FFR vs. Angio-Guided PCI(Meta-analysis n=9,301)

Death
MI
MACE
42%
53%
30%
Outcomes
RelativeRisk Reduction
TVR
29%
P value
<0.001
<0.001
0.06
<0.001
Park SJ, Ahn JM et al. Unpublished data, 2013
FFR vs. Angio-Guided PCI(Meta-analysis n=9,301)
FFR Guided PCI Has
Better Clinical Outcomes !

Impact of FFR Guided PCI,
from AMC Registry
How Much Synergetic ?
Integrated Use of FFR and IVUS

After Routine Use of FFR
(N=2398)
IVUS
Integrated Use of FFR and IVUS (AMC data, n=5097)
Before Routine Use of FFR
(N=2699)
FFR
98.5
81.583.6 83.4
89.8
92.6 97.7 94.3 95.7 94.396.7 96.7 97.5 97.0 96.7
98.0
58.2
0 0 0 0 0 1.1 1.4
13.3
37.5
47.841.7
47.7
53.757.6 57.8
Park SJ, Ahn JM. AMC Registry Data Analysis

Primary End Point(Death, MI, or Repeat Revascularization)
0 60 120 180 240 300 360
0
5
10
15
No. at Risk
Before Routine Use
After Routine Use
2066
2092
2011
2067
1960
2037
2178
2178
HR (95%CI) 0.55 (0.43-0.70),
p<0.001
8.6%
4.8%
Before Routine Use of FFRAfter Routine Use of FFR
Days Since Procedure
Cu
mu
lati
ve In
cid
en
ce,
%
45%
Propensity Score Matched Population

PCI vs. CABG
in Multi-Vessel Disease, 2013
Evolving Concept of PCI ; More Functional Approach,
More Stents Means Just More MACE.
Complete Revascularization is Not Always Necessary.
Consider Reasonable Incomplete Revascularization.
Ischemia Guided PCI is Better.
FFR Guided PCI is Better, Consider Integrated Use of FFR and IVUS.

Impact of FFR
for Multi-Vessel Disease
Tonino et al, JACC 2010;55:2816-2821
3VD
(14%)
2VD (43%)
0VD
(9%)
1VD (34%)
Angiographic3 VD
(n=115)
Only 14% of cases are truly,
functionally significant 3 vessel disease !
How many patients who have
functionally, significant 2-3 vessel disease
requiring surgery in real practice ?
“Totally Different World”
“Different Concept and
Different Clinical Outcomes” !

Patients with
Positive FFR (<0.80), 2-3 Vessel Disease
with or without LM
Primary Endpoint at 2 years:
Death + MI + Repeat R + Stroke
R
PCI + OMT CABG
We Need New Concept of Study, FAME 3

We need absolutely new data,
about the future role of PCI and CABG in
functionally, significant multi-vessel disease
under the concept of functional approach,
integrated use of FFR and IVUS.
The Game Is Just Begun !
PCI vs. CABG
in Multi-Vessel Disease, 2013