PCEC MOS/GDS Development and Other Updates - … · 1 PCEC MOS/GDS Development and Other Updates...
24
1 PCEC MOS/GDS Development and Other Updates NASA Cost Symposium August 23, 2016 Shawn Hayes and Mark Jacobs Victory Solutions MIPSS Team
Transcript of PCEC MOS/GDS Development and Other Updates - … · 1 PCEC MOS/GDS Development and Other Updates...

1
PCEC MOS/GDS Development and Other Updates
NASA Cost SymposiumAugust 23, 2016
Shawn Hayes and Mark JacobsVictory Solutions MIPSS Team

2
PCEC MOS/GDS Development ModelObjective & Approach
Objective: Develop an improved estimating methodology to capture the cost of Mission Operations and Ground Data Systems (MOS/GDS) prior to launch.
Wanted to move away from the traditional “wrap factor” approach typically used when estimating these parts of the NASA WBS
Only covers robotic science spacecraft projects (unmanned)
Approach: Utilized Principal Component Analysis (PCA) in conjunction with multiple regression and constructive approaches (similar to SOCM) to develop CERs

3
PCEC MOS/GDS Development ModelNASA WBS Elements Included
o The PCEC Pre-Launch MOS/GDS Model combines Pre-Launch Mission Operation Systems (MOS) and Pre-Launch Ground Data Systems (GDS) from WBS 7.0 & 9.0.
o An attempt was made to develop CERs for each of the development phases but the data did not support the analysis at this level.
NASA WBS items
included for this effort

4
PCEC CADRe Data NormalizationCurrent Project Data Set
o 42 missions with normalized cost data used for CERs are shown here
o The set covers recent missions and includes representatives from each NASA science discipline
o The normalization process shows the traceability to the official CADRe data All assumptions and changes have
been documented
o The normalized data for each of these missions has been provided to the lead organizations for their review
o GPM, OCO-2, and MMS have also been normalized but not incorporated into the CERs (used for testing/validation)

5
PCEC MOS/GDS Development Model Initial Input Candidates
o Multiple information sources have been reviewed to generate the initial input candidate list: CADRe: Fields in Part B (technical) Cost Models: Space Operations Cost Model (SOCM), PCEC Normalized Data
Library, MOCET Over 150 input candidates were identified for each mission
INPUT CANDIDATES

6
MOS/GDS CER Sausage Maker
PCEC InputsSOCM
Inputs
MOCET Inputs
PCAMultiple
Regression
Constructive Processes
Do the Parameters
Make Sense?
Are the Results Statistically Significant?
Is the CER Viable?
No
Yes

77
PCEC MOS/GDS Development ModelRationale for Planetary/Near-Earth Split
o Initially, a CER was developed using the entire data set which consists of both Planetary and Near Earth missions. The results from this effort resulted in a CER which was useable but not great.
oUltimately, the best results were obtained by splitting the data set into Near Earth and Planetary missions.
oThis split makes sense when you consider the unique aspects of operating in the near Earth environment when compared to deep space operations. Near Earth mission have many options in terms communications networks
(NEN, TDRSS). Planetary missions rely on the Deep Space Network (DSN).Near-Earth missions often employ high-heritage s/c and MOS/GDS elements.
Planetary s/c are typically customized to minimize mass and tailored to their application.

8
PCEC MOS/GDS Development ModelCER Results
• SOCM payload score and level 1 score inputs require a separate calculator in PCEC
• Regression Statistics:
• Equations take the form of:– LN($/mo) = α·LN(Parameter 1) + β·LN(Parameter 2) +……..+ Constant

9
PCEC MOS/GDS Development Model Leveraging of SOCM
o Even with the large input set, reasonable CERs could not be identified
o Several SOCM inputs were added to the candidate input set The Space Operations Cost Model (SOCM) was developed by a team of
operations experts and cost analysts
SOCM Level 1 Overall Score and Payload Score were added; These inputs remained unchanged over the last 2 SOCM updates (2000 & 2004)
Parametric performance statistics significantly improved with the added SOCM Score inputs; The Overall Score supported the Near Earth CER and the Payload Score supported the Planetary CER

10
PCEC MOS/GDS Development ModelSOCM Payload Score
o The SOCM Payload Score requires the user to enter the quantities of instrument types. These values are then weighted to generate the score.
o For Planetary applications, the instrument types are classified as follows:
Heat Probes Point Spectrometers Sample Acquisition Devices
Accelerometers Laser Altimeters Imaging X-Ray Spectrometers
Lightning & Radio Emission Detector Alpha Proton X-Ray Spectrometers Electron Ion Mass Spectrometers
Atmospheric Structures Instr. Radio Experiments Multi-Spectral Imaging Systems
Dust Detectors Radar Altimeters Mapping Spectro. Systems
Magnetometers Gamma Ray Spectrometers Synthetic Aperture Radar
In Situ Mass Spectrometers X-Ray Spectrometers -
11
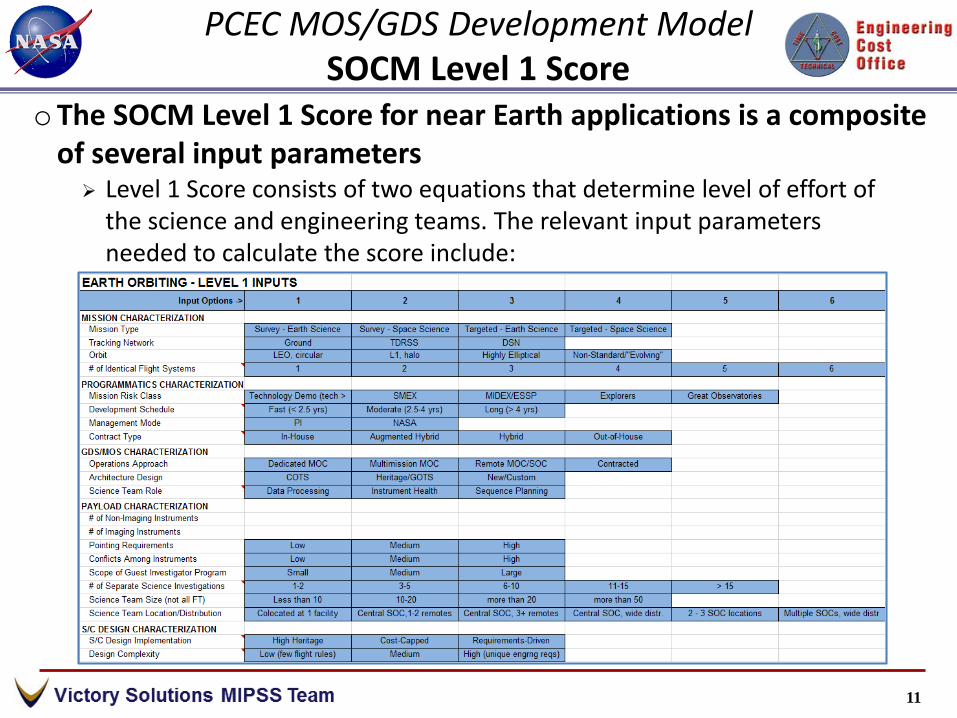
PCEC MOS/GDS Development ModelSOCM Level 1 Score
oThe SOCM Level 1 Score for near Earth applications is a composite of several input parameters Level 1 Score consists of two equations that determine level of effort of
the science and engineering teams. The relevant input parameters needed to calculate the score include:

12
PCEC MOS/GDS Development ModelModeling Performance Comparisons
Mean Error = 6%Mean Abs. Error = 30%Standard Dev. = 36%
Mean Error = 3%Mean Abs. Error = 23%Standard Dev. = 27%

1313
PCEC MOS/GDS Development ModelConstructive Adjustments
o Adjustment factors to apply to the regression-based CER results were explored, but no improvements could be found

14
PCEC MOS/GDS Development ModelDistributions to Development Project Phases
o The database averages are approximate starting points and distributions used should represent the implementation approach Reasonable levels for these functions should
be included in WBS 7/9 based on the scope of the Flight System being examined.
o Phase distributions are also approximate starting points and should be assigned consistent with the implementation approach being modelled

15
MO&DA Preview

16
MO&DA (Phase E) Model PreviewApproach
GOAL: Demonstrate feasibility of deriving Phase E CERs for PCEC Robotic SC leveraging the MOS/GDS Development effort
Preliminary InputsIncludes all items needed to
run SOCM and MOCET
New Input CandidatesDifferent Input Combinations;Data Collection of Add’l Info;
Combination Inputs (SOCM Scores)
PCA
Other Data Analysis Methods
Key Driver Input SetsSupports Regression-based
CERs
Candidate CERsNear Earth Prime Mission;
Planetary – Cruise;Planetary – Encounter
CER Performance
AnalysisAttempt to identify common attributes
to explain error/residuals
NOAcceptable CER Performance?
YES
PCEC CERs

17
MO&DA (Phase E) Model PreviewPreliminary Summary Results
NEAR EARTH
CER Inputs1) SOCM Level 1 Score2) Science Team Size
PLANETARY
CRUISE
Adjusted R^2 = 0.777
CER Inputs1) Annual Encounter Cost
ENCOUNTER, Option 1
CER Inputs1) SOCM Level 1 Score2) # of Operating Modes3) Electric Propulsion (Y/N)
ENCOUNTER, Option 2
Adjusted R^2 = 0.743
CER Inputs1) SOCM Level 1 Score2) # of Operating Modes3) MOC/SOC Lead Org Types

18
MO&DA (Phase E) Model PreviewPlanetary Encounter Error Ranges by Mission
o Multiple CER options have been derived with reasonable statistical performance (adjusted R^>0.7).
o Each option has some common and some different outliers.o There are some combinations of approaches where the error using the
average is significantly improved; however, the validity of this approach is not clear (and under further review)
(Est-Act)Actual
Data compares 4 of the best regression results to date

19
MO&DA (Phase E) Model PreviewFindings & Challenges
o As the analysis was performed it quickly became clear that the data needed to be split into three separate categories Near Earth Operations Planetary Cruise Operations Planetary Encounter Operations
o Several approaches were used to develop CERs for each of the 3 categories Best Near Earth CER was a result of the PCA analysis Best Planetary Cruise CER was developed as a cost to cost CER with Planetary
Encounter A blend of constructive and PCA modeling resulted in the best Planetary Encounter
CERso Some fairly good CERs resulted from the analysis, but there are still are some
fairly significant outliers in each of the setso More work is needed to improve the MO&DA CERs; Planned activities include:
More stringent normalization of the Phase E data Explore alternative approaches to represent Phase E/F requirements Incorporate most current CADRe mission data for Phase E (Juno, MAVEN, etc.)Difficult to accurately capture costs associated with Planetary EDL (cruise for MER is
significantly lower cost than for MSL); Different inputs may be needed to characterize certain mission types

20
Summary
o The current PCEC approach has eliminated need for “wrap factors” across all NASA WBS items except the Science Team
o Use of the SOCM Level 1 scores strongly improved parametric performance for MOS/GDS Development and MO&DA CERs MOS/GDS systems are affected by all Project elements (Mission Design,
S/C, Payload, Programmatics) The SOCM Level 1 score combines inputs characterizing all Project
elements and was developed by an integrated team of operations experts and cost analysts
Prior operations modeling efforts (SOCM) included participation from operations experts; Current approach is attempting to build on the insights from past efforts by statistically correlating identified operations cost drivers to documented costs
o MOS/GDS CERs are ready for use; More effort is needed for the Phase E (MO&DA) CERs

2121
Backup
• Backup
22
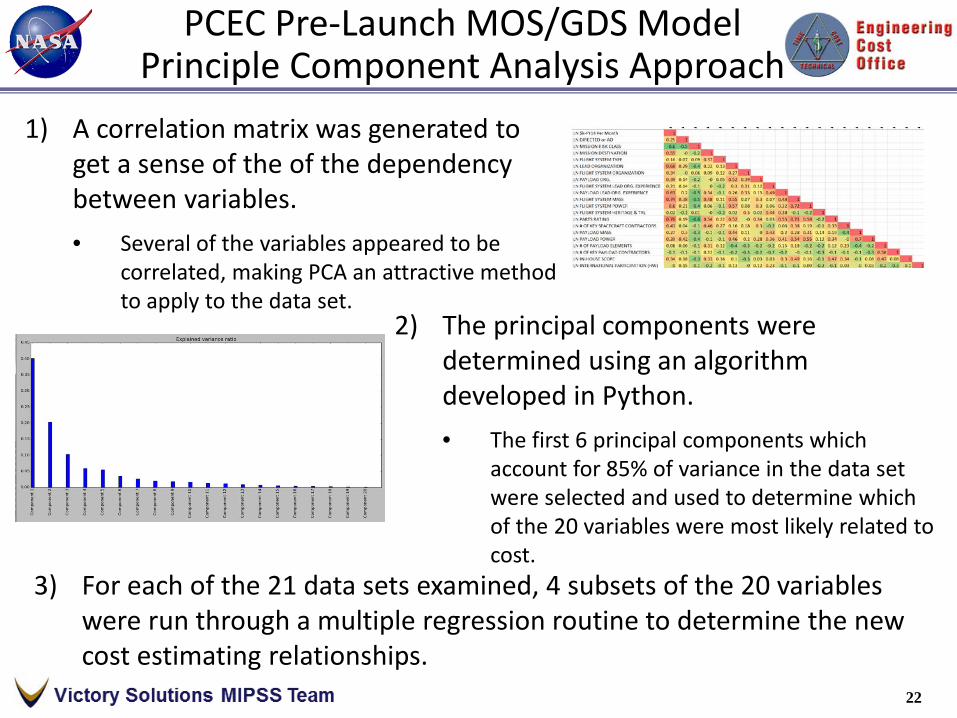
PCEC Pre-Launch MOS/GDS ModelPrinciple Component Analysis Approach
1) A correlation matrix was generated to get a sense of the of the dependency between variables. • Several of the variables appeared to be
correlated, making PCA an attractive method to apply to the data set.
2) The principal components were determined using an algorithm developed in Python. • The first 6 principal components which
account for 85% of variance in the data set were selected and used to determine which of the 20 variables were most likely related to cost.
3) For each of the 21 data sets examined, 4 subsets of the 20 variables were run through a multiple regression routine to determine the new cost estimating relationships.

23
ProcessPCA Results
Run Regression Minimal Model
2424
NASA SPACE MISSIONS MODELLINGLESSONS LEARNED
• Principle Component Analysis (PCA) can help identify a manageable subset of potential costing inputs that are the main contributors to cost differences from a much larger candidate set
• A consistent approach for data normalization is essential; Programmatic differences between the projects can strongly influence official costs
– PCEC normalization adjusts the data to a defined set of rules/procedures
• Do not trust regression results without a thorough sanity check– Often, “associative” instead of “causal” inputs can yield counter-intuitive results (that may
be misdirected); Best approach maximizes utilization of available “causal” inputs– It is important to understand reasons for outliers, which can lead to model enhancements
• A combination of PCA, regression, and constructive modelling approaches appears to offer many benefits over reliance on a single technique
– Enhances flexibility to capture unique aspects associated with NASA robotic science missions– Adjustments to regression results need to be supported by data analysis
• Accuracy of technical and cost data should always be reviewed and questioned – differences often exist in assumptions behind different values for the same item from different sources