PCBs in small fish
45
Elsevier Editorial System(tm) for Chemosphere Manuscript Draft Manuscript Number: Title: Polychlorinated biphenyl spatial patterns in San Francisco Bay forage fish Article Type: Research Paper Section/Cat egory: Persistent Organic Pollutants and Dioxins Keywords: Polychlorinated biphenyl; fish; sediment; principal component analysis; spatial; bioaccumulation Corresponding Author: Mr. Ben K. Greenfield, MS Corresponding Author's Institution: San Francisco Estuary Institute First Author: Ben K. Greenfield, MS Order of Authors: Ben K. Greenfield, MS; Rachel M Allen, ScB
-
Upload
ben-greenfield -
Category
Documents
-
view
226 -
download
0
Transcript of PCBs in small fish

8/3/2019 PCBs in small fish
http://slidepdf.com/reader/full/pcbs-in-small-fish 1/45
Elsevier Editorial System(tm) for ChemosphereManuscript Draft
Manuscript Number:
Title: Polychlorinated biphenyl spatial patterns in San Francisco Bay forage fish
Article Type: Research Paper
Section/Category: Persistent Organic Pollutants and Dioxins
Keywords: Polychlorinated biphenyl; fish; sediment; principal component analysis; spatial;bioaccumulation
Corresponding Author: Mr. Ben K. Greenfield, MS
Corresponding Author's Institution: San Francisco Estuary Institute
First Author: Ben K. Greenfield, MS
Order of Authors: Ben K. Greenfield, MS; Rachel M Allen, ScB
8/3/2019 PCBs in small fish
http://slidepdf.com/reader/full/pcbs-in-small-fish 2/45
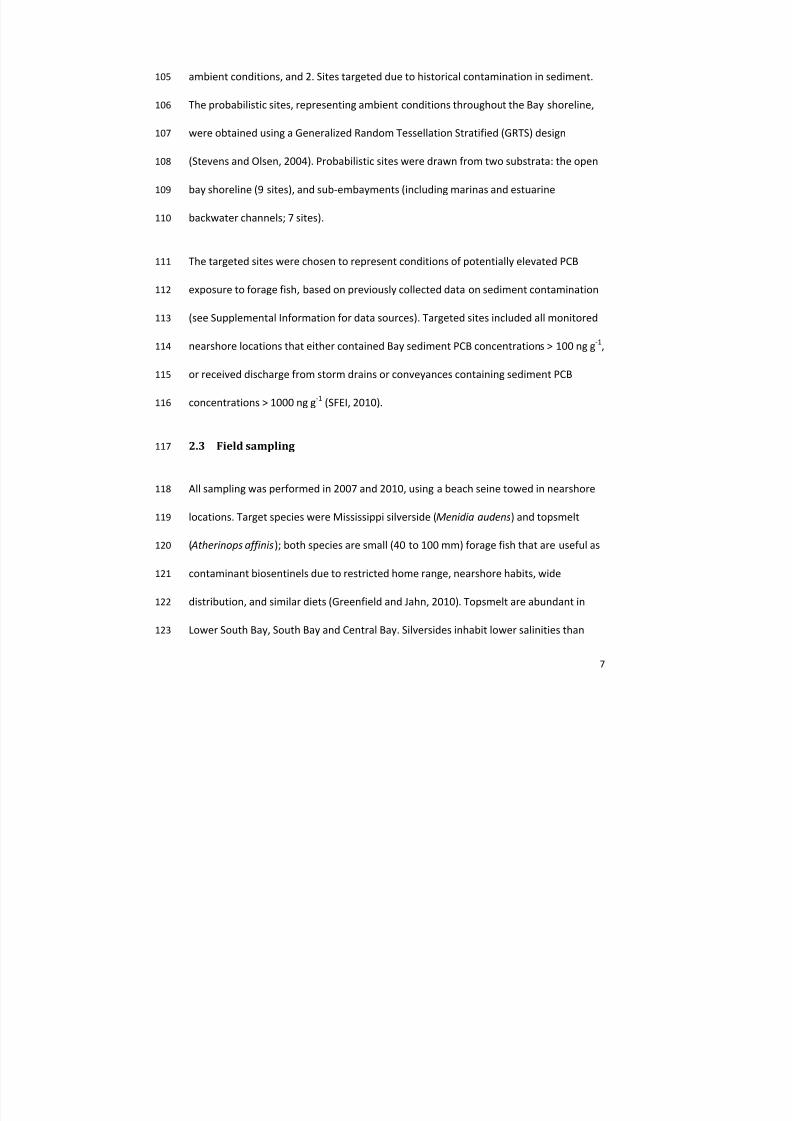
Environmental Health Sciences DivisionSchool of Public HealthUniversity of California, Berkeley50 University Hall #7360Berkeley, CA 94720-7360
Tel: 1 510 507 2365E-mail: [email protected]
Gang YuEditor – Persistent Organic Pollutants and DioxinsChemosphereEmail: [email protected]
January 5, 2012
Dear Dr. Yu:
Enclosed for your consideration is a manuscript entitled “ Polychlorinatedbiphenyl spatial patterns in San Francisco Bay forage fish, ” by Ben K. Greenfield andRachel M. Allen. We submit this manuscript for possible publication in Chemosphere .
The study reports on PCB concentrations in two forage fish species in SanFrancisco Bay. The study focuses on estuarine forage fish, for which development of PCB biosentinel monitoring tools has received relatively limited study. Data indicatedpronounced spatial patterns in exposure and congener patterns, with the highest tissuePCB concentrations and distinct congener patterns found at industrial sites. These resultssuggest elevated exposure to local biota at multiple contaminated sites within this
urbanized estuary.Because of the value and limited availability of PCB data in estuarine forage fish,
we include a supplemental data section. The Supplement contains the forage fish PCBand ancillary parameter data set, as well as exact spatial locations of all sampling stations.
These findings have not been published and this manuscript is not beingconsidered for publication elsewhere. Preliminary findings were reported at the postersession in North America SETAC (2011). Potential reviewers include Peter Green, KeithMaruya, Marc Fernandez, Adria Elskus, Jeffrey Ashley, Shian-Chee Wu, StéphaneBayen, Bi-Xian Mai, and any others you might consider appropriate.
Thank you for considering this manuscript.
Sincerely,
Ben GreenfieldCorresponding Author
r Letter

8/3/2019 PCBs in small fish
http://slidepdf.com/reader/full/pcbs-in-small-fish 3/45
Estuarine forage fish are useful biosentinels of site-specific PCB contamination Contaminated industrial sites have elevated tissue PCB concentrations A north-south spatial gradient was related to urbanization
Tissue concentrations correlated with colocated sediment concentrations Congener profiles at some industrial sites indicated local Aroclor 1248 exposure
hlights

8/3/2019 PCBs in small fish
http://slidepdf.com/reader/full/pcbs-in-small-fish 4/45
1
1
Polychlorinated biphenyl spatial patterns in San Francisco Bay forage fish2
3
Ben K. Greenfield a, b and Rachel M. Allen a 4
5
a. San Francisco Estuary Institute, 4911 Central Ave., Richmond, CA 948046
b. Present Address: Environmental Health Sciences Division, School of Public Health,7
University of California, Berkeley, 50 University Hall #7360, Berkeley, CA 94720-73608
Tel: 1 510 507 2365 E-mail: [email protected]
10
11
nuscripthere to view linked References

8/3/2019 PCBs in small fish
http://slidepdf.com/reader/full/pcbs-in-small-fish 5/45
2
Abstract 12
Industrialized waterways frequently contain nearshore hotspots of legacy13
polychlorinated biphenyl (PCB) contamination, with uncertain contribution to aquatic14
food web contamination. We evaluated the utility of estuarine forage fish as biosentinel15
indicators of local PCB contamination across multiple nearshore sites in San Francisco16
Bay. Topsmelt ( Atherinops affinis ) or Mississippi silverside ( Menidia audens )17
contamination was compared between 12 targeted sites near historically polluted18
locations and 17 probabilistically chosen sites. The average sum of 209 PCB congeners in19
fish from targeted stations (441 ± 432 ng g -1 wet weight, mean ± SD) was significantly20
higher than probabilistic stations (138 ± 94 ng g -1). At probabilistic stations,21
concentrations in topsmelt (185 ± 82 ng g -1) were higher than silverside (90 ± 82 ng g -1),22
likely due to habitat differences and elevated lipid content in topsmelt. Concentrations23
in both species were comparable to those of high lipid sport fish in the Bay, and strongly24
correlated with spatial patterns in sediment contamination. The highest concentrations25
were from targeted Central Bay locations, including Hunter’s Point Naval Shipyard ( 134726
ng g -1; topsmelt) and Stege Marsh (1337 ng g -1; silverside). Targeted sites exhibited27
increased abundance of lower chlorinated congeners, suggesting local source28
contributions, including Aroclor 1248. These findings indicate that current spatial29
patterns in PCB bioaccumulation correlate with historical sediment contamination due30

8/3/2019 PCBs in small fish
http://slidepdf.com/reader/full/pcbs-in-small-fish 6/45
3
to industrial activity. They also demonstrate the utility of naturally occurring forage fish31
as biosentinels of localized PCB exposure.32
Keywords: Polychlorinated biphenyl; fish; sediment; principal component analysis;33
spatial; bioaccumulation34
1 Introduction35
Polychlorinated biphenyls (PCBs) were produced and used in industrial applications36
from the 1930s until their ban in 1979. Elevated PCB concentrations in aquatic animals37
were first noted in the 1960s (Jensen et al., 1969) , and continue to the present. PCBs are38
environmentally persistent and bioaccumulative endocrine disrupting compounds that39
pose health risks to humans and wildlife (Diamanti-Kandarakis et al., 2009) . Sport fish40
contamination by total PCBs and PCBs with dioxin-like properties poses elevated risk of 41
carcinogenic effects to humans in multiple US water bodies (Connor et al., 2005; Huang42
et al., 2006; Weis and Ashley, 2007; Stahl et al., 2009) . As a result, management43
activities to reduce the impacts of PCBs include fish consumption advisories and44
attempts to reduce PCB mass and bioavailability in contaminated areas (Cho et al., 1999; 45
U.S. EPA, 2000; Gustavson et al., 2008) .46
Given the concern regarding human health impacts, many studies have quantified PCBs47
in sport fish used for human consumption (Rasmussen et al., 1990; Lamon and Stow,48

8/3/2019 PCBs in small fish
http://slidepdf.com/reader/full/pcbs-in-small-fish 7/45
4
1999; Davis et al., 2002; Fernandez et al., 2004; Greenfield et al., 2005; Huang et al.,49
2006; Parnell et al., 2008; Stahl et al., 2009) . However, sport fish have limited utility for50
resolving contaminant spatial patterns within water bodies, because they often have51
large foraging ranges. Small fish consumed by piscivorous wildlife (i.e., forage fish) have52
been occasionally monitored for PCBs (Monosson et al., 2003; Pulster et al., 2005; Jarvis53
et al., 2008; Brar et al., 2010) . Forage fish have been useful indicators of spatial patterns54
in mercury bioaccumulation within a water body (Suchanek et al., 2008; Greenfield and55
Jahn, 2010) . Because forage fish are small and have limited home ranges, they may be56
particularly useful for discerning spatial patterns in food web exposure to PCBs and57
other industrial pollutants.58
Concentrations of PCBs, and toxicological impairment have been found to be highest in59
fish and invertebrates collected from industrial regions (Rasmussen et al., 1990; Myers60
et al., 1998; Johnson et al., 1999; Bayen et al., 2003; Wu et al., 2008; Brar et al., 2010) ,61
suggesting an association between historic production, use, and disposal of PCBs in62
adjacent industrial facilities, and biota exposure. Congener profile patterns have also63
been demonstrated to vary, with fish from contaminated locations often exhibiting64
elevated abundance of lower chlorinated congeners (Ashley et al., 2000; Barron et al.,65
2000; Fernandez et al., 2004) , or higher chlorinated congeners (Pulster et al., 2005; 66
Grant et al., 2011) , depending on local production and use patterns.67

8/3/2019 PCBs in small fish
http://slidepdf.com/reader/full/pcbs-in-small-fish 8/45
5
In large river and coastal systems, broad spatial gradients of biota PCB concentrations68
have been observed, with concentrations declining with increasing distance from69
historic production facilities (Barron et al., 2000; Fernandez et al., 2004) . Fewer studies70
have examined spatial patterns within smaller water bodies, such as urbanized71
estuaries. These water bodies often have multiple potential sources, including72
numerous shoreline locations having a history of PCB use and contamination.73
Consequently, sediment PCB concentrations and congener profiles indicate local74
contamination of industrial areas, such as urbanized harbors (Ashley and Baker, 1999; 75
Fu and Wu, 2006; Davis et al., 2007; Grant et al., 2011) . The extent to which76
contamination at these nearshore sites enters the local aquatic food web is often77
unclear. If forage fish from industrially contaminated locations exhibit elevated78
concentrations, this would indicate food web exposure and validate the extensive79
remediation efforts underway (Cho et al., 1999; Gustavson et al., 2008) .80
We determined PCB congener concentrations in forage fish samples collected from 3581
locations in San Francisco Bay (CA, USA), an urbanized estuary. Our study included two82
strata: sites with elevated PCBs in sediments due to historic industrial activity, and83
randomly selected sites. The study addressed four questions: 1. What are the PCB84
concentrations and spatial patterns in San Francisco Bay forage fish? 2. Do forage fish85
concentrations vary between random sites and industrial sites? 3. How do forage fish86

8/3/2019 PCBs in small fish
http://slidepdf.com/reader/full/pcbs-in-small-fish 9/45
6
PCB concentrations correlate with co-located sediment PCB concentrations? and 4. How87
do congener profile patterns vary among sites?88
2 Methods89
2.1 Study area90
The land and water use history of San Francisco Bay is representative of industrialization91
that occurred in many densely populated estuaries. PCBs were employed in many92
applications and processes sited along the San Francisco Bay margins (Davis et al.,93
2007) . Accordingly, parts of the Bay margins are contaminated (Hunt et al., 1998; Hwang94
et al., 2006) , with several locations listed by the US Superfund cleanup program for PCBs95
and other pollutants (Battelle et al., 2005; Davis et al., 2007) . Although sediment96
contamination and toxicity have been monitored in these locations, their contribution97
to local biota contaminant exposure has not previously been evaluated.98
2.2 Site selection99
In 2007, six stations were sampled as part of a pilot study: Alviso Slough, Newark Slough,100
Steinberger Slough, Candlestick Point, Point Isabel, and Benicia State Park. These101
stations were chosen to represent the different Bay sub-embayments, focusing on sites102
significant for piscivorous wildlife and habitat management (Greenfield and Jahn, 2010) .103
In 2010, 29 sites were sampled from two strata: 1. A probabilistic survey to reflect104
8/3/2019 PCBs in small fish
http://slidepdf.com/reader/full/pcbs-in-small-fish 10/45
7
ambient conditions, and 2. Sites targeted due to historical contamination in sediment.105
The probabilistic sites, representing ambient conditions throughout the Bay shoreline,106
were obtained using a Generalized Random Tessellation Stratified (GRTS) design107
(Stevens and Olsen, 2004) . Probabilistic sites were drawn from two substrata: the open108
bay shoreline (9 sites), and sub-embayments (including marinas and estuarine109
backwater channels; 7 sites).110
The targeted sites were chosen to represent conditions of potentially elevated PCB111
exposure to forage fish, based on previously collected data on sediment contamination112
(see Supplemental Information for data sources). Targeted sites included all monitored113
nearshore locations that either contained Bay sediment PCB concentrations > 100 ng g -1,114
or received discharge from storm drains or conveyances containing sediment PCB115
concentrations > 1000 ng g -1 (SFEI, 2010).116
2.3 Field sampling117
All sampling was performed in 2007 and 2010, using a beach seine towed in nearshore118
locations. Target species were Mississippi silverside ( Menidia audens ) and topsmelt119
( Atherinops affinis ); both species are small (40 to 100 mm) forage fish that are useful as120
contaminant biosentinels due to restricted home range, nearshore habits, wide121
distribution, and similar diets (Greenfield and Jahn, 2010) . Topsmelt are abundant in122
Lower South Bay, South Bay and Central Bay. Silversides inhabit lower salinities than123

8/3/2019 PCBs in small fish
http://slidepdf.com/reader/full/pcbs-in-small-fish 11/45
8
topsmelt, and are abundant in sub-embayments of Lower South Bay, San Pablo Bay, and124
Suisun Bay, as well as sites where freshwater drainages meet the Bay.125
Separate composite samples of topsmelt were collected from six sites between126
September 24 and October 9, 2007. Between September 22 and November 10 of 2010,127
Alviso Slough was resampled, and 28 new sites were sampled, including 15 probabilistic128
sites, and 13 targeted sites, with a total of 31 composite samples collected at 29129
different sites. Based on species occurrence, silverside were collected and analyzed at130
14 sites, and topsmelt at 17 sites. Both species were sampled at Alviso Slough as well as131
at the targeted site in San Rafael channel.132
Samples were analyzed as homogenized composites, with target fish total lengths of 60133
to 100 mm for topsmelt and 40 to 80 mm for silverside. Topsmelt samples ranged from134
8 to 16 individuals per composite (mean = 11), with mean fish length of 90 ± 5 mm135
(mean ± SD) in 2007 and 77 ± 8 mm in 2010. Silverside samples ranged from 13 to 38136
individuals per composite (mean = 23), with average fish length of 61 ± 5 mm.137
2.4 Laboratory analysis and quality assurance138
In 2007, samples were analyzed for 40 separately resolved PCB congeners. Samples139
collected in 2010 were analyzed for all 209 congeners ( Σ209 congeners). This included140
the 40 PCB congeners ( Σ40 congeners) routinely analyzed in tissue samples by the141
Regional Monitoring Program for Water Quality in San Francisco Bay (RMP): PCBs 8, 18,142

8/3/2019 PCBs in small fish
http://slidepdf.com/reader/full/pcbs-in-small-fish 12/45
9
28, 31, 33, 44, 49, 52, 56, 60, 66, 70, 74, 87, 95, 97, 99, 101, 105, 110, 118, 128, 132,143
138, 141, 149, 151, 153, 156, 158, 170, 174, 177, 180, 183, 187, 194, 195, 201, and 203.144
In 2007, 36 of the Σ40 congeners were determined (excluding PCBs 44, 128, 132, and145
151).146
Samples were spiked with 13C labeled surrogate standards, dried with sodium sulphate,147
Soxhlet extracted with dichloromethane, and analyzed for PCBs using U.S. EPA Method148
1668A. All analyses were performed by isotope dilution high resolution gas149
chromatography/high resolution mass spectrometry, by AXYS Analytical Services150
(Sidney, BC, Canada). In Method 1668A, 126 congeners are resolved as separate151
chromatographic peaks and the remaining 83 PCB congeners coelute in groups of two to152
six congeners (U.S. EPA, 2003) . Lipid content was determined by gravimetric analysis,153
with dichloromethane as the extraction solvent (U.S. EPA, 2000) . QA samples included154
three procedural blanks, three laboratory spiked reference material samples, three155
Certified Reference Material (CRM, NIST 1946) samples, three duplicates, and two156
matrix spikes (MS). Supplemental Information contains a QA results summary.157
2.5 Comparison to sediment PCBs158
To determine association with legacy sediment contamination, fish PCB concentrations159
were regressed against total PCBs in sediments, using previously published data (Barnett160
et al., 2008; SFEI, 2010). The Supplemental Information provides further details on the161

8/3/2019 PCBs in small fish
http://slidepdf.com/reader/full/pcbs-in-small-fish 13/45
10
sediment data used in the regressions. For these comparisons, the RMP Σ40 PCB162
congeners were used to enable inclusion of both 2007 and 2010 tissue data. Given that163
fish and sediment data were not colocated, the average sediment concentration was164
determined within a 4 km radius of each fish collection location, and the results were165
regressed against fish tissue concentrations (Melwani et al., 2009) . There were 31 fish166
locations having between 1 and 76 sediment samples within a 4 km radius (average 21.5167
sediment samples per location).168
2.6 Data analysis169
All statistical analyses were performed in R version 2.13 (R Development Core Team,170
2011) . Σ40 and Σ209 PCB congeners were determined for each sample using Kaplan-171
Meier estimation for summary statistics in the presence of censored data (Helsel, 2010) .172
Dioxin-like potency was calculated for the planar PCBs (77, 81, 105, 114, 118, 123, 126,173
156, 157, 167, 169, and 189) using the WHO 2005 revised mammalian toxic equivalency174
factors for dioxin-like compounds (Van den Berg et al., 2006) .175
For all statistical analyses, PCBs were natural log transformed to achieve normality and176
variance homoscedasticity of the residuals. The R linear model procedure was177
performed on 2010 data to evaluate the potential effects of site type (targeted versus178
random), species, tissue lipid percentage, and distance from Guadalupe River on Σ209179
PCB congeners. Distance from Guadalupe River is the aquatic surface distance (in river180

8/3/2019 PCBs in small fish
http://slidepdf.com/reader/full/pcbs-in-small-fish 14/45
11
km) from a primary tributary located at the southern extent of the Lower South Bay. The181
Lower South Bay has elevated concentrations of many contaminants due to high182
watershed development and lower Bay flushing rate (Conaway et al., 2003; Oros et al.,183
2005; Davis et al., 2007) . Distance from the Guadalupe River primarily serves as a184
quantitative proxy for broad spatial variation in the Bay, more accurate than latitude185
because it accounts for the half-moon shape of the Bay.186
Models were evaluated using an information theoretic approach, in which the relative187
goodness of fit of multiple models was compared, and models that simply and188
effectively explained variability in Σ209 PCBs were selected (Burnham and Anderson,189
2002) . Potential models were linear models including all possible combinations of the190
four parameters: site type, species, lipid, and distance from the Guadalupe River.191
Additionally, an interaction term for site type versus species was considered to evaluate192
species dependence of difference between targeted versus probabilistic sites. Model193
evaluation was performed based upon the AICc (Akaike information criterion with bias194
adjustment for small sample sizes). The model with the minimum AICc is considered the195
best model, based on a combination of fit to the observed data and model parsimony196
(i.e., minimum number of model parameters). Model comparison was aided with the197
ΔAICc (ΔAICci = AICci – minimum AICc of all models), with models having ΔAICc < 2.0198
being considered comparable; and the Akaike weight (w i = exp[- ΔAICci/2+/Σ exp*-199
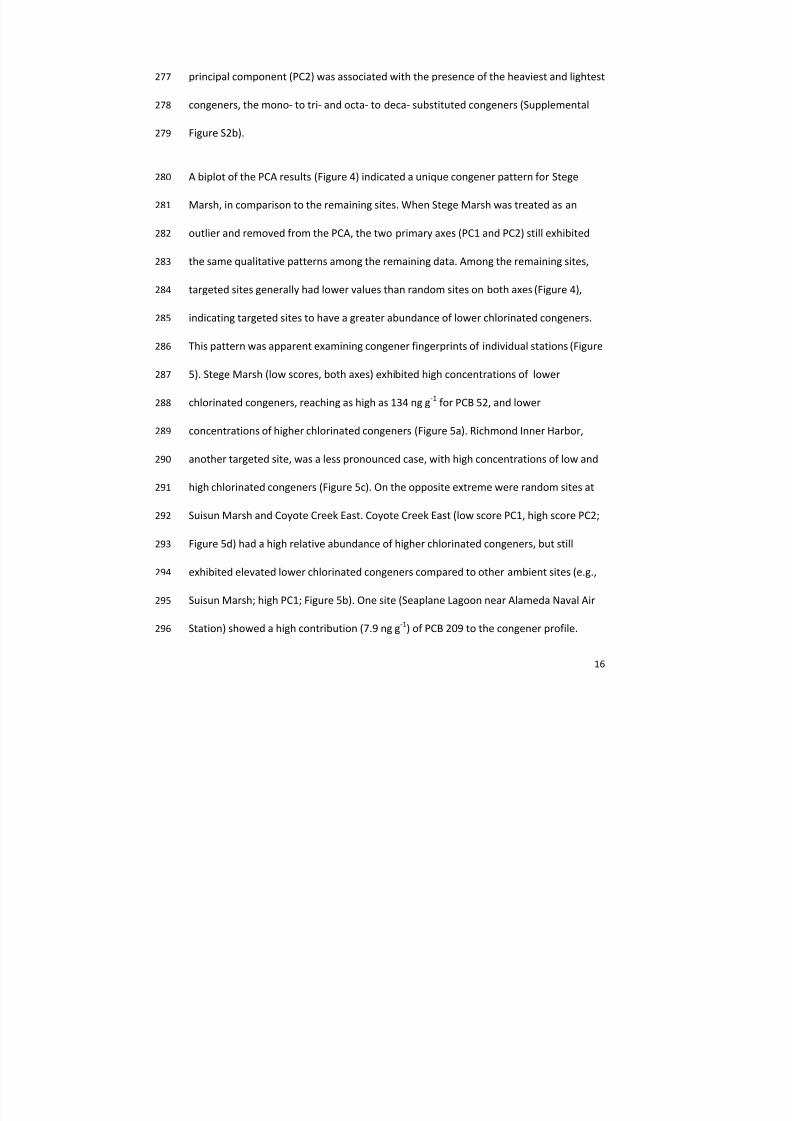
ΔAICci/2]) to determine degree of confidence that the selected model was the best200

8/3/2019 PCBs in small fish
http://slidepdf.com/reader/full/pcbs-in-small-fish 15/45
12
model. Variable weights (i.e., relative importance of variables) were obtained by201
summing Akaike weights across models that incorporated the same variable. For all202
linear models, adjusted R 2 was reported to indicate the extent of variability explained.203
Principal component analysis (PCA) was performed on the concentrations of individual204
congeners from the 2010 samples to help evaluate variation in congener patterns across205
sites. For each site, the congener concentrations were normalized to the Σ209 PCBs to206
eliminate the effect of total concentration on the first principal component. The207
statistical analysis was performed on the log-transformed relative abundances of each208
congener. The PCA was performed on 131 unique congener values. The Supplemental209
Information describes congener inclusion criteria in the PCA.210
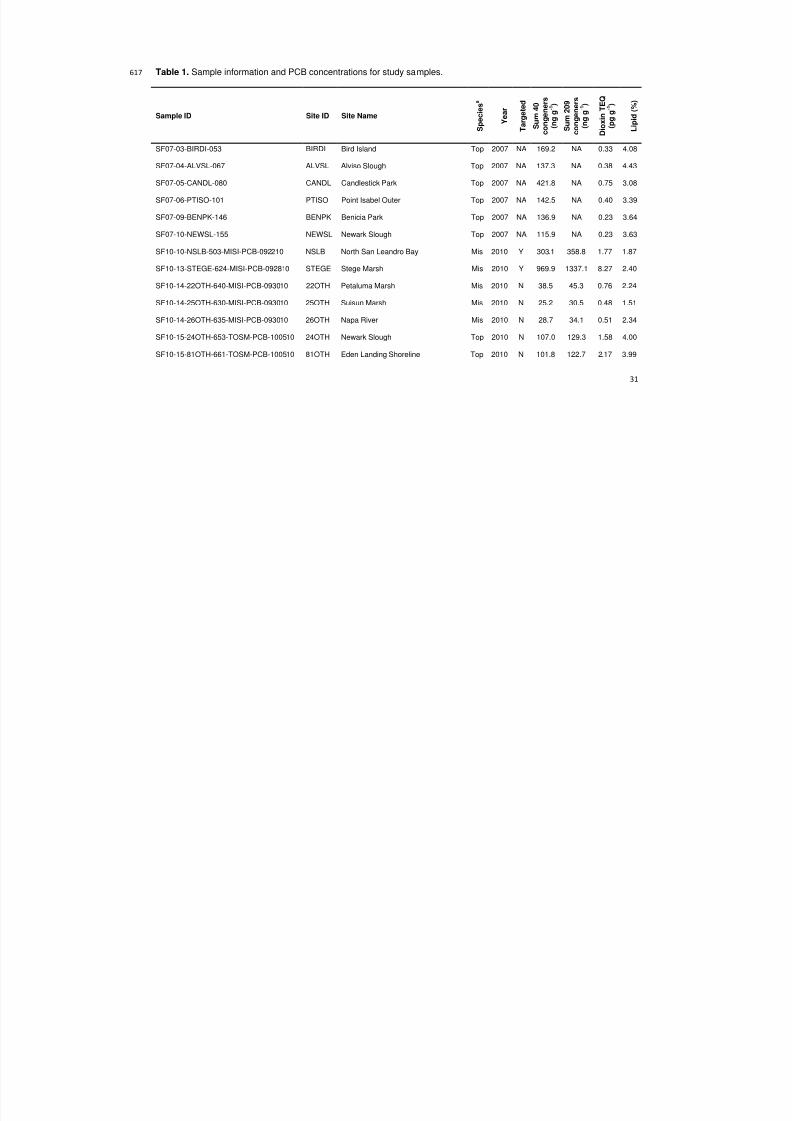
3 Results211
In 2007, six topsmelt samples were analyzed from six stations. In 2010, 14 silverside and212
17 topsmelt samples were analyzed from 29 stations (Table 1 ). Lipid content of 213
silversides (2.5 ± 0.9%, mean ± SD) was lower than topsmelt in 2007 (3.7 ± 0.5) and 2010214
(3.6 ± 0.6).215
Topsmelt from 2007 exhibited an average sum of ( Σ) 40 PCB congeners of 187 ± 116 ng216
g-1. All individual station measurements were within 95% CI of the mean except for PCBs217
at Candlestick Point (422 ng g -1). Concentrations in the 31 fish samples analyzed in 2010218

8/3/2019 PCBs in small fish
http://slidepdf.com/reader/full/pcbs-in-small-fish 16/45
13
averaged 216 ± 253 ng g -1 for Σ40 PCB congeners, 265 ± 321 for Σ209 PCB congeners,219
and 3.5 ± 3.2 pg g -1 dioxin TEQ for the 12 congeners with dioxin-like potency. All field220
and analytical results are provided in Supplemental Data Files SDat1PCBs.csv and221
SDat2Samples.csv.222
Concentrations ( Σ209 PCB congeners) in 2010 were lognormally distributed, with 24 of 223
31 samples below 200 ng g -1, and two samples above 1300 ng g -1 (Table 1 ). The four224
highest concentrations were all from targeted stations: South Basin of Hunters Point225
(topsmelt, 1347 ng g-1
), Stege Marsh (silverside, 1337 ng g-1
), Oakland Inner Harbor226
(topsmelt, 700 ng g -1), and Richmond Inner Harbor (topsmelt, 415 ng g -1). The seven227
lowest concentrations, ranging between 31 and 57 ng g -1, were all San Pablo Bay and228
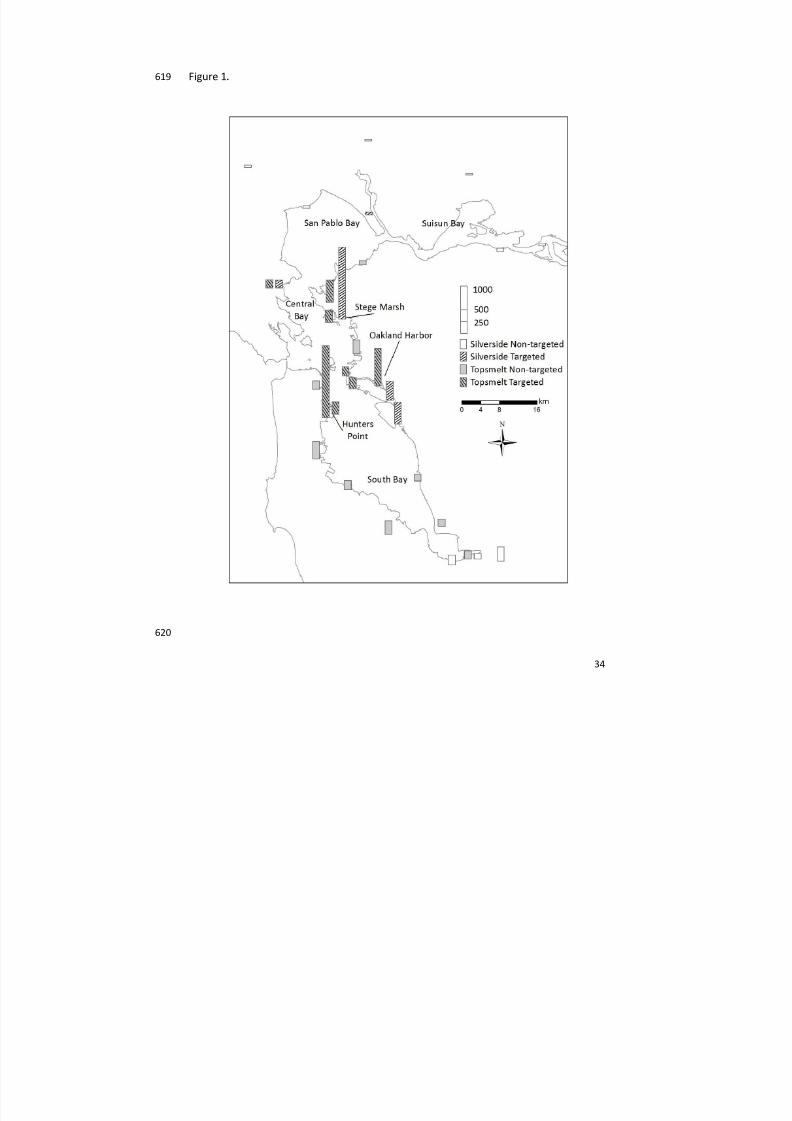
Suisun Bay silversides (Table 1 , Figure 1) . PCBs ranged 44-fold between the lowest (31229
ng g -1) and highest (1347 ng g -1) sites.230
The relationship between Σ40 congeners and Σ209 congeners was examined using a231
regression between the Σ40 congeners and the sum of the remaining 169 congeners.232
Regression analysis indicated a highly significant log-log relationship (p < 0.0001; R 2 =233
0.98; Supplemental Figure S1); however, the Stege Marsh silverside sample was an234
influential positive outlier and was consequently removed to obtain an unbiased fit (R 2 =235
0.99). The final model to predict Σ209 congeners from Σ40 congeners is:236
Σ209 congeners = ( Σ40 congeners) -1.643 + exp[ - 1.6431 + 1.0064*ln( Σ40 congeners)]237

8/3/2019 PCBs in small fish
http://slidepdf.com/reader/full/pcbs-in-small-fish 17/45
14
3.1 Predictors of fish PCBs238
In 2010, the historically contaminated targeted locations had elevated fish PCB239
concentrations, compared to the probabilistic ambient locations (Figure 2) . Average240
Σ209 PCB congeners in fish from targeted stations (441 ± 432 ng g -1) was 3.2 times than241
at probabilistic stations (138 ± 94 ng g -1). Average concentrations in topsmelt (301 ± 306242
ng g -1) were higher than silverside (222 ± 344 ng g -1) for all stations, and particularly for243
probabilistic stations (185 ± 82 versus 90 ± 82 ng g -1; Figure 2) . For all samples,244
concentrations decreased with distance from the Guadalupe River (Pearson’s r = -0.47)245
and increased slightly with increased lipid (r = 0.36).246
Based on AICc, ΔAIC, and Akaike weight, the most parsimonious model explaining fish247
PCBs in 2010 included site type (targeted versus random) and distance from the248
Guadalupe River (Supplemental Information Table S1). A model including species, site249
type, and distance from the Guada lupe River, was also reasonably likely (ΔAIC ≤ 2.0).250
The next most likely model (ΔAIC = 2.1) included site type, species, and lipid . Using251
evidence ratios (i.e., quotient of the Akaike weights), the best model with site type and252
distance from Guadalupe River was 1.6 times more likely than the next best model that253
also included species, and 2.9 times more likely than the third best model, including site254
type, lipid, and distance from the Guadalupe River. Based on variable weight (the sum of 255
all Akaike weights for each model term), there was very strong supporting evidence for256
site type (variable weight = 1.00) and distance from Guadalupe River (variable weight =257

8/3/2019 PCBs in small fish
http://slidepdf.com/reader/full/pcbs-in-small-fish 18/45
15
0.98), and weak support for species (0.36) and lipid (0.24). Overall, concentrations were258
higher at the sites located towards the Central Bay and South Bay. Concentrations were259
relatively low in samples collected from San Pablo Bay and Suisun Bay, including the260
Mare Island targeted site collected northeast of San Pablo Bay (Figure 1) .261
Fish and sediment PCB concentrations were positively related (R 2 = 0.51, N = 34; Figure262
3), with a ΔAICcof 37.0 compared to the null model. The linear model to predict fish263
from sediment Σ40 congeners was: fish PCBs = exp[3.4571 + 0.5862*ln(Sediment264
PCBs)]. Examining species individually, the relationship was stronger for topsmelt (R 2 =265
0.71, ΔAICcvs. null = 26.8, N = 23) than silverside (R 2 = 0.27, ΔAICc= 9.7, N = 11).266
3.2 PCB congener patterns267
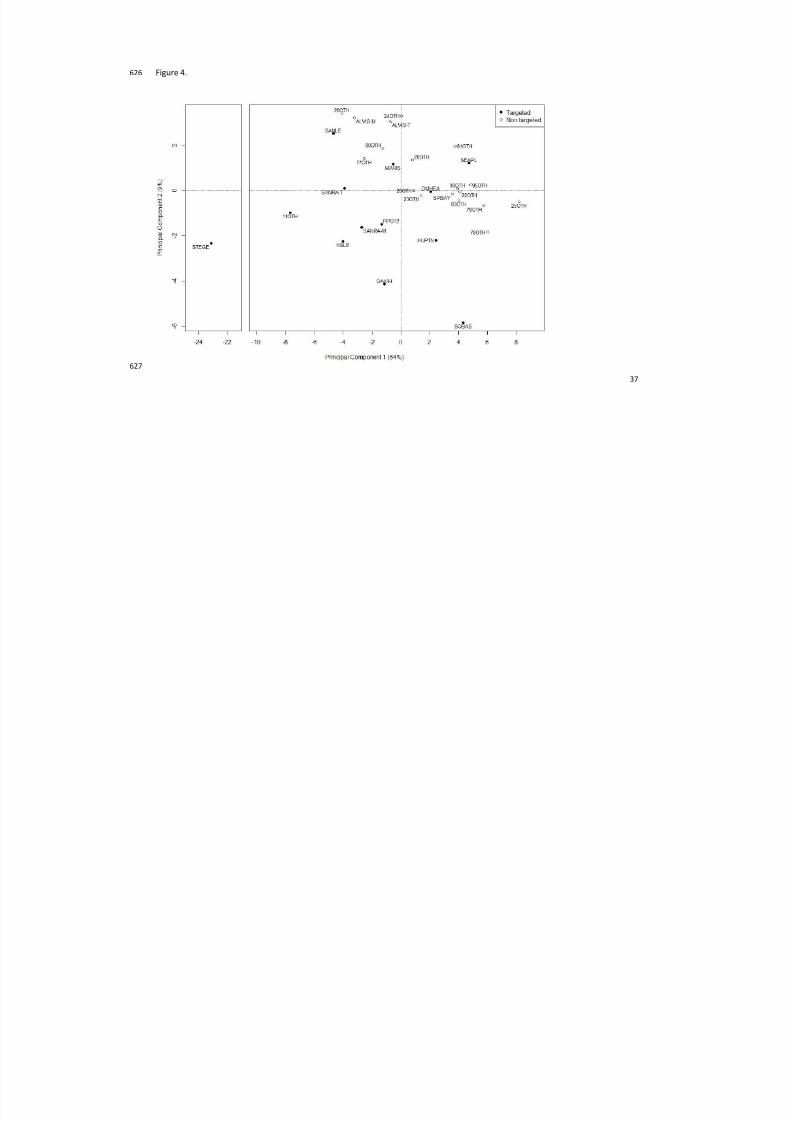
In principal component analysis (PCA), the first two principal components accounted for268
64 and 9% of the variation between sites, respectively. Examining the relative269
contributions of each congener to the principal component axes (the eigenvectors,270
Supplemental Figure S2), the heavier congeners generally contributed positively to the271
first principal component (PC1) axis, while the lighter congeners contributed negatively272
(Supplemental Figure S2a). PC1 was significantly correlated with the ratio of the sum of 273
the light congeners (mono- to tetra- substituted) to the sum of the heavy congeners274
(penta- to deca- substituted) (p < 0.001, adjusted R 2 = 0.63), indicating that samples with275
lower PC1 scores had a higher contribution of less chlorinated congeners. The second276
8/3/2019 PCBs in small fish
http://slidepdf.com/reader/full/pcbs-in-small-fish 19/45
16
principal component (PC2) was associated with the presence of the heaviest and lightest277
congeners, the mono- to tri- and octa- to deca- substituted congeners (Supplemental278
Figure S2b).279
A biplot of the PCA results (Figure 4) indicated a unique congener pattern for Stege280
Marsh, in comparison to the remaining sites. When Stege Marsh was treated as an281
outlier and removed from the PCA, the two primary axes (PC1 and PC2) still exhibited282
the same qualitative patterns among the remaining data. Among the remaining sites,283
targeted sites generally had lower values than random sites on both axes (Figure 4) ,284
indicating targeted sites to have a greater abundance of lower chlorinated congeners.285
This pattern was apparent examining congener fingerprints of individual stations (Figure286
5). Stege Marsh (low scores, both axes) exhibited high concentrations of lower287
chlorinated congeners, reaching as high as 134 ng g -1 for PCB 52, and lower288
concentrations of higher chlorinated congeners (Figure 5a ). Richmond Inner Harbor,289
another targeted site, was a less pronounced case, with high concentrations of low and290
high chlorinated congeners (Figure 5c ). On the opposite extreme were random sites at291
Suisun Marsh and Coyote Creek East. Coyote Creek East (low score PC1, high score PC2;292
Figure 5 d) had a high relative abundance of higher chlorinated congeners, but still293
exhibited elevated lower chlorinated congeners compared to other ambient sites (e.g.,294
Suisun Marsh; high PC1; Figure 5 b). One site (Seaplane Lagoon near Alameda Naval Air295
Station) showed a high contribution (7.9 ng g -1) of PCB 209 to the congener profile.296

8/3/2019 PCBs in small fish
http://slidepdf.com/reader/full/pcbs-in-small-fish 20/45
17
4 Discussion297
4.1 Silversides and topsmelt as PCB biosentinels298
PCB concentrations in randomly sampled San Francisco Bay forage fish (silversides and299
topsmelt) were similar to or higher than concentrations in the most contaminated San300
Francisco Bay sport fish. The average Σ40 PCB concentration in topsmelt and silverside301
from probabilistic stations in 2010 (115 ng g -1) was similar to average 2009302
concentrations in shiner perch ( Cymatogaster aggregata ; 121 ng g -1; whole body minus303
tail, head, and digestive tract), white croaker ( Genyonemus lineatus ; 144 ng g -1; skin-on304
fillet), and Northern anchovy ( Genyonemus lineatus ; 118 ng g -1; skin-on fillet), and five305
to twelve times higher than five additional sport fish species (Davis et al., 2011) . The306
average topsmelt and silverside Σ40 PCB concentration from targeted stations (357 ng307
g-1) was substantially higher than all sport fish. The highest Σ40 PCB concentration308
measured (1132 ng g -1 at South Basin Hunters Point) was 40 to 100 times the average309
concentrations of large predatory sport fish, including striped bass ( Morone saxatilis , 30310
ng g -1), California halibut ( Paralichthys californicus , 18 ng g -1), and white sturgeon311
( Acipenser transmontanus , 11 ng g -1) (Davis et al., 2011) . These findings indicate that312
large body size and high trophic position are not positively associated with increased313
PCB contamination in San Francisco Bay fish.314
8/3/2019 PCBs in small fish
http://slidepdf.com/reader/full/pcbs-in-small-fish 21/45
18
The high tissue concentrations at industrial sites, and the strong correlation between315
tissue and sediment contamination, suggest that forage fish had high concentrations316
due to their relatively small home ranges and proximity to contaminated sediments and317
historic sources (Melwani et al., 2009) . Sediment contamination strongly correlated with318
forage fish concentrations in this study, and spatial variation among sites was much319
more pronounced for small fish than the variation observed for sport fish (Davis et al.,320
2002; Davis et al., 2011) . The elevated concentrations in topsmelt and silverside may321
also be partially attributable their moderately high lipid contents, as lipid affects322
bioaccumulation of hydrophobic contaminants, including PCBs (Kidd et al., 1998; Jarvis323
et al., 2008) .324
Previous research has supported the use of Mississippi silverside and topsmelt as325
biosentinels for spatial and temporal patterns in mercury contamination (Suchanek et326
al., 2008; Greenfield and Jahn, 2010) . Our results supported the general utility of these327
species as biosentinels of localized PCB exposure, in that they exhibited both elevated328
concentrations and unique congener patterns in proximity to contaminated sites. PCB329
average levels were threefold higher in fish collected from sites targeted for historical330
PCB contamination than randomly selected sites reflecting ambient Bay conditions. At331
areas with high levels of sediment PCBs, small fish tissue levels were also increased.332
Thus, the small fish indicated biotic exposure to conditions at the locations studied,333
including historical PCB contamination.334

8/3/2019 PCBs in small fish
http://slidepdf.com/reader/full/pcbs-in-small-fish 22/45
19
PCBs in topsmelt were generally higher than in silversides; however, silversides have335
higher mercury concentrations (Greenfield and Jahn, 2010) . The higher PCBs in topsmelt336
was likely partially attributable to their higher lipid content (Kidd et al., 1998) , but337
habitat differences (reviewed in Greenfield and Jahn, 2010) likely explain the contrasting338
PCB and mercury contamination. Silversides favor less saline waters than topsmelt, and339
their distribution corresponds to the less urbanized San Pablo Bay and Suisun Bay340
locations (Figure 1) , where PCB contamination was reduced. Habitat differences341
between the species may also explain the stronger association with sediment342
concentrations for topsmelt. Related to their salinity preferences, silverside spend more343
time in fringing marshes and channels draining into the Bay, and less time near the344
subtidal areas where sediment contamination has been monitored.345
Although we did not monitor biological effects, Brar et al. (2010) indicated a statistical346
correlation between hepatic PCB concentrations and thyroid endocrine response in347
shiner perch and staghorn sculpin ( Leptocottus armatus ). The affected locations in Brar348
et al. (2010) (Oakland Harbor and San Leandro Bay) were less contaminated than South349
Basin and Stege Marsh in our study (Table 1), suggesting a risk of sublethal effects due350
to PCB exposure in multiple San Francisco Bay industrial locations.351
4.2 Spatial patterns352

8/3/2019 PCBs in small fish
http://slidepdf.com/reader/full/pcbs-in-small-fish 23/45
20
Unlike prior examinations of PCBs in aquatic biota, our study emphasized the detailed353
spatial patterns within a single estuary. Two general patterns were discerned: both site354
type and distance from Guadalupe River influenced forage fish PCB concentrations. Fish355
concentrations reflected general Bay-wide spatial trends in sediment PCB356
concentrations, with elevated fish concentrations at targeted locations with357
contaminated sediments. The clear distinction between fish from targeted and non-358
targeted sites suggests that PCB exposure at the base of the food web remains elevated359
in historically contaminated areas, despite ongoing efforts to remediate PCB360
contamination in these hotspots (Cho et al., 1999; Davis et al., 2007) . 361
After accounting for elevated concentrations in targeted sites, predominantly located in362
Central Bay, small fish PCB concentrations declined northward from South Bay through363
Suisun Bay. This spatial trend indicated a broad gradient in biota PCB contamination364
throughout the Bay. A similar pattern is seen in Hg and PBDEs (Conaway et al., 2003; 365
Oros et al., 2005; Greenfield and Jahn, 2010) . Studies in other industrialized water366
bodies also demonstrate spatial gradients of decreased fish PCB contamination with367
increasing capture distance from contaminated locations (Barron et al., 2000; Fernandez368
et al., 2004) .369
The spatial trend of pollution declining from the South Bay likely results from changes in370
two attributes: extent of watershed urbanization and fluvial flushing rates (Conomos,371
1979) . Higher ambient sediment and forage fish PCBs in the South Bay is primarily linked372

8/3/2019 PCBs in small fish
http://slidepdf.com/reader/full/pcbs-in-small-fish 24/45
21
to river and stormwater runoff dominated by urban and industrial regions as well as a373
higher residence time for water in the South Bay compared with the North Bay. The374
North Bay tributaries contain extensive agricultural and undeveloped land, contributing375
more dilute loads. Additionally the San Joaquin and Sacramento Rivers that drain into376
Suisun Bay have high flow volumes, which would more readily flush out legacy377
contamination.378
Although there was a general spatial trend with distance from the Guadalupe River,379
forage fish PCB concentrations were also elevated in historically contaminated locations,380
including several Central Bay sites. The sites with the highest fish PCB concentrations381
have well-documented histories of PCB use and contamination in sediment. Our results382
indicate that multiple in-Bay and watershed sources together, rather than a single point383
source, contribute to increased overall exposure to Bay biota.384
4.3 Congener patterns385
The high variability explained by PC1, and its high correlation to congener weight,386
indicated that a primary factor in the variation between sites is driven by the387
contribution of light versus heavy congeners. In general, targeted sites had a greater388
abundance of lower chlorinated congeners. Sites having lower scores for PC1 exhibit389
chlorination patterns characteristic of Aroclor mixture 1248. Since these congeners are390

8/3/2019 PCBs in small fish
http://slidepdf.com/reader/full/pcbs-in-small-fish 25/45
22
more readily volatilized and degraded, their relative contribution is reduced for random391
sites not near legacy PCB sources.392
Stege Marsh had the most distinctive congener profile of all sites sampled, including393
particularly elevated tissue concentrations of PCB 52, PCB 66, and PCB 70. Given their394
low salinity and nearshore habitat preferences (Greenfield and Jahn, 2010) , the395
silversides from Stege Marsh likely never roamed beyond the extent of the slough. The396
distinct profile and high concentration detected in the Stege Marsh silversides397
corresponded to sediment measurements and likely reflected local contamination by398
PCBs from Aroclor mixture 1248 (Hwang et al., 2006) . Several historic sources of PCB399
contamination drain into Stege Marsh. A former Pacific Gas and Electric (PG&E) site400
adjoined the Western Storm Drain (WSD) which drains into the marsh. This site was401
used to store materials including electrical transformers, employing PCBs in hydraulic402
and dielectrical fluids. In the marsh sediment and the WSD, Aroclor 1248 was detected403
at an average concentration of 18.97 ng g -1, followed by Aroclors 1254 and 1260 at404
average concentrations of 0.98 and 0.36 ng g -1, respectively. Another sewer system405
deposited materials from the former Zeneca, Inc. pyrite cinder landfill into the Bay until406
the 1950s. Maximum PCB soil concentrations adjacent to the sewer pipe were 63 ng g -1.407
It is unclear if the Stege Marsh PCB contamination largely originated from the PG&E or408
Zeneca sites, or other sources along the same drainage systems (Blasland Bouck & Lee409
Inc., 2005) . Given a range of sources of PCBs and other contaminants in Stege Marsh,410

8/3/2019 PCBs in small fish
http://slidepdf.com/reader/full/pcbs-in-small-fish 26/45
23
integrated assessments of chemical exposure and biological effects have determined411
this site to be highly impacted in comparison to other San Francisco Bay and reference412
wetlands (Hwang et al., 2006, 2008) .413
In addition to Stege Marsh, other targeted sites, including Richmond Inner Harbor and414
San Rafael Creek, also had relatively high relative contributions of lower chlorinated415
congeners. Aroclor mixtures 1016, 1242 and 1248 are discernible by the high relative416
contributions of PCBs 17, 18, 28, 31, 33, 44, 49, 66, and 70 (Frame et al., 1996) , and417
were likely predominant sources at these sites. Because lower chlorinated congeners418
degrade and volatilize more readily, the high concentrations seen in these samples419
suggest either continuous sources or very high concentrations of legacy PCB420
contamination at these sites.421
Samples collected from Oakland Inner Harbor, North San Leandro Bay, Coyote Point422
South, Petaluma Marsh, and Napa River exhibited higher concentrations of PCBs 95, 99,423
101, 110, and 118, suggesting Aroclor 1254 as a dominant source to these regions.424
Congeners 149, 170, 180, and 187 contributed more to the total sum of PCBs in the425
samples collected from South Basin, Hunters Point North, SF Airport, Mission Creek426
Mouth, Suisun Bay at Port Chicago, Suisun Bay East at Winter Island, and Suisun Marsh427
West at Cutoff Slough, suggesting Aroclors 1260 and 1262 as dominant among the PCB428
sources at these sites. The detection of PCB 209 at Seaplane Lagoon may indicate the429

8/3/2019 PCBs in small fish
http://slidepdf.com/reader/full/pcbs-in-small-fish 27/45
24
nearby use of investment casting waxes, some of which were composed solely of 430
decachlorinated biphenyl (SFBRWQCB, 2008).431
The high abundance of lower chlorinated congeners near legacy contamination sources432
was similarly observed in mummichog ( Fundulus heteroclitus ) from the Hudson River433
Estuary and Newark Bay (Monosson et al., 2003) and multiple forage fish species in434
Georgia and Florida (Pulster et al., 2005) . Congener PCA also distinguished fish samples435
among sites on the San Diego, CA, offshore coastal shelf. Hypothesized sources of 436
variation for the Southern California samples included differences in sources and taxa-437
specific bioaccumulation patterns (Parnell et al., 2008) . The increased light congener438
abundance in forage fish collected from historically contaminated locations suggests439
continued contamination of nearshore terrestrial areas, where light congeners may be440
more persistent (Fu and Wu, 2006) . This finding, combined with locally elevated441
concentrations, suggest that legacy PCB contamination remains a concern in442
industrialized portions of San Francisco Bay. 443
5 Acknowledgements444
We thank J. Davis, J.L. Grenier, N. Feger, C. Sommers, R. Looker, R. Schlipf, M. Connor445
and the RMP Technical Review Committee for study design and site selection assistance.446
Field sampling was performed by D. Slotton and S. Ayers, with assistance from B.447
Stanford and K. Ridolfi. Laboratory analyses for PCBs were performed by AXYS Analytical448
8/3/2019 PCBs in small fish
http://slidepdf.com/reader/full/pcbs-in-small-fish 28/45
25
Laboratories (Sidney, BC, Canada). Data were formatted and QA validated by J. Ross, A.449
Wong, and D. Yee, and J. Kass prepared Figure 1. J. Davis, D. Senn, and M. Lahiff 450
reviewed the manuscript. This study was funded by the Regional Monitoring Program451
for Water Quality in San Francisco Bay (SFEI Publication ###), with additional support by452
a US EPA STAR Graduate Fellowship to BG.453
6 References454
Ashley, J.T., Secor, D.H., Wales, S.Q., Baker, J.E., 2000. Linking habitat use of Hudson455River striped bass to accumulation of polychlorinated biphenyl congeners. Environ. Sci.456Technol. 34, 1023-1029.457
Ashley, J.T.F., Baker, J.E., 1999. Hydrophobic organic contaminants in surficial sediments458of Baltimore Harbor: Inventories and sources. Environ. Toxicol. Chem. 18, 838-849.459
Barnett, A.M., Bay, S.M., Ritter, K.J., Moore, S.L., Weisberg, S.B., 2008. Sediment quality460in California bays and estuaries. Technical Report 522. SCCWRP, Costa Mesa, CA. p. 42.461
Barron, M.G., Anderson, M.J., Cacela, D., Lipton, J., Teh, S.J., Hinton, D.E., Zelikoff, J.T.,462Dikkeboom, A.L., Tillitt, D.E., Holey, M., Denslow, N., 2000. PCBs, liver lesions and463biomarker responses in adult walleye ( Stizostedium vitreum vitreum ) collected from464Green Bay, Wisconsin. J. Great Lakes Res. 26, 250-771.465
Battelle, Blasland Bouck & Lee Inc., Neptune & Company, 2005. Final Hunters Point466Shipyard Parcel F Validation Study Report. San Francisco Bay, California. U.S. Navy, San467Diego, CA. p. 298 + App.468
Bayen, S., Thomas, G.O., Lee, H.K., Obbard, J.P., 2003. Occurrence of polychlorinated469
biphenyls and polybrominated diphenyl ethers in green mussels ( Perna viridis ) from470Singapore, Southeast Asia. Environ. Toxicol. Chem. 22, 2432-2437.471
Blasland Bouck & Lee Inc., 2005. Summary of PCB results. Richmond Field Station.472University of California, Berkeley. Richmond, California.473

8/3/2019 PCBs in small fish
http://slidepdf.com/reader/full/pcbs-in-small-fish 29/45
26
Brar, N.K., Waggoner, C., Reyes, J.A., Fairey, R., Kelley, K.M., 2010. Evidence for thyroid474endocrine disruption in wild fish in San Francisco Bay, California, USA. Relationships to475contaminant exposures. Aquat. Toxicol. 96, 203-215.476
Burnham, K.P., Anderson, D.R., 2002. Model selection and multimodel inference: A477
practical information-theoretic approach, 2nd ed. Springer. p. 488.478
Cho, Y.M., Ghosh, U., Kennedy, A.J., Grossman, A., Ray, G., Tomaszewski, J.E., Smithenry,479D.W., Bridges, T.S., Luthy, R.G., 1999. Field application of activated carbon amendment480for in-situ stabilization of polychlorinated biphenyls in marine sediment. Environ. Sci.481Technol. 43, 3815-3823.482
Conaway, C.H., Squire, S., Mason, R.P., Flegal, A.R., 2003. Mercury speciation in the San483Francisco Bay estuary. Mar. Chem. 80, 199-225.484
Connor, K.T., Eversen, M., Su, S.H., Finley, B.L., 2005. Quantitation of polychlorinated485biphenyls in fish for human cancer risk assessment: A comparative case study. Environ.486Toxicol. Chem. 24, 17-24.487
Conomos, T.J., 1979. Properties and Circulation of San Francisco Bay Waters. in:488Conomos, T.J. (Ed.). San Francisco Bay: The Urbanized Estuary. California Academy of 489Sciences, San Francisco, pp. 47-84.490
Davis, J.A., Hetzel, F., Oram, J.J., McKee, L.J., 2007. Polychlorinated biphenyls (PCBs) in491San Francisco Bay. Environ. Res. 105, 67-86.492
Davis, J.A., May, M.D., Greenfield, B.K., Fairey, R., Roberts, C., Ichikawa, G., Stoelting,493M.S., Becker, J.S., Tjeerdema, R.S., 2002. Contaminant concentrations in sport fish from494San Francisco Bay, 1997. Mar. Pollut. Bull. 44, 1117-1129.495
Davis, J.A., Schiff, K., Melwani, A.R., Bezalel, S.N., Hunt, J.A., Allen, R., Ichikawa, G.,496Bonnema, A., Heim, W., Crane, D., Swenson, S., Lamerdin, C., Stephenson, M., 2011.497SWAMP/RMP/Bight program report on contaminants in fish from the California coast.498Report of the Surface Water Ambient Monitoring Program (SWAMP). California State499Water Resources Control Board, Sacramento, CA.500http://www.sfei.org/documents/contaminants-fish-california-coast-report . 501

8/3/2019 PCBs in small fish
http://slidepdf.com/reader/full/pcbs-in-small-fish 30/45
27
Diamanti-Kandarakis, E., Bourguignon, J.-P., Giudice, L.C., Hauser, R., Prins, G.S., Soto,502A.M., Zoeller, R.T., Gore, A.C., 2009. Endocrine-disrupting chemicals: an Endocrine503Society scientific statement. Endocrine Reviews 30, 293-342.504
Fernandez, M.P., Ikonomou, M.G., Courtenay, S.C., Wirgin, I.I., 2004. Spatial variation in505
hepatic levels and patterns of PCBs and PCDD/Fs among young-of-the-year and adult506Atlantic tomcod ( Microgadus tomcod ) in the Hudson River estuary. Environ. Sci.507Technol. 38, 976-983.508
Frame, G.M., Wagner, R.E., Carnahan, J.C., Brown, J.F., Jr., May, R.J., Smullen, L.A.,509Bedard, D.L., 1996. Comprehensive, quantitative, congener-specific analyses of eight510Aroclors and complete PCB congener assignments on DB-1 capillary GC columns.511Chemosphere 33, 603-623.512
Fu, C.T., Wu, S.C., 2006. Seasonal variation of the distribution of PCBs in sediments and513biota in a PCB-contaminated estuary. Chemosphere, pp. 1786-1794.514
Grant, P.B., Johannessen, S.C., Macdonald, R.W., Yunker, M.B., Sanborn, M.,515Dangerfield, N., Wright, C., Ross, P.S., 2011. Environmental fractionation of PCBs and516PBDEs during particle transport as recorded by sediments in coastal waters. Environ.517Toxicol. Chem. 30, 1522-1532.518
Greenfield, B.K., Davis, J.A., Fairey, R., Roberts, C., Crane, D., Ichikawa, G., 2005.519Seasonal, interannual, and long-term variation in sport fish contamination, San520Francisco Bay. Sci. Total Environ. 336, 25-43.521
Greenfield, B.K., Jahn, A., 2010. Mercury in San Francisco Bay forage fish. Environ. Pollut.522158, 2716-2724.523
Gustavson, K.E., Burton, G.A., Francingues, N.R., Reible, D.D., Vorhees, D.J., Wolfe, J.R.,5242008. Evaluating the effectiveness of contaminated-sediment dredging. Environ. Sci.525Technol. 42, 5042-5047.526
Helsel, D.R., 2010. Summing nondetects: incorporating low-level contaminants in risk527assessment. Integr. Environ. Assess. Manag. 6, 361-366.528
Huang, X., Hites, R.A., Foran, J.A., Hamilton, C., Knuth, B.A., Schwager, S.J., Carpenter,529D.O., 2006. Consumption advisories for salmon based on risk of cancer and noncancer530health effects. Environ. Res. 101, 263-274.531

8/3/2019 PCBs in small fish
http://slidepdf.com/reader/full/pcbs-in-small-fish 31/45
28
Hunt, J.W., Anderson, B.S., Phillips, B.M., Newman, J., Tjeerdema, R.S., Taberski, K.,532Wilson, C.J., Stephenson, M., Puckett, H.M., Fairey, R., Oakden, J., 1998. Sediment533quality and biological effects in San Francisco Bay: Bay Protection and Toxic Cleanup534Program Final Technical Report. San Francisco Bay Regional Water Quality Control535Board, Oakland, CA.536
Hwang, H.M., Green, P.G., Young, T.M., 2006. Tidal salt marsh sediment in California,537USA. Part 1: occurrence and sources of organic contaminants. Chemosphere 64, 1383-5381392.539
Hwang, H.M., Green, P.G., Young, T.M., 2008. Tidal salt marsh sediment in California,540USA: Part 3. Current and historic toxicity potential of contaminants and their541bioaccumulation. Chemosphere 71, 2139-2149.542
Jarvis, E., Schiff, K., Sabin, L., Allen, M.J., 2008. Chlorinated hydrocarbons in pelagic543forage fishes and squid of the Southern California Bight. Environ. Toxicol. Chem. 26,5442290-2298.545
Jensen, S., Johnels, A.G., Olsson, M., Otterlind, G., 1969. DDT and PCB in marine animals546from Swedish waters. Nature 224, 247-250.547
Johnson, L.L., Sol, S.Y., Ylitalo, G.M., Hom, T., French, B., Olson, O.P., Collier, T.K., 1999.548Reproductive injury in English sole ( Pleuronectes vetulus ) from the Hylebos Waterway,549Commencement Bay, Washington. J. Aquat. Ecosyst. Stress Recovery 6, 289-310.550
Kidd, K.A., Schindler, D.W., Hesslein, R.H., Muir, D.C.G., 1998. Effects of trophic position551and lipid on organochlorine concentrations in fishes from subarctic lakes in Yukon552Territory. Can. J. Fish. Aquat. Sci. 55, 868-881.553
Lamon, E.C., Stow, C.A., 1999. Sources of variability in microcontaminant data for Lake554Michigan salmonids: statistical models and implications for trend detection. Can. J. Fish.555Aquat. Sci. 56, 71-85.556
Melwani, A.R., Greenfield, B.K., Byron, E.R., 2009. Empirical estimation of biota exposure557range for calculation of bioaccumulation parameters. Integr. Environ. Assess. Manag. 5,558138-149.559

8/3/2019 PCBs in small fish
http://slidepdf.com/reader/full/pcbs-in-small-fish 32/45
29
Monosson, E., Ashley, J.T.F., McElroy, A.E., Woltering, D., Elskus, A.A., 2003. PCB560congener distributions in muscle, liver and gonad of Fundulus heteroclitus from the561lower Hudson River Estuary and Newark Bay. Chemosphere 52, 777-787.562
Myers, M.S., Johnson, L.L., Olson, O.P., Stehr, C.M., Horness, B.H., Collier, T.K., McCain,563
B.B., 1998. Toxicopathic hepatic lesions as biomarkers of chemical contaminant564exposure and effects in marine bottomfish species from the Northeast and Pacific565Coasts, USA. Mar. Pollut. Bull. 37, 92-113.566
Oros, D.R., Hoover, D., Rodigari, F., Crane, D., Sericano, J., 2005. Levels and distribution567of polybrominated diphenyl ethers in water, surface sediments, and bivalves from the568San Francisco Estuary. Environ. Sci. Technol. 39, 33-41.569
Parnell, P.E., Groce, A.K., Stebbins, T.D., Dayton, P.K., 2008. Discriminating sources of 570PCB contamination in fish on the coastal shelf off San Diego, California (USA) Mar.571Pollut. Bull. 56, 1992-2002.572
Pulster, E.L., Smalling, K.L., Maruya, K.A., 2005. Polychlorinated biphenyls and573toxaphene in preferred prey fish of coastal southeastern U.S. bottlenose dolphins574(Tursiops truncatus ). Environ. Toxicol. Chem. 24, 3128-3136.575
R Development Core Team, 2011. R: A language and environment for statistical576computing. R Foundation for Statistical Computing, Vienna, Austria. http://www.R-577project.org/ . 578
Rasmussen, J.B., Rowan, D.J., Lean, D.R.S., Carey, J.H., 1990. Food chain structure in579Ontario lakes determines PCB levels in Lake Trout ( Salvelinus namaycush ) and other580pelagic fish. Can. J. Fish. Aquat. Sci. 47, 2030-2038.581
SFBRWQCB, 2008. Total Maximum Daily Load for PCBs in San Francisco Bay. San582Francisco Bay Regional Water Quality Control Board, Oakland, CA. p. 134.583http://www.waterboards.ca.gov/sanfranciscobay/TMDL/SFBayPCBs/pcbs_tmdl_project584
_report010804.pdf . 585
SFEI, 2010. A BMP tool box for reducing polychlorinated biphenyls (PCBs) and mercury586(Hg) in municipal stormwater. San Francisco Estuary Institute, Oakland, CA.587
Stahl, L.L., Snyder, B.D., Olsen, A.R., Pitt, J.L., 2009. Contaminants in fish tissue from US588lakes and reservoirs: a national probabilistic study. Environ. Monit. Assess. 150, 3-19.589

8/3/2019 PCBs in small fish
http://slidepdf.com/reader/full/pcbs-in-small-fish 33/45
30
Stevens, D.L., Jr., Olsen, A.R., 2004. Spatially balanced sampling of natural resources. J.590Am. Stat. Assoc. 99, 262-278.591
Suchanek, T., Eagles-Smith, C., Slotton, D., Harner, E., Colwell, A., Anderson, N., Mullen,592L., Flanders, J., Adam, D., McElroy, K., 2008. Spatio-temporal trends of mercury in fish593
from a mine-dominated ecosystem at Clear Lake, California: individual, species and594population level trends. Ecol. Appl. 18, A177-A195.595
U.S. EPA, 2000. Guidance for assessing chemical contaminant data for use in fish596advisories. Volume 1. Fish sampling and analysis. 3rd edition. EPA-823-B-00-007. U.S.597Environmental Protection Agency, Washington, DC.598http://www.epa.gov/waterscience/fishadvice/volume1/index.html . 599
U.S. EPA, 2003. Method 1668, Revision A: Chlorinated biphenyl congeners in water, soil,600sediment, and tissue by HRGC/HRMS. U.S. Environmental Protection Agency, Ofce of 601Water, Washington, DC. p. 129.602
Van den Berg, M., Birnbaum, L.S., Denison, M., De Vito, M., Farland, W., Feeley, M.,603Fiedler, H., Hakansson, H., Hanberg, A., Haws, L., Rose, M., Safe, S., Schrenk, D.,604Tohyama, C., Tritscher, A., Tuomisto, J., Tysklind, M., Walker, N., Peterson, R.E., 2006.605The 2005 World Health Organization reevaluation of human and mammalian toxic606equivalency factors for dioxins and dioxin-like compounds. Toxicol. Sci. 93, 223-241.607
Weis, P., Ashley, J.T.F., 2007. Contaminants in fish of the Hackensack Meadowlands,608New Jersey: size, sex, and seasonal relationships as related to health risks. Arch. Environ.609Contam. Toxicol. 52, 80 –89.610
Wu, J.P., Luo, X.J., Zhang, Y., Luo, Y., Chen, S.J., Mai, B.X., Yang, Z.Y., 2008.611Bioaccumulation of polybrominated diphenyl ethers (PBDEs) and polychlorinated612biphenyls (PCBs) in wild aquatic species from an electronic waste (e-waste) recycling site613in South China. Environment International 34, 1109-1113.614
615
616
8/3/2019 PCBs in small fish
http://slidepdf.com/reader/full/pcbs-in-small-fish 34/45
31
Table 1. Sample information and PCB concentrations for study samples.617
Sample ID Site ID Site Name S p e c
i e s a
Y e a r
T a r g e
t e d
S u m
4 0
c o n g e n e r s
( n g g
- 1 )
S u m
2 0 9
c o n g e n e r s
( n g g
- 1 )
D i o x
i n T E Q
( p g g
- 1 )
L i p i d ( % )
SF07-03-BIRDI-053 BIRDI Bird Island Top 2007 NA 169.2 NA 0.33 4.08
SF07-04-ALVSL-067 ALVSL Alviso Slough Top 2007 NA 137.3 NA 0.38 4.43
SF07-05-CANDL-080 CANDL Candlestick Park Top 2007 NA 421.8 NA 0.75 3.08
SF07-06-PTISO-101 PTISO Point Isabel Outer Top 2007 NA 142.5 NA 0.40 3.39
SF07-09-BENPK-146 BENPK Benicia Park Top 2007 NA 136.9 NA 0.23 3.64
SF07-10-NEWSL-155 NEWSL Newark Slough Top 2007 NA 115.9 NA 0.23 3.63
SF10-10-NSLB-503-MISI-PCB-092210 NSLB North San Leandro Bay Mis 2010 Y 303.1 358.8 1.77 1.87
SF10-13-STEGE-624-MISI-PCB-092810 STEGE Stege Marsh Mis 2010 Y 969.9 1337.1 8.27 2.40
SF10-14-22OTH-640-MISI-PCB-093010 22OTH Petaluma Marsh Mis 2010 N 38.5 45.3 0.76 2.24
SF10-14-25OTH-630-MISI-PCB-093010 25OTH Suisun Marsh Mis 2010 N 25.2 30.5 0.48 1.51
SF10-14-26OTH-635-MISI-PCB-093010 26OTH Napa River Mis 2010 N 28.7 34.1 0.51 2.34
SF10-15-24OTH-653-TOSM-PCB-100510 24OTH Newark Slough Top 2010 N 107.0 129.3 1.58 4.00
SF10-15-81OTH-661-TOSM-PCB-100510 81OTH Eden Landing Shoreline Top 2010 N 101.8 122.7 2.17 3.99

8/3/2019 PCBs in small fish
http://slidepdf.com/reader/full/pcbs-in-small-fish 35/45
32
SF10-16-78OTH-687-TOSM-PCB-100710 78OTH Mission Creek Top 2010 N 134.5 162.3 2.37 2.02
SF10-16-HUPTN-682-TOSM-PCB-100710 HUPTN Hunter’s Point North Top 2010 Y 189.7 228.3 3.10 2.75
SF10-16-SOBAS-677-TOSM-PCB-100710 SOBAS Hunter’s Point South Basin Top 2010 Y 1131.7 1346.6 14.28 4.20
SF10-17-80OTH-692-TOSM-PCB-101210 80OTH Emeryville Top 2010 N 217.7 261.5 5.34 3.43
SF10-17-OMHEA-702-TOSM-PCB-101210 OMHEA Oakland Middle Harbor Top 2010 Y 142.0 169.4 3.71 3.66
SF10-17-SEAPL-697-TOSM-PCB-101210 SEAPL Alameda Seaplane Harbor Top 2010 Y 162.4 203.8 4.41 2.98
SF10-18-SPBAY-726-TOSM-PCB-101310 SPBAY South San Pablo Bay Top 2010 N 63.9 76.6 0.89 3.46
SF10-20-90OTH-745-MISI-PCB-101910 90OTH North San Pablo Bay Mis 2010 N 44.3 52.9 0.96 1.87
SF10-21-28OTH-759-MISI-PCB-102110 28OTH Coyote Creek East Mis 2010 N 220.7 266.6 3.61 3.89
SF10-21-ALVIS-778-MISI-PCB-102110 ALVIS Alviso Slough Mis 2010 N 82.6 98.7 1.36 4.31
SF10-21-ALVIS-779-TOSM-PCB-102110 ALVIS Alviso Slough Top 2010 N 128.5 154.6 1.73 3.97
SF10-22-OAKIH-793-TOSM-PCB-102210 OAKIH Oakland Inner Harbor Top 2010 Y 589.2 699.9 11.63 3.97
SF10-23-11OTH-821-TOSM-PCB-102510 11OTH Richmond Inner Harbor Top 2010 Y 342.1 415.3 6.97 3.84
SF10-23-PPOT2-816-TOSM-PCB-102510 PPOT2 Point Potrero Top 2010 Y 187.4 224.9 3.67 3.88
SF10-23-SANRA-806-MISI-PCB-102510 SANRA San Rafael Creek Mis 2010 Y 126.3 148.2 3.36 1.82
SF10-23-SANRA-811-TOSM-PCB-102510 SANRA San Rafael Creek Top 2010 Y 125.6 150.0 2.60 3.38
SF10-24-20OTH-826-TOSM-PCB-102610 20OTH Redwood City Boat Ramp Top 2010 N 216.2 260.6 4.01 4.06

8/3/2019 PCBs in small fish
http://slidepdf.com/reader/full/pcbs-in-small-fish 36/45
33
SF10-24-SANLE-840-MISI-PCB-102610 SANLE San Leandro Harbor, Davis Creek Mis 2010 Y 329.5 398.6 6.78 1.98
SF10-25-77OTH-863-MISI-PCB-102810 77OTH Lower South Bay, Near Stevens
Creek
Mis 2010 N 152.7 183.2 2.82 3.60
SF10-26-MARIS-872-MISI-PCB-110110 MARIS Mare Island Mis 2010 Y 43.8 52.5 1.61 2.89
SF10-29-23OTH-909-TOSM-PCB-110810 23OTH Central Bay, Near SF Airport Top 2010 N 279.3 332.9 5.49 3.93
SF10-29-85OTH-904-TOSM-PCB-110810 85OTH South Bay, Near Coyote Point Top 2010 N 140.3 169.8 2.65 3.90
SF10-30-79OTH-914-MISI-PCB-111010 79OTH Suisun Bay, Port Chicago Mis 2010 N 47.6 56.9 0.12 1.90
SF10-30-83OTH-922-MISI-PCB-111010 83OTH Suisun Bay, Winter Island Mis 2010 N 31.7 38.0 0.67 2.16
a. Top = topsmelt; Mis = Mississippi silverside618
8/3/2019 PCBs in small fish
http://slidepdf.com/reader/full/pcbs-in-small-fish 37/45
34
Figure 1 . 619
620

8/3/2019 PCBs in small fish
http://slidepdf.com/reader/full/pcbs-in-small-fish 38/45
35
Figure 2. 621
622
623

8/3/2019 PCBs in small fish
http://slidepdf.com/reader/full/pcbs-in-small-fish 39/45
36
Figure 3.624
625
2 5 10 20 50 100
5 0
1 0 0
2 0 0
5 0 0
1 0
0 0
Sediment PCBs (ppb)
F i s h P C B s
( p p
b )
TopsmeltMississippi Silverside
8/3/2019 PCBs in small fish
http://slidepdf.com/reader/full/pcbs-in-small-fish 40/45
37
Figure 4. 626
627

8/3/2019 PCBs in small fish
http://slidepdf.com/reader/full/pcbs-in-small-fish 41/45
38
Figure 5. 628
629

8/3/2019 PCBs in small fish
http://slidepdf.com/reader/full/pcbs-in-small-fish 42/45
39
Figure captions630
Figure 1. Sum of 209 PCB concentrations at each location. For non-targeted stations,631
concentrations generally increased from north to south.632
Figure 2. Box and whisker plot of PCB concentrations across species and site type633
(targeted versus non-targeted). Thick line represents median concentration, box634
represents 25 th and 75 th percentile, and whiskers represent 95% confidence intervals.635
Note log scale. 636
Figure 3. Relationship between sediment and fish PCB concentrations ( Σ40 congeners).637
Figure 4. Biplot of sites as separated out by the first two principal components.638
Abbreviations follow Table 1. For sites with two species sampled, T = topsmelt and M =639
Mississippi silverside.640
Figure 5. Congener profiles for a) Stege Marsh, b) Suisun Marsh (25OTH), c) Richmond641
Inner Harbor (11OTH), and d) Coyote Creek East (28OTH). 642

8/3/2019 PCBs in small fish
http://slidepdf.com/reader/full/pcbs-in-small-fish 43/45
tronic Supplementary Material (Text Table and Figs)k here to download Electronic Supplementary Material (online publication only): SI Spatial patterns in forage fish polychlori

8/3/2019 PCBs in small fish
http://slidepdf.com/reader/full/pcbs-in-small-fish 44/45
tronic Supplementary PCB Datak here to download Electronic Supplementary Material (online publication only): SDat1PCBs.csv

8/3/2019 PCBs in small fish
http://slidepdf.com/reader/full/pcbs-in-small-fish 45/45
tronic Supplementary Sample Datak here to download Electronic Supplementary Material (online publication only): SDat2Samples.csv