PCaP Data/Specimen Guide PCaP Data/Specimen Guide Last updated September 13, 2012 North Carolina –...
25
1 PCaP Data/Specimen Guide Last updated September 13, 2012 North Carolina – Louisiana Prostate Cancer Project (PCaP) Funded by the Department of Defense contract DAMD 17-03-2-0052
Transcript of PCaP Data/Specimen Guide PCaP Data/Specimen Guide Last updated September 13, 2012 North Carolina –...

1
PCaP Data/Specimen Guide
Last updated September 13, 2012
North Carolina – Louisiana Prostate Cancer Project (PCaP)
Funded by the Department of Defense
contract DAMD 17-03-2-0052
2
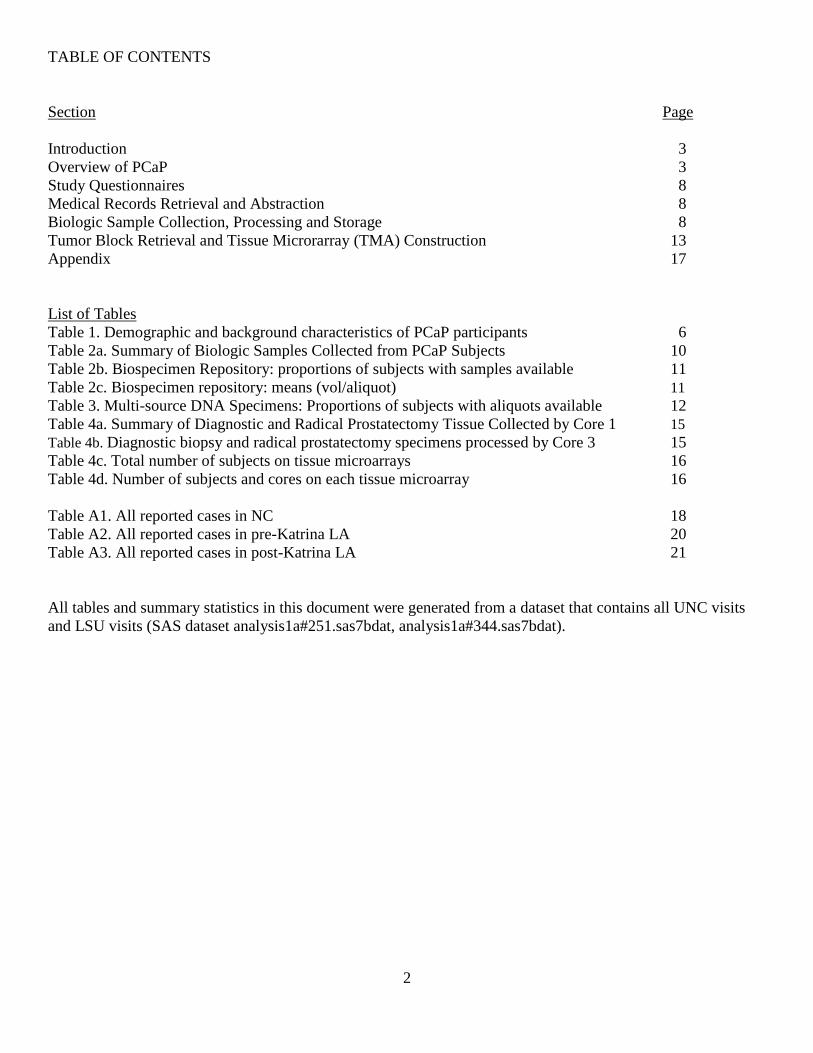
TABLE OF CONTENTS
Section Page
Introduction 3
Overview of PCaP 3
Study Questionnaires 8
Medical Records Retrieval and Abstraction 8
Biologic Sample Collection, Processing and Storage 8
Tumor Block Retrieval and Tissue Microrarray (TMA) Construction 13
Appendix 17
List of Tables
Table 1. Demographic and background characteristics of PCaP participants 6
Table 2a. Summary of Biologic Samples Collected from PCaP Subjects 10
Table 2b. Biospecimen Repository: proportions of subjects with samples available 11
Table 2c. Biospecimen repository: means (vol/aliquot) 11
Table 3. Multi-source DNA Specimens: Proportions of subjects with aliquots available 12
Table 4a. Summary of Diagnostic and Radical Prostatectomy Tissue Collected by Core 1 15
Table 4b. Diagnostic biopsy and radical prostatectomy specimens processed by Core 3 15
Table 4c. Total number of subjects on tissue microarrays 16
Table 4d. Number of subjects and cores on each tissue microarray 16
Table A1. All reported cases in NC 18
Table A2. All reported cases in pre-Katrina LA 20
Table A3. All reported cases in post-Katrina LA 21
All tables and summary statistics in this document were generated from a dataset that contains all UNC visits
and LSU visits (SAS dataset analysis1a#251.sas7bdat, analysis1a#344.sas7bdat).

3
Introduction
This document gives an overview of the North Carolina – Louisiana Prostate Cancer Project (PCaP). The study
design, study outcomes, tissue collection procedures, and sample availability are described in the sections
below, with the list of 13 key demographic and tumor characteristic variables provided in Appendix 3. The
PCaP Management Committee is responsible for final decisions regarding the use of the biorepository. Requests
to use the PCaP repository can be made by contacting PCaP ([email protected] ).
PCaP does not provide funding to support applicants’ projects. Investigators are required to find funding to
support their research projects as well as any additional costs for selecting, processing and shipping samples.
Overview of the North Carolina-Louisiana Prostate Cancer Project (PCaP)
The North Carolina-Louisiana Prostate Cancer Project (PCaP) is a multidisciplinary population-based case-only
study designed to address racial differences in prostate cancer through a comprehensive evaluation of social,
individual and tumor level influences on prostate cancer aggressiveness. PCaP enrolled approximately equal
numbers of African Americans and Caucasian Americans with newly-diagnosed prostate cancer from Louisiana
and North Carolina. The primary goals of the study are to investigate the factors associated with aggressive
prostate cancer in the population as a whole, and compare risk factors for aggressive prostate cancer between
the two racial groups. Geographic differences in aggressive prostate cancer within racial groups will also be
evaluated to see if differences in race-specific prostate cancer mortality rates between North Carolina and
Louisiana (specifically, higher mortality rates for African Americans in North Carolina (NC) versus Louisiana
(LA), and higher mortality rates for Caucasian Americans in Louisiana versus North Carolina) can be
explained. The PCaP Consortium website is located at www.ncla-pcap.org.
Eligibility
Residents of the North Carolina and Louisiana study areas with a first diagnosis of histologically confirmed
adenocarcinoma of the prostate were eligible to participate if they were diagnosed on or after July 1, 2004 but
before the end of recruitment at each site, were 40-79 years old at diagnosis, could complete the study interview
in English, did not live in an institution (nursing home), were not cognitively impaired or in a severely
debilitated physical state, and were not under the influence of alcohol, severely medicated, or apparently
psychotic at the time of the interview. Eligible men also had to self-identify as at least part African
American/Black or Caucasian American/White in response to the open-ended interview question “What is your
race?”, and a randomized recruitment procedure was used to facilitate comparable recruitment of Caucasian
Americans (CA) and African Americans (AA) over time, as described below. The cancer registries that
provided contact information in each state required that permission be obtained from each patient’s physician
before study staff could contact the patient.
North Carolina Case Ascertainment, Enrollment and Participation
The Rapid Case Ascertainment facility of the North Carolina Central Cancer Registry and the Lineberger
Comprehensive Cancer Center reported all potentially eligible cases residing in a 42 county study area
beginning in October 2003 and ending in August 2007 (for CA) or November 2007 (for AA). Counties included
in the study area increased from 27 at the start of enrollment to 42 at the end of the study (see Appendix 2 for
study maps and the list of study counties). In total, 4,640 unique cases were reported to the study, including
1,599 AA, 2,860 CA, 171 cases of unknown race and 10 cases that were classified as race other than AA or CA.
NC Caucasian Americans were sampled for recruitment with probability of 0.44; consequently, 1,607 CA cases
were randomly excluded from recruitment at ascertainment or when their racial status was confirmed to be CA.
Cases reported less than 90 days prior to the last day recruitment was attempted (Sept. 17, 2007 for CA, Nov.
29, 2007 for AA) were also excluded from the pool of potentially eligible cases because there was insufficient
time to obtain physician permission and complete enrollment (64 AA, 35 CA and 8 men of unknown race).

4
NC cases completed PCaP study visits between October 19, 2004 and December 10, 2007. The average time
from diagnosis to the study visit was 164 days (169.5 for AA, 158.8 for CA) with a median time of 134 (range
43 to 831) overall, and 138 (range 48 to 831) in AA, 132 (range 43 to 674) in CA. In total, 1,031 eligible North
Carolina men participated in the PCaP study, including 505 AA and 526 CA. The overall response rate, defined
as the number of eligible cases enrolled (1,031) divided by the number eligible to participate (2,704), was
38.1%. There were 143 non-participants of unknown race assumed to be eligible (reported as physician refusal
(24), deceased (1) no contact (88), lost contact (2), refused (28)). The response rate for AA cases was 35.4%
and 46.4% for CAs. The overall participation rate, defined as the number of eligible cases enrolled (1,031)
divided by the number enrolled plus the number that refused participation (1,031 + 620) was 62.4%. The
participation rate among AA cases was 62.0%, and the participation rate among CA cases was 65.1%. For
additional details, see Participation rates summary in Appendix 1.
Louisiana Ascertainment, Enrollment and Participation
Louisiana cases were reported to the study by the Louisiana Tumor Registry. Data for Louisiana are reported
separately for cases enrolled prior to Hurricane Katrina and those enrolled after Louisiana field activities
resumed in August 2006. In most cases, data will be analyzed separately for pre- and post-Katrina Louisiana
cases because of differences in the study populations between the two time periods.
Pre-Katrina
Pre-Katrina Louisiana enrollment included eligible cases diagnosed in 13 parishes surrounding New Orleans,
with study visits conducted from September 10, 2004 to August 25, 2005. This period of data collection
included study visits with 119 AA and 94 CA participants. During this time, CAs were sampled for recruitment
with a probability of 0.42 until March 16, 2005, changing to 0.45 on March 16, 2005. The average time from
diagnosis to the study visit was 112.7 days (103.1 for AAs, 125.1 for CAs) with a median time of 94 (range 34
to 304) overall, and 90 (range 34 to 302) in AAs, 106.5 (range 50 to 304) in CAs. The overall response rate
defined as the number of eligible cases enrolled (213) divided by the number eligible (479) to participate, was
44.5%. There were 38 non-participants of unknown race assumed to be eligible (reported as physician refusal
(7), deceased (2), no contact (6), lost contact (17), refused (6)). The response rate for AA cases was 49.4% and
47.0% for CAs. The overall participation rate, defined as the number of eligible cases enrolled (213) divided by
the number enrolled plus the number that refused participation (213 + 82) was 72.2%. The participation rate
among AA cases was 70.4%, and the participation rate among CA cases was 78.3%. For additional details, see
Participation rates summary in Appendix 1.
Post-Katrina
A second phase of Louisiana enrollment began in an expanded study area (including 8 additional parishes in
southern Louisiana, see Appendix 2 for maps and the list of study parishes) on September 5, 2006 and ended on
August 31, 2009, after study visits were completed with 506 African American and 508 Caucasian American
patients (in addition to the 213 pre-Katrina participants described above). All CA were recruited at the start of
post-Katrina field activities because of uncertainties regarding population demographics following Hurricane
Katrina, but CA were sampled with a probability of 0.45 between September 5, 2006 and March 29, 2007; 0.55
between March 30, 2007 and January 6, 2008; and 0.44 beginning on January 7, 2008. The average time from
diagnosis to the study visit was 140.5 days (143.4 for AA, 137.6 for CA) with a median time of 112 (range 37 to
702) overall, and 109 (range 37 to 702) in AA, 113.5 (range 40 to 526) in CA. The overall response rate defined
as the number of eligible cases enrolled (1014) divided by the number eligible (2078) to participate, was 48.8%.
There were 163 assumed eligible non-participants of unknown race (reported as physician refusal (11),
deceased (1) no contact (50), lost contact (14), refused (87)). The response rate for AA cases was 46.8% and
61.0% for CA. The overall participation rate, defined as the number of eligible cases enrolled (1014) divided by
the number enrolled plus the number that refused participation (1014 + 601) was 62.8%. The participation rate
among AA cases was 62.5%, and the participation rate among CA cases was 70.7%. For additional details, see
Participation rates summary in Appendix 1.

5
Baseline Data Collection
Participants were visited in their home by a trained Registered Nurse. The study nurse collected biologic
samples, made anthropometric measurements and administered the questionnaire. For more information please
see manual of procedures for specimen collection, body measurement, or questionnaire.

6
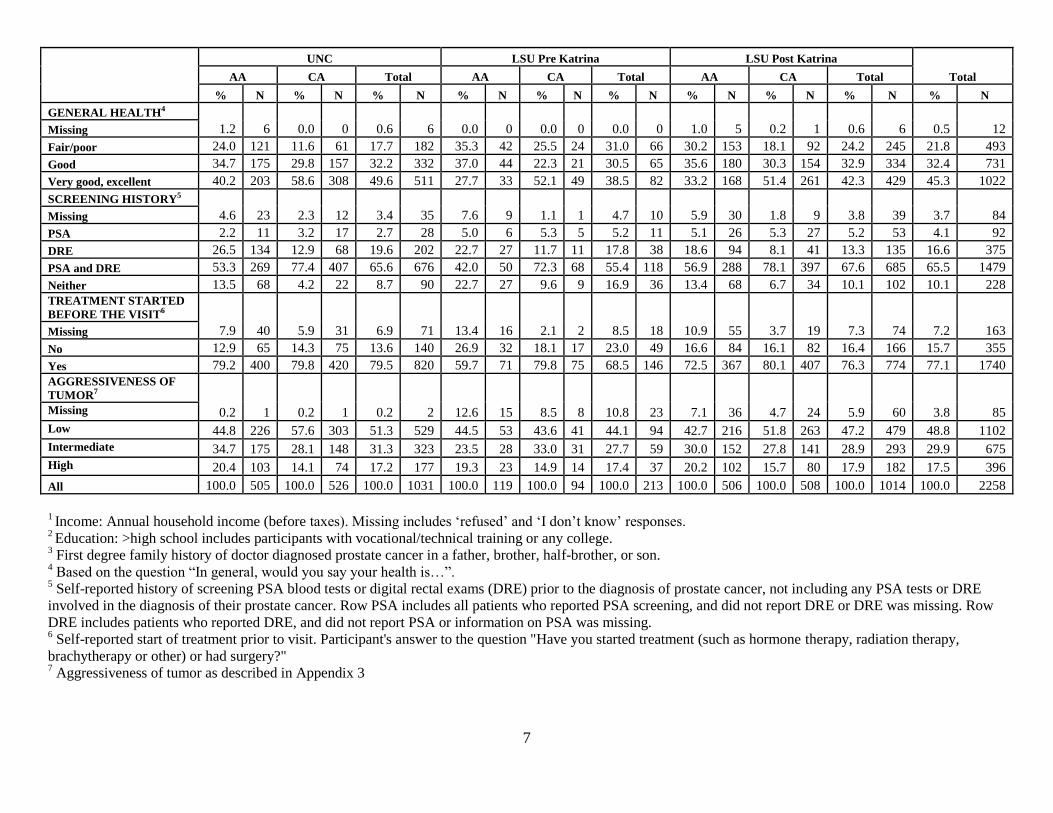
Table 1. Demographic and background characteristics of PCaP participants
UNC LSU Pre Katrina LSU Post Katrina
Total AA CA Total AA CA Total AA CA Total
% N % N % N % N % N % N % N % N % N % N
AGE GROUP AT
DIAGNOSIS
5.9 30 4.2 22 5.0 52 3.4 4 2.1 2 2.8 6 3.8 19 2.4 12 3.1 31 3.9 89 40-49
50-59 39.2 198 24.0 126 31.4 324 33.6 40 20.2 19 27.7 59 32.2 163 26.8 136 29.5 299 30.2 682
60-69 36.8 186 45.8 241 41.4 427 42.0 50 43.6 41 42.7 91 44.1 223 43.1 219 43.6 442 42.5 960
70-79 18.0 91 26.0 137 22.1 228 21.0 25 34.0 32 26.8 57 20.0 101 27.8 141 23.9 242 23.3 527
MARITAL
STATUS
0.2 1 0.0 0 0.1 1 0.0 0 0.0 0 0.0 0 0.2 1 0.0 0 0.1 1 0.1 2 Missing
Married 67.7 342 83.3 438 75.7 780 64.7 77 72.3 68 68.1 145 66.4 336 84.3 428 75.3 764 74.8 1689
Widowed 6.5 33 4.9 26 5.7 59 7.6 9 11.7 11 9.4 20 8.5 43 4.1 21 6.3 64 6.3 143
Divorced/separated 18.4 93 8.9 47 13.6 140 21.0 25 9.6 9 16.0 34 20.2 102 9.1 46 14.6 148 14.3 322
Never married 7.1 36 2.9 15 4.9 51 6.7 8 6.4 6 6.6 14 4.7 24 2.6 13 3.6 37 4.5 102
ANNUAL
INCOME1
6.7 34 4.9 26 5.8 60 7.6 9 8.5 8 8.0 17 14.2 72 13.0 66 13.6 138 9.5 215 Missing
Less than $20,000 28.1 142 7.6 40 17.7 182 43.7 52 19.1 18 32.9 70 32.6 165 10.8 55 21.7 220 20.9 472
$20,001-40,000 25.3 128 20.7 109 23.0 237 31.1 37 28.7 27 30.0 64 23.9 121 17.7 90 20.8 211 22.7 512
$40,001-70,000 23.6 119 23.0 121 23.3 240 10.9 13 20.2 19 15.0 32 15.6 79 24.0 122 19.8 201 20.9 473
More than $70,000 16.2 82 43.7 230 30.3 312 6.7 8 23.4 22 14.1 30 13.6 69 34.4 175 24.1 244 26.0 586
EDUCATION2
0.2 1 0.0 0 0.1 1 0.0 0 0.0 0 0.0 0 0.2 1 0.0 0 0.1 1 0.1 2 Missing
Less than High
school 26.9 136 8.4 44 17.5 180 47.1 56 14.9 14 32.9 70 36.2 183 11.6 59 23.9 242 21.8 492
High school 30.1 152 20.0 105 24.9 257 29.4 35 26.6 25 28.2 60 23.1 117 21.9 111 22.5 228 24.1 545
More than High
school 42.8 216 71.7 377 57.5 593 23.5 28 58.5 55 39.0 83 40.3 204 66.5 338 53.5 542 53.9 1218
Don’t know 0.0 0 0.0 0 0.0 0 0.0 0 0.0 0 0.0 0 0.2 1 0.0 0 0.1 1 0.0 1
FIRST DEGREE
FAMILY
HISTORY3
6.9 35 6.1 32 6.5 67 8.4 10 16.0 15 11.7 25 10.9 55 7.5 38 9.2 93 8.2 185 Missing
No 67.3 340 73.0 384 70.2 724 73.9 88 66.0 62 70.4 150 63.4 321 66.3 337 64.9 658 67.8 1532
Yes 25.7 130 20.9 110 23.3 240 17.6 21 18.1 17 17.8 38 25.7 130 26.2 133 25.9 263 24.0 541
7
UNC LSU Pre Katrina LSU Post Katrina
Total AA CA Total AA CA Total AA CA Total
% N % N % N % N % N % N % N % N % N % N
GENERAL HEALTH4
1.2 6 0.0 0 0.6 6 0.0 0 0.0 0 0.0 0 1.0 5 0.2 1 0.6 6 0.5 12 Missing
Fair/poor 24.0 121 11.6 61 17.7 182 35.3 42 25.5 24 31.0 66 30.2 153 18.1 92 24.2 245 21.8 493
Good 34.7 175 29.8 157 32.2 332 37.0 44 22.3 21 30.5 65 35.6 180 30.3 154 32.9 334 32.4 731
Very good, excellent 40.2 203 58.6 308 49.6 511 27.7 33 52.1 49 38.5 82 33.2 168 51.4 261 42.3 429 45.3 1022
SCREENING HISTORY5
4.6 23 2.3 12 3.4 35 7.6 9 1.1 1 4.7 10 5.9 30 1.8 9 3.8 39 3.7 84 Missing
PSA 2.2 11 3.2 17 2.7 28 5.0 6 5.3 5 5.2 11 5.1 26 5.3 27 5.2 53 4.1 92
DRE 26.5 134 12.9 68 19.6 202 22.7 27 11.7 11 17.8 38 18.6 94 8.1 41 13.3 135 16.6 375
PSA and DRE 53.3 269 77.4 407 65.6 676 42.0 50 72.3 68 55.4 118 56.9 288 78.1 397 67.6 685 65.5 1479
Neither 13.5 68 4.2 22 8.7 90 22.7 27 9.6 9 16.9 36 13.4 68 6.7 34 10.1 102 10.1 228
TREATMENT STARTED
BEFORE THE VISIT6
7.9 40 5.9 31 6.9 71 13.4 16 2.1 2 8.5 18 10.9 55 3.7 19 7.3 74 7.2 163 Missing
No 12.9 65 14.3 75 13.6 140 26.9 32 18.1 17 23.0 49 16.6 84 16.1 82 16.4 166 15.7 355
Yes 79.2 400 79.8 420 79.5 820 59.7 71 79.8 75 68.5 146 72.5 367 80.1 407 76.3 774 77.1 1740
AGGRESSIVENESS OF
TUMOR7
0.2 1 0.2 1 0.2 2 12.6 15 8.5 8 10.8 23 7.1 36 4.7 24 5.9 60 3.8 85 Missing
Low 44.8 226 57.6 303 51.3 529 44.5 53 43.6 41 44.1 94 42.7 216 51.8 263 47.2 479 48.8 1102
Intermediate 34.7 175 28.1 148 31.3 323 23.5 28 33.0 31 27.7 59 30.0 152 27.8 141 28.9 293 29.9 675
High 20.4 103 14.1 74 17.2 177 19.3 23 14.9 14 17.4 37 20.2 102 15.7 80 17.9 182 17.5 396
All 100.0 505 100.0 526 100.0 1031 100.0 119 100.0 94 100.0 213 100.0 506 100.0 508 100.0 1014 100.0 2258
1 Income: Annual household income (before taxes). Missing includes ‘refused’ and ‘I don’t know’ responses.
2 Education: >high school includes participants with vocational/technical training or any college.
3 First degree family history of doctor diagnosed prostate cancer in a father, brother, half-brother, or son.
4 Based on the question “In general, would you say your health is…”.
5 Self-reported history of screening PSA blood tests or digital rectal exams (DRE) prior to the diagnosis of prostate cancer, not including any PSA tests or DRE
involved in the diagnosis of their prostate cancer. Row PSA includes all patients who reported PSA screening, and did not report DRE or DRE was missing. Row
DRE includes patients who reported DRE, and did not report PSA or information on PSA was missing. 6 Self-reported start of treatment prior to visit. Participant's answer to the question "Have you started treatment (such as hormone therapy, radiation therapy,
brachytherapy or other) or had surgery?" 7 Aggressiveness of tumor as described in Appendix 3

8
Study Questionnaires
1. Background characteristics: self-described race and ethnicity, marital status, religion, education, income,
tobacco use, physical activity;
2. Occupation: current employment, occupation and industry; longest and second longest occupation and
industry; military service; occupations associated with pesticide use;
3. Family history: prostate cancer in first- and second-degree relatives;
4. Health status: general health (SF-12
) and comorbid conditions;
5. Health care: usual sources of care, health insurance, traditional health beliefs, perceived access and
quality of care;
6. Prostate cancer diagnosis and screening history: PSA tests, digital rectal exams, urinary and sexual
symptoms, previous prostate biopsies;
7. Medication Survey: All prescription and over-the-counter medications and supplements used in the prior
2 weeks (transcribed by study nurses);
8. Non-steroidal anti-inflammatory drugs (NSAIDs): Frequency and duration of use for prescription and
over-the-counter NSAIDs taken during the past 5 years at least once a month for one week or longer,
with product name show cards to aid recall;
9. Vitamins and supplements (including herbal products);
10. The diet history questionnaire (DHQ) was developed by the National Cancer Institute and modified by
PCaP Project 3 investigators to include Southern foods. Questionnaire responses were linked to the
updated DHQ Nutrient Database through the NCI-developed Diet*Calc software to estimate intake of
fatty acid and antioxidant micronutrients, including omega-3 and omega-6 polyunsaturated fatty acids,
carotenoids, and tocopherols.
11. Rapid estimate of adult literacy questionnaire.
12. Post-Katrina survey (administered in LA only).
For more details see .pdf files with study questionnaires.
Medical Records Retrieval and Abstraction
Medical records were requested from the physician of consenting participants. Trained staff used a relational
database designed specifically for PCaP to abstract information concerning comorbid conditions, family history
of prostate cancer, urologic symptoms, indications for diagnostic examinations and biopsies, prostate cancer
screening examinations, physical examinations and laboratory assays at or near diagnosis, imaging
examinations used in staging, clinical stage and grade, and initial treatment information. The stage was derived
for all subjects with medical records according to the algorithm described in Appendix 3. The clinical stage that
was assigned by the physician was also abstracted when available. For more details see the Manual of
Operations.
Biologic Sample Collection, Processing and Storage
Blood: Approximately 42ml of blood was obtained from consenting participants, including three 8.5ml yellow
top (ACD) tubes, one 10 ml red top tube, and one 6.5ml lavender top (EDTA) tube. Red and lavender top tubes
were wrapped in foil and were transported on ice prior to initial processing. Serum was removed from the red
top tube and aliquoted into ten cryovials. Lavender top samples were processed into plasma (six aliquots) and
packed red blood cells (two aliquots). Yellow top tubes were transported at room temperature, and Louisiana
samples were shipped overnight to UNC for processing and lymphocyte immortalization. Immortalized
lymphocytes were divided into 6 aliquots and cryopreserved in liquid nitrogen. Plasma was removed from
yellow-top tubes and DNA was purified from white blood cells. DNA, plasma, serum and packed red blood
cells were stored long-term at -80C.

9
Buccal rinse: For participants whose DNA was unavailable from blood, a retrospective collection of buccal
rinse samples was conducted in NC and LA. Beginning on September 4, 2007, LA participants who, at the time
of the study visit, could not complete the blood draw for DNA were given the option to complete a buccal rinse
instead.
Urine: A 20ml urine sample was requested from participants. The study nurse immediately aliquoted half of the
sample into a 15ml conical centrifuge tube containing 20 mg of crystalline ascorbic acid (as a preservative) and
placed the remainder into a second conical tube without preservative. Samples were wrapped in foil and
transported on ice prior to long-term storage at -20C.
Adipose tissue: Subcutaneous fat samples were obtained from the abdominal area of consenting participants
who were not allergic to local anesthetics. After the overlying skin was anesthetized with 2% lidocaine solution,
a 15-gauge needle was inserted into the subcutaneous fat and suction was applied using a 15ml vacutainer tube.
Aspirated tissue was trapped in the needle and Luer lock adapter, which were placed in separate cryovials,
transported on ice, and stored at -80C.
Toenail clippings: Participants were asked to collect toenail clippings from each toe of one foot prior to the
study visit. Toenails were stored in a cryovial at ambient temperature.
Anthropometric Measurements: Weight (to the nearest 0.1 kg), height, and waist and hip circumferences (in cm)
were measured using standardized instruments.
Diagnostic and Radical Prostatectomy Tissue: See Tumor Block Retrieval and Tissue Microarray (TMA)
Construction, page 13.
10
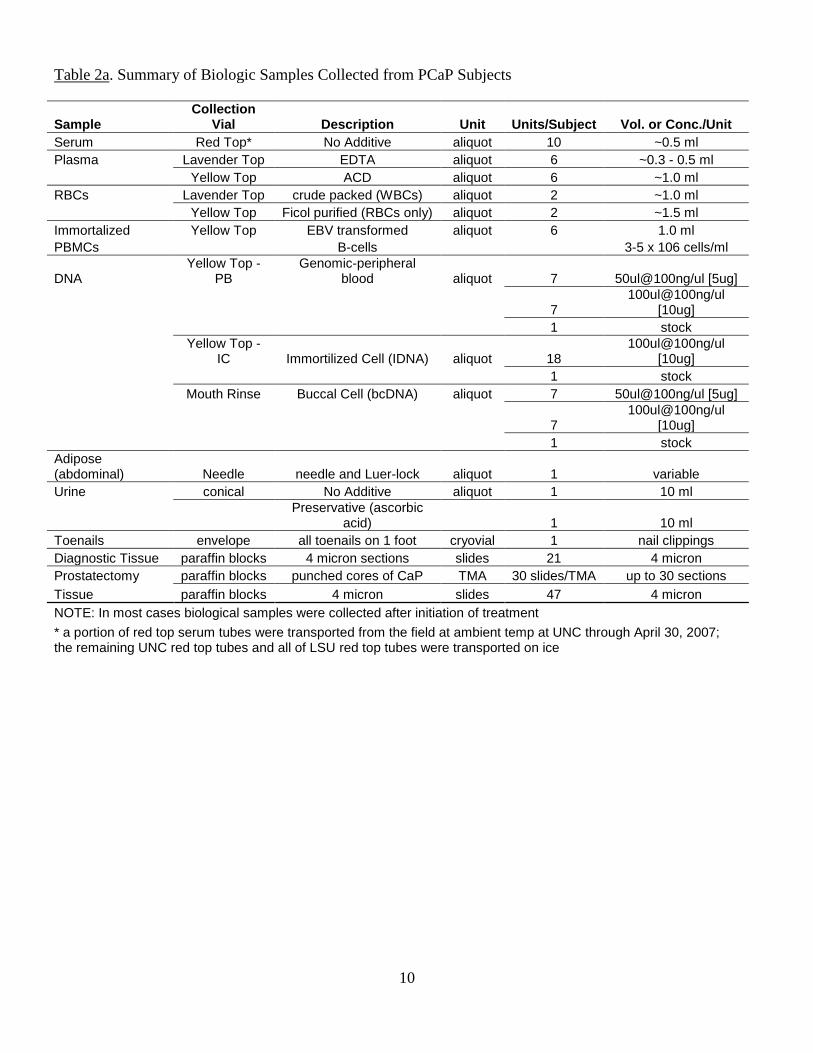
Table 2a. Summary of Biologic Samples Collected from PCaP Subjects
Sample Collection
Vial Description Unit Units/Subject Vol. or Conc./Unit
Serum Red Top* No Additive aliquot 10 ~0.5 ml
Plasma Lavender Top EDTA aliquot 6 ~0.3 - 0.5 ml
Yellow Top ACD aliquot 6 ~1.0 ml
RBCs Lavender Top crude packed (WBCs) aliquot 2 ~1.0 ml
Yellow Top Ficol purified (RBCs only) aliquot 2 ~1.5 ml
Immortalized Yellow Top EBV transformed aliquot 6 1.0 ml
PBMCs B-cells 3-5 x 10⁶ cells/ml
DNA Yellow Top -
PB Genomic-peripheral
blood aliquot 7 50ul@100ng/ul [5ug]
7 100ul@100ng/ul
[10ug]
1 stock
Yellow Top -
IC Immortilized Cell (IDNA) aliquot 18 100ul@100ng/ul
[10ug]
1 stock
Mouth Rinse Buccal Cell (bcDNA) aliquot 7 50ul@100ng/ul [5ug]
7 100ul@100ng/ul
[10ug]
1 stock
Adipose (abdominal) Needle needle and Luer-lock aliquot 1 variable
Urine conical No Additive aliquot 1 10 ml
Preservative (ascorbic
acid) 1 10 ml
Toenails envelope all toenails on 1 foot cryovial 1 nail clippings
Diagnostic Tissue paraffin blocks 4 micron sections slides 21 4 micron
Prostatectomy paraffin blocks punched cores of CaP TMA 30 slides/TMA up to 30 sections
Tissue paraffin blocks 4 micron slides 47 4 micron
NOTE: In most cases biological samples were collected after initiation of treatment
* a portion of red top serum tubes were transported from the field at ambient temp at UNC through April 30, 2007; the remaining UNC red top tubes and all of LSU red top tubes were transported on ice

11
Table 2b. Biospecimen repository: proportions of subjects with samples2
UNC Pre-K
LSU
Post-K
LSU ALL
Serum1 (10ml, no additive, no clot activator, uncoated interior).
Proportion of subjects with 10 aliquots 0.92 0.85 0.92 0.92
Plasma (8.5ml tube-6ml draw ACD solution A). Proportion of
subjects with 6 aliquots 0.89 0.94 0.90 0.90
Plasma (6.0ml K2 EDTA). Proportion of subjects with 6 aliquots
0.92 0.85 0.92 0.91
Packed RBCs. Proportion of subjects with 2 aliquots
0.92 0.85 0.92 0.91
Urine (with preservative) 0.98 0.86 0.98 0.97
Urine (without preservative) 0.98 0.86 0.98 0.97
Toenail Clippings 0.96 0.97 0.99 0.97
DENOMINATOR 1031 213 1014 2258
1 There were 835 UNC subjects (395 AA, 440 CA) interviewed before May 1, 2007. Of these subjects, 772 (360 AA, 412 CA)
contributed serum samples, which were transported at room temperature rather than on ice. 2 For more detail on specimen preparation, see manual of operations.
Table 2c. Biospecimen repository: means (vol/aliquot)
UNC Pre-K
LSU
Post-K
LSU ALL DENOMINATOR
Serum (10ml, no additive, no clot
activator, uncoated interior) out of >0 0.4 0.5 0.5 0.4 2084
Plasma (8.5ml tube-6ml draw ACD
solution A) 1.3 0.8 1.5 1.3 2036
Plasma (6.0ml K2 EDTA) 0.4 0.5 0.5 0.5 2066
Packed RBCs 1.1 1.1 1.0 1.0 2066
Urine (with preservative) 10.0 10.0 10.0 10.0 2187
Urine (without preservative) 10.0 10.0 10.0 10.0 2185
Type I error
Power
12
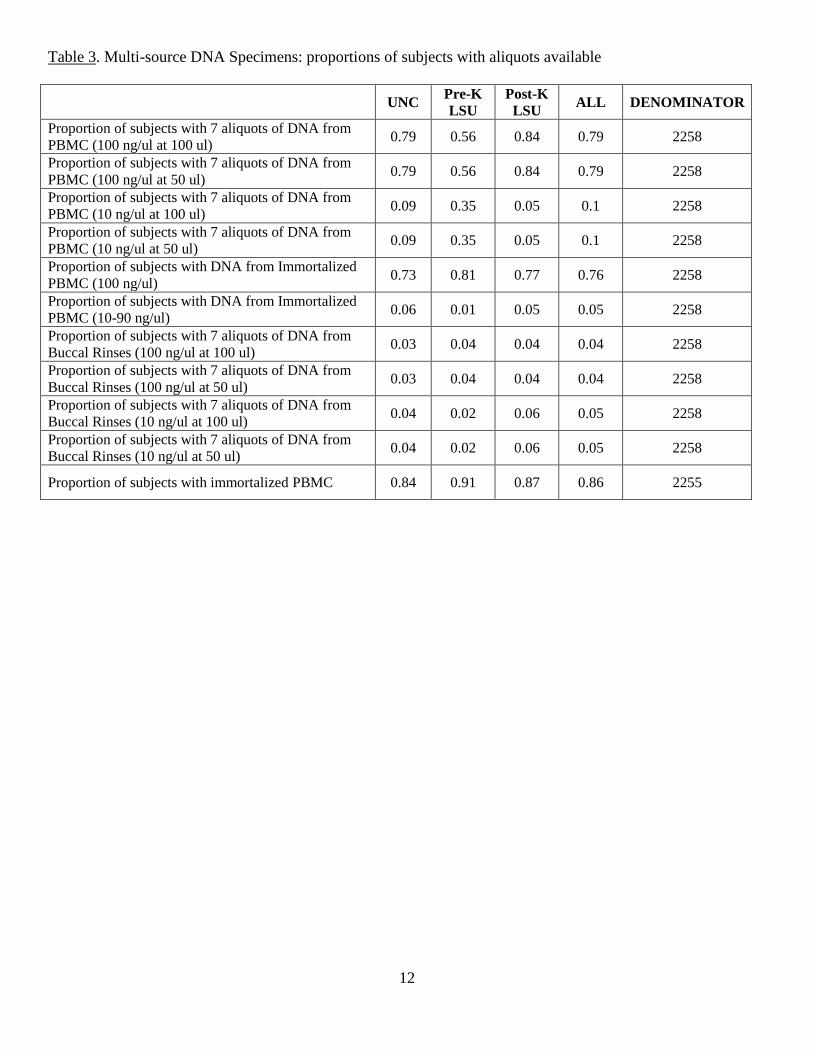
Table 3. Multi-source DNA Specimens: proportions of subjects with aliquots available
UNC Pre-K
LSU
Post-K
LSU ALL DENOMINATOR
Proportion of subjects with 7 aliquots of DNA from
PBMC (100 ng/ul at 100 ul) 0.79 0.56 0.84 0.79 2258
Proportion of subjects with 7 aliquots of DNA from
PBMC (100 ng/ul at 50 ul) 0.79 0.56 0.84 0.79 2258
Proportion of subjects with 7 aliquots of DNA from
PBMC (10 ng/ul at 100 ul) 0.09 0.35 0.05 0.1 2258
Proportion of subjects with 7 aliquots of DNA from
PBMC (10 ng/ul at 50 ul) 0.09 0.35 0.05 0.1 2258
Proportion of subjects with DNA from Immortalized
PBMC (100 ng/ul) 0.73 0.81 0.77 0.76 2258
Proportion of subjects with DNA from Immortalized
PBMC (10-90 ng/ul) 0.06 0.01 0.05 0.05 2258
Proportion of subjects with 7 aliquots of DNA from
Buccal Rinses (100 ng/ul at 100 ul) 0.03 0.04 0.04 0.04 2258
Proportion of subjects with 7 aliquots of DNA from
Buccal Rinses (100 ng/ul at 50 ul) 0.03 0.04 0.04 0.04 2258
Proportion of subjects with 7 aliquots of DNA from
Buccal Rinses (10 ng/ul at 100 ul) 0.04 0.02 0.06 0.05 2258
Proportion of subjects with 7 aliquots of DNA from
Buccal Rinses (10 ng/ul at 50 ul) 0.04 0.02 0.06 0.05 2258
Proportion of subjects with immortalized PBMC 0.84 0.91 0.87 0.86 2255

13
Tumor Block Retrieval and Tissue Microrarray (TMA) Construction
Tumor block retrieval is summarized in Table 4a. In nearly all state-race groups, 100% of subjects who
completed a study visit also consented to release diagnostic tissue. The exceptions are 99.8% of post-Katrina
LA AA (505 of 508) and 99.4% of NC AA (502 of 505). Paraffin blocks containing diagnostic prostate tissue
biopsies (core biopsies or TURP samples used to diagnose cancer) were requested from hospitals or reference
pathology laboratories. A few facilities provided unstained slides instead of tissue blocks. Hospitals/labs
declined to release diagnostic tissue for 96 or 9.3% of NC cases (56 or 11.2% AA, 40 or 7.6% CA), 44 or 20.7%
of pre-Katrina cases (32 or 26.9% AA, 12 or 12.8% CA) and 96 or 9.5% post-Katrina LA cases (81 or 16.0%
AA, 15 or 3.0% CA). Reasons for decline included overall policy (i.e., no blocks are ever released from that
facility) or case-specific reasons (e.g., a particular patient’s blocks did not contain enough tissue).
Diagnostic tissue (blocks or slides) was received for 879 NC subjects or 85.3% of NC subjects who completed a
visit (412 or 81.6% AA; 467 or 88.8% CA); 113 or 53.1% of pre-Katrina subjects (53 or 44.5% AA, 60 or
63.8% CA); and 775 or 76.4% of post-Katrina subjects (363 or 71.7% AA, 412 or 81.1% CA).
For each subject, six sections were cut from each representative positive diagnostic block and one from each
negative (without adenocarcinoma) block. Of the six sections from each positive diagnostic block; one was
stained for eosin and hematoxylin and reviewed by the study pathologist in order to identify areas of cancer.
One additional positive section/slide was immuno-stained for Ki-67 and caspase-3 and analyzed using
automated image analysis. The remaining sections were archived. See Table 4b for additional detail.
In NC, 638 subjects (289 AA, 349 CA) indicated at the time of the study visit that they chose radical
prostatectomy (RP) for their method of prostate cancer treatment. In pre-Katrina LA, 99 subjects (58 AA, 41
CA) chose RP, while in post-Katrina LA 509 subjects (230 AA, 279 CA) chose RP. This equates to 61.9% of
NC subjects who completed a study visit (57.2% AA, 66.3% CA), 46.5% of pre-Katrina subjects (48.7% AA,
43.6% CA) and 50.2% of post-Katrina subjects (45.5% AA, 54.9% CA). Of those subjects who chose RP,
consent to release that tissue to PCaP was provided by 593 or 92.9% of NC subjects (260 or 90.0% AA, 333 or
95.4% CA), 50 or 50.5% of pre-Katrina subjects (23 or 39.7% AA, 27 or 65.9% CA), and 506 or 99.4% of post-
Katrina subjects (228 or 99.1% AA, 278 or 99.6% CA). Some NC subjects and all pre-Katrina LA subjects were
contacted after the study visit to ask for release of RP tissue, with many pre-Katrina LA subjects lost to contact
after Hurricane Katrina; thus, their rates are lower than those for post-Katrina LA, all of whom were asked for
release of RP tissue at the time of their study visit.
Paraffin-embedded prostatectomy specimens were requested for consenting participants who had undergone or
scheduled an RP at the time of the study visit. A few facilities provided unstained slides instead of tissue blocks.
Hospitals/labs declined to release RP tissue for 68 or 11.5% NC subjects (23 or 8.8% AA, 45 or 13.5 % CA), 7
or 14.0% pre-Katrina (3 or 13.0% AA, 4 or 14.8% CA) and 38 or 7.5% post-Katrina LA subjects (13 or 5.7%
AA, 25 or 9.0% CA). Reasons for decline included overall policy (i.e., no blocks were ever released from that
facility) or case-specific reasons (e.g., a particular patient’s blocks did not contain enough tissue).
RP tissue was received for 442 NC subjects or 42.9% of NC subjects who completed a visit (196 or 38.8% AA,
246 or 46.8% CA); 19 or 8.9% of pre-Katrina subjects (9 or 7.6% AA, 10 or 10.6% CA); and 331 or 32.6% of
post-Katrina subjects (169 or 33.4% AA, 162 or 31.9% CA). When considering only those subjects who
indicated at the study visit that they chose CaP treatment via RP, rates of RP tissue receipt are 69.3% for NC
(67.8% AA, 70.5% CA), 19.2% for pre-Katrina LA (15.5% AA, 24.4% CA) and 65.0% for post-Katrina LA
(73.5% AA, 58.1% CA).
Similar to the process for sectioning diagnostic specimens, 6 slides were cut from each positive RP block and 1
from each negative (without adenocarcinoma) RP block. One newly-cut section from the surgical specimen was

14
reviewed by the study pathologist to select areas of cancer for construction of tissue microarrays (TMAs), and
additional sections were archived (see Table 4b for additional detail). TMAs contain tissue from an average of
62 subjects. TMAs were constructed with 0.6 mm core punches of neoplastic tissue and one core of paired non-
neoplastic tissue from the same subject using the following algorithm:
Number of blocks containing cancer Number of cancer cores Benign core
≥6 12 1
5 10 1
4 8 1
3 9 1
2 8 1
1 5 1
The following information was recorded for each core inserted:
1) Research subject study ID number;
2) Research Block number;
3) Punch identifier;
4) Benign or cancer (Gleason primary and secondary grades) coded centrally by a study
reference pathologist;
5) Percent prostatectomy specimen involved by tumor coded centrally by a study reference
pathologist;
6) TMA block number (for radical prostatectomy TMAs);
7) TMA location (x, y-coordinates) (for radical prostatectomy TMAs).
The number of sections and cores cut from each block was reduced when necessary to ensure that diagnostically
important tissue was not depleted. Blocks were returned within four months (or immediately on request).

15
Table 4a. Summary of Diagnostic and Radical Prostatectomy Tissue Collected by Core 1 North Carolina
Pre-Katrina Louisiana
Post-Katrina Louisiana
AA CA Total AA CA Total AA CA Total
Diagnostic Tissue
Consented: N (% of subjects
completing visit) 502 (99.4) 526 (100) 1028 (99.7) 119 (100) 94 (100) 213 (100) 506 (100) 507 (99.8) 1013 (99.9)
Declined by hospital/lab: N (% of subjects who consented) 56 (11.2) 40 (7.6) 96 (9.3) 32 (26.9) 12 (12.8) 44 (20.7) 81 (16.0) 15 (3.0) 96 (9.5)
Received: N (% of subjects completing visit) 412 (81.6) 467 (88.8) 879 (85.3) 53 (44.5) 60 (63.8) 113 (53.1) 364 (71.9) 411 (80.9) 775 (76.4)
Tissue
Chose RP*: N (% of subjects
completing visit) 289 (57.2) 349 (66.3) 638 (61.9) 58 (48.7) 41 (43.6) 99 (46.5) 230 (45.5) 279 (54.9) 509 (50.2)
Consented, if chose RP: N (% of
subjects who chose RP) 260 (90.0) 333 (95.4) 593 (92.9) 23 (39.7) 27 (65.9) 50 (50.5) 229 (99.6) 278 (99.6) 507 (99.6)
Declined by hospital/lab: N (% of subjects who chose RP and
consented) 23 (8.8) 45 (13.5) 68 (11.5) 3 (13.0) 4 (14.8) 7 (14.0) 13 (5.7) 25 (9.0) 38 (7.5)
Received: N (% of subjects
completing visit, % of subjects who chose RP) 195 (38.6, 67.5) 241 (45.8, 69.1) 436 (42.3, 68.3) 9 (7.6, 15.5) 10 (10.6, 24.4) 19 (8.9, 19.2) 171 (33.8, 74.3) 165 (32.5, 59.1) 336 (33.1, 66.0)
* According to self-report at the study visit that RP had been performed or was planned
Table 4b. Diagnostic biopsy (DX) and radical prostatectomy (RP) specimens processed by Core 32
UNC LSU Pre
Katrina LSU Post Katrina Total
Average number of DX slides per person among subjects with
slides 20.8 21.4 23.1 21.7
Average number of RP slides per person with slides cut 1
37.4 115.8 62.5 49.4
Subjects on TMA 407 18 264 689
Subjects on TMA eligible for phase II data distribution 379 13 235 627
Proportion of subjects with completed TMA 0.39 0.08 0.26 0.31
Average number of cores per person 7.8 8.8 5.9 7.1 1 Every block received by LSU is cut; at UNC only blocks with cancer are cut. This results in increased number of blocks cut at LSU.
2 For more detail on tissue/microarray preparation, see manual of operations.

16
Table 4c. Total number of subjects on tissue microarrays
UNC Pre-K LSU Post-K LSU Total
AA CA AA CA AA CA
183 224 8 10 137 127 689
Table 4d. Number of subjects and cores on each tissue microarray
Array Number of
subjects, Frequency
Number of
subjects, Cumulative
Frequency
Number of
Cores, Frequency
Number of
Cores, Cumulative
Frequency 1 60 60 489 489
2 56 116 476 965
3 52 168 457 1422
4 47 215 365 1787
5 71 286 513 2300
6 58 344 416 2716
7 65 409 483 3199
8 71 480 451 3650
9 73 553 449 4099
10 72 625 482 4581
11 55 680 265 4846
12 9 689 28 4874
i
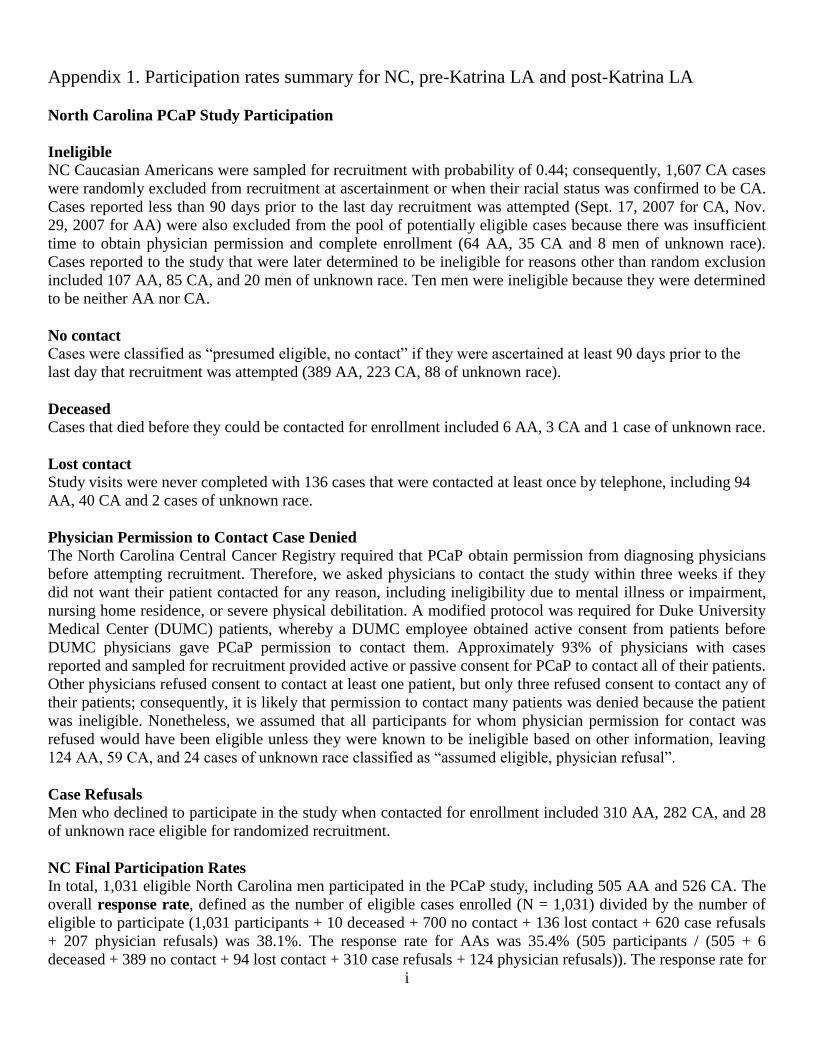
Appendix 1. Participation rates summary for NC, pre-Katrina LA and post-Katrina LA
North Carolina PCaP Study Participation
Ineligible
NC Caucasian Americans were sampled for recruitment with probability of 0.44; consequently, 1,607 CA cases
were randomly excluded from recruitment at ascertainment or when their racial status was confirmed to be CA.
Cases reported less than 90 days prior to the last day recruitment was attempted (Sept. 17, 2007 for CA, Nov.
29, 2007 for AA) were also excluded from the pool of potentially eligible cases because there was insufficient
time to obtain physician permission and complete enrollment (64 AA, 35 CA and 8 men of unknown race).
Cases reported to the study that were later determined to be ineligible for reasons other than random exclusion
included 107 AA, 85 CA, and 20 men of unknown race. Ten men were ineligible because they were determined
to be neither AA nor CA.
No contact
Cases were classified as “presumed eligible, no contact” if they were ascertained at least 90 days prior to the
last day that recruitment was attempted (389 AA, 223 CA, 88 of unknown race).
Deceased
Cases that died before they could be contacted for enrollment included 6 AA, 3 CA and 1 case of unknown race.
Lost contact
Study visits were never completed with 136 cases that were contacted at least once by telephone, including 94
AA, 40 CA and 2 cases of unknown race.
Physician Permission to Contact Case Denied
The North Carolina Central Cancer Registry required that PCaP obtain permission from diagnosing physicians
before attempting recruitment. Therefore, we asked physicians to contact the study within three weeks if they
did not want their patient contacted for any reason, including ineligibility due to mental illness or impairment,
nursing home residence, or severe physical debilitation. A modified protocol was required for Duke University
Medical Center (DUMC) patients, whereby a DUMC employee obtained active consent from patients before
DUMC physicians gave PCaP permission to contact them. Approximately 93% of physicians with cases
reported and sampled for recruitment provided active or passive consent for PCaP to contact all of their patients.
Other physicians refused consent to contact at least one patient, but only three refused consent to contact any of
their patients; consequently, it is likely that permission to contact many patients was denied because the patient
was ineligible. Nonetheless, we assumed that all participants for whom physician permission for contact was
refused would have been eligible unless they were known to be ineligible based on other information, leaving
124 AA, 59 CA, and 24 cases of unknown race classified as “assumed eligible, physician refusal”.
Case Refusals
Men who declined to participate in the study when contacted for enrollment included 310 AA, 282 CA, and 28
of unknown race eligible for randomized recruitment.
NC Final Participation Rates
In total, 1,031 eligible North Carolina men participated in the PCaP study, including 505 AA and 526 CA. The
overall response rate, defined as the number of eligible cases enrolled (N = 1,031) divided by the number of
eligible to participate (1,031 participants + 10 deceased + 700 no contact + 136 lost contact + 620 case refusals
+ 207 physician refusals) was 38.1%. The response rate for AAs was 35.4% (505 participants / (505 + 6
deceased + 389 no contact + 94 lost contact + 310 case refusals + 124 physician refusals)). The response rate for

ii
CAs was 46.4% (526 participants / (526 + 3 deceased + 223 no contact + 40 lost contact + 282 case refusals +
59 physician refusals)).
The overall participation rate, defined as the number of eligible cases enrolled (1,031) divided by the number
enrolled plus the number that refused participation (1,031+ 620) was 62.4%. The participation rate for AAs was
62.0% (505 / (505 + 310)). The participation rate for CAs was 65.1% (526 / (526 + 282)). For additional details,
see Table A1 below.
Table A1. All reported cases in NC
Race
Final Status AA CA Unknown Other Total
Ineligible
Randomized out 0 1607 0 0 1607
Ineligible 107 85 20 10 222
Late report 64 35 8 0 107
Eligible
MD refusal 124 59 24 0 207
Deceased 6 3 1 0 10
No contact 389 223 88 0 700
Lost Contact 94 40 2 0 136
Refused 310 282 28 0 620
Participant 505 526 0 0 1031
Total
Ineligible 171 1727 28 10 1936
Eligible 1428 1133 143 0 2704
All 1599 2860 171 10 4640
Louisiana PCaP Study Participation
Ineligible
Pre-Katrina CAs were sampled for recruitment with a probability of 0.42 until March 16, 2005, changing to
0.45 on March 16, 2005; consequently, 133 CA cases were randomly excluded from recruitment at
ascertainment or when their racial status was confirmed to be CA. All CA were recruited at the start of post-
Katrina field activities because of uncertainties regarding population demographics following Hurricane
Katrina, but CA were sampled with a probability of 0.45 between September 5, 2006 and March 29, 2007; 0.55
between March 30, 2007 and January 6, 2008; and 0.44 beginning on January 7, 2008. This resulted in the
random exclusion of 491 post-Katrina CAs. Post-Katrina cases reported less than 90 days prior to the last day
recruitment was attempted (November 11, 2008 for CA; August 27, 2009 for AA) were also excluded from the
pool of potentially eligible cases because there was insufficient time to obtain physician permission and
complete enrollment (58 AAs, 24 CA and 15 men of unknown race). Cases reported to the study that were later
determined to be ineligible for reasons other than random exclusion included: (Pre-Katrina) 14 AA, 17 CA, and
16 men of unknown race; (Post-Katrina) 81 AA, 89 CA and 38 men of unknown race. Five men were ineligible
because they were determined to be neither AA nor CA.
No contact
Cases were classified as “presumed eligible, no contact” if they were ascertained at least 90 days prior to the
last day that recruitment was attempted (Pre-Katrina: 2 AA, 26 CA, 6 of unknown race; Post-Katrina: 166 AA,
50 CA, 50 of unknown race).

iii
Deceased
Cases that died before they could be contacted for enrollment included 1 AA and 2 unknown race Pre-Katrina
cases and 7 AAs, 5 CAs and 1 unknown race Post-Katrina case.
Lost contact
Study visits were never completed with 130 Pre-Katrina cases that were contacted at least once by telephone
(65 AA, 48 CA and 17 cases of unknown race); and 114 Post-Katrina cases (72 AAs, 28 CAs and 14 cases of
unknown race).
Physician Permission to Contact Case Denied
It was assumed that all participants for whom physician permission for contact was refused would have been
eligible unless they were known to be ineligible based on other information, leaving 4 AA, 6 CA, and 17
unknown race Pre-Katrina cases and 28 AAs, 31 CAs, and 11 unknown race Post-Katrina cases classified as
“assumed eligible, physician refusal”.
Case Refusals
Men who declined to participate in the study when contacted for enrollment included: (Pre-Katrina) 50 AAs, 26
CAs, and 6 of unknown race and (Post-Katrina) 303 AAs, 211 CAs, and 87 of unknown race eligible for
randomized recruitment
Pre-Katrina Louisiana Final Participation Rates
In total, 213 eligible pre-Katrina men participated in PCaP, including 119 AA and 94 CA. The overall response
rate, defined as the number of eligible cases enrolled (N = 213) divided by the number of eligible to participate
(213 participants + 3 deceased + 34 no contact + 130 lost contact + 82 case refusals + 17 physician refusals)
was 44.5%. The response rate for AAs was 49.4% (119 participants / (119 + 1 deceased + 2 no contact + 65 lost
contact + 50 case refusals + 4 physician refusals)). The response rate for CAs was 47.0% (94 participants / (94
+ 0 deceased + 26 no contact + 48 lost contact + 26 case refusals + 6 physician refusals)).
The overall participation rate, defined as the number of eligible cases enrolled (213) divided by the number
enrolled plus the number that refused participation (213 + 82) was 72.2%. The participation rate for AAs was
70.4% (119 / (119 + 50)). The participation rate among CAs was 78.3% (94 / (94 + 26)).
For additional details, see Table A2.

iv
Table A2. All reported cases in pre-Katrina LA
Race
Final Status AA CA Unknown Total
Ineligible
Randomized out 0 133 0 133
Ineligible 14 17 16 47
Late report 0 0 0 0
Eligible
MD refusal 4 6 7 17
Deceased 1 0 2 3
No contact 2 26 6 34
Lost Contact 65 48 17 130
Refused 50 26 6 82
Participant 119 94 0 213
Total
Ineligible 14 150 16 180
Eligible 241 200 38 479
All 255 350 54 659
Post-Katrina Louisiana Final Participation Rates
In total, 1014 eligible post-Katrina men participated in PCaP, including 506 AA and 508 CA. The overall
response rate, defined as the number of eligible cases enrolled (N = 1014) divided by the number of eligible to
participate (1014 participants + 13 deceased + 266 no contact + 114 lost to contact + 601 case refusals + 70
physician refusals) was 48.8%. The response rate for AAs was 46.8% (506 participants / (506 + 7 deceased +
166 no contact + 72 lost contact + 303 case refusals + 28 physician refusals)). The response rate for CAs was
61.0% (508 participants / (508 + 5 deceased + 50 no contact + 28 lost contact + 211 case refusals + 31
physician refusals)).
The overall participation rate, defined as the number of eligible cases enrolled (1014) divided by the number
enrolled plus the number that refused participation (1014 + 601) was 62.8%. The participation rate for AAs was
62.5% (506 / (506 + 303)). The participation rate among CAs was 70.7% (508 / (508 + 211)). For additional
details, see Table A3.
Table A3. All reported cases in post-Katrina LA
Race
Final Status AA CA
Other Unknown Total
Ineligible
Randomized out 0 491 0 1 492
Ineligible 81 89 5 38 213
Late report 58 24 0 15 97
Eligible
MD refusal 28 31 0 11 70
Deceased 7 5 0 1 13
No contact 166 50 0 50 266
Lost Contact 72 28 0 14 114
Refused 303 211 0 87 601
Participant 506 508 0 0 1014
Total
Ineligible 139 604 5 54 802
Eligible 1082 833 0 163 2078
All 1221 1437 5 217 2880

v
Appendix 2. Participating NC counties and LA parishes
Original PCaP NC counties
Alamance, Caswell, Chatham, Cumberland, Duplin, Durham, Edgecomb, Franklin, Granville, Halifax, Harnett,
Hoke, Johnston, Lee, Lenoir, Mecklenburg, Nash, Orange, Person, Pitt, Rockingham, Sampson, Vance, Wake,
Warren, Wayne, Wilson.
Expansion PCaP NC counties
Beaufort, Bertie, Chowan, Craven, Gates, Greene, Hertford, Jones, Martin, Montgomery, Moore, Northampton,
Onslow, Pasquotank, Perquimans.

vi
Original PCaP LA parishes
Assumption, Jefferson, Lafourche, Orleans, Plaquemines, St. Bernard, St. Charles, St. James, St. John the
Baptist, St. Tammany, Tangipahoa, Terrebonne, Washington.
Expansion PCaP LA parishes
Acadia, Ascension, East Baton Rouge, East Feliciana, Evangeline, Iberia, Iberville, Lafayette, Livingston,
Pointe Coupee, St. Helena, St. Landry, St. Martin, St. Mary, Vermillion, West Baton Rouge, West Feliciana.

vii
Appendix 3. PCaP essential variables Name Description Possible Values
aggressive Aggressiveness of tumor
High
Any Gleason sum >= 8 or
Any PSA >20 or
Any Gleason sum = 7 & clinical stage T3-T4
Low
Gleason sum < 7 & clinical stage T1-T2 & PSA
<10
Intermediate
Gleason sum = 7 & clinical stage T1-T2 & PSA
<=20 or
Gleason sum < 7 & clinical stage T3-T4 & PSA
<10 or
Any Gleason sum < 7 & PSA 10 - 20
1 low
2 intermediate
3 high
. missing
formid PCaP subject ID 1105-9999
age Age at Diagnosis
= Dx Procedure Date (the date of the biopsy as
indicated in medical records) – Date of Birth
(questionnaire)
Dx Procedure_Date from medical
records: dxpath
o if missing then from
t_path_report in subject tracker
o if dx date is missing in
t_path_report then RP procedure
date is used (all UNC subjects
have Dx Procedure_Date in
medical records, LSU still
abstracting medical records)
Age is truncated: e.g. 42.75 yr >> 42 yr
40-79
bc6 Race
From questionnaire: Background
Characteristics 6.
Race “other” (bc6=3) changed to “AA” in
pc29.sas
1 (AA)
2 (CA)
site Site
from questionnaire
‘UNC’
‘LSU’
surveydate Date of visit
from questionnaire, page 1
from Background Characteristics:
“Today’s Date”
9/10/2004 – LSU
completion
stage Tumor stage
from medical records: table dxpath
o stage = ‘DTNMT’ (Derived
Clinical Stage (Diagnostic) T) from
3A
T1(NOS)
T1C
T1a

viii
table dxpath
o if ‘DTNMT’ is missing, then stage
= ‘clistatnmt’ (Clinical Stage (T))
from table dxpath
T1c
T2 a or b
T2(NOS)
T2a
T2b
T2c
T3/4(NOS)
T3a
T3b
T4
NA
blank = missing
stage_num Stage number
derived from Stage
1=T1a, T1c, T1(NOS), T1C
2=T2(NOS, T2a, T2b, T2 a or b, T2c
3=T3/4(NOS), 'T3b, T3a, 3A
4=T4
1-4
. missing
gleone_tbldxpath_mra Primary gleason grade
always from medical records: table dxpath
0-5
. missing
gletwo_tbldxpath_mra Secondary gleason grade
always from medical records: table dxpath
0-5
. missing
glesum_tbldxpath_mra Gleason sum or score: gleone_tbldxpath_mra +
gletwo_tbldxpath_mra
0-10
. missing
psaclosest365 PSA value closest and within 1 year prior to
diagnosis date.
from medical records variable psatotal
(table tblpsatest)
if psatotal = ‘na’ then it is set to a missing
value
if psatotal had '>' or '<' instead of '='
then .003 is added or subtracted from
psatotal (e.g. 'psatotal < .1' becomes
'psatotal = .097')
0.1 – 4520,
. missing
bcstart_time242
Time biological specimens taken
From questionnaire “After Consent Forms
are Signed”
24 hour time derived. e.g. 1:15, 19:35
00:01 – 23:59,
. missing
Comments
1. Gleason grades and sums (scores) are recorded from the subject’s medical record. If no Gleason sum is
reported in the diagnostic biopsy table, Gleone, Gletwo and Glesum are missing. Note that for most
subjects who had a prostatectomy, a second set of Gleason grades and sum is also available.
2. The Gleason grades and sum are reported as indicated in a medical record. These are: the 1° Gleason
grade or pattern (assigned to the most predominant histologic pattern in the sample and listed first), the
2° Gleason grade or pattern (assigned to the second most predominant histologic pattern in the sample
and listed second) and the Gleason sum or score (the sum of the 1° and 2° Gleason grades, which may
sometimes be the only value listed). The primary grade is the first pattern of the sum. If there are more
than one positive sites, the pattern with highest Gleason sum is reported. If the sums are the same, the

ix
one with the higher primary grade is reported. For example, if someone has three positive sites: 3+3=6,
3+4=7, and 4+3=7, the Gleason 4+3=7 is reported and the 4 is the primary. See Medical Records
Abstraction Manual of Procedures for more information.
3. The PSA range of 365 days prior to diagnosis was set by the PCaP investigators.