PCAP- - CMEC Assessment Program PCAP-2010 Report on the Pan-Canadian Assessment of Mathematics,...
174
Pan-Canadian Assessment Program PCAP- Report on the Pan-Canadian Assessment of Report on the Pan-Canadian Assessment of Mathematics, Science, and Reading Mathematics, Science, and Reading
-
Upload
vuongxuyen -
Category
Documents
-
view
224 -
download
0
Transcript of PCAP- - CMEC Assessment Program PCAP-2010 Report on the Pan-Canadian Assessment of Mathematics,...
Pan-Canadian Assessment Program
PCAP-Report on the Pan-Canadian Assessment ofReport on the Pan-Canadian Assessment of
Mathematics, Science, and ReadingMathematics, Science, and Reading

Pan-Canadian Assessment Program
PCAP-2010
Report on the Pan-Canadian Assessment of Mathematics, Science, and Reading
The Council of Ministers of Education, Canada (CMEC) was formed in 1967 by the jurisdictional ministers responsible for education to provide a forum in which they could discuss matters of mutual interest, undertake educational initiatives cooperatively, and represent the interests of the provinces and territories with national educational organizations, the federal government, foreign governments, and international organizations. CMEC is the national voice for education in Canada and, through CMEC, the provinces and territories work collectively on common objectives in a broad range of activities at the elementary, secondary, and postsecondary levels.
Through the CMEC Secretariat, the Council serves as the organization in which ministries and departments of education undertake cooperatively the activities, projects, and initiatives of particular interest to all jurisdictions1. One of the activities on which they cooperate is the development and implementation of pan-Canadian testing based on contemporary research and best practices in the assessment of student achievement in core subjects.
Note of appreciationThe Council of Ministers of Education (Canada) would like to thank the students, teachers, and administrators whose participation in the Pan-Canadian Assessment Program ensured its success. The quality of your commitment has made this study possible. We are truly grateful for your contribution to a pan-Canadian understanding of educational policy and practices in mathematics, science, and reading among Grade 82 students.
Council of Ministers of Education, Canada 95 St. Clair West, Suite 1106 Toronto, Ontario M4V 1N6
Telephone: (416) 962-8100 Fax: (416) 962-2800 E-mail: [email protected] © 2011 Council of Ministers of Education, Canada
ISBN 978-0-88987-212-7
Ce rapport est également disponible en français.
Printed on recycled paper.
1 In this report, “ministry” includes “department”, and “jurisdictions” includes participating “provinces” and “territories.” 2 Grade 8 refers to Secondary Two in Quebec throughout this report.
iii
TAble of CoNTeNTs
What is the Pan-Canadian Assessment Program? � � � � � � � � � � � � � � � � � � � � � � � � � � � 1Goals � � � � � � � � � � � � � � � � � � � � � � � � � � � � � � � � � � � � � � � � � � � � � � � � � � � � � � � � � � � � � � � � � � � � � � � � � � � � � � � � � � � � � � � � � � � � � � � � � � � � � � � � � � � � � � � � 1
The development process � � � � � � � � � � � � � � � � � � � � � � � � � � � � � � � � � � � � � � � � � � � � � � � � � � � � � � � � � � � � � � � � � � � � � � � � � � � � � � � � � � � � 2
Design and development of contextual questionnaires � � � � � � � � � � � � � � � � � � � � � � � � � � � � � � � � � � � � � � � � � � � � � � 3
Features of the administration of the PCAP 2010 Mathematics Assessment � � � � � � � � � � � � � � � � � � � 4
Sampling � � � � � � � � � � � � � � � � � � � � � � � � � � � � � � � � � � � � � � � � � � � � � � � � � � � � � � � � � � � � � � � � � � � � � � � � � � � � � � � � � � � � � � � � � � � � � � � � � � � � � � � 4
Reporting results by language � � � � � � � � � � � � � � � � � � � � � � � � � � � � � � � � � � � � � � � � � � � � � � � � � � � � � � � � � � � � � � � � � � � � � � � � � � � � � � � 4
Participation � � � � � � � � � � � � � � � � � � � � � � � � � � � � � � � � � � � � � � � � � � � � � � � � � � � � � � � � � � � � � � � � � � � � � � � � � � � � � � � � � � � � � � � � � � � � � � � � � � � � 5
Scoring the student response booklets � � � � � � � � � � � � � � � � � � � � � � � � � � � � � � � � � � � � � � � � � � � � � � � � � � � � � � � � � � � � � � � � � � � � � � 6
Presentation of performance results � � � � � � � � � � � � � � � � � � � � � � � � � � � � � � � � � � � � � � � � � � � � � � � � � � � � � � � � � � � � � � � � � � � � � � � � 6
PCAP 2010 Mathematics Assessment � � � � � � � � � � � � � � � � � � � � � � � � � � � � � � � � � � � � � � � � � � � � � � � � � � � 7The primary domain – mathematics � � � � � � � � � � � � � � � � � � � � � � � � � � � � � � � � � � � � � � � � � � � � � � � � � � � � � � � � � � � � � � � � � � � � � � � 7
Assessment design � � � � � � � � � � � � � � � � � � � � � � � � � � � � � � � � � � � � � � � � � � � � � � � � � � � � � � � � � � � � � � � � � � � � � � � � � � � � � � � � � � � � � � � � � � � � � � 8
General design of the assessment � � � � � � � � � � � � � � � � � � � � � � � � � � � � � � � � � � � � � � � � � � � � � � � � � � � � � � � � � � � � � � � � � � � � � � � � � � � 8
Task characteristics � � � � � � � � � � � � � � � � � � � � � � � � � � � � � � � � � � � � � � � � � � � � � � � � � � � � � � � � � � � � � � � � � � � � � � � � � � � � � � � � � � � � � � � � � � � � 9
Item format and item type � � � � � � � � � � � � � � � � � � � � � � � � � � � � � � � � � � � � � � � � � � � � � � � � � � � � � � � � � � � � � � � � � � � � � � � � � � � � � � � � � 10
Selected-response items � � � � � � � � � � � � � � � � � � � � � � � � � � � � � � � � � � � � � � � � � � � � � � � � � � � � � � � � � � � � � � � � � � � � � � � � � � � � � � � � � � � � � 10
Constructed-response items � � � � � � � � � � � � � � � � � � � � � � � � � � � � � � � � � � � � � � � � � � � � � � � � � � � � � � � � � � � � � � � � � � � � � � � � � � � � � � � � 10
Specific considerations � � � � � � � � � � � � � � � � � � � � � � � � � � � � � � � � � � � � � � � � � � � � � � � � � � � � � � � � � � � � � � � � � � � � � � � � � � � � � � � � � � � � � � 10
What the assessment measures � � � � � � � � � � � � � � � � � � � � � � � � � � � � � � � � � � � � � � � � � � � � � � � � � � � � � � � � � � � � � � � � � � � � � � � � � � � 11
Specific conceptual and procedural knowledge being assessed � � � � � � � � � � � � � � � � � � � � � � � � � � � � � � � � � � � � � � � � 11
Table of specifications � � � � � � � � � � � � � � � � � � � � � � � � � � � � � � � � � � � � � � � � � � � � � � � � � � � � � � � � � � � � � � � � � � � � � � � � � � � � � � � � � � � � � � � � 17
Reporting the PCAP 2010 Mathematics Assessment results � � � � � � � � � � � � � � � � � � � � � � � � � � � � � � � � � � � � � � � � � � � 18
Reporting on performance scales � � � � � � � � � � � � � � � � � � � � � � � � � � � � � � � � � � � � � � � � � � � � � � � � � � � � � � � � � � � � � � � � � � � � � � � � � � 18
Reporting on processes � � � � � � � � � � � � � � � � � � � � � � � � � � � � � � � � � � � � � � � � � � � � � � � � � � � � � � � � � � � � � � � � � � � � � � � � � � � � � � � � � � � � � � 21
Pan-Canadian Results in Mathematics � � � � � � � � � � � � � � � � � � � � � � � � � � � � � � � � � � � � � � � � � � � � � � 23Results in mathematics by jurisdiction � � � � � � � � � � � � � � � � � � � � � � � � � � � � � � � � � � � � � � � � � � � � � � � � � � � � � � � � � � � � � � � � � � 24
Overall results by language � � � � � � � � � � � � � � � � � � � � � � � � � � � � � � � � � � � � � � � � � � � � � � � � � � � � � � � � � � � � � � � � � � � � � � � � � � � � � � � � 25
iv
Pan-Canadian results by levels of performance � � � � � � � � � � � � � � � � � � � � � � � � � � � � � � � � � � � � � � � � � � � � � � � � � � � � � � � 27
Percentage of students performing at each level, by language � � � � � � � � � � � � � � � � � � � � � � � � � � � � � � � � � 28
Pan-Canadian results in mathematics by gender � � � � � � � � � � � � � � � � � � � � � � � � � � � � � � � � � � � � � � � � � � � � � � � � � � � � 29
Pan-Canadian results in mathematics by subdomain � � � � � � � � � � � � � � � � � � � � � � � � � � � � � � � � � � � � � � � � � � � � � � � 30
Results by subdomain, by language � � � � � � � � � � � � � � � � � � � � � � � � � � � � � � � � � � � � � � � � � � � � � � � � � � � � � � � � � � � � � � � � � � � � � � � 32
Results for problem solving, by jurisdiction, by language � � � � � � � � � � � � � � � � � � � � � � � � � � � � � � � � � � � � � � � � � � � � � � � 34
Results for communication � � � � � � � � � � � � � � � � � � � � � � � � � � � � � � � � � � � � � � � � � � � � � � � � � � � � � � � � � � � � � � � � � � � � � � � � � � � � � � � � � 35
PCAP 2010 science and Reading Assessments � � � � � � � � � � � � � � � � � � � � � � � � � � � � � � � � 37Science assessment � � � � � � � � � � � � � � � � � � � � � � � � � � � � � � � � � � � � � � � � � � � � � � � � � � � � � � � � � � � � � � � � � � � � � � � � � � � � � � � � � � � � � � � � � � � 37
Describing the domain � � � � � � � � � � � � � � � � � � � � � � � � � � � � � � � � � � � � � � � � � � � � � � � � � � � � � � � � � � � � � � � � � � � � � � � � � � � � � � � � � � � � � � 37
Organization of the domain � � � � � � � � � � � � � � � � � � � � � � � � � � � � � � � � � � � � � � � � � � � � � � � � � � � � � � � � � � � � � � � � � � � � � � � � � � � � � � � 38
Reading assessment � � � � � � � � � � � � � � � � � � � � � � � � � � � � � � � � � � � � � � � � � � � � � � � � � � � � � � � � � � � � � � � � � � � � � � � � � � � � � � � � � � � � � � � � � � 39
Describing the domain � � � � � � � � � � � � � � � � � � � � � � � � � � � � � � � � � � � � � � � � � � � � � � � � � � � � � � � � � � � � � � � � � � � � � � � � � � � � � � � � � � � � � � 39
Science and reading results � � � � � � � � � � � � � � � � � � � � � � � � � � � � � � � � � � � � � � � � � � � � � � � � � � � � � � � � � � � � � � � � � � � � � � � � � � � � � � � � 39
Results in science by jurisdiction � � � � � � � � � � � � � � � � � � � � � � � � � � � � � � � � � � � � � � � � � � � � � � � � � � � � � � � � � � � � � � � � � � � � � � � � � � � 41
Results in reading by jurisdiction � � � � � � � � � � � � � � � � � � � � � � � � � � � � � � � � � � � � � � � � � � � � � � � � � � � � � � � � � � � � � � � � � � � � � � � � � � 42
Results in science by language � � � � � � � � � � � � � � � � � � � � � � � � � � � � � � � � � � � � � � � � � � � � � � � � � � � � � � � � � � � � � � � � � � � � � � � � � � � � � 43
Results in reading by language � � � � � � � � � � � � � � � � � � � � � � � � � � � � � � � � � � � � � � � � � � � � � � � � � � � � � � � � � � � � � � � � � � � � � � � � � � � � 44
Results in science and reading by gender � � � � � � � � � � � � � � � � � � � � � � � � � � � � � � � � � � � � � � � � � � � � � � � � � � � � � � � � � � � � � � � � � 45
Assessment Results by Jurisdiction � � � � � � � � � � � � � � � � � � � � � � � � � � � � � � � � � � � � � � � � � � � � � � � � � � � � � � 47
BRITISH COLUMBIA � � � � � � � � � � � � � � � � � � � � � � � � � � � � � � � � � � � � � � � � � � � � � � � � � � � � � � � � � � � � � � � � � � � � � � � � � � � � � � � � � � � � � � � � � � � 47
Context statement � � � � � � � � � � � � � � � � � � � � � � � � � � � � � � � � � � � � � � � � � � � � � � � � � � � � � � � � � � � � � � � � � � � � � � � � � � � � � � � � � � � � � � � � � � � � 47
Social context � � � � � � � � � � � � � � � � � � � � � � � � � � � � � � � � � � � � � � � � � � � � � � � � � � � � � � � � � � � � � � � � � � � � � � � � � � � � � � � � � � � � � � � � � � � � � � � � 47
Organization of the school system � � � � � � � � � � � � � � � � � � � � � � � � � � � � � � � � � � � � � � � � � � � � � � � � � � � � � � � � � � � � � � � � � � � � � � � � 47
Mathematics teaching � � � � � � � � � � � � � � � � � � � � � � � � � � � � � � � � � � � � � � � � � � � � � � � � � � � � � � � � � � � � � � � � � � � � � � � � � � � � � � � � � � � � � � 47
Mathematics assessment � � � � � � � � � � � � � � � � � � � � � � � � � � � � � � � � � � � � � � � � � � � � � � � � � � � � � � � � � � � � � � � � � � � � � � � � � � � � � � � � � � � 48
Results in mathematics � � � � � � � � � � � � � � � � � � � � � � � � � � � � � � � � � � � � � � � � � � � � � � � � � � � � � � � � � � � � � � � � � � � � � � � � � � � � � � � � � � � � � � 48
Science and reading results � � � � � � � � � � � � � � � � � � � � � � � � � � � � � � � � � � � � � � � � � � � � � � � � � � � � � � � � � � � � � � � � � � � � � � � � � � � � � � � � 52
ALBERTA � � � � � � � � � � � � � � � � � � � � � � � � � � � � � � � � � � � � � � � � � � � � � � � � � � � � � � � � � � � � � � � � � � � � � � � � � � � � � � � � � � � � � � � � � � � � � � � � � � � � � � � � � � � 54
Context statement � � � � � � � � � � � � � � � � � � � � � � � � � � � � � � � � � � � � � � � � � � � � � � � � � � � � � � � � � � � � � � � � � � � � � � � � � � � � � � � � � � � � � � � � � � � � 54
Social context � � � � � � � � � � � � � � � � � � � � � � � � � � � � � � � � � � � � � � � � � � � � � � � � � � � � � � � � � � � � � � � � � � � � � � � � � � � � � � � � � � � � � � � � � � � � � � � � 54
v
Organization of the school system � � � � � � � � � � � � � � � � � � � � � � � � � � � � � � � � � � � � � � � � � � � � � � � � � � � � � � � � � � � � � � � � � � � � � � � � 54
Mathematics teaching � � � � � � � � � � � � � � � � � � � � � � � � � � � � � � � � � � � � � � � � � � � � � � � � � � � � � � � � � � � � � � � � � � � � � � � � � � � � � � � � � � � � � � 55
Mathematics assessment � � � � � � � � � � � � � � � � � � � � � � � � � � � � � � � � � � � � � � � � � � � � � � � � � � � � � � � � � � � � � � � � � � � � � � � � � � � � � � � � � � � 56
Results in mathematics � � � � � � � � � � � � � � � � � � � � � � � � � � � � � � � � � � � � � � � � � � � � � � � � � � � � � � � � � � � � � � � � � � � � � � � � � � � � � � � � � � � � � � 56
Science and reading results � � � � � � � � � � � � � � � � � � � � � � � � � � � � � � � � � � � � � � � � � � � � � � � � � � � � � � � � � � � � � � � � � � � � � � � � � � � � � � � � 60
SASKATCHEWAN � � � � � � � � � � � � � � � � � � � � � � � � � � � � � � � � � � � � � � � � � � � � � � � � � � � � � � � � � � � � � � � � � � � � � � � � � � � � � � � � � � � � � � � � � � � � � � � 62
Context statement � � � � � � � � � � � � � � � � � � � � � � � � � � � � � � � � � � � � � � � � � � � � � � � � � � � � � � � � � � � � � � � � � � � � � � � � � � � � � � � � � � � � � � � � � � � � 62
Social context � � � � � � � � � � � � � � � � � � � � � � � � � � � � � � � � � � � � � � � � � � � � � � � � � � � � � � � � � � � � � � � � � � � � � � � � � � � � � � � � � � � � � � � � � � � � � � � � 62
Organization of the school system � � � � � � � � � � � � � � � � � � � � � � � � � � � � � � � � � � � � � � � � � � � � � � � � � � � � � � � � � � � � � � � � � � � � � � � � 62
Mathematics teaching � � � � � � � � � � � � � � � � � � � � � � � � � � � � � � � � � � � � � � � � � � � � � � � � � � � � � � � � � � � � � � � � � � � � � � � � � � � � � � � � � � � � � � 62
Mathematics assessment � � � � � � � � � � � � � � � � � � � � � � � � � � � � � � � � � � � � � � � � � � � � � � � � � � � � � � � � � � � � � � � � � � � � � � � � � � � � � � � � � � � 63
Results in mathematics � � � � � � � � � � � � � � � � � � � � � � � � � � � � � � � � � � � � � � � � � � � � � � � � � � � � � � � � � � � � � � � � � � � � � � � � � � � � � � � � � � � � � � 63
Science and reading results � � � � � � � � � � � � � � � � � � � � � � � � � � � � � � � � � � � � � � � � � � � � � � � � � � � � � � � � � � � � � � � � � � � � � � � � � � � � � � � � 67
MANITOBA � � � � � � � � � � � � � � � � � � � � � � � � � � � � � � � � � � � � � � � � � � � � � � � � � � � � � � � � � � � � � � � � � � � � � � � � � � � � � � � � � � � � � � � � � � � � � � � � � � � � � � � 69
Context statement � � � � � � � � � � � � � � � � � � � � � � � � � � � � � � � � � � � � � � � � � � � � � � � � � � � � � � � � � � � � � � � � � � � � � � � � � � � � � � � � � � � � � � � � � � � � 69
Social context � � � � � � � � � � � � � � � � � � � � � � � � � � � � � � � � � � � � � � � � � � � � � � � � � � � � � � � � � � � � � � � � � � � � � � � � � � � � � � � � � � � � � � � � � � � � � � � � 69
Organization of the school system � � � � � � � � � � � � � � � � � � � � � � � � � � � � � � � � � � � � � � � � � � � � � � � � � � � � � � � � � � � � � � � � � � � � � � � � 69
Mathematics teaching � � � � � � � � � � � � � � � � � � � � � � � � � � � � � � � � � � � � � � � � � � � � � � � � � � � � � � � � � � � � � � � � � � � � � � � � � � � � � � � � � � � � � � 69
Mathematics assessment � � � � � � � � � � � � � � � � � � � � � � � � � � � � � � � � � � � � � � � � � � � � � � � � � � � � � � � � � � � � � � � � � � � � � � � � � � � � � � � � � � � 70
Results in mathematics � � � � � � � � � � � � � � � � � � � � � � � � � � � � � � � � � � � � � � � � � � � � � � � � � � � � � � � � � � � � � � � � � � � � � � � � � � � � � � � � � � � � � � 71
Science and reading results � � � � � � � � � � � � � � � � � � � � � � � � � � � � � � � � � � � � � � � � � � � � � � � � � � � � � � � � � � � � � � � � � � � � � � � � � � � � � � � � 75
ONTARIO � � � � � � � � � � � � � � � � � � � � � � � � � � � � � � � � � � � � � � � � � � � � � � � � � � � � � � � � � � � � � � � � � � � � � � � � � � � � � � � � � � � � � � � � � � � � � � � � � � � � � � � � � � 77
Context statement � � � � � � � � � � � � � � � � � � � � � � � � � � � � � � � � � � � � � � � � � � � � � � � � � � � � � � � � � � � � � � � � � � � � � � � � � � � � � � � � � � � � � � � � � � � � 77
Social context � � � � � � � � � � � � � � � � � � � � � � � � � � � � � � � � � � � � � � � � � � � � � � � � � � � � � � � � � � � � � � � � � � � � � � � � � � � � � � � � � � � � � � � � � � � � � � � � 77
Organization of the school system � � � � � � � � � � � � � � � � � � � � � � � � � � � � � � � � � � � � � � � � � � � � � � � � � � � � � � � � � � � � � � � � � � � � � � � � 77
Mathematics teaching � � � � � � � � � � � � � � � � � � � � � � � � � � � � � � � � � � � � � � � � � � � � � � � � � � � � � � � � � � � � � � � � � � � � � � � � � � � � � � � � � � � � � � 77
Mathematics assessment � � � � � � � � � � � � � � � � � � � � � � � � � � � � � � � � � � � � � � � � � � � � � � � � � � � � � � � � � � � � � � � � � � � � � � � � � � � � � � � � � � � 78
Results in mathematics � � � � � � � � � � � � � � � � � � � � � � � � � � � � � � � � � � � � � � � � � � � � � � � � � � � � � � � � � � � � � � � � � � � � � � � � � � � � � � � � � � � � � � 79
Science and reading results � � � � � � � � � � � � � � � � � � � � � � � � � � � � � � � � � � � � � � � � � � � � � � � � � � � � � � � � � � � � � � � � � � � � � � � � � � � � � � � � 83
QUEBEC � � � � � � � � � � � � � � � � � � � � � � � � � � � � � � � � � � � � � � � � � � � � � � � � � � � � � � � � � � � � � � � � � � � � � � � � � � � � � � � � � � � � � � � � � � � � � � � � � � � � � � � � � � � � 85
Context statement � � � � � � � � � � � � � � � � � � � � � � � � � � � � � � � � � � � � � � � � � � � � � � � � � � � � � � � � � � � � � � � � � � � � � � � � � � � � � � � � � � � � � � � � � � � � 85
Social context � � � � � � � � � � � � � � � � � � � � � � � � � � � � � � � � � � � � � � � � � � � � � � � � � � � � � � � � � � � � � � � � � � � � � � � � � � � � � � � � � � � � � � � � � � � � � � � � 85
vi
Organization of the school system � � � � � � � � � � � � � � � � � � � � � � � � � � � � � � � � � � � � � � � � � � � � � � � � � � � � � � � � � � � � � � � � � � � � � � � � 85
Mathematics teaching � � � � � � � � � � � � � � � � � � � � � � � � � � � � � � � � � � � � � � � � � � � � � � � � � � � � � � � � � � � � � � � � � � � � � � � � � � � � � � � � � � � � � � 86
Mathematics assessment � � � � � � � � � � � � � � � � � � � � � � � � � � � � � � � � � � � � � � � � � � � � � � � � � � � � � � � � � � � � � � � � � � � � � � � � � � � � � � � � � � � 86
Results in mathematics � � � � � � � � � � � � � � � � � � � � � � � � � � � � � � � � � � � � � � � � � � � � � � � � � � � � � � � � � � � � � � � � � � � � � � � � � � � � � � � � � � � � � � 87
Science and reading results � � � � � � � � � � � � � � � � � � � � � � � � � � � � � � � � � � � � � � � � � � � � � � � � � � � � � � � � � � � � � � � � � � � � � � � � � � � � � � � � 91
NEW BRUNSWICK � � � � � � � � � � � � � � � � � � � � � � � � � � � � � � � � � � � � � � � � � � � � � � � � � � � � � � � � � � � � � � � � � � � � � � � � � � � � � � � � � � � � � � � � � � � � � 93
Context statement � � � � � � � � � � � � � � � � � � � � � � � � � � � � � � � � � � � � � � � � � � � � � � � � � � � � � � � � � � � � � � � � � � � � � � � � � � � � � � � � � � � � � � � � � � � 93
Social context � � � � � � � � � � � � � � � � � � � � � � � � � � � � � � � � � � � � � � � � � � � � � � � � � � � � � � � � � � � � � � � � � � � � � � � � � � � � � � � � � � � � � � � � � � � � � � � � 93
Organization of the school system � � � � � � � � � � � � � � � � � � � � � � � � � � � � � � � � � � � � � � � � � � � � � � � � � � � � � � � � � � � � � � � � � � � � � � � � 93
Mathematics teaching � � � � � � � � � � � � � � � � � � � � � � � � � � � � � � � � � � � � � � � � � � � � � � � � � � � � � � � � � � � � � � � � � � � � � � � � � � � � � � � � � � � � � � 94
Mathematics assessment � � � � � � � � � � � � � � � � � � � � � � � � � � � � � � � � � � � � � � � � � � � � � � � � � � � � � � � � � � � � � � � � � � � � � � � � � � � � � � � � � � � 94
Results in mathematics � � � � � � � � � � � � � � � � � � � � � � � � � � � � � � � � � � � � � � � � � � � � � � � � � � � � � � � � � � � � � � � � � � � � � � � � � � � � � � � � � � � � � � 95
Science and reading results � � � � � � � � � � � � � � � � � � � � � � � � � � � � � � � � � � � � � � � � � � � � � � � � � � � � � � � � � � � � � � � � � � � � � � � � � � � � � � � � 98
NOVA SCOTIA � � � � � � � � � � � � � � � � � � � � � � � � � � � � � � � � � � � � � � � � � � � � � � � � � � � � � � � � � � � � � � � � � � � � � � � � � � � � � � � � � � � � � � � � � � � � � � � � � 101
Context statement � � � � � � � � � � � � � � � � � � � � � � � � � � � � � � � � � � � � � � � � � � � � � � � � � � � � � � � � � � � � � � � � � � � � � � � � � � � � � � � � � � � � � � � � � 101
Social context � � � � � � � � � � � � � � � � � � � � � � � � � � � � � � � � � � � � � � � � � � � � � � � � � � � � � � � � � � � � � � � � � � � � � � � � � � � � � � � � � � � � � � � � � � � � � � 101
Organization of the school system � � � � � � � � � � � � � � � � � � � � � � � � � � � � � � � � � � � � � � � � � � � � � � � � � � � � � � � � � � � � � � � � � � � � � � 101
Mathematics teaching � � � � � � � � � � � � � � � � � � � � � � � � � � � � � � � � � � � � � � � � � � � � � � � � � � � � � � � � � � � � � � � � � � � � � � � � � � � � � � � � � � � � 101
Mathematics assessment � � � � � � � � � � � � � � � � � � � � � � � � � � � � � � � � � � � � � � � � � � � � � � � � � � � � � � � � � � � � � � � � � � � � � � � � � � � � � � � � � 102
Results in mathematics � � � � � � � � � � � � � � � � � � � � � � � � � � � � � � � � � � � � � � � � � � � � � � � � � � � � � � � � � � � � � � � � � � � � � � � � � � � � � � � � � � � � 103
Science and reading results � � � � � � � � � � � � � � � � � � � � � � � � � � � � � � � � � � � � � � � � � � � � � � � � � � � � � � � � � � � � � � � � � � � � � � � � � � � � � � 107
PRINCE EDWARD ISLAND� � � � � � � � � � � � � � � � � � � � � � � � � � � � � � � � � � � � � � � � � � � � � � � � � � � � � � � � � � � � � � � � � � � � � � � � � � � � � � � � � 109
Context statement � � � � � � � � � � � � � � � � � � � � � � � � � � � � � � � � � � � � � � � � � � � � � � � � � � � � � � � � � � � � � � � � � � � � � � � � � � � � � � � � � � � � � � � � � � 109
Social context � � � � � � � � � � � � � � � � � � � � � � � � � � � � � � � � � � � � � � � � � � � � � � � � � � � � � � � � � � � � � � � � � � � � � � � � � � � � � � � � � � � � � � � � � � � � � � 109
Organization of the school system � � � � � � � � � � � � � � � � � � � � � � � � � � � � � � � � � � � � � � � � � � � � � � � � � � � � � � � � � � � � � � � � � � � � � � 109
Mathematics teaching � � � � � � � � � � � � � � � � � � � � � � � � � � � � � � � � � � � � � � � � � � � � � � � � � � � � � � � � � � � � � � � � � � � � � � � � � � � � � � � � � � � � 109
Mathematics assessment � � � � � � � � � � � � � � � � � � � � � � � � � � � � � � � � � � � � � � � � � � � � � � � � � � � � � � � � � � � � � � � � � � � � � � � � � � � � � � � � � 109
Results in mathematics � � � � � � � � � � � � � � � � � � � � � � � � � � � � � � � � � � � � � � � � � � � � � � � � � � � � � � � � � � � � � � � � � � � � � � � � � � � � � � � � � � � � 110
Science and reading results � � � � � � � � � � � � � � � � � � � � � � � � � � � � � � � � � � � � � � � � � � � � � � � � � � � � � � � � � � � � � � � � � � � � � � � � � � � � � � 112
NEWFOUNDLAND AND LABRADOR � � � � � � � � � � � � � � � � � � � � � � � � � � � � � � � � � � � � � � � � � � � � � � � � � � � � � � � � � � � � � � � � 113
Context statement � � � � � � � � � � � � � � � � � � � � � � � � � � � � � � � � � � � � � � � � � � � � � � � � � � � � � � � � � � � � � � � � � � � � � � � � � � � � � � � � � � � � � � � � � � 113
Social context � � � � � � � � � � � � � � � � � � � � � � � � � � � � � � � � � � � � � � � � � � � � � � � � � � � � � � � � � � � � � � � � � � � � � � � � � � � � � � � � � � � � � � � � � � � � � � 113
vii
Organization of the school system � � � � � � � � � � � � � � � � � � � � � � � � � � � � � � � � � � � � � � � � � � � � � � � � � � � � � � � � � � � � � � � � � � � � � � 113
Mathematics teaching � � � � � � � � � � � � � � � � � � � � � � � � � � � � � � � � � � � � � � � � � � � � � � � � � � � � � � � � � � � � � � � � � � � � � � � � � � � � � � � � � � � � 113
Mathematics assessment � � � � � � � � � � � � � � � � � � � � � � � � � � � � � � � � � � � � � � � � � � � � � � � � � � � � � � � � � � � � � � � � � � � � � � � � � � � � � � � � � 114
Results in mathematics � � � � � � � � � � � � � � � � � � � � � � � � � � � � � � � � � � � � � � � � � � � � � � � � � � � � � � � � � � � � � � � � � � � � � � � � � � � � � � � � � � � � 115
Science and reading results � � � � � � � � � � � � � � � � � � � � � � � � � � � � � � � � � � � � � � � � � � � � � � � � � � � � � � � � � � � � � � � � � � � � � � � � � � � � � � 117
YUKON � � � � � � � � � � � � � � � � � � � � � � � � � � � � � � � � � � � � � � � � � � � � � � � � � � � � � � � � � � � � � � � � � � � � � � � � � � � � � � � � � � � � � � � � � � � � � � � � � � � � � � � � � � � 118
Context statement � � � � � � � � � � � � � � � � � � � � � � � � � � � � � � � � � � � � � � � � � � � � � � � � � � � � � � � � � � � � � � � � � � � � � � � � � � � � � � � � � � � � � � � � � � 118
Social context � � � � � � � � � � � � � � � � � � � � � � � � � � � � � � � � � � � � � � � � � � � � � � � � � � � � � � � � � � � � � � � � � � � � � � � � � � � � � � � � � � � � � � � � � � � � � � 118
Organization of the school system � � � � � � � � � � � � � � � � � � � � � � � � � � � � � � � � � � � � � � � � � � � � � � � � � � � � � � � � � � � � � � � � � � � � � � 118
Mathematics teaching � � � � � � � � � � � � � � � � � � � � � � � � � � � � � � � � � � � � � � � � � � � � � � � � � � � � � � � � � � � � � � � � � � � � � � � � � � � � � � � � � � � � 119
Mathematics assessment � � � � � � � � � � � � � � � � � � � � � � � � � � � � � � � � � � � � � � � � � � � � � � � � � � � � � � � � � � � � � � � � � � � � � � � � � � � � � � � � � 119
Results in mathematics � � � � � � � � � � � � � � � � � � � � � � � � � � � � � � � � � � � � � � � � � � � � � � � � � � � � � � � � � � � � � � � � � � � � � � � � � � � � � � � � � � � � 120
Science and reading results � � � � � � � � � � � � � � � � � � � � � � � � � � � � � � � � � � � � � � � � � � � � � � � � � � � � � � � � � � � � � � � � � � � � � � � � � � � � � � 122
PCAP 2010 Questionnaires � � � � � � � � � � � � � � � � � � � � � � � � � � � � � � � � � � � � � � � � � � � � � � � � � � � � � � � � � � � � � � � � � 123Core questions � � � � � � � � � � � � � � � � � � � � � � � � � � � � � � � � � � � � � � � � � � � � � � � � � � � � � � � � � � � � � � � � � � � � � � � � � � � � � � � � � � � � � � � � � � � � � � � 123
Gender differences in mathematics � � � � � � � � � � � � � � � � � � � � � � � � � � � � � � � � � � � � � � � � � � � � � � � � � � � � � � � � � � � � � � � � � � � � � � 123
Time allocation and use � � � � � � � � � � � � � � � � � � � � � � � � � � � � � � � � � � � � � � � � � � � � � � � � � � � � � � � � � � � � � � � � � � � � � � � � � � � � � � � � � � 124
Special needs � � � � � � � � � � � � � � � � � � � � � � � � � � � � � � � � � � � � � � � � � � � � � � � � � � � � � � � � � � � � � � � � � � � � � � � � � � � � � � � � � � � � � � � � � � � � � � 124
Assessment programs � � � � � � � � � � � � � � � � � � � � � � � � � � � � � � � � � � � � � � � � � � � � � � � � � � � � � � � � � � � � � � � � � � � � � � � � � � � � � � � � � � � � 124
Attitudes/Motivations � � � � � � � � � � � � � � � � � � � � � � � � � � � � � � � � � � � � � � � � � � � � � � � � � � � � � � � � � � � � � � � � � � � � � � � � � � � � � � � � � � � � � 124
Student learning strategies � � � � � � � � � � � � � � � � � � � � � � � � � � � � � � � � � � � � � � � � � � � � � � � � � � � � � � � � � � � � � � � � � � � � � � � � � � � � � � 125
Teaching strategies � � � � � � � � � � � � � � � � � � � � � � � � � � � � � � � � � � � � � � � � � � � � � � � � � � � � � � � � � � � � � � � � � � � � � � � � � � � � � � � � � � � � � � 125
Opportunity to learn � � � � � � � � � � � � � � � � � � � � � � � � � � � � � � � � � � � � � � � � � � � � � � � � � � � � � � � � � � � � � � � � � � � � � � � � � � � � � � � � � � � � � � 125
Comparison of Reading Results: 2010 to 2007 � � � � � � � � � � � � � � � � � � � � � � � � � � � � � � 127
Conclusions � � � � � � � � � � � � � � � � � � � � � � � � � � � � � � � � � � � � � � � � � � � � � � � � � � � � � � � � � � � � � � � � � � � � � � � � � � � � � � � � � � � � � � � � � � � � � 133Overview of results � � � � � � � � � � � � � � � � � � � � � � � � � � � � � � � � � � � � � � � � � � � � � � � � � � � � � � � � � � � � � � � � � � � � � � � � � � � � � � � � � � � � � � � � � 133
Test design � � � � � � � � � � � � � � � � � � � � � � � � � � � � � � � � � � � � � � � � � � � � � � � � � � � � � � � � � � � � � � � � � � � � � � � � � � � � � � � � � � � � � � � � � � � � � � � � � 133
Performance � � � � � � � � � � � � � � � � � � � � � � � � � � � � � � � � � � � � � � � � � � � � � � � � � � � � � � � � � � � � � � � � � � � � � � � � � � � � � � � � � � � � � � � � � � � � � � � 133
Performance by gender � � � � � � � � � � � � � � � � � � � � � � � � � � � � � � � � � � � � � � � � � � � � � � � � � � � � � � � � � � � � � � � � � � � � � � � � � � � � � � � � � � � 134
Pan-Canadian results by subdomain in mathematics � � � � � � � � � � � � � � � � � � � � � � � � � � � � � � � � � � � � � � � � � � � � � � � � 134
Pan-Canadian results by process in mathematics � � � � � � � � � � � � � � � � � � � � � � � � � � � � � � � � � � � � � � � � � � � � � � � � � � � � � 134
Performance comparisons in reading over time � � � � � � � � � � � � � � � � � � � � � � � � � � � � � � � � � � � � � � � � � � � � � � � � � � � � � � � 135
Final statement � � � � � � � � � � � � � � � � � � � � � � � � � � � � � � � � � � � � � � � � � � � � � � � � � � � � � � � � � � � � � � � � � � � � � � � � � � � � � � � � � � � � � � � � � � � � � � 135
viii
lisT of TAbles ANd ChARTs
What is the Pan-Canadian Assessment Program? Table 1-1 Actual and prospective PCAP administrations � � � � � � � � � � � � � � � � � � � � � � � � � � � � � � � � � � � � � � � � � � � � � � � � � � � � � � 1
PCAP 2010 Mathematics AssessmentTable 2-1 Distribution of items by subdomain � � � � � � � � � � � � � � � � � � � � � � � � � � � � � � � � � � � � � � � � � � � � � � � � � � � � � � � � � � � � � � � � � 17
Table 2-2 Distribution of items by cognitive demand � � � � � � � � � � � � � � � � � � � � � � � � � � � � � � � � � � � � � � � � � � � � � � � � � � � � � � � � � 17
Pan-Canadian Results in Mathematics Chart 3-1 Mean scores by jurisdiction in mathematics � � � � � � � � � � � � � � � � � � � � � � � � � � � � � � � � � � � � � � � � � � � � � � � � � � � � � � � � 24
Table 3-1 Pan-Canadian results in mathematics — English � � � � � � � � � � � � � � � � � � � � � � � � � � � � � � � � � � � � � � � � � � � � � � � � � � � 25
Table 3-2 Pan-Canadian results in mathematics — French � � � � � � � � � � � � � � � � � � � � � � � � � � � � � � � � � � � � � � � � � � � � � � � � � � � 26
Chart 3-2 Percentage of students at each level of performance by jurisdiction � � � � � � � � � � � � � � � � � � � � � � � � � � � � � 27
Table 3-3 Levels of performance in mathematics by language — English � � � � � � � � � � � � � � � � � � � � � � � � � � � � � � � � � � � 28
Table 3-4 Levels of performance in mathematics by language — French � � � � � � � � � � � � � � � � � � � � � � � � � � � � � � � � � � � 28
Chart 3-3 Comparison of overall Canadian mean score by gender � � � � � � � � � � � � � � � � � � � � � � � � � � � � � � � � � � � � � � � � � � 29
Table 3-5 Comparison of overall Canadian student performance by level, by gender � � � � � � � � � � � � � � � � � � � � � 29
Chart 3-4 Results by subdomain � � � � � � � � � � � � � � � � � � � � � � � � � � � � � � � � � � � � � � � � � � � � � � � � � � � � � � � � � � � � � � � � � � � � � � � � � � � � � � � � 30
Table 3-6 Results by subdomain, by gender � � � � � � � � � � � � � � � � � � � � � � � � � � � � � � � � � � � � � � � � � � � � � � � � � � � � � � � � � � � � � � � � � � � 31
Table 3-7 Results by subdomain, by language — English � � � � � � � � � � � � � � � � � � � � � � � � � � � � � � � � � � � � � � � � � � � � � � � � � � � � � 32
Table 3-8 Results by subdomain, by language — French � � � � � � � � � � � � � � � � � � � � � � � � � � � � � � � � � � � � � � � � � � � � � � � � � � � � � 33
Chart 3-5 Problem-solving results by jurisdiction and by language � � � � � � � � � � � � � � � � � � � � � � � � � � � � � � � � � � � � � � � � � � 34
Chart 3-6 Mean score and percentage of students for each communication code � � � � � � � � � � � � � � � � � � � � � � � � � 35
PCAP science and Reading Assessments 2010Chart 4-1 Mean scores for Canadian jurisdictions in science � � � � � � � � � � � � � � � � � � � � � � � � � � � � � � � � � � � � � � � � � � � � � � � � � 41
Chart 4-2 Mean scores for Canadian jurisdictions in reading � � � � � � � � � � � � � � � � � � � � � � � � � � � � � � � � � � � � � � � � � � � � � � � � � 42
Table 4-1 Mean scores by population: science — English � � � � � � � � � � � � � � � � � � � � � � � � � � � � � � � � � � � � � � � � � � � � � � � � � � � � 43
Table 4-2 Mean scores by population: science — French � � � � � � � � � � � � � � � � � � � � � � � � � � � � � � � � � � � � � � � � � � � � � � � � � � � � � 43
Table 4-3 Mean scores by population: reading — English � � � � � � � � � � � � � � � � � � � � � � � � � � � � � � � � � � � � � � � � � � � � � � � � � � � � 44
Table 4-4 Mean scores by population: reading — French � � � � � � � � � � � � � � � � � � � � � � � � � � � � � � � � � � � � � � � � � � � � � � � � � � � � 44
Chart 4-3 Mean scores in science by gender � � � � � � � � � � � � � � � � � � � � � � � � � � � � � � � � � � � � � � � � � � � � � � � � � � � � � � � � � � � � � � � � � � � 45
Chart 4-4 Mean scores in reading by gender � � � � � � � � � � � � � � � � � � � � � � � � � � � � � � � � � � � � � � � � � � � � � � � � � � � � � � � � � � � � � � � � � � 45
ix
Assessment Results by Jurisdiction
BRITISH COLUMBIACanada — british Columbia: Mean scores in mathematics
Chart BC1 � � � � � � � � � � � � � � � � � � � � � � � � � � � � � � � � � � � � � � � � � � � � � � � � � � � � � � � � � � � � � � � � � � � � � � � � � � � � � � � � � � � � � � � � � � � � � � � � � � � � � � � � � � � 48
Canada — british Columbia: Comparison of results in mathematics by languageTable BC(E)1 � � � � � � � � � � � � � � � � � � � � � � � � � � � � � � � � � � � � � � � � � � � � � � � � � � � � � � � � � � � � � � � � � � � � � � � � � � � � � � � � � � � � � � � � � � � � � � � � � � � � � � � 49
Table BC(F)1 � � � � � � � � � � � � � � � � � � � � � � � � � � � � � � � � � � � � � � � � � � � � � � � � � � � � � � � � � � � � � � � � � � � � � � � � � � � � � � � � � � � � � � � � � � � � � � � � � � � � � � � � 49
Canada — british Columbia: Comparison of results in mathematics by levelsChart BC2 � � � � � � � � � � � � � � � � � � � � � � � � � � � � � � � � � � � � � � � � � � � � � � � � � � � � � � � � � � � � � � � � � � � � � � � � � � � � � � � � � � � � � � � � � � � � � � � � � � � � � � � � � � � 49
Canada — british Columbia: Comparison of results in mathematics by levels, by languageTable BC(E)2 � � � � � � � � � � � � � � � � � � � � � � � � � � � � � � � � � � � � � � � � � � � � � � � � � � � � � � � � � � � � � � � � � � � � � � � � � � � � � � � � � � � � � � � � � � � � � � � � � � � � � � � � 50
Table BC(F)2 � � � � � � � � � � � � � � � � � � � � � � � � � � � � � � � � � � � � � � � � � � � � � � � � � � � � � � � � � � � � � � � � � � � � � � � � � � � � � � � � � � � � � � � � � � � � � � � � � � � � � � � � 50
Canada — british Columbia: Comparison of results in mathematics by gender Chart BC3 � � � � � � � � � � � � � � � � � � � � � � � � � � � � � � � � � � � � � � � � � � � � � � � � � � � � � � � � � � � � � � � � � � � � � � � � � � � � � � � � � � � � � � � � � � � � � � � � � � � � � � � � � � � 50
Canada — british Columbia: Comparison of results in mathematics by subdomainTable BC3 � � � � � � � � � � � � � � � � � � � � � � � � � � � � � � � � � � � � � � � � � � � � � � � � � � � � � � � � � � � � � � � � � � � � � � � � � � � � � � � � � � � � � � � � � � � � � � � � � � � � � � � � � � � 51
Canada — british Columbia: Comparison of results in mathematics by subdomain, by languageTable BC4 � � � � � � � � � � � � � � � � � � � � � � � � � � � � � � � � � � � � � � � � � � � � � � � � � � � � � � � � � � � � � � � � � � � � � � � � � � � � � � � � � � � � � � � � � � � � � � � � � � � � � � � � � � � 51
Canada — british Columbia: Mean scores in scienceChart BC4 � � � � � � � � � � � � � � � � � � � � � � � � � � � � � � � � � � � � � � � � � � � � � � � � � � � � � � � � � � � � � � � � � � � � � � � � � � � � � � � � � � � � � � � � � � � � � � � � � � � � � � � � � � � 52
Canada — british Columbia: Mean scores in readingChart BC5 � � � � � � � � � � � � � � � � � � � � � � � � � � � � � � � � � � � � � � � � � � � � � � � � � � � � � � � � � � � � � � � � � � � � � � � � � � � � � � � � � � � � � � � � � � � � � � � � � � � � � � � � � � � 52
Canada — british Columbia: Comparison of results in science by language Table BC(E)5 � � � � � � � � � � � � � � � � � � � � � � � � � � � � � � � � � � � � � � � � � � � � � � � � � � � � � � � � � � � � � � � � � � � � � � � � � � � � � � � � � � � � � � � � � � � � � � � � � � � � � � � � 53
Table BC(F)5 � � � � � � � � � � � � � � � � � � � � � � � � � � � � � � � � � � � � � � � � � � � � � � � � � � � � � � � � � � � � � � � � � � � � � � � � � � � � � � � � � � � � � � � � � � � � � � � � � � � � � � � � 53
Canada — british Columbia: Comparison of results in reading by language Table BC(E)6 � � � � � � � � � � � � � � � � � � � � � � � � � � � � � � � � � � � � � � � � � � � � � � � � � � � � � � � � � � � � � � � � � � � � � � � � � � � � � � � � � � � � � � � � � � � � � � � � � � � � � � � � 53
Table BC(F)6 � � � � � � � � � � � � � � � � � � � � � � � � � � � � � � � � � � � � � � � � � � � � � � � � � � � � � � � � � � � � � � � � � � � � � � � � � � � � � � � � � � � � � � � � � � � � � � � � � � � � � � � � 53
ALBERTACanada — Alberta: Mean scores in mathematics
Chart AB1 � � � � � � � � � � � � � � � � � � � � � � � � � � � � � � � � � � � � � � � � � � � � � � � � � � � � � � � � � � � � � � � � � � � � � � � � � � � � � � � � � � � � � � � � � � � � � � � � � � � � � � � � � � � 56
Canada — Alberta: Comparison of results in mathematics by language Table AB(E)1 � � � � � � � � � � � � � � � � � � � � � � � � � � � � � � � � � � � � � � � � � � � � � � � � � � � � � � � � � � � � � � � � � � � � � � � � � � � � � � � � � � � � � � � � � � � � � � � � � � � � � � � � 57
Table AB(F)1 � � � � � � � � � � � � � � � � � � � � � � � � � � � � � � � � � � � � � � � � � � � � � � � � � � � � � � � � � � � � � � � � � � � � � � � � � � � � � � � � � � � � � � � � � � � � � � � � � � � � � � � � 57
Canada — Alberta: Comparison of results in mathematics by levelsChart AB2 � � � � � � � � � � � � � � � � � � � � � � � � � � � � � � � � � � � � � � � � � � � � � � � � � � � � � � � � � � � � � � � � � � � � � � � � � � � � � � � � � � � � � � � � � � � � � � � � � � � � � � � � � � � 57
Canada — Alberta: Comparison of results in mathematics by levels, by languageTable AB(E)2 � � � � � � � � � � � � � � � � � � � � � � � � � � � � � � � � � � � � � � � � � � � � � � � � � � � � � � � � � � � � � � � � � � � � � � � � � � � � � � � � � � � � � � � � � � � � � � � � � � � � � � � � 58
Table AB(F)2 � � � � � � � � � � � � � � � � � � � � � � � � � � � � � � � � � � � � � � � � � � � � � � � � � � � � � � � � � � � � � � � � � � � � � � � � � � � � � � � � � � � � � � � � � � � � � � � � � � � � � � � � 58
Canada — Alberta: Comparison of results in mathematics by gender Chart AB3 � � � � � � � � � � � � � � � � � � � � � � � � � � � � � � � � � � � � � � � � � � � � � � � � � � � � � � � � � � � � � � � � � � � � � � � � � � � � � � � � � � � � � � � � � � � � � � � � � � � � � � � � � � � 58
x
Canada — Alberta: Comparison of results in mathematics by subdomainTable AB3 � � � � � � � � � � � � � � � � � � � � � � � � � � � � � � � � � � � � � � � � � � � � � � � � � � � � � � � � � � � � � � � � � � � � � � � � � � � � � � � � � � � � � � � � � � � � � � � � � � � � � � � � � � � 59
Canada — Alberta: Comparison of results in mathematics by subdomain, by languageTable AB4 � � � � � � � � � � � � � � � � � � � � � � � � � � � � � � � � � � � � � � � � � � � � � � � � � � � � � � � � � � � � � � � � � � � � � � � � � � � � � � � � � � � � � � � � � � � � � � � � � � � � � � � � � � � 59
Canada — Alberta: Mean scores in scienceChart AB4 � � � � � � � � � � � � � � � � � � � � � � � � � � � � � � � � � � � � � � � � � � � � � � � � � � � � � � � � � � � � � � � � � � � � � � � � � � � � � � � � � � � � � � � � � � � � � � � � � � � � � � � � � � � 60
Canada — Alberta: Mean scores in readingChart AB5 � � � � � � � � � � � � � � � � � � � � � � � � � � � � � � � � � � � � � � � � � � � � � � � � � � � � � � � � � � � � � � � � � � � � � � � � � � � � � � � � � � � � � � � � � � � � � � � � � � � � � � � � � � � 60
Canada — Alberta: Comparison of results in science by languageTable AB(E)5 � � � � � � � � � � � � � � � � � � � � � � � � � � � � � � � � � � � � � � � � � � � � � � � � � � � � � � � � � � � � � � � � � � � � � � � � � � � � � � � � � � � � � � � � � � � � � � � � � � � � � � � � 61
Table AB(F)5 � � � � � � � � � � � � � � � � � � � � � � � � � � � � � � � � � � � � � � � � � � � � � � � � � � � � � � � � � � � � � � � � � � � � � � � � � � � � � � � � � � � � � � � � � � � � � � � � � � � � � � � � 61
Canada — Alberta: Comparison of results in reading by language Table AB(E)6 � � � � � � � � � � � � � � � � � � � � � � � � � � � � � � � � � � � � � � � � � � � � � � � � � � � � � � � � � � � � � � � � � � � � � � � � � � � � � � � � � � � � � � � � � � � � � � � � � � � � � � � � 61
Table AB(F)6 � � � � � � � � � � � � � � � � � � � � � � � � � � � � � � � � � � � � � � � � � � � � � � � � � � � � � � � � � � � � � � � � � � � � � � � � � � � � � � � � � � � � � � � � � � � � � � � � � � � � � � � � 61
SASKATCHEWANCanada — saskatchewan: Mean scores in mathematics
Chart SK1 � � � � � � � � � � � � � � � � � � � � � � � � � � � � � � � � � � � � � � � � � � � � � � � � � � � � � � � � � � � � � � � � � � � � � � � � � � � � � � � � � � � � � � � � � � � � � � � � � � � � � � � � � � � 63
Canada — saskatchewan: Comparison of results in mathematics by languageTable SK(E)1 � � � � � � � � � � � � � � � � � � � � � � � � � � � � � � � � � � � � � � � � � � � � � � � � � � � � � � � � � � � � � � � � � � � � � � � � � � � � � � � � � � � � � � � � � � � � � � � � � � � � � � � � � 64
Table SK(F)1 � � � � � � � � � � � � � � � � � � � � � � � � � � � � � � � � � � � � � � � � � � � � � � � � � � � � � � � � � � � � � � � � � � � � � � � � � � � � � � � � � � � � � � � � � � � � � � � � � � � � � � � � � 64
Canada — saskatchewan: Comparison of results in mathematics by levelsChart SK2 � � � � � � � � � � � � � � � � � � � � � � � � � � � � � � � � � � � � � � � � � � � � � � � � � � � � � � � � � � � � � � � � � � � � � � � � � � � � � � � � � � � � � � � � � � � � � � � � � � � � � � � � � � � 64
Canada — saskatchewan: Comparison of results in mathematics by levels, by languageTable SK(E)2 � � � � � � � � � � � � � � � � � � � � � � � � � � � � � � � � � � � � � � � � � � � � � � � � � � � � � � � � � � � � � � � � � � � � � � � � � � � � � � � � � � � � � � � � � � � � � � � � � � � � � � � � � 65
Table SK(F)2 � � � � � � � � � � � � � � � � � � � � � � � � � � � � � � � � � � � � � � � � � � � � � � � � � � � � � � � � � � � � � � � � � � � � � � � � � � � � � � � � � � � � � � � � � � � � � � � � � � � � � � � � � 65
Canada — saskatchewan: Comparison of results in mathematics by gender Chart SK3 � � � � � � � � � � � � � � � � � � � � � � � � � � � � � � � � � � � � � � � � � � � � � � � � � � � � � � � � � � � � � � � � � � � � � � � � � � � � � � � � � � � � � � � � � � � � � � � � � � � � � � � � � � � 65
Canada — saskatchewan: Comparison of results in mathematics by subdomainTable SK3 � � � � � � � � � � � � � � � � � � � � � � � � � � � � � � � � � � � � � � � � � � � � � � � � � � � � � � � � � � � � � � � � � � � � � � � � � � � � � � � � � � � � � � � � � � � � � � � � � � � � � � � � � � � � 66
Canada — saskatchewan: Comparison of results in mathematics by subdomain, by languageTable SK4 � � � � � � � � � � � � � � � � � � � � � � � � � � � � � � � � � � � � � � � � � � � � � � � � � � � � � � � � � � � � � � � � � � � � � � � � � � � � � � � � � � � � � � � � � � � � � � � � � � � � � � � � � � � � 66
Canada — saskatchewan: Mean scores in scienceChart SK4 � � � � � � � � � � � � � � � � � � � � � � � � � � � � � � � � � � � � � � � � � � � � � � � � � � � � � � � � � � � � � � � � � � � � � � � � � � � � � � � � � � � � � � � � � � � � � � � � � � � � � � � � � � � 67
Canada — saskatchewan: Mean scores in readingChart SK5 � � � � � � � � � � � � � � � � � � � � � � � � � � � � � � � � � � � � � � � � � � � � � � � � � � � � � � � � � � � � � � � � � � � � � � � � � � � � � � � � � � � � � � � � � � � � � � � � � � � � � � � � � � � 67
Canada — saskatchewan: Comparison of results in science by languageTable SK(E)5 � � � � � � � � � � � � � � � � � � � � � � � � � � � � � � � � � � � � � � � � � � � � � � � � � � � � � � � � � � � � � � � � � � � � � � � � � � � � � � � � � � � � � � � � � � � � � � � � � � � � � � � � � 68
Table SK(F)5 � � � � � � � � � � � � � � � � � � � � � � � � � � � � � � � � � � � � � � � � � � � � � � � � � � � � � � � � � � � � � � � � � � � � � � � � � � � � � � � � � � � � � � � � � � � � � � � � � � � � � � � � � 68
Canada — saskatchewan: Comparison of results in reading, by languageTable SK(E)6 � � � � � � � � � � � � � � � � � � � � � � � � � � � � � � � � � � � � � � � � � � � � � � � � � � � � � � � � � � � � � � � � � � � � � � � � � � � � � � � � � � � � � � � � � � � � � � � � � � � � � � � � � 68
Table SK(F)6 � � � � � � � � � � � � � � � � � � � � � � � � � � � � � � � � � � � � � � � � � � � � � � � � � � � � � � � � � � � � � � � � � � � � � � � � � � � � � � � � � � � � � � � � � � � � � � � � � � � � � � � � � 68
xi
MANITOBACanada — Manitoba: Mean scores in mathematics
Chart MB1 � � � � � � � � � � � � � � � � � � � � � � � � � � � � � � � � � � � � � � � � � � � � � � � � � � � � � � � � � � � � � � � � � � � � � � � � � � � � � � � � � � � � � � � � � � � � � � � � � � � � � � � � � � 71
Canada — Manitoba: Comparison of results in mathematics by language Table MB(E)1 � � � � � � � � � � � � � � � � � � � � � � � � � � � � � � � � � � � � � � � � � � � � � � � � � � � � � � � � � � � � � � � � � � � � � � � � � � � � � � � � � � � � � � � � � � � � � � � � � � � � � � � � 71
Table MB(F)1 � � � � � � � � � � � � � � � � � � � � � � � � � � � � � � � � � � � � � � � � � � � � � � � � � � � � � � � � � � � � � � � � � � � � � � � � � � � � � � � � � � � � � � � � � � � � � � � � � � � � � � � � 71
Canada — Manitoba: Comparison of results in mathematics by levelsChart MB2 � � � � � � � � � � � � � � � � � � � � � � � � � � � � � � � � � � � � � � � � � � � � � � � � � � � � � � � � � � � � � � � � � � � � � � � � � � � � � � � � � � � � � � � � � � � � � � � � � � � � � � � � � � 72
Canada — Manitoba: Comparison of results in mathematics by levels, by languageTable MB(E)2 � � � � � � � � � � � � � � � � � � � � � � � � � � � � � � � � � � � � � � � � � � � � � � � � � � � � � � � � � � � � � � � � � � � � � � � � � � � � � � � � � � � � � � � � � � � � � � � � � � � � � � � � 72
Table MB(F)2 � � � � � � � � � � � � � � � � � � � � � � � � � � � � � � � � � � � � � � � � � � � � � � � � � � � � � � � � � � � � � � � � � � � � � � � � � � � � � � � � � � � � � � � � � � � � � � � � � � � � � � � � 72
Canada — Manitoba: Comparison of results in mathematics by gender Chart MB3 � � � � � � � � � � � � � � � � � � � � � � � � � � � � � � � � � � � � � � � � � � � � � � � � � � � � � � � � � � � � � � � � � � � � � � � � � � � � � � � � � � � � � � � � � � � � � � � � � � � � � � � � � � 73
Canada — Manitoba: Comparison of results in mathematics by subdomainTable MB3 � � � � � � � � � � � � � � � � � � � � � � � � � � � � � � � � � � � � � � � � � � � � � � � � � � � � � � � � � � � � � � � � � � � � � � � � � � � � � � � � � � � � � � � � � � � � � � � � � � � � � � � � � � � 74
Canada — Manitoba: Comparison of results in mathematics by subdomain, by languageTable MB4 � � � � � � � � � � � � � � � � � � � � � � � � � � � � � � � � � � � � � � � � � � � � � � � � � � � � � � � � � � � � � � � � � � � � � � � � � � � � � � � � � � � � � � � � � � � � � � � � � � � � � � � � � � � 74
Canada — Manitoba: Mean scores in scienceChart MB4 � � � � � � � � � � � � � � � � � � � � � � � � � � � � � � � � � � � � � � � � � � � � � � � � � � � � � � � � � � � � � � � � � � � � � � � � � � � � � � � � � � � � � � � � � � � � � � � � � � � � � � � � � � 75
Canada — Manitoba: Mean scores in readingChart MB5 � � � � � � � � � � � � � � � � � � � � � � � � � � � � � � � � � � � � � � � � � � � � � � � � � � � � � � � � � � � � � � � � � � � � � � � � � � � � � � � � � � � � � � � � � � � � � � � � � � � � � � � � � � 75
Canada — Manitoba: Comparison of results in science by language Table MB(E)5 � � � � � � � � � � � � � � � � � � � � � � � � � � � � � � � � � � � � � � � � � � � � � � � � � � � � � � � � � � � � � � � � � � � � � � � � � � � � � � � � � � � � � � � � � � � � � � � � � � � � � � � � 76
Table MB(F)5 � � � � � � � � � � � � � � � � � � � � � � � � � � � � � � � � � � � � � � � � � � � � � � � � � � � � � � � � � � � � � � � � � � � � � � � � � � � � � � � � � � � � � � � � � � � � � � � � � � � � � � � � 76
Canada — Manitoba: Comparison of results in reading by language Table MB(E)6 � � � � � � � � � � � � � � � � � � � � � � � � � � � � � � � � � � � � � � � � � � � � � � � � � � � � � � � � � � � � � � � � � � � � � � � � � � � � � � � � � � � � � � � � � � � � � � � � � � � � � � � � 76
Table MB(F)6 � � � � � � � � � � � � � � � � � � � � � � � � � � � � � � � � � � � � � � � � � � � � � � � � � � � � � � � � � � � � � � � � � � � � � � � � � � � � � � � � � � � � � � � � � � � � � � � � � � � � � � � � 76
ONTARIOCanada — ontario: Mean scores in mathematics
Chart ON1 � � � � � � � � � � � � � � � � � � � � � � � � � � � � � � � � � � � � � � � � � � � � � � � � � � � � � � � � � � � � � � � � � � � � � � � � � � � � � � � � � � � � � � � � � � � � � � � � � � � � � � � � � � 79
Canada — ontario: Comparison of results in mathematics by language Table ON(E)1 � � � � � � � � � � � � � � � � � � � � � � � � � � � � � � � � � � � � � � � � � � � � � � � � � � � � � � � � � � � � � � � � � � � � � � � � � � � � � � � � � � � � � � � � � � � � � � � � � � � � � � � 79
Table ON(F)1 � � � � � � � � � � � � � � � � � � � � � � � � � � � � � � � � � � � � � � � � � � � � � � � � � � � � � � � � � � � � � � � � � � � � � � � � � � � � � � � � � � � � � � � � � � � � � � � � � � � � � � � 79
Canada — ontario: Comparison of results in mathematics by levelsChart ON2 � � � � � � � � � � � � � � � � � � � � � � � � � � � � � � � � � � � � � � � � � � � � � � � � � � � � � � � � � � � � � � � � � � � � � � � � � � � � � � � � � � � � � � � � � � � � � � � � � � � � � � � � � � 80
Canada — ontario: Comparison of results in mathematics by levels, by languageTable ON(E)2 � � � � � � � � � � � � � � � � � � � � � � � � � � � � � � � � � � � � � � � � � � � � � � � � � � � � � � � � � � � � � � � � � � � � � � � � � � � � � � � � � � � � � � � � � � � � � � � � � � � � � � � 80
Table ON(F)2 � � � � � � � � � � � � � � � � � � � � � � � � � � � � � � � � � � � � � � � � � � � � � � � � � � � � � � � � � � � � � � � � � � � � � � � � � � � � � � � � � � � � � � � � � � � � � � � � � � � � � � � 80
Canada — ontario: Comparison of results in mathematics by gender Chart ON3 � � � � � � � � � � � � � � � � � � � � � � � � � � � � � � � � � � � � � � � � � � � � � � � � � � � � � � � � � � � � � � � � � � � � � � � � � � � � � � � � � � � � � � � � � � � � � � � � � � � � � � � � � � 81
Canada — ontario: Comparison of results in mathematics by subdomainTable ON3 � � � � � � � � � � � � � � � � � � � � � � � � � � � � � � � � � � � � � � � � � � � � � � � � � � � � � � � � � � � � � � � � � � � � � � � � � � � � � � � � � � � � � � � � � � � � � � � � � � � � � � � � � � 81
xii
Canada — ontario: Comparison of results in mathematics by subdomain, by languageTable ON4 � � � � � � � � � � � � � � � � � � � � � � � � � � � � � � � � � � � � � � � � � � � � � � � � � � � � � � � � � � � � � � � � � � � � � � � � � � � � � � � � � � � � � � � � � � � � � � � � � � � � � � � � � � 82
Canada — ontario: Mean scores in scienceChart ON4 � � � � � � � � � � � � � � � � � � � � � � � � � � � � � � � � � � � � � � � � � � � � � � � � � � � � � � � � � � � � � � � � � � � � � � � � � � � � � � � � � � � � � � � � � � � � � � � � � � � � � � � � � � 83
Canada — ontario: Mean scores in readingChart ON5 � � � � � � � � � � � � � � � � � � � � � � � � � � � � � � � � � � � � � � � � � � � � � � � � � � � � � � � � � � � � � � � � � � � � � � � � � � � � � � � � � � � � � � � � � � � � � � � � � � � � � � � � � � 83
Canada — ontario: Comparison of results in science by languageTable ON(E)5 � � � � � � � � � � � � � � � � � � � � � � � � � � � � � � � � � � � � � � � � � � � � � � � � � � � � � � � � � � � � � � � � � � � � � � � � � � � � � � � � � � � � � � � � � � � � � � � � � � � � � � � 84
Table ON(F)5 � � � � � � � � � � � � � � � � � � � � � � � � � � � � � � � � � � � � � � � � � � � � � � � � � � � � � � � � � � � � � � � � � � � � � � � � � � � � � � � � � � � � � � � � � � � � � � � � � � � � � � � 84
Canada — ontario: Comparison of results in reading by language Table ON(E)6 � � � � � � � � � � � � � � � � � � � � � � � � � � � � � � � � � � � � � � � � � � � � � � � � � � � � � � � � � � � � � � � � � � � � � � � � � � � � � � � � � � � � � � � � � � � � � � � � � � � � � � � 84
Table ON(F)6 � � � � � � � � � � � � � � � � � � � � � � � � � � � � � � � � � � � � � � � � � � � � � � � � � � � � � � � � � � � � � � � � � � � � � � � � � � � � � � � � � � � � � � � � � � � � � � � � � � � � � � � 84
QUEBECCanada — Quebec: Mean scores in mathematics
Chart QC1 � � � � � � � � � � � � � � � � � � � � � � � � � � � � � � � � � � � � � � � � � � � � � � � � � � � � � � � � � � � � � � � � � � � � � � � � � � � � � � � � � � � � � � � � � � � � � � � � � � � � � � � � � � 87
Canada — Quebec: Comparison of results in mathematics by language Table QC(F)1 � � � � � � � � � � � � � � � � � � � � � � � � � � � � � � � � � � � � � � � � � � � � � � � � � � � � � � � � � � � � � � � � � � � � � � � � � � � � � � � � � � � � � � � � � � � � � � � � � � � � � � � � 87
Table QC(E)1 � � � � � � � � � � � � � � � � � � � � � � � � � � � � � � � � � � � � � � � � � � � � � � � � � � � � � � � � � � � � � � � � � � � � � � � � � � � � � � � � � � � � � � � � � � � � � � � � � � � � � � � � 87
Canada — Quebec: Comparison of results in mathematics by levelsChart QC2 � � � � � � � � � � � � � � � � � � � � � � � � � � � � � � � � � � � � � � � � � � � � � � � � � � � � � � � � � � � � � � � � � � � � � � � � � � � � � � � � � � � � � � � � � � � � � � � � � � � � � � � � � � 88
Canada — Quebec: Comparison of results in mathematics by levels, by languageTable QC(F)2 � � � � � � � � � � � � � � � � � � � � � � � � � � � � � � � � � � � � � � � � � � � � � � � � � � � � � � � � � � � � � � � � � � � � � � � � � � � � � � � � � � � � � � � � � � � � � � � � � � � � � � � � 88
Table QC(E)2 � � � � � � � � � � � � � � � � � � � � � � � � � � � � � � � � � � � � � � � � � � � � � � � � � � � � � � � � � � � � � � � � � � � � � � � � � � � � � � � � � � � � � � � � � � � � � � � � � � � � � � � � 88
Canada — Quebec: Comparison of results in mathematics by gender Chart QC3 � � � � � � � � � � � � � � � � � � � � � � � � � � � � � � � � � � � � � � � � � � � � � � � � � � � � � � � � � � � � � � � � � � � � � � � � � � � � � � � � � � � � � � � � � � � � � � � � � � � � � � � � � � 89
Canada — Quebec: Comparison of results in mathematics by subdomainTable QC3 � � � � � � � � � � � � � � � � � � � � � � � � � � � � � � � � � � � � � � � � � � � � � � � � � � � � � � � � � � � � � � � � � � � � � � � � � � � � � � � � � � � � � � � � � � � � � � � � � � � � � � � � � � � 90
Canada — Quebec: Comparison of results in mathematics by subdomain, by languageTable QC4 � � � � � � � � � � � � � � � � � � � � � � � � � � � � � � � � � � � � � � � � � � � � � � � � � � � � � � � � � � � � � � � � � � � � � � � � � � � � � � � � � � � � � � � � � � � � � � � � � � � � � � � � � � � 90
Canada — Quebec: Mean scores in scienceChart QC4 � � � � � � � � � � � � � � � � � � � � � � � � � � � � � � � � � � � � � � � � � � � � � � � � � � � � � � � � � � � � � � � � � � � � � � � � � � � � � � � � � � � � � � � � � � � � � � � � � � � � � � � � � � 91
Canada — Quebec: Mean scores in readingChart QC5 � � � � � � � � � � � � � � � � � � � � � � � � � � � � � � � � � � � � � � � � � � � � � � � � � � � � � � � � � � � � � � � � � � � � � � � � � � � � � � � � � � � � � � � � � � � � � � � � � � � � � � � � � � 91
Canada — Quebec: Comparison of results in science by language Table QC(F)5 � � � � � � � � � � � � � � � � � � � � � � � � � � � � � � � � � � � � � � � � � � � � � � � � � � � � � � � � � � � � � � � � � � � � � � � � � � � � � � � � � � � � � � � � � � � � � � � � � � � � � � � � 92
Table QC(E)5 � � � � � � � � � � � � � � � � � � � � � � � � � � � � � � � � � � � � � � � � � � � � � � � � � � � � � � � � � � � � � � � � � � � � � � � � � � � � � � � � � � � � � � � � � � � � � � � � � � � � � � � � 92
Canada — Quebec: Comparison of results in reading by language Table QC(F)6 � � � � � � � � � � � � � � � � � � � � � � � � � � � � � � � � � � � � � � � � � � � � � � � � � � � � � � � � � � � � � � � � � � � � � � � � � � � � � � � � � � � � � � � � � � � � � � � � � � � � � � � � 92
Table QC(E)6 � � � � � � � � � � � � � � � � � � � � � � � � � � � � � � � � � � � � � � � � � � � � � � � � � � � � � � � � � � � � � � � � � � � � � � � � � � � � � � � � � � � � � � � � � � � � � � � � � � � � � � � � 92
NEW BRUNSWICKCanada — New brunswick: Mean scores in mathematics
Chart NB1 � � � � � � � � � � � � � � � � � � � � � � � � � � � � � � � � � � � � � � � � � � � � � � � � � � � � � � � � � � � � � � � � � � � � � � � � � � � � � � � � � � � � � � � � � � � � � � � � � � � � � � � � � � � 95
xiii
Canada — New brunswick: Comparison of results in mathematics by language Table NB(E)1 � � � � � � � � � � � � � � � � � � � � � � � � � � � � � � � � � � � � � � � � � � � � � � � � � � � � � � � � � � � � � � � � � � � � � � � � � � � � � � � � � � � � � � � � � � � � � � � � � � � � � � � � 95
Table NB(F)1 � � � � � � � � � � � � � � � � � � � � � � � � � � � � � � � � � � � � � � � � � � � � � � � � � � � � � � � � � � � � � � � � � � � � � � � � � � � � � � � � � � � � � � � � � � � � � � � � � � � � � � � � 95
Canada — New brunswick: Comparison of results in mathematics by levelsChart NB2 � � � � � � � � � � � � � � � � � � � � � � � � � � � � � � � � � � � � � � � � � � � � � � � � � � � � � � � � � � � � � � � � � � � � � � � � � � � � � � � � � � � � � � � � � � � � � � � � � � � � � � � � � � � 96
Canada — New brunswick: Comparison of results in mathematics by levels, by languageTable NB(E)2 � � � � � � � � � � � � � � � � � � � � � � � � � � � � � � � � � � � � � � � � � � � � � � � � � � � � � � � � � � � � � � � � � � � � � � � � � � � � � � � � � � � � � � � � � � � � � � � � � � � � � � � � 96
Table NB(F)2 � � � � � � � � � � � � � � � � � � � � � � � � � � � � � � � � � � � � � � � � � � � � � � � � � � � � � � � � � � � � � � � � � � � � � � � � � � � � � � � � � � � � � � � � � � � � � � � � � � � � � � � � 96
Canada — New brunswick: Comparison of results in mathematics by gender Chart NB3 � � � � � � � � � � � � � � � � � � � � � � � � � � � � � � � � � � � � � � � � � � � � � � � � � � � � � � � � � � � � � � � � � � � � � � � � � � � � � � � � � � � � � � � � � � � � � � � � � � � � � � � � � � � 97
Canada — New brunswick: Comparison of results in mathematics by subdomainTable NB3 � � � � � � � � � � � � � � � � � � � � � � � � � � � � � � � � � � � � � � � � � � � � � � � � � � � � � � � � � � � � � � � � � � � � � � � � � � � � � � � � � � � � � � � � � � � � � � � � � � � � � � � � � � � 98
Canada — New brunswick: Comparison of results in mathematics by subdomain, by languageTable NB4 � � � � � � � � � � � � � � � � � � � � � � � � � � � � � � � � � � � � � � � � � � � � � � � � � � � � � � � � � � � � � � � � � � � � � � � � � � � � � � � � � � � � � � � � � � � � � � � � � � � � � � � � � � � 98
Canada — New brunswick: Mean scores in scienceChart NB4 � � � � � � � � � � � � � � � � � � � � � � � � � � � � � � � � � � � � � � � � � � � � � � � � � � � � � � � � � � � � � � � � � � � � � � � � � � � � � � � � � � � � � � � � � � � � � � � � � � � � � � � � � � � 99
Canada — New brunswick: Mean scores in readingChart NB5 � � � � � � � � � � � � � � � � � � � � � � � � � � � � � � � � � � � � � � � � � � � � � � � � � � � � � � � � � � � � � � � � � � � � � � � � � � � � � � � � � � � � � � � � � � � � � � � � � � � � � � � � � � � 99
Canada — New brunswick: Comparison of results in science by language Table NB(E)5 � � � � � � � � � � � � � � � � � � � � � � � � � � � � � � � � � � � � � � � � � � � � � � � � � � � � � � � � � � � � � � � � � � � � � � � � � � � � � � � � � � � � � � � � � � � � � � � � � � � � � � 100
Table NB(F)5 � � � � � � � � � � � � � � � � � � � � � � � � � � � � � � � � � � � � � � � � � � � � � � � � � � � � � � � � � � � � � � � � � � � � � � � � � � � � � � � � � � � � � � � � � � � � � � � � � � � � � � 100
Canada — New brunswick: Comparison of results in reading by language Table NB(E)6 � � � � � � � � � � � � � � � � � � � � � � � � � � � � � � � � � � � � � � � � � � � � � � � � � � � � � � � � � � � � � � � � � � � � � � � � � � � � � � � � � � � � � � � � � � � � � � � � � � � � � � 100
Table NB(F)6 � � � � � � � � � � � � � � � � � � � � � � � � � � � � � � � � � � � � � � � � � � � � � � � � � � � � � � � � � � � � � � � � � � � � � � � � � � � � � � � � � � � � � � � � � � � � � � � � � � � � � � 100
NOVA SCOTIACanada — Nova scotia: Mean scores in mathematics
Chart NS1 � � � � � � � � � � � � � � � � � � � � � � � � � � � � � � � � � � � � � � � � � � � � � � � � � � � � � � � � � � � � � � � � � � � � � � � � � � � � � � � � � � � � � � � � � � � � � � � � � � � � � � � � � 103
Canada — Nova scotia: Comparison of results in mathematics by language Table NS(E)1 � � � � � � � � � � � � � � � � � � � � � � � � � � � � � � � � � � � � � � � � � � � � � � � � � � � � � � � � � � � � � � � � � � � � � � � � � � � � � � � � � � � � � � � � � � � � � � � � � � � � � � 103
Table NS(F)1 � � � � � � � � � � � � � � � � � � � � � � � � � � � � � � � � � � � � � � � � � � � � � � � � � � � � � � � � � � � � � � � � � � � � � � � � � � � � � � � � � � � � � � � � � � � � � � � � � � � � � � 103
Canada — Nova scotia: Comparison of results in mathematics by levelsChart NS2 � � � � � � � � � � � � � � � � � � � � � � � � � � � � � � � � � � � � � � � � � � � � � � � � � � � � � � � � � � � � � � � � � � � � � � � � � � � � � � � � � � � � � � � � � � � � � � � � � � � � � � � � � 104
Canada — Nova scotia: Comparison of results in mathematics by levels, by languageTable NS(E)2 � � � � � � � � � � � � � � � � � � � � � � � � � � � � � � � � � � � � � � � � � � � � � � � � � � � � � � � � � � � � � � � � � � � � � � � � � � � � � � � � � � � � � � � � � � � � � � � � � � � � � � 104
Table NS(F)2 � � � � � � � � � � � � � � � � � � � � � � � � � � � � � � � � � � � � � � � � � � � � � � � � � � � � � � � � � � � � � � � � � � � � � � � � � � � � � � � � � � � � � � � � � � � � � � � � � � � � � � 104
Canada — Nova scotia: Comparison of results in mathematics by gender Chart NS3 � � � � � � � � � � � � � � � � � � � � � � � � � � � � � � � � � � � � � � � � � � � � � � � � � � � � � � � � � � � � � � � � � � � � � � � � � � � � � � � � � � � � � � � � � � � � � � � � � � � � � � � � � 105
Canada — Nova scotia: Comparison of results in mathematics by subdomainTable NS3 � � � � � � � � � � � � � � � � � � � � � � � � � � � � � � � � � � � � � � � � � � � � � � � � � � � � � � � � � � � � � � � � � � � � � � � � � � � � � � � � � � � � � � � � � � � � � � � � � � � � � � � � � 106
Canada — Nova scotia: Comparison of results in mathematics by subdomain, by languageTable NS4 � � � � � � � � � � � � � � � � � � � � � � � � � � � � � � � � � � � � � � � � � � � � � � � � � � � � � � � � � � � � � � � � � � � � � � � � � � � � � � � � � � � � � � � � � � � � � � � � � � � � � � � � � 106
Canada — Nova scotia: Mean scores in scienceChart NS4 � � � � � � � � � � � � � � � � � � � � � � � � � � � � � � � � � � � � � � � � � � � � � � � � � � � � � � � � � � � � � � � � � � � � � � � � � � � � � � � � � � � � � � � � � � � � � � � � � � � � � � � � � 107
xiv
Canada — Nova scotia: Mean scores in readingChart NS5 � � � � � � � � � � � � � � � � � � � � � � � � � � � � � � � � � � � � � � � � � � � � � � � � � � � � � � � � � � � � � � � � � � � � � � � � � � � � � � � � � � � � � � � � � � � � � � � � � � � � � � � � � 107
Canada — Nova scotia: Comparison of results in science by language Table NS(E)5 � � � � � � � � � � � � � � � � � � � � � � � � � � � � � � � � � � � � � � � � � � � � � � � � � � � � � � � � � � � � � � � � � � � � � � � � � � � � � � � � � � � � � � � � � � � � � � � � � � � � � � 108
Table NS(F)5 � � � � � � � � � � � � � � � � � � � � � � � � � � � � � � � � � � � � � � � � � � � � � � � � � � � � � � � � � � � � � � � � � � � � � � � � � � � � � � � � � � � � � � � � � � � � � � � � � � � � � � 108
Canada — Nova scotia: Comparison of results in reading by language Table NS(E)6 � � � � � � � � � � � � � � � � � � � � � � � � � � � � � � � � � � � � � � � � � � � � � � � � � � � � � � � � � � � � � � � � � � � � � � � � � � � � � � � � � � � � � � � � � � � � � � � � � � � � � � 108
Table NS(F)6 � � � � � � � � � � � � � � � � � � � � � � � � � � � � � � � � � � � � � � � � � � � � � � � � � � � � � � � � � � � � � � � � � � � � � � � � � � � � � � � � � � � � � � � � � � � � � � � � � � � � � � 108
PRINCE EDWARD ISLANDCanada — Prince edward island: Mean scores in mathematics
Chart PE1 � � � � � � � � � � � � � � � � � � � � � � � � � � � � � � � � � � � � � � � � � � � � � � � � � � � � � � � � � � � � � � � � � � � � � � � � � � � � � � � � � � � � � � � � � � � � � � � � � � � � � � � � � � 110
Canada — Prince edward island: Comparison of results in mathematics by levelsChart PE2 � � � � � � � � � � � � � � � � � � � � � � � � � � � � � � � � � � � � � � � � � � � � � � � � � � � � � � � � � � � � � � � � � � � � � � � � � � � � � � � � � � � � � � � � � � � � � � � � � � � � � � � � � � 110
Canada — Prince edward island: Comparison of results in mathematics by gender Chart PE3 � � � � � � � � � � � � � � � � � � � � � � � � � � � � � � � � � � � � � � � � � � � � � � � � � � � � � � � � � � � � � � � � � � � � � � � � � � � � � � � � � � � � � � � � � � � � � � � � � � � � � � � � � � 111
Canada — Prince edward island: Comparison of results in mathematics by subdomainTable PE1 � � � � � � � � � � � � � � � � � � � � � � � � � � � � � � � � � � � � � � � � � � � � � � � � � � � � � � � � � � � � � � � � � � � � � � � � � � � � � � � � � � � � � � � � � � � � � � � � � � � � � � � � � � 111
Canada — Prince edward island: Mean scores in scienceChart PE4 � � � � � � � � � � � � � � � � � � � � � � � � � � � � � � � � � � � � � � � � � � � � � � � � � � � � � � � � � � � � � � � � � � � � � � � � � � � � � � � � � � � � � � � � � � � � � � � � � � � � � � � � � � 112
Canada — Prince edward island: Mean scores in readingChart PE5 � � � � � � � � � � � � � � � � � � � � � � � � � � � � � � � � � � � � � � � � � � � � � � � � � � � � � � � � � � � � � � � � � � � � � � � � � � � � � � � � � � � � � � � � � � � � � � � � � � � � � � � � � � 112
NEWFOUNDLAND AND LABRADOR Canada — Newfoundland and labrador: Mean scores in mathematics
Chart NL1 � � � � � � � � � � � � � � � � � � � � � � � � � � � � � � � � � � � � � � � � � � � � � � � � � � � � � � � � � � � � � � � � � � � � � � � � � � � � � � � � � � � � � � � � � � � � � � � � � � � � � � � � � 115
Canada — Newfoundland and labrador: Comparison of results in mathematics by levelsChart NL2 � � � � � � � � � � � � � � � � � � � � � � � � � � � � � � � � � � � � � � � � � � � � � � � � � � � � � � � � � � � � � � � � � � � � � � � � � � � � � � � � � � � � � � � � � � � � � � � � � � � � � � � � � 115
Canada — Newfoundland and labrador: Comparison of results in mathematics by gender Chart NL3 � � � � � � � � � � � � � � � � � � � � � � � � � � � � � � � � � � � � � � � � � � � � � � � � � � � � � � � � � � � � � � � � � � � � � � � � � � � � � � � � � � � � � � � � � � � � � � � � � � � � � � � � � 116
Canada — Newfoundland and labrador: Comparison of results in mathematics by subdomainTable NL1 � � � � � � � � � � � � � � � � � � � � � � � � � � � � � � � � � � � � � � � � � � � � � � � � � � � � � � � � � � � � � � � � � � � � � � � � � � � � � � � � � � � � � � � � � � � � � � � � � � � � � � � � � 116
Canada — Newfoundland and labrador: Mean scores in scienceChart NL4 � � � � � � � � � � � � � � � � � � � � � � � � � � � � � � � � � � � � � � � � � � � � � � � � � � � � � � � � � � � � � � � � � � � � � � � � � � � � � � � � � � � � � � � � � � � � � � � � � � � � � � � � � 117
Canada — Newfoundland and labrador: Mean scores in readingChart NL5 � � � � � � � � � � � � � � � � � � � � � � � � � � � � � � � � � � � � � � � � � � � � � � � � � � � � � � � � � � � � � � � � � � � � � � � � � � � � � � � � � � � � � � � � � � � � � � � � � � � � � � � � � 117
YUKONCanada — Yukon: Mean scores in mathematics
Chart YK1 � � � � � � � � � � � � � � � � � � � � � � � � � � � � � � � � � � � � � � � � � � � � � � � � � � � � � � � � � � � � � � � � � � � � � � � � � � � � � � � � � � � � � � � � � � � � � � � � � � � � � � � � � 120
Canada — Yukon: Comparison of results in mathematics by levelsChart YK2 � � � � � � � � � � � � � � � � � � � � � � � � � � � � � � � � � � � � � � � � � � � � � � � � � � � � � � � � � � � � � � � � � � � � � � � � � � � � � � � � � � � � � � � � � � � � � � � � � � � � � � � � � 120
Canada — Yukon: Comparison of results in mathematics by gender Chart YK3 � � � � � � � � � � � � � � � � � � � � � � � � � � � � � � � � � � � � � � � � � � � � � � � � � � � � � � � � � � � � � � � � � � � � � � � � � � � � � � � � � � � � � � � � � � � � � � � � � � � � � � � � � 121
xv
Canada — Yukon: Comparison of results in mathematics by subdomainTable YK1 � � � � � � � � � � � � � � � � � � � � � � � � � � � � � � � � � � � � � � � � � � � � � � � � � � � � � � � � � � � � � � � � � � � � � � � � � � � � � � � � � � � � � � � � � � � � � � � � � � � � � � � � � � 121
Canada — Yukon: Mean scores in scienceChart YK4 � � � � � � � � � � � � � � � � � � � � � � � � � � � � � � � � � � � � � � � � � � � � � � � � � � � � � � � � � � � � � � � � � � � � � � � � � � � � � � � � � � � � � � � � � � � � � � � � � � � � � � � � � 122
Canada — Yukon: Mean scores in readingChart YK5 � � � � � � � � � � � � � � � � � � � � � � � � � � � � � � � � � � � � � � � � � � � � � � � � � � � � � � � � � � � � � � � � � � � � � � � � � � � � � � � � � � � � � � � � � � � � � � � � � � � � � � � � � 122
Comparisons of Reading Results: 2010 to 2007Chart 7-1 Reading mean score comparisons overall, by language, by gender � � � � � � � � � � � � � � � � � � � � � � � � � � � � 128
Chart 7-2 Reading mean score comparisons 2010–2007 by jurisdiction � � � � � � � � � � � � � � � � � � � � � � � � � � � � � � � � � � 129
Chart 7-3 Reading mean score comparisons 2010–2007 by jurisdiction, by language � � � � � � � � � � � � � � � � � � � 130
Appendix
Mathematics
Table A-1 Pan-Canadian results in mathematics � � � � � � � � � � � � � � � � � � � � � � � � � � � � � � � � � � � � � � � � � � � � � � � � � � � � � � � � � � � � � 137
Table A-2 Pan-Canadian results in mathematics by language — English � � � � � � � � � � � � � � � � � � � � � � � � � � � � � � � � � � 137
Table A-3 Pan-Canadian results in mathematics by language — French � � � � � � � � � � � � � � � � � � � � � � � � � � � � � � � � � � � 138
Table A-4 Comparison of performance in mathematics by gender � � � � � � � � � � � � � � � � � � � � � � � � � � � � � � � � � � � � � � � � 138
Table A-5 Distribution of levels of performance in mathematics � � � � � � � � � � � � � � � � � � � � � � � � � � � � � � � � � � � � � � � � � � � 139
Table A-6 Distribution of levels of performance in mathematics by language — English� � � � � � � � � � � � � � � � � 139
Table A-7 Distribution of levels of performance in mathematics by language — French � � � � � � � � � � � � � � � � � 140
Table A-8 Distribution of levels of performance in mathematics by jurisdiction, by gender � � � � � � � � � � � � � � 140
Table A-9 Pan-Canadian results in mathematics by subdomain — numbers and operations � � � � � � � � � � � � � � � � � � � � � � � � � � � � � � � � � � � � � � � � � � � � � � � � � � � � � � � � � � � � � � � � � � � � � � � � � � � � 141
Table A-10 Pan-Canadian results in mathematics by subdomain — geometry and measurement � � � � � � � � � � � � � � � � � � � � � � � � � � � � � � � � � � � � � � � � � � � � � � � � � � � � � � � � � � � � � � � � � � � � � � � 141
Table A-11 Pan-Canadian results in mathematics by subdomain — patterns and relationships � � � � � � � � � � � � � � � � � � � � � � � � � � � � � � � � � � � � � � � � � � � � � � � � � � � � � � � � � � � � � � � � � � � � � � � � � � 142
Table A-12 Pan-Canadian results in mathematics by subdomain — data management and probability � � � � � � � � � � � � � � � � � � � � � � � � � � � � � � � � � � � � � � � � � � � � � � � � � � � � � � � � � � � � � � � � 142
Table A-13 Pan-Canadian results in mathematics by subdomain, by language (English) — numbers and operations � � � � � � � � � � � � � � � � � � � � � � � � � � � � � � � � � � � � � � � � � � � � � � � � � � � � � � � � � � � � � � � � � � � � � � � � � � � � 143
Table A-14 Pan-Canadian results in mathematics by subdomain, by language (English) — geometry and measurement � � � � � � � � � � � � � � � � � � � � � � � � � � � � � � � � � � � � � � � � � � � � � � � � � � � � � � � � � � � � � � � � � � � � � � � 143
Table A-15 Pan-Canadian results in mathematics by subdomain, by language (English) — patterns and relationships � � � � � � � � � � � � � � � � � � � � � � � � � � � � � � � � � � � � � � � � � � � � � � � � � � � � � � � � � � � � � � � � � � � � � � � � � � 144
Table A-16 Pan-Canadian results in mathematics by subdomain, by language (English) — data management and probability � � � � � � � � � � � � � � � � � � � � � � � � � � � � � � � � � � � � � � � � � � � � � � � � � � � � � � � � � � � � � � � � 144
Table A-17 Pan-Canadian results in mathematics by subdomain, by language (French) — numbers and operations � � � � � � � � � � � � � � � � � � � � � � � � � � � � � � � � � � � � � � � � � � � � � � � � � � � � � � � � � � � � � � � � � � � � � � � � � � � � 145
Table A-18 Pan-Canadian results in mathematics by subdomain, by language (French) — geometry and measurement � � � � � � � � � � � � � � � � � � � � � � � � � � � � � � � � � � � � � � � � � � � � � � � � � � � � � � � � � � � � � � � � � � � � � � � 145
Table A-19 Pan-Canadian results in mathematics by subdomain, by language (French) — patterns and relationships � � � � � � � � � � � � � � � � � � � � � � � � � � � � � � � � � � � � � � � � � � � � � � � � � � � � � � � � � � � � � � � � � � � � � � � � � � 145
xvi
Table A-20 Pan-Canadian results in mathematics by subdomain, by language (French) — data management and probability � � � � � � � � � � � � � � � � � � � � � � � � � � � � � � � � � � � � � � � � � � � � � � � � � � � � � � � � � � � � � � � � 146
Table A-21 Pan-Canadian results in mathematics by subdomain, by gender — numbers and operations � � � � � � � � � � � � � � � � � � � � � � � � � � � � � � � � � � � � � � � � � � � � � � � � � � � � � � � � � � � � � � � � � � � � � � � � � � � � 146
Table A-22 Pan-Canadian results in mathematics by subdomain, by gender — geometry and measurement � � � � � � � � � � � � � � � � � � � � � � � � � � � � � � � � � � � � � � � � � � � � � � � � � � � � � � � � � � � � � � � � � � � � � � � 147
Table A-23 Pan-Canadian results in mathematics by subdomain, by gender — patterns and relationships � � � � � � � � � � � � � � � � � � � � � � � � � � � � � � � � � � � � � � � � � � � � � � � � � � � � � � � � � � � � � � � � � � � � � � � � � � 147
Table A-24 Pan-Canadian results in mathematics by subdomain, by gender — data management and probability � � � � � � � � � � � � � � � � � � � � � � � � � � � � � � � � � � � � � � � � � � � � � � � � � � � � � � � � � � � � � � � � 148
science
Table A-25 Pan-Canadian results in science by jurisdiction � � � � � � � � � � � � � � � � � � � � � � � � � � � � � � � � � � � � � � � � � � � � � � � � � � � 149
Table A-26 Pan-Canadian results in science by jurisdiction, by language — English � � � � � � � � � � � � � � � � � � � � � � � � 149
Table A-27 Pan-Canadian results in science by jurisdiction, by language — French � � � � � � � � � � � � � � � � � � � � � � � � 150
Table A-28 Pan-Canadian results in science by jurisdiction, by gender � � � � � � � � � � � � � � � � � � � � � � � � � � � � � � � � � � � � � � 150
Reading
Table A-29 Pan-Canadian results in reading by jurisdiction � � � � � � � � � � � � � � � � � � � � � � � � � � � � � � � � � � � � � � � � � � � � � � � � � � � 151
Table A-30 Pan-Canadian results in reading by jurisdiction, by language — English � � � � � � � � � � � � � � � � � � � � � � � 151
Table A-31 Pan-Canadian results in reading by jurisdiction, by language — French � � � � � � � � � � � � � � � � � � � � � � � � 152
Table A-32 Pan-Canadian results in reading by jurisdiction, by gender � � � � � � � � � � � � � � � � � � � � � � � � � � � � � � � � � � � � � � 152
Table A-33 Reading mean score comparisons 2010–2007 by jurisdiction, by language � � � � � � � � � � � � � � � � � � � 153
student participation and exemption rates
Table A-34 Students’ participation rate by jurisdiction, by language � � � � � � � � � � � � � � � � � � � � � � � � � � � � � � � � � � � � � � � � 154
Table A-35 Students’ exemption rates � � � � � � � � � � � � � � � � � � � � � � � � � � � � � � � � � � � � � � � � � � � � � � � � � � � � � � � � � � � � � � � � � � � � � � � � � � 155
Table A-36 School response rates � � � � � � � � � � � � � � � � � � � � � � � � � � � � � � � � � � � � � � � � � � � � � � � � � � � � � � � � � � � � � � � � � � � � � � � � � � � � � � � 155
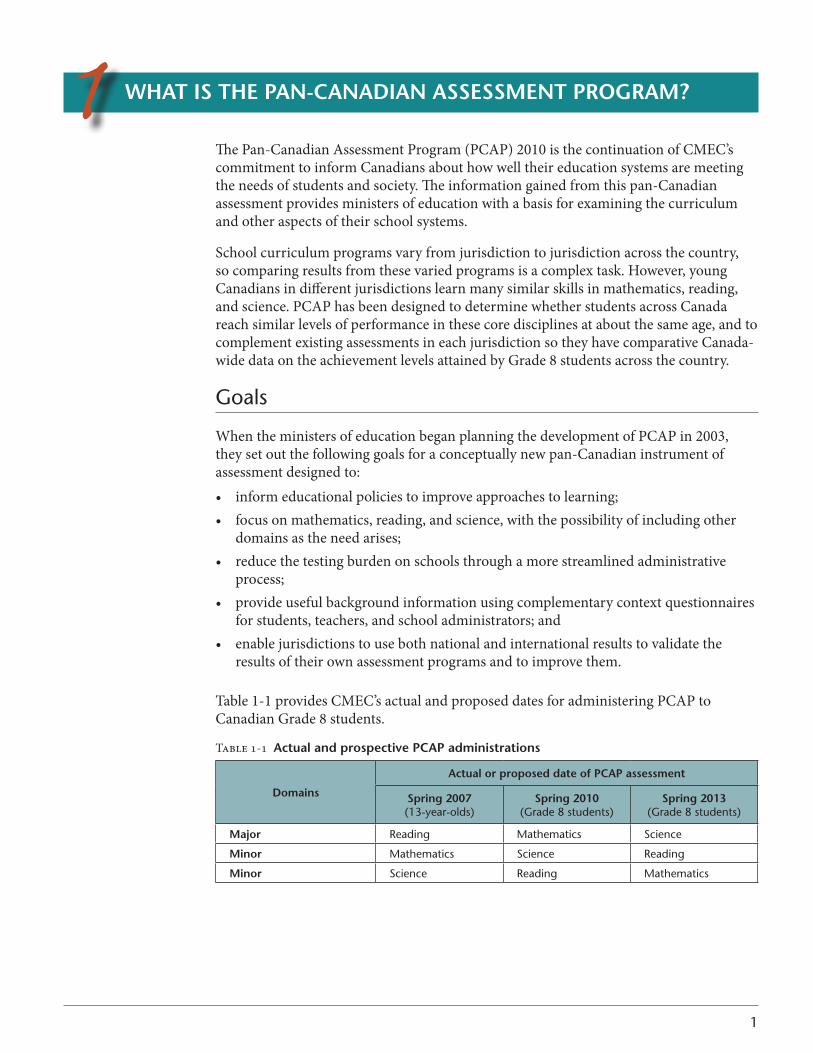
1
WhAT is The PAN-CANAdiAN AssessMeNT PRogRAM?
The Pan-Canadian Assessment Program (PCAP) 2010 is the continuation of CMEC’s commitment to inform Canadians about how well their education systems are meeting the needs of students and society. The information gained from this pan-Canadian assessment provides ministers of education with a basis for examining the curriculum and other aspects of their school systems.
School curriculum programs vary from jurisdiction to jurisdiction across the country, so comparing results from these varied programs is a complex task. However, young Canadians in different jurisdictions learn many similar skills in mathematics, reading, and science. PCAP has been designed to determine whether students across Canada reach similar levels of performance in these core disciplines at about the same age, and to complement existing assessments in each jurisdiction so they have comparative Canada-wide data on the achievement levels attained by Grade 8 students across the country.
Goals
When the ministers of education began planning the development of PCAP in 2003, they set out the following goals for a conceptually new pan-Canadian instrument of assessment designed to: • informeducationalpoliciestoimproveapproachestolearning;• focusonmathematics,reading,andscience,withthepossibilityofincludingother
domainsastheneedarises;• reducethetestingburdenonschoolsthroughamorestreamlinedadministrative
process;• provideusefulbackgroundinformationusingcomplementarycontextquestionnaires
forstudents,teachers,andschooladministrators;and• enablejurisdictionstousebothnationalandinternationalresultstovalidatethe
results of their own assessment programs and to improve them.
Table 1-1 provides CMEC’s actual and proposed dates for administering PCAP to Canadian Grade 8 students.
Table 1-1 Actual and prospective PCAP administrations
domains
Actual or proposed date of PCAP assessment
spring 2007(13-year-olds)
spring 2010(Grade 8 students)
spring 2013(Grade 8 students)
Major Reading Mathematics Science
Minor Mathematics Science Reading
Minor Science Reading Mathematics
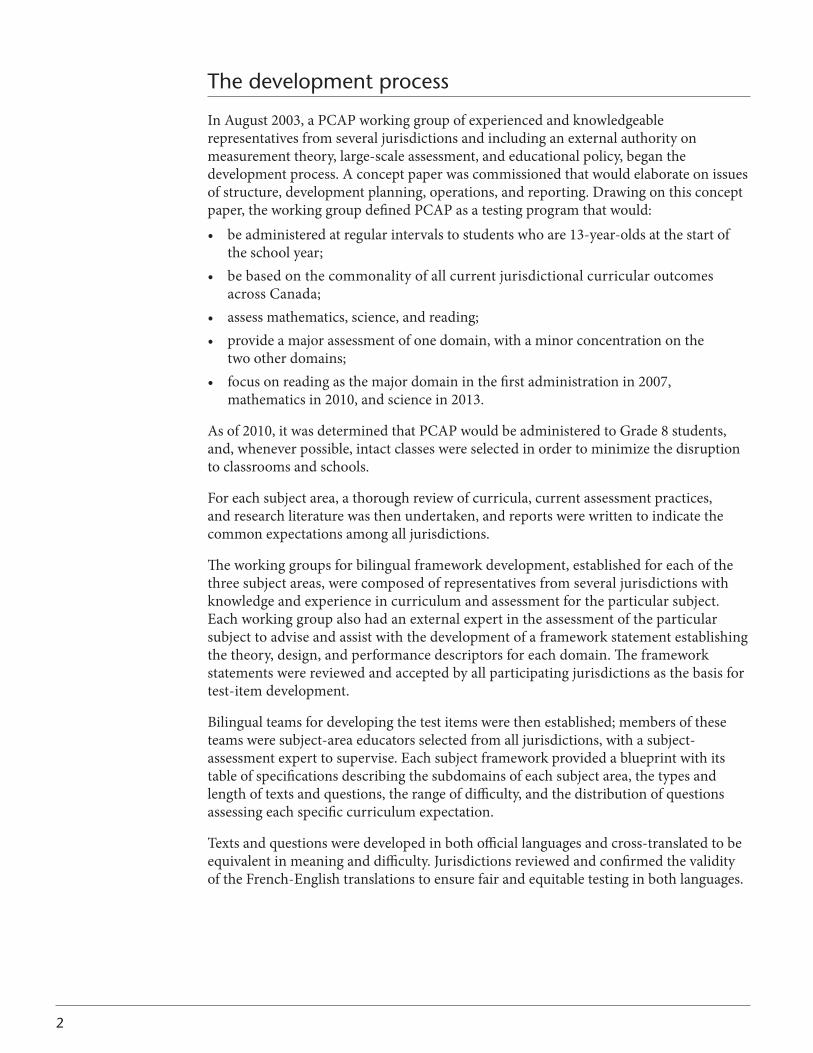
2
The development process
In August 2003, a PCAP working group of experienced and knowledgeable representatives from several jurisdictions and including an external authority on measurement theory, large-scale assessment, and educational policy, began the development process. A concept paper was commissioned that would elaborate on issues of structure, development planning, operations, and reporting. Drawing on this concept paper, the working group defined PCAP as a testing program that would: • beadministeredatregularintervalstostudentswhoare13-year-oldsatthestartof
theschoolyear;• bebasedonthecommonalityofallcurrentjurisdictionalcurricularoutcomes
acrossCanada;• assessmathematics,science,andreading;• provideamajorassessmentofonedomain,withaminorconcentrationonthe
twootherdomains;• focusonreadingasthemajordomaininthefirstadministrationin2007,
mathematics in 2010, and science in 2013.
As of 2010, it was determined that PCAP would be administered to Grade 8 students, and, whenever possible, intact classes were selected in order to minimize the disruption to classrooms and schools.
For each subject area, a thorough review of curricula, current assessment practices, and research literature was then undertaken, and reports were written to indicate the common expectations among all jurisdictions.
The working groups for bilingual framework development, established for each of the three subject areas, were composed of representatives from several jurisdictions with knowledge and experience in curriculum and assessment for the particular subject. Each working group also had an external expert in the assessment of the particular subject to advise and assist with the development of a framework statement establishing the theory, design, and performance descriptors for each domain. The framework statements were reviewed and accepted by all participating jurisdictions as the basis for test-item development.
Bilingualteamsfordevelopingthetestitemswerethenestablished;membersoftheseteams were subject-area educators selected from all jurisdictions, with a subject-assessment expert to supervise. Each subject framework provided a blueprint with its table of specifications describing the subdomains of each subject area, the types and lengthoftextsandquestions,therangeofdifficulty,andthedistributionofquestionsassessing each specific curriculum expectation.
Textsandquestionsweredevelopedinbothofficiallanguagesandcross-translatedtobeequivalentinmeaninganddifficulty.JurisdictionsreviewedandconfirmedthevalidityoftheFrench-Englishtranslationstoensurefairandequitabletestinginbothlanguages.
3
All new items were reviewed by outside validators and further revised by members of the item-development team. These texts and items were then submitted to the framework-development working group to be examined in light of the blueprint, and field-test bookletswereconsequentlyputtogether.Bookletscontainedbothselected-response andconstructed-responseitems.Theirrangeofdifficultywasdeemedaccessibleto Grade 8 students, based on scenarios meaningful to the age group and reflecting Canadian values, culture, and content.
Field testing involved the administration of these temporary forms to a representative sample of students from an appropriate range of jurisdictions in both languages. Approximately 2,000 students in 100 schools across Canada were involved in the field testing. The tests were then scored by teams of educators from the jurisdictions. Following analysis of the data from the field test, each framework-development working group reviewed all items and selected the texts and items considered best, from a content and statistical viewpoint, to form four 90-minute booklets.
Design and development of contextual questionnaires
Theaccompanyingquestionnairesforstudents,teachers,andschoolsweredesignedto provide jurisdictions with contextual information that would contribute to the interpretation of the performance results. Such information could also be examined and used by researchers, policy-makers, and practitioners to help determine what factors influence learning outcomes. Aquestionnairedevelopmentgroupcomprisingeducatorsandresearchexpertsfromselectedjurisdictionsdevelopedaframeworktoensurethatthequestionsaskedofstudents, teachers, and school principals were consistent with predetermined theoretical constructsorimportantresearchquestions.Thegroup:• reviewedmodelsofquestionnairedesignfoundinthethreelarge-scaleassessment
programs—theSchoolAchievementIndicatorsProgram(SAIP);theInternationalAssociation for the Evaluation of Educational Achievement (IEA) – Trends in InternationalMathematicsandScienceStudy(TIMSS);andtheProgrammeforInternationalStudentAssessment(PISA);
• maximizedresearchvaluebyshapingthequestionnairesaroundselectedresearchissues for the 2010 administration of the test.
Thequestionnaireswereadaptedandexpandedformathematicsasthemajordomain.
4
Features of the administration of the PCAP 2010 Mathematics Assessment
In the spring of 2010, the test was administered to a random sample of schools and Grade 8 classes (one per selected school) with a random assignment of booklets.
Sampling This assessment adopted the following stratified sampling process in the selection of participants: 1. the random selection of schools from each jurisdiction, drawn from a
completelistofpubliclyfundedschoolsprovidedbythejurisdiction;2. the random selection of Grade 8 classes, drawn from a list of all eligible
Grade8classeswithineachschool;3. theselectionofallstudentsenrolledintheselectedGrade8class;4. when intact Grade 8 classes could not be selected, a random selection of
Grade 8 students.
The sampling process refers to the way in which students were selected to write the assessment� It is necessary to select a large enough number of participants to allow for adequate representation of the population’s performance; the word “population” refers to all eligible students within a jurisdiction and/or a linguistic group�
In the case where numbers were smaller than the desired size, all schools and/or all Grade 8 classes meeting the criteria within the jurisdiction were selected. This approach ensuredthatwehadanadequatenumberofparticipantstoallowforreportingontheirachievement as if all students within the jurisdiction had participated.
The sampling process resulted in a very large sample of approximately 32,000 Grade 8 studentsparticipatingintheassessment.Allstudentsansweredquestionsinall three domains. Approximately 24,000 responded in English, and 8,000 in French.
Reporting results by language The results obtained from students educated in the French system of their respective jurisdiction are reported as French. The results obtained from students educated in the English system of their respective jurisdiction are reported as English. Results achieved by French immersion students who wrote in French are calculated as part of the English results since these students are considered to be part of the English-language cohort. All French and English students were expected to write for 90 minutes, with breaks deemed appropriate by the assessment administrator. If necessary, students were given an additional 30 minutes to complete the assessment. Then, they completed the context questionnaireatthebackoftheirtestbooklet.
5
ParticipationEach school received the assessment handbook that outlined the purposes of the assessment,theorganizationandadministrationrequirements,andsuggestionstoencourage the maximum possible participation. These suggestions included a common administration script to ensure that all students encountered the testing process in a similar manner, and provided guidelines for accommodating special-needs students. PCAP testing is intended to be as inclusive as possible in order to provide a complete picture of the range of performance for students in Grade 8. The students who were excusedfromparticipatingwereneverthelessrecordedforstatisticalpurposes;theyincluded those with functional disabilities, intellectual disabilities, socioemotional conditions, or limited language proficiency in the target language of the assessment.
Participation ratesIn large-scale assessments, participation rates are calculated in a variety of ways and are used to guide school administrators when determining whether the number of students who completed the assessment falls within the established norm set for all schools� In the case of PCAP, a formula for this purpose is provided to the test administrators, thereby ensuring that all schools use the same guidelines and that the set minimum of participating students is uniformly applied� Using this formula, the overall PCAP student participation rate was over 85 per cent� For additional information concerning student participation and sampling, refer to Table A-35 on page 155�
Schools were encouraged to prepare and motivate students for the test, aiming for positive participation and engagement in the process by teachers, students, and parents. The materials provided included information pamphlets for parents and students, as well as the school handbook.
Schools were also asked to have the Teacher Questionnaire completed by all the mathematics teachers of the participating students in the school, and the School Questionnairebytheschoolprincipal.Allquestionnaireswerelinkedtostudentresultsbutuseduniqueidentifierstopreserveconfidentiality.
6
Scoring the student response bookletsThe scoring was conducted concurrently in both languages in one location over a three-week period. After all student booklets had been submitted from the jurisdictions, the booklets were then scrambled into bundles of 10 so that any single bundle contained booklets from several jurisdictions. The scoring-administration team, the table leaders, and the scorers themselves came from several jurisdictions. The whole scoring process included:• aparalleltrainingofbothtableleadersandscorersineachsubjectarea;• abilingualcommitteewithresponsibilityforreviewingallinstrumentsandselecting
anchorpaperstoensurecomparabilityateverylevel;• twice-dailyrater-reliabilitychecksinwhichallscorersmarkedthesamestudentwork
inordertotracktheconsistencyofscoringonanimmediatebasis;• double-blindscoringinwhich300ofeachofthefourbookletswerereturnedtothe
scoring bundles to be re-scored, providing an overall inter-rater reliability score.
Presentation of performance results The results of student performance on the PCAP 2010 Mathematics Assessment for Grade 8 are presented in this report in two ways: as overall mean scores on the mathematics assessment and as the percentage of students attaining performance levels.
The performance levels represent how jurisdictional performances measured up to the expected level of achievement based on the performance of students in the subdomains of numbers and operations, geometry and measurement, patterns and relationships, and data management and probability. Descriptors of each performance level were developed by the working group prior to the test administration.
A standard-setting exercise involving a group of educators from each jurisdiction set the “cut scores” for each level using the “bookmark” method3;thatis,determiningtherelativedifficultyofthefullsetofassessmentinstrumentsanddelineatingthepointalong a scale that defines the achievement of each level of success, thus determining the “cut score.” Once suitable cut scores were set, student performance within the range of cut scores could be refined. These refined descriptors of performance-level results more clearly indicated what students should know and be able to do at each level.
The achievement results in the minor subject domains (science and reading) for all participating jurisdictions are reported as an overall mean score. Because the students responded to a small subset of items for these two minor subject areas, their results by subdomain or by performance level are not reported.
3 www.dpi.state.wi.us/oea/ctbbkmrk03.html
7
PCAP 2010 MATheMATiCs AssessMeNT
The primary domain – mathematics
For the purpose of this assessment, mathematics is broadly defined as a conceptual tool that students can use to increase their capacity to calculate, describe, and solve problems. The domain is divided into four strands or subdomains and five processes which are described below. The PCAP assessment focuses on curricular outcomes that are common to all participating Canadian jurisdictions at the Grade 8 level.
Regardless of the terms used to define mathematics, curricula across Canada are structured to enable students “to use mathematics in his or her personal life, in the workplace, and in further study. All students deserve an opportunity to understand the power and beauty of mathematics. Students need to learn a new set of mathematics basics that enable them to compute fluently and to solve problems creatively and resourcefully.”4
Many jurisdictions use the National Council of Teachers of Mathematics (NCTM) Principles and Standards for School Mathematics as a starting point for the development of their programs. The NCTM curriculum design recommends five organizing principles relating to content and five relating to process. The NCTM content strands include: numbers and operations, algebra, geometry, measurement, and data analysis and probability, while the process elements are based on problem-solving, reasoning and proof, communication, connections, and representation. Framework and development of the PCAP assessment was based on this NCTM source.
The PCAP mathematics domain is divided into four strands or subdomains as described below:• numbersandoperations(properties,equivalentrepresentations,andmagnitude);• geometryandmeasurement(propertiesof2-Dfiguresand3-Dshapes,relative
position,transformations,andmeasurement);• patternsandrelationships(patternsandalgebraicexpressions,linearrelations,and
equations);and• datamanagementandprobability(datacollectionandanalysis,experimentaland
theoretical probability).
These subdomains in turn involve the five processes listed below:• problemsolving• communication• representation• reasoningandproof• connections
4 www.nctm.org/standards/content.aspx?id=3044 downloaded October 7, 2010
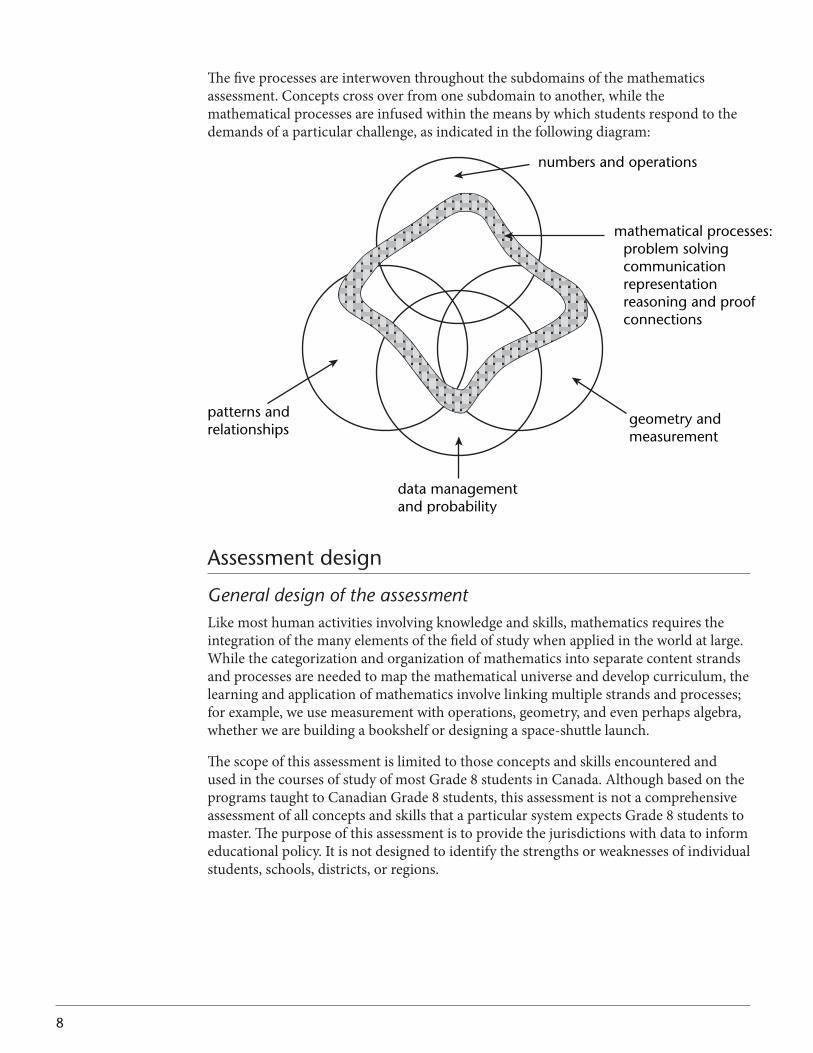
8
The five processes are interwoven throughout the subdomains of the mathematics assessment. Concepts cross over from one subdomain to another, while the mathematical processes are infused within the means by which students respond to the demands of a particular challenge, as indicated in the following diagram:
numbers and operations
mathematical processes: problem solving communication representation reasoning and proof connections
geometry andmeasurement
data managementand probability
patterns andrelationships
Assessment design
General design of the assessmentLikemosthumanactivitiesinvolvingknowledgeandskills,mathematicsrequirestheintegration of the many elements of the field of study when applied in the world at large. While the categorization and organization of mathematics into separate content strands and processes are needed to map the mathematical universe and develop curriculum, the learningandapplicationofmathematicsinvolvelinkingmultiplestrandsandprocesses;for example, we use measurement with operations, geometry, and even perhaps algebra, whether we are building a bookshelf or designing a space-shuttle launch.
The scope of this assessment is limited to those concepts and skills encountered and used in the courses of study of most Grade 8 students in Canada. Although based on the programs taught to Canadian Grade 8 students, this assessment is not a comprehensive assessment of all concepts and skills that a particular system expects Grade 8 students to master. The purpose of this assessment is to provide the jurisdictions with data to inform educational policy. It is not designed to identify the strengths or weaknesses of individual students, schools, districts, or regions.
9
Consequently,thePCAPassessmentinmathematicswasorganizedintoeightgroups,orclusters,withscenariosrequiringtheengagementofmultiplestrandsandprocesses.Theeight clusters were distributed within four booklets. Each booklet contained two clusters of mathematics items, one reading cluster, and one science cluster. The four booklets were distributed to students within a single class. Thus, every student completed two of the eight mathematics clusters of assessment items. In addition, all booklets contained a set of common items allowing for comparative measurements of student performance from one booklet to another.
Each PCAP mathematics cluster was composed of three to four scenarios with items spanning all four subdomains. Each scenario was comprised of one to six items assessing the various concepts and skills that are taught in mathematics and focused on their relevance for the context of the assessment cluster. Clusters were designed so that a student would need 90 minutes to complete all of the items in any one booklet. The clusters contained selected-response items and constructed-response items. The number of items per cluster varied slightly, depending on the distribution of item types in the cluster. No cluster contained only one type of item.
The assessment was designed at a reading level consistent with the literacy level expected of most Canadian Grade 8 students. Information in the items was presented in a variety of modes (e.g., graphically, in tables, symbolically). Because many jurisdictions in Canada assess the performance of both French- and English-language populations, English and French versions of the assessment were developed simultaneously and are consideredtobeequivalent.Inaddition,byassuringadequaterepresentativesamplingofthese groups, this assessment provides statistically valid information at the jurisdictional level and for each of these linguistic groups.
Task characteristicsOne area of concern for any low-stakes, large-scale assessment program is student motivation and engagement in the assessment. The contextualization of assessment items is often used to help encourage this engagement and motivation. Therefore, scenarios were drawn from situations that were considered relevant, appropriate, and sensible for Canadian Grade 8 students. The presentation of a scenario included a brief narrative and could include tables, charts, graphs, or diagrams. The desired effect was that scenarios be relevant to students’ interests and lives, and sensitive to linguistic and cultural differences. Some scenarios were taken from students’ personal lives, from school/sports/leisure activities, or, on a larger scale, from the community/society. Most of the scenarios were meant to emulate the world outside of the classroom.
10
Item format and item type
Selected-response itemsSelected-response (SR) items give the students specific choices from which they must select a response. Multiple-choice items include a stem statement with four choices, one of which is the correct answer, and three of which are carefully constructed distracters.
Constructed-response itemsConstructed-response(CR)itemsrequireresponsesrangingfromsinglewordsorphrases to extended, constructed responses of two to three sentences. For mathematics, these responses can also include symbols, numbers, graphs, diagrams, and calculations. Generally, there were two forms of constructed-response items. The “show your work” type asked students to clearly demonstrate how he or she arrived at the final solution to a particular problem. The “explain your reasoning” type asked the student to provide a clear explanation of the processes used to arrive at the solution to the problem.
Specific considerationsGuidelines for the use of calculators, computers, and manipulatives during the assessment are given below.
a) Use of calculators: This assessment did not focus on students’ ability to perform calculations but rather on their ability to choose the appropriate operation, to demonstrate their understanding, and to assess the relevance of their answer in a givensituation.Consequently,allstudentswereallowedtouseacalculator,preferablythe type they would normally use in their mathematics class.
b) Use of computers: Computers were not permitted for this assessment. Although computers have become commonplace in all Canadian schools, the large disparity between the types of computers available, their use as a teaching tool, and the students’ familiarity with software could contribute to a biased administration of the assessment if computers were to be permitted.
c) Use of manipulatives: The use of manipulatives as teaching tools is encouraged by all jurisdictions, and they should be found in all schools. Manipulatives help and support students in developing a better understanding of concepts as they go from concrete to abstract representations. The assessment was designed so that the use of manipulativeswaspermittedifthestudentrequestedthem.
11
What the assessment measures
Specific conceptual and procedural knowledge being assessedNumbers and operations
The student shows evidence that he or she can:• demonstrateanunderstandingoftheinverserelationshipbetweenperfectsquaresand
squareroots,multiplicationanddivision,andadditionandsubtraction;• findtheexactsquarerootofnumbersthatareperfectsquaresandtheapproximate
squarerootofnumbersthatarenotperfectsquares;• demonstrateanunderstandingofandfindfactorsfornumberslessthan100;• findprimefactorizationofcompositenumbersanduseittofindleastcommon
multiplesofnumberslessthan100;• orderandcomparepositivefractionsandpositiveandnegativedecimals;• generateequivalentexpressionsforpercentages,fractions,anddecimals;• representrationalnumberswithdiagramsandonanumberline;• explainandapplytheorderofoperationsfordecimals,fractions,andintegers;• demonstrateanunderstandingofthefouroperations(+,-,×, ÷) on positive fractions,
negative and positive decimals (× and ÷ of decimals limited to two-digit multipliers andone-digitdivisors);
• demonstrateanunderstandingofthefouroperationswithintegers;• selectappropriateoperationstosolveproblemsinvolvingrationalnumbers(except
negativefractions)setincontextualsituations;• describewaystoestimatesums,differences,products,andquotientsofpositive
fractionsanddecimals;• applythecommutative,associative,anddistributiveproperties,andorderof
operationstoevaluatemathematicalexpressions;• demonstrateanunderstandingofpercentagesgreaterthanorequalto0%;• demonstrateanunderstandingofproportionalrelationshipsusingpercent,ratio,andrate;• useratioandproportionalitytosolveproblemsinvolvingpercentagesthatarise
from real-life contexts, such as discount, interest, taxes, tips, and per cent increase anddecrease;
• recognizeaproportionalrelationshipfromcontext,tableofvalues,andgraphandusetosolvecontextualproblems;
• solveproblemsusingproportionalreasoninginthedifferentsubdomains, e.g., numbers and operations, geometry, probability.
12
geometry and measurement
The student shows evidence that he or she can:• compareandclassify2-Dgeometricpolygonsusingappropriategeometric
vocabularyandproperties,suchaslinesymmetry,angles,andsides;• applytherelationshipsforintersectinglines,parallellinesandtransversals,andthesumof
theanglesofatriangletofindthemeasuresofmissinganglesandsolveotherproblems;• demonstrateanunderstandingofcongruenceofpolygons;• drawanddescribetheimageofacombinationoftranslations,rotations,and/or
reflectionsona2-Dshape(notonacoordinateplane);• identifyandplotpointsinthefourquadrantsofaCartesianplaneusingintegral
orderedpairs;• demonstrateanunderstandingoftherelationshipsamongradii,diameter,and
circumferenceofcirclesandusetheserelationshipstosolveproblems;• calculatethemeasuresofthecircumferenceandareaofacircleandusethe
calculationstosolvecontextualproblems;• calculatetheperimeterandtheareaoftriangles,rectangles,andparallelogramsand
usethecalculationstosolvecontextualproblems;• calculatethesurfaceareaofrightprismsandpyramidsandusethecalculationsto
solvecontextualproblems;• identify,use,andconvertamongSIunitstomeasure,estimate,andsolveproblems
that relate to length and area.
Patterns and relationships
The student shows evidence that he or she can:• representlinearpatternsandrelationshipsusingwords,drawings,tables,graphs,
algebraicexpressions,andequations;• makeconnectionsamongvariousrepresentationsoflinearrelationships(words,
drawings,tables,graphs,algebraicexpressions,andequations);• usedifferentrepresentationsoflinearpatternsandrelationshipstomake
generalizations,predictunknownvalues,andsolveproblems;• demonstrateanunderstandingofthedifferentmeaningsandusesofvariablesas
aplaceholder,inrules,informulae,aschangingquantities,andasdependentandindependentvariables;
• translatestatementsdescribingmathematicalrelationshipsintooneormorealgebraicexpressionsorequationsinavarietyofcontexts;
• evaluatealgebraicexpressionsgiventhevalueofthevariablewithinthesetofrationalnumbers(exceptnegativefractions);
• showthattwoormoreexpressionsareequivalentbyusingpropertiessuchascommutative,associative,distributive,andorderofoperations;
• showthattwoequationsareequivalentbyusingpropertiesofequality;orderofoperations;andcommutative,associative,anddistributiveproperties;
• distinguishbetweenalgebraicexpressionsandalgebraicequations;
13
• solvelinearequationsusingthemostappropriatemethod(concrete,inspection,trialand error, and algebraic) involving a one-variable term for integral solutions and to verifysolutions;
• uselinearequationstosolveproblemsinvolvingproportionandmeasurementproblems (area, perimeter, unknown angles of polygons).
data management and probability
The student shows evidence that he or she can:Collect data
• formulatequestionsforinvestigation;• select,justify,anduseappropriatemethodsofcollectingdata(primaryandsecondary
data;categorical,discrete,continuousdata;sampling);• evaluateissuessuchassampling,biasedandunbiasedsampling,andthevalidityof
an inference.
Organize and display data
• organizedataintointervals;• select,use,andjustifyanappropriaterepresentationfordisplayingrelationships
among collected data (including circle, line, and bar graphs).
Analyze data
• makeinferencesandconvincingargumentsaboutaproblembeinginvestigatedbasedon an interpretation and analysis of charts, tables, and graphs used to display given or collecteddata;
• evaluatedatainterpretationsthatarebasedongraphs,tables,andcharts.
Understand measures of central tendency
• describeasetofdataandsolveproblemsusingmeanandrange;• comparedifferentpopulationsusingmeanandrange;• determinetheeffectsofvariationindataonmeasuresofcentraltendency(outliers,
gaps, clusters).
Understand probability concepts
• identifyallpossibleoutcomesoftwoindependenteventsusingtreediagrams,areamodels,tables,orlists;
• determineprobabilityofasingleortwoindependentevents,anddescribeusingfractions,decimals,orpercentages;
• usetheprobabilityofasingleortwoindependenteventstomakepredictionsabout apopulation;
• comparetheoreticalandexperimentalprobabilitiesofasingleandtwoindependentevents in appropriate contexts.
The processes: problem solving, reasoning and proof, communication, connections, andrepresentationhighlightwaysofacquiringandusingthecontentknowledgeoutlined above.
14
Problem solving
The student shows evidence that he or she can:• solvemulti-stepproblemspresentedincontextthatrequireusingandmaking
connectionsamongmathematicalconcepts,procedures,andprocesses;• solvemulti-stepproblemspresentedincontextthatshowevidenceofunderstanding
the problem, making a plan, carrying out the plan, and evaluating the solution forreasonableness;
• explaintheprocessusedtosolveaproblemandverifythereasonablenessofsolutionsbyusingnumbers,words,pictures/diagrams,symbols,andequations;
• applyavarietyofproblem-solvingstrategiestosolveproblems,suchasdrawingapicture or diagram, looking for a pattern, using “guess and check,” making a table, working a simpler problem, or working backwards.
Communication
The student shows evidence that he or she can:• communicatemathematicalideasandsolutionsclearlyandpreciselytoothersusing
appropriate everyday and mathematical language, units of measurement, and a varietyofrepresentations(written,graphical,numerical,algebraic);
• formulateclearandcompleteargumentsusingavarietyofrepresentations (written, graphical, numerical, and algebraic) to justify conjectures and solutions toproblemsituations;
• usesymboliclanguageofmathematicscorrectly.
Reasoning
The student shows evidence that he or she can:• analyzeaproblem,makeandassessconjectures,justifyconclusions,andplanand
construct an organized mathematical argument by applying logical reasoning (inductive,deductive)andmathematicalknowledge;
• makeandtestgeneralizationsfrompatternsandrelationshipsusinglogicalreasoning;• usecounter-examplestoevaluateconjectures;• evaluatemathematicalarguments;• selectanduseappropriatelyvarioustypesofreasoning(algebraic,geometric,
proportional,probabilistic,statistical,quantitative)tosolveproblemspresented in context.
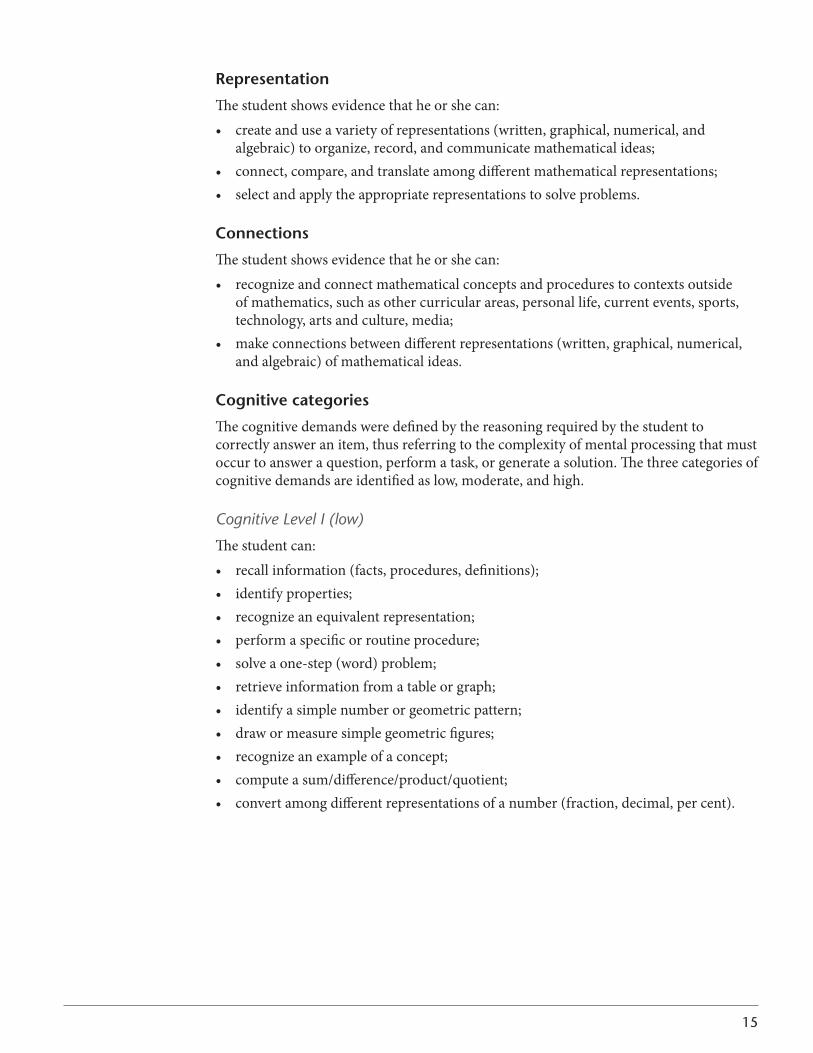
15
Representation
The student shows evidence that he or she can:• createanduseavarietyofrepresentations(written,graphical,numerical,and
algebraic)toorganize,record,andcommunicatemathematicalideas;• connect,compare,andtranslateamongdifferentmathematicalrepresentations;• selectandapplytheappropriaterepresentationstosolveproblems.
Connections
The student shows evidence that he or she can:• recognizeandconnectmathematicalconceptsandprocedurestocontextsoutside
of mathematics, such as other curricular areas, personal life, current events, sports, technology,artsandculture,media;
• makeconnectionsbetweendifferentrepresentations(written,graphical,numerical,and algebraic) of mathematical ideas.
Cognitive categories
Thecognitivedemandsweredefinedbythereasoningrequiredbythestudenttocorrectly answer an item, thus referring to the complexity of mental processing that must occurtoansweraquestion,performatask,orgenerateasolution.Thethreecategoriesofcognitive demands are identified as low, moderate, and high.
Cognitive Level I (low)
The student can:• recallinformation(facts,procedures,definitions);• identifyproperties;• recognizeanequivalentrepresentation;• performaspecificorroutineprocedure;• solveaone-step(word)problem;• retrieveinformationfromatableorgraph;• identifyasimplenumberorgeometricpattern;• drawormeasuresimplegeometricfigures;• recognizeanexampleofaconcept;• computeasum/difference/product/quotient;• convertamongdifferentrepresentationsofanumber(fraction,decimal,percent).
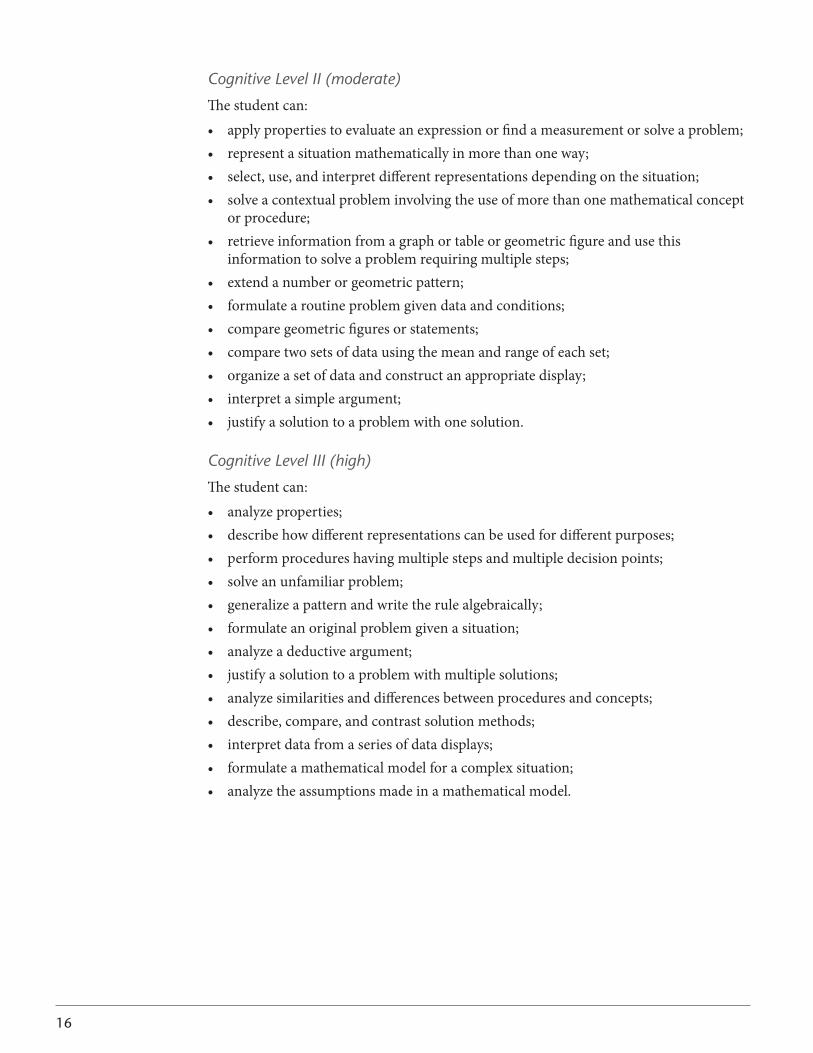
16
Cognitive Level II (moderate)
The student can:• applypropertiestoevaluateanexpressionorfindameasurementorsolveaproblem;• representasituationmathematicallyinmorethanoneway;• select,use,andinterpretdifferentrepresentationsdependingonthesituation;• solveacontextualprobleminvolvingtheuseofmorethanonemathematicalconcept
orprocedure;• retrieveinformationfromagraphortableorgeometricfigureandusethis
informationtosolveaproblemrequiringmultiplesteps;• extendanumberorgeometricpattern;• formulatearoutineproblemgivendataandconditions;• comparegeometricfiguresorstatements;• comparetwosetsofdatausingthemeanandrangeofeachset;• organizeasetofdataandconstructanappropriatedisplay;• interpretasimpleargument;• justifyasolutiontoaproblemwithonesolution.
Cognitive Level III (high)
The student can:• analyzeproperties;• describehowdifferentrepresentationscanbeusedfordifferentpurposes;• performprocedureshavingmultiplestepsandmultipledecisionpoints;• solveanunfamiliarproblem;• generalizeapatternandwritetherulealgebraically;• formulateanoriginalproblemgivenasituation;• analyzeadeductiveargument;• justifyasolutiontoaproblemwithmultiplesolutions;• analyzesimilaritiesanddifferencesbetweenproceduresandconcepts;• describe,compare,andcontrastsolutionmethods;• interpretdatafromaseriesofdatadisplays;• formulateamathematicalmodelforacomplexsituation;• analyzetheassumptionsmadeinamathematicalmodel.
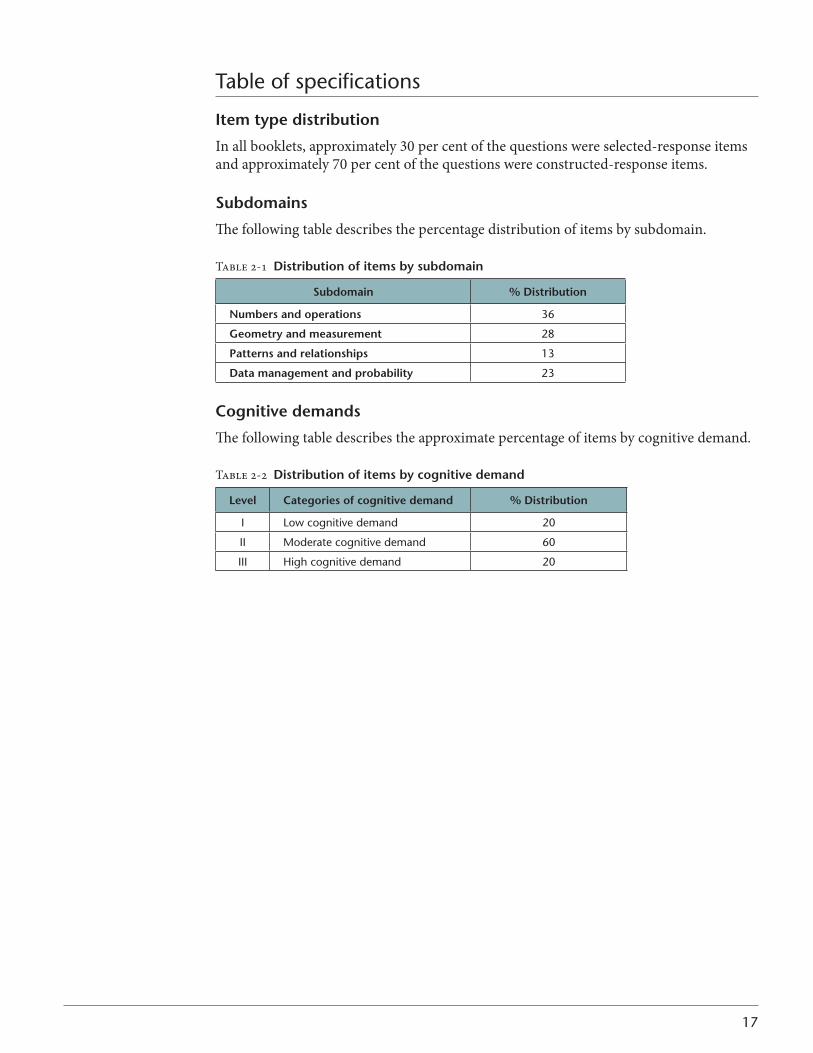
17
Table of specifications
item type distribution
Inallbooklets,approximately30percentofthequestionswereselected-responseitemsandapproximately70percentofthequestionswereconstructed-responseitems.
subdomains
The following table describes the percentage distribution of items by subdomain.
Table 2-1 distribution of items by subdomain
subdomain % distribution
Numbers and operations 36
geometry and measurement 28
Patterns and relationships 13
data management and probability 23
Cognitive demands
The following table describes the approximate percentage of items by cognitive demand.
Table 2-2 distribution of items by cognitive demand
level Categories of cognitive demand % distribution
I Low cognitive demand 20
II Moderate cognitive demand 60
III High cognitive demand 20
18
Reporting the PCAP 2010 Mathematics Assessment resultsActual results of tests are called “raw scores.” Initial analysis of raw scores involves the examination of the range of scores and the calculation of the “mean (average) score” obtained by the total population of participating students.
When comparisons of scores obtained from different populations are to be made over time and on different versions of a test, it becomes necessary to develop a common way of reporting achievement scores that will allow for direct comparisons across populations and across tests. The common method used is to numerically convert the raw scores to “standard scale scores.” In the case of PCAP 2010, the raw scores were converted to a scale on which the average for the pan-Canadian population was set at 500, with a standard deviation of 100. From this conversion, the scores of two-thirds of all participating students fell within the range of 400 to 600 points, which represents a “statistically normal distribution” of scores. These derived “scale scores” are used to interpret more accurately the performance of students in each assessment and from one administration of the assessment to another. As well, the performance of the sample of students can be shown, within statistical limits, to be representative of the performance of the whole population of Grade 8 students in Canada. Once the set of scale scores has been established for the pan-Canadian population, the accurate comparison of achievement results of each jurisdiction’s scores to the scale scores at the pan-Canadian level can be made.
subdomain scores
This scale score was calculated using the same methodology as that used for the mathematics overall scale score (mean of 500 and a standard deviation of 100) for each of the subdomains: numbers and operations, geometry and measurement, patterns and relationships, and data management and probability.
Reporting on performance scalesIn addition to the reporting of mean scale scores, the results for each jurisdiction are referenced to the levels of achievement using a performance scale. The performance levels represent how jurisdictional performances measured up to the expected level of achievementontwofactors:cognitivedemandanddegreeofdifficultyoftheitems.Thecognitivedemandsaredefinedbythelevelofreasoningrequiredbythestudenttocorrectlyansweranitem,fromlowdemandtohighdemand,whilethelevelsofdifficultyare determined by a statistical determination based on the collective performance of the students on the assessment. This is accomplished by setting the “cut scores” for each level, as previously described.
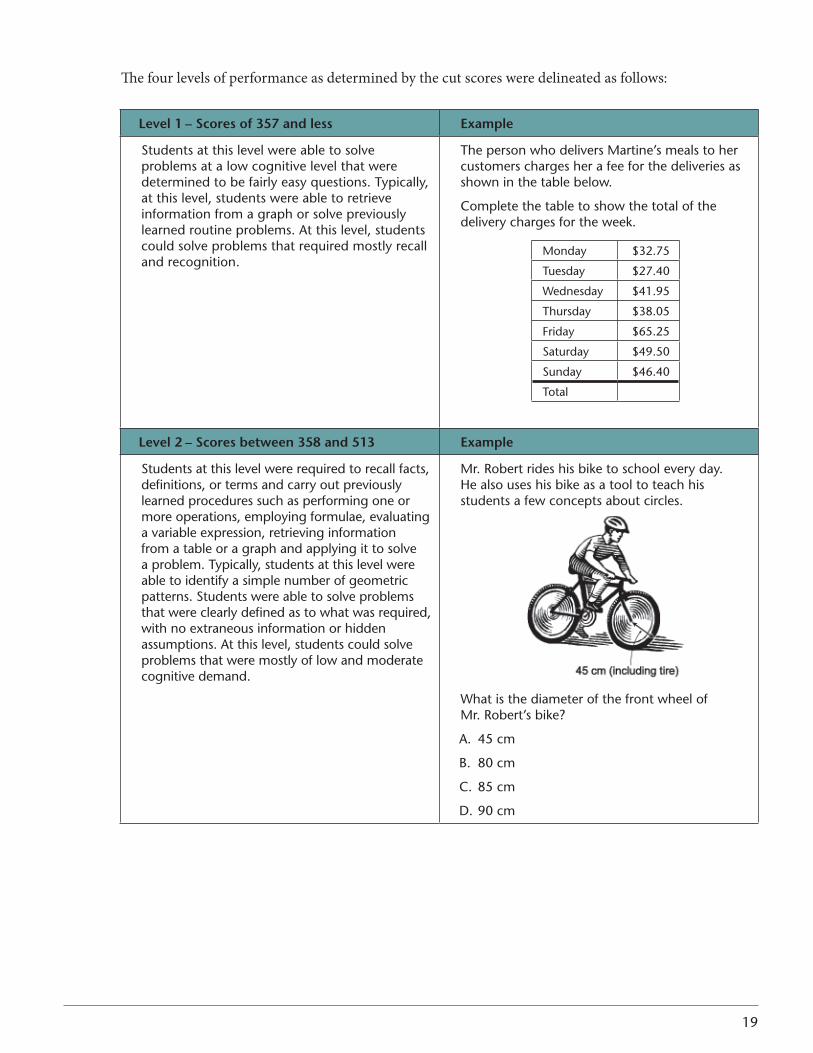
19
The four levels of performance as determined by the cut scores were delineated as follows:
level 1 – scores of 357 and less example
Students at this level were able to solve problems at a low cognitive level that were determined to be fairly easy questions� Typically, at this level, students were able to retrieve information from a graph or solve previously learned routine problems� At this level, students could solve problems that required mostly recall and recognition�
The person who delivers Martine’s meals to her customers charges her a fee for the deliveries as shown in the table below�
Complete the table to show the total of the delivery charges for the week�
Monday $32�75
Tuesday $27�40
Wednesday $41�95
Thursday $38�05
Friday $65�25
Saturday $49�50
Sunday $46�40
Total
level 2 – scores between 358 and 513 example
Students at this level were required to recall facts, definitions, or terms and carry out previously learned procedures such as performing one or more operations, employing formulae, evaluating a variable expression, retrieving information from a table or a graph and applying it to solve a problem� Typically, students at this level were able to identify a simple number of geometric patterns� Students were able to solve problems that were clearly defined as to what was required, with no extraneous information or hidden assumptions� At this level, students could solve problems that were mostly of low and moderate cognitive demand�
Mr� Robert rides his bike to school every day� He also uses his bike as a tool to teach his students a few concepts about circles�
What is the diameter of the front wheel of Mr� Robert’s bike?
A� 45 cm
B� 80 cm
C� 85 cm
D� 90 cm
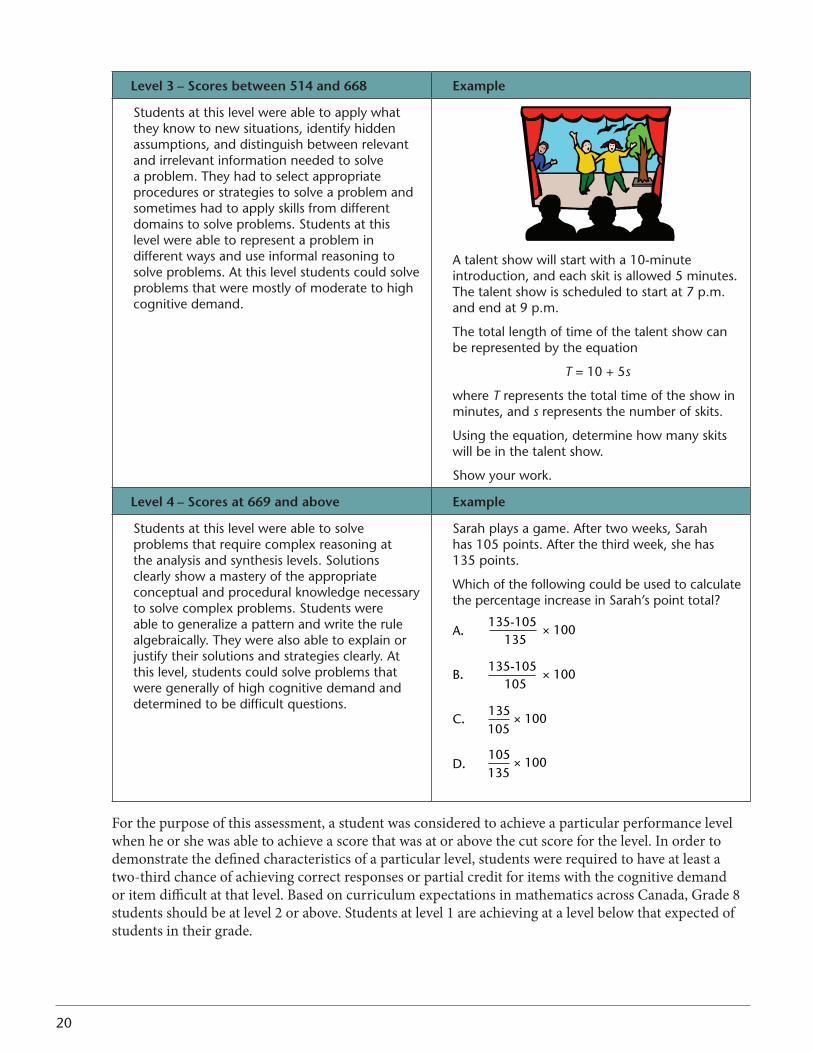
20
level 3 – scores between 514 and 668 example
Students at this level were able to apply what they know to new situations, identify hidden assumptions, and distinguish between relevant and irrelevant information needed to solve a problem� They had to select appropriate procedures or strategies to solve a problem and sometimes had to apply skills from different domains to solve problems� Students at this level were able to represent a problem in different ways and use informal reasoning to solve problems� At this level students could solve problems that were mostly of moderate to high cognitive demand�
A talent show will start with a 10-minute introduction, and each skit is allowed 5 minutes� The talent show is scheduled to start at 7 p�m� and end at 9 p�m�
The total length of time of the talent show can be represented by the equation
T = 10 + 5s
where T represents the total time of the show in minutes, and s represents the number of skits�
Using the equation, determine how many skits will be in the talent show�
Show your work�
level 4 – scores at 669 and above example
Students at this level were able to solve problems that require complex reasoning at the analysis and synthesis levels� Solutions clearly show a mastery of the appropriate conceptual and procedural knowledge necessary to solve complex problems� Students were able to generalize a pattern and write the rule algebraically� They were also able to explain or justify their solutions and strategies clearly� At this level, students could solve problems that were generally of high cognitive demand and determined to be difficult questions�
Sarah plays a game� After two weeks, Sarah has 105 points� After the third week, she has 135 points�
Which of the following could be used to calculate the percentage increase in Sarah’s point total?
A.
B.
C.
D.
135-105105
× 100
135-105135
× 100
105135
× 100
135105
× 100
For the purpose of this assessment, a student was considered to achieve a particular performance level when he or she was able to achieve a score that was at or above the cut score for the level. In order to demonstratethedefinedcharacteristicsofaparticularlevel,studentswererequiredtohaveatleastatwo-third chance of achieving correct responses or partial credit for items with the cognitive demand oritemdifficultatthatlevel.BasedoncurriculumexpectationsinmathematicsacrossCanada,Grade8students should be at level 2 or above. Students at level 1 are achieving at a level below that expected of students in their grade.
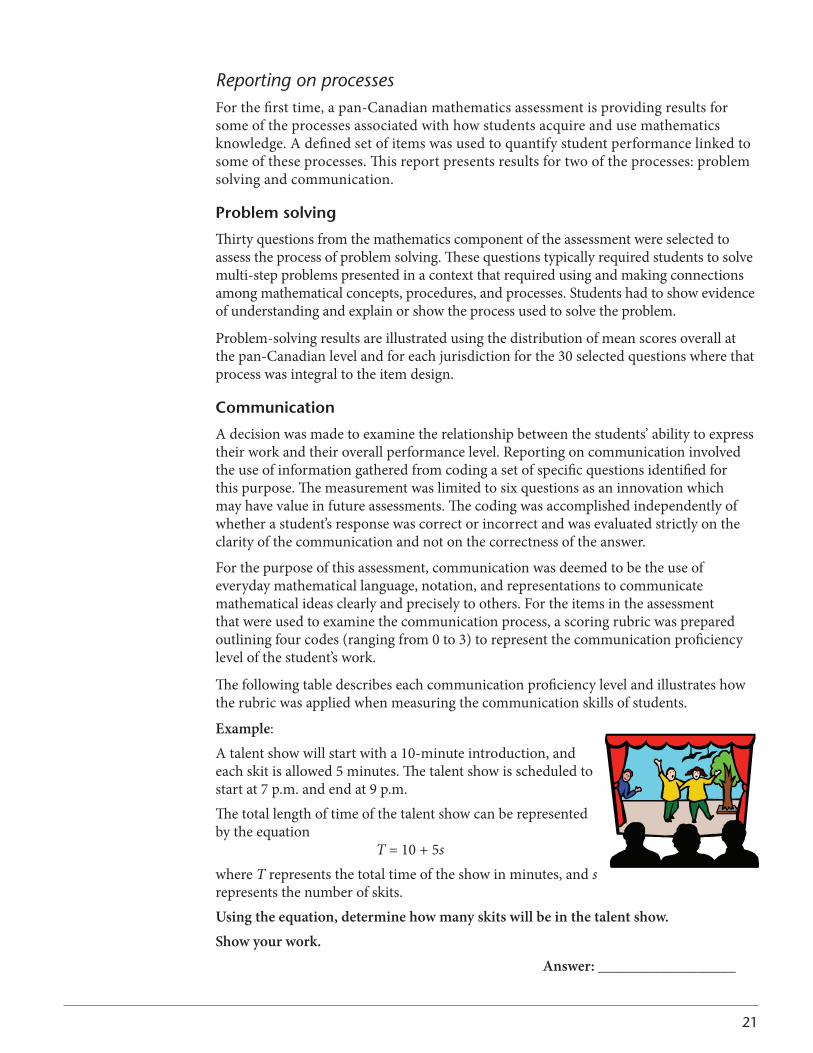
21
Reporting on processesFor the first time, a pan-Canadian mathematics assessment is providing results for someoftheprocessesassociatedwithhowstudentsacquireandusemathematicsknowledge.Adefinedsetofitemswasusedtoquantifystudentperformancelinkedtosome of these processes. This report presents results for two of the processes: problem solving and communication.
Problem solving
Thirtyquestionsfromthemathematicscomponentoftheassessmentwereselectedtoassesstheprocessofproblemsolving.Thesequestionstypicallyrequiredstudentstosolvemulti-stepproblemspresentedinacontextthatrequiredusingandmakingconnectionsamong mathematical concepts, procedures, and processes. Students had to show evidence of understanding and explain or show the process used to solve the problem.
Problem-solving results are illustrated using the distribution of mean scores overall at thepan-Canadianlevelandforeachjurisdictionforthe30selectedquestionswherethatprocess was integral to the item design.
Communication
A decision was made to examine the relationship between the students’ ability to express their work and their overall performance level. Reporting on communication involved theuseofinformationgatheredfromcodingasetofspecificquestionsidentifiedforthispurpose.Themeasurementwaslimitedtosixquestionsasaninnovationwhichmay have value in future assessments. The coding was accomplished independently of whether a student’s response was correct or incorrect and was evaluated strictly on the clarity of the communication and not on the correctness of the answer.
For the purpose of this assessment, communication was deemed to be the use of everyday mathematical language, notation, and representations to communicate mathematical ideas clearly and precisely to others. For the items in the assessment that were used to examine the communication process, a scoring rubric was prepared outlining four codes (ranging from 0 to 3) to represent the communication proficiency level of the student’s work.
The following table describes each communication proficiency level and illustrates how the rubric was applied when measuring the communication skills of students.
Example:A talent show will start with a 10-minute introduction, and each skit is allowed 5 minutes. The talent show is scheduled to start at 7 p.m. and end at 9 p.m.The total length of time of the talent show can be represented bytheequation
T=10+5swhere T represents the total time of the show in minutes, and s represents the number of skits.Using the equation, determine how many skits will be in the talent show.
Show your work.
Answer: __________________
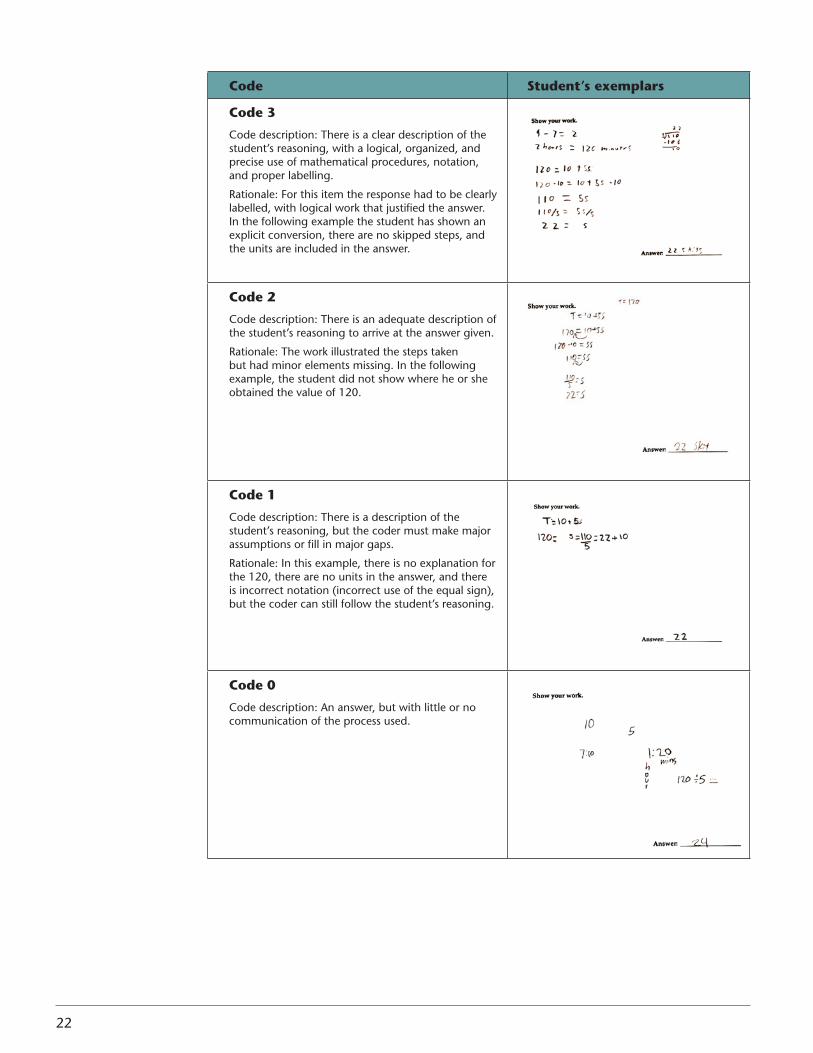
22
Code Student’s exemplars
Code 3
Code description: There is a clear description of the student’s reasoning, with a logical, organized, and precise use of mathematical procedures, notation, and proper labelling�
Rationale: For this item the response had to be clearly labelled, with logical work that justified the answer� In the following example the student has shown an explicit conversion, there are no skipped steps, and the units are included in the answer�
Code 2
Code description: There is an adequate description of the student’s reasoning to arrive at the answer given�
Rationale: The work illustrated the steps taken but had minor elements missing� In the following example, the student did not show where he or she obtained the value of 120�
Code 1
Code description: There is a description of the student’s reasoning, but the coder must make major assumptions or fill in major gaps�
Rationale: In this example, there is no explanation for the 120, there are no units in the answer, and there is incorrect notation (incorrect use of the equal sign), but the coder can still follow the student’s reasoning�
Code 0
Code description: An answer, but with little or no communication of the process used�
23
PAN-CANAdiAN ResulTs iN MATheMATiCs
Terminology used in the charts and tables
differences
In this report, the terms “difference” or “different” used in the context of performance levels and percentages refer to a difference in a technical sense. They refer to a statistically significant difference. A difference is statistically different when there is no overlap of confidence intervals between different measurements. In this report, mean scores and confidence intervals that are significantly different from the Canadian mean score and confidence interval are indicated using bold font.
Confidence intervals
In this assessment, the reported mean scores provide estimates of the achievement results students would have demonstrated if all students in the population had participated in the assessment. In addition, a degree of error is associated with the scores describing student skills because these scores are estimated, based on student responses to test items. This error is called the error of measurement. Because an estimate that is based on a sample is rarely exact, and because the error of measurement exists, it is common practice to provide a range of scores for each jurisdiction within which the actual achievement level might fall. This range of scores expressed for each mean score is called a confidence interval. A 95 per cent confidence interval is used in this report to represent the high- and low-end points between which the actual mean score should fall 95 per cent of the time.
In other words, one can be confident that the actual achievement level of all students would fall somewhere in the established range 19 times out of 20, if the assessment were repeated with different samples randomly drawn from the same student population. In the charts in this report, confidence intervals are represented by the following symbol: . If the confidence intervals overlap, the differences are defined as not statistically significant.
Comparisons between results for english and french
Caution is advised when comparing achievement results, even though assessment instruments were prepared collaboratively with due regard for equity for students in both language groups. Every language has unique features that are not readily comparable. While the mathematics items, performance descriptors, scoring guides, and processes were judged equivalent in English and French, pedagogical and cultural differences related to differences in language structure and use render direct comparisons between language groups inherently difficult and should be done with caution.
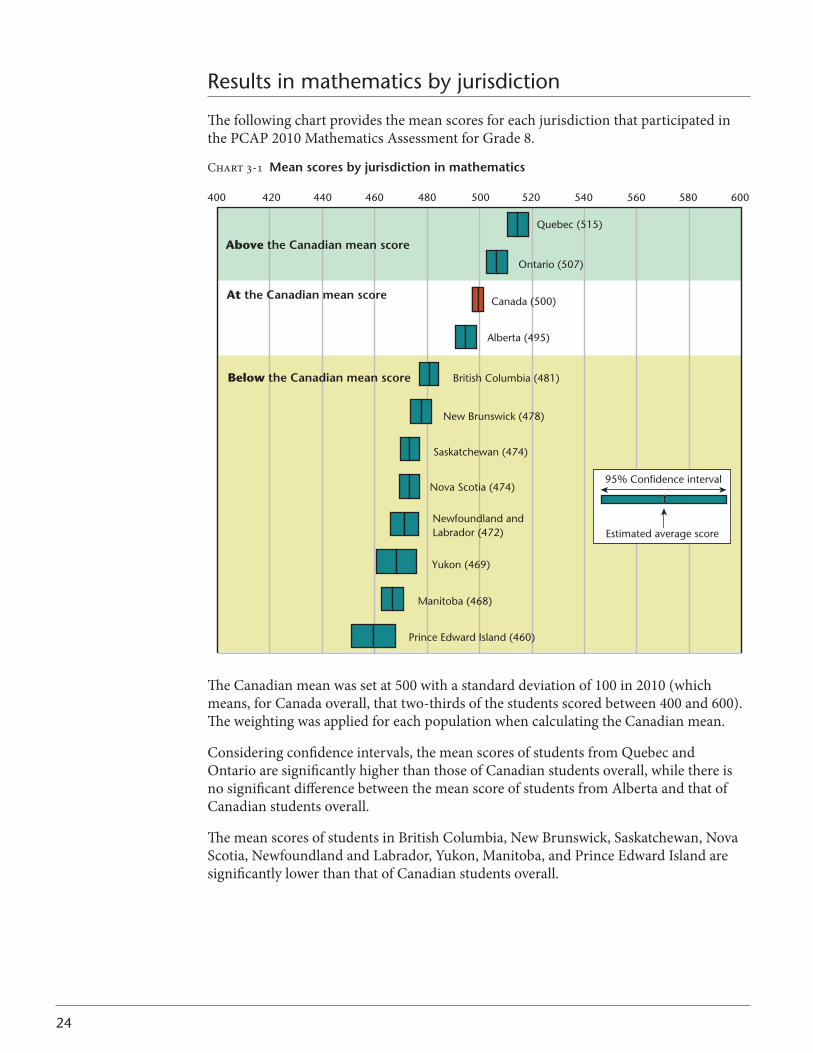
24
Results in mathematics by jurisdiction
The following chart provides the mean scores for each jurisdiction that participated in the PCAP 2010 Mathematics Assessment for Grade 8.
Chart 3-1 Mean scores by jurisdiction in mathematics
400 420 440 460 480 500 520 540 560 580 600
95% Confidence interval
Estimated average score
Prince Edward Island (460)
Manitoba (468)
Yukon (469)
Newfoundland and Labrador (472)
Nova Scotia (474)
Saskatchewan (474)
New Brunswick (478)
British Columbia (481)
Alberta (495)
Canada (500)
Ontario (507)
Quebec (515)
Below the Canadian mean score
At the Canadian mean score
Above the Canadian mean score
The Canadian mean was set at 500 with a standard deviation of 100 in 2010 (which means, for Canada overall, that two-thirds of the students scored between 400 and 600). The weighting was applied for each population when calculating the Canadian mean.
Considering confidence intervals, the mean scores of students from Quebec and Ontario are significantly higher than those of Canadian students overall, while there is no significant difference between the mean score of students from Alberta and that of Canadian students overall.
The mean scores of students in British Columbia, New Brunswick, Saskatchewan, Nova Scotia, Newfoundland and Labrador, Yukon, Manitoba, and Prince Edward Island are significantly lower than that of Canadian students overall.
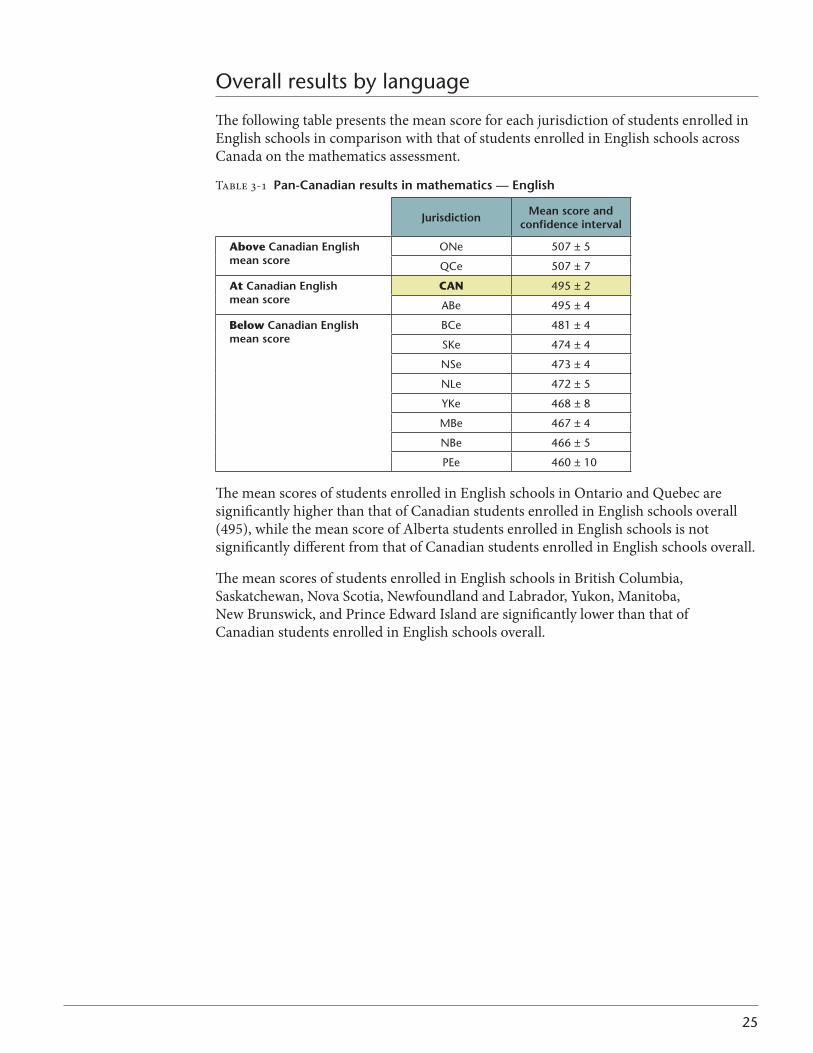
25
Overall results by language
The following table presents the mean score for each jurisdiction of students enrolled in English schools in comparison with that of students enrolled in English schools across Canada on the mathematics assessment.
Table 3-1 Pan-Canadian results in mathematics — english
Jurisdiction Mean score and confidence interval
Above Canadian english mean score
ONe 507 ± 5
QCe 507 ± 7
At Canadian english mean score
CAN 495 ± 2
ABe 495 ± 4
Below Canadian english mean score
BCe 481 ± 4
SKe 474 ± 4
NSe 473 ± 4
NLe 472 ± 5
YKe 468 ± 8
MBe 467 ± 4
NBe 466 ± 5
PEe 460 ± 10
The mean scores of students enrolled in English schools in Ontario and Quebec are significantly higher than that of Canadian students enrolled in English schools overall (495), while the mean score of Alberta students enrolled in English schools is not significantly different from that of Canadian students enrolled in English schools overall.
The mean scores of students enrolled in English schools in British Columbia, Saskatchewan, Nova Scotia, Newfoundland and Labrador, Yukon, Manitoba, New Brunswick, and Prince Edward Island are significantly lower than that of Canadian students enrolled in English schools overall.
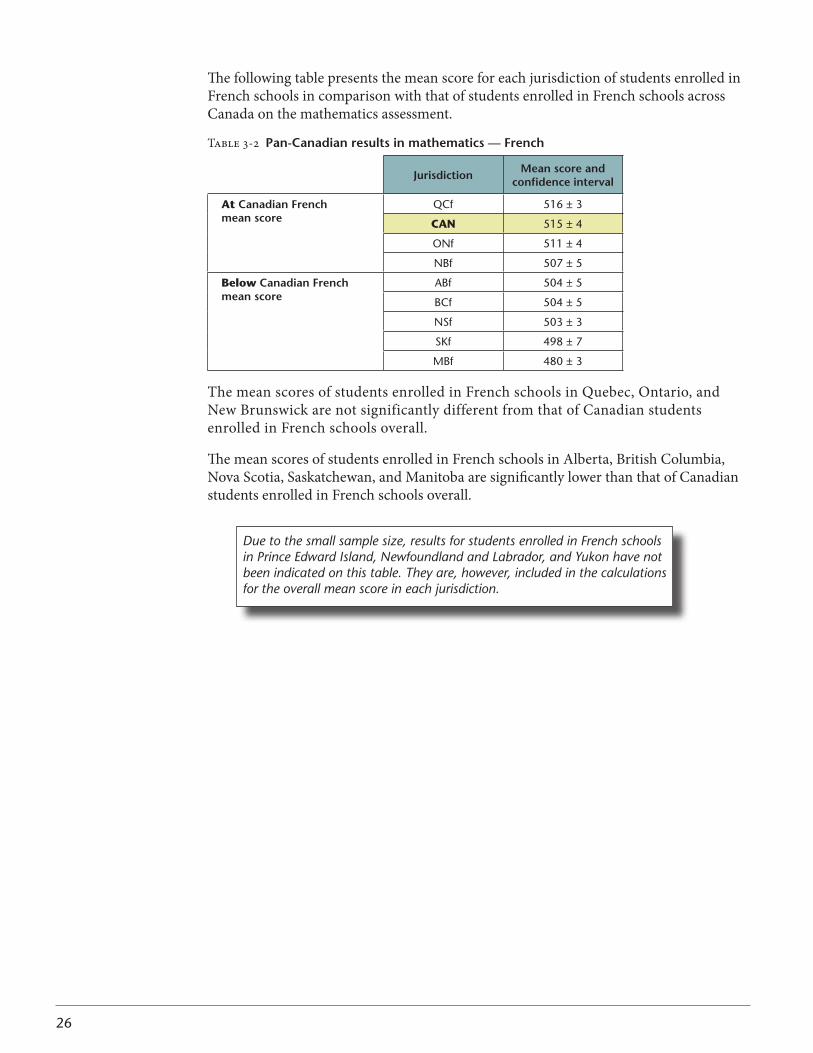
26
The following table presents the mean score for each jurisdiction of students enrolled in French schools in comparison with that of students enrolled in French schools across Canada on the mathematics assessment.
Table 3-2 Pan-Canadian results in mathematics — french
Jurisdiction Mean score and confidence interval
At Canadian french mean score
QCf 516 ± 3
CAN 515 ± 4
ONf 511 ± 4
NBf 507 ± 5
Below Canadian french mean score
ABf 504 ± 5
BCf 504 ± 5
NSf 503 ± 3
SKf 498 ± 7
MBf 480 ± 3
The mean scores of students enrolled in French schools in Quebec, Ontario, and New Brunswick are not significantly different from that of Canadian students enrolled in French schools overall.
The mean scores of students enrolled in French schools in Alberta, British Columbia, Nova Scotia, Saskatchewan, and Manitoba are significantly lower than that of Canadian students enrolled in French schools overall.
Due to the small sample size, results for students enrolled in French schools in Prince Edward Island, Newfoundland and Labrador, and Yukon have not been indicated on this table. They are, however, included in the calculations for the overall mean score in each jurisdiction.
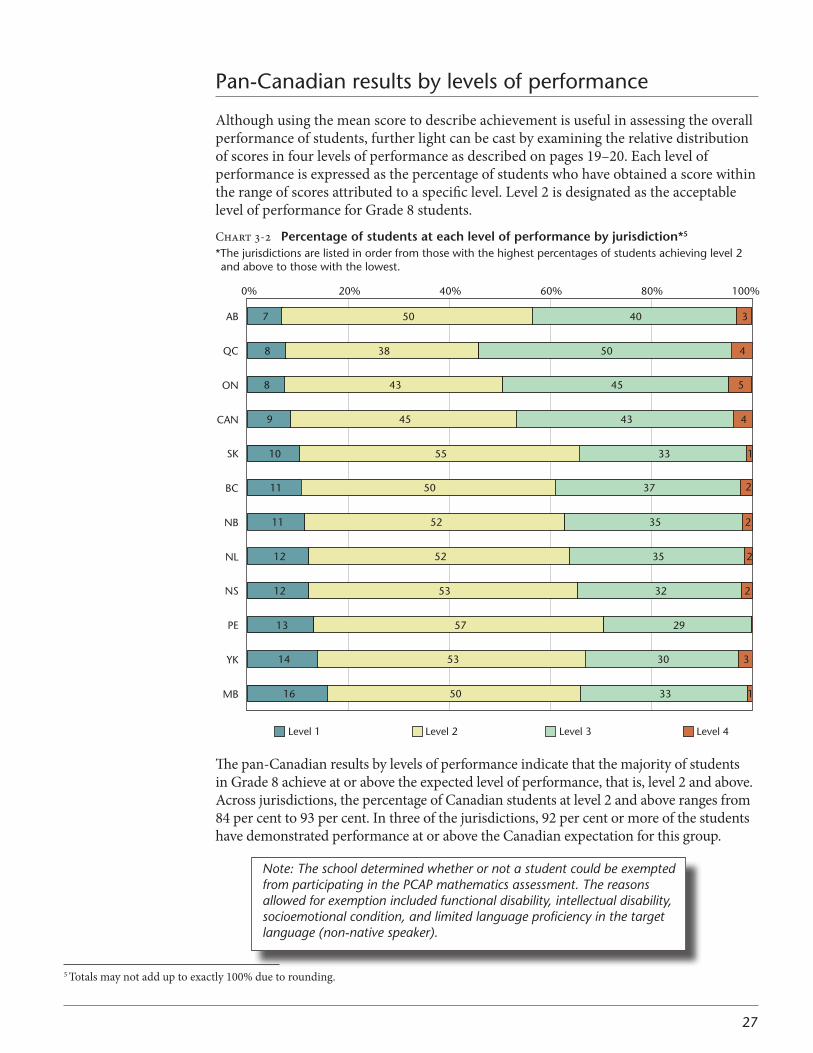
27
Pan-Canadian results by levels of performance
Although using the mean score to describe achievement is useful in assessing the overall performance of students, further light can be cast by examining the relative distribution of scores in four levels of performance as described on pages 19–20. Each level of performance is expressed as the percentage of students who have obtained a score within the range of scores attributed to a specific level. Level 2 is designated as the acceptable level of performance for Grade 8 students.
Chart 3-2 Percentage of students at each level of performance by jurisdiction*5
*The jurisdictions are listed in order from those with the highest percentages of students achieving level 2 and above to those with the lowest�
Level 1 Level 2 Level 3 Level 4
0% 20% 40% 60% 80% 100%
16
14
13
12
12
11
11
10
9
8
8
7
50
53
57
53
52
52
50
55
45
43
38
50
33
30
29
32
35
35
37
33
43
45
50
40
1
3
2
2
2
2
1
4
5
4
3
MB
YK
PE
NS
NL
NB
BC
SK
CAN
ON
QC
AB
The pan-Canadian results by levels of performance indicate that the majority of students in Grade 8 achieve at or above the expected level of performance, that is, level 2 and above. Across jurisdictions, the percentage of Canadian students at level 2 and above ranges from 84 per cent to 93 per cent. In three of the jurisdictions, 92 per cent or more of the students have demonstrated performance at or above the Canadian expectation for this group.
Note: The school determined whether or not a student could be exempted from participating in the PCAP mathematics assessment. The reasons allowed for exemption included functional disability, intellectual disability, socioemotional condition, and limited language proficiency in the target language (non-native speaker).
5 Totalsmaynotadduptoexactly100%duetorounding.
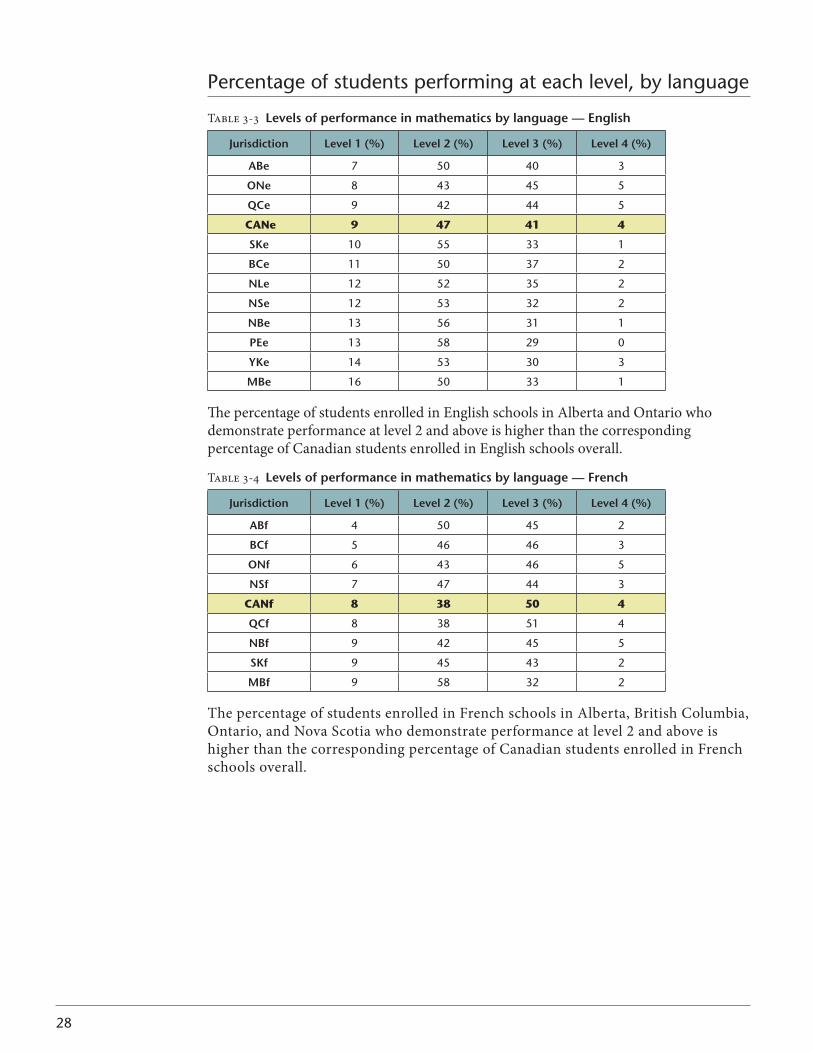
28
Percentage of students performing at each level, by language
Table 3-3 levels of performance in mathematics by language — english
Jurisdiction level 1 (%) level 2 (%) level 3 (%) level 4 (%)
Abe 7 50 40 3
oNe 8 43 45 5
QCe 9 42 44 5
CANe 9 47 41 4
sKe 10 55 33 1
bCe 11 50 37 2
Nle 12 52 35 2
Nse 12 53 32 2
Nbe 13 56 31 1
Pee 13 58 29 0
YKe 14 53 30 3
Mbe 16 50 33 1
The percentage of students enrolled in English schools in Alberta and Ontario who demonstrate performance at level 2 and above is higher than the corresponding percentage of Canadian students enrolled in English schools overall.
Table 3-4 levels of performance in mathematics by language — french
Jurisdiction level 1 (%) level 2 (%) level 3 (%) level 4 (%)
Abf 4 50 45 2
bCf 5 46 46 3
oNf 6 43 46 5
Nsf 7 47 44 3
CANf 8 38 50 4
QCf 8 38 51 4
Nbf 9 42 45 5
sKf 9 45 43 2
Mbf 9 58 32 2
The percentage of students enrolled in French schools in Alberta, British Columbia, Ontario, and Nova Scotia who demonstrate performance at level 2 and above is higher than the corresponding percentage of Canadian students enrolled in French schools overall.
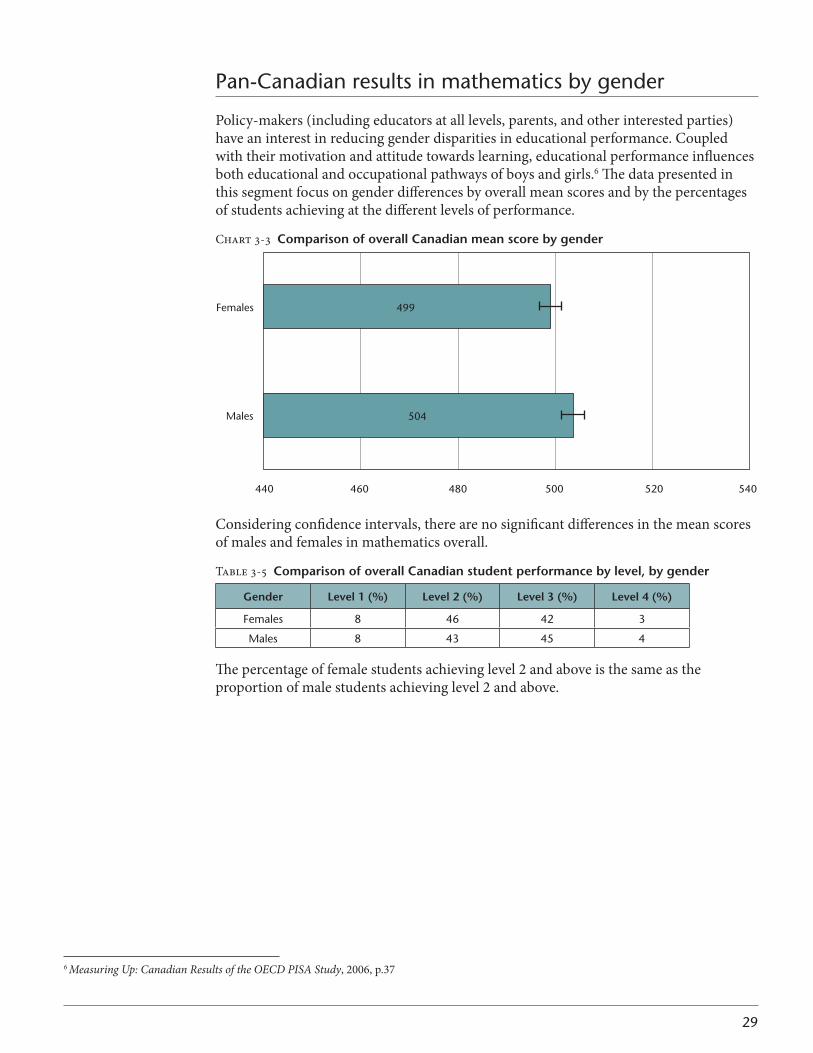
29
Pan-Canadian results in mathematics by gender
Policy-makers (including educators at all levels, parents, and other interested parties) have an interest in reducing gender disparities in educational performance. Coupled with their motivation and attitude towards learning, educational performance influences both educational and occupational pathways of boys and girls.6 The data presented in this segment focus on gender differences by overall mean scores and by the percentages of students achieving at the different levels of performance.
Chart 3-3 Comparison of overall Canadian mean score by gender
Considering confidence intervals, there are no significant differences in the mean scores of males and females in mathematics overall.
Table 3-5 Comparison of overall Canadian student performance by level, by gender
gender level 1 (%) level 2 (%) level 3 (%) level 4 (%)
Females 8 46 42 3
Males 8 43 45 4
The percentage of female students achieving level 2 and above is the same as the proportion of male students achieving level 2 and above.
Males
Females
440 460 500480 520 540
504
499
6 Measuring Up: Canadian Results of the OECD PISA Study, 2006, p.37
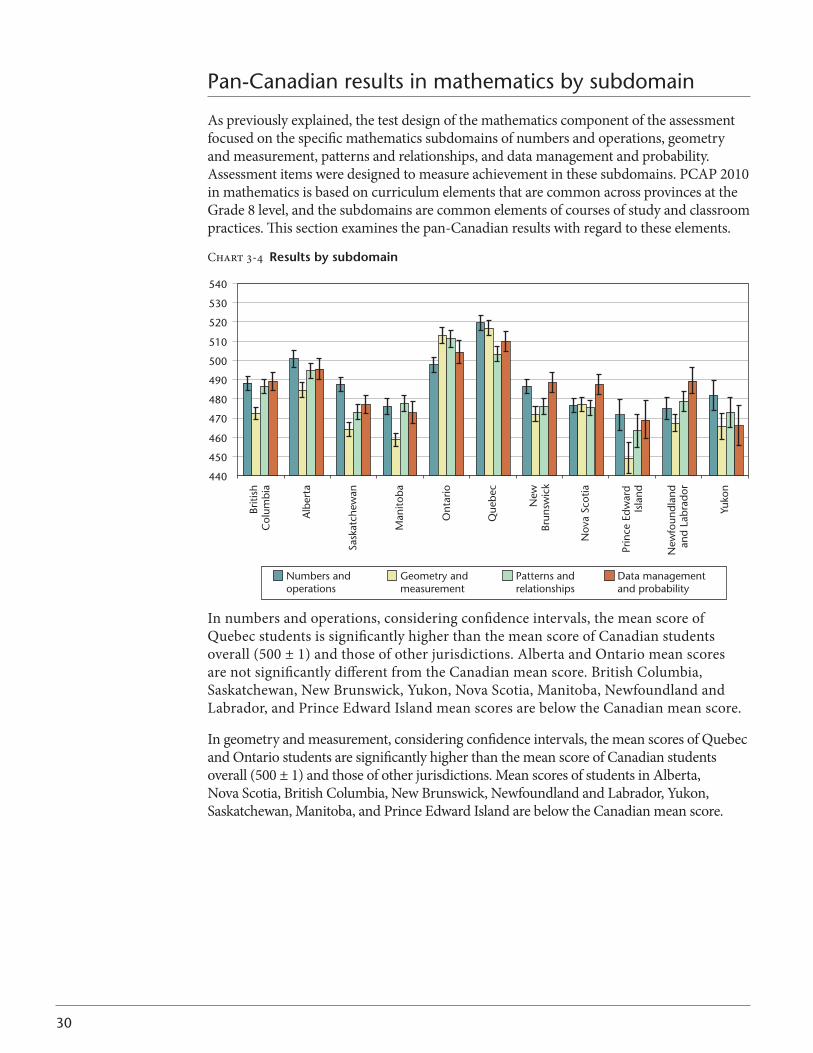
30
Pan-Canadian results in mathematics by subdomain
As previously explained, the test design of the mathematics component of the assessment focused on the specific mathematics subdomains of numbers and operations, geometry and measurement, patterns and relationships, and data management and probability. Assessment items were designed to measure achievement in these subdomains. PCAP 2010 in mathematics is based on curriculum elements that are common across provinces at the Grade 8 level, and the subdomains are common elements of courses of study and classroom practices. This section examines the pan-Canadian results with regard to these elements.
Chart 3-4 Results by subdomain
In numbers and operations, considering confidence intervals, the mean score of Quebec students is significantly higher than the mean score of Canadian students overall (500 ± 1) and those of other jurisdictions. Alberta and Ontario mean scores are not significantly different from the Canadian mean score. British Columbia, Saskatchewan, New Brunswick, Yukon, Nova Scotia, Manitoba, Newfoundland and Labrador, and Prince Edward Island mean scores are below the Canadian mean score.
In geometry and measurement, considering confidence intervals, the mean scores of Quebec and Ontario students are significantly higher than the mean score of Canadian students overall (500 ± 1) and those of other jurisdictions. Mean scores of students in Alberta, Nova Scotia, British Columbia, New Brunswick, Newfoundland and Labrador, Yukon, Saskatchewan, Manitoba, and Prince Edward Island are below the Canadian mean score.
440
450
460
470
480
490
500
510
520
530
540
Briti
shC
olum
bia
Alb
erta
Sask
atch
ewan
Man
itoba
Ont
ario
Que
bec
New
Brun
swic
k
Nov
a Sc
otia
Prin
ce E
dwar
dIs
land
New
foun
dlan
dan
d La
brad
or
Yuko
n
Numbers andoperations
Geometry andmeasurement
Patterns andrelationships
Data managementand probability
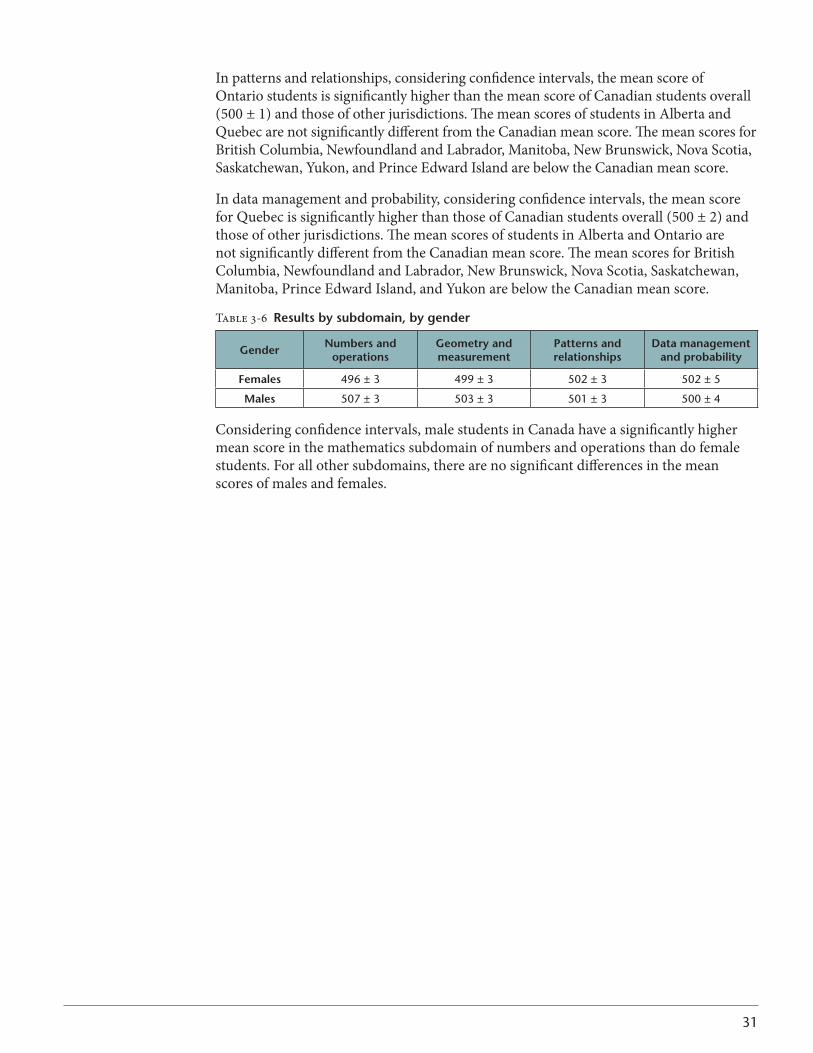
31
In patterns and relationships, considering confidence intervals, the mean score of Ontario students is significantly higher than the mean score of Canadian students overall (500 ± 1) and those of other jurisdictions. The mean scores of students in Alberta and Quebec are not significantly different from the Canadian mean score. The mean scores for British Columbia, Newfoundland and Labrador, Manitoba, New Brunswick, Nova Scotia, Saskatchewan, Yukon, and Prince Edward Island are below the Canadian mean score.
In data management and probability, considering confidence intervals, the mean score for Quebec is significantly higher than those of Canadian students overall (500 ± 2) and those of other jurisdictions. The mean scores of students in Alberta and Ontario are not significantly different from the Canadian mean score. The mean scores for British Columbia, Newfoundland and Labrador, New Brunswick, Nova Scotia, Saskatchewan, Manitoba, Prince Edward Island, and Yukon are below the Canadian mean score.
Table 3-6 Results by subdomain, by gender
gender Numbers and operations
geometry and measurement
Patterns and relationships
data management and probability
females 496 ± 3 499 ± 3 502 ± 3 502 ± 5
Males 507 ± 3 503 ± 3 501 ± 3 500 ± 4
Considering confidence intervals, male students in Canada have a significantly higher mean score in the mathematics subdomain of numbers and operations than do female students. For all other subdomains, there are no significant differences in the mean scores of males and females.
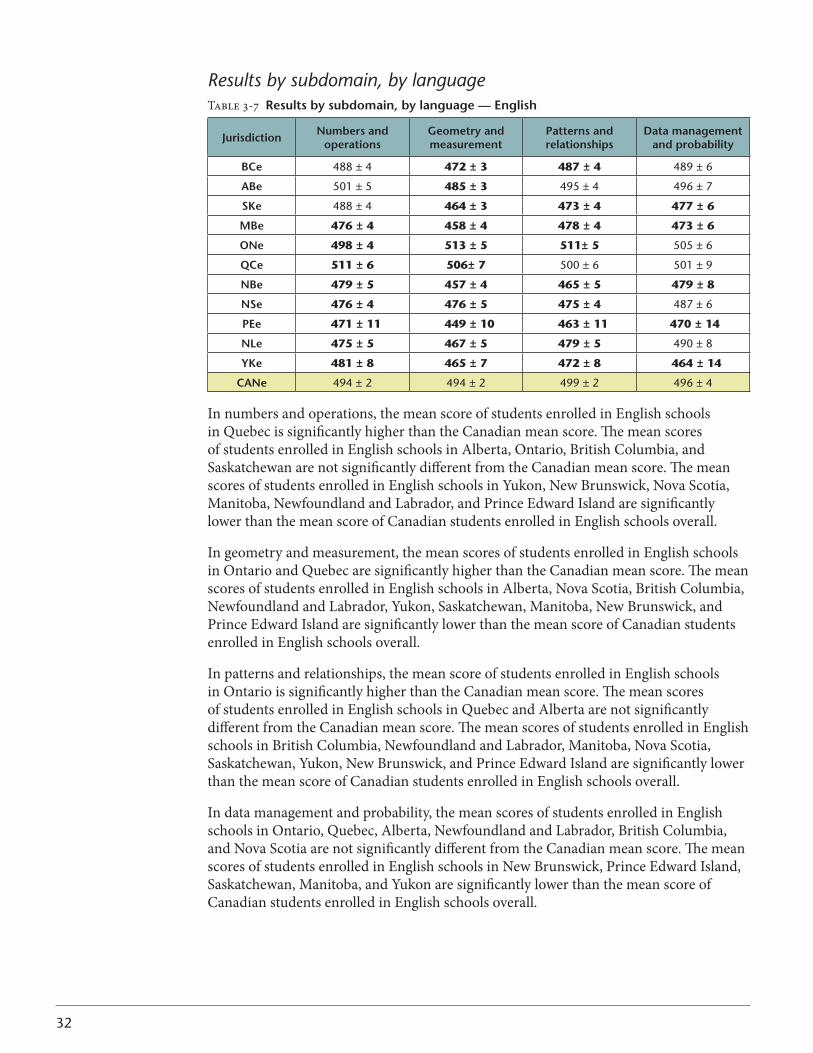
32
Results by subdomain, by languageTable 3-7 Results by subdomain, by language — english
Jurisdiction Numbers and operations
geometry and measurement
Patterns and relationships
data management and probability
bCe 488 ± 4 472 ± 3 487 ± 4 489 ± 6
Abe 501 ± 5 485 ± 3 495 ± 4 496 ± 7
sKe 488 ± 4 464 ± 3 473 ± 4 477 ± 6
Mbe 476 ± 4 458 ± 4 478 ± 4 473 ± 6
oNe 498 ± 4 513 ± 5 511± 5 505 ± 6
QCe 511 ± 6 506± 7 500 ± 6 501 ± 9
Nbe 479 ± 5 457 ± 4 465 ± 5 479 ± 8
Nse 476 ± 4 476 ± 5 475 ± 4 487 ± 6
Pee 471 ± 11 449 ± 10 463 ± 11 470 ± 14
Nle 475 ± 5 467 ± 5 479 ± 5 490 ± 8
YKe 481 ± 8 465 ± 7 472 ± 8 464 ± 14
CANe 494 ± 2 494 ± 2 499 ± 2 496 ± 4
In numbers and operations, the mean score of students enrolled in English schools in Quebec is significantly higher than the Canadian mean score. The mean scores of students enrolled in English schools in Alberta, Ontario, British Columbia, and Saskatchewan are not significantly different from the Canadian mean score. The mean scores of students enrolled in English schools in Yukon, New Brunswick, Nova Scotia, Manitoba, Newfoundland and Labrador, and Prince Edward Island are significantly lower than the mean score of Canadian students enrolled in English schools overall.
In geometry and measurement, the mean scores of students enrolled in English schools in Ontario and Quebec are significantly higher than the Canadian mean score. The mean scores of students enrolled in English schools in Alberta, Nova Scotia, British Columbia, Newfoundland and Labrador, Yukon, Saskatchewan, Manitoba, New Brunswick, and Prince Edward Island are significantly lower than the mean score of Canadian students enrolled in English schools overall.
In patterns and relationships, the mean score of students enrolled in English schools in Ontario is significantly higher than the Canadian mean score. The mean scores of students enrolled in English schools in Quebec and Alberta are not significantly different from the Canadian mean score. The mean scores of students enrolled in English schools in British Columbia, Newfoundland and Labrador, Manitoba, Nova Scotia, Saskatchewan, Yukon, New Brunswick, and Prince Edward Island are significantly lower than the mean score of Canadian students enrolled in English schools overall.
In data management and probability, the mean scores of students enrolled in English schools in Ontario, Quebec, Alberta, Newfoundland and Labrador, British Columbia, and Nova Scotia are not significantly different from the Canadian mean score. The mean scores of students enrolled in English schools in New Brunswick, Prince Edward Island, Saskatchewan, Manitoba, and Yukon are significantly lower than the mean score of Canadian students enrolled in English schools overall.
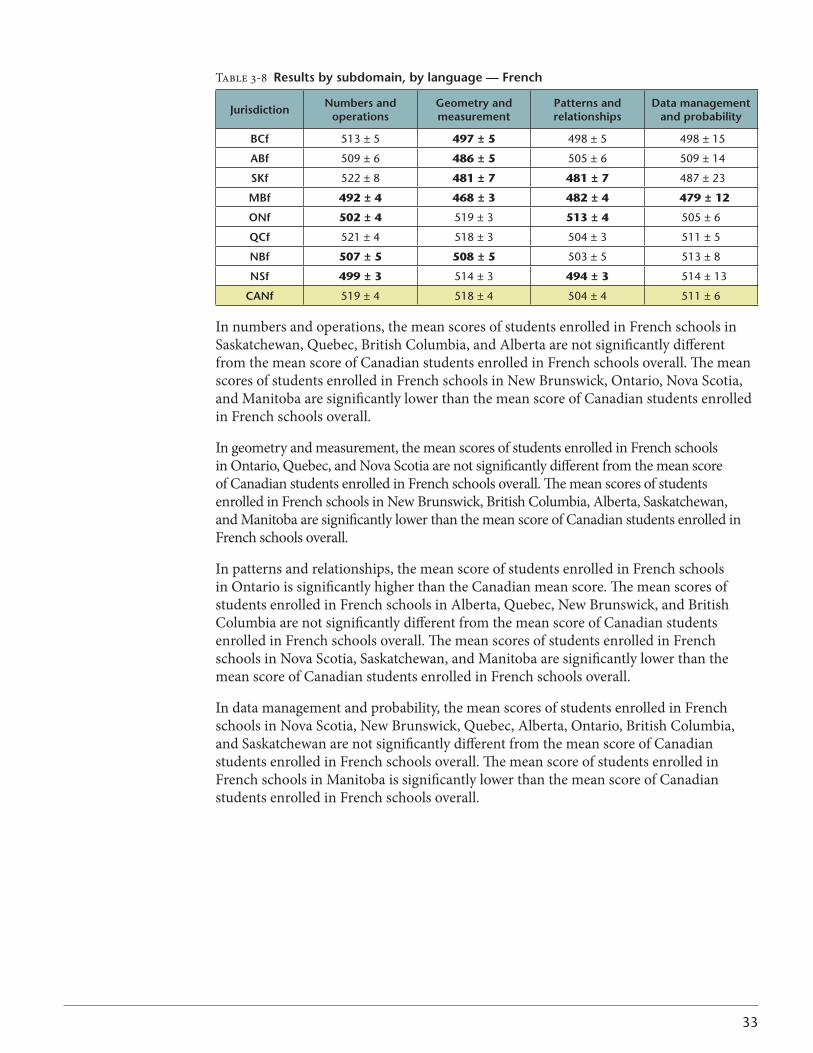
33
Table 3-8 Results by subdomain, by language — french
Jurisdiction Numbers and operations
geometry and measurement
Patterns and relationships
data management and probability
bCf 513 ± 5 497 ± 5 498 ± 5 498 ± 15
Abf 509 ± 6 486 ± 5 505 ± 6 509 ± 14
sKf 522 ± 8 481 ± 7 481 ± 7 487 ± 23
Mbf 492 ± 4 468 ± 3 482 ± 4 479 ± 12
oNf 502 ± 4 519 ± 3 513 ± 4 505 ± 6
QCf 521 ± 4 518 ± 3 504 ± 3 511 ± 5
Nbf 507 ± 5 508 ± 5 503 ± 5 513 ± 8
Nsf 499 ± 3 514 ± 3 494 ± 3 514 ± 13
CANf 519 ± 4 518 ± 4 504 ± 4 511 ± 6
In numbers and operations, the mean scores of students enrolled in French schools in Saskatchewan, Quebec, British Columbia, and Alberta are not significantly different from the mean score of Canadian students enrolled in French schools overall. The mean scores of students enrolled in French schools in New Brunswick, Ontario, Nova Scotia, and Manitoba are significantly lower than the mean score of Canadian students enrolled in French schools overall.
In geometry and measurement, the mean scores of students enrolled in French schools in Ontario, Quebec, and Nova Scotia are not significantly different from the mean score of Canadian students enrolled in French schools overall. The mean scores of students enrolled in French schools in New Brunswick, British Columbia, Alberta, Saskatchewan, and Manitoba are significantly lower than the mean score of Canadian students enrolled in French schools overall.
In patterns and relationships, the mean score of students enrolled in French schools in Ontario is significantly higher than the Canadian mean score. The mean scores of students enrolled in French schools in Alberta, Quebec, New Brunswick, and British Columbia are not significantly different from the mean score of Canadian students enrolled in French schools overall. The mean scores of students enrolled in French schools in Nova Scotia, Saskatchewan, and Manitoba are significantly lower than the mean score of Canadian students enrolled in French schools overall.
In data management and probability, the mean scores of students enrolled in French schools in Nova Scotia, New Brunswick, Quebec, Alberta, Ontario, British Columbia, and Saskatchewan are not significantly different from the mean score of Canadian students enrolled in French schools overall. The mean score of students enrolled in French schools in Manitoba is significantly lower than the mean score of Canadian students enrolled in French schools overall.
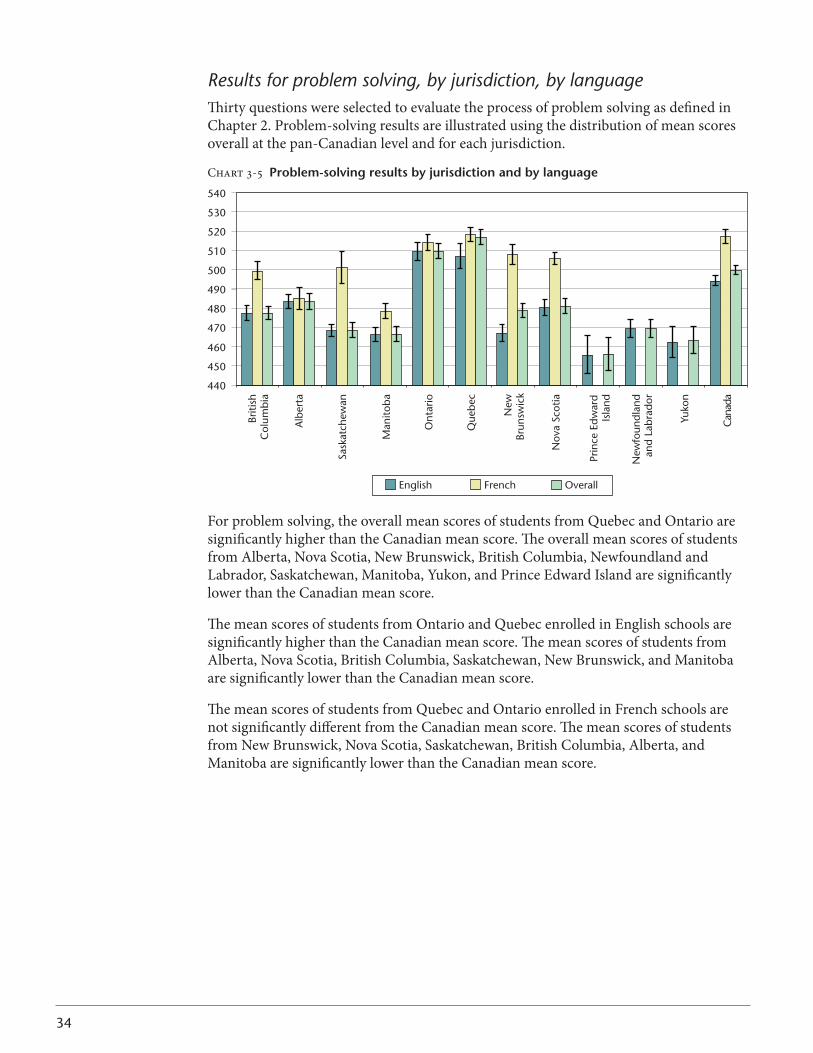
34
Results for problem solving, by jurisdiction, by languageThirtyquestionswereselectedtoevaluatetheprocessofproblemsolvingasdefinedinChapter 2. Problem-solving results are illustrated using the distribution of mean scores overall at the pan-Canadian level and for each jurisdiction.
Chart 3-5 Problem-solving results by jurisdiction and by language
440
450
460
470
480
490
500
510
520
530
540
Briti
shC
olum
bia
Alb
erta
Sask
atch
ewan
Man
itoba
Ont
ario
Que
bec
New
Brun
swic
k
Nov
a Sc
otia
Prin
ce E
dwar
dIs
land
New
foun
dlan
dan
d La
brad
or
Yuko
n
Can
ada
English French Overall
For problem solving, the overall mean scores of students from Quebec and Ontario are significantly higher than the Canadian mean score. The overall mean scores of students from Alberta, Nova Scotia, New Brunswick, British Columbia, Newfoundland and Labrador, Saskatchewan, Manitoba, Yukon, and Prince Edward Island are significantly lower than the Canadian mean score.
The mean scores of students from Ontario and Quebec enrolled in English schools are significantly higher than the Canadian mean score. The mean scores of students from Alberta, Nova Scotia, British Columbia, Saskatchewan, New Brunswick, and Manitoba are significantly lower than the Canadian mean score.
The mean scores of students from Quebec and Ontario enrolled in French schools are not significantly different from the Canadian mean score. The mean scores of students from New Brunswick, Nova Scotia, Saskatchewan, British Columbia, Alberta, and Manitoba are significantly lower than the Canadian mean score.
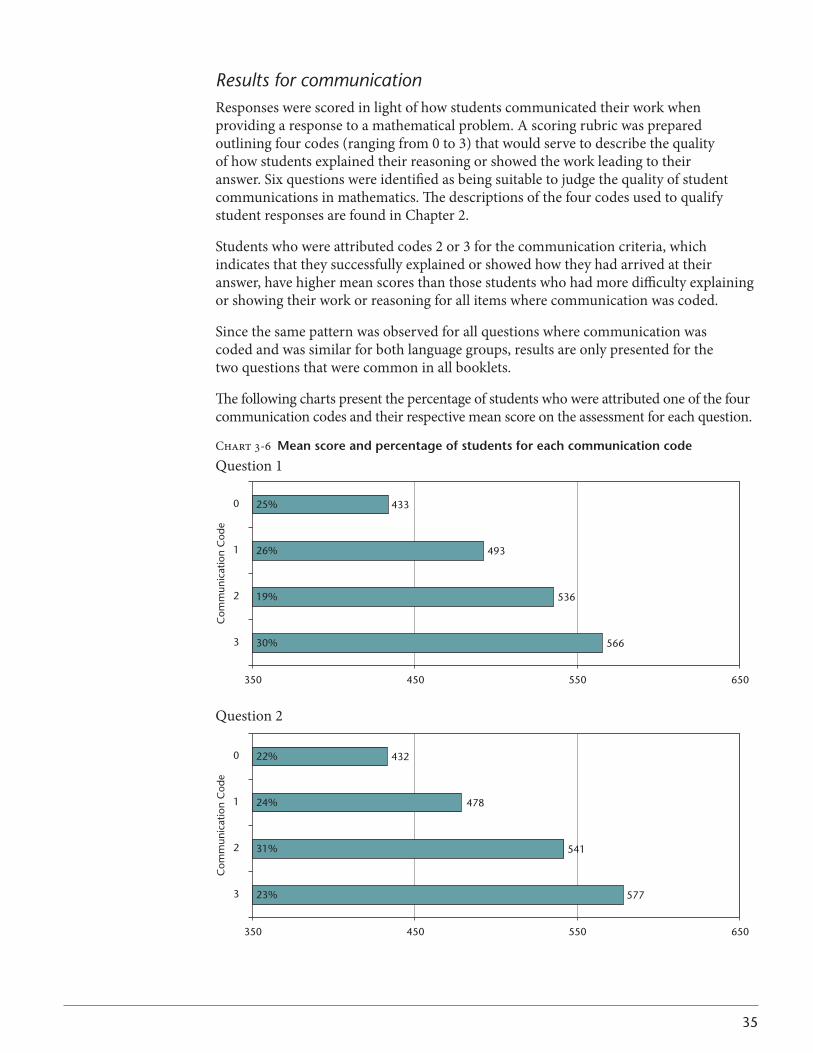
35
Results for communicationResponses were scored in light of how students communicated their work when providing a response to a mathematical problem. A scoring rubric was prepared outliningfourcodes(rangingfrom0to3)thatwouldservetodescribethequalityof how students explained their reasoning or showed the work leading to their answer.Sixquestionswereidentifiedasbeingsuitabletojudgethequalityofstudentcommunicationsinmathematics.Thedescriptionsofthefourcodesusedtoqualifystudent responses are found in Chapter 2.
Students who were attributed codes 2 or 3 for the communication criteria, which indicates that they successfully explained or showed how they had arrived at their answer,havehighermeanscoresthanthosestudentswhohadmoredifficultyexplainingor showing their work or reasoning for all items where communication was coded.
Sincethesamepatternwasobservedforallquestionswherecommunicationwas coded and was similar for both language groups, results are only presented for the twoquestionsthatwerecommoninallbooklets.
The following charts present the percentage of students who were attributed one of the four communicationcodesandtheirrespectivemeanscoreontheassessmentforeachquestion.
Chart 3-6 Mean score and percentage of students for each communication code
Question 1
3
2
1
0
350 450 550 650
566
536
493
433
30%
19%
26%
25%
Com
mun
icat
ion
Cod
e
Question 2
3
2
1
0
350
Com
mun
icat
ion
Cod
e
450 550 650
577
541
478
432
23%
31%
24%
22%

37
PCAP 2010 sCieNCe ANd ReAdiNg AssessMeNTs
Science assessment
This section presents the overall performance of Canadian students in Grade 8 in the PCAP 2010 science and reading components by comparing the performance of each jurisdiction (as expressed by a mean score) to the overall Canadian mean score. It should be noted that since these two subject areas were assessed as minor domains in PCAP 2010, no levels of performance are reported.
Describing the domainThe concept of “scientific literacy” is generally accepted as the overarching goal of science curricula across Canada. The PCAP science assessment is founded on a definition of scientific literacy that advocates that students’ evolving competencies in applying science-related attitudes, skills, and knowledge, as well as an understanding of the nature ofscience,enablethemtoconductinquiries,solveproblems,andmakeevidence-baseddecisions about science-related issues. Embedded in this definition of scientific literacy is the supposition that students have knowledge of the life sciences, physical sciences (chemistry and physics), and Earth and space sciences, as well as an understanding of the nature of science as a human endeavour.
As reflected in most science curriculum documents across Canadian provinces and territories, three competencies are associated with demonstrating scientific literacy: scienceinquiry,problemsolving,anddecisionmaking.Eachofthesecompetenciesrequiresunderstandingthenatureofscience,applyingrelevantscientificknowledge,usingskillsrequiredforscientificandtechnologicalinquiry,anddemonstratingattitudesas a reflection of scientific literacy. For the purposes of PCAP 2010, all of these are considered interrelated and mutually supportive. Additionally, one of the purposes of PCAP as identified by CMEC was to align itself with international assessments such as the Organisation for Economic Co-operation and Development’s (OECD) Programme for International Student Assessment. Adopting a similar definition of scientific literacy enhances the possibility of finding some areas of comparability between the two assessments. Finally, although the design of this framework and resulting items has been consistent with the intent of science curricula across Canada, the PCAP science assessment is not a comprehensive assessment that includes every aspect of science and all the content knowledge in every science curriculum for Canadian students in Grade 8, but it does focus on common curriculum areas for that grade level.
38
Organization of the domainThe science assessment comprises items associated with the competencies and subdomains that provide opportunities for students to demonstrate their use of science-related attitudes, skills, and knowledge. The competencies and the combination of the five interrelated subdomains as defined by curricula across Canada, as well as the statements in CMEC’s Common Framework of Science Learning Outcomes K to 127
provided the foundation for the development of all test items.
The competencies
• Scienceinquiry(addressingquestionsaboutthenatureofthings,involvingbroadexplorationsaswellasfocusedinvestigations);
• Problemsolving(seekinganswerstopracticalproblemsrequiringtheapplication oftheirscienceknowledgeinnewways);
• Decisionmaking(identifyingquestionsorissues,researchingscienceknowledgeforinformationaboutthequestionorissue,andmakingpersonaljudgments or decisions).
The subdomains
• Natureofscience(understandingthenatureofscientificknowledgeandtheprocessesbywhichthatknowledgedevelops);
• Natureoftechnology(recognizingtheinterrelationshipsbetweenscienceandtechnology);
• Knowledgeofscience(knowingtheories,models,concepts,andprinciplesinthevarious strands of science: life sciences [biology], physical sciences [chemistry and physics],andEarthandspacesciences);
• Skills(applyingcompetenciestoreal-lifesituationsinordertosolveproblemsand make informed decisions). The subdomain of skills has been categorized into four strands: initiating and planning, performing and recording, analyzing and interpreting,andcommunication;
• Attitudes(developingpositiveattitudessuchasinterestinscience,awarenessofscience-related issues, respect and support for evidence-based knowledge, and awareness of sustainable development and stewardship).
The PCAP 2010 science component comprised sets of items, each set defined (contextualized) by a specific scenario. Efforts were made to ensure that the contexts of the various scenarios were drawn from situations that were relevant, appropriate, and sensible for Canadian students in Grade 8.
7 Common Framework of Science Learning Outcomes K to 12 (1997), Council of Ministers of Education, Canada, www.cmec.ca/publications
39
Reading assessment
Describing the domainThe reading framework statement for PCAP 2010 has not been altered from that used to define reading performance in the 2007 assessment in which reading was the major domain. This enables comparisons over time between the two cohorts (see Chapter 7). According to curricula across Canada, reading is a dynamic, interactive process whereby the reader constructs meaning from texts. The process of reading effectively involves the interaction of reader, text, purpose, and context before, during, and after reading.
The reader
In order to make meaning of a text, readers must make a connection between what is in the text and what they know or bring to the text. Readers’ personal experiences, real or vicarious, allow a greater or lesser access to the content and forms of what they read. Knowledgeoflanguage,facilitywithlanguagestrategies,andknowledgeofthewaylanguage works in print affect the student’s construction of meaning in the text.
The text
Writers produce texts for a variety of purposes and use a variety of forms. Currently, many of the traditional genres have been combined or used in novel ways. Students must read a variety of texts such as those generally considered fiction and those considered non-fiction. Within that range, texts have different degrees of complexity in structure, vocabulary, syntax, organization, ideas, rhetorical devices, and subject matter. To read these forms or types successfully, students need to recognize how these forms or types of text function in different situations.
The reader’s purpose
The purpose of the reading activity affects the reader’s construction of meaning. Students read texts for a variety of purposes, ranging from the pleasure they take in thetext’scontentandstyletothepracticalinformationorpointofviewtheyacquirefrom engaging with it. Whereas particular forms or types of text are often considered aesthetic or pragmatic in intention, the reader’s purpose may differ from that intent. For example,socialstudiesstudentsmayberequiredtoreadanoveltodevelopknowledgeofa particular culture, era, or event.
The context
Context is important in any reading act because it affects the stance the reader takes toward the printed word. Context refers specifically to the physical, emotional, social, and institutional environment at the time of reading. Any meaning constructed by a reader is a reflection of the social and cultural environment in which the reader lives and reads. Peers, family, and community values affect the stance readers take as they engage with text.
40
describing the subdomains of reading
In light of the interactive process linking the reader, text, purpose, and context, this assessment of the domain of reading considers the reader’s engagement with the text and his or her response to it. Language arts curricula across Canada identify comprehension, interpretation, and response and reflection as major organizing aspects of reading literacy. In this assessment, three subdomains of the integrated process of reading are assessed: comprehension, interpretation, and response to text (which includes response and reflection).
Comprehension: Students understand the explicit and implicit information provided by the text. In particular, they understand the vocabulary, parts, elements, and events of the text.
Interpretation: Students make meaning by analyzing and synthesizing the parts/elements/events to develop a broader perspective and/or meaning for the text. They may identify theme/thesis and support that with references to details, events, symbols, patterns, and/or text features.
Response to text: In responding, the readers engage with the text in many ways: by making personal connections between aspects of the text and their own real/vicarious/priorexperiences,knowledge,valuesand/orpointofview;byrespondingemotionallytocentralideasoraspectsofthetext;and/orbytakinganevaluativestanceaboutthequalityor value of the text, possibly in relation to other texts and/or social or cultural factors.
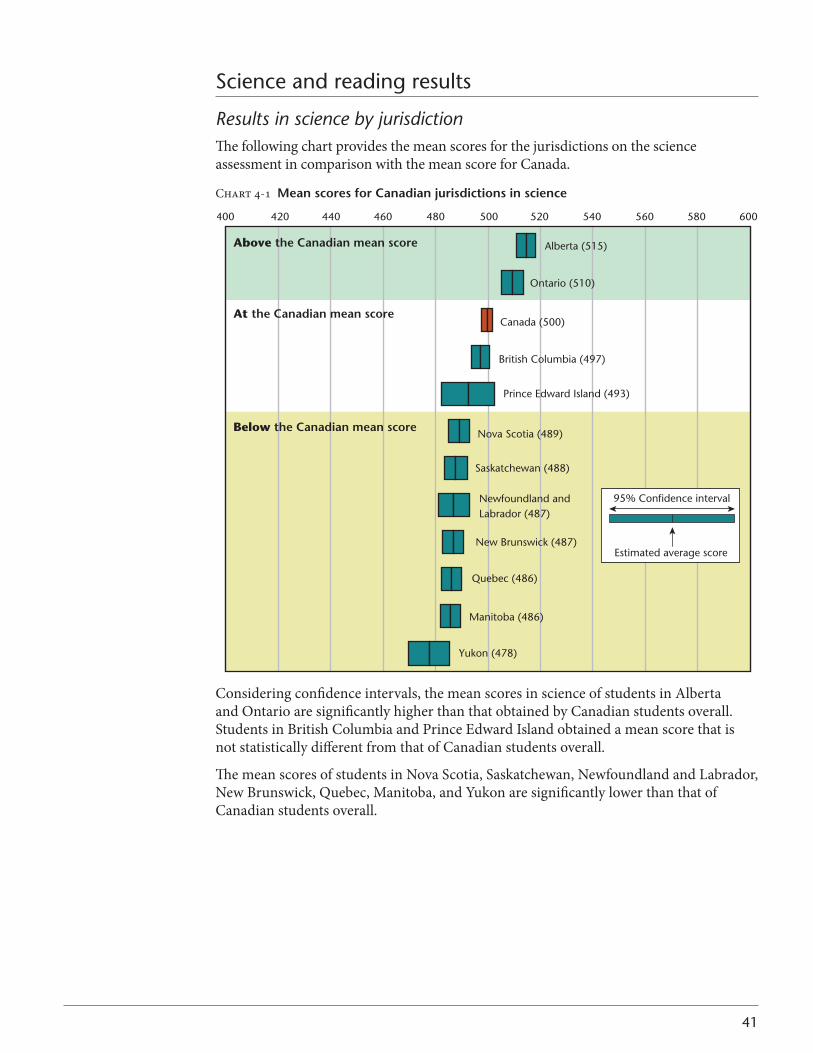
41
Science and reading results
Results in science by jurisdictionThe following chart provides the mean scores for the jurisdictions on the science assessment in comparison with the mean score for Canada.
Chart 4-1 Mean scores for Canadian jurisdictions in science
Considering confidence intervals, the mean scores in science of students in Alberta and Ontario are significantly higher than that obtained by Canadian students overall. Students in British Columbia and Prince Edward Island obtained a mean score that is not statistically different from that of Canadian students overall.
The mean scores of students in Nova Scotia, Saskatchewan, Newfoundland and Labrador, New Brunswick, Quebec, Manitoba, and Yukon are significantly lower than that of Canadian students overall.
Below the Canadian mean score
At the Canadian mean score
Above the Canadian mean score
400 420 440 460 480 500 520 540 560 580 600
95% Confidence interval
Estimated average score
Yukon (478)
Manitoba (486)
New Brunswick (487)
Quebec (486)
Newfoundland and Labrador (487)
Saskatchewan (488)
Nova Scotia (489)
Prince Edward Island (493)
British Columbia (497)
Canada (500)
Ontario (510)
Alberta (515)
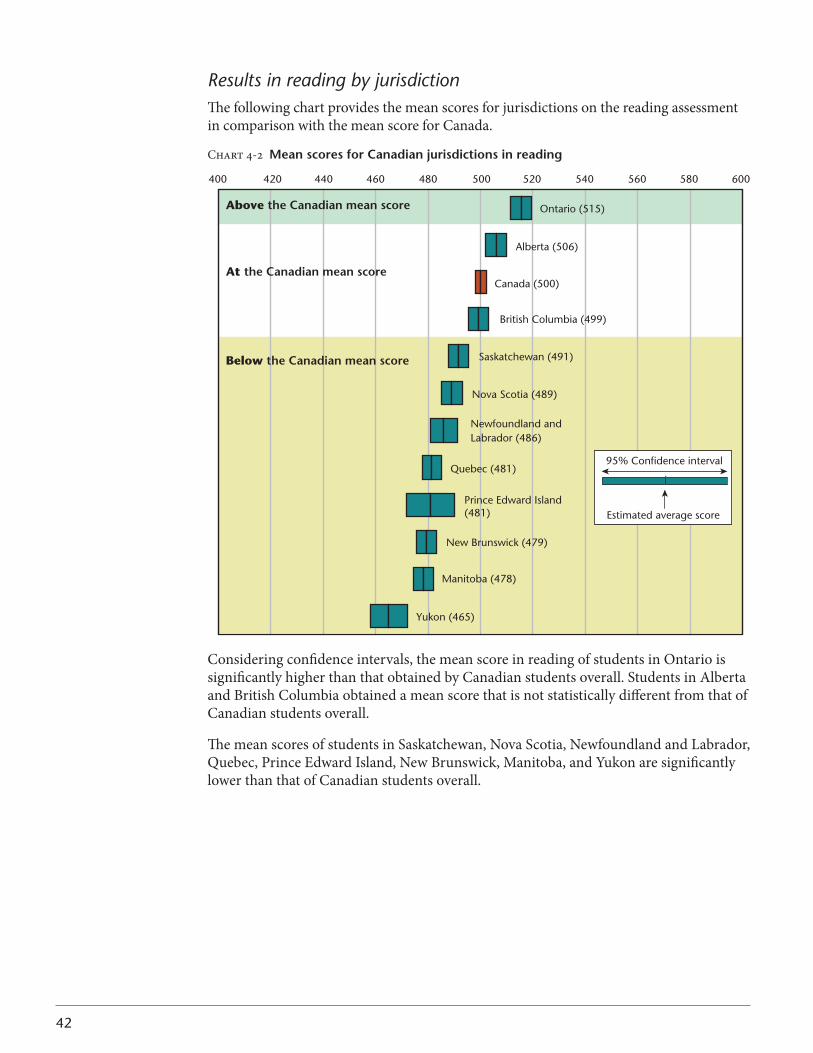
42
Results in reading by jurisdictionThe following chart provides the mean scores for jurisdictions on the reading assessment in comparison with the mean score for Canada.
Chart 4-2 Mean scores for Canadian jurisdictions in reading
Considering confidence intervals, the mean score in reading of students in Ontario is significantly higher than that obtained by Canadian students overall. Students in Alberta and British Columbia obtained a mean score that is not statistically different from that of Canadian students overall.
The mean scores of students in Saskatchewan, Nova Scotia, Newfoundland and Labrador, Quebec, Prince Edward Island, New Brunswick, Manitoba, and Yukon are significantly lower than that of Canadian students overall.
Below the Canadian mean score
At the Canadian mean score
Above the Canadian mean score
400 420 440 460 480 500 520 540 560 580 600
95% Confidence interval
Estimated average score
Yukon (465)
Manitoba (478)
New Brunswick (479)
Prince Edward Island (481)
Quebec (481)
Newfoundland and Labrador (486)
Nova Scotia (489)
Saskatchewan (491)
British Columbia (499)
Canada (500)
Alberta (506)
Ontario (515)
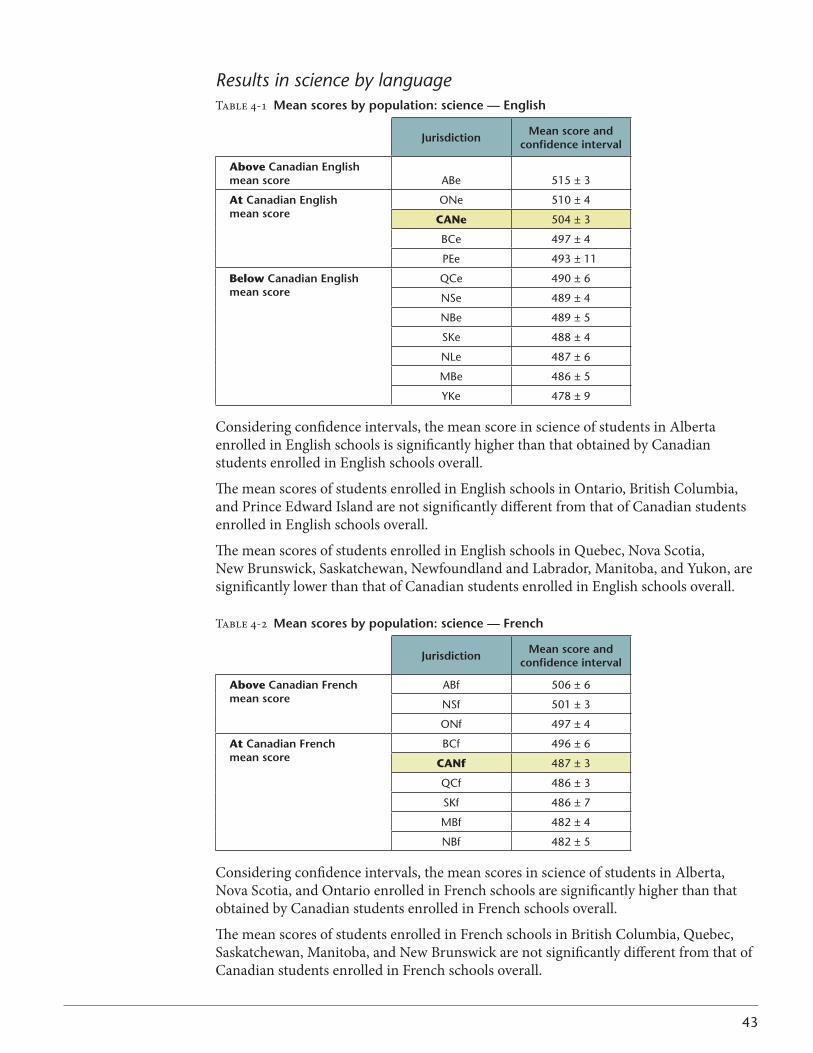
43
Results in science by languageTable 4-1 Mean scores by population: science — english
Jurisdiction Mean score and confidence interval
Above Canadian english mean score ABe 515 ± 3
At Canadian english mean score
ONe 510 ± 4
CANe 504 ± 3
BCe 497 ± 4
PEe 493 ± 11
Below Canadian english mean score
QCe 490 ± 6
NSe 489 ± 4
NBe 489 ± 5
SKe 488 ± 4
NLe 487 ± 6
MBe 486 ± 5
YKe 478 ± 9
Considering confidence intervals, the mean score in science of students in Alberta enrolled in English schools is significantly higher than that obtained by Canadian students enrolled in English schools overall.
The mean scores of students enrolled in English schools in Ontario, British Columbia, and Prince Edward Island are not significantly different from that of Canadian students enrolled in English schools overall.
The mean scores of students enrolled in English schools in Quebec, Nova Scotia, New Brunswick, Saskatchewan, Newfoundland and Labrador, Manitoba, and Yukon, are significantly lower than that of Canadian students enrolled in English schools overall.
Table 4-2 Mean scores by population: science — french
Jurisdiction Mean score and confidence interval
Above Canadian french mean score
ABf 506 ± 6
NSf 501 ± 3
ONf 497 ± 4
At Canadian french mean score
BCf 496 ± 6
CANf 487 ± 3
QCf 486 ± 3
SKf 486 ± 7
MBf 482 ± 4
NBf 482 ± 5
Considering confidence intervals, the mean scores in science of students in Alberta, Nova Scotia, and Ontario enrolled in French schools are significantly higher than that obtained by Canadian students enrolled in French schools overall.
The mean scores of students enrolled in French schools in British Columbia, Quebec, Saskatchewan, Manitoba, and New Brunswick are not significantly different from that of Canadian students enrolled in French schools overall.
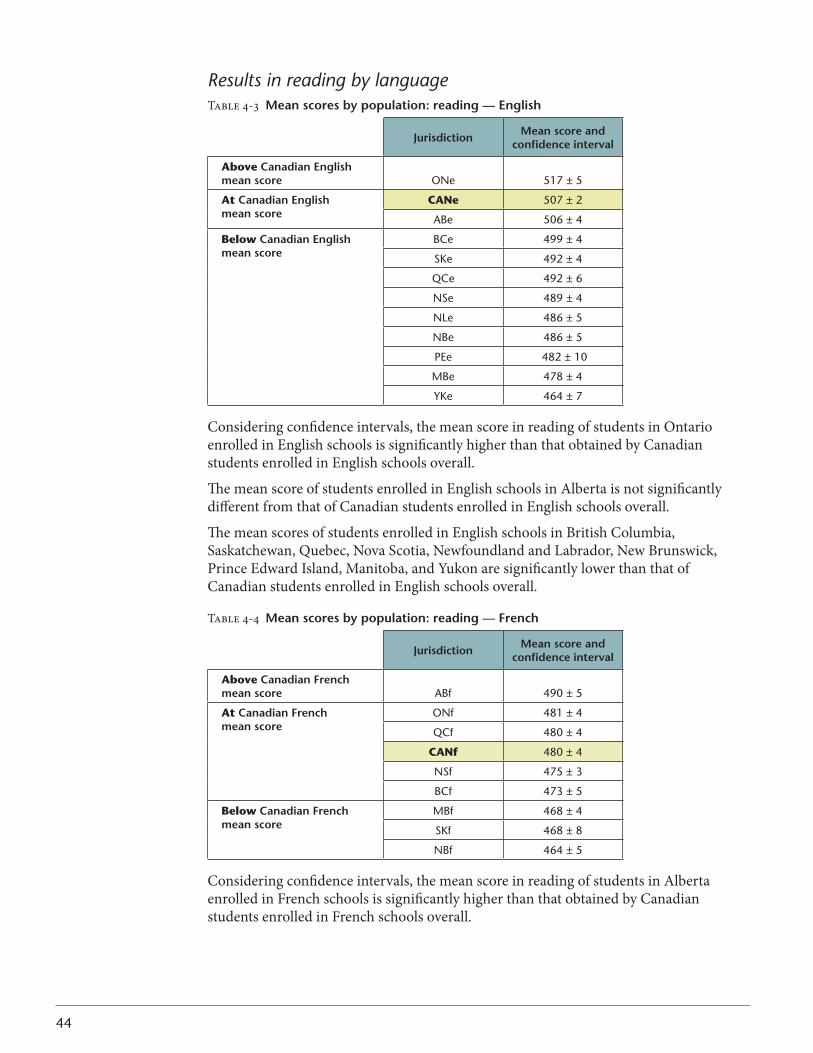
44
Results in reading by languageTable 4-3 Mean scores by population: reading — english
Jurisdiction Mean score and confidence interval
Above Canadian english mean score ONe 517 ± 5
At Canadian english mean score
CANe 507 ± 2
ABe 506 ± 4
Below Canadian english mean score
BCe 499 ± 4
SKe 492 ± 4
QCe 492 ± 6
NSe 489 ± 4
NLe 486 ± 5
NBe 486 ± 5
PEe 482 ± 10
MBe 478 ± 4
YKe 464 ± 7
Considering confidence intervals, the mean score in reading of students in Ontario enrolled in English schools is significantly higher than that obtained by Canadian students enrolled in English schools overall.
The mean score of students enrolled in English schools in Alberta is not significantly different from that of Canadian students enrolled in English schools overall.
The mean scores of students enrolled in English schools in British Columbia, Saskatchewan, Quebec, Nova Scotia, Newfoundland and Labrador, New Brunswick, Prince Edward Island, Manitoba, and Yukon are significantly lower than that of Canadian students enrolled in English schools overall.
Table 4-4 Mean scores by population: reading — french
Jurisdiction Mean score and confidence interval
Above Canadian french mean score ABf 490 ± 5
At Canadian french mean score
ONf 481 ± 4
QCf 480 ± 4
CANf 480 ± 4
NSf 475 ± 3
BCf 473 ± 5
Below Canadian french mean score
MBf 468 ± 4
SKf 468 ± 8
NBf 464 ± 5
Considering confidence intervals, the mean score in reading of students in Alberta enrolled in French schools is significantly higher than that obtained by Canadian students enrolled in French schools overall.
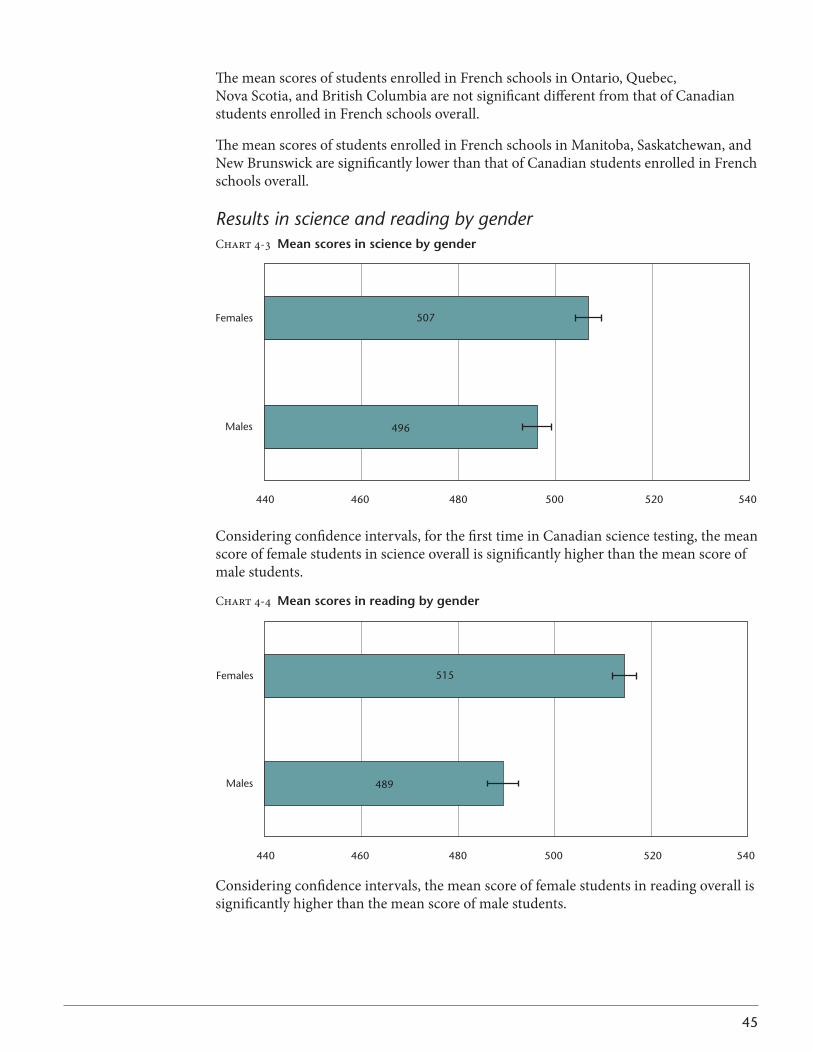
45
The mean scores of students enrolled in French schools in Ontario, Quebec, Nova Scotia, and British Columbia are not significant different from that of Canadian students enrolled in French schools overall.
The mean scores of students enrolled in French schools in Manitoba, Saskatchewan, and New Brunswick are significantly lower than that of Canadian students enrolled in French schools overall.
Results in science and reading by genderChart 4-3 Mean scores in science by gender
Considering confidence intervals, for the first time in Canadian science testing, the mean score of female students in science overall is significantly higher than the mean score of male students.
Chart 4-4 Mean scores in reading by gender
Considering confidence intervals, the mean score of female students in reading overall is significantly higher than the mean score of male students.
Males
Females
440 460 500480 520 540
496
507
Males
Females
440 460 500480 520 540
489
515

47
AssessMeNT ResulTs bY JuRisdiCTioN
BRITISH COLUMBIA
Context statement
Social contextBritish Columbia has a population of approximately four million. Eighty-six per cent of the population lives in urban areas, the largest portion of which is concentrated in the Greater Vancouver area. The province promotes achievement for all students, regardless of their backgrounds. (www.gov.bc.ca/bced)
Organization of the school systemApproximately 580,000 students are enrolled in the public school system, 70,000 are enrolled in independent schools, and 2,500 are in home schools. The province has 60 school districts, including one francophone school district.
The Conseil scolaire francophone (CSF) offers French-language educational programs to approximately 4,400 students whose parents choose to exercise their rights under Section 23 of the Canadian Charter of Rights and Freedoms. The CSF offers its programs in 38 schools across the province. The CSF program aims to help francophone students develop and maintain a sense of cultural identity in a social and educational context. The language of instruction in the schools is French, except for English language arts.
Mathematics teachingTheBCcurriculumforK–12mathematicsispublishedincurriculumdocumentsandisavailable in both English and French. The structure of the documents varies depending on when they were published. While some of the documents may contain additional teacher-support information, all of them contain the provincially prescribed curriculum (Prescribed Learning Outcomes or PLOs). Most provincial curriculum documents also contain achievement indicators, which are not mandated but describe the breadth and depth of the PLOs.
BCstudentsarerequiredtotakemathematicsfromKindergartentoGrade10.Inordertograduate,studentsarealsorequiredtocompleteaGrade11-orGrade12-levelmathematics course. The provincial mathematics curriculum is based on the Western and Northern Canadian Protocol Common Curriculum Framework and is organized around four curriculum strands: number, patterns and relations, shape and space, and statistics and probability. Additional information, as well as the curriculum documents, can be found on the ministry of education Web site. (www.bced.gov.bc.ca/irp/subject.php?lang=en&subject=Mathematics)
The mathematics curriculum is also offered in French for students enrolled in the French Immersion program.
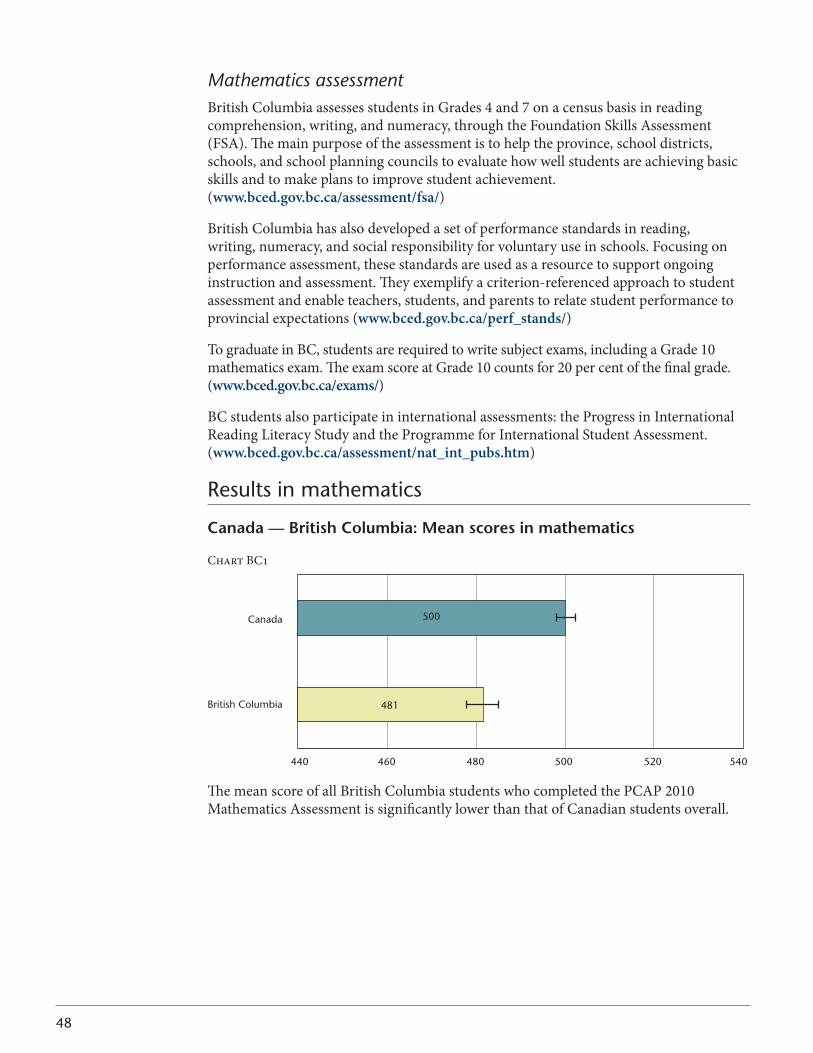
48
Mathematics assessmentBritish Columbia assesses students in Grades 4 and 7 on a census basis in reading comprehension, writing, and numeracy, through the Foundation Skills Assessment (FSA). The main purpose of the assessment is to help the province, school districts, schools, and school planning councils to evaluate how well students are achieving basic skills and to make plans to improve student achievement. (www.bced.gov.bc.ca/assessment/fsa/)
British Columbia has also developed a set of performance standards in reading, writing, numeracy, and social responsibility for voluntary use in schools. Focusing on performance assessment, these standards are used as a resource to support ongoing instruction and assessment. They exemplify a criterion-referenced approach to student assessment and enable teachers, students, and parents to relate student performance to provincial expectations (www.bced.gov.bc.ca/perf_stands/)
TograduateinBC,studentsarerequiredtowritesubjectexams,includingaGrade10mathematics exam. The exam score at Grade 10 counts for 20 per cent of the final grade. (www.bced.gov.bc.ca/exams/)
BC students also participate in international assessments: the Progress in International Reading Literacy Study and the Programme for International Student Assessment. (www.bced.gov.bc.ca/assessment/nat_int_pubs.htm)
Results in mathematics
Canada — british Columbia: Mean scores in mathematics
Chart BC1
The mean score of all British Columbia students who completed the PCAP 2010 Mathematics Assessment is significantly lower than that of Canadian students overall.
British Columbia
Canada
440 460 500480 520 540
481
500

49
Canada — british Columbia: Comparison of results in mathematics by language
Table BC(E)1
Jurisdiction Mean score and confidence interval
CANe 495 ± 2
bCe 481 ± 4
Considering confidence intervals, the mean score of British Columbia students enrolled in English schools is significantly lower than that of Canadian students enrolled in English schools overall.
Table BC(F)1
Jurisdiction Mean score and confidence interval
CANf 515 ± 4
bCf 504 ± 5
The mean score of British Columbia students enrolled in French schools is significantly lower than that of Canadian students enrolled in French schools overall.
Canada — british Columbia: Comparison of results in mathematics by levels
Chart BC2
The proportion of British Columbia students performing at level 2 and above is lower than that of Canadian students overall.
CAN
BC
0% 20% 40% 60% 80% 100%
9
11
45
50
43
37
4
2
Level 1 Level 2 Level 3 Level 4
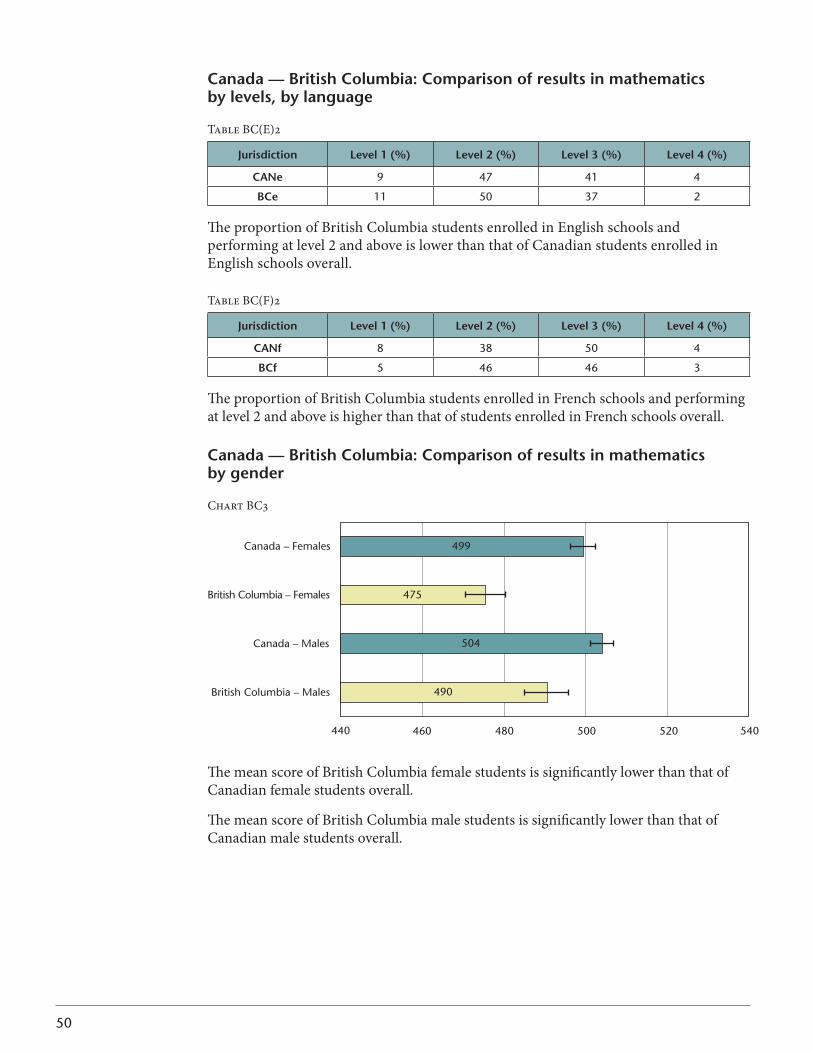
50
Canada — british Columbia: Comparison of results in mathematics by levels, by language
Table BC(E)2
Jurisdiction level 1 (%) level 2 (%) level 3 (%) level 4 (%)
CANe 9 47 41 4
bCe 11 50 37 2
The proportion of British Columbia students enrolled in English schools and performing at level 2 and above is lower than that of Canadian students enrolled in English schools overall.
Table BC(F)2
Jurisdiction level 1 (%) level 2 (%) level 3 (%) level 4 (%)
CANf 8 38 50 4
bCf 5 46 46 3
The proportion of British Columbia students enrolled in French schools and performing at level 2 and above is higher than that of students enrolled in French schools overall.
Canada — british Columbia: Comparison of results in mathematics by gender
Chart BC3
440 540460 480 500 520
British Columbia – Males
Canada – Males
British Columbia – Females
Canada – Females
490
504
475
499
The mean score of British Columbia female students is significantly lower than that of Canadian female students overall.
The mean score of British Columbia male students is significantly lower than that of Canadian male students overall.
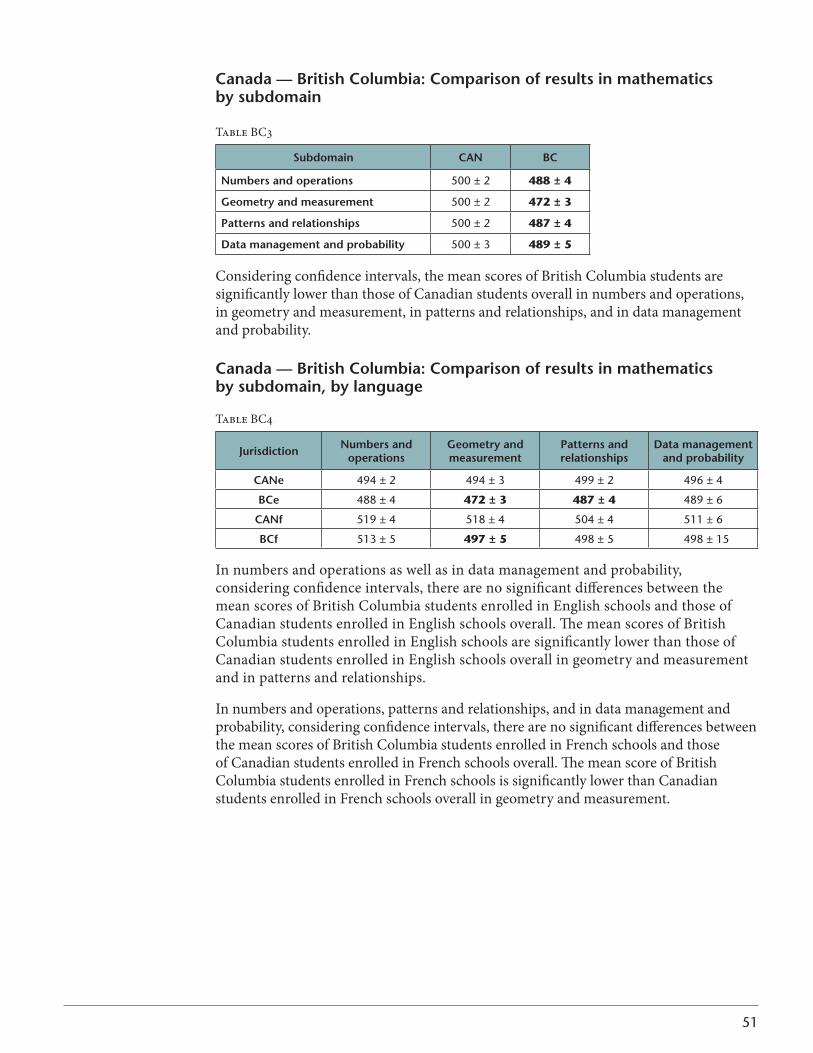
51
Canada — british Columbia: Comparison of results in mathematics by subdomain
Table BC3
subdomain CAN bC
Numbers and operations 500 ± 2 488 ± 4
geometry and measurement 500 ± 2 472 ± 3
Patterns and relationships 500 ± 2 487 ± 4
data management and probability 500 ± 3 489 ± 5
Considering confidence intervals, the mean scores of British Columbia students are significantly lower than those of Canadian students overall in numbers and operations, in geometry and measurement, in patterns and relationships, and in data management and probability.
Canada — british Columbia: Comparison of results in mathematics by subdomain, by language
Table BC4
Jurisdiction Numbers and operations
geometry and measurement
Patterns and relationships
data managementand probability
CANe 494 ± 2 494 ± 3 499 ± 2 496 ± 4
bCe 488 ± 4 472 ± 3 487 ± 4 489 ± 6
CANf 519 ± 4 518 ± 4 504 ± 4 511 ± 6
bCf 513 ± 5 497 ± 5 498 ± 5 498 ± 15
In numbers and operations as well as in data management and probability, considering confidence intervals, there are no significant differences between the mean scores of British Columbia students enrolled in English schools and those of Canadian students enrolled in English schools overall. The mean scores of British Columbia students enrolled in English schools are significantly lower than those of Canadian students enrolled in English schools overall in geometry and measurement and in patterns and relationships.
In numbers and operations, patterns and relationships, and in data management and probability, considering confidence intervals, there are no significant differences between the mean scores of British Columbia students enrolled in French schools and those of Canadian students enrolled in French schools overall. The mean score of British Columbia students enrolled in French schools is significantly lower than Canadian students enrolled in French schools overall in geometry and measurement.
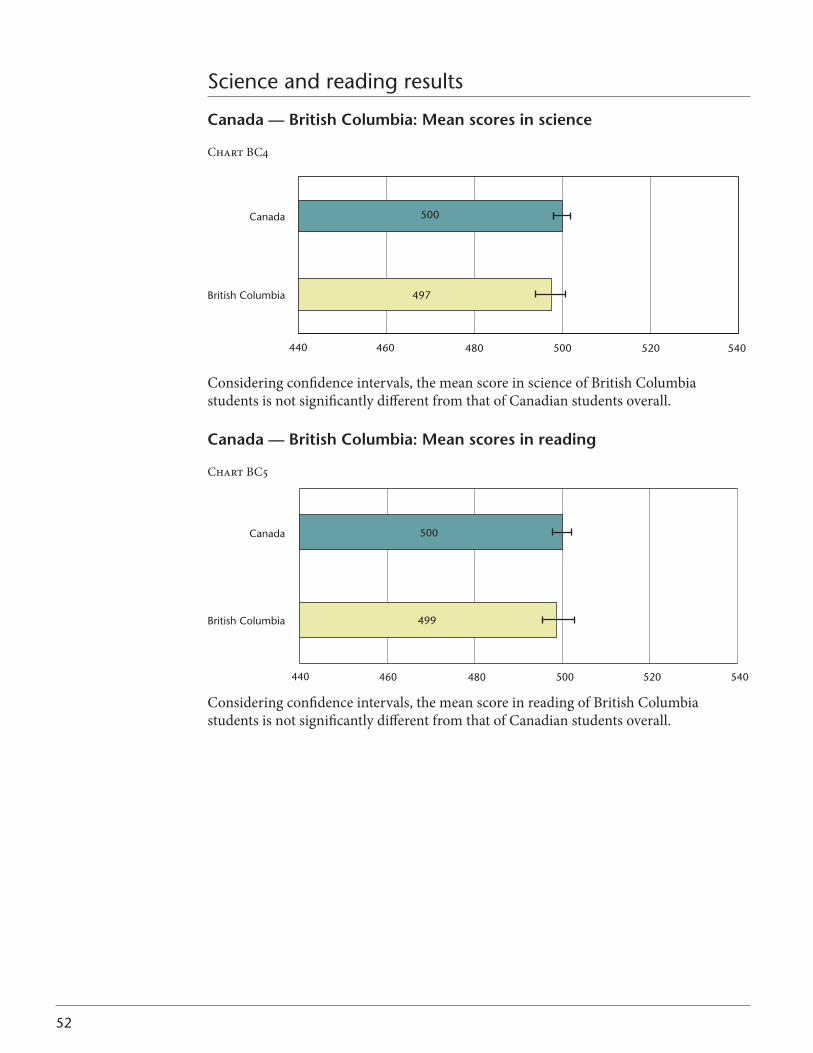
52
Science and reading results
Canada — british Columbia: Mean scores in science
Chart BC4
497
500
British Columbia
Canada
440 540520500480460
Considering confidence intervals, the mean score in science of British Columbia students is not significantly different from that of Canadian students overall.
Canada — british Columbia: Mean scores in reading
Chart BC5
499
500
British Columbia
Canada
440 540520500480460
Considering confidence intervals, the mean score in reading of British Columbia students is not significantly different from that of Canadian students overall.
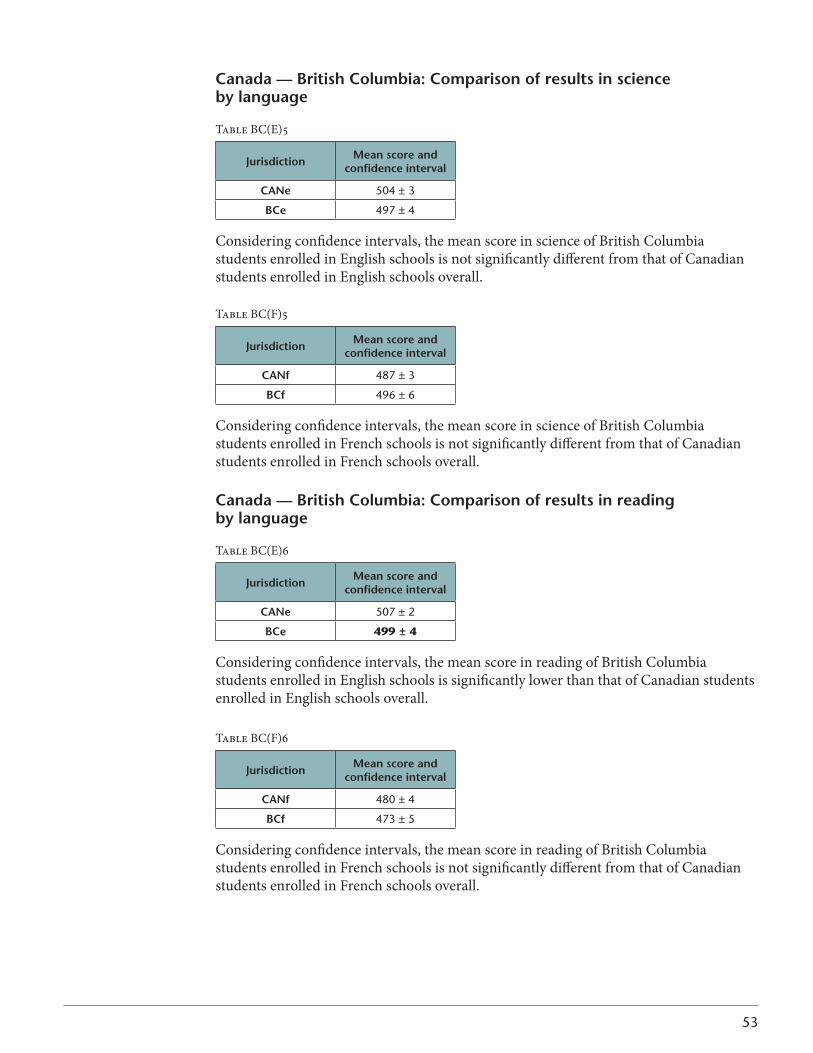
53
Canada — british Columbia: Comparison of results in science by language
Table BC(E)5
Jurisdiction Mean score and confidence interval
CANe 504 ± 3
bCe 497 ± 4
Considering confidence intervals, the mean score in science of British Columbia students enrolled in English schools is not significantly different from that of Canadian students enrolled in English schools overall.
Table BC(F)5
Jurisdiction Mean score and confidence interval
CANf 487 ± 3
bCf 496 ± 6
Considering confidence intervals, the mean score in science of British Columbia students enrolled in French schools is not significantly different from that of Canadian students enrolled in French schools overall.
Canada — british Columbia: Comparison of results in reading by language
Table BC(E)6
Jurisdiction Mean score and confidence interval
CANe 507 ± 2
bCe 499 ± 4
Considering confidence intervals, the mean score in reading of British Columbia students enrolled in English schools is significantly lower than that of Canadian students enrolled in English schools overall.
Table BC(F)6
Jurisdiction Mean score and confidence interval
CANf 480 ± 4
bCf 473 ± 5
Considering confidence intervals, the mean score in reading of British Columbia students enrolled in French schools is not significantly different from that of Canadian students enrolled in French schools overall.
54
ALBERTA
Context statement
Social contextAlberta has a multicultural population of approximately three million. All Albertans arerequiredtoattendschoolfromtheageof6to16.TheprovincialgovernmenthastheprimaryresponsibilityforeducationfromKindergartentoGrade12andsharesthisresponsibility with local school boards.
Organization of the school systemIn the 2009-2010 school year, 606,627 Albertan students were registered in 2,165 schools. Of these students, 69 per cent attended public schools, 22 per cent attended separate schools, and the remaining 9 per cent attended a variety of private, charter, special, and federal schools. About 5,565 students (0.9 per cent) were enrolled in French-first-language programs offered by the five francophone school authorities.
FromKindergartenthroughtoGrade11,allstudentsarerequiredtobeenrolledinmathematics.FromKindergartentoGrade7,theprogramsofstudydescribeonemathematics program per grade. Beginning in Grade 8, students may be enrolled in Mathematics8orKnowledgeandEmployabilityMathematics8.
KnowledgeandEmployabilityMathematicsisfocusedonessentialmathematicsknowledge, skills, and attitudes needed for everyday living at home, in the workplace, and in the community. The courses emphasize career and life skills, teamwork, communication skills, and thinking processes.
Thesenior-high-schoolmathematicsprogramcurrentlyhasfourcoursesequences: PureMathematics10-20-30;AppliedMathematics10-20-30;Mathematics14and24;and Mathematics 10-4 and 20-4. Implementation of the revised senior-high mathematics programs of study began in September 2010, starting with the new Grade 10 courses.
The Pure Mathematics courses are designed to prepare students for a wide range of postsecondaryprogramsthatrequireagoodfoundationofmathematicalknowledgeandunderstanding. The Applied Mathematics courses are designed to provide students with exposure to many of the same mathematical concepts but with less reliance on algebra, and are intended to prepare students for postsecondary programs that do not have a rigorousmathematicalrequirement.TheMathematics14and24coursesareintendedfor students who will enter the workforce directly from high school. The Mathematics 10-4and20-4coursesareforstudentsenrolledintheKnowledgeandEmployabilityMathematics program.
CurrentgraduationrequirementsforanAlbertaHighSchoolDiplomarequireastudentto successfully complete one of Pure Mathematics 20, Applied Mathematics 20, or Mathematics 24.
55
Mathematics teachingAlberta schools provide a variety of learning experiences so that students can appreciate and value mathematics, communicate and reason mathematically, engage and persevere in problem solving, and make informed decisions as contributors to society.
The following principles provide the framework for the mathematics program:• Studentsarecurious,activelearnerswithindividualinterests,abilities,andneeds.• Learningthroughproblemsolvingisthefocusofmathematicsatalllevels.• Thefocusofstudentlearningshouldbeondevelopingaconceptualandprocedural
understanding of mathematics which must be directly related to each other.• Studentslearnbyattachingmeaningtowhattheydo,andtheyneedtoconstructtheir
own meaning of mathematics.• Students’understandingofmathematicsisbestdevelopedwhentheyencounter
mathematical experiences that proceed from the simple to the complex and from the concrete to the abstract.
• Atalllevels,studentsbenefitfromworkingwithavarietyofmaterials,tools,andcontexts when constructing meaning about new mathematical ideas.
• Studentsneedtoexperienceconcrete,pictorial,andsymbolicrepresentationsofmathematical concepts, and the links among these representations are developed through meaningful student discussions.
• Studentsneedtosolveproblemsinavarietyofwaysandtounderstandthatavarietyof solutions may be acceptable.
• Thelearningenvironmentshouldvalueandrespectthediversityofstudents’experiences and ways of thinking so that students are comfortable taking intellectual risks,askingquestions,andposingconjectures.
• Thesevenmathematicalprocesses(communication,connections,mentalmathematics and estimation, problem solving, reasoning, technology, and visualization) are critical components that students must encounter in order to achieve the goals of mathematics education and embrace lifelong learning in mathematics.
• Thecomponentsofthenatureofmathematics(constancy,numbersense,patterns, relationships, spatial sense, and uncertainty) are woven throughout the mathematics program.
ThelearningoutcomesoftheprogramsofstudyforKindergartentoGrade9areorganized into four strands: number, patterns and relations, shape and space, and statistics and probability. The programs of study are stated in terms of general outcomes, specific outcomes, and achievement indicators. For the senior-high-school courses, general and specific outcomes are organized by topic.
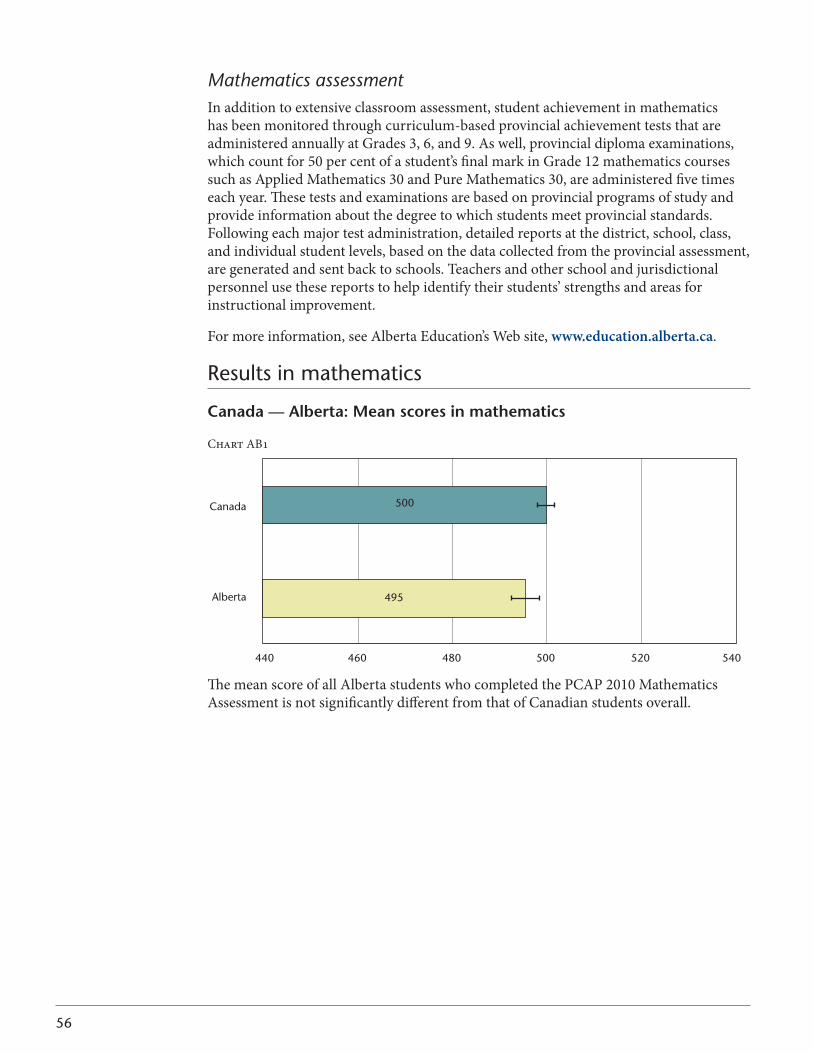
56
Mathematics assessmentIn addition to extensive classroom assessment, student achievement in mathematics has been monitored through curriculum-based provincial achievement tests that are administered annually at Grades 3, 6, and 9. As well, provincial diploma examinations, which count for 50 per cent of a student’s final mark in Grade 12 mathematics courses such as Applied Mathematics 30 and Pure Mathematics 30, are administered five times each year. These tests and examinations are based on provincial programs of study and provide information about the degree to which students meet provincial standards. Following each major test administration, detailed reports at the district, school, class, and individual student levels, based on the data collected from the provincial assessment, are generated and sent back to schools. Teachers and other school and jurisdictional personnel use these reports to help identify their students’ strengths and areas for instructional improvement.
For more information, see Alberta Education’s Web site, www.education.alberta.ca.
Results in mathematics
Canada — Alberta: Mean scores in mathematics
Chart AB1
The mean score of all Alberta students who completed the PCAP 2010 Mathematics Assessment is not significantly different from that of Canadian students overall.
Alberta
Canada
440 460 500480 520 540
495
500
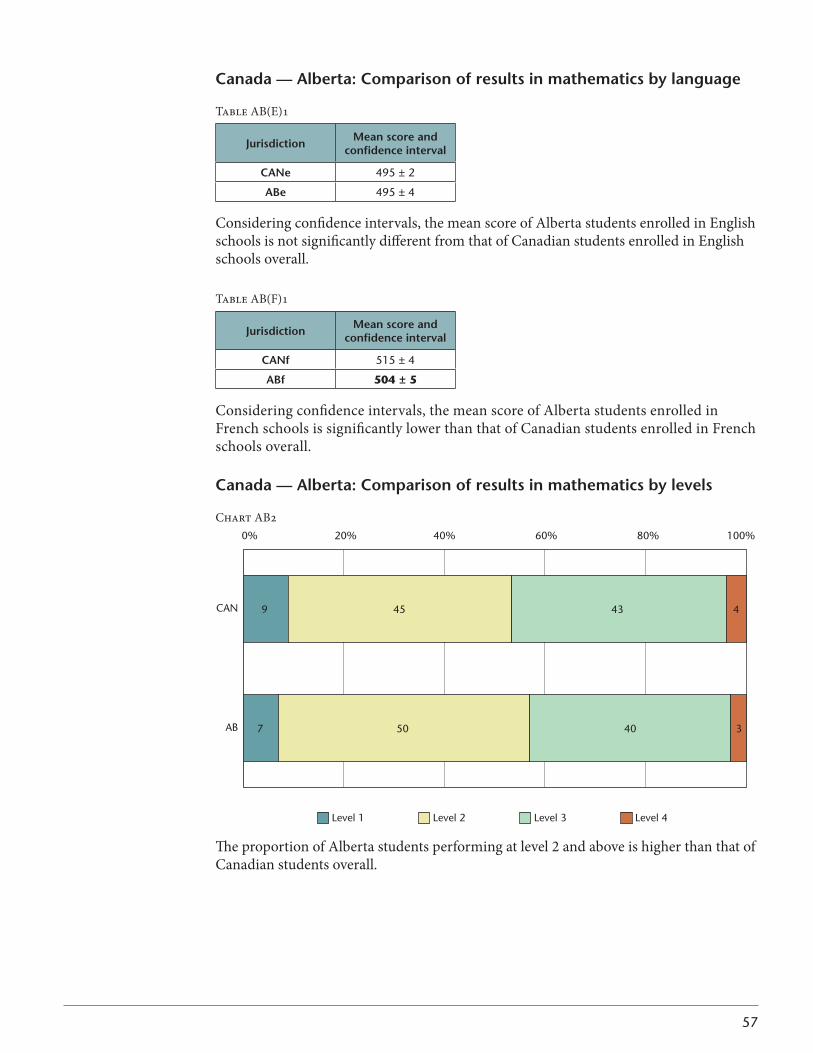
57
Canada — Alberta: Comparison of results in mathematics by language
Table AB(E)1
Jurisdiction Mean score and confidence interval
CANe 495 ± 2
Abe 495 ± 4
Considering confidence intervals, the mean score of Alberta students enrolled in English schools is not significantly different from that of Canadian students enrolled in English schools overall.
Table AB(F)1
Jurisdiction Mean score and confidence interval
CANf 515 ± 4
Abf 504 ± 5
Considering confidence intervals, the mean score of Alberta students enrolled in French schools is significantly lower than that of Canadian students enrolled in French schools overall.
Canada — Alberta: Comparison of results in mathematics by levels
Chart AB2
The proportion of Alberta students performing at level 2 and above is higher than that of Canadian students overall.
CAN
AB
0% 20% 40% 60% 80% 100%
Level 1 Level 2 Level 3 Level 4
9
7
45
50
43
40
4
3
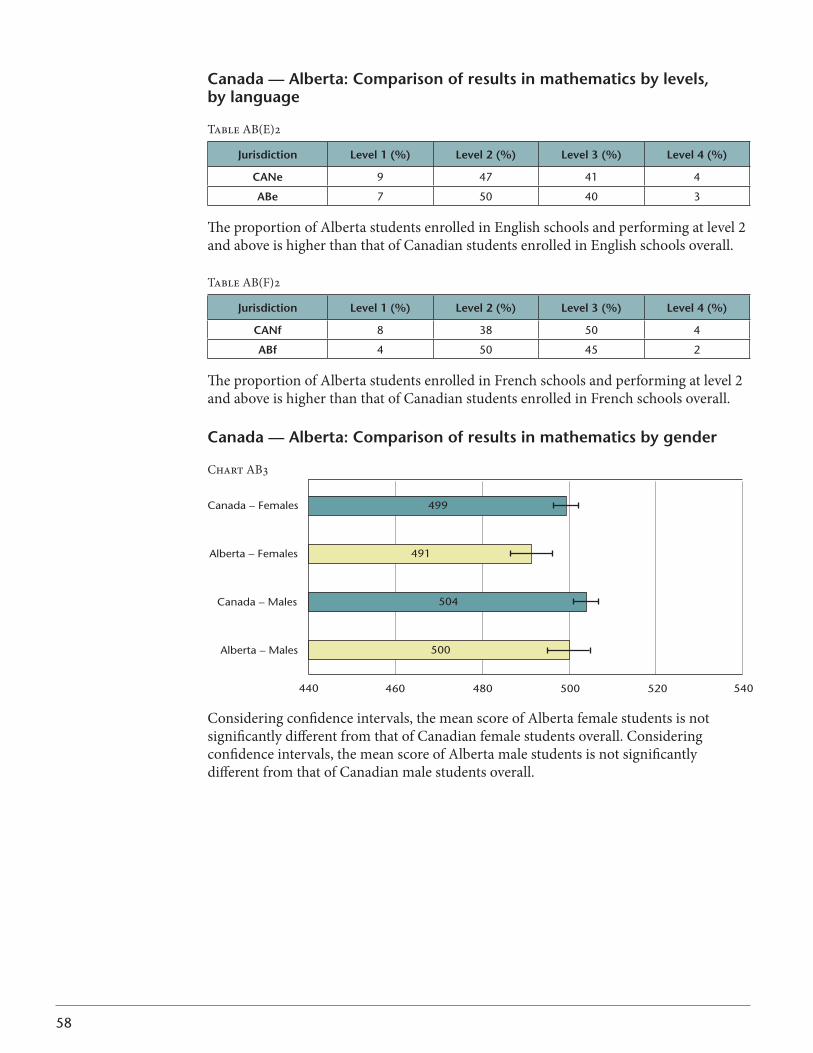
58
Canada — Alberta: Comparison of results in mathematics by levels, by language
Table AB(E)2
Jurisdiction level 1 (%) level 2 (%) level 3 (%) level 4 (%)
CANe 9 47 41 4
Abe 7 50 40 3
The proportion of Alberta students enrolled in English schools and performing at level 2 and above is higher than that of Canadian students enrolled in English schools overall.
Table AB(F)2
Jurisdiction level 1 (%) level 2 (%) level 3 (%) level 4 (%)
CANf 8 38 50 4
Abf 4 50 45 2
The proportion of Alberta students enrolled in French schools and performing at level 2 and above is higher than that of Canadian students enrolled in French schools overall.
Canada — Alberta: Comparison of results in mathematics by gender
Chart AB3
Alberta – Males
Canada – Males
Alberta – Females
Canada – Females
440 540460 480 500 520
500
504
491
499
Considering confidence intervals, the mean score of Alberta female students is not significantly different from that of Canadian female students overall. Considering confidence intervals, the mean score of Alberta male students is not significantly different from that of Canadian male students overall.
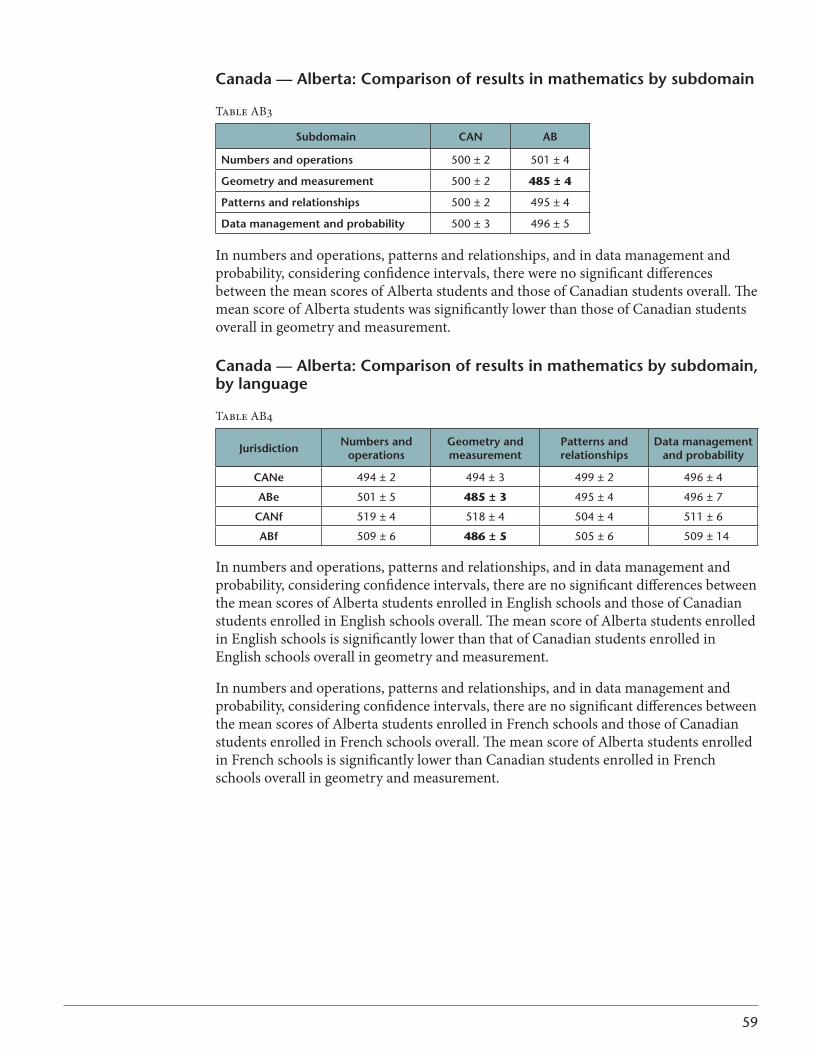
59
Canada — Alberta: Comparison of results in mathematics by subdomain
Table AB3
subdomain CAN Ab
Numbers and operations 500 ± 2 501 ± 4
geometry and measurement 500 ± 2 485 ± 4
Patterns and relationships 500 ± 2 495 ± 4
data management and probability 500 ± 3 496 ± 5
In numbers and operations, patterns and relationships, and in data management and probability, considering confidence intervals, there were no significant differences between the mean scores of Alberta students and those of Canadian students overall. The mean score of Alberta students was significantly lower than those of Canadian students overall in geometry and measurement.
Canada — Alberta: Comparison of results in mathematics by subdomain, by language
Table AB4
Jurisdiction Numbers and operations
geometry and measurement
Patterns and relationships
data managementand probability
CANe 494 ± 2 494 ± 3 499 ± 2 496 ± 4
Abe 501 ± 5 485 ± 3 495 ± 4 496 ± 7
CANf 519 ± 4 518 ± 4 504 ± 4 511 ± 6
Abf 509 ± 6 486 ± 5 505 ± 6 509 ± 14
In numbers and operations, patterns and relationships, and in data management and probability, considering confidence intervals, there are no significant differences between the mean scores of Alberta students enrolled in English schools and those of Canadian students enrolled in English schools overall. The mean score of Alberta students enrolled in English schools is significantly lower than that of Canadian students enrolled in English schools overall in geometry and measurement.
In numbers and operations, patterns and relationships, and in data management and probability, considering confidence intervals, there are no significant differences between the mean scores of Alberta students enrolled in French schools and those of Canadian students enrolled in French schools overall. The mean score of Alberta students enrolled in French schools is significantly lower than Canadian students enrolled in French schools overall in geometry and measurement.
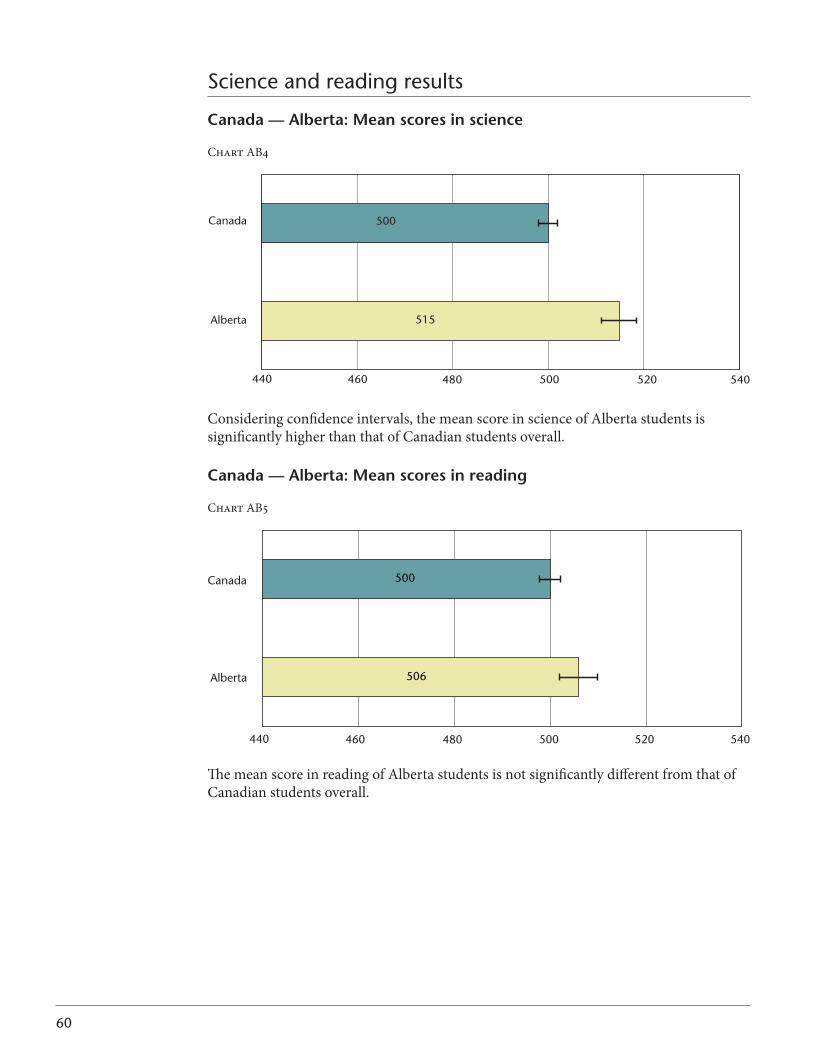
60
Science and reading results
Canada — Alberta: Mean scores in science
Chart AB4
Considering confidence intervals, the mean score in science of Alberta students is significantly higher than that of Canadian students overall.
Canada — Alberta: Mean scores in reading
Chart AB5
The mean score in reading of Alberta students is not significantly different from that of Canadian students overall.
515
500
Alberta
Canada
440 540520500480460
506
500
Alberta
Canada
440 540520500480460
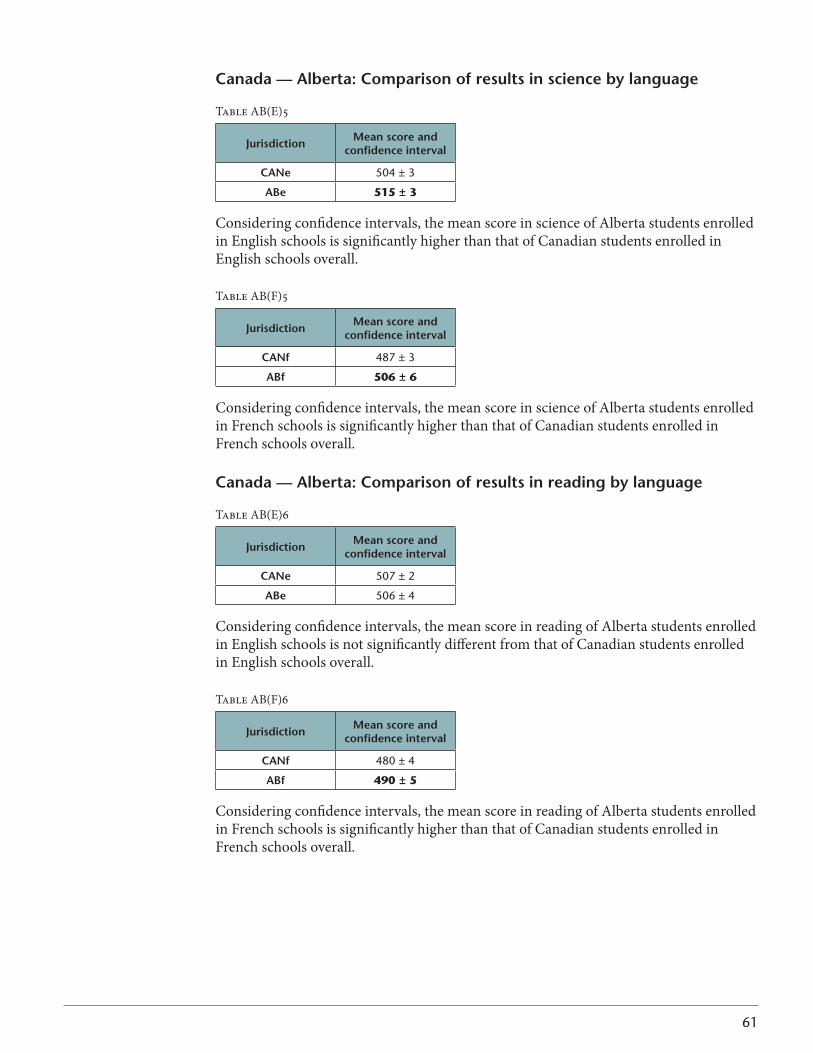
61
Canada — Alberta: Comparison of results in science by language
Table AB(E)5
Jurisdiction Mean score and confidence interval
CANe 504 ± 3
Abe 515 ± 3
Considering confidence intervals, the mean score in science of Alberta students enrolled in English schools is significantly higher than that of Canadian students enrolled in English schools overall.
Table AB(F)5
Jurisdiction Mean score and confidence interval
CANf 487 ± 3
Abf 506 ± 6
Considering confidence intervals, the mean score in science of Alberta students enrolled in French schools is significantly higher than that of Canadian students enrolled in French schools overall.
Canada — Alberta: Comparison of results in reading by language
Table AB(E)6
Jurisdiction Mean score and confidence interval
CANe 507 ± 2
Abe 506 ± 4
Considering confidence intervals, the mean score in reading of Alberta students enrolled in English schools is not significantly different from that of Canadian students enrolled in English schools overall.
Table AB(F)6
Jurisdiction Mean score and confidence interval
CANf 480 ± 4
Abf 490 ± 5
Considering confidence intervals, the mean score in reading of Alberta students enrolled in French schools is significantly higher than that of Canadian students enrolled in French schools overall.
62
SASKATCHEWAN
Context statement
Social contextSaskatchewan has a population of a little over one million, its largest population in the past 60 years, which is spread throughout a vast geographic area. About half of Saskatchewan’s population lives in towns, villages, rural municipalities or on First Nations reserves, giving a strong rural influence in the province. Potash and uranium mining, oil production, agriculture, and forestry are the major industries. Saskatchewan has a diverse cultural and ethnic heritage, including a large and growing First Nation and Métis population.
Organization of the school systemSaskatchewan has approximately 180,000 kindergarten to Grade 12 students. About 89 per cent of elementary/secondary students attend 719 publicly funded provincial schools;9percentattendFirstNationschoolsandtheremainderattendindependentschools or are home-schooled. The provincial average class size is 20.8 students per class. This represents an increase from 2006 in both urban and rural schools, with the typical rural classroom having about three fewer students than the typical urban classroom.
Mathematics teachingThe aim of the mathematics program in Saskatchewan is to graduate individuals who value mathematics and appreciate its role in society. The program seeks to prepare students to cope confidently and competently with everyday situations that demand theuseofmathematicalconcepts,includinginterpretingquantitativeinformation,estimating, performing calculations mentally, measuring, understanding spatial relationships, and problem solving. The mathematics program is intended to stimulate thespiritofinquirywithinthecontextofmathematicalthinkingandreasoning.Studentsexperience mathematics through various strands: numbers, patterns and relations, shape and space, and statistics and probability. Students should be encouraged to challenge the boundaries of their experiences and to view mathematics as a set of tools and a way of thinking that every society develops to meet its particular needs.Experiencing broad-based mathematics through exploration of and interaction in interesting and relevant situations provides all students with the mathematical preparation essential to:• developandbeabletoapplymathematicalreasoningprocesses,skills,andstrategies
tonewsituationsandproblems;• developanunderstandingofthemeaningof,relationshipsbetween,propertiesof,
roles of, and representations (including symbolic) of numbers and to apply this understandingtonewsituationsandproblems;and
• developanunderstandingof2-Dshapesand3-Dobjectsandtherelationshipsbetween geometrical shapes and objects and numbers, and to apply this understanding to new situations and problems.
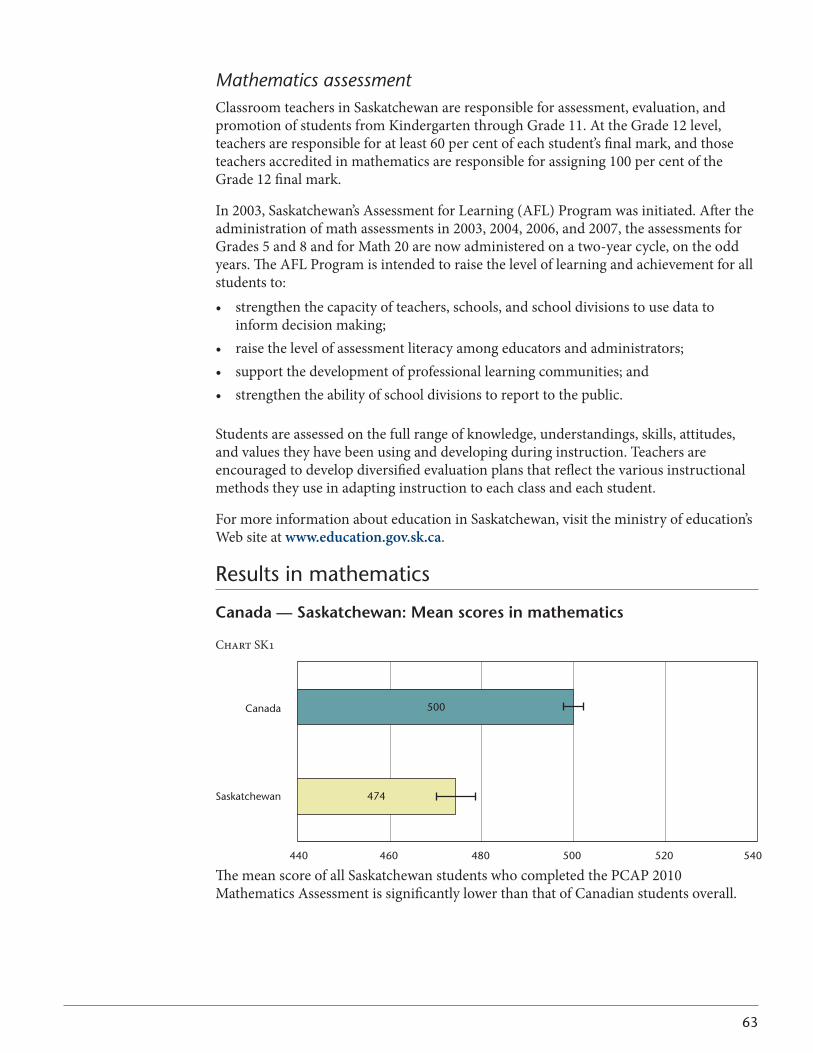
63
Mathematics assessmentClassroom teachers in Saskatchewan are responsible for assessment, evaluation, and promotionofstudentsfromKindergartenthroughGrade11.AttheGrade12level,teachers are responsible for at least 60 per cent of each student’s final mark, and those teachers accredited in mathematics are responsible for assigning 100 per cent of the Grade 12 final mark.
In 2003, Saskatchewan’s Assessment for Learning (AFL) Program was initiated. After the administration of math assessments in 2003, 2004, 2006, and 2007, the assessments for Grades 5 and 8 and for Math 20 are now administered on a two-year cycle, on the odd years. The AFL Program is intended to raise the level of learning and achievement for all students to:• strengthenthecapacityofteachers,schools,andschooldivisionstousedatato
informdecisionmaking;• raisethelevelofassessmentliteracyamongeducatorsandadministrators;• supportthedevelopmentofprofessionallearningcommunities;and• strengthentheabilityofschooldivisionstoreporttothepublic.
Students are assessed on the full range of knowledge, understandings, skills, attitudes, and values they have been using and developing during instruction. Teachers are encouraged to develop diversified evaluation plans that reflect the various instructional methods they use in adapting instruction to each class and each student.
For more information about education in Saskatchewan, visit the ministry of education’s Web site at www.education.gov.sk.ca.
Results in mathematics
Canada — saskatchewan: Mean scores in mathematics
ChartSK1
Saskatchewan
Canada
440 460 500480 520 540
500
474
The mean score of all Saskatchewan students who completed the PCAP 2010 Mathematics Assessment is significantly lower than that of Canadian students overall.
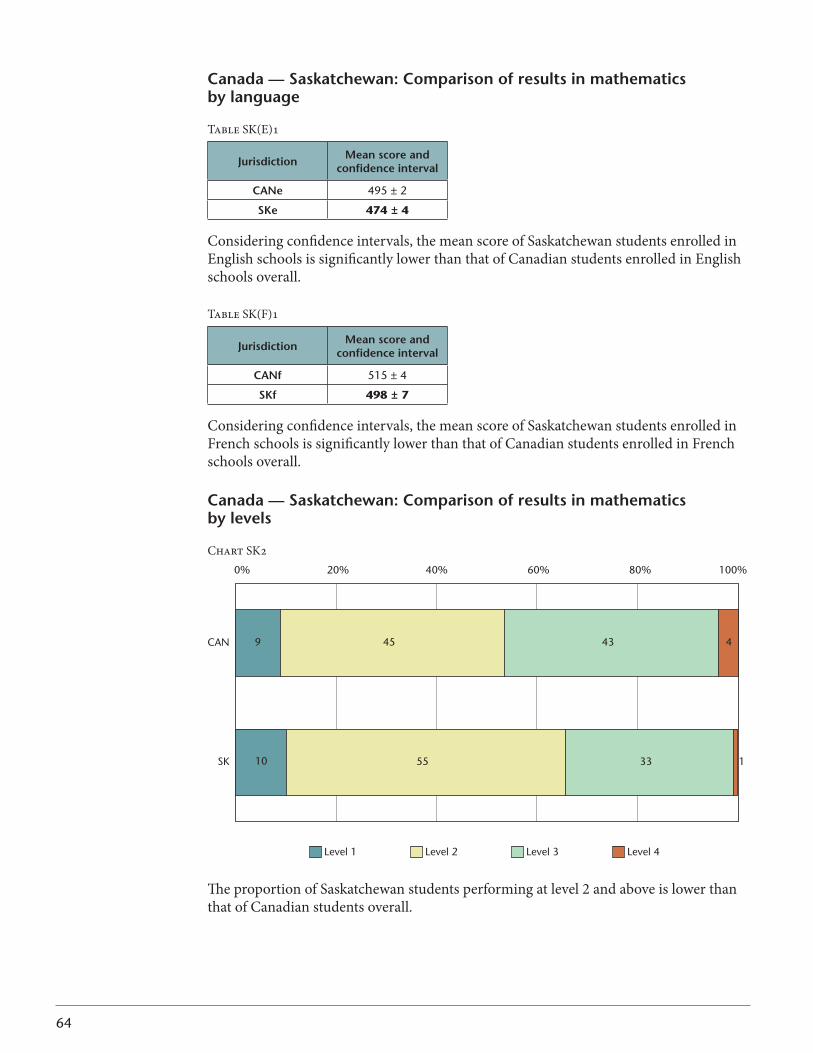
64
Canada — saskatchewan: Comparison of results in mathematics by language
TableSK(E)1
Jurisdiction Mean score and confidence interval
CANe 495 ± 2
sKe 474 ± 4
Considering confidence intervals, the mean score of Saskatchewan students enrolled in English schools is significantly lower than that of Canadian students enrolled in English schools overall.
TableSK(F)1
Jurisdiction Mean score and confidence interval
CANf 515 ± 4
sKf 498 ± 7
Considering confidence intervals, the mean score of Saskatchewan students enrolled in French schools is significantly lower than that of Canadian students enrolled in French schools overall.
Canada — saskatchewan: Comparison of results in mathematics by levels
ChartSK2
CAN
SK
0% 20% 40% 60% 80% 100%
Level 1 Level 2 Level 3 Level 4
9
10
45
55
43
33
4
1
The proportion of Saskatchewan students performing at level 2 and above is lower than that of Canadian students overall.
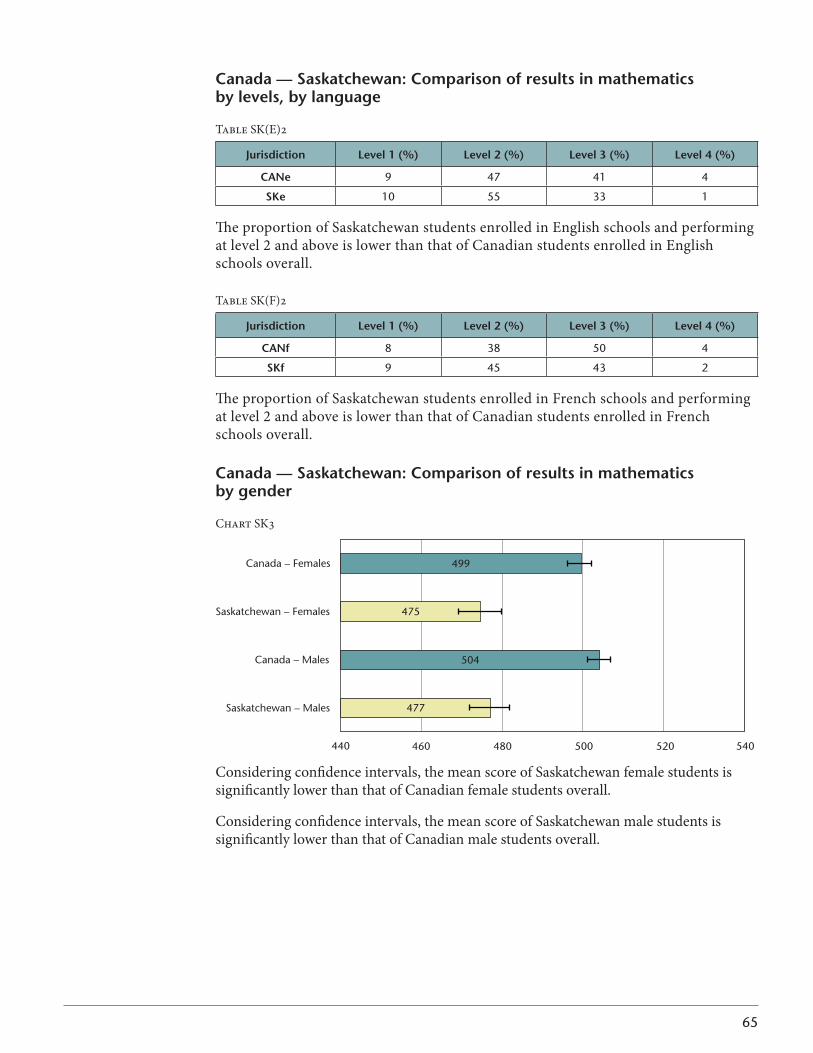
65
Canada — saskatchewan: Comparison of results in mathematics by levels, by language
TableSK(E)2
Jurisdiction level 1 (%) level 2 (%) level 3 (%) level 4 (%)
CANe 9 47 41 4
sKe 10 55 33 1
The proportion of Saskatchewan students enrolled in English schools and performing at level 2 and above is lower than that of Canadian students enrolled in English schools overall.
TableSK(F)2
Jurisdiction level 1 (%) level 2 (%) level 3 (%) level 4 (%)
CANf 8 38 50 4
sKf 9 45 43 2
The proportion of Saskatchewan students enrolled in French schools and performing at level 2 and above is lower than that of Canadian students enrolled in French schools overall.
Canada — saskatchewan: Comparison of results in mathematics by gender
ChartSK3
440 540460 480 500 520
Saskatchewan – Males
Canada – Males
Saskatchewan – Females
Canada – Females
477
504
475
499
Considering confidence intervals, the mean score of Saskatchewan female students is significantly lower than that of Canadian female students overall.
Considering confidence intervals, the mean score of Saskatchewan male students is significantly lower than that of Canadian male students overall.
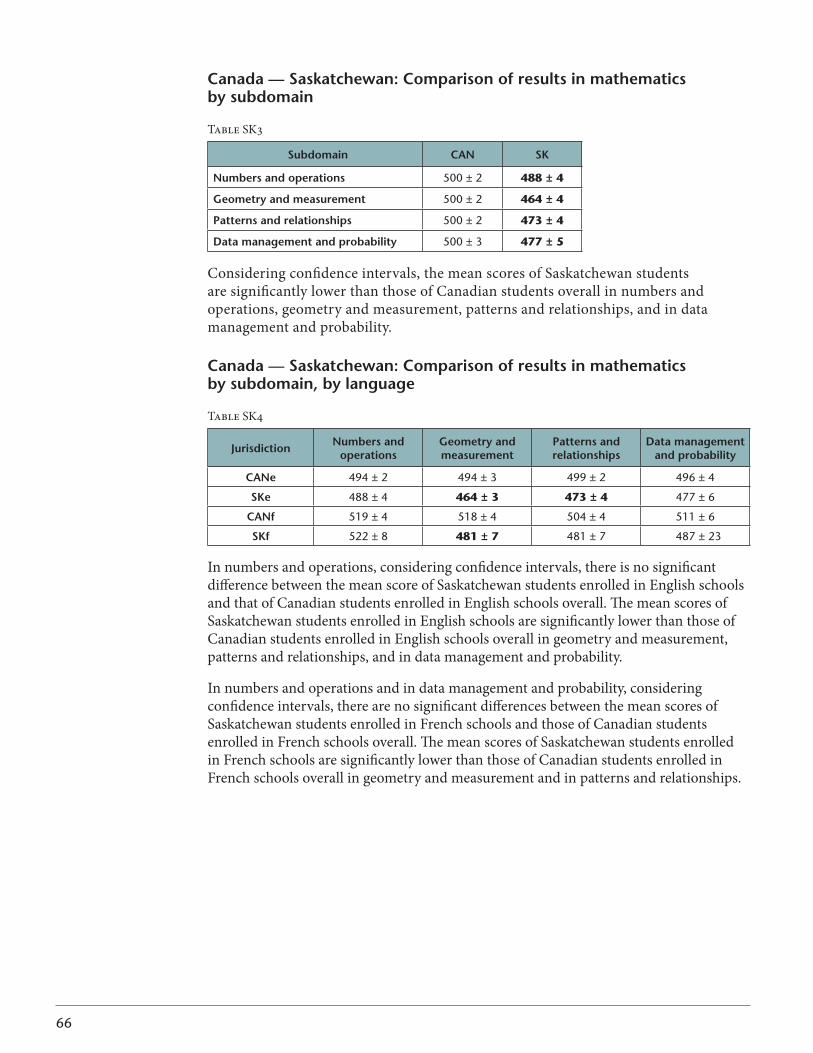
66
Canada — saskatchewan: Comparison of results in mathematics by subdomain
TableSK3
subdomain CAN sK
Numbers and operations 500 ± 2 488 ± 4
geometry and measurement 500 ± 2 464 ± 4
Patterns and relationships 500 ± 2 473 ± 4
data management and probability 500 ± 3 477 ± 5
Considering confidence intervals, the mean scores of Saskatchewan students are significantly lower than those of Canadian students overall in numbers and operations, geometry and measurement, patterns and relationships, and in data management and probability.
Canada — saskatchewan: Comparison of results in mathematics by subdomain, by language
TableSK4
Jurisdiction Numbers and operations
geometry and measurement
Patterns and relationships
data managementand probability
CANe 494 ± 2 494 ± 3 499 ± 2 496 ± 4
sKe 488 ± 4 464 ± 3 473 ± 4 477 ± 6
CANf 519 ± 4 518 ± 4 504 ± 4 511 ± 6
sKf 522 ± 8 481 ± 7 481 ± 7 487 ± 23
In numbers and operations, considering confidence intervals, there is no significant difference between the mean score of Saskatchewan students enrolled in English schools and that of Canadian students enrolled in English schools overall. The mean scores of Saskatchewan students enrolled in English schools are significantly lower than those of Canadian students enrolled in English schools overall in geometry and measurement, patterns and relationships, and in data management and probability.
In numbers and operations and in data management and probability, considering confidence intervals, there are no significant differences between the mean scores of Saskatchewan students enrolled in French schools and those of Canadian students enrolled in French schools overall. The mean scores of Saskatchewan students enrolled in French schools are significantly lower than those of Canadian students enrolled in French schools overall in geometry and measurement and in patterns and relationships.
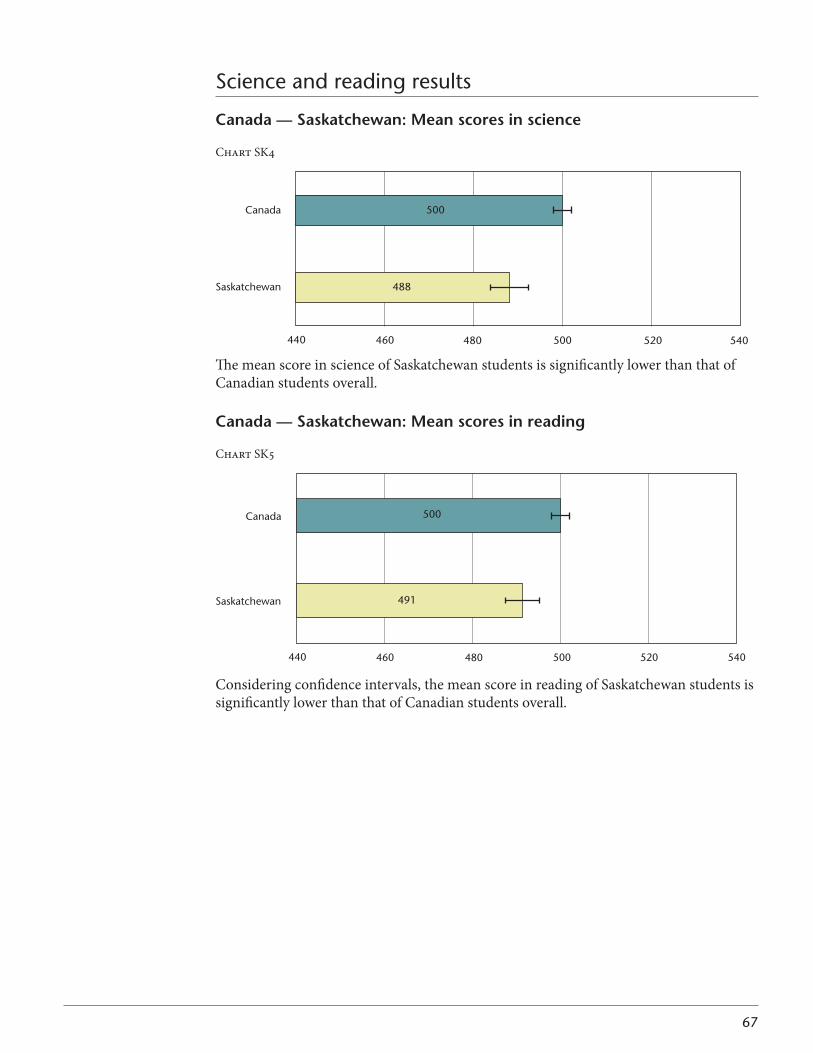
67
Science and reading results
Canada — saskatchewan: Mean scores in science
ChartSK4
488
500
Saskatchewan
Canada
440 540520500480460
The mean score in science of Saskatchewan students is significantly lower than that of Canadian students overall.
Canada — saskatchewan: Mean scores in reading
ChartSK5
491
500
Saskatchewan
Canada
440 540520500480460
Considering confidence intervals, the mean score in reading of Saskatchewan students is significantly lower than that of Canadian students overall.
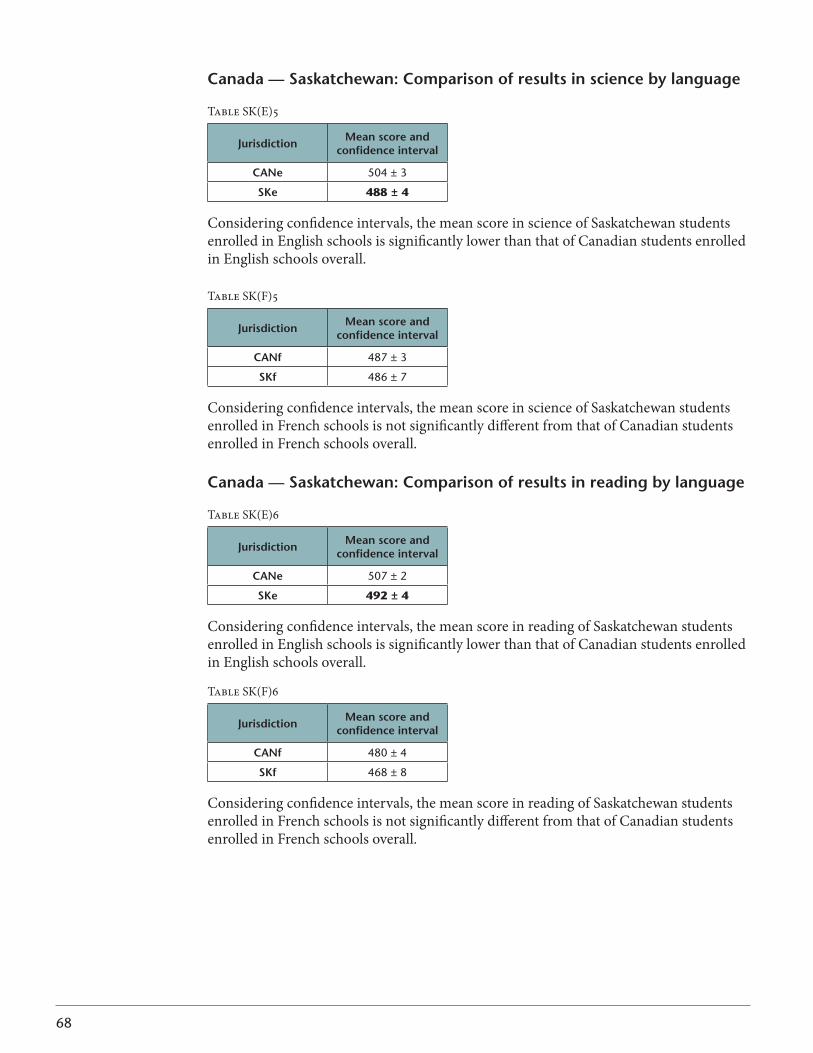
68
Canada — saskatchewan: Comparison of results in science by language
TableSK(E)5
Jurisdiction Mean score and confidence interval
CANe 504 ± 3
sKe 488 ± 4
Considering confidence intervals, the mean score in science of Saskatchewan students enrolled in English schools is significantly lower than that of Canadian students enrolled in English schools overall.
TableSK(F)5
Jurisdiction Mean score and confidence interval
CANf 487 ± 3
sKf 486 ± 7
Considering confidence intervals, the mean score in science of Saskatchewan students enrolled in French schools is not significantly different from that of Canadian students enrolled in French schools overall.
Canada — saskatchewan: Comparison of results in reading by language
TableSK(E)6
Jurisdiction Mean score and confidence interval
CANe 507 ± 2
sKe 492 ± 4
Considering confidence intervals, the mean score in reading of Saskatchewan students enrolled in English schools is significantly lower than that of Canadian students enrolled in English schools overall.
TableSK(F)6
Jurisdiction Mean score and confidence interval
CANf 480 ± 4
sKf 468 ± 8
Considering confidence intervals, the mean score in reading of Saskatchewan students enrolled in French schools is not significantly different from that of Canadian students enrolled in French schools overall.
69
MANITOBA
Context statement
Social contextManitoba has a population of approximately 1.2 million people, about 60 per cent of whom reside in the capital city of Winnipeg. Manitoba’s population comprises a wide range of ethnic and cultural groups, including a strong Franco-Manitoban community and an Aboriginal community, in both rural and urban areas. Manitoba has a broad and diverse economic base.
Organization of the school systemManitoba’spublicschoolsystemenrolsabout193,000studentsinKindergartento Grade 12 and employs about 13,000 teachers in 37 school divisions and districts. Students may choose courses from four school programs — English Program, Français Program (about 2.7 per cent of students), French Immersion Program (about 10 per cent of students), and Senior Years Technology Education Program. Children who have one francophone parent may attend the non-geographical Division scolaire franco-manitobaine, which offers the Français Program. Other educational options include private schools, home schooling, and federally funded on-reserve schools for First Nation students.Schoolsareencouragedtogroupgradesaccordingtoearlyyears(Kindergartento Grade 4), middle years (Grades 5 to 8), and senior years (Grades 9 to 12).
Public schools and provincially funded independent schools participated in PCAP (www.edu.gov.mb.ca/k12). Students in the Français Program participated in French. FrenchImmersionstudentsparticipatedineitherlanguage,atthechoiceoftheschool;their results, however, are included with Manitoba English.
Mathematics teachingManitoba’s mathematics curricula were developed following the province’s involvement with the Western and Northern Canadian Protocol for Collaboration in Education (WNCP,2006;www.wncp.ca). In May 2006, WNCP published The Common Curriculum Framework for K–9 Mathematics. Manitoba published Kindergarten to Grade 8 Mathematics: Manitoba Curriculum Framework of OutcomesinMay2008.Kindergartento Grade 8 schools in Manitoba implemented this revised curriculum in the 2008-2009 school year. General and specific learning outcomes describe the mathematical knowledge and skills that students are expected to learn at each grade level.
InJanuary2008,WNCPpublished The Common Curriculum Framework for Grades 10–12 Mathematics. Manitoba published Grades 9 to 12 Mathematics: Manitoba Curriculum Framework of Outcomes in May 2009. Implementation of the revised senior-years courses began in September 2009 and will continue through to September 2012.
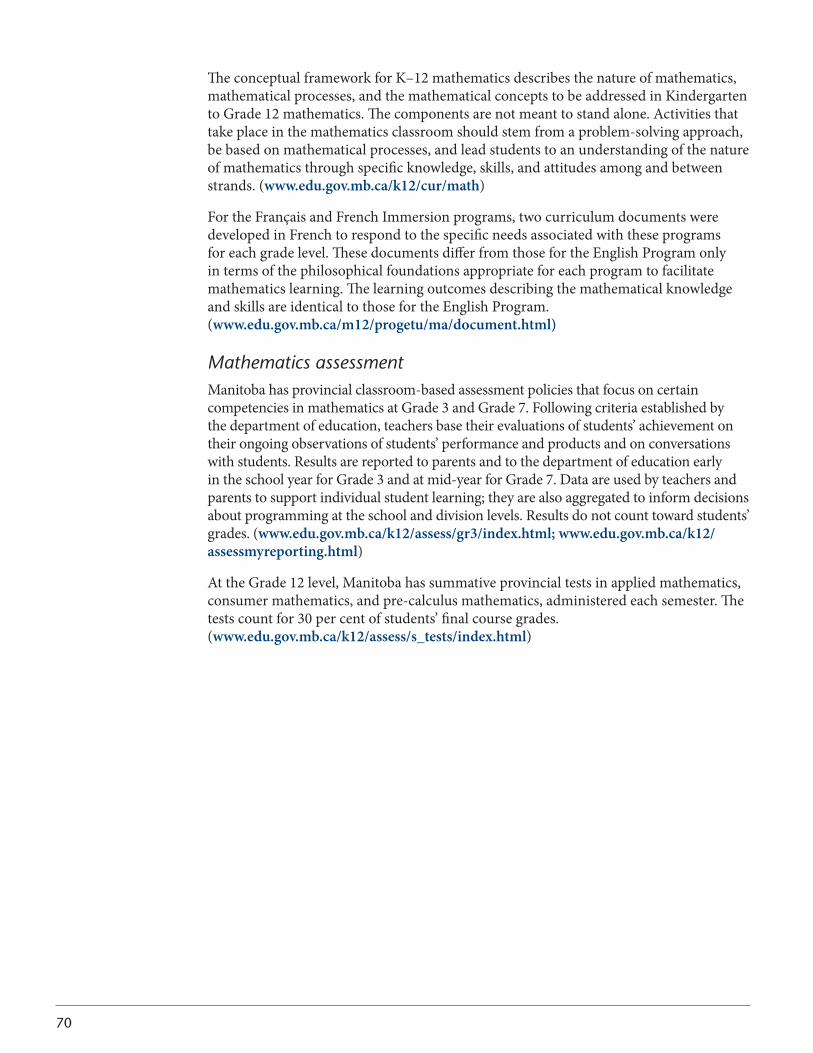
70
TheconceptualframeworkforK–12mathematicsdescribesthenatureofmathematics,mathematicalprocesses,andthemathematicalconceptstobeaddressedinKindergartento Grade 12 mathematics. The components are not meant to stand alone. Activities that take place in the mathematics classroom should stem from a problem-solving approach, be based on mathematical processes, and lead students to an understanding of the nature of mathematics through specific knowledge, skills, and attitudes among and between strands. (www.edu.gov.mb.ca/k12/cur/math)
For the Français and French Immersion programs, two curriculum documents were developed in French to respond to the specific needs associated with these programs for each grade level. These documents differ from those for the English Program only in terms of the philosophical foundations appropriate for each program to facilitate mathematics learning. The learning outcomes describing the mathematical knowledge and skills are identical to those for the English Program. (www.edu.gov.mb.ca/m12/progetu/ma/document.html)
Mathematics assessmentManitoba has provincial classroom-based assessment policies that focus on certain competencies in mathematics at Grade 3 and Grade 7. Following criteria established by the department of education, teachers base their evaluations of students’ achievement on their ongoing observations of students’ performance and products and on conversations with students. Results are reported to parents and to the department of education early in the school year for Grade 3 and at mid-year for Grade 7. Data are used by teachers and parentstosupportindividualstudentlearning;theyarealsoaggregatedtoinformdecisionsabout programming at the school and division levels. Results do not count toward students’ grades. (www.edu.gov.mb.ca/k12/assess/gr3/index.html; www.edu.gov.mb.ca/k12/assessmyreporting.html)
At the Grade 12 level, Manitoba has summative provincial tests in applied mathematics, consumer mathematics, and pre-calculus mathematics, administered each semester. The tests count for 30 per cent of students’ final course grades. (www.edu.gov.mb.ca/k12/assess/s_tests/index.html)
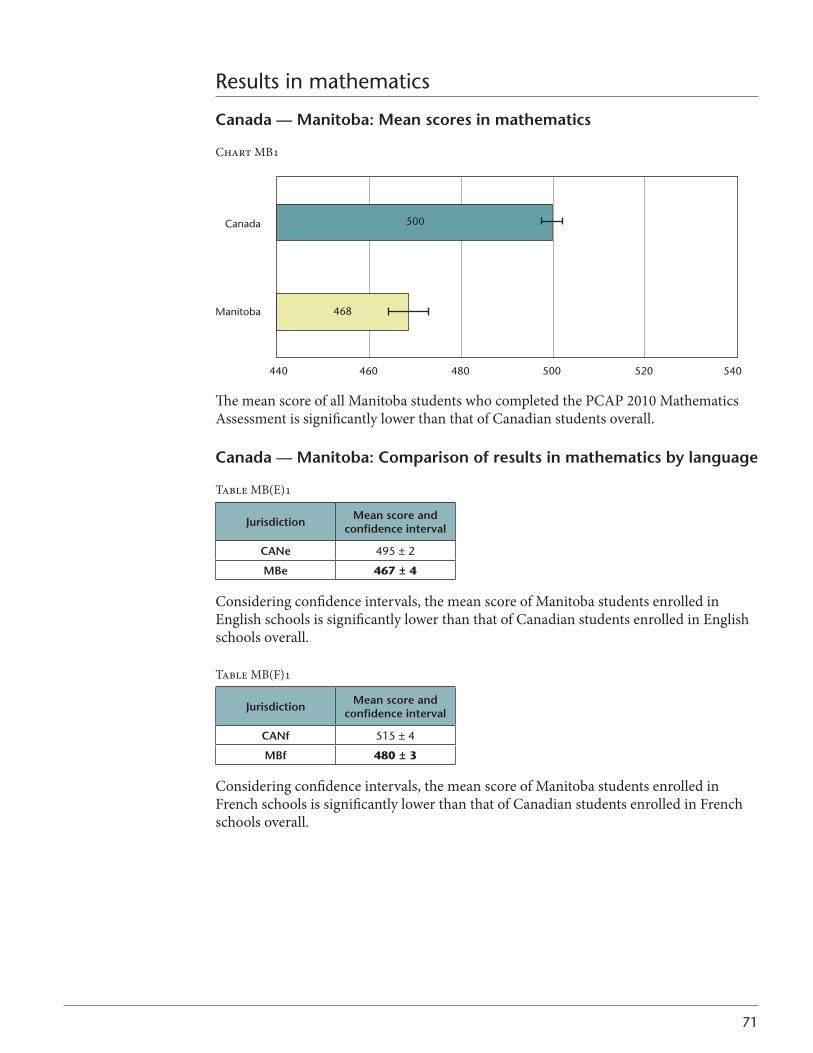
71
Results in mathematics
Canada — Manitoba: Mean scores in mathematics
Chart MB1
500
Manitoba
Canada
440 460 500480 520 540
468
The mean score of all Manitoba students who completed the PCAP 2010 Mathematics Assessment is significantly lower than that of Canadian students overall.
Canada — Manitoba: Comparison of results in mathematics by language
Table MB(E)1
Jurisdiction Mean score and confidence interval
CANe 495 ± 2
Mbe 467 ± 4
Considering confidence intervals, the mean score of Manitoba students enrolled in English schools is significantly lower than that of Canadian students enrolled in English schools overall.
Table MB(F)1
Jurisdiction Mean score and confidence interval
CANf 515 ± 4
Mbf 480 ± 3
Considering confidence intervals, the mean score of Manitoba students enrolled in French schools is significantly lower than that of Canadian students enrolled in French schools overall.
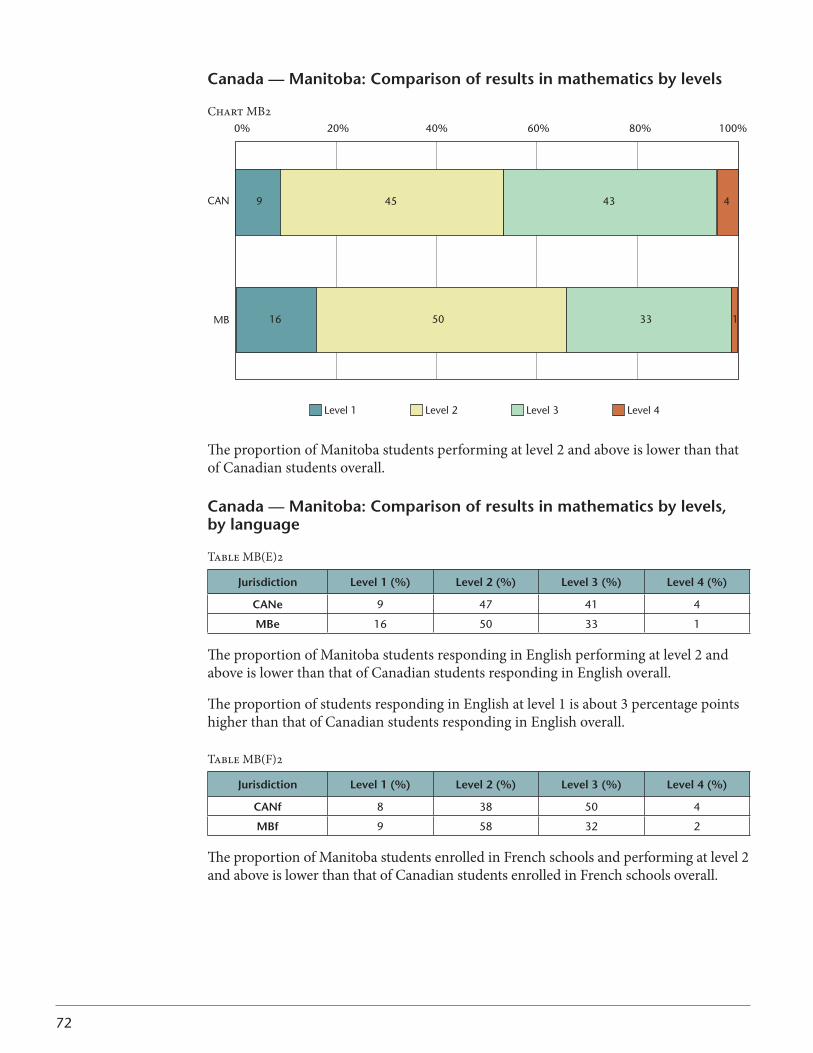
72
Canada — Manitoba: Comparison of results in mathematics by levels
Chart MB2
12
CAN
MB
0% 20% 40% 60% 80% 100%
9
16
45
50
43
33
4
1
Level 1 Level 2 Level 3 Level 4
The proportion of Manitoba students performing at level 2 and above is lower than that of Canadian students overall.
Canada — Manitoba: Comparison of results in mathematics by levels, by language
Table MB(E)2
Jurisdiction level 1 (%) level 2 (%) level 3 (%) level 4 (%)
CANe 9 47 41 4
Mbe 16 50 33 1
The proportion of Manitoba students responding in English performing at level 2 and above is lower than that of Canadian students responding in English overall.
The proportion of students responding in English at level 1 is about 3 percentage points higher than that of Canadian students responding in English overall.
Table MB(F)2
Jurisdiction level 1 (%) level 2 (%) level 3 (%) level 4 (%)
CANf 8 38 50 4
Mbf 9 58 32 2
The proportion of Manitoba students enrolled in French schools and performing at level 2 and above is lower than that of Canadian students enrolled in French schools overall.
73
Canada — Manitoba: Comparison of results in mathematics by gender
Chart MB3
440 540460 480 500 520
Manitoba – Males
Canada – Males
Manitoba – Females
Canada – Females
470
504
468
499
The mean score of Manitoba female students is significantly lower than that of Canadian female students overall.
The mean score of Manitoba male students is significantly lower than that of Canadian male students overall.
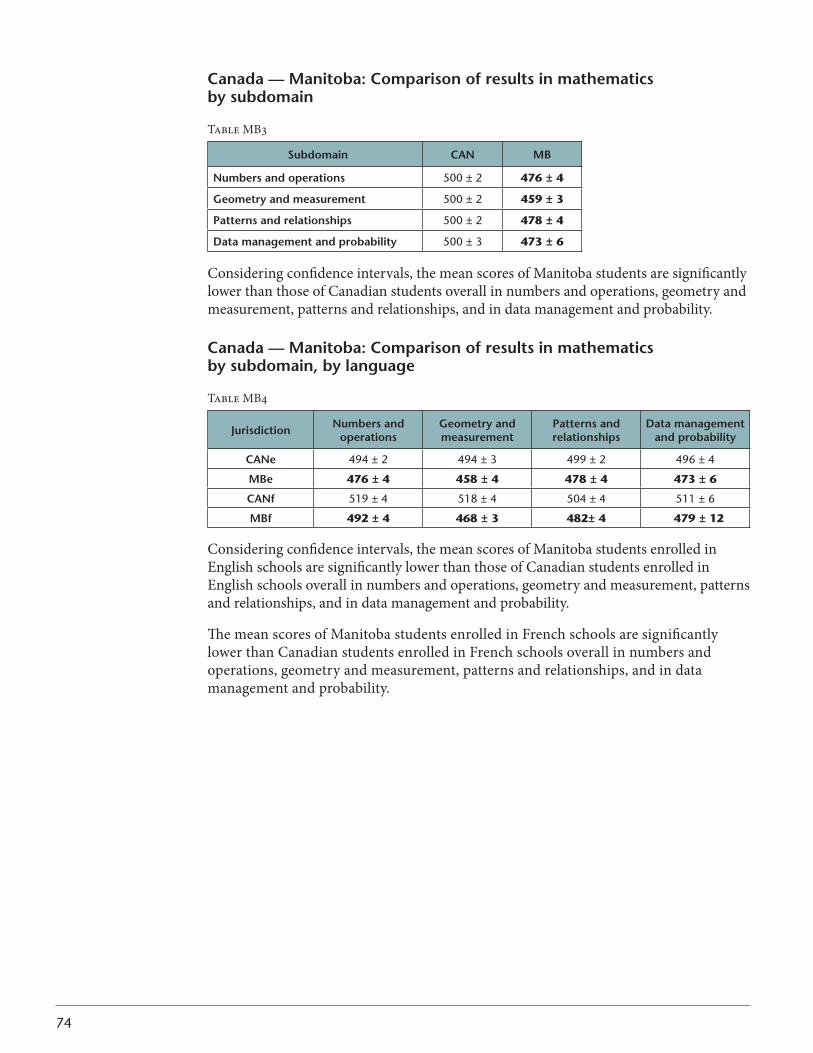
74
Canada — Manitoba: Comparison of results in mathematics by subdomain
Table MB3
subdomain CAN Mb
Numbers and operations 500 ± 2 476 ± 4
geometry and measurement 500 ± 2 459 ± 3
Patterns and relationships 500 ± 2 478 ± 4
data management and probability 500 ± 3 473 ± 6
Considering confidence intervals, the mean scores of Manitoba students are significantly lower than those of Canadian students overall in numbers and operations, geometry and measurement, patterns and relationships, and in data management and probability.
Canada — Manitoba: Comparison of results in mathematics by subdomain, by language
Table MB4
Jurisdiction Numbers and operations
geometry and measurement
Patterns and relationships
data managementand probability
CANe 494 ± 2 494 ± 3 499 ± 2 496 ± 4
Mbe 476 ± 4 458 ± 4 478 ± 4 473 ± 6
CANf 519 ± 4 518 ± 4 504 ± 4 511 ± 6
Mbf 492 ± 4 468 ± 3 482± 4 479 ± 12
Considering confidence intervals, the mean scores of Manitoba students enrolled in English schools are significantly lower than those of Canadian students enrolled in English schools overall in numbers and operations, geometry and measurement, patterns and relationships, and in data management and probability.
The mean scores of Manitoba students enrolled in French schools are significantly lower than Canadian students enrolled in French schools overall in numbers and operations, geometry and measurement, patterns and relationships, and in data management and probability.
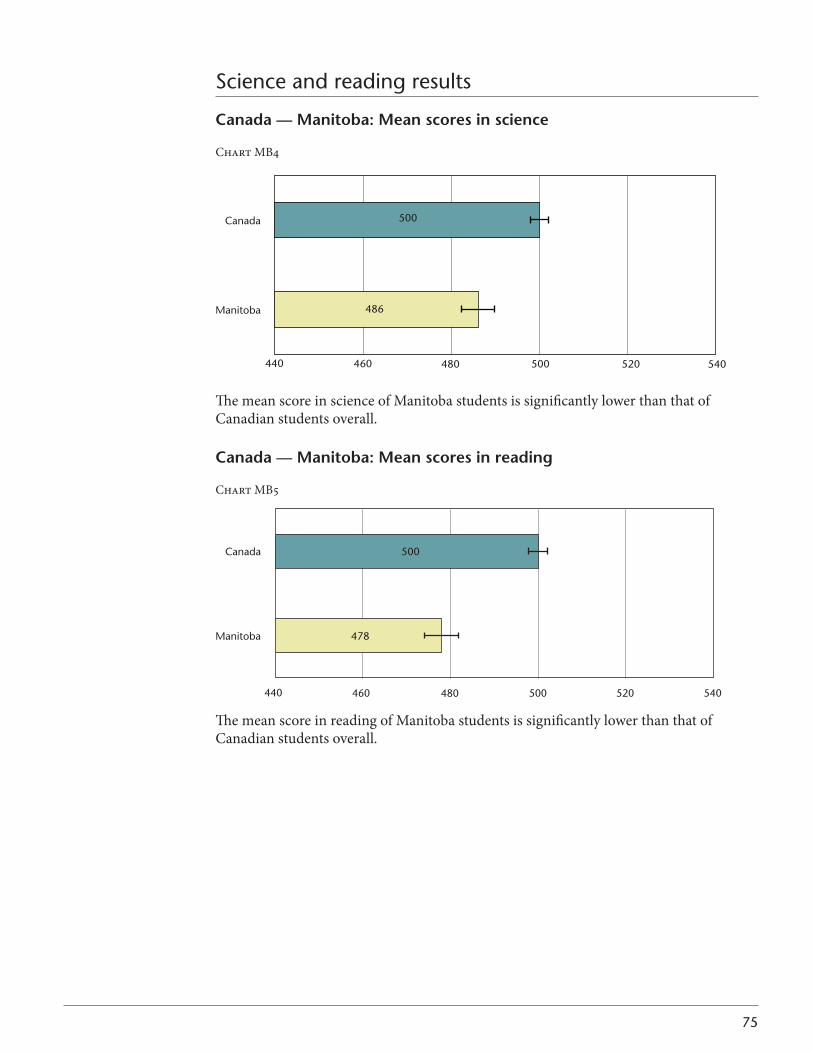
75
Science and reading results
Canada — Manitoba: Mean scores in science
Chart MB4
486
500
Manitoba
Canada
440 540520500480460
The mean score in science of Manitoba students is significantly lower than that of Canadian students overall.
Canada — Manitoba: Mean scores in reading
Chart MB5
500
478Manitoba
Canada
440 540520500480460
The mean score in reading of Manitoba students is significantly lower than that of Canadian students overall.

76
Canada — Manitoba: Comparison of results in science by language
Table MB(E)5
Jurisdiction Mean score and confidence interval
CANe 504 ± 3
Mbe 486 ± 5
Considering confidence intervals, the mean score in science of Manitoba students enrolled in English schools is significantly lower than that of Canadian students enrolled in English schools overall.
Table MB(F)5
Jurisdiction Mean score and confidence interval
CANf 487 ± 3
Mbf 482 ± 4
Considering confidence intervals, the mean score in science of Manitoba students enrolled in French schools is not significantly different from that of Canadian students enrolled in French schools overall.
Canada — Manitoba: Comparison of results in reading by language
Table MB(E)6
Jurisdiction Mean score and confidence interval
CANe 507 ± 2
Mbe 478 ± 4
Considering confidence intervals, the mean score in reading of Manitoba students enrolled in English schools is significantly lower than that of Canadian students enrolled in English schools overall.
Table MB(F)6
Jurisdiction Mean score and confidence interval
CANf 480 ± 4
Mbf 468 ± 4
Considering confidence intervals, the mean score in reading of Manitoba students enrolled in French schools is significantly lower than that of Canadian students enrolled in French schools overall.
77
ONTARIO
Context statement
Social contextIn2010,Ontario’spopulationwas13.2million.EnglishisOntario’sofficiallanguage,and French-language rights have been extended to the legal and educational systems. According to the 2006 census by Statistics Canada, the languages most commonly spoken at home in Ontario are English (8,000,000), French (583,000), Chinese languages (482,000), Italian (283,000), and German (158,000). According to the census, about 240,000 people identified themselves as Aboriginal.
The ministry of education works to promote successful outcomes for all students, including students whose first language is neither English nor French, students with special needs, First Nation, Métis, and Inuit students, and students who are economically disadvantaged.
Organization of the school systemOntario has 72 district school boards, of which 60 are English-language and 12 are French-language. There are 31 public and 29 Catholic district school boards in the English-language system, and four public and eight Catholic district school boards in the French-language system. In addition, there are 11 school authorities that are geographically isolated boards or hospital school boards.
In 2008-2009, there were 2,070,736 students enrolled in publicly funded schools in Ontario. There were 1,355,440 students enrolled in elementary schools and 715,296 students enrolled in secondary schools. There were 4,034 elementary and 901 secondary schools. Approximately 70 per cent of students were enrolled in public school boards and 30 per cent in Catholic school boards. Approximately 4.4 per cent of students were enrolled in the French-language education system.
In2010-2011,Ontariointroducedfull-dayKindergartenforfour-andfive-year-oldsinnearly 600 schools. This program will be expanded to almost 800 schools in 2011-2012, withcompleteimplementationexpectedby2014-15.WhileKindergartenisnotmandatory,90 per cent of eligible children are enrolled.
InOntario,childrenarerequiredtoattendschooloncetheyturnsixyearsoldandstayin school until they graduate or turn 18. The levels are primary (Grades 1–3), junior (Grades 4–6), intermediate (Grades 7–10), and senior (Grades 11 and 12).
Mathematics teachingIn 2005, the ministry of education released the revised Ontario Curriculum Grades 1–8: Mathematics and Le curriculum de l’Ontario de la 1re à la 8e année, Mathématiques.
The revised curriculum recognizes the diversity among students and is based on the belief that all students can learn mathematics and deserve the opportunity to do so. The curriculumsupportsequitybypromotingtheactiveparticipationofallstudentsand
78
by clearly identifying the knowledge and skills students are expected to demonstrate in every grade. It recognizes different learning styles and sets expectations that call for the use of a variety of instructional strategies and assessment tools. It aims to challenge allstudentsbyincludingexpectationsthatrequirethemtousehigher-orderthinkingskills and to make connections between related mathematical concepts and between mathematics, other disciplines, and the real world.
The five strands or major areas of knowledge and skills in the revised mathematics curriculumare:numbersenseandnumeration;measurement;geometryandspatialsense;patterningandalgebra;anddatamanagementandprobability.Includedinthe curriculum expectations are seven mathematical process expectations: problem solving, communicating, reasoning and proving, reflecting, representing, connecting, and selecting tools and computational strategies. In Grades 1–12, students are actively engaged in applying these mathematical processes through their programs.
The curriculum policy documents can be found on the following Web sites: www.edu.gov.on.ca/eng/curriculum/elementary/math.html; www.edu.gov.on.ca/fre/curriculum/elementary/math.html.
Mathematics assessmentIn Ontario classrooms, teachers are responsible for classroom assessment and evaluation to improve student learning. Teachers bring varied assessment and evaluation approaches to the classroom, including assessment for, as, and of learning. In the curriculum policy documents, teachers are provided with an achievement chart that identifies four categories of knowledge and skills in mathematics: knowledge and understanding, thinking, application, and communication. The achievement chart is a standard province-wide guide used by teachers to make judgments about student work that are based on clear performance standards and on a body of evidence collected over time.
Ontario participates in international mathematics assessments through PISA and TIMSS. Ontario also participates in national mathematics assessment at Grade 8 through PCAP.
More information about provincial, national, and international assessments in Ontario canbefoundattheEducationQualityandAccountabilityOffice’s(EQAO)’sWebsites:www.eqao.com/NIA/NIA.aspx?status=logout&Lang=E (English); www.eqao.com/NIA/NIA.aspx?status=logout&Lang=F (French).
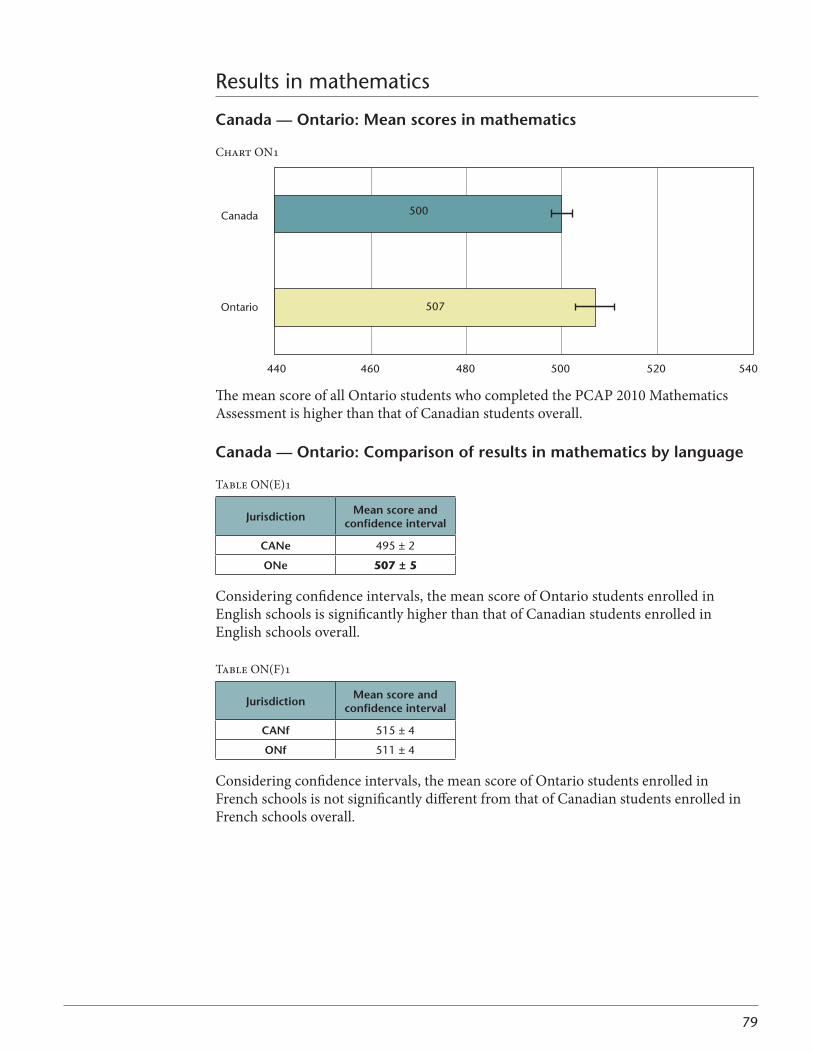
79
Results in mathematics
Canada — ontario: Mean scores in mathematics
Chart ON1
The mean score of all Ontario students who completed the PCAP 2010 Mathematics Assessment is higher than that of Canadian students overall.
Canada — ontario: Comparison of results in mathematics by language
Table ON(E)1
Jurisdiction Mean score and confidence interval
CANe 495 ± 2
oNe 507 ± 5
Considering confidence intervals, the mean score of Ontario students enrolled in English schools is significantly higher than that of Canadian students enrolled in English schools overall.
Table ON(F)1
Jurisdiction Mean score and confidence interval
CANf 515 ± 4
oNf 511 ± 4
Considering confidence intervals, the mean score of Ontario students enrolled in French schools is not significantly different from that of Canadian students enrolled in French schools overall.
Ontario
Canada
440 460 500480 520 540
507
500
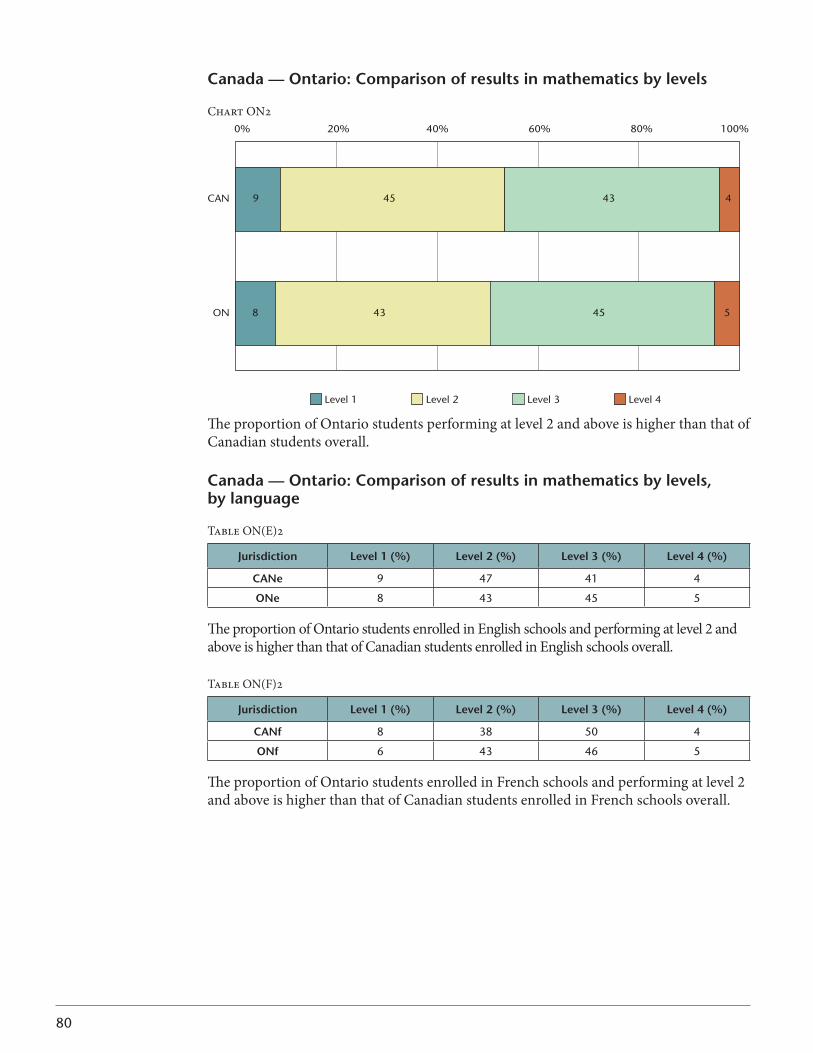
80
Canada — ontario: Comparison of results in mathematics by levels
Chart ON2
The proportion of Ontario students performing at level 2 and above is higher than that of Canadian students overall.
Canada — ontario: Comparison of results in mathematics by levels, by language
Table ON(E)2
Jurisdiction level 1 (%) level 2 (%) level 3 (%) level 4 (%)
CANe 9 47 41 4
oNe 8 43 45 5
The proportion of Ontario students enrolled in English schools and performing at level 2 and above is higher than that of Canadian students enrolled in English schools overall.
Table ON(F)2
Jurisdiction level 1 (%) level 2 (%) level 3 (%) level 4 (%)
CANf 8 38 50 4
oNf 6 43 46 5
The proportion of Ontario students enrolled in French schools and performing at level 2 and above is higher than that of Canadian students enrolled in French schools overall.
CAN
ON
0% 20% 40% 60% 80% 100%
Level 1 Level 2 Level 3 Level 4
9
8
45
43
43
45
4
5
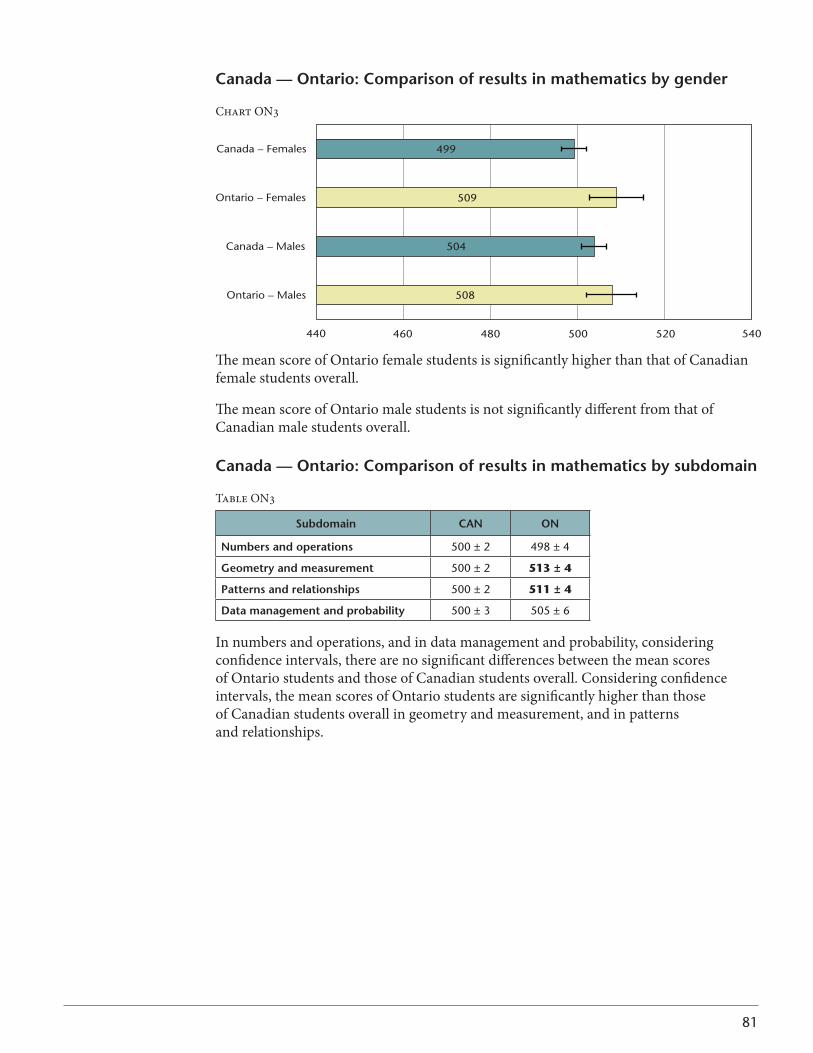
81
Canada — ontario: Comparison of results in mathematics by gender
Chart ON3
440 540460 480 500 520
Ontario – Males
Canada – Males
Ontario – Females
Canada – Females
508
504
509
499
The mean score of Ontario female students is significantly higher than that of Canadian female students overall.
The mean score of Ontario male students is not significantly different from that of Canadian male students overall.
Canada — ontario: Comparison of results in mathematics by subdomain
Table ON3
subdomain CAN oN
Numbers and operations 500 ± 2 498 ± 4
geometry and measurement 500 ± 2 513 ± 4
Patterns and relationships 500 ± 2 511 ± 4
data management and probability 500 ± 3 505 ± 6
In numbers and operations, and in data management and probability, considering confidence intervals, there are no significant differences between the mean scores of Ontario students and those of Canadian students overall. Considering confidence intervals, the mean scores of Ontario students are significantly higher than those of Canadian students overall in geometry and measurement, and in patterns and relationships.
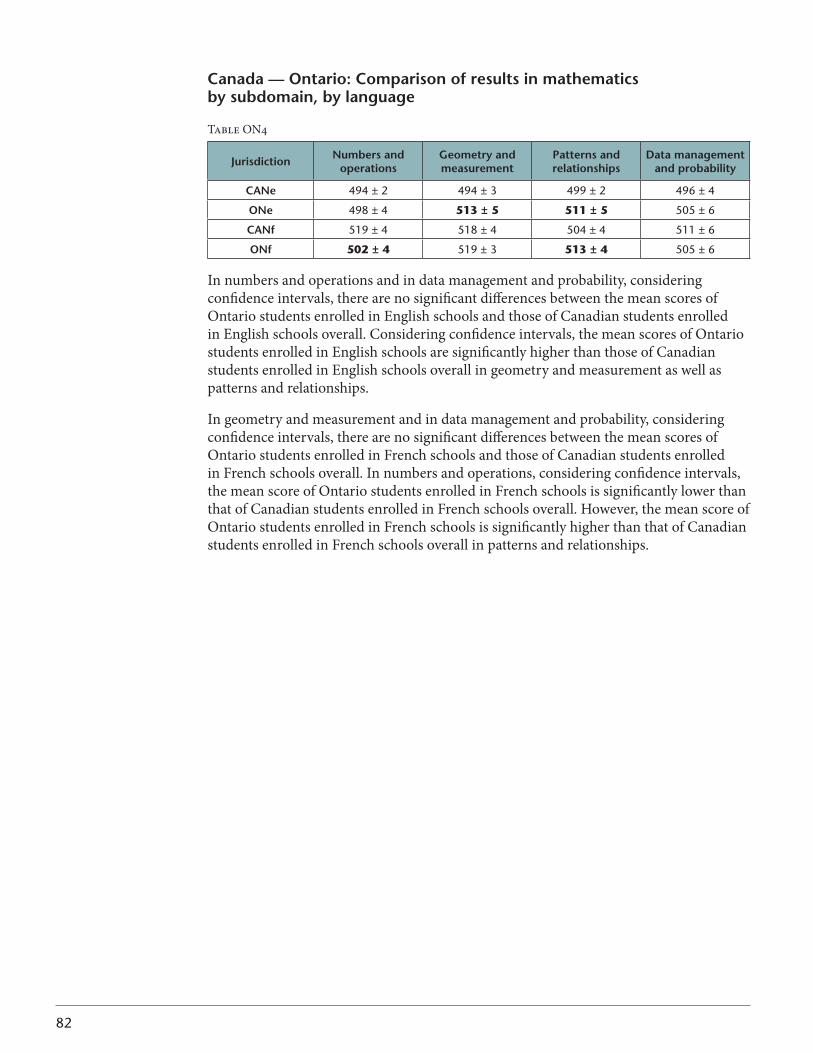
82
Canada — ontario: Comparison of results in mathematics by subdomain, by language
Table ON4
Jurisdiction Numbers and operations
geometry and measurement
Patterns and relationships
data managementand probability
CANe 494 ± 2 494 ± 3 499 ± 2 496 ± 4
oNe 498 ± 4 513 ± 5 511 ± 5 505 ± 6
CANf 519 ± 4 518 ± 4 504 ± 4 511 ± 6
oNf 502 ± 4 519 ± 3 513 ± 4 505 ± 6
In numbers and operations and in data management and probability, considering confidence intervals, there are no significant differences between the mean scores of Ontario students enrolled in English schools and those of Canadian students enrolled in English schools overall. Considering confidence intervals, the mean scores of Ontario students enrolled in English schools are significantly higher than those of Canadian students enrolled in English schools overall in geometry and measurement as well as patterns and relationships.
In geometry and measurement and in data management and probability, considering confidence intervals, there are no significant differences between the mean scores of Ontario students enrolled in French schools and those of Canadian students enrolled in French schools overall. In numbers and operations, considering confidence intervals, the mean score of Ontario students enrolled in French schools is significantly lower than that of Canadian students enrolled in French schools overall. However, the mean score of Ontario students enrolled in French schools is significantly higher than that of Canadian students enrolled in French schools overall in patterns and relationships.
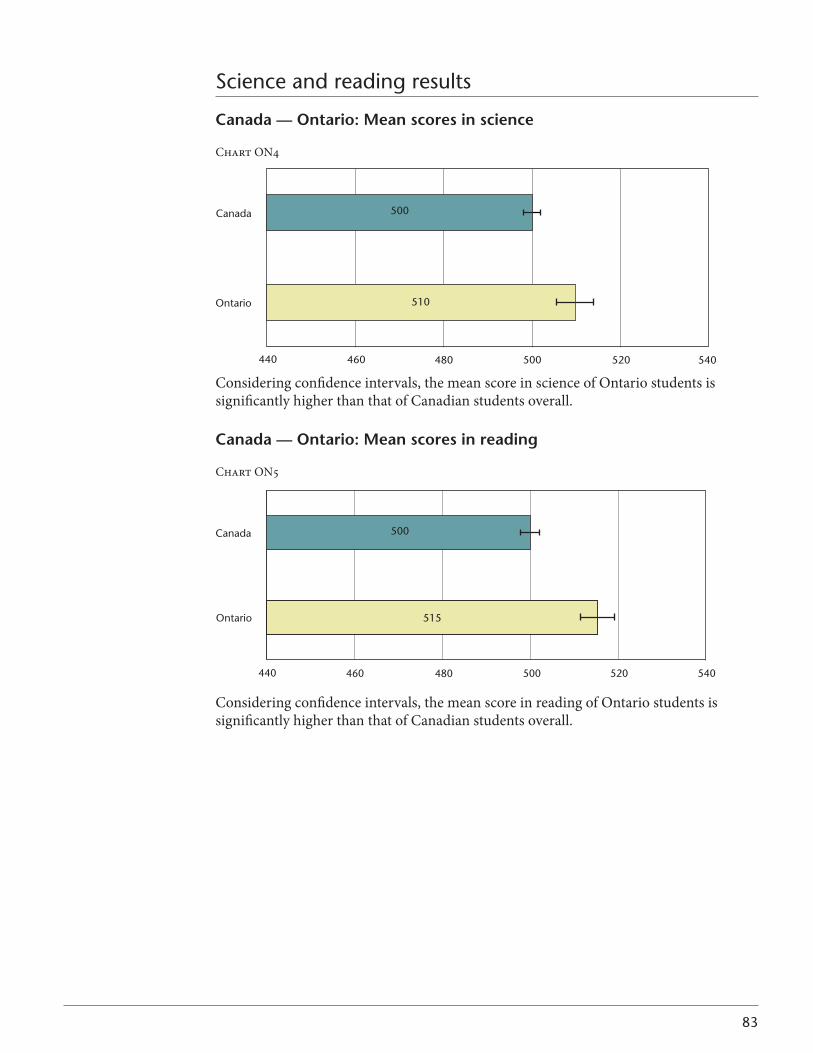
83
Science and reading results
Canada — ontario: Mean scores in science
Chart ON4
510
500
Ontario
Canada
440 540520500480460
Considering confidence intervals, the mean score in science of Ontario students is significantly higher than that of Canadian students overall.
Canada — ontario: Mean scores in reading
Chart ON5
515
500
Ontario
Canada
440 540520500480460
Considering confidence intervals, the mean score in reading of Ontario students is significantly higher than that of Canadian students overall.
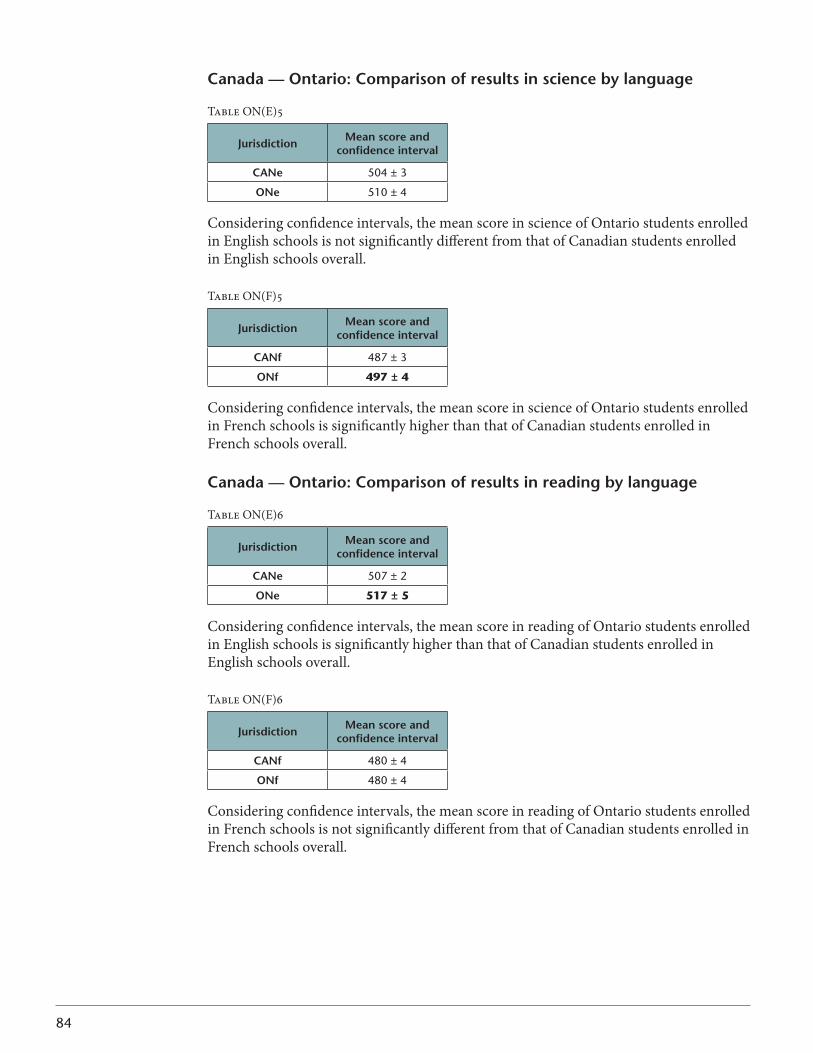
84
Canada — ontario: Comparison of results in science by language
Table ON(E)5
Jurisdiction Mean score and confidence interval
CANe 504 ± 3
oNe 510 ± 4
Considering confidence intervals, the mean score in science of Ontario students enrolled in English schools is not significantly different from that of Canadian students enrolled in English schools overall.
Table ON(F)5
Jurisdiction Mean score and confidence interval
CANf 487 ± 3
oNf 497 ± 4
Considering confidence intervals, the mean score in science of Ontario students enrolled in French schools is significantly higher than that of Canadian students enrolled in French schools overall.
Canada — ontario: Comparison of results in reading by language
Table ON(E)6
Jurisdiction Mean score and confidence interval
CANe 507 ± 2
oNe 517 ± 5
Considering confidence intervals, the mean score in reading of Ontario students enrolled in English schools is significantly higher than that of Canadian students enrolled in English schools overall.
Table ON(F)6
Jurisdiction Mean score and confidence interval
CANf 480 ± 4
oNf 480 ± 4
Considering confidence intervals, the mean score in reading of Ontario students enrolled in French schools is not significantly different from that of Canadian students enrolled in French schools overall.
85
QUEBEC
Context statement
Social contextQuebec’s population of close to eight million is concentrated in the south of the province,mostlyinitslargestcity,Montreal,anditscapital,QuebecCity.Theofficiallanguage of Quebec is French. Francophones account for around 80 per cent of Quebec’s total population. Anglophones make up around 9 per cent, and have access to a full system of educational institutions, from preschool to university. There are 11 Aboriginal peoples in Quebec, who account for about 1 per cent of the population. Under the Indian Act, the Government of Canada is responsible for ensuring that Aboriginal children receive educational services. However, under agreements signed with three First Nations in the 1970s, the government of Quebec determines the legal framework applicable to educational services delivered to Cree, Inuit, and Naskapi communities.
In addition, an increase in immigration, especially in the Greater Montreal area, has resulted in a massive inflow of students whose first language is neither French nor English. These students attend French schools. To meet the needs of this new client group, schools have implemented special measures, including initiation and francization programs and welcoming classes.
Organization of the school systemQuebec has four levels of education: elementary (including preschool), secondary, college, and university. Full- and part-time enrolment is approximately 1.8 million. Elementary, secondary, and college education is free. University students pay tuition fees (relatively low in the North American context). Children are admitted to elementary school at six years of age, and school attendance is compulsory until the age of 16. TheofficiallanguageofinstructionattheelementaryandsecondarylevelsisFrench.Education in English is available mainly to students whose father or mother pursued elementary studies in English in Canada. Approximately 10 per cent of Quebec students are educated in English.
Elementaryschoolisusuallyprecededbyoneyearoffull-timeKindergartenforfive-year-olds.Almostallfive-year-oldsattendKindergarten,eventhoughitisnotcompulsory.Somechildrenfromunderprivilegedbackgroundsmayhaveaccesstohalf-dayKindergartenfromthe age of four.
Elementary school lasts six years. Secondary school lasts five years and is divided into two levels. The first two-year level, or “cycle,” is strongly focused on basic education. In the second three-year cycle, students continue their general education but also take optional courses to explore other avenues of learning before going on to college.
In 2009-2010, a total of 1,088,296 students were registered in Quebec’s 2,677 public and private elementary and secondary schools. Of these, 2,347 are public schools run by 72 school boards, and 330 are private schools.
86
Mathematics teachingThe ministry of education, recreation and sports determines curriculum content, in close collaboration with professional expert groups in various subjects, curriculum developers, teachers, and school-board consultants.
The new elementary mathematics curriculum focuses on skills development. The new curriculum for the first year of secondary school, implemented in the 2005-2006 academic year, is also skills-based. At the time of this assessment, the target population was the fourth cohort being taught under the new Quebec Education Program.
Since 1994, the objective of mathematics teaching in Quebec has been to help studentsacquiretheabilitytosolvesituationalproblems,toreason,todrawlinks,and to communicate. The mathematics portion of the Quebec Education Program is structuredaroundthreecompetencies:solvingsituationalproblems;usingmathematicalreasoning,includingappropriatingconceptsandprocessesspecifictothediscipline;andcommunicating by using mathematical language.
The development of the three competencies outlined in the curriculum is closely linked withtheacquisitionofknowledgerelatedtoarithmetic,algebra,geometry,probability,statistics, and discrete mathematics. These branches of mathematics organize the mathematical concepts and processes studied throughout a student’s schooling.
In Secondary Cycle Two, the mathematics program offers three different options designedtomeetstudents’needs.TheyaretheCultural,Social,andTechnicaloption;theTechnicalandScientificoption;andtheScienceoption.
Mathematics assessmentAt the elementary level, model tests for Grades 2 and 4 have been available to schools forthepastfewyearsandarenowcompulsoryinmanyschoolboards.SinceJune2006,Grade6studentsarerequiredtopassaministerialassessment,whichismarkedlocallyby teachers.
At the secondary level, model tests have been available to schools since the implementation of the new curriculum. For the 2009-2010 school year, additional tests for the three options are available to schools for Secondary Cycle Four. Model tests are also available for Secondary Cycle Five. Schools administer and weight these assessments at their discretion.
For additional information, please see the following Web sites:
• www.mels.gouv.qc.ca/DGFJ/dp/index.htm• www.meq.gouv.qc.ca/STAT/STAT_det/PPS_EFF.htm• www.mels.gouv.qc.ca/DGFJ/sections/programmeFormation/secondaire2/index.
asp?page=programme
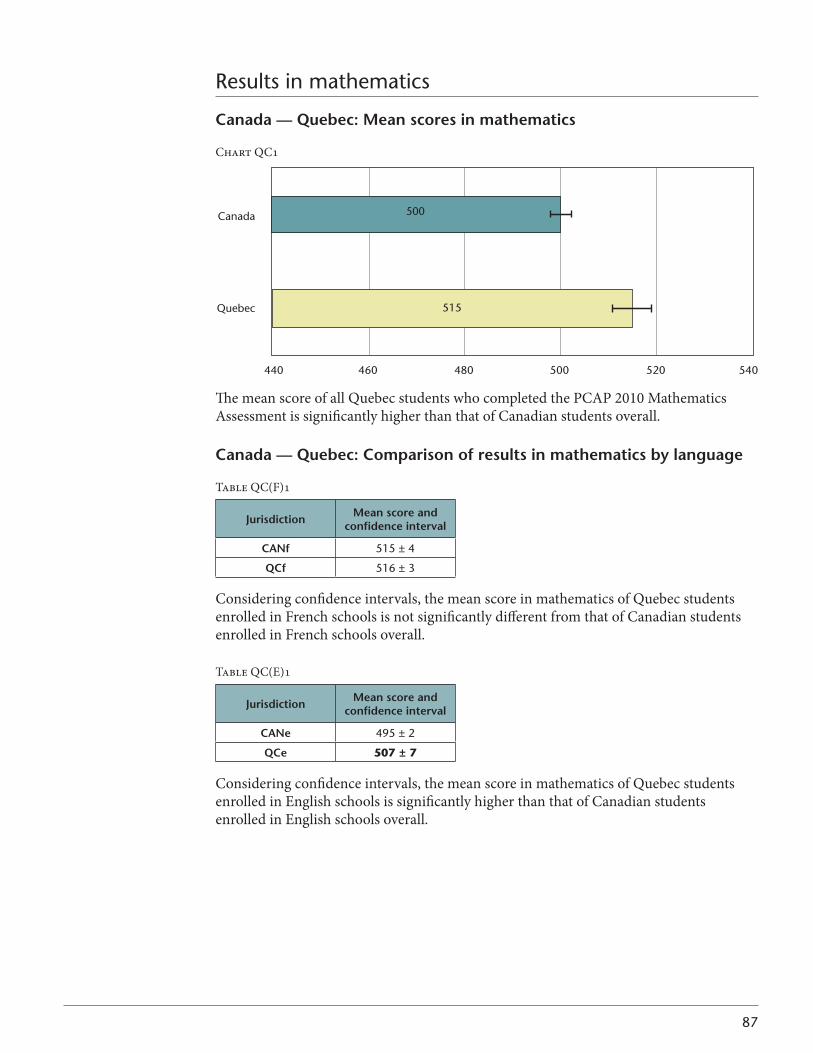
87
Results in mathematics
Canada — Quebec: Mean scores in mathematics
Chart QC1
The mean score of all Quebec students who completed the PCAP 2010 Mathematics Assessment is significantly higher than that of Canadian students overall.
Canada — Quebec: Comparison of results in mathematics by language
Table QC(F)1
Jurisdiction Mean score and confidence interval
CANf 515 ± 4
QCf 516 ± 3
Considering confidence intervals, the mean score in mathematics of Quebec students enrolled in French schools is not significantly different from that of Canadian students enrolled in French schools overall.
Table QC(E)1
Jurisdiction Mean score and confidence interval
CANe 495 ± 2
QCe 507 ± 7
Considering confidence intervals, the mean score in mathematics of Quebec students enrolled in English schools is significantly higher than that of Canadian students enrolled in English schools overall.
Quebec
Canada
440 460 500480 520 540
500
515
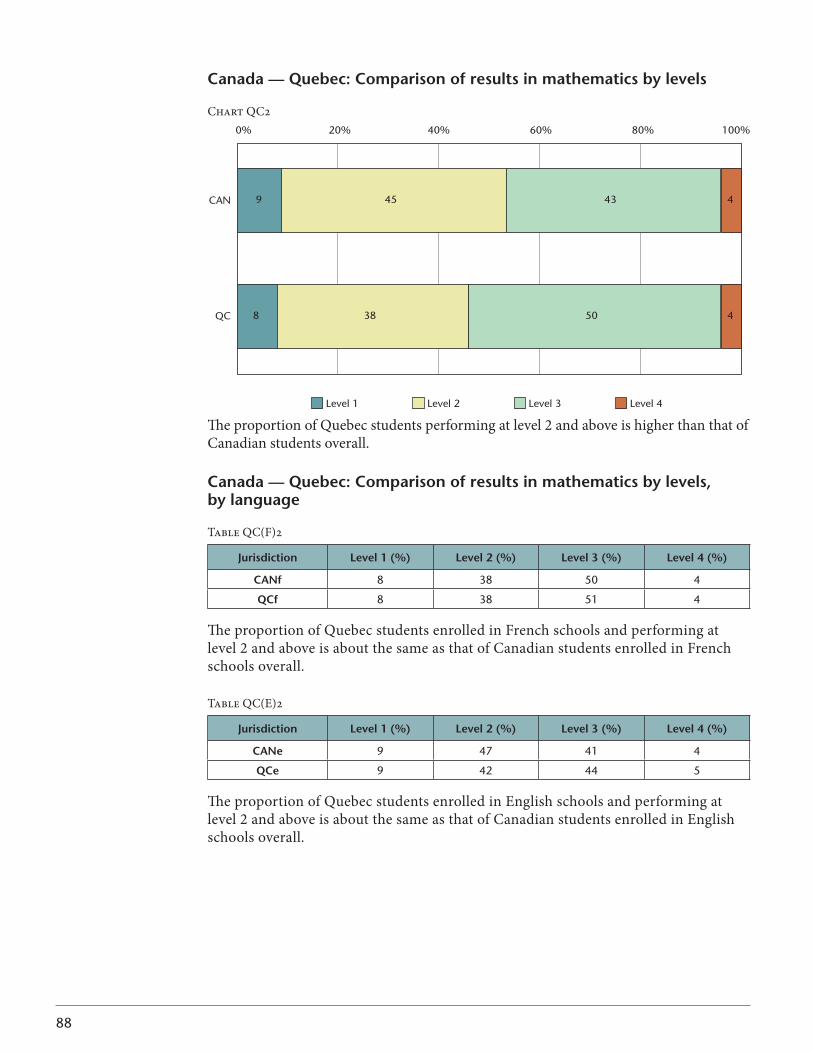
88
Canada — Quebec: Comparison of results in mathematics by levels
Chart QC2
The proportion of Quebec students performing at level 2 and above is higher than that of Canadian students overall.
Canada — Quebec: Comparison of results in mathematics by levels, by language
Table QC(F)2
Jurisdiction level 1 (%) level 2 (%) level 3 (%) level 4 (%)
CANf 8 38 50 4
QCf 8 38 51 4
The proportion of Quebec students enrolled in French schools and performing at level 2 and above is about the same as that of Canadian students enrolled in French schools overall.
Table QC(E)2
Jurisdiction level 1 (%) level 2 (%) level 3 (%) level 4 (%)
CANe 9 47 41 4
QCe 9 42 44 5
The proportion of Quebec students enrolled in English schools and performing at level 2 and above is about the same as that of Canadian students enrolled in English schools overall.
CAN
QC
0% 20% 40% 60% 80% 100%
Level 1 Level 2 Level 3 Level 4
9
8
45
38
43
50
4
4
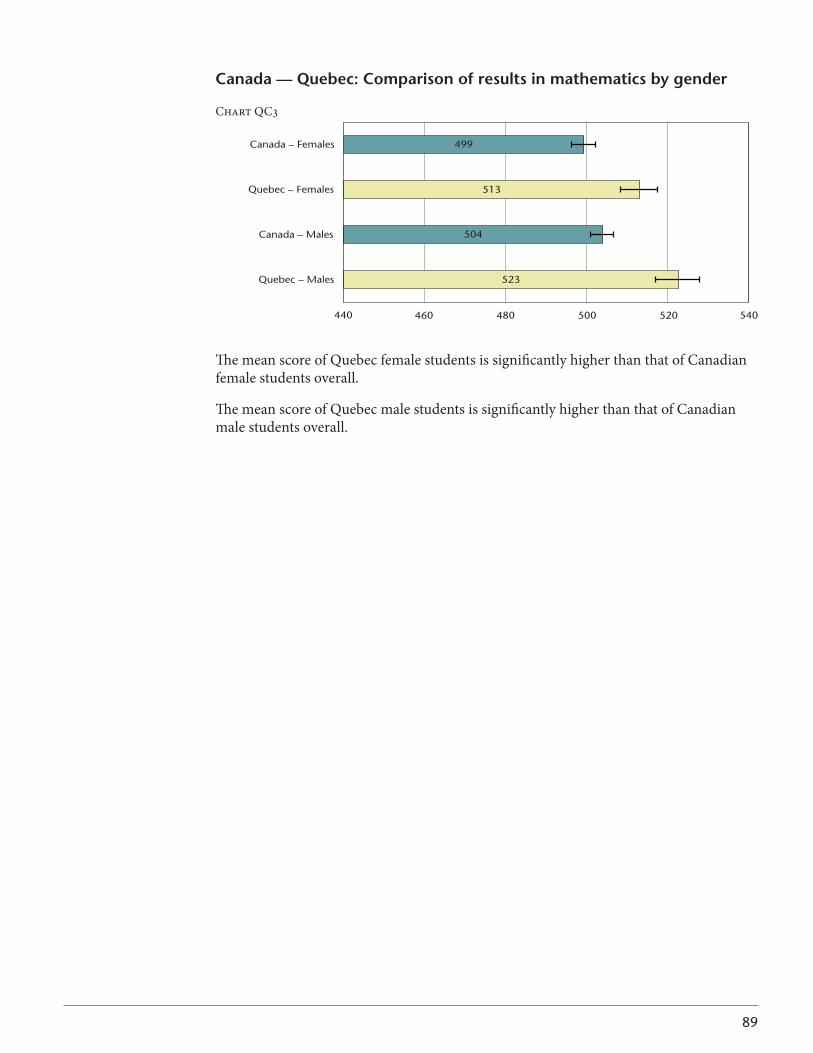
89
Canada — Quebec: Comparison of results in mathematics by gender
Chart QC3
440 540460 480 500 520
Quebec – Males
Canada – Males
Quebec – Females
Canada – Females
523
504
513
499
The mean score of Quebec female students is significantly higher than that of Canadian female students overall.
The mean score of Quebec male students is significantly higher than that of Canadian male students overall.
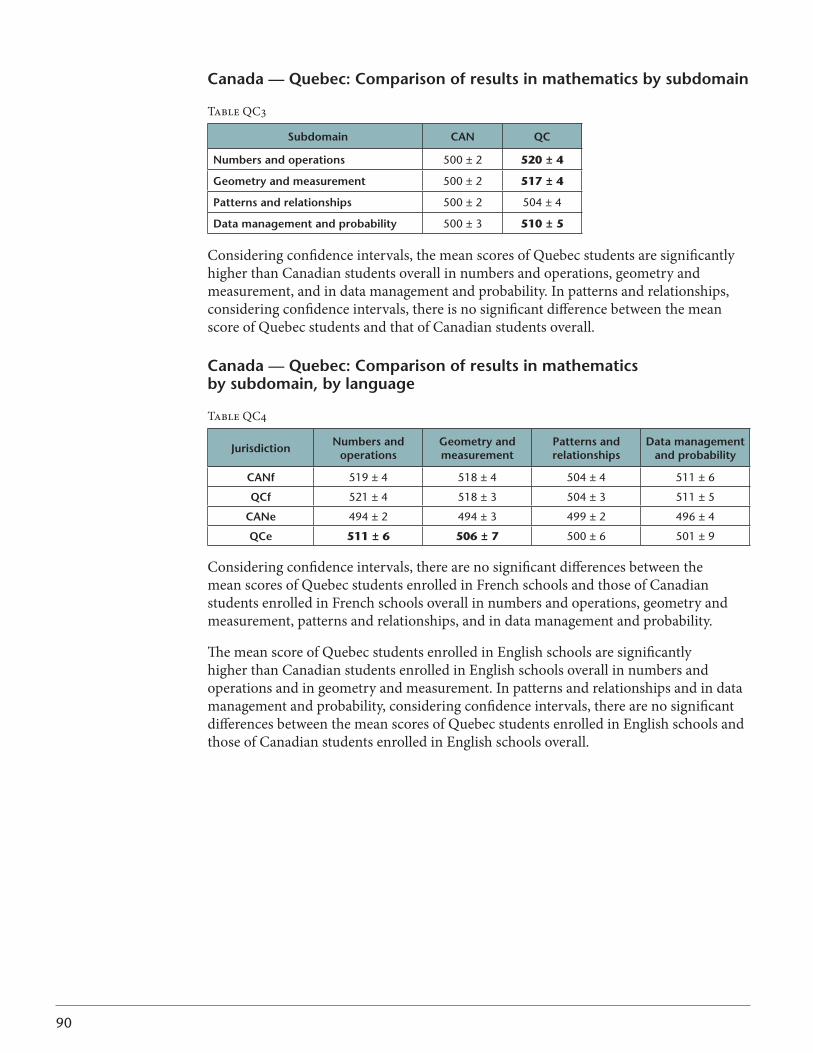
90
Canada — Quebec: Comparison of results in mathematics by subdomain
Table QC3
subdomain CAN QC
Numbers and operations 500 ± 2 520 ± 4
geometry and measurement 500 ± 2 517 ± 4
Patterns and relationships 500 ± 2 504 ± 4
data management and probability 500 ± 3 510 ± 5
Considering confidence intervals, the mean scores of Quebec students are significantly higher than Canadian students overall in numbers and operations, geometry and measurement, and in data management and probability. In patterns and relationships, considering confidence intervals, there is no significant difference between the mean score of Quebec students and that of Canadian students overall.
Canada — Quebec: Comparison of results in mathematics by subdomain, by language
Table QC4
Jurisdiction Numbers and operations
geometry and measurement
Patterns and relationships
data managementand probability
CANf 519 ± 4 518 ± 4 504 ± 4 511 ± 6
QCf 521 ± 4 518 ± 3 504 ± 3 511 ± 5
CANe 494 ± 2 494 ± 3 499 ± 2 496 ± 4
QCe 511 ± 6 506 ± 7 500 ± 6 501 ± 9
Considering confidence intervals, there are no significant differences between the mean scores of Quebec students enrolled in French schools and those of Canadian students enrolled in French schools overall in numbers and operations, geometry and measurement, patterns and relationships, and in data management and probability.
The mean score of Quebec students enrolled in English schools are significantly higher than Canadian students enrolled in English schools overall in numbers and operations and in geometry and measurement. In patterns and relationships and in data management and probability, considering confidence intervals, there are no significant differences between the mean scores of Quebec students enrolled in English schools and those of Canadian students enrolled in English schools overall.
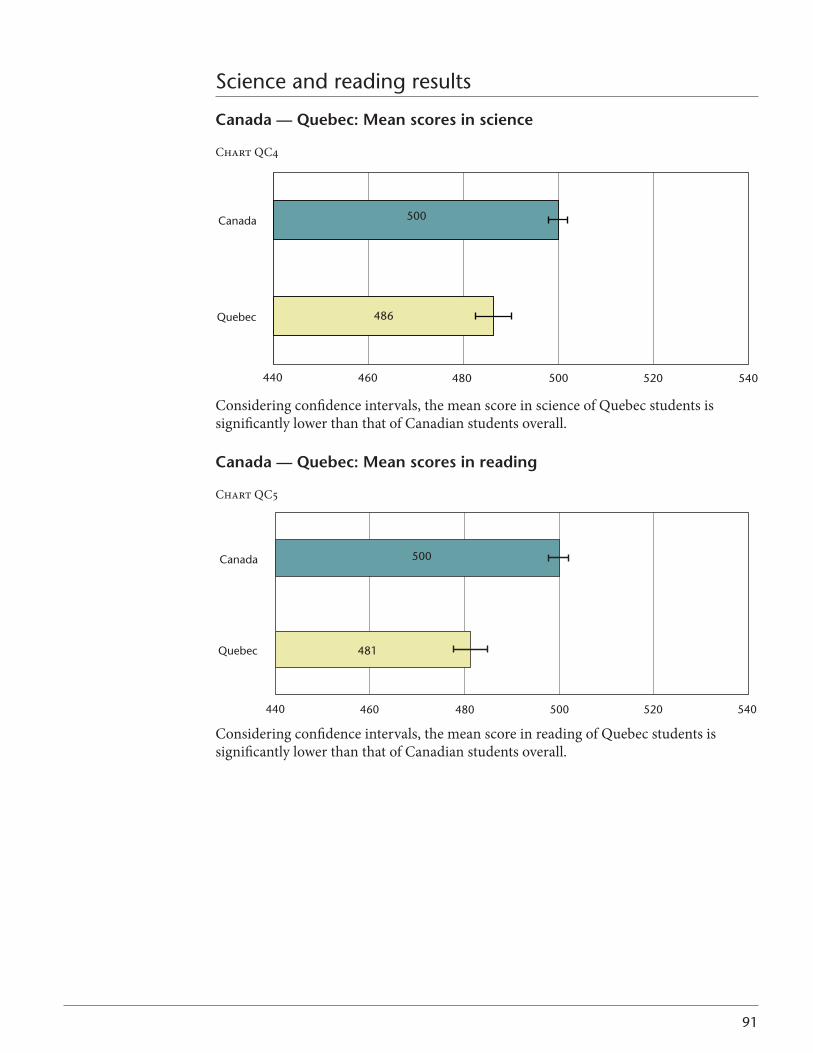
91
Science and reading results
Canada — Quebec: Mean scores in science
Chart QC4
Considering confidence intervals, the mean score in science of Quebec students is significantly lower than that of Canadian students overall.
Canada — Quebec: Mean scores in reading
Chart QC5
Considering confidence intervals, the mean score in reading of Quebec students is significantly lower than that of Canadian students overall.
486
500
Quebec
Canada
440 540520500480460
481
500
Quebec
Canada
440 540520500480460

92
Canada — Quebec: Comparison of results in science by language
Table QC(F)5
Jurisdiction Mean score and confidence interval
CANf 487 ± 3
QCf 486 ± 3
Considering confidence intervals, the mean score in science of Quebec students enrolled in French schools is not significantly different from that of Canadian students enrolled in French schools overall.
Table QC(E)5
Jurisdiction Mean score and confidence interval
CANe 504 ± 3
QCe 490 ± 6
Considering confidence intervals, the mean score in science of Quebec students enrolled in English schools is significantly lower than that of Canadian students enrolled in English schools overall.
Canada — Quebec: Comparison of results in reading by language
Table QC(F)6
Jurisdiction Mean score and confidence interval
CANf 480 ± 4
QCf 480 ± 4
Considering confidence intervals, the mean score in reading of Quebec students enrolled in French schools is not significantly different from that of Canadian students enrolled in French schools overall.
Table QC(E)6
Jurisdiction Mean score and confidence interval
CANe 507 ± 2
QCe 492 ± 6
Considering confidence intervals, the mean score in reading of Quebec students enrolled in English schools is significantly lower than that of Canadian students enrolled in English schools overall.
93
NEW BRUNSWICK
Context statement
Social contextAsCanada’sonlyofficiallybilingualprovince,NewBrunswickoffersstudentstheopportunity to learn in both English and French. The public education system has 14 school districts — nine English and five French.
OnJuly1,2010,thetotalpopulationofNewBrunswickwas751,800,anincreaseof 0.33percentoverJuly2009.Althoughtheprovince’spopulationhascontinuouslygrownsincethefirstquarterof2007,enrolmentinfrancophoneandanglophoneschoolshasdecreased during the same period. For the 2009-2010 school year, 30,420 students were enrolled in the francophone sector, representing 28.6 per cent of the total enrolment of 106,394intheprovincefromKindergartentoGrade12.Almosthalfofstudentsenrolledin francophone schools live in a majority-anglophone environment. For the 2009-2010 school year 75,974 students were enrolled in the Anglophone sector, representing 71.4 per cent of the total New Brunswick enrolment.
NewBrunswick’s1986inclusiveeducationpoliciesareuniqueamongCanadianprovinces.Thepoliciesaffirmtherightofallstudentstolearnanddeveloptheirfullpotential in a common, positive learning environment.
Organization of the school systemIn 1974, New Brunswick recognized its linguistic duality by establishing two parallel but distinct school systems. The francophone sector of the department of education is responsible for francophone curriculum and assessment and the anglophone sector is responsible for anglophone curriculum and assessment. Management of the education system is shared between the Minister of Education and Early Childhood Development and District Education Councils. The province is divided into 14 school districts (nine English and five French), each governed by a District Education Council (DEC).
The francophone sector has five district boards of education, whose members are locally elected by the public, and are responsible for policy development and decision making regarding school and district operations. Children who will be five years old by December31areenrolledinKindergarten.Schoolattendanceiscompulsoryuntiltheend of secondary school or the age of 18 (up to 21 years of age), whichever comes first. Since 2009, two independent curricula, one anglophone and one francophone, have been implemented in all regulated early learning and child care facilities. The curricula are mandatory for facilities that offer services to preschool-aged children.
94
Mathematics teachingMathematics is a core subject in New Brunswick schools. Mathematics courses are compulsoryintheprovinceforallstudentsfromKindergartentoGrade11.Intheanglophone sector, math courses are compulsory to the end of Grade 10, and completion ofonemorecreditinmathinGrade11orGrade12isrequired.Byage13,astudenthas received (starting as early as the first year of schooling) approximately 1,750 hours of mathematics education in the francophone sector and approximately 1,150 hours in the anglophone sector. In secondary school (Grades 9 to 12), francophone students arerequiredtoobtainthreemathematicscreditstoreceiveasecondarydiploma.Theanglophone sector implemented new math curricula starting in September 2008 with GradesK,1,4,and7;followedin2009withGrades2,5and8;in2010withGrades3, 6and9;andin2011withtwocoursesinGrade10.
The aim of the mathematics curricula is to develop mathematically literate students who communicate to learn and express their understanding of mathematics, connect mathematical ideas, demonstrate fluency with mental math and estimation, develop and apply reasoning and problem-solving skills, and select and use technological tools. The math curriculum is focused on the nature of mathematics and key processes and is organized into four strands: number, patterns and relations, shape and space, and statistics and probability.
In the francophone sector, these aims are attained through mathematics domains such as numbers and operations, patterns and relations, shapes and space, and statistics and probability.
Mathematics assessmentAt the provincial level, both the francophone and the anglophone sectors of the department of education have administered mathematics examinations to Grade 5 and Grade8studentssince2006.TheteststakeplaceinMayorJune,withresultsmadeavailable to schools and parents before the end of the school year. The examinations includebothmultiple-choiceandconstructed-response/essayquestionsandassessthefour domains of the curriculum. Detailed statistical reports on success rates are then provided to school districts and schools in order to set goals for improvement and provide information on student achievement to parents and the general public.
A Grade 3 provincial mathematics assessment was introduced in 2010. The four assessments (including the Grade 11 test administered since 1991 in the francophone sector) generate standardized data on progress in learning at key points in students’ careers. Teachers participate in every stage of the development, administration, and marking of the examinations.
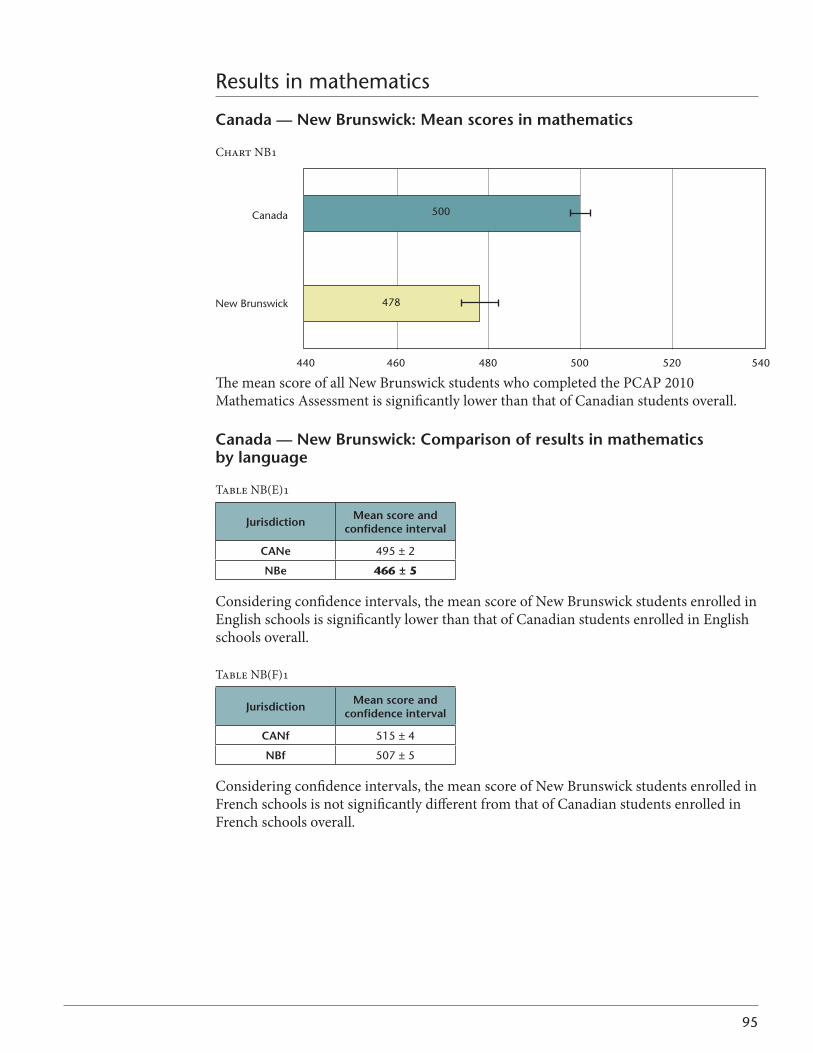
95
Results in mathematics
Canada — New brunswick: Mean scores in mathematics
Chart NB1
New Brunswick
Canada
440 460 500480 520 540
478
500
The mean score of all New Brunswick students who completed the PCAP 2010 Mathematics Assessment is significantly lower than that of Canadian students overall.
Canada — New brunswick: Comparison of results in mathematics by language
Table NB(E)1
Jurisdiction Mean score and confidence interval
CANe 495 ± 2
Nbe 466 ± 5
Considering confidence intervals, the mean score of New Brunswick students enrolled in English schools is significantly lower than that of Canadian students enrolled in English schools overall.
Table NB(F)1
Jurisdiction Mean score and confidence interval
CANf 515 ± 4
Nbf 507 ± 5
Considering confidence intervals, the mean score of New Brunswick students enrolled in French schools is not significantly different from that of Canadian students enrolled in French schools overall.
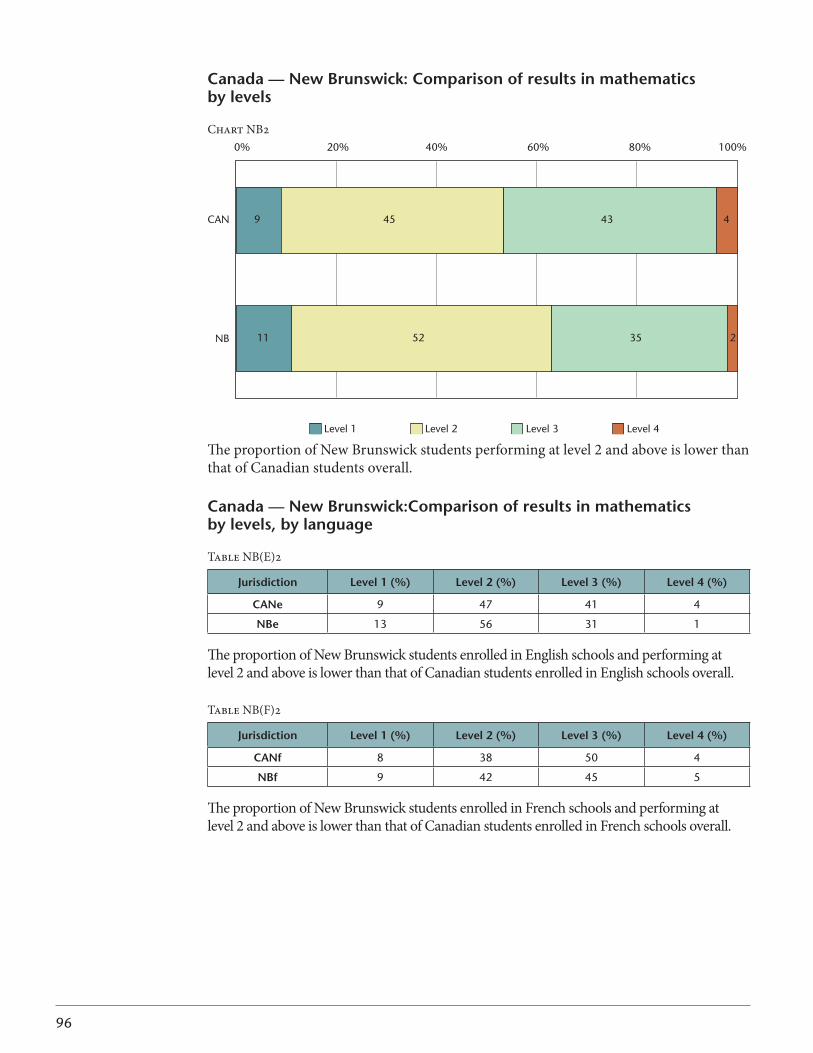
96
Canada — New brunswick: Comparison of results in mathematics by levels
Chart NB2
The proportion of New Brunswick students performing at level 2 and above is lower than that of Canadian students overall.
Canada — New brunswick:Comparison of results in mathematics by levels, by language
Table NB(E)2
Jurisdiction level 1 (%) level 2 (%) level 3 (%) level 4 (%)
CANe 9 47 41 4
Nbe 13 56 31 1
The proportion of New Brunswick students enrolled in English schools and performing at level 2 and above is lower than that of Canadian students enrolled in English schools overall.
Table NB(F)2
Jurisdiction level 1 (%) level 2 (%) level 3 (%) level 4 (%)
CANf 8 38 50 4
Nbf 9 42 45 5
The proportion of New Brunswick students enrolled in French schools and performing at level 2 and above is lower than that of Canadian students enrolled in French schools overall.
CAN
NB
0% 20% 40% 60% 80% 100%
9
11
45
52
43
35
4
2
Level 1 Level 2 Level 3 Level 4
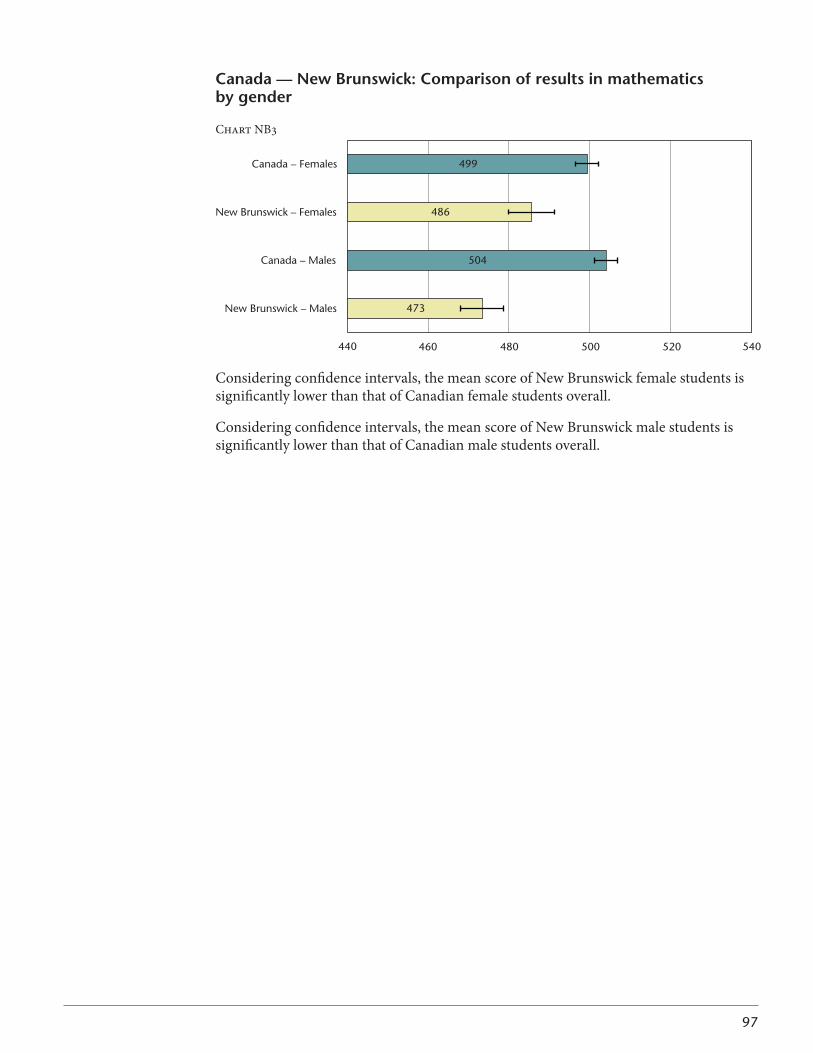
97
Canada — New brunswick: Comparison of results in mathematics by gender
Chart NB3
440 540460 480 500 520
New Brunswick – Males
Canada – Males
New Brunswick – Females
Canada – Females
473
504
486
499
Considering confidence intervals, the mean score of New Brunswick female students is significantly lower than that of Canadian female students overall.
Considering confidence intervals, the mean score of New Brunswick male students is significantly lower than that of Canadian male students overall.
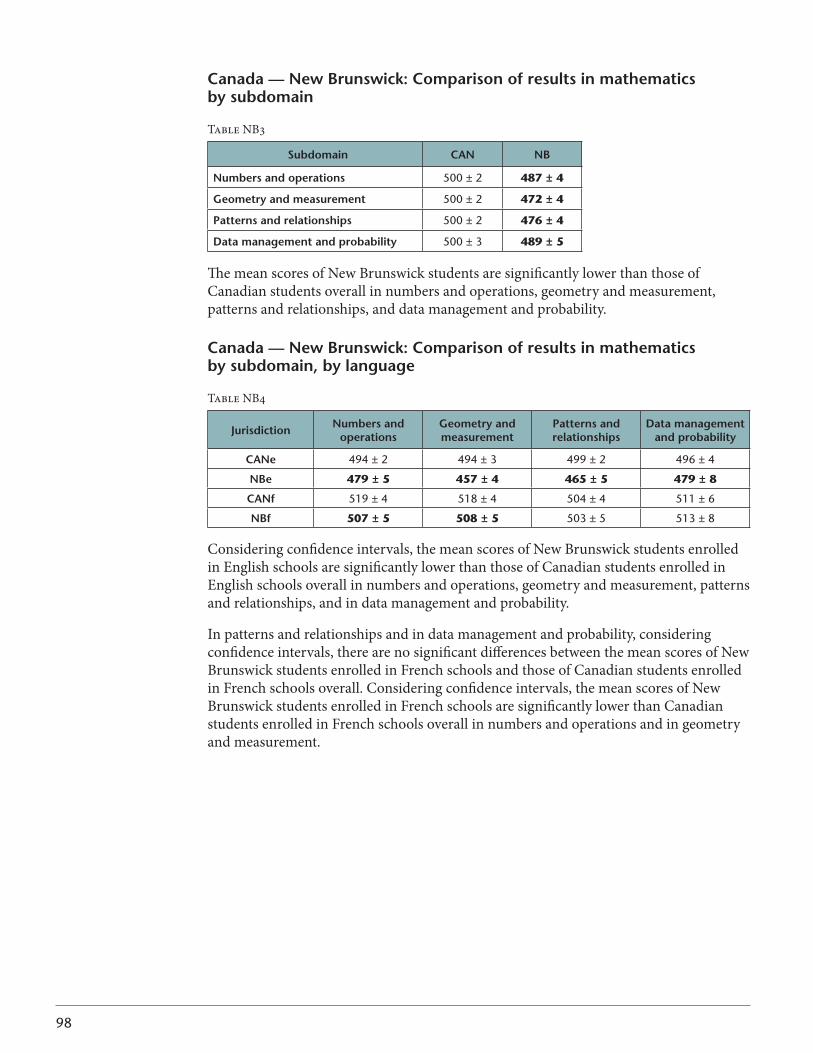
98
Canada — New brunswick: Comparison of results in mathematics by subdomain
Table NB3
subdomain CAN Nb
Numbers and operations 500 ± 2 487 ± 4
geometry and measurement 500 ± 2 472 ± 4
Patterns and relationships 500 ± 2 476 ± 4
data management and probability 500 ± 3 489 ± 5
The mean scores of New Brunswick students are significantly lower than those of Canadian students overall in numbers and operations, geometry and measurement, patterns and relationships, and data management and probability.
Canada — New brunswick: Comparison of results in mathematics by subdomain, by language
Table NB4
Jurisdiction Numbers and operations
geometry and measurement
Patterns and relationships
data managementand probability
CANe 494 ± 2 494 ± 3 499 ± 2 496 ± 4
Nbe 479 ± 5 457 ± 4 465 ± 5 479 ± 8
CANf 519 ± 4 518 ± 4 504 ± 4 511 ± 6
Nbf 507 ± 5 508 ± 5 503 ± 5 513 ± 8
Considering confidence intervals, the mean scores of New Brunswick students enrolled in English schools are significantly lower than those of Canadian students enrolled in English schools overall in numbers and operations, geometry and measurement, patterns and relationships, and in data management and probability.
In patterns and relationships and in data management and probability, considering confidence intervals, there are no significant differences between the mean scores of New Brunswick students enrolled in French schools and those of Canadian students enrolled in French schools overall. Considering confidence intervals, the mean scores of New Brunswick students enrolled in French schools are significantly lower than Canadian students enrolled in French schools overall in numbers and operations and in geometry and measurement.
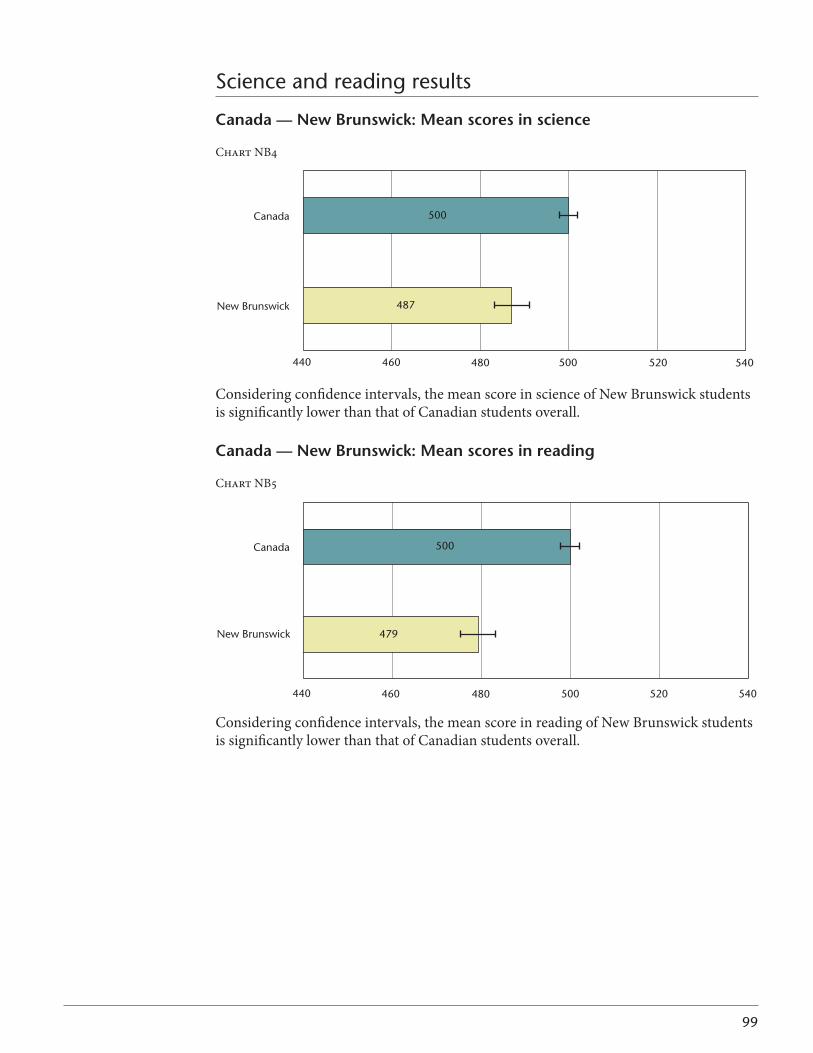
99
Science and reading results
Canada — New brunswick: Mean scores in science
Chart NB4
Considering confidence intervals, the mean score in science of New Brunswick students is significantly lower than that of Canadian students overall.
Canada — New brunswick: Mean scores in reading
Chart NB5
Considering confidence intervals, the mean score in reading of New Brunswick students is significantly lower than that of Canadian students overall.
487
500
New Brunswick
Canada
440 540520500480460
479
500
New Brunswick
Canada
440 540520500480460
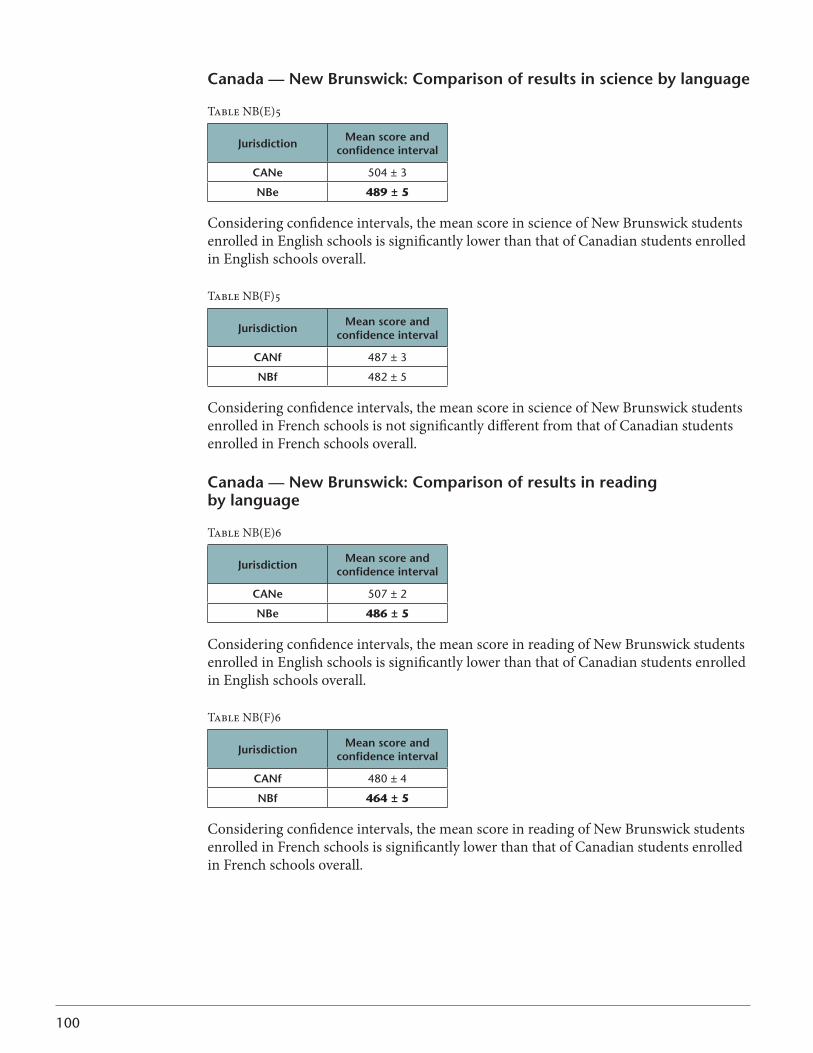
100
Canada — New brunswick: Comparison of results in science by language
Table NB(E)5
Jurisdiction Mean score and confidence interval
CANe 504 ± 3
Nbe 489 ± 5
Considering confidence intervals, the mean score in science of New Brunswick students enrolled in English schools is significantly lower than that of Canadian students enrolled in English schools overall.
Table NB(F)5
Jurisdiction Mean score and confidence interval
CANf 487 ± 3
Nbf 482 ± 5
Considering confidence intervals, the mean score in science of New Brunswick students enrolled in French schools is not significantly different from that of Canadian students enrolled in French schools overall.
Canada — New brunswick: Comparison of results in reading by language
Table NB(E)6
Jurisdiction Mean score and confidence interval
CANe 507 ± 2
Nbe 486 ± 5
Considering confidence intervals, the mean score in reading of New Brunswick students enrolled in English schools is significantly lower than that of Canadian students enrolled in English schools overall.
Table NB(F)6
Jurisdiction Mean score and confidence interval
CANf 480 ± 4
Nbf 464 ± 5
Considering confidence intervals, the mean score in reading of New Brunswick students enrolled in French schools is significantly lower than that of Canadian students enrolled in French schools overall.
101
NOVA SCOTIA
Context statement
Social contextNova Scotia has a population of 939,500, with a higher rural population than the Canadian average. The annual population growth rate is below 1 per cent, and immigration is low compared to the rest of Canada. About 10 per cent of the population speaks both English and French or French only. Among the total population, visible minorities make up 4 per cent. Unemployment rates in Nova Scotia are typically above the Canadian average.
Organization of the school systemThere are seven regional anglophone school boards in Nova Scotia, which enrol 96.7 per cent of all public school students. The provincial school board for Acadian/francophone students, known as the Conseil scolaire acadien provincial, enrols the remaining 3.3 per cent of students. Nova Scotia’s total public school population is slightly more than 133,000 from primary to Grade 12. Overall, it is anticipated that school enrolment will continue to decrease over the next few years. Children who started school prior to the 2008-2009 school year must have turned five years of age on or before October 1 to be admitted to the level. Beginning in September 2008, students who enter primary must be five years old on or before December 31. Students must attend school until they are 16 years old.
Mathematics teachingImplementation of the Atlantic Canada Mathematics Curriculum began in 1997. The curriculumwascarefullyconceivedtoemphasizealogical,developmentalsequenceofmathematicsfromgradetograde,totheendofthepublicschoolprogram.Keyaspectsof this curriculum include the following:• Studentstakeanactiveroleintheirstudyofmathematics.• Mathematicsclassroomsarecentresofinquirywherelearnersinvestigate
mathematics learning.• Conceptualandproceduralfluencyinmathematicsisdevelopedinaresource-based
learning environment.• Theimportanceofmathematicsliteracypermeatesthebreadthanddepthofthe
mathematics curriculum at all instructional levels.• Studentsareexpectedtocommunicatemathematically,reasonmathematically,use
problem-solving strategies effectively, and value mathematics.• Mathematicsinstruction,andmathematicsitself,offerincreasedopportunitiesfor
students to use current and emerging technologies.• Assessmentisintegratedwithinstructionandincludesawidevarietyof
assessment strategies.
102
The Atlantic Canada Mathematics Curriculum is shaped by a vision that fosters the development of mathematically literate students who can extend and apply their learning and who are effective participants in an increasingly technological society. Mathematics is a priority in Nova Scotia’s public schools at all grade levels. Nova Scotia’s Mathematics Strategy P–9 centres on improving teaching, learning, and achievement. The government has committed to providing appropriate learning materials for all students in mathematics, as well as mentors and professional learning for teachers. Nova Scotia has recently implemented new geometry curricula for Grades 7–9.
Mathematics assessmentsProvincial assessments of mathematical literacy are administered in Grades 3 and 6. A new provincial mathematics assessment for Grade 8 is in development and will be administered for the first time in the 2011–2012 school year. These assessments are used to identify student learning needs and focus improvement strategies. Assessment results are returned to each school in a timely manner so that teachers can give appropriate mathematics instruction to individual students. Students’ progress is monitored each year within the school, but teachers are also able to determine student progress over time in relation to mathematical literacy on the provincial assessments. Senior high-school students participate in Grade 12 provincial examinations in mathematics. The examination result counts as 30 per cent of a student’s final course mark.
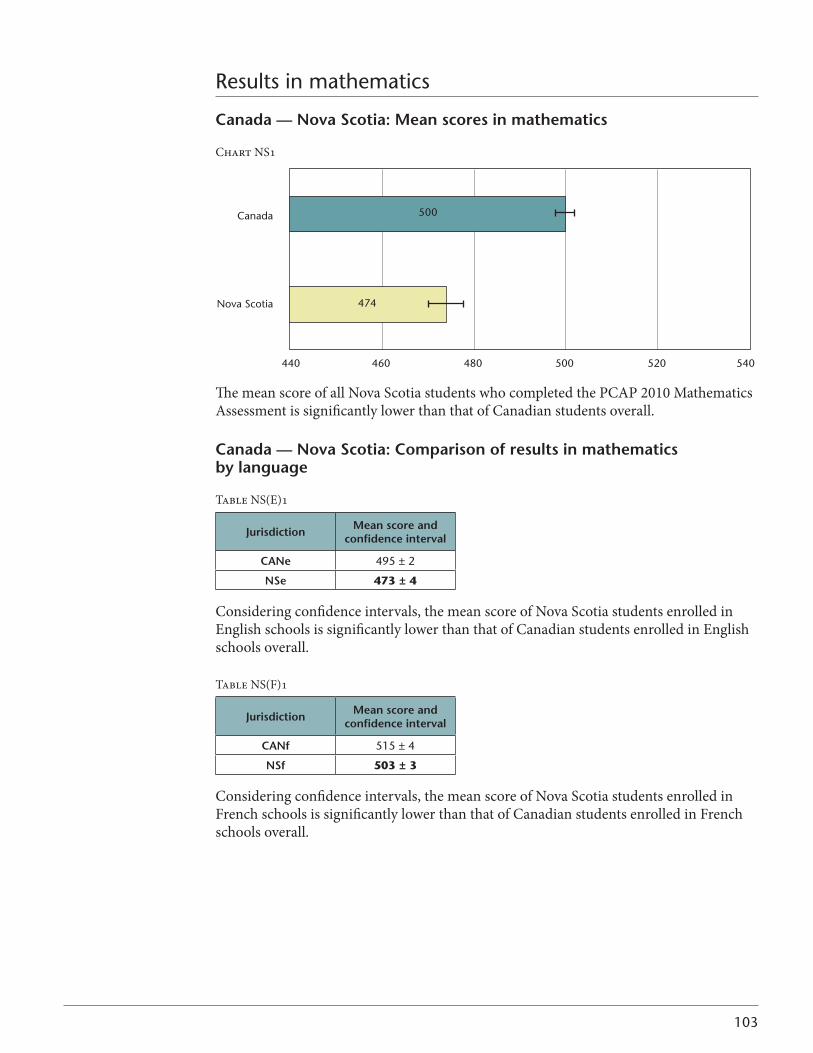
103
Results in mathematics
Canada — Nova scotia: Mean scores in mathematics
Chart NS1
The mean score of all Nova Scotia students who completed the PCAP 2010 Mathematics Assessment is significantly lower than that of Canadian students overall.
Canada — Nova scotia: Comparison of results in mathematics by language
Table NS(E)1
Jurisdiction Mean score and confidence interval
CANe 495 ± 2
Nse 473 ± 4
Considering confidence intervals, the mean score of Nova Scotia students enrolled in English schools is significantly lower than that of Canadian students enrolled in English schools overall.
Table NS(F)1
Jurisdiction Mean score and confidence interval
CANf 515 ± 4
Nsf 503 ± 3
Considering confidence intervals, the mean score of Nova Scotia students enrolled in French schools is significantly lower than that of Canadian students enrolled in French schools overall.
Nova Scotia
Canada
440 460 500480 520 540
474
500
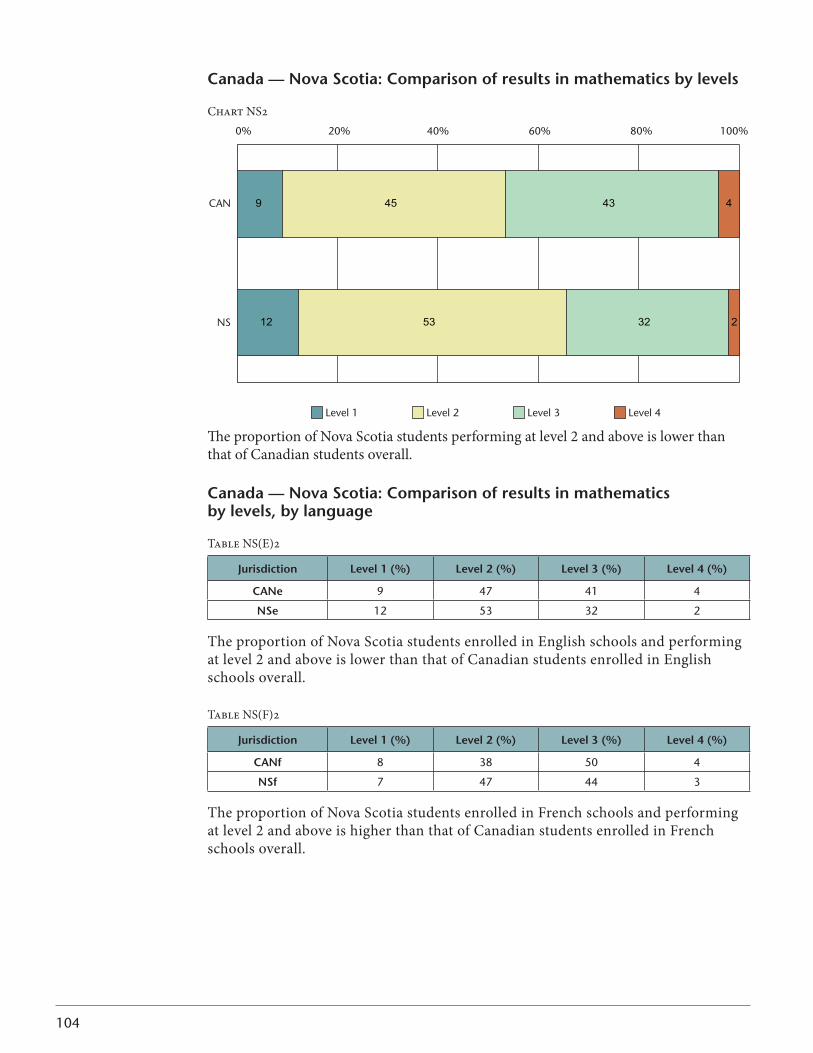
104
Canada — Nova scotia: Comparison of results in mathematics by levels
Chart NS2
The proportion of Nova Scotia students performing at level 2 and above is lower than that of Canadian students overall.
Canada — Nova scotia: Comparison of results in mathematics by levels, by language
Table NS(E)2
Jurisdiction level 1 (%) level 2 (%) level 3 (%) level 4 (%)
CANe 9 47 41 4
Nse 12 53 32 2
The proportion of Nova Scotia students enrolled in English schools and performing at level 2 and above is lower than that of Canadian students enrolled in English schools overall.
Table NS(F)2
Jurisdiction level 1 (%) level 2 (%) level 3 (%) level 4 (%)
CANf 8 38 50 4
Nsf 7 47 44 3
The proportion of Nova Scotia students enrolled in French schools and performing at level 2 and above is higher than that of Canadian students enrolled in French schools overall.
CAN
NS
0% 20% 40% 60% 80% 100%
Level 1 Level 2 Level 3 Level 4
9
12
45
53
43
32
4
2
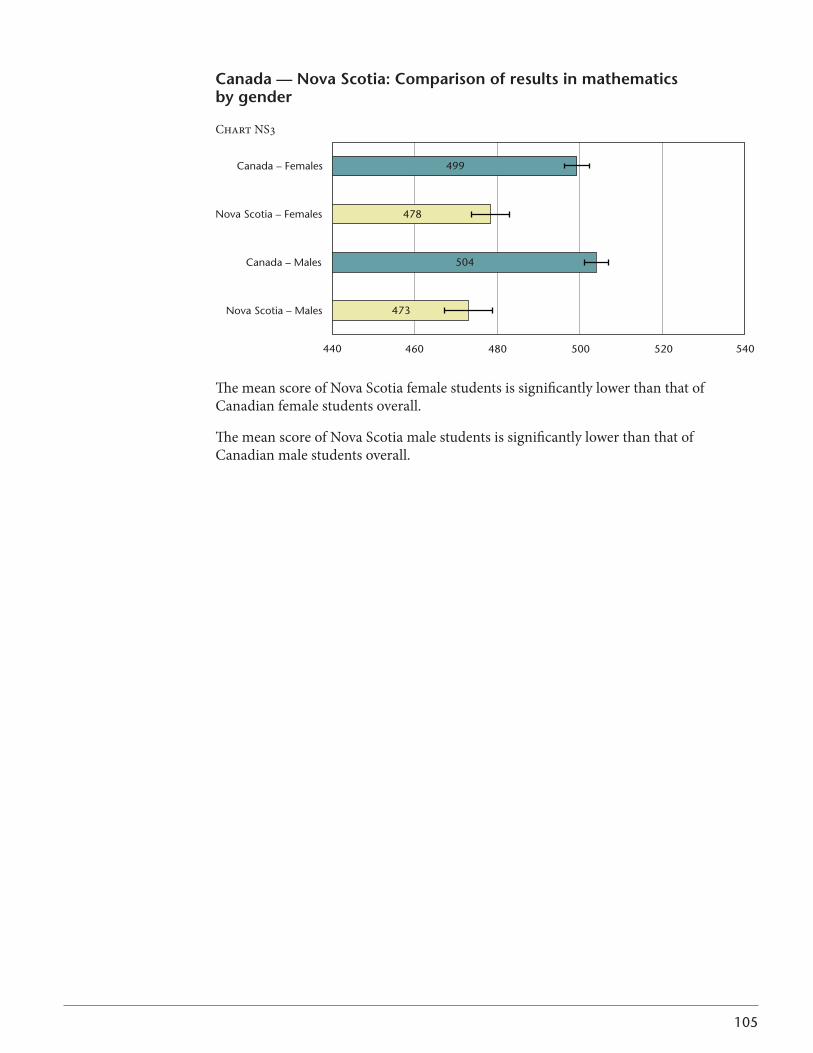
105
Canada — Nova scotia: Comparison of results in mathematics by gender
Chart NS3
440 540460 480 500 520
Nova Scotia – Males
Canada – Males
Nova Scotia – Females
Canada – Females
473
504
478
499
The mean score of Nova Scotia female students is significantly lower than that of Canadian female students overall.
The mean score of Nova Scotia male students is significantly lower than that of Canadian male students overall.
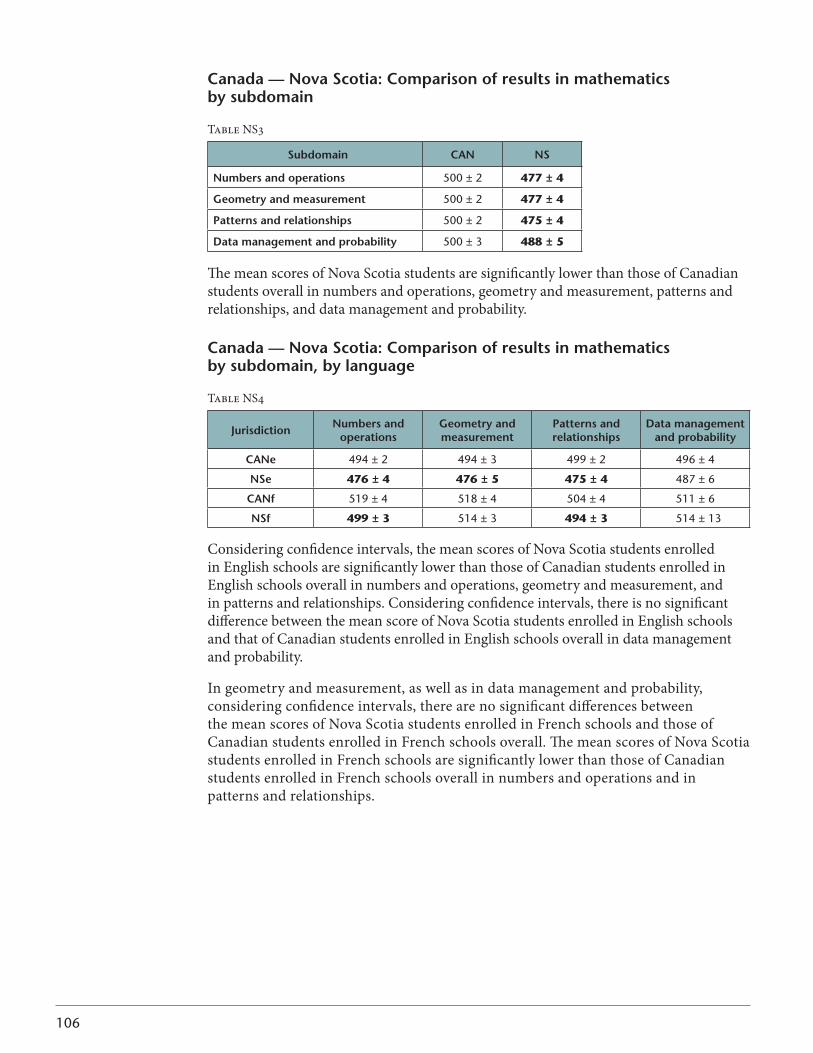
106
Canada — Nova scotia: Comparison of results in mathematics by subdomain
Table NS3
subdomain CAN Ns
Numbers and operations 500 ± 2 477 ± 4
geometry and measurement 500 ± 2 477 ± 4
Patterns and relationships 500 ± 2 475 ± 4
data management and probability 500 ± 3 488 ± 5
The mean scores of Nova Scotia students are significantly lower than those of Canadian students overall in numbers and operations, geometry and measurement, patterns and relationships, and data management and probability.
Canada — Nova scotia: Comparison of results in mathematics by subdomain, by language
Table NS4
Jurisdiction Numbers and operations
geometry and measurement
Patterns and relationships
data managementand probability
CANe 494 ± 2 494 ± 3 499 ± 2 496 ± 4
Nse 476 ± 4 476 ± 5 475 ± 4 487 ± 6
CANf 519 ± 4 518 ± 4 504 ± 4 511 ± 6
Nsf 499 ± 3 514 ± 3 494 ± 3 514 ± 13
Considering confidence intervals, the mean scores of Nova Scotia students enrolled in English schools are significantly lower than those of Canadian students enrolled in English schools overall in numbers and operations, geometry and measurement, and in patterns and relationships. Considering confidence intervals, there is no significant difference between the mean score of Nova Scotia students enrolled in English schools and that of Canadian students enrolled in English schools overall in data management and probability.
In geometry and measurement, as well as in data management and probability, considering confidence intervals, there are no significant differences between the mean scores of Nova Scotia students enrolled in French schools and those of Canadian students enrolled in French schools overall. The mean scores of Nova Scotia students enrolled in French schools are significantly lower than those of Canadian students enrolled in French schools overall in numbers and operations and in patterns and relationships.
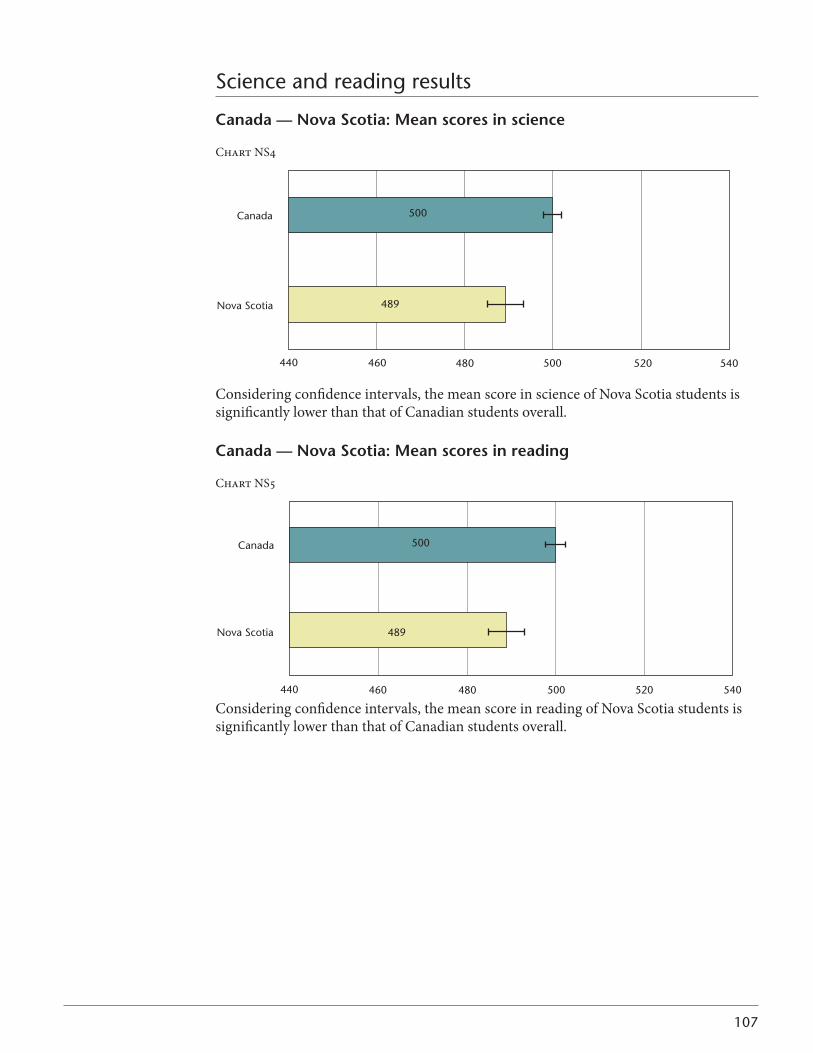
107
Science and reading results
Canada — Nova scotia: Mean scores in science
Chart NS4
Considering confidence intervals, the mean score in science of Nova Scotia students is significantly lower than that of Canadian students overall.
Canada — Nova scotia: Mean scores in reading
Chart NS5
Considering confidence intervals, the mean score in reading of Nova Scotia students is significantly lower than that of Canadian students overall.
489
500
Nova Scotia
Canada
440 540520500480460
489
500
Nova Scotia
Canada
440 540520500480460
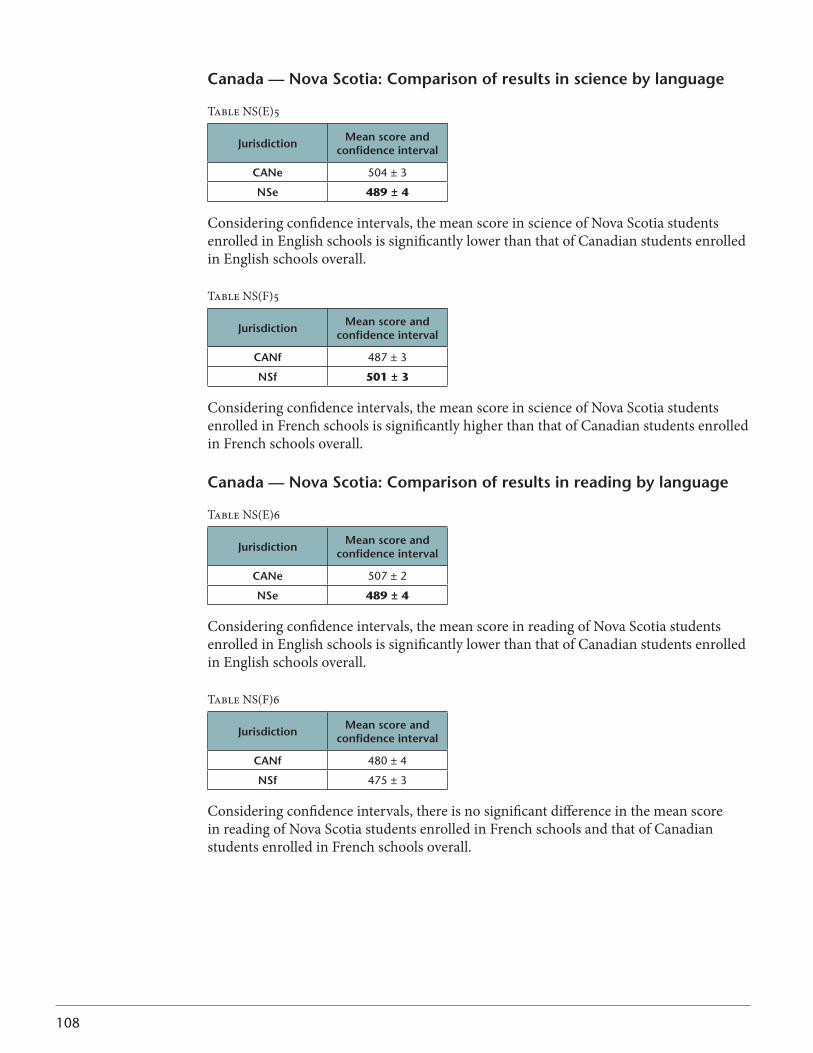
108
Canada — Nova scotia: Comparison of results in science by language
Table NS(E)5
Jurisdiction Mean score and confidence interval
CANe 504 ± 3
Nse 489 ± 4
Considering confidence intervals, the mean score in science of Nova Scotia students enrolled in English schools is significantly lower than that of Canadian students enrolled in English schools overall.
Table NS(F)5
Jurisdiction Mean score and confidence interval
CANf 487 ± 3
Nsf 501 ± 3
Considering confidence intervals, the mean score in science of Nova Scotia students enrolled in French schools is significantly higher than that of Canadian students enrolled in French schools overall.
Canada — Nova scotia: Comparison of results in reading by language
Table NS(E)6
Jurisdiction Mean score and confidence interval
CANe 507 ± 2
Nse 489 ± 4
Considering confidence intervals, the mean score in reading of Nova Scotia students enrolled in English schools is significantly lower than that of Canadian students enrolled in English schools overall.
Table NS(F)6
Jurisdiction Mean score and confidence interval
CANf 480 ± 4
Nsf 475 ± 3
Considering confidence intervals, there is no significant difference in the mean score in reading of Nova Scotia students enrolled in French schools and that of Canadian students enrolled in French schools overall.
109
PRINCE EDWARD ISLAND
Context statement
Social contextPrince Edward Island (PE) is the smallest province in Canada, both in terms of land (5,684squarekilometres)andpopulation(141,000).Ninety-ninepercentofthepopulation speaks English. Approximately 6,000 francophone residents live in Prince Edward Island. Fifty-six per cent of the population is rural, with approximately 7 per cent living on farms. The environment is predominately rural, with agriculture, tourism, fishing, and manufacturing constituting the major industries. The Confederation Bridge, the world’s longest continuous multi-span bridge, opened in 1997, connecting Prince Edward Island to mainland New Brunswick (www.gov.pe.ca).
Organization of the school systemAt the time of the 2010 PCAP assessment, Prince Edward Island’s public school system was composed of three school boards, with an enrolment of 20,324 students in 70 public schools. Approximately 707 students were enrolled in six French schools, and 17 per cent were enrolled in French Immersion courses. In addition, there were three private schools with a total of 212 students, and one First Nations-operated school. Prince Edward Island has a teaching force of approximately 1,500 teachers employed by the school boards.
The school system consists of Grades 1–12. Students entering Grade 1 must be six years of age by the end of December of their first school year. Prince Edward Island has a publiclyfunded,community-basedKindergartenprogramthatattractsapproximately97 per cent of the province’s eligible five-year-olds. Prince Edward Island’s students are accommodated within facilities that contain a number of grade configurations, including Grades 1–3, 1–4, 1–6, 4–6, 5–8, 1–8, 1–9, 7–9, 9–12, and 10–12. This diversity results from demands placed on the schools by local communities, enrolment, and existing facilities. In this province, high school consists of Grades 10–12.
Mathematics teachingThe PE mathematics curriculum articulates the vision for mathematics instruction in Prince Edward Island as the vehicle that enables and encourages students to become lifelong learners of mathematics. Learning outcomes are organized into seven unifying and interrelated processes: communications, connections, mental mathematics and estimation, problem solving, reasoning, technology, and visualization. Instruction is designed to engage students in a range of experiences to help them use mathematics effectively and purposefully, and to appreciate why it is so central to their lives.
Mathematics assessmentIn 2006-2007, Prince Edward Island introduced a common assessment program. One component of this program is the Intermediate Mathematics Assessment, which is administered to all Grade 9 students. In 2009, the Primary Mathematics Assessment was added for all students in Grade 3. In addition, teachers are encouraged to use a multi-faceted approach in their classrooms to integrate assessment with instruction and to use the collected information to inform students, parents, and other school personnel about student progress. For more information, please visit www.edu.pe.ca.
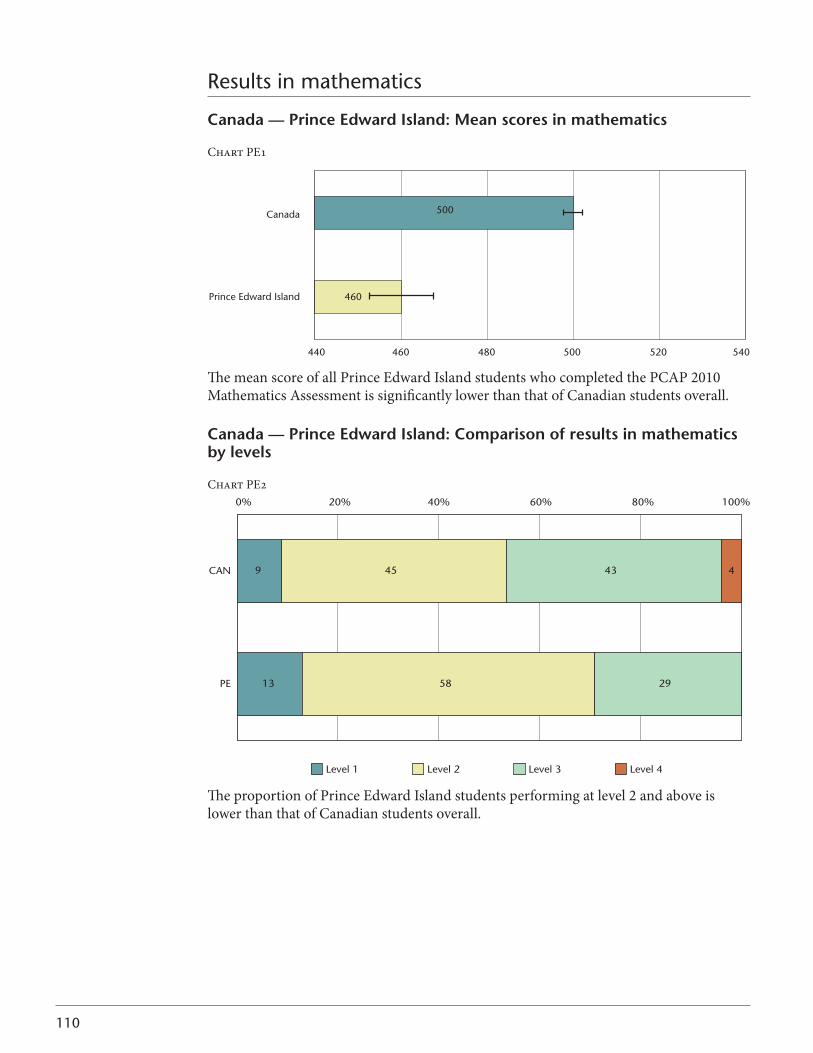
110
Results in mathematics
Canada — Prince edward island: Mean scores in mathematics
Chart PE1
The mean score of all Prince Edward Island students who completed the PCAP 2010 Mathematics Assessment is significantly lower than that of Canadian students overall.
Canada — Prince edward island: Comparison of results in mathematics by levels
Chart PE2
The proportion of Prince Edward Island students performing at level 2 and above is lower than that of Canadian students overall.
Prince Edward Island
Canada
440 460 500480 520 540
500
460
12
CAN
PE
0% 20% 40% 60% 80% 100%
9
13
45
58
43
29
4
Level 1 Level 2 Level 3 Level 4
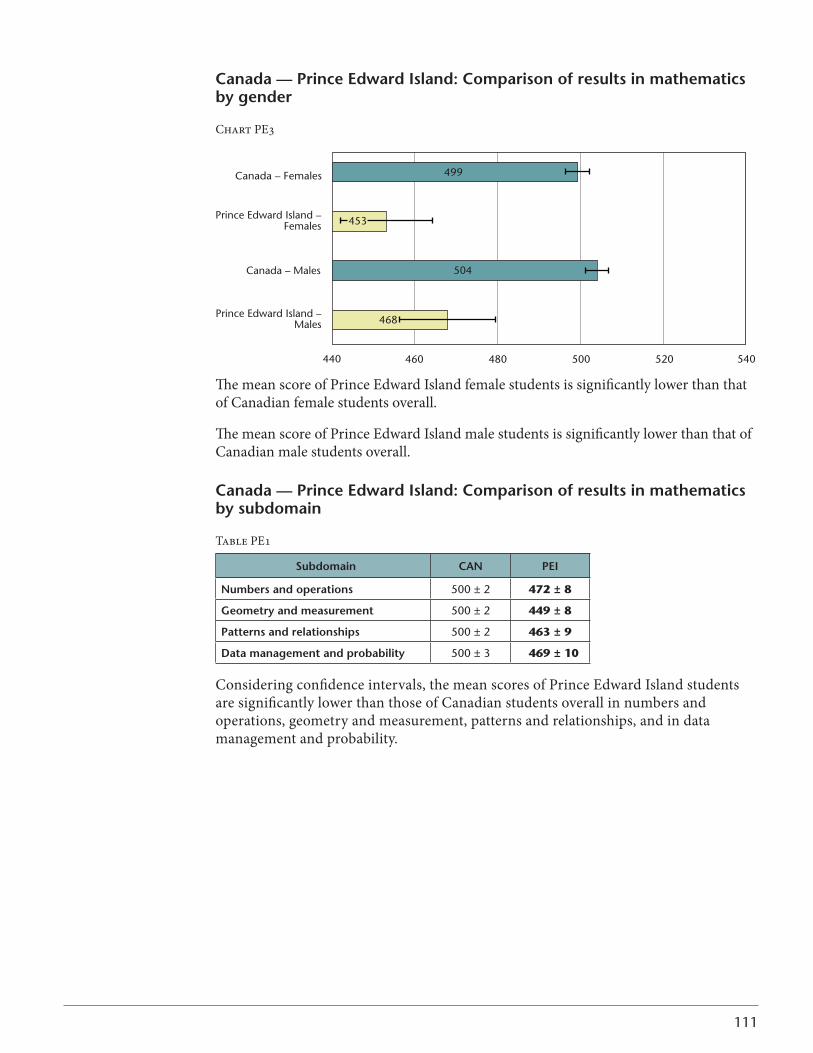
111
Canada — Prince edward island: Comparison of results in mathematics by gender
Chart PE3
440 540460 480 500 520
Prince Edward Island –Males
Canada – Males
Prince Edward Island –Females
Canada – Females
468
504
453
499
The mean score of Prince Edward Island female students is significantly lower than that of Canadian female students overall.
The mean score of Prince Edward Island male students is significantly lower than that of Canadian male students overall.
Canada — Prince edward island: Comparison of results in mathematics by subdomain
Table PE1
subdomain CAN Pei
Numbers and operations 500 ± 2 472 ± 8
geometry and measurement 500 ± 2 449 ± 8
Patterns and relationships 500 ± 2 463 ± 9
data management and probability 500 ± 3 469 ± 10
Considering confidence intervals, the mean scores of Prince Edward Island students are significantly lower than those of Canadian students overall in numbers and operations, geometry and measurement, patterns and relationships, and in data management and probability.
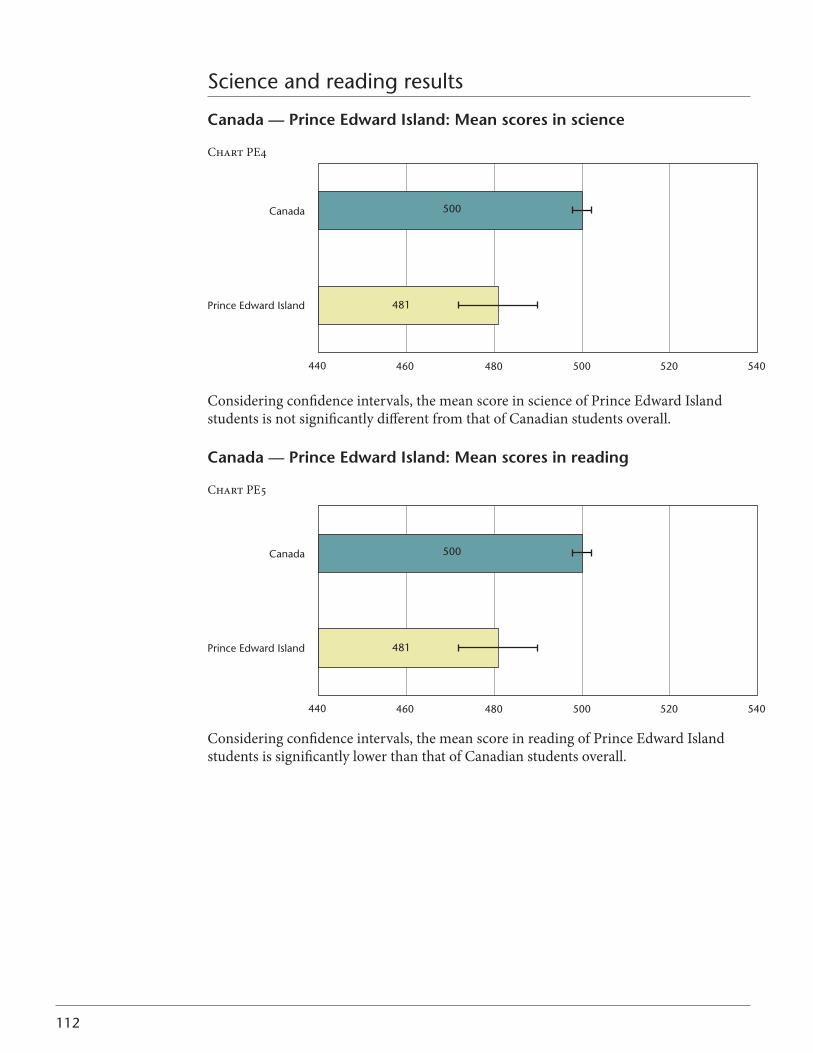
112
Science and reading results
Canada — Prince edward island: Mean scores in science
Chart PE4
481
500
Prince Edward Island
Canada
440 540520500480460
Considering confidence intervals, the mean score in science of Prince Edward Island students is not significantly different from that of Canadian students overall.
Canada — Prince edward island: Mean scores in reading
Chart PE5
481
500
Prince Edward Island
Canada
440 540520500480460
Considering confidence intervals, the mean score in reading of Prince Edward Island students is significantly lower than that of Canadian students overall.
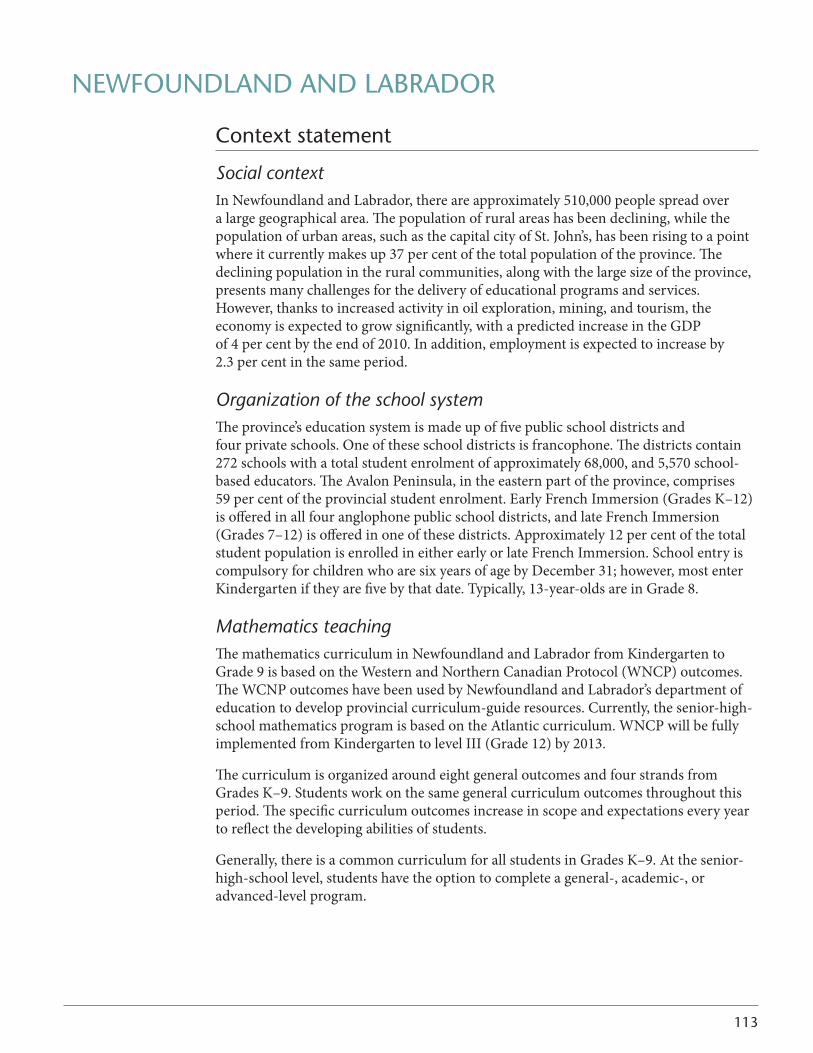
113
NEWFOUNDLAND AND LABRADOR
Context statement
Social contextIn Newfoundland and Labrador, there are approximately 510,000 people spread over a large geographical area. The population of rural areas has been declining, while the populationofurbanareas,suchasthecapitalcityofSt.John’s,hasbeenrisingtoapointwhere it currently makes up 37 per cent of the total population of the province. The declining population in the rural communities, along with the large size of the province, presents many challenges for the delivery of educational programs and services. However, thanks to increased activity in oil exploration, mining, and tourism, the economy is expected to grow significantly, with a predicted increase in the GDP of 4 per cent by the end of 2010. In addition, employment is expected to increase by 2.3 per cent in the same period.
Organization of the school systemThe province’s education system is made up of five public school districts and four private schools. One of these school districts is francophone. The districts contain 272 schools with a total student enrolment of approximately 68,000, and 5,570 school-based educators. The Avalon Peninsula, in the eastern part of the province, comprises 59percentoftheprovincialstudentenrolment.EarlyFrenchImmersion(GradesK–12)is offered in all four anglophone public school districts, and late French Immersion (Grades 7–12) is offered in one of these districts. Approximately 12 per cent of the total student population is enrolled in either early or late French Immersion. School entry is compulsoryforchildrenwhoaresixyearsofagebyDecember31;however,mostenterKindergarteniftheyarefivebythatdate.Typically,13-year-oldsareinGrade8.
Mathematics teachingThemathematicscurriculuminNewfoundlandandLabradorfromKindergartentoGrade 9 is based on the Western and Northern Canadian Protocol (WNCP) outcomes. The WCNP outcomes have been used by Newfoundland and Labrador’s department of education to develop provincial curriculum-guide resources. Currently, the senior-high-school mathematics program is based on the Atlantic curriculum. WNCP will be fully implementedfromKindergartentolevelIII(Grade12)by2013.
The curriculum is organized around eight general outcomes and four strands from GradesK–9.Studentsworkonthesamegeneralcurriculumoutcomesthroughoutthisperiod. The specific curriculum outcomes increase in scope and expectations every year to reflect the developing abilities of students.
Generally,thereisacommoncurriculumforallstudentsinGradesK–9.Atthesenior-high-school level, students have the option to complete a general-, academic-, or advanced-level program.
114
Mathematics assessmentNewfoundland and Labrador administers standardized provincial assessments each year at the end of primary, elementary, and intermediate levels in an effort to improve student learning. Students are assessed in the learning strands of the mathematics outcomes as outlined in the Newfoundland and Labrador curriculum guide documents. Provincial assessments are constructed to measure student learning in all strands of the mathematics program. Each assessment involves selected-response and constructed-response items. The mathematical processes — communication, connections, mental mathematics and estimation, problem solving, reasoning, technology, and visualization — are critical components of mathematics and are used in the teaching and learning of mathematics. The identified processes are a primary focus of instruction and assessment in Newfoundland and Labrador.
The province also has a provincial examination administered to students who complete the academic or advanced mathematics program. This examination is worth 50 per cent of a student’s final grade and is marked by a panel of teachers at the end of the school year.
MoreinformationabouttheNewfoundlandandLabradorK–12educationsystemcanbefound on the department of education Web site at www.gov.nl.ca/edu.
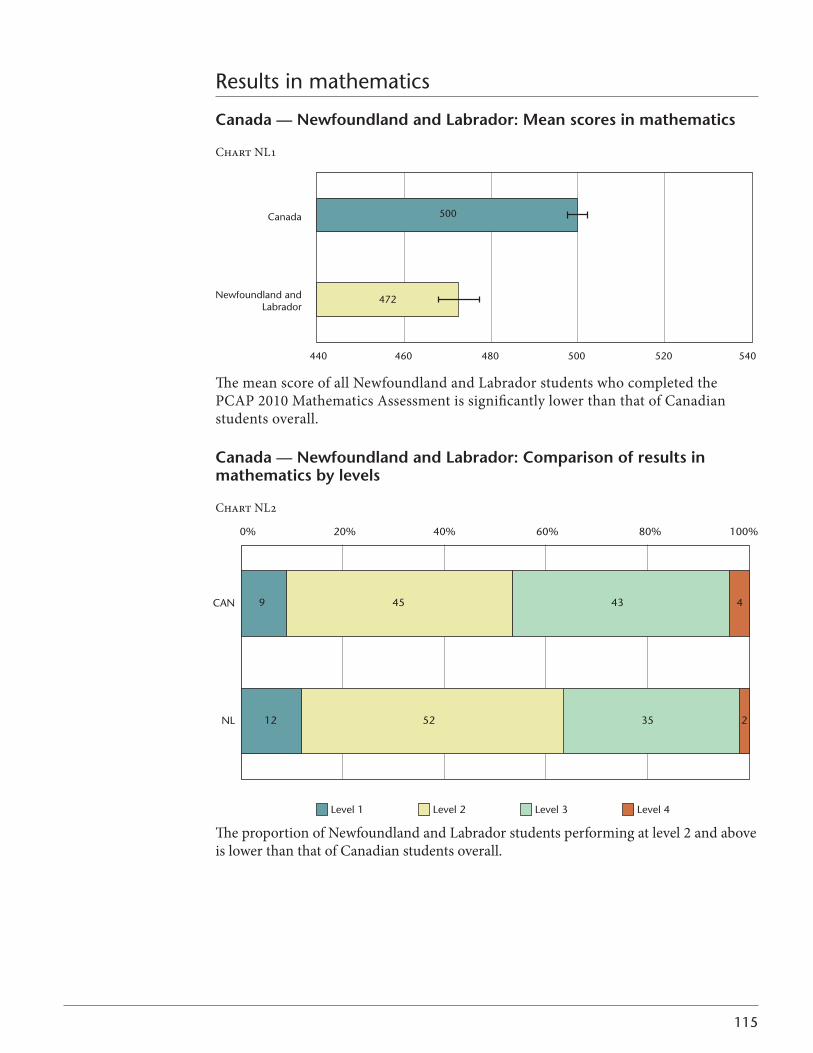
115
Results in mathematics
Canada — Newfoundland and labrador: Mean scores in mathematics
Chart NL1
The mean score of all Newfoundland and Labrador students who completed the PCAP 2010 Mathematics Assessment is significantly lower than that of Canadian students overall.
Canada — Newfoundland and labrador: Comparison of results in mathematics by levels
Chart NL2
The proportion of Newfoundland and Labrador students performing at level 2 and above is lower than that of Canadian students overall.
Newfoundland andLabrador
Canada
440 460 500480 520 540
472
500
CAN
NL
0% 20% 40% 60% 80% 100%
9
12
45
52
43
35
4
2
Level 1 Level 2 Level 3 Level 4
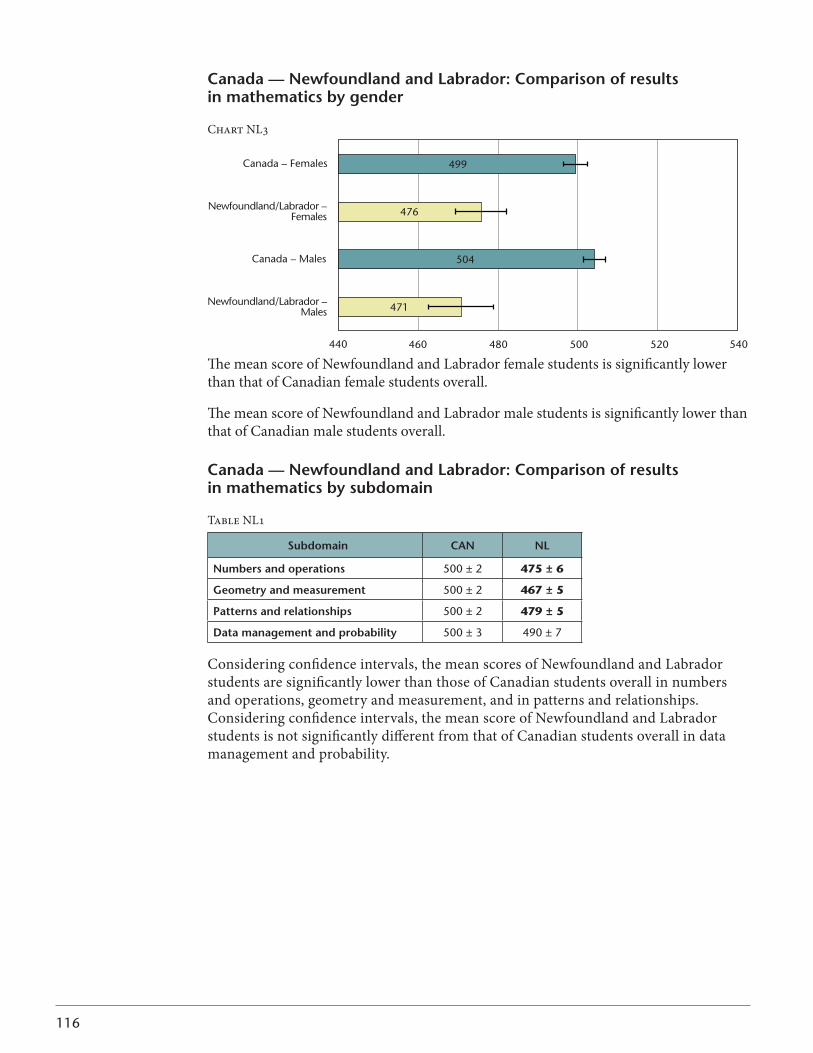
116
Canada — Newfoundland and labrador: Comparison of results in mathematics by gender
Chart NL3
499
476
504
471
440 540460 480 500 520
Newfoundland/Labrador –Males
Canada – Males
Newfoundland/Labrador –Females
Canada – Females
The mean score of Newfoundland and Labrador female students is significantly lower than that of Canadian female students overall.
The mean score of Newfoundland and Labrador male students is significantly lower than that of Canadian male students overall.
Canada — Newfoundland and labrador: Comparison of results in mathematics by subdomain
Table NL1
subdomain CAN Nl
Numbers and operations 500 ± 2 475 ± 6
geometry and measurement 500 ± 2 467 ± 5
Patterns and relationships 500 ± 2 479 ± 5
data management and probability 500 ± 3 490 ± 7
Considering confidence intervals, the mean scores of Newfoundland and Labrador students are significantly lower than those of Canadian students overall in numbers and operations, geometry and measurement, and in patterns and relationships. Considering confidence intervals, the mean score of Newfoundland and Labrador students is not significantly different from that of Canadian students overall in data management and probability.
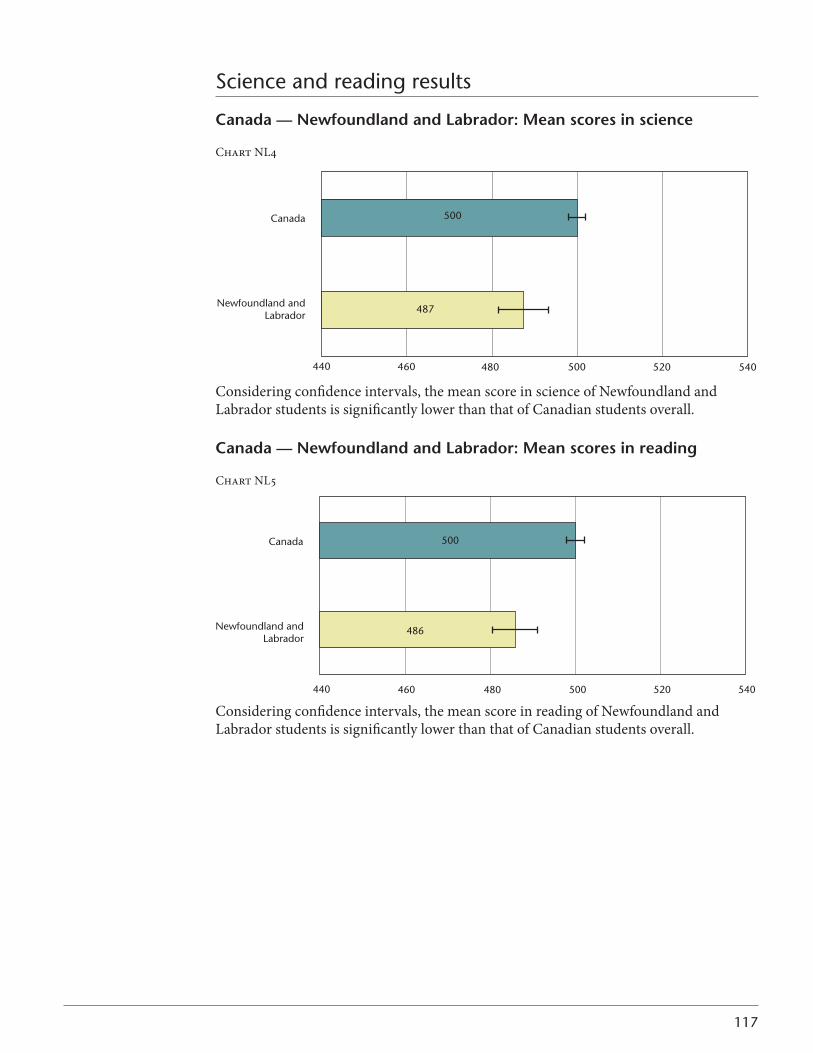
117
Science and reading results
Canada — Newfoundland and labrador: Mean scores in science
Chart NL4
Considering confidence intervals, the mean score in science of Newfoundland and Labrador students is significantly lower than that of Canadian students overall.
Canada — Newfoundland and labrador: Mean scores in reading
Chart NL5
Considering confidence intervals, the mean score in reading of Newfoundland and Labrador students is significantly lower than that of Canadian students overall.
487
500
Newfoundland andLabrador
Canada
440 540520500480460
486
500
Newfoundland andLabrador
Canada
440 540520500480460
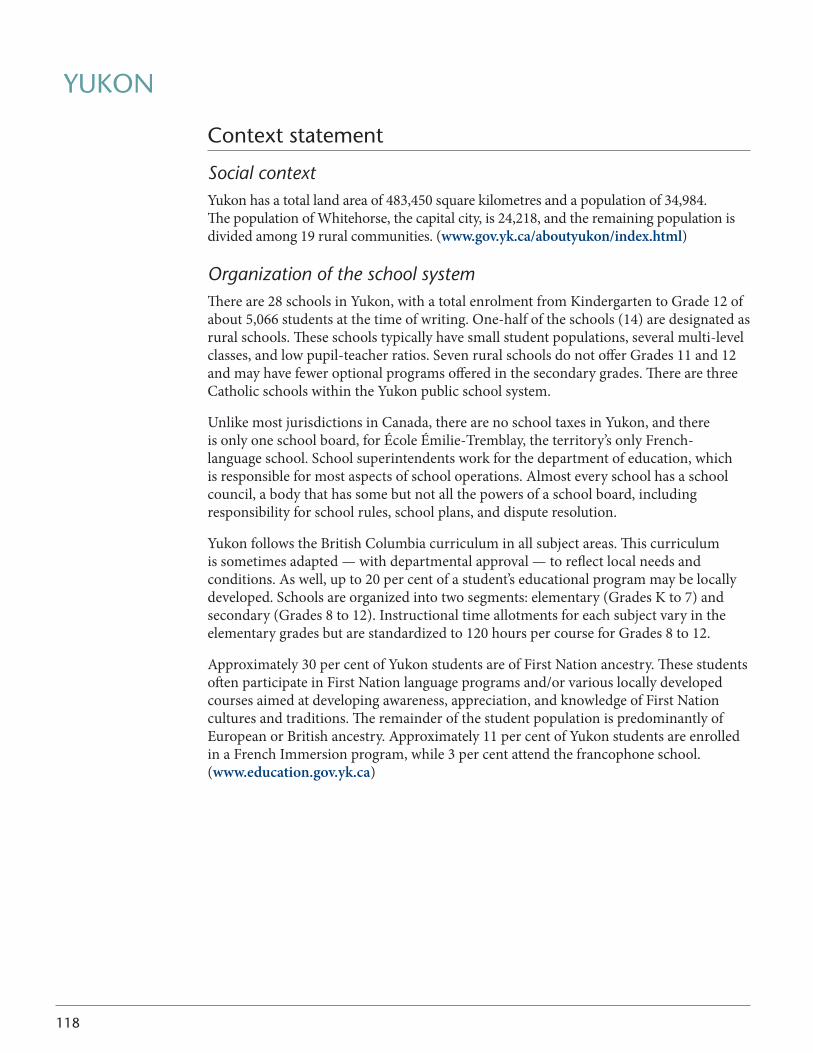
118
YUKON
Context statement
Social contextYukonhasatotallandareaof483,450squarekilometresandapopulationof34,984. The population of Whitehorse, the capital city, is 24,218, and the remaining population is divided among 19 rural communities. (www.gov.yk.ca/aboutyukon/index.html)
Organization of the school systemThereare28schoolsinYukon,withatotalenrolmentfromKindergartentoGrade12ofabout 5,066 students at the time of writing. One-half of the schools (14) are designated as rural schools. These schools typically have small student populations, several multi-level classes, and low pupil-teacher ratios. Seven rural schools do not offer Grades 11 and 12 and may have fewer optional programs offered in the secondary grades. There are three Catholic schools within the Yukon public school system.
Unlike most jurisdictions in Canada, there are no school taxes in Yukon, and there is only one school board, for École Émilie-Tremblay, the territory’s only French-language school. School superintendents work for the department of education, which is responsible for most aspects of school operations. Almost every school has a school council, a body that has some but not all the powers of a school board, including responsibility for school rules, school plans, and dispute resolution.
Yukon follows the British Columbia curriculum in all subject areas. This curriculum is sometimes adapted — with departmental approval — to reflect local needs and conditions. As well, up to 20 per cent of a student’s educational program may be locally developed.Schoolsareorganizedintotwosegments:elementary(GradesKto7)andsecondary (Grades 8 to 12). Instructional time allotments for each subject vary in the elementary grades but are standardized to 120 hours per course for Grades 8 to 12.
Approximately 30 per cent of Yukon students are of First Nation ancestry. These students often participate in First Nation language programs and/or various locally developed courses aimed at developing awareness, appreciation, and knowledge of First Nation cultures and traditions. The remainder of the student population is predominantly of European or British ancestry. Approximately 11 per cent of Yukon students are enrolled in a French Immersion program, while 3 per cent attend the francophone school. (www.education.gov.yk.ca)
119
Mathematics teachingThe department of education established the curriculum and general philosophy of education for all Yukon schools.
The Government of Yukon is a full partner in the Western and Northern Canadian Protocol (WNCP). This protocol supports the development of common curriculum frameworks for Western and Northern Canada. Within these frameworks, the British Columbia program of studies forms the basis of the Yukon curriculum. This curriculum isfrequentlyadaptedtoreflectlocalneedsandconditions.FromKindergartentoGrade12, curriculum is organized according to four learning strands: number, patterns and relations, shape and space, and statistics and probability. (www.education.gov.yk.ca/psb/curriculum.html)
Mathematics assessmentVarious assessment strategies are used to measure student progress. Yukon uses a mathematics achievement test at Grades 3, 6, and 9, and department-approved exams at theGrade10and12levelsformathematics.Theachievementtestconsistsofquestionsthat assess each of the four strands in mathematics and is used to inform instructional practice along with classroom-based formative assessment strategies. (www.education.gov.yk.ca/psb/assessment/yat.html)
link with PCAP assessment
All Yukon Grade 8 students participated in the 2010 PCAP test. The sample size for the territory was relatively large due to the small population size of Yukon (i.e., the sample was, in fact, the entire population of Yukon Grade 8 students).
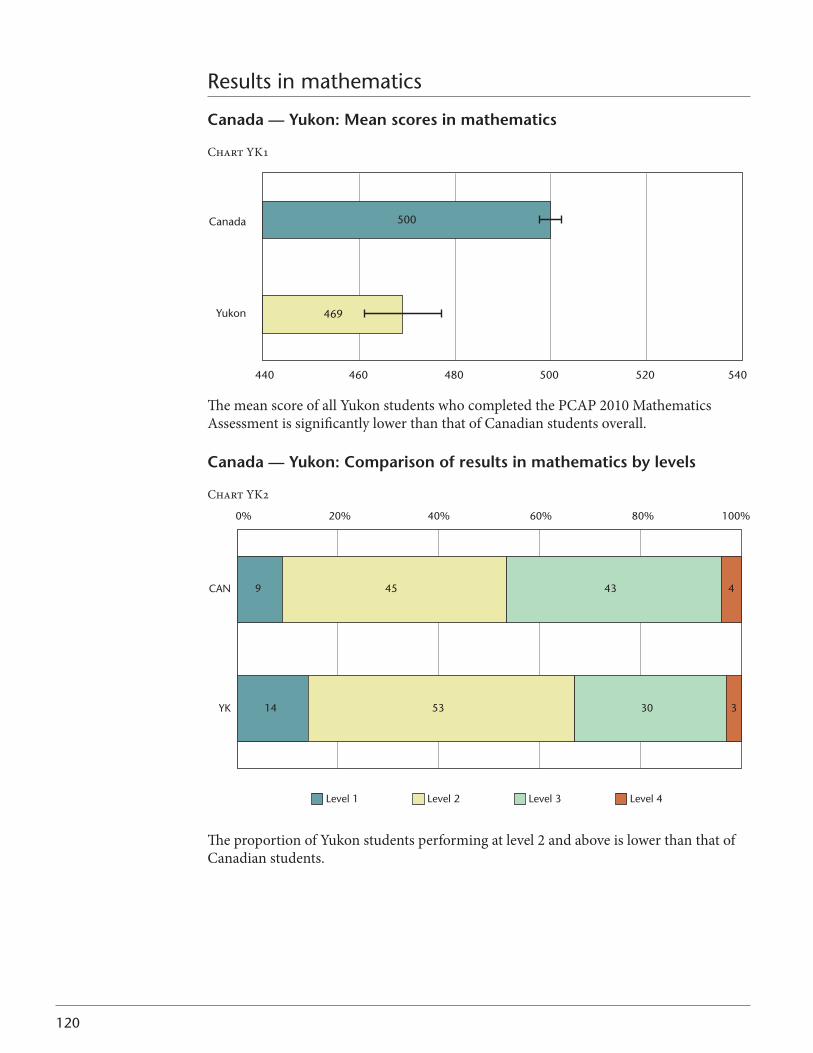
120
Results in mathematics
Canada — Yukon: Mean scores in mathematics
ChartYK1
The mean score of all Yukon students who completed the PCAP 2010 Mathematics Assessment is significantly lower than that of Canadian students overall.
Canada — Yukon: Comparison of results in mathematics by levels
ChartYK2
The proportion of Yukon students performing at level 2 and above is lower than that of Canadian students.
Yukon
Canada
440 460 500480 520 540
500
469
CAN
YK
0% 20% 40% 60% 80% 100%
Level 1 Level 2 Level 3 Level 4
9
14
45
53
43
30
4
3
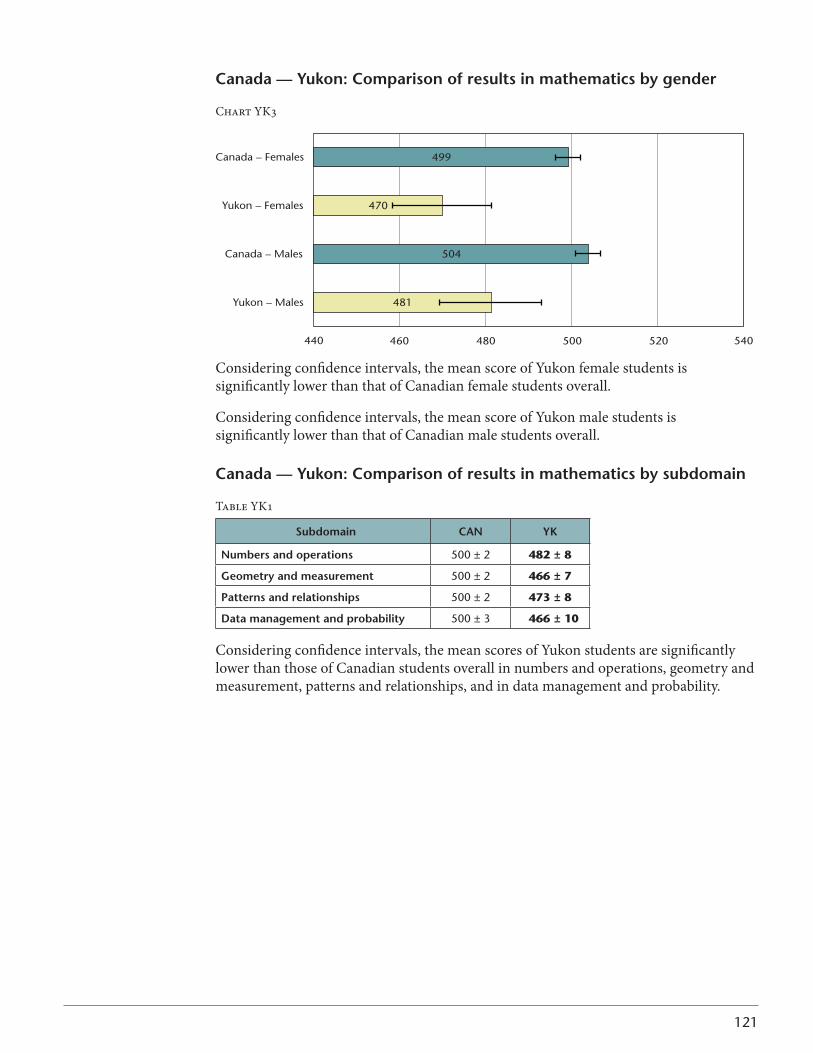
121
Canada — Yukon: Comparison of results in mathematics by gender
ChartYK3
481
504
470
499
440 540460 480 500 520
Yukon – Males
Canada – Males
Yukon – Females
Canada – Females
Considering confidence intervals, the mean score of Yukon female students is significantly lower than that of Canadian female students overall.
Considering confidence intervals, the mean score of Yukon male students is significantly lower than that of Canadian male students overall.
Canada — Yukon: Comparison of results in mathematics by subdomain
TableYK1
subdomain CAN YK
Numbers and operations 500 ± 2 482 ± 8
geometry and measurement 500 ± 2 466 ± 7
Patterns and relationships 500 ± 2 473 ± 8
data management and probability 500 ± 3 466 ± 10
Considering confidence intervals, the mean scores of Yukon students are significantly lower than those of Canadian students overall in numbers and operations, geometry and measurement, patterns and relationships, and in data management and probability.
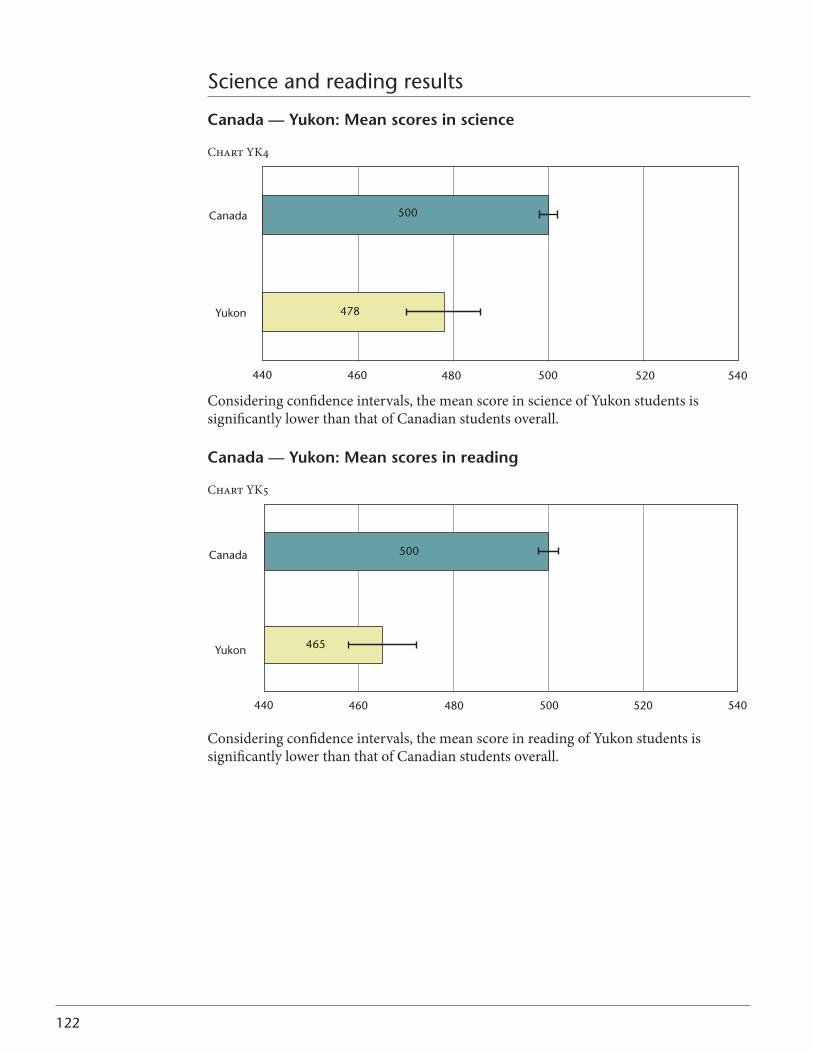
122
Science and reading results
Canada — Yukon: Mean scores in science
ChartYK4
Considering confidence intervals, the mean score in science of Yukon students is significantly lower than that of Canadian students overall.
Canada — Yukon: Mean scores in reading
ChartYK5
Considering confidence intervals, the mean score in reading of Yukon students is significantly lower than that of Canadian students overall.
478
500
Yukon
Canada
440 540520500480460
465
500
Yukon
Canada
440 540520500480460
123
PCAP 2010 QuesTioNNAiRes
ThePCAP2010Grade8assessmentincludedthreequestionnaires,oneforparticipatingstudents, one for teachers, and one for school principals. The overarching structure ofthethreequestionnaireswasderivedfromtheWang-Haertel-Walbergsynthesisofresearchonfactorsassociatedwithschoollearning.Thesequestionnairesalsofocusedon the particular need to capture factors associated with mathematics achievement. Thequestionnairesareintendedtocontextualizetheassessmentresults.Theyincludesomecoredescriptivedatausefulforbothpolicyandresearch;forexample,studentsocioeconomicstatus(SES),schooldemographics,andteacherqualifications.Varioustopicsalsoaddressedpolicy-relevantissues.Somequestionsfocusedontheassessment’smajordomain,mathematics,withtheinclusionofquestionsaboutteachingandlearningstrategiesandbehaviours.Otherquestionswereinareasthatsupportthedirectionsidentified by ministries and departments of education, even if these do not have obvious links to achievement in the major domain. The intended purpose of this selection of topics was to provide information useful in research applicable to mathematics.
Core questions
Thecoresectionincludedalimitednumberofquestionsfordescriptivepurposesandfor comparison or control variables in research models. Some of the topics addressed in thestudentquestionnaireincludedstudentgender,studentAboriginalstatus,studenthome background, SES, immigration status, home language, and language of instruction. Teacherquestionnairesincludedteacherdemographics,teacherqualificationsandassignments to mathematics, and teacher professional development in mathematics, whiletheschoolquestionnaire,includedschooldemographicsandgovernance,communitycontext,andcompositionofthestudentbody.ItwasfoundthatquestionsonhomelanguageusedinPCAP2007wereinsufficienttopursuethatareaatthelevelofdetailrequiredforaspecialreportonachievementofmajorityandminorityofficial-language groups, so this area was considerably expanded for PCAP 2010.
Gender differences in mathematicsDifferences in reading achievement favouring females have been a consistent feature of large-scale assessments. Differences in mathematics achievement tend to favour males but are much smaller than the reading differences. The concern in the reading questionnaireswastouncoversomepotentialexplanationsforthisphenomenonbyfocusing explicitly on differential treatment of boys and girls in school and differential reading-related behaviours outside of school. For mathematics, this issue is less strongly emphasized, but there remains an interest in following trends in gender differences over time.
124
Time allocation and use There is also a strong theoretical and empirical basis for time as a contributor to achievement. PCAP is trying to find ways to enhance the ability to measure time allocations and time loss by omitting previous variables that have little variance (e.g.,lengthofschoolyear)andbyaskingsomemorespecificquestionsaboutengagement in school and in mathematics. These include time lost, time on subject areas, length of class periods, homework assignment and completion, out-of-school time relevant to learning, absenteeism, and exam times.
Special needs Asetofquestionsaddressedsomeoftheresearchandpolicyissuessurroundinghowtotreatstudentswithlearningdisabilitiesorotherdifficultiesthatmightinhibittheirprogressin school. The focus is on students with lower levels of achievement (i.e., level 1) and especiallythosewithidentifieddisabilitiesrequiringsomeformofspecialtreatmentintheschool but who are not exempted from the PCAP assessment by virtue of these disabilities. The broad policy context around this area is the strong movement in most jurisdictions toward inclusion of these students in regular classes. Questions have been formulated in the following areas: accommodations for disabilities, programming (modified programs), and class composition.
Assessment programs Many jurisdictions have responded to concerns about the performance of students and schools by implementing jurisdictional assessment programs. These take different forms and are of different degrees of maturity in different jurisdictions. Assuming that the underlying goal of this policy direction is to improve and not merely to describe achievement or entrench current levels, there is strong reason to examine assessment practices in the jurisdictions, and particularly the uses made of jurisdictional assessments.Theintenthereistoexpandthescopeofquestionsaboutassessment.Someareasforquestiondevelopmentare:assessmentpractices,teacherknowledgeof assessment principles, school and teacher use of external assessments, and student reaction to assessment, including attitudes to low-stake assessment, teaching to the test, strategies to prepare students for assessment, and existence and use of external (e.g., district, provincial) assessments.
Attitudes/MotivationsA number of items were included to permit use of attitudes and motivations as control variablesinresearchonteachingandlearningstrategies.Thesequestionsdealtwithattitudes toward school and mathematics as well as self-concept and interests.
125
Student learning strategies The study of student learning strategies is considered one of the core elements of PCAP.Thequestionsinthiskeyarealinkedtothemathematicsassessmentframeworkdealt with student cognitive and meta-cognitive strategies in mathematics, that is, the mathematics strategies that students use when confronting different tasks and at different levelsofdifficulty.
Teaching strategies Anothersmallsetofquestionsdealtwithteachingperceptionspurportingtocontributeto mathematics achievement. Additional information about teaching strategies was gathered by asking students about their attendance at school and about their teacher’s classroom practices (subject-specific).
PCAPquestionnaireswillattemptto“reachback,”thatis,tocapturethestudent’slonger-termclassroomexperience.Whilethiswilllikelybedifficulttodo,itcan,ifsuccessful,contribute to our understanding of students’ broader school experience and how this relates to achievement. Questions in this section include teacher perceptions of what contributes to mathematics achievement, student perceptions of their earlier school experienceswithmathematics,andschoolquestionsonoverallinstructionalphilosophyand approach to mathematics learning.
Opportunity to learnSince opportunity to learn has often been considered one of the better predictors ofachievement,asmallsetofquestionswerededicatedtothedeterminationofthestudent’s individual history of being taught mathematics and of parental activities related to opportunities to learn. One interesting feature of the PCAP 2010 Grade 8 assessment resultsisthatthelinkageofstudentperformancetothethreequestionnaireswillpermitdirect association of the output data (performance results) to the contextual elements for which information was gathered.

127
CoMPARisoN of ReAdiNg ResulTs: 2010 To 2007
An important feature of PCAP is to determine if the performance of students changes over time. This type of comparison presents significant challenges. Obviously, it is not feasible to repeat the same test on the same students over the three-year cycle. Because of the rotation of major/minor test focus, the tests themselves in reading are not identical in both assessments. The 2007 PCAP first involved large numbers of items in reading and the second 2010 PCAP involved just a selection of items common to both tests. Similarly, the mathematics test was a minor domain with a limited selection of items in PCAP 2007 and a major domain with a broader scope for assessment in PCAP 2010. Finally, for the comparison between 2007 and 2010, there was a shift in the population definition from an age basis (13-year-olds) to a grade basis (Grade 8).
Because of subtle but substantial changes in the mathematics and science assessment instruments, it was possible to make the comparison only for the reading results. In 2007, reading was the major subject. To facilitate the comparison, the 2010 reading test was constructed from a subset of the 2007 items. These items, referred to as “anchor items,” are used to link the 2007 and the 2010 reading tests. Also, because the results were scaled separately on the two assessments to a mean of 500 and a standard deviation of 100, it is not possible to directly compare the scaled scores of 2007 and 2010 without rescaling the scaled scores from one administration to the metric of the other.
scientific description of the actual process used to ensure a valid comparison
• Grade 8 students were selected from the 2007 sample for the comparison.• Itemparametersfortheanchoritemswereextractedfromthe2010readingtest.• Theseitemparameterswereappliedtothesameitemsinthe2007readingtestand
the whole of that test was recalibrated from these parameters.• MeanscoreswerecomputedfortheGrade8studentsinbothyears,usingthe
anchor items for 2010 and the full recalibrated test for 2007.• Thedifferencebetween2007and2010meanswascomputedfortheoverallpan-
Canadian results and the results by the following: jurisdiction, language, gender, jurisdiction by gender, and jurisdiction by language.
• Themeandifferenceswererescaledtothe2010reportingscale,withameanof500and a standard deviation of 100.
• Standarderrorandconfidenceintervalestimatesforthechangescoreswerecomputed by combining the jurisdictional standard error estimates from PCAP 2007 and PCAP 2010.
• Themeandifferenceswereaddedtoorsubtractedfromthe2010scorestocreatecomparisons based on the 2010 reported scores.
• Thecomparativeresultswerepresentedgraphically,witherrorbarsrepresentingthe confidence intervals, as in the other sections of this report.
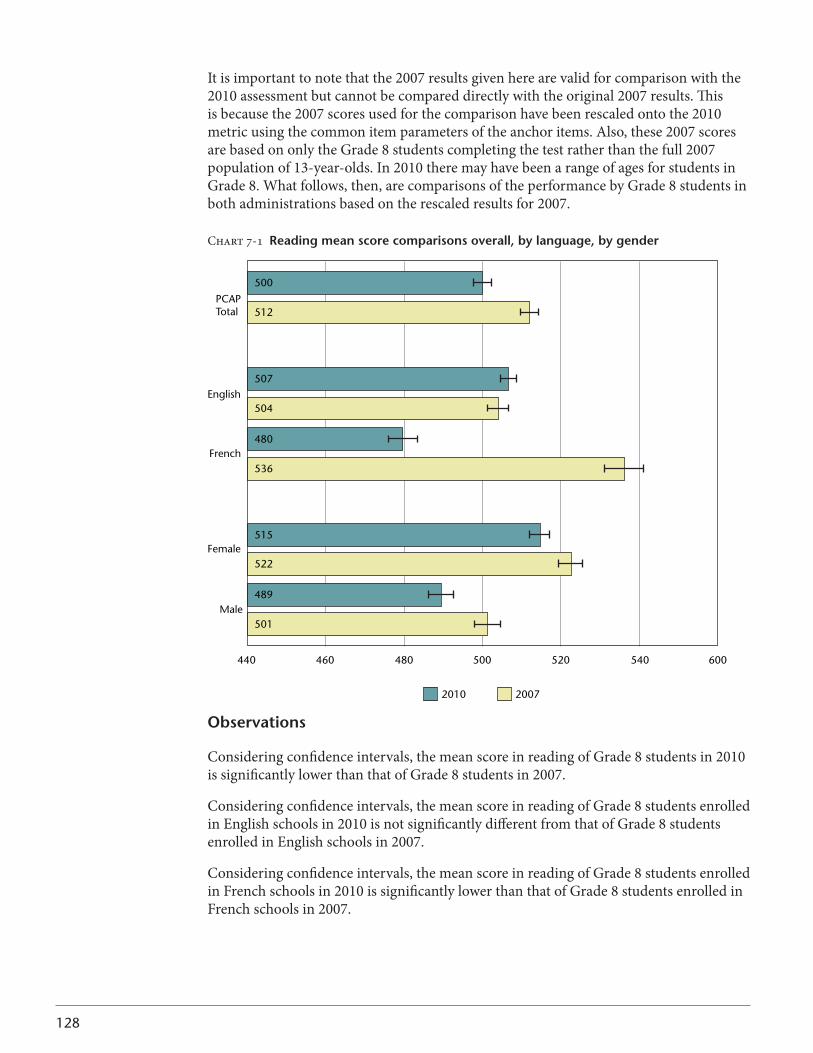
128
It is important to note that the 2007 results given here are valid for comparison with the 2010 assessment but cannot be compared directly with the original 2007 results. This is because the 2007 scores used for the comparison have been rescaled onto the 2010 metric using the common item parameters of the anchor items. Also, these 2007 scores are based on only the Grade 8 students completing the test rather than the full 2007 population of 13-year-olds. In 2010 there may have been a range of ages for students in Grade 8. What follows, then, are comparisons of the performance by Grade 8 students in both administrations based on the rescaled results for 2007.
Chart 7-1 Reading mean score comparisons overall, by language, by gender
500
512PCAPTotal
507
480
504
536
English
French
515
489
522
501
Female
Male
2010 2007
440 460 480 500 520 540 600
observations
Considering confidence intervals, the mean score in reading of Grade 8 students in 2010 is significantly lower than that of Grade 8 students in 2007.
Considering confidence intervals, the mean score in reading of Grade 8 students enrolled in English schools in 2010 is not significantly different from that of Grade 8 students enrolled in English schools in 2007.
Considering confidence intervals, the mean score in reading of Grade 8 students enrolled in French schools in 2010 is significantly lower than that of Grade 8 students enrolled in French schools in 2007.
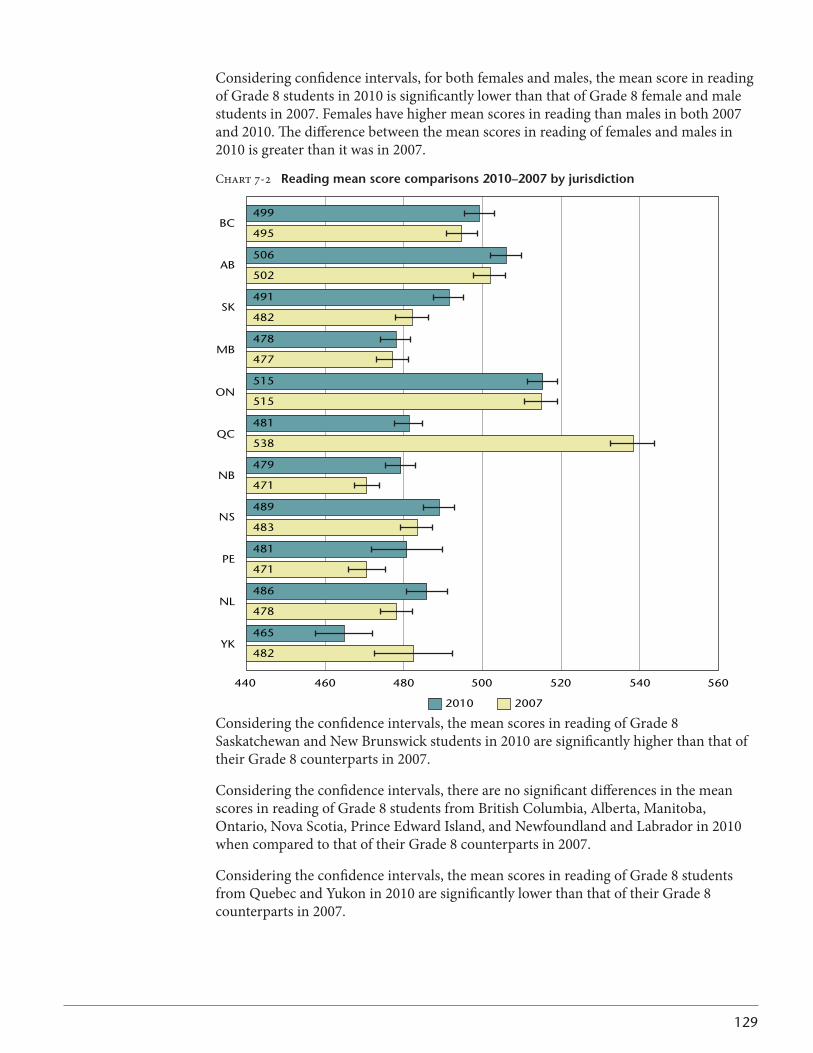
129
Considering confidence intervals, for both females and males, the mean score in reading of Grade 8 students in 2010 is significantly lower than that of Grade 8 female and male students in 2007. Females have higher mean scores in reading than males in both 2007 and 2010. The difference between the mean scores in reading of females and males in 2010 is greater than it was in 2007.
Chart 7-2 Reading mean score comparisons 2010–2007 by jurisdiction
499
506
491
478
515
481
479
489
481
486
465
495
502
482
477
515
538
471
483
471
478
482
BC
AB
SK
MB
ON
QC
NB
NS
PE
NL
YK
440 460 480 500 520 540 560
2010 2007
Considering the confidence intervals, the mean scores in reading of Grade 8 Saskatchewan and New Brunswick students in 2010 are significantly higher than that of their Grade 8 counterparts in 2007.
Considering the confidence intervals, there are no significant differences in the mean scores in reading of Grade 8 students from British Columbia, Alberta, Manitoba, Ontario, Nova Scotia, Prince Edward Island, and Newfoundland and Labrador in 2010 when compared to that of their Grade 8 counterparts in 2007.
Considering the confidence intervals, the mean scores in reading of Grade 8 students from Quebec and Yukon in 2010 are significantly lower than that of their Grade 8 counterparts in 2007.
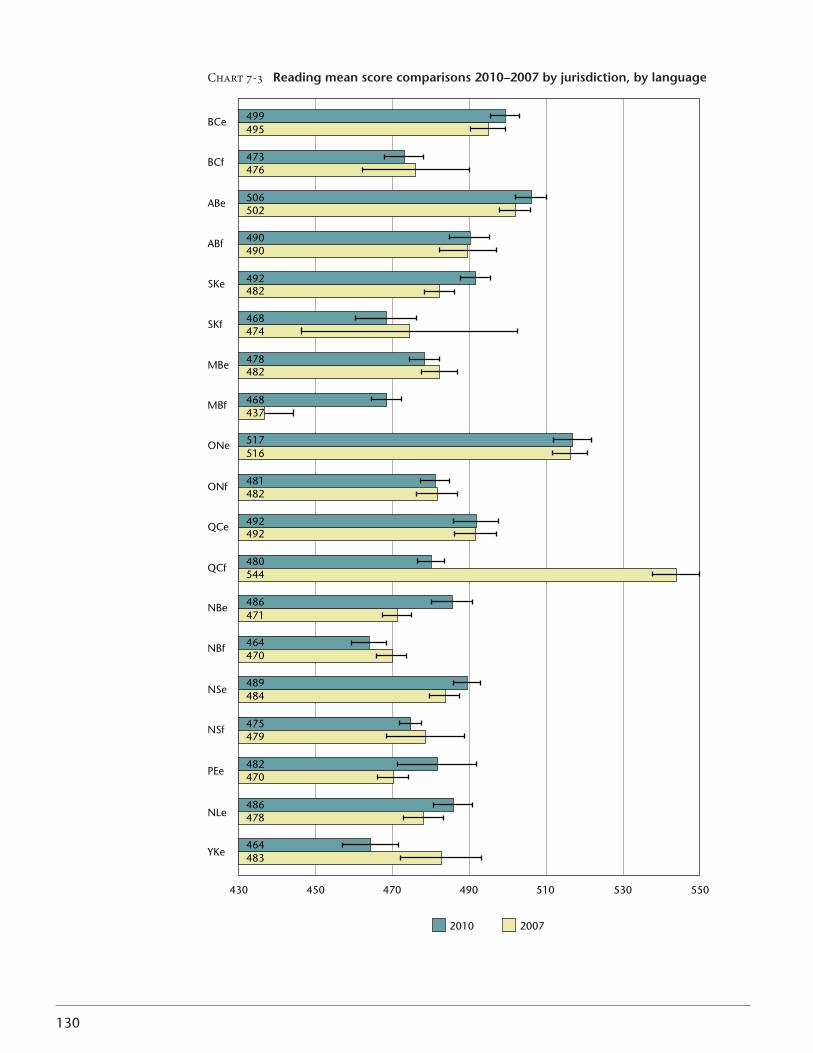
130
Chart 7-3 Reading mean score comparisons 2010–2007 by jurisdiction, by language
499495
473476
506502
490490
492482
468474
478482
468437
517516
481482
492492
480544
486471
464470
489484
475479
482470
486478
464483
BCe
BCf
ABe
ABf
SKe
SKf
MBe
MBf
ONe
ONf
QCe
QCf
NBe
NBf
NSe
NSf
PEe
NLe
YKe
2010 2007
430 450 470 490 510 530 550
131
Considering the confidence intervals, the mean score in reading of Grade 8 students in New Brunswick enrolled in English schools in 2010 is significantly higher than that of their Grade 8 counterparts in 2007. Considering the confidence intervals, the mean score in reading of students in Grade 8 in Yukon enrolled in English schools in 2010 is significantly lower than that of Grade 8 students enrolled in English schools in 2007.
Considering the confidence intervals, the mean score in reading of Grade 8 students in Manitoba enrolled in French schools in 2010 is significantly higher than that of Grade 8 students enrolled in French schools in 2007.
Considering the confidence intervals, there are no significant differences in the mean scores in reading of Grade 8 students in 2010, enrolled in either English or French schools, from British Columbia, Alberta, Saskatchewan, Ontario, and Nova Scotia when compared to that of their Grade 8 counterparts in 2007. As well, there are no significant differences in the mean scores in reading of Grade 8 students for Manitoba, Prince Edward Island, and Newfoundland and Labrador students enrolled in English schools, or for New Brunswick students enrolled in French schools.
Considering the confidence intervals, there are no significant differences in the mean score in reading of Grade 8 students in Quebec enrolled in English schools in 2010 when compared to that of their counterparts in 2007. Considering the confidence intervals, the mean score in reading of Grade 8 students in Quebec enrolled in French schools in 2010 is significantly lower than that of their Grade 8 counterparts in 2007.

133
CoNClusioNs
The Pan-Canadian Assessment Program is the most recent CMEC initiative to inform Canadians on how well their education systems may be meeting the needs of students and society. As well, the information gained from such an assessment gives ministers of education a basis for examining the curriculum and other aspects of their school system.
This report describes the performance of Grade 8 students in the second administration of PCAP, in which the major domain was mathematics and the secondary or minor domains were science and reading. The mathematics component encompasses more of the actual curricula of all Canadian jurisdictions, while the science component contains questionsonalimitednumberofassociatedsubdomains,andthereadingcomponentmaintains a focus on the same subdomains as in 2007, but with fewer items.
Participation in the testing process can be a demanding exercise. PCAP does not provide student results on an individual basis, which means that it can appear to be of noimmediateconsequencetothem.Therefore,itisatributetothestudentsandtheteachers who participated in the administration process that they so readily and clearly applied themselves to the tasks demanded of them.
Overview of results
Test design Based on a review of contemporary research and the curricula from all jurisdictions in each subject area for the grade level, the development process for the test included a bilingual framework-writing team, a bilingual item-development team, a validation process, and field testing, all under the constant review of and feedback from the jurisdictions and their particular subject experts. The data in this case indicate that the design and content of the instruments were sound, engaging students effectively. The instruments provided reliable and valid data on specific pan-Canadian curriculum-based objectives. The range of scenarios and item designs appears to have engaged students sufficientlytoallowthemtodemonstratetheirproficiencyinmathematics,science,andreading.
Performance In mathematics, the mean scores of Grade 8 students from Quebec and Ontario were above the Canadian mean score, while those of students from Alberta were at the Canadian mean score.
The majority of Canadian students performed academically in mathematics at or aboveGrade8-levelexpectations;forexample,inmathematics,foralljurisdictions,thepercentage range of achievement was 84 to 93 per cent at level 2 and above. In three of the jurisdictions, 92 per cent or more of the students demonstrated performance at or above the Canadian expectation for this group.
134
In science, the mean scores of Grade 8 Alberta and Ontario students were significantly higher than that of Canadian students overall. Students in British Columbia and Prince Edward Island obtained mean scores that were not statistically different from that of Canadian students overall.
In reading, the mean score of Grade 8 Ontario students was significantly higher than that obtained by Canadian students overall. Students in Alberta and British Columbia obtained mean scores that were not statistically different from that of Canadian students overall.
Performance by genderThere were no significant differences in the mean scores of males and females in mathematics overall. The percentage of female students achieving level 2 and above was the same as the proportion of male students performing at level 2 and above. The percentage of males achieving level 3 and above was higher than that of females. In other words, although there were just as many males as females performing at the appropriate Grade level in mathematics, there seemed to be more males who demonstrated a higher level of mathematics skills and knowledge than there were females at these higher levels.
The mean scores of female students in science and reading were significantly higher than the mean scores of male students.
Pan-Canadian results by subdomain in mathematicsThe test design of the mathematics component of the assessment focused on the specific mathematics subdomains of numbers and operations, geometry and measurement, patterns and relationships, and data management and probability. In numbers and operations, the mean score of Quebec students was significantly higher than those of Canadian students overall and those of other jurisdictions. Alberta and Ontario mean scores were not significantly different from the Canadian mean score. In geometry and measurement, the mean scores of Quebec and Ontario students were significantly higher than those of Canadian students overall and those of other jurisdictions. In patterns and relationships, the mean scores of Ontario students were significantly higher than those of Canadian students overall and those of other jurisdictions. The mean scores of students in Quebec and Alberta were not significantly different from the Canadian mean score. In data management and probability, the mean scores of Quebec students were significantly higher than those of Canadian students overall and those of other jurisdictions. The mean scores of students in Ontario and Alberta were not significantly different from the Canadian mean score.
Pan-Canadian results by process in mathematicsFor the first time, a pan-Canadian mathematics assessment is providing results for some oftheprocessesassociatedwithhowstudentsacquireandusemathematicsknowledge.Adefinedsetofitemswasusedtoquantifystudentperformancelinkedtosomeoftheseprocesses, including problem solving and communication. For problem solving, the mean scores of students from Quebec and Ontario were significantly higher than the Canadian mean score. In general, students who scored well on communication had higher mean scoresthanthosewhohadmoredifficultyexplainingtheirworkorreasoning.
135
Performance comparisons in reading over time
This second administration of PCAP allows for comparisons of results over time. In order to allow for comparison of performance of Grade 8 students from 2010 to 2007, results had to be extracted from the general 2007 results. Overall, Grade 8 students performed significantly lower in 2010 than in 2007. However, the mean score in reading of Grade 8 students enrolled in English schools in 2010 was not significantly different than that of their counterparts in 2007. The mean score in reading of Grade 8 students enrolled in French schools in 2010 was significantly lower than that of Grade 8 students enrolled in French schools in 2007.
Grade 8 students in Saskatchewan and New Brunswick had mean scores in reading in 2010 significantly higher than that of their counterparts in 2007. There were no significant differences in mean scores in reading of students in British Columbia, Alberta, Manitoba, Ontario, Nova Scotia, Prince Edward Island, and Newfoundland and Labrador in 2010 when compared to that of their Grade 8 counterparts in 2007.
In terms of language, there was no significant difference between the mean scores in reading in 2010 and those in 2007 for students enrolled in either French or English schools in British Columbia, Alberta, Saskatchewan, Ontario, and Nova Scotia. While the mean score in reading of New Brunswick Grade 8 students was significantly higher for students enrolled in English schools in 2010 than that of their counterparts enrolled in English schools in 2007, there was no significant difference in mean scores in reading of Quebec Grade 8 students enrolled in English schools in 2010 when compared with that of their counterparts enrolled in English schools in 2007. The mean score in reading of Grade 8 students in Yukon enrolled in English schools in 2010 was significantly lower than that of their counterparts enrolled in English schools in 2007.
In terms of gender, female students had overall higher mean scores in reading than males in both 2007 and 2010. The difference between females and males in 2010 was greater than it was in 2007.
Final statement
The results of this assessment suggest that Canadian jurisdictions are addressing the demands and practices in mathematics, and that the majority of students know and use their knowledge and skills in practical day-to-day activities.
ThePCAP2010resultsprovidebothaffirmationanddirectionforCanadianjurisdictionsand classrooms. While students appear to understand what is expected of them in mathematics and appear to practise the key aspects when completing mathematical tasks, there is room for improvement. As well, there are numerous students at level 1 for whom mathematics remains a challenging subject.
Overall,thePCAPtestingreaffirmsthatCMEC’slarge-scaleassessmentprojectsoffer innovative and contemporary direction on education policy, curriculum, and classroom practices.

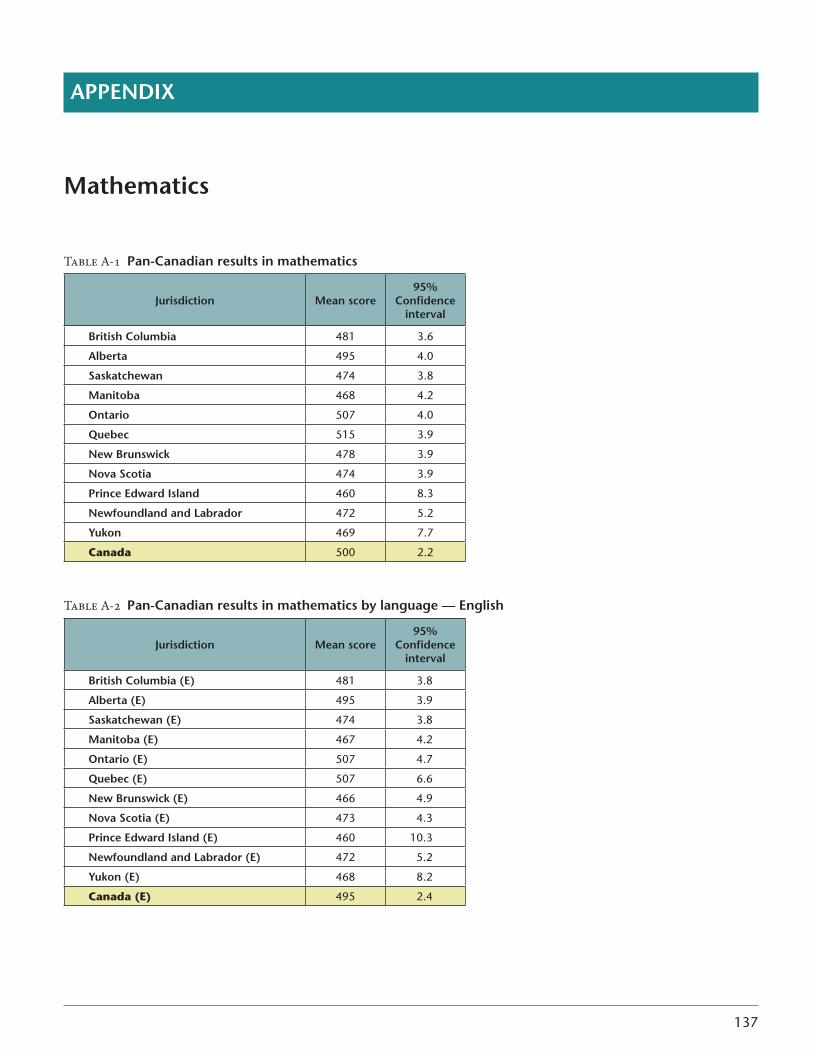
137
APPeNdix
Mathematics
Table A-1 Pan-Canadian results in mathematics
Jurisdiction Mean score95%
Confidence interval
british Columbia 481 3�6
Alberta 495 4�0
saskatchewan 474 3�8
Manitoba 468 4�2
ontario 507 4�0
Quebec 515 3�9
New brunswick 478 3�9
Nova scotia 474 3�9
Prince edward island 460 8�3
Newfoundland and labrador 472 5�2
Yukon 469 7�7
Canada 500 2�2
Table A-2 Pan-Canadian results in mathematics by language — english
Jurisdiction Mean score95%
Confidence interval
british Columbia (e) 481 3�8
Alberta (e) 495 3�9
saskatchewan (e) 474 3�8
Manitoba (e) 467 4�2
ontario (e) 507 4�7
Quebec (e) 507 6�6
New brunswick (e) 466 4�9
Nova scotia (e) 473 4�3
Prince edward island (e) 460 10�3
Newfoundland and labrador (e) 472 5�2
Yukon (e) 468 8�2
Canada (E) 495 2�4
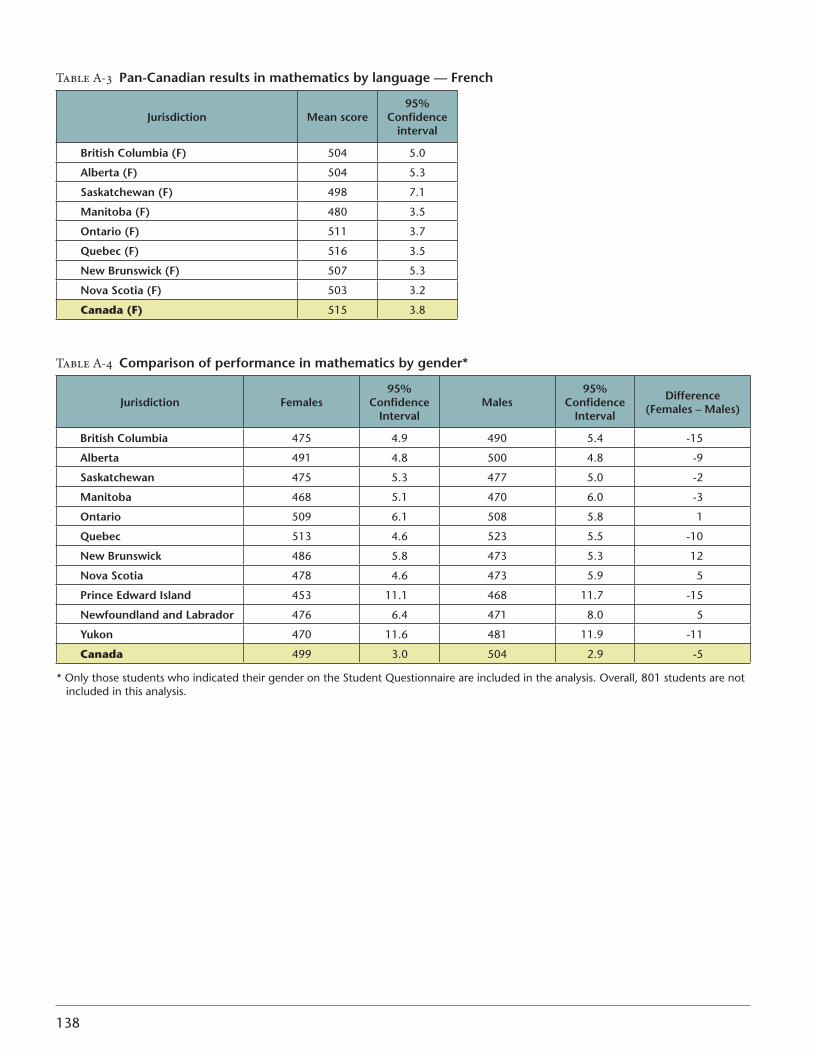
138
Table A-3 Pan-Canadian results in mathematics by language — french
Jurisdiction Mean score95%
Confidence interval
british Columbia (f) 504 5�0
Alberta (f) 504 5�3
saskatchewan (f) 498 7�1
Manitoba (f) 480 3�5
ontario (f) 511 3�7
Quebec (f) 516 3�5
New brunswick (f) 507 5�3
Nova scotia (f) 503 3�2
Canada (F) 515 3�8
Table A-4 Comparison of performance in mathematics by gender*
Jurisdiction females95%
Confidence interval
Males95%
Confidence interval
difference(females – Males)
british Columbia 475 4�9 490 5�4 -15
Alberta 491 4�8 500 4�8 -9
saskatchewan 475 5�3 477 5�0 -2
Manitoba 468 5�1 470 6�0 -3
ontario 509 6�1 508 5�8 1
Quebec 513 4�6 523 5�5 -10
New brunswick 486 5�8 473 5�3 12
Nova scotia 478 4�6 473 5�9 5
Prince edward island 453 11�1 468 11�7 -15
Newfoundland and labrador 476 6�4 471 8�0 5
Yukon 470 11�6 481 11�9 -11
Canada 499 3�0 504 2�9 -5
* Only those students who indicated their gender on the Student Questionnaire are included in the analysis� Overall, 801 students are not included in this analysis�
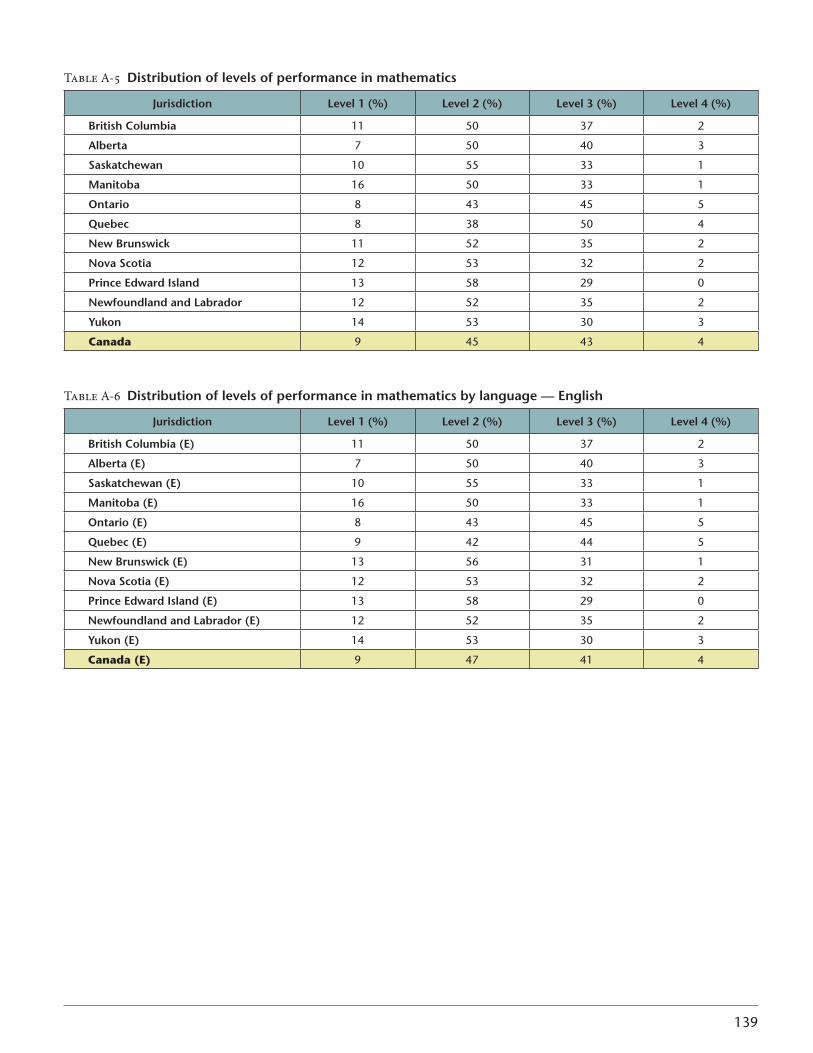
139
Table A-5 distribution of levels of performance in mathematics
Jurisdiction level 1 (%) level 2 (%) level 3 (%) level 4 (%)
british Columbia 11 50 37 2
Alberta 7 50 40 3
saskatchewan 10 55 33 1
Manitoba 16 50 33 1
ontario 8 43 45 5
Quebec 8 38 50 4
New brunswick 11 52 35 2
Nova scotia 12 53 32 2
Prince edward island 13 58 29 0
Newfoundland and labrador 12 52 35 2
Yukon 14 53 30 3
Canada 9 45 43 4
Table A-6 distribution of levels of performance in mathematics by language — english
Jurisdiction level 1 (%) level 2 (%) level 3 (%) level 4 (%)
british Columbia (e) 11 50 37 2
Alberta (e) 7 50 40 3
saskatchewan (e) 10 55 33 1
Manitoba (e) 16 50 33 1
ontario (e) 8 43 45 5
Quebec (e) 9 42 44 5
New brunswick (e) 13 56 31 1
Nova scotia (e) 12 53 32 2
Prince edward island (e) 13 58 29 0
Newfoundland and labrador (e) 12 52 35 2
Yukon (e) 14 53 30 3
Canada (E) 9 47 41 4
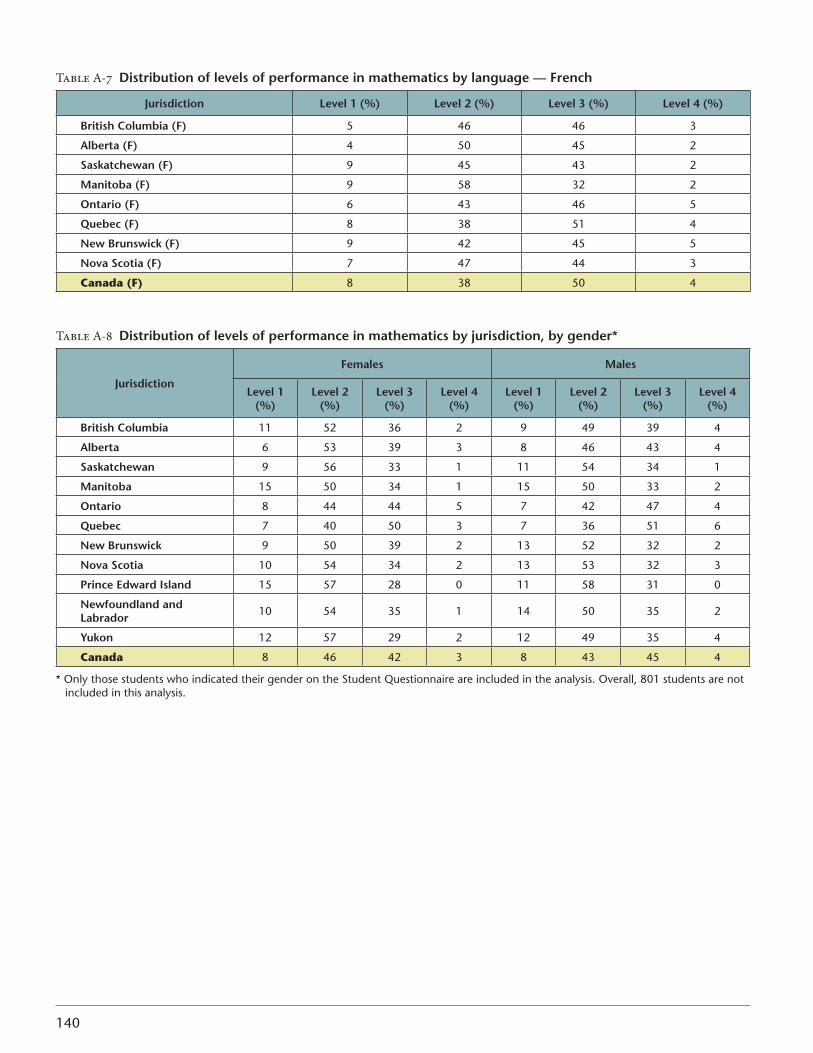
140
Table A-7 distribution of levels of performance in mathematics by language — french
Jurisdiction level 1 (%) level 2 (%) level 3 (%) level 4 (%)
british Columbia (f) 5 46 46 3
Alberta (f) 4 50 45 2
saskatchewan (f) 9 45 43 2
Manitoba (f) 9 58 32 2
ontario (f) 6 43 46 5
Quebec (f) 8 38 51 4
New brunswick (f) 9 42 45 5
Nova scotia (f) 7 47 44 3
Canada (F) 8 38 50 4
Table A-8 distribution of levels of performance in mathematics by jurisdiction, by gender*
Jurisdiction
females Males
level 1 (%)
level 2 (%)
level 3 (%)
level 4 (%)
level 1 (%)
level 2 (%)
level 3 (%)
level 4 (%)
british Columbia 11 52 36 2 9 49 39 4
Alberta 6 53 39 3 8 46 43 4
saskatchewan 9 56 33 1 11 54 34 1
Manitoba 15 50 34 1 15 50 33 2
ontario 8 44 44 5 7 42 47 4
Quebec 7 40 50 3 7 36 51 6
New brunswick 9 50 39 2 13 52 32 2
Nova scotia 10 54 34 2 13 53 32 3
Prince edward island 15 57 28 0 11 58 31 0
Newfoundland and labrador 10 54 35 1 14 50 35 2
Yukon 12 57 29 2 12 49 35 4
Canada 8 46 42 3 8 43 45 4
* Only those students who indicated their gender on the Student Questionnaire are included in the analysis� Overall, 801 students are not included in this analysis�
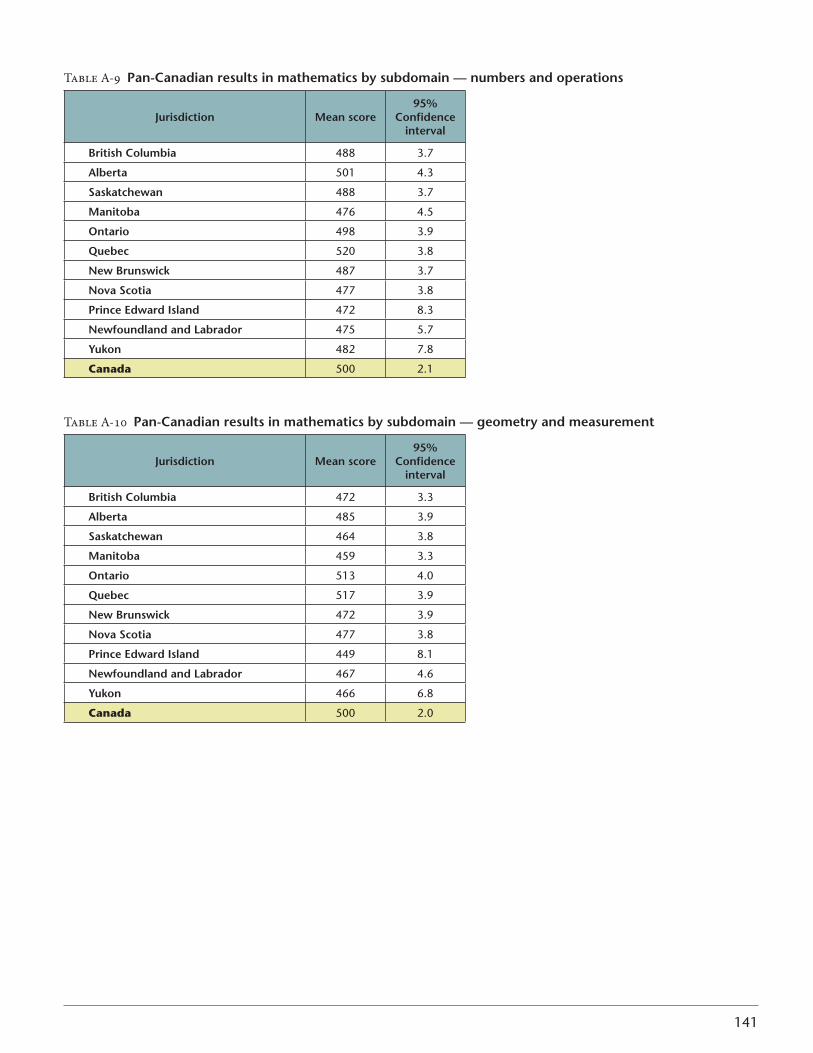
141
Table A-9 Pan-Canadian results in mathematics by subdomain — numbers and operations
Jurisdiction Mean score95%
Confidence interval
british Columbia 488 3�7
Alberta 501 4�3
saskatchewan 488 3�7
Manitoba 476 4�5
ontario 498 3�9
Quebec 520 3�8
New brunswick 487 3�7
Nova scotia 477 3�8
Prince edward island 472 8�3
Newfoundland and labrador 475 5�7
Yukon 482 7�8
Canada 500 2�1
Table A-10 Pan-Canadian results in mathematics by subdomain — geometry and measurement
Jurisdiction Mean score95%
Confidence interval
british Columbia 472 3�3
Alberta 485 3�9
saskatchewan 464 3�8
Manitoba 459 3�3
ontario 513 4�0
Quebec 517 3�9
New brunswick 472 3�9
Nova scotia 477 3�8
Prince edward island 449 8�1
Newfoundland and labrador 467 4�6
Yukon 466 6�8
Canada 500 2�0
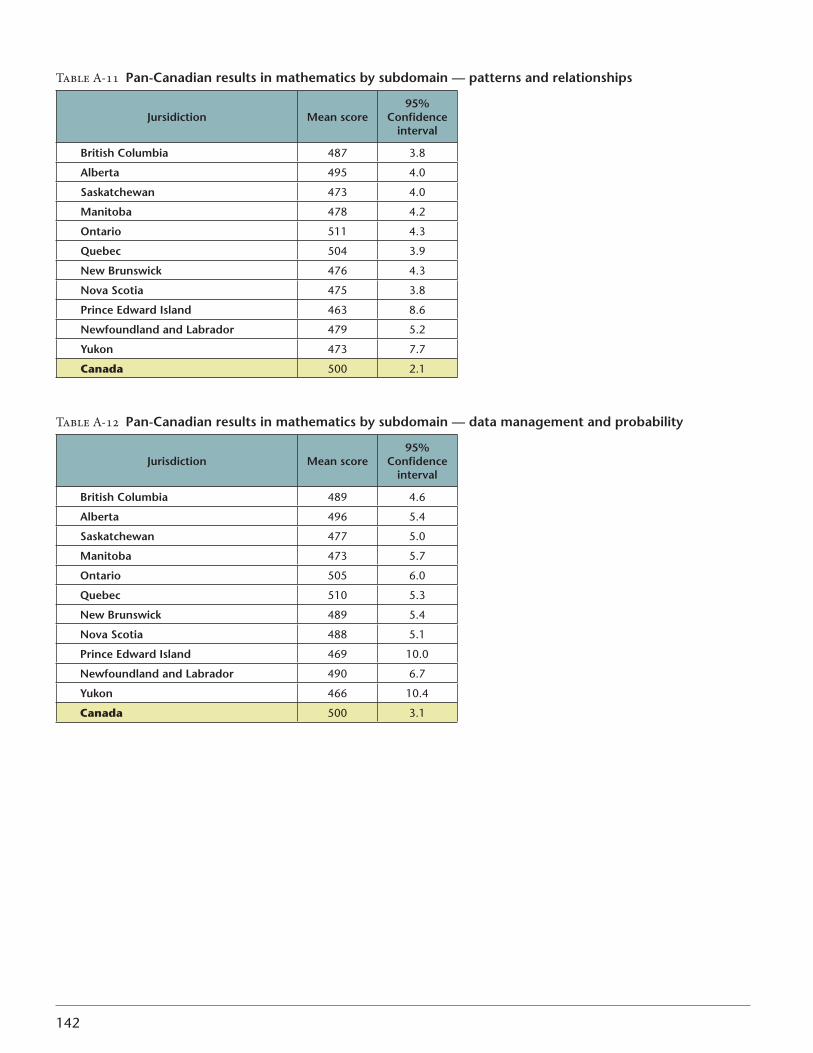
142
Table A-11 Pan-Canadian results in mathematics by subdomain — patterns and relationships
Jursidiction Mean score95%
Confidence interval
british Columbia 487 3�8
Alberta 495 4�0
saskatchewan 473 4�0
Manitoba 478 4�2
ontario 511 4�3
Quebec 504 3�9
New brunswick 476 4�3
Nova scotia 475 3�8
Prince edward island 463 8�6
Newfoundland and labrador 479 5�2
Yukon 473 7�7
Canada 500 2�1
Table A-12 Pan-Canadian results in mathematics by subdomain — data management and probability
Jurisdiction Mean score95%
Confidence interval
british Columbia 489 4�6
Alberta 496 5�4
saskatchewan 477 5�0
Manitoba 473 5�7
ontario 505 6�0
Quebec 510 5�3
New brunswick 489 5�4
Nova scotia 488 5�1
Prince edward island 469 10�0
Newfoundland and labrador 490 6�7
Yukon 466 10�4
Canada 500 3�1
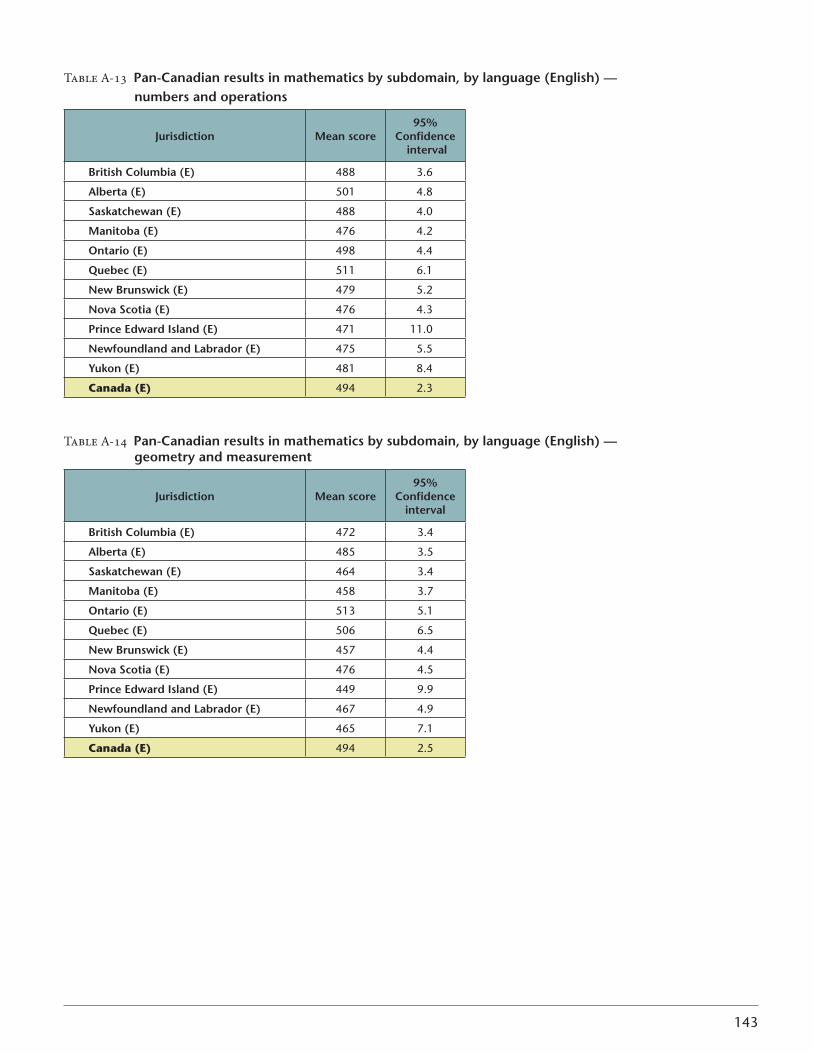
143
Table A-13 Pan-Canadian results in mathematics by subdomain, by language (english) — numbers and operations
Jurisdiction Mean score95%
Confidence interval
british Columbia (e) 488 3�6
Alberta (e) 501 4�8
saskatchewan (e) 488 4�0
Manitoba (e) 476 4�2
ontario (e) 498 4�4
Quebec (e) 511 6�1
New brunswick (e) 479 5�2
Nova scotia (e) 476 4�3
Prince edward island (e) 471 11�0
Newfoundland and labrador (e) 475 5�5
Yukon (e) 481 8�4
Canada (E) 494 2�3
Table A-14 Pan-Canadian results in mathematics by subdomain, by language (english) — geometry and measurement
Jurisdiction Mean score95%
Confidence interval
british Columbia (e) 472 3�4
Alberta (e) 485 3�5
saskatchewan (e) 464 3�4
Manitoba (e) 458 3�7
ontario (e) 513 5�1
Quebec (e) 506 6�5
New brunswick (e) 457 4�4
Nova scotia (e) 476 4�5
Prince edward island (e) 449 9�9
Newfoundland and labrador (e) 467 4�9
Yukon (e) 465 7�1
Canada (E) 494 2�5
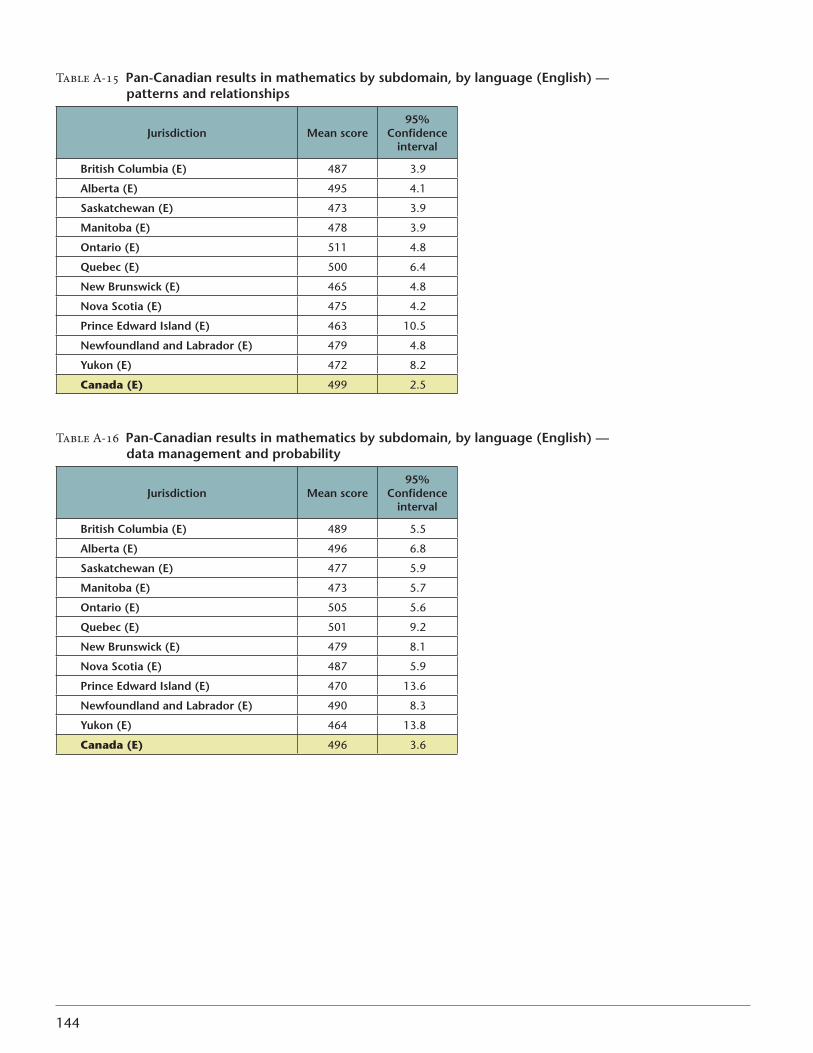
144
Table A-15 Pan-Canadian results in mathematics by subdomain, by language (english) — patterns and relationships
Jurisdiction Mean score95%
Confidence interval
british Columbia (e) 487 3�9
Alberta (e) 495 4�1
saskatchewan (e) 473 3�9
Manitoba (e) 478 3�9
ontario (e) 511 4�8
Quebec (e) 500 6�4
New brunswick (e) 465 4�8
Nova scotia (e) 475 4�2
Prince edward island (e) 463 10�5
Newfoundland and labrador (e) 479 4�8
Yukon (e) 472 8�2
Canada (E) 499 2�5
Table A-16 Pan-Canadian results in mathematics by subdomain, by language (english) — data management and probability
Jurisdiction Mean score95%
Confidence interval
british Columbia (e) 489 5�5
Alberta (e) 496 6�8
saskatchewan (e) 477 5�9
Manitoba (e) 473 5�7
ontario (e) 505 5�6
Quebec (e) 501 9�2
New brunswick (e) 479 8�1
Nova scotia (e) 487 5�9
Prince edward island (e) 470 13�6
Newfoundland and labrador (e) 490 8�3
Yukon (e) 464 13�8
Canada (E) 496 3�6
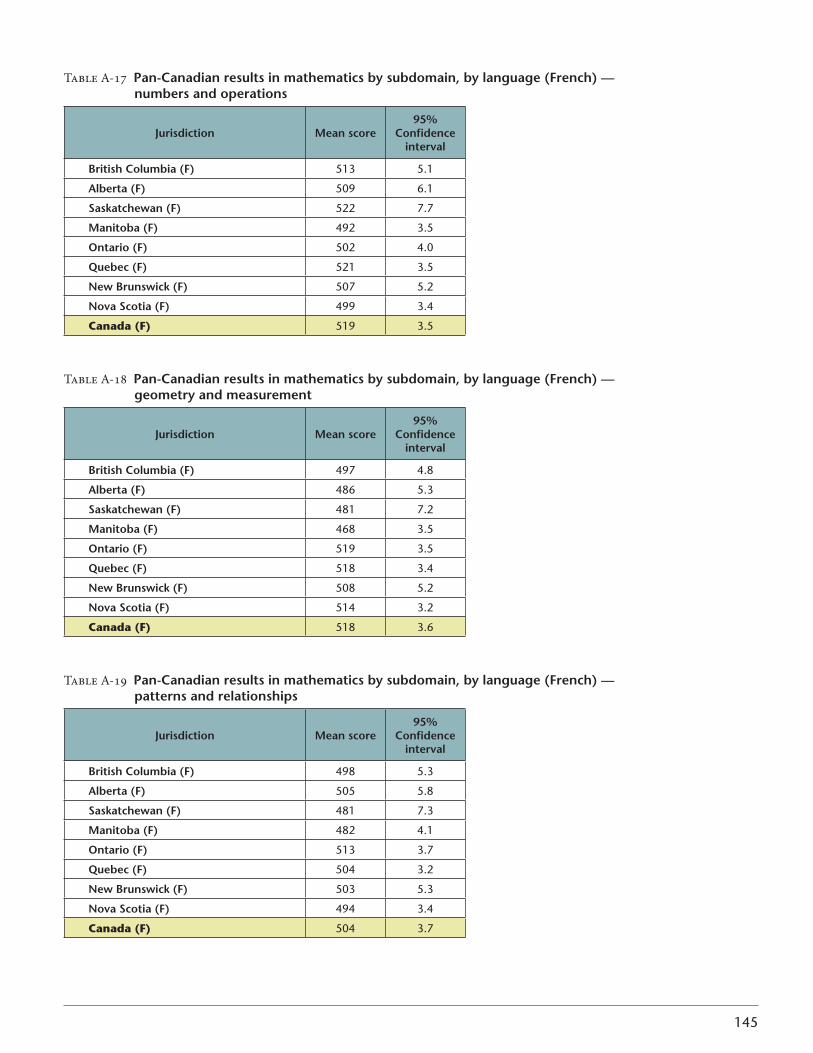
145
Table A-17 Pan-Canadian results in mathematics by subdomain, by language (french) — numbers and operations
Jurisdiction Mean score95%
Confidence interval
british Columbia (f) 513 5�1
Alberta (f) 509 6�1
saskatchewan (f) 522 7�7
Manitoba (f) 492 3�5
ontario (f) 502 4�0
Quebec (f) 521 3�5
New brunswick (f) 507 5�2
Nova scotia (f) 499 3�4
Canada (F) 519 3�5
Table A-18 Pan-Canadian results in mathematics by subdomain, by language (french) — geometry and measurement
Jurisdiction Mean score95%
Confidence interval
british Columbia (f) 497 4�8
Alberta (f) 486 5�3
saskatchewan (f) 481 7�2
Manitoba (f) 468 3�5
ontario (f) 519 3�5
Quebec (f) 518 3�4
New brunswick (f) 508 5�2
Nova scotia (f) 514 3�2
Canada (F) 518 3�6
Table A-19 Pan-Canadian results in mathematics by subdomain, by language (french) — patterns and relationships
Jurisdiction Mean score95%
Confidence interval
british Columbia (f) 498 5�3
Alberta (f) 505 5�8
saskatchewan (f) 481 7�3
Manitoba (f) 482 4�1
ontario (f) 513 3�7
Quebec (f) 504 3�2
New brunswick (f) 503 5�3
Nova scotia (f) 494 3�4
Canada (F) 504 3�7
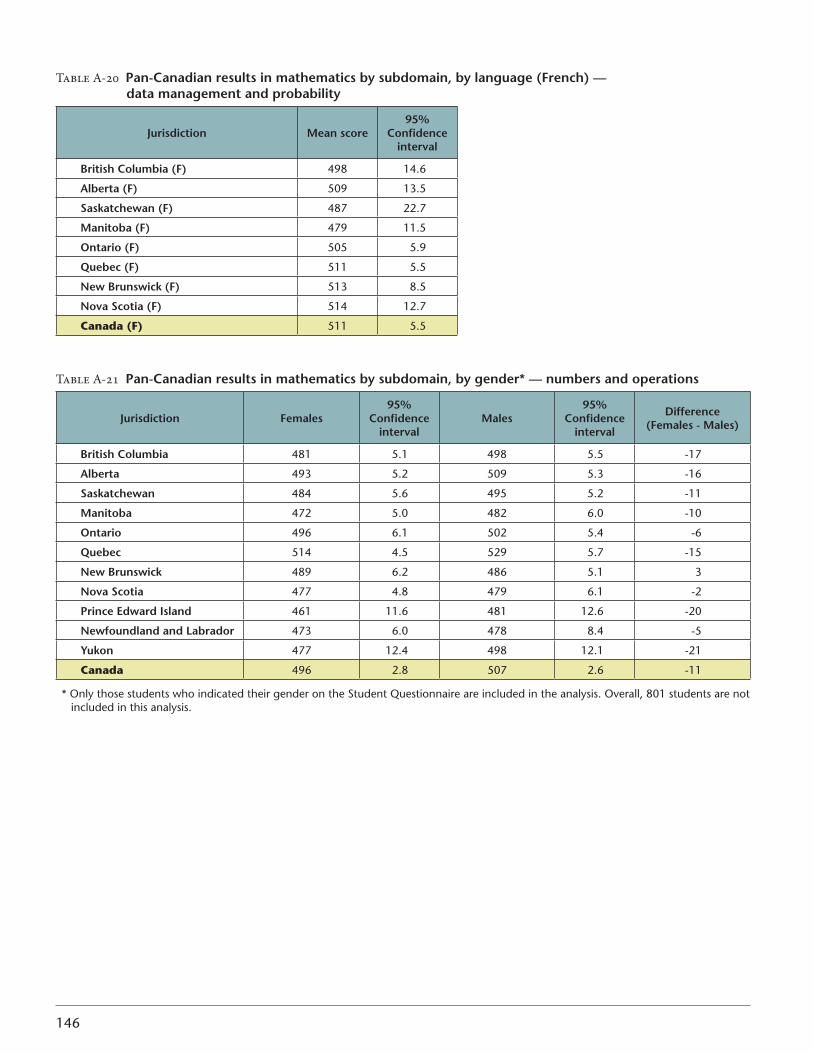
146
Table A-20 Pan-Canadian results in mathematics by subdomain, by language (french) — data management and probability
Jurisdiction Mean score95%
Confidence interval
british Columbia (f) 498 14�6
Alberta (f) 509 13�5
saskatchewan (f) 487 22�7
Manitoba (f) 479 11�5
ontario (f) 505 5�9
Quebec (f) 511 5�5
New brunswick (f) 513 8�5
Nova scotia (f) 514 12�7
Canada (F) 511 5�5
Table A-21 Pan-Canadian results in mathematics by subdomain, by gender* — numbers and operations
Jurisdiction females95%
Confidence interval
Males95%
Confidence interval
difference (females - Males)
british Columbia 481 5�1 498 5�5 -17
Alberta 493 5�2 509 5�3 -16
saskatchewan 484 5�6 495 5�2 -11
Manitoba 472 5�0 482 6�0 -10
ontario 496 6�1 502 5�4 -6
Quebec 514 4�5 529 5�7 -15
New brunswick 489 6�2 486 5�1 3
Nova scotia 477 4�8 479 6�1 -2
Prince edward island 461 11�6 481 12�6 -20
Newfoundland and labrador 473 6�0 478 8�4 -5
Yukon 477 12�4 498 12�1 -21
Canada 496 2�8 507 2�6 -11
* Only those students who indicated their gender on the Student Questionnaire are included in the analysis� Overall, 801 students are not included in this analysis�
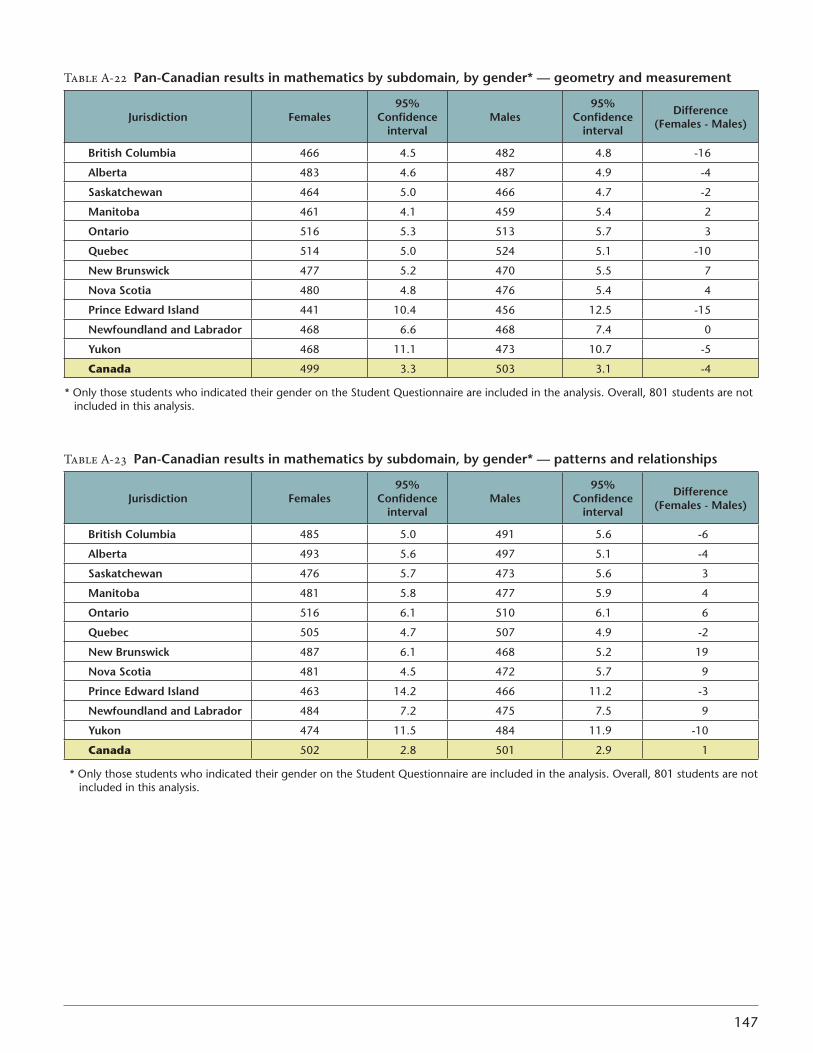
147
Table A-22 Pan-Canadian results in mathematics by subdomain, by gender* — geometry and measurement
Jurisdiction females95%
Confidence interval
Males95%
Confidence interval
difference (females - Males)
british Columbia 466 4�5 482 4�8 -16
Alberta 483 4�6 487 4�9 -4
saskatchewan 464 5�0 466 4�7 -2
Manitoba 461 4�1 459 5�4 2
ontario 516 5�3 513 5�7 3
Quebec 514 5�0 524 5�1 -10
New brunswick 477 5�2 470 5�5 7
Nova scotia 480 4�8 476 5�4 4
Prince edward island 441 10�4 456 12�5 -15
Newfoundland and labrador 468 6�6 468 7�4 0
Yukon 468 11�1 473 10�7 -5
Canada 499 3�3 503 3�1 -4
* Only those students who indicated their gender on the Student Questionnaire are included in the analysis� Overall, 801 students are not included in this analysis�
Table A-23 Pan-Canadian results in mathematics by subdomain, by gender* — patterns and relationships
Jurisdiction females95%
Confidence interval
Males95%
Confidence interval
difference (females - Males)
british Columbia 485 5�0 491 5�6 -6
Alberta 493 5�6 497 5�1 -4
saskatchewan 476 5�7 473 5�6 3
Manitoba 481 5�8 477 5�9 4
ontario 516 6�1 510 6�1 6
Quebec 505 4�7 507 4�9 -2
New brunswick 487 6�1 468 5�2 19
Nova scotia 481 4�5 472 5�7 9
Prince edward island 463 14�2 466 11�2 -3
Newfoundland and labrador 484 7�2 475 7�5 9
Yukon 474 11�5 484 11�9 -10
Canada 502 2�8 501 2�9 1
* Only those students who indicated their gender on the Student Questionnaire are included in the analysis� Overall, 801 students are not included in this analysis�
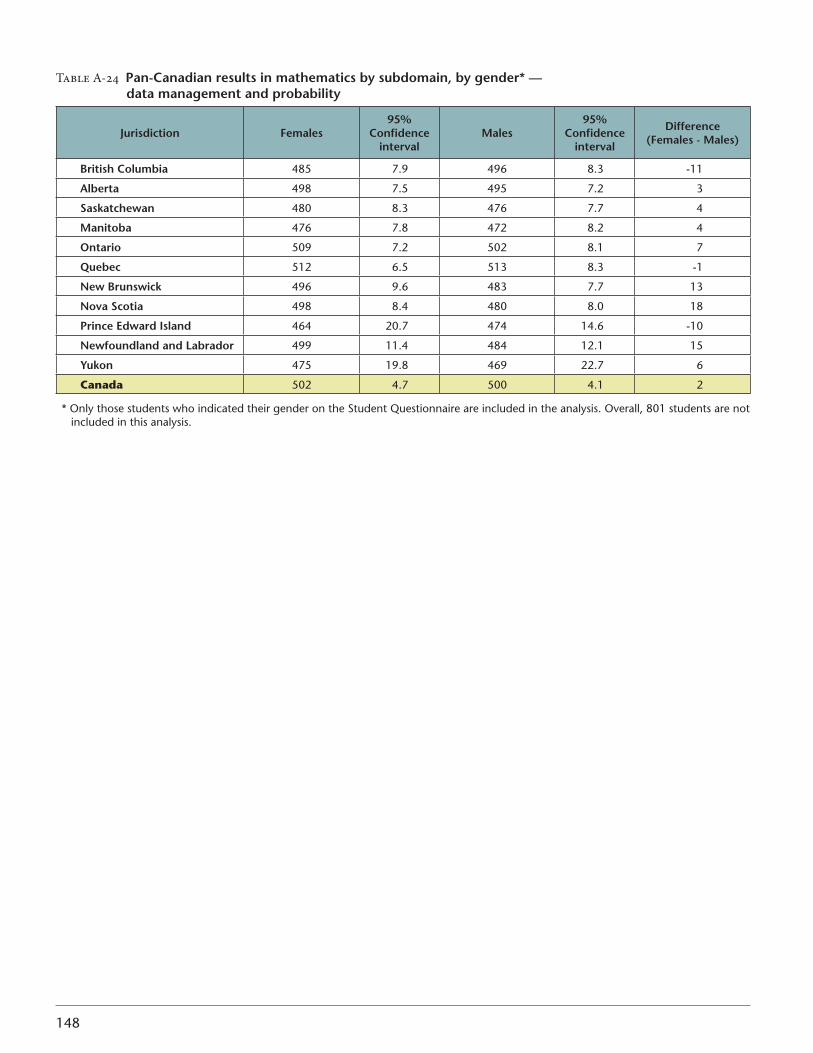
148
Table A-24 Pan-Canadian results in mathematics by subdomain, by gender* — data management and probability
Jurisdiction females95%
Confidence interval
Males95%
Confidence interval
difference (females - Males)
british Columbia 485 7�9 496 8�3 -11
Alberta 498 7�5 495 7�2 3
saskatchewan 480 8�3 476 7�7 4
Manitoba 476 7�8 472 8�2 4
ontario 509 7�2 502 8�1 7
Quebec 512 6�5 513 8�3 -1
New brunswick 496 9�6 483 7�7 13
Nova scotia 498 8�4 480 8�0 18
Prince edward island 464 20�7 474 14�6 -10
Newfoundland and labrador 499 11�4 484 12�1 15
Yukon 475 19�8 469 22�7 6
Canada 502 4�7 500 4�1 2
* Only those students who indicated their gender on the Student Questionnaire are included in the analysis� Overall, 801 students are not included in this analysis�

149
science
Table A-25 Pan-Canadian results in science by jurisdiction
Jurisdiction Mean score95%
Confidence interval
british Columbia 497 3�4
Alberta 515 3�7
saskatchewan 488 4�2
Manitoba 486 3�9
ontario 510 4�1
Quebec 486 3�8
New brunswick 487 3�9
Nova scotia 489 4�0
Prince edward island 493 10�2
Newfoundland and labrador 487 5�8
Yukon 478 7�8
Canada 500 2�0
Table A-26 Pan-Canadian results in science by jurisdiction, by language — english
Jurisdiction Mean score95%
Confidence interval
british Columbia (e) 497 3�7
Alberta (e) 515 3�3
saskatchewan (e) 488 3�8
Manitoba (e) 486 4�5
ontario (e) 510 4�4
Quebec (e) 490 6�2
New brunswick (e) 489 4�7
Nova scotia (e) 489 4�1
Prince edward island (e) 493 10�9
Newfoundland and labrador (e) 487 6�0
Yukon (e) 478 9�0
Canada (E) 504 2�5
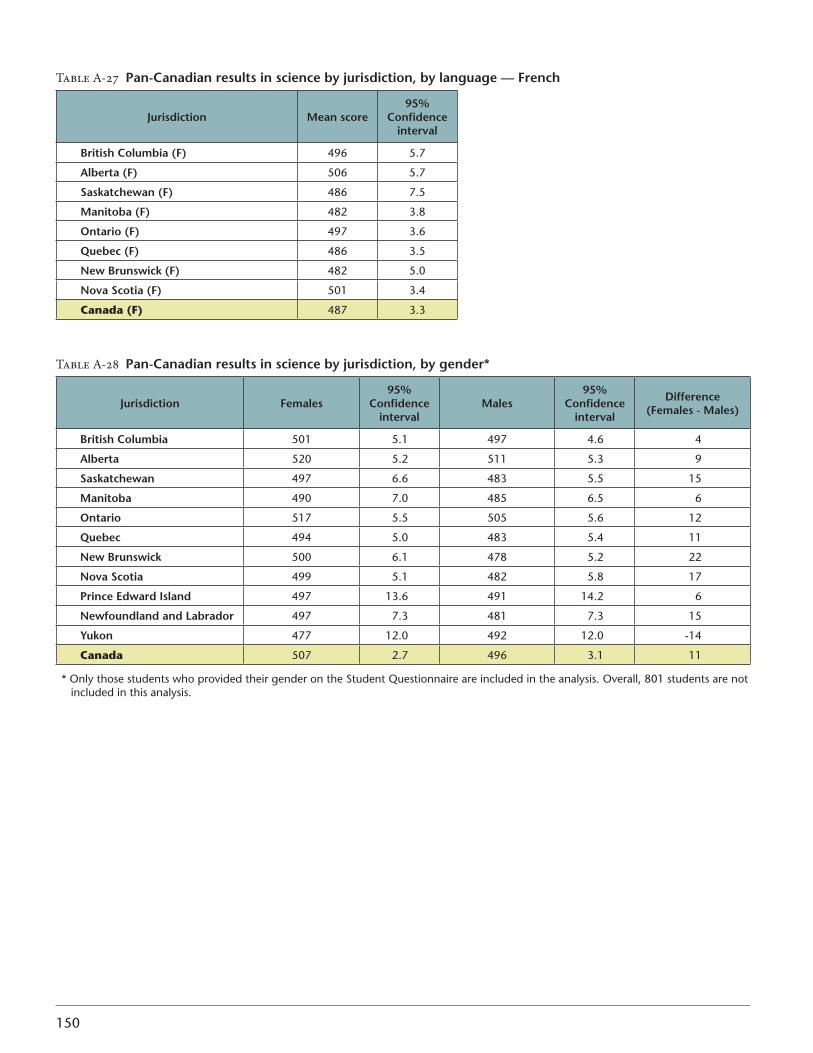
150
Table A-27 Pan-Canadian results in science by jurisdiction, by language — french
Jurisdiction Mean score95%
Confidence interval
british Columbia (f) 496 5�7
Alberta (f) 506 5�7
saskatchewan (f) 486 7�5
Manitoba (f) 482 3�8
ontario (f) 497 3�6
Quebec (f) 486 3�5
New brunswick (f) 482 5�0
Nova scotia (f) 501 3�4
Canada (F) 487 3�3
Table A-28 Pan-Canadian results in science by jurisdiction, by gender*
Jurisdiction females95%
Confidence interval
Males95%
Confidence interval
difference (females - Males)
british Columbia 501 5�1 497 4�6 4
Alberta 520 5�2 511 5�3 9
saskatchewan 497 6�6 483 5�5 15
Manitoba 490 7�0 485 6�5 6
ontario 517 5�5 505 5�6 12
Quebec 494 5�0 483 5�4 11
New brunswick 500 6�1 478 5�2 22
Nova scotia 499 5�1 482 5�8 17
Prince edward island 497 13�6 491 14�2 6
Newfoundland and labrador 497 7�3 481 7�3 15
Yukon 477 12�0 492 12�0 -14
Canada 507 2�7 496 3�1 11
* Only those students who provided their gender on the Student Questionnaire are included in the analysis� Overall, 801 students are not included in this analysis�
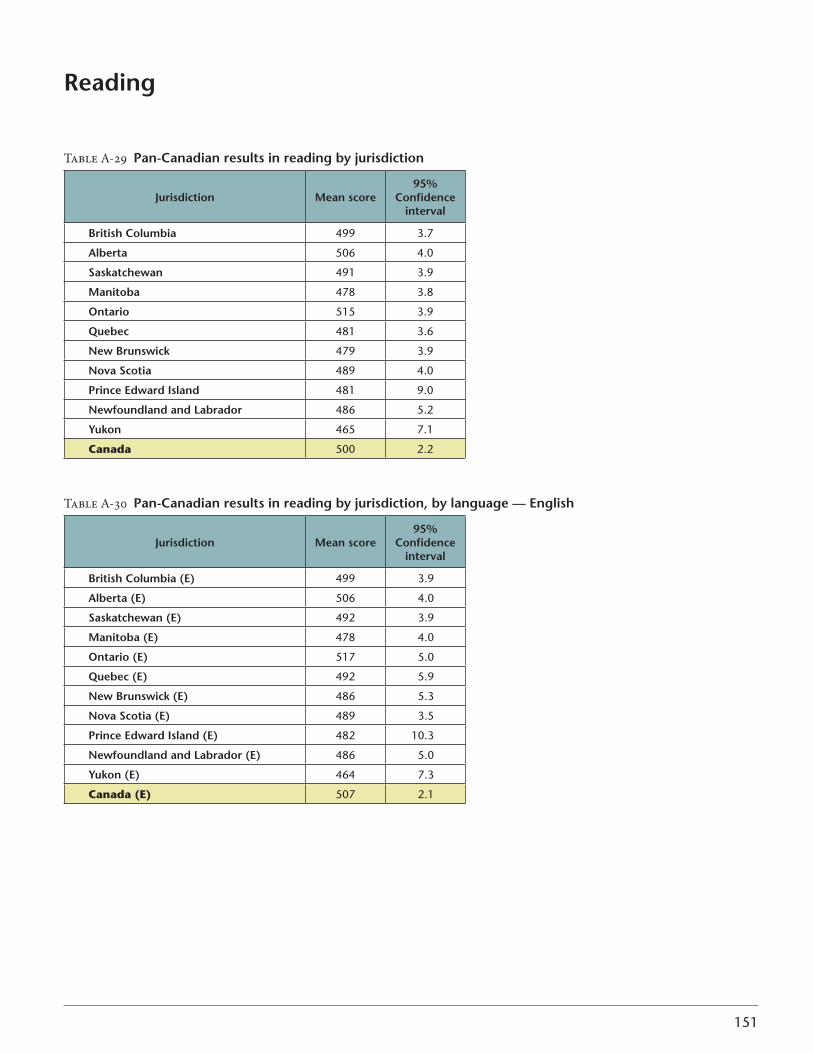
151
Reading
Table A-29 Pan-Canadian results in reading by jurisdiction
Jurisdiction Mean score95%
Confidence interval
british Columbia 499 3�7
Alberta 506 4�0
saskatchewan 491 3�9
Manitoba 478 3�8
ontario 515 3�9
Quebec 481 3�6
New brunswick 479 3�9
Nova scotia 489 4�0
Prince edward island 481 9�0
Newfoundland and labrador 486 5�2
Yukon 465 7�1
Canada 500 2�2
Table A-30 Pan-Canadian results in reading by jurisdiction, by language — english
Jurisdiction Mean score95%
Confidence interval
british Columbia (e) 499 3�9
Alberta (e) 506 4�0
saskatchewan (e) 492 3�9
Manitoba (e) 478 4�0
ontario (e) 517 5�0
Quebec (e) 492 5�9
New brunswick (e) 486 5�3
Nova scotia (e) 489 3�5
Prince edward island (e) 482 10�3
Newfoundland and labrador (e) 486 5�0
Yukon (e) 464 7�3
Canada (E) 507 2�1

152
Table A-31 Pan-Canadian results in reading by jurisdiction, by language — french
Jurisdiction Mean score95%
Confidence interval
british Columbia (f) 473 5�1
Alberta (f) 490 5�2
saskatchewan (f) 468 8�0
Manitoba (f) 468 4�0
ontario (f) 481 3�7
Quebec (f) 480 3�6
New brunswick (f) 464 4�5
Nova scotia (f) 475 2�9
Canada (F) 480 3�6
Table A-32 Pan-Canadian results in reading by jurisdiction, by gender*
Jurisdiction females95%
Confidence interval
Males95%
Confidence interval
difference (females - Males)
british Columbia 511 5�7 491 5�4 20
Alberta 516 5�4 497 4�5 19
saskatchewan 504 5�9 482 5�1 22
Manitoba 494 5�5 466 5�9 28
ontario 530 6�1 503 5�6 27
Quebec 498 4�5 471 5�4 27
New brunswick 501 4�9 462 5�9 39
Nova scotia 501 5�0 480 5�8 21
Prince edward island 491 13�5 474 13�6 17
Newfoundland and labrador 506 7�4 468 7�3 38
Yukon 474 11�9 467 10�8 7
Canada 515 2�6 489 3�3 26
* Only those students who provided their gender on the Student Questionnaire are included in the analysis� Overall, 801 students are not included in this analysis�
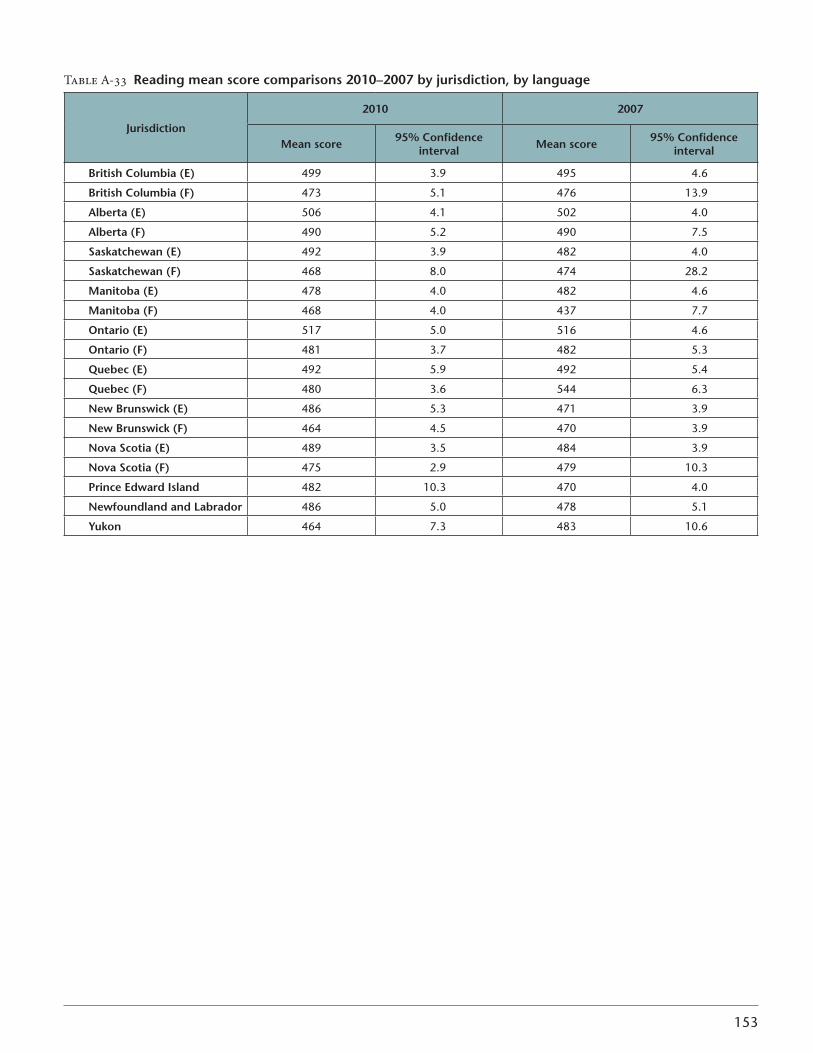
153
Table A-33 Reading mean score comparisons 2010–2007 by jurisdiction, by language
Jurisdiction
2010 2007
Mean score 95% Confidence interval Mean score 95% Confidence
interval
british Columbia (e) 499 3�9 495 4�6
british Columbia (f) 473 5�1 476 13�9
Alberta (e) 506 4�1 502 4�0
Alberta (f) 490 5�2 490 7�5
saskatchewan (e) 492 3�9 482 4�0
saskatchewan (f) 468 8�0 474 28�2
Manitoba (e) 478 4�0 482 4�6
Manitoba (f) 468 4�0 437 7�7
ontario (e) 517 5�0 516 4�6
ontario (f) 481 3�7 482 5�3
Quebec (e) 492 5�9 492 5�4
Quebec (f) 480 3�6 544 6�3
New brunswick (e) 486 5�3 471 3�9
New brunswick (f) 464 4�5 470 3�9
Nova scotia (e) 489 3�5 484 3�9
Nova scotia (f) 475 2�9 479 10�3
Prince edward island 482 10�3 470 4�0
Newfoundland and labrador 486 5�0 478 5�1
Yukon 464 7�3 483 10�6
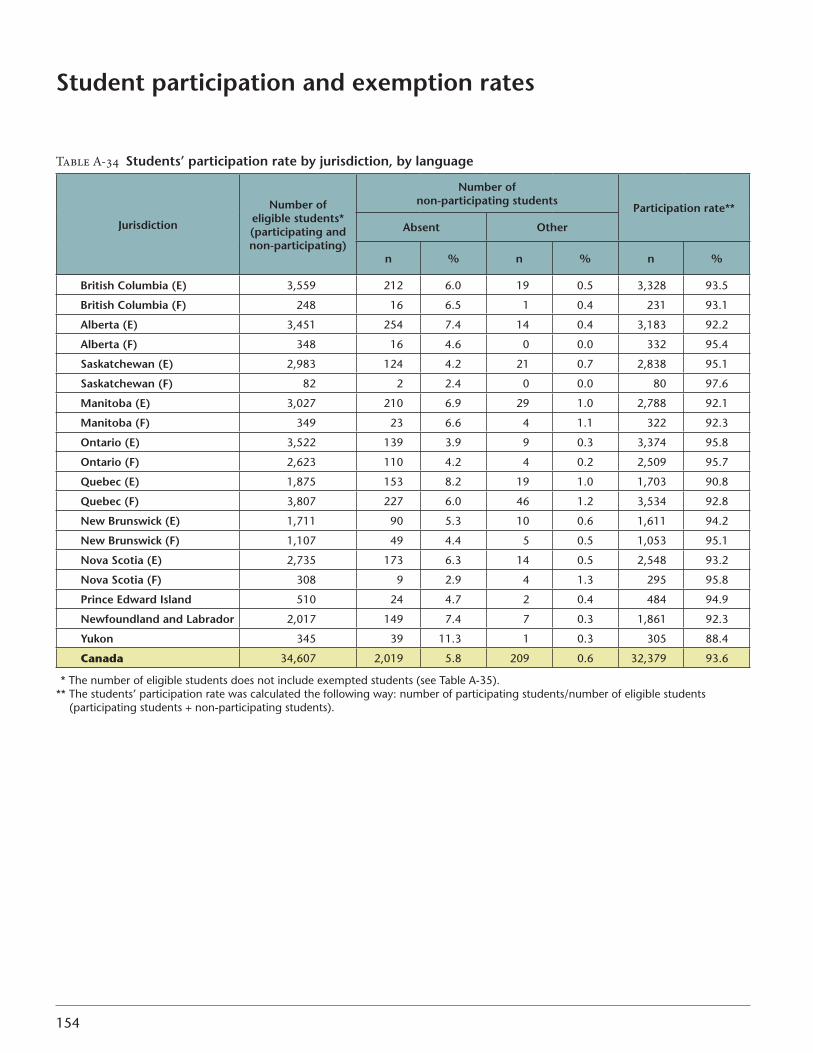
154
student participation and exemption rates
Table A-34 students’ participation rate by jurisdiction, by language
Jurisdiction
Number of eligible students* (participating and non-participating)
Number of non-participating students
Participation rate**
Absent other
n % n % n %
british Columbia (e) 3,559 212 6�0 19 0�5 3,328 93�5
british Columbia (f) 248 16 6�5 1 0�4 231 93�1
Alberta (e) 3,451 254 7�4 14 0�4 3,183 92�2
Alberta (f) 348 16 4�6 0 0�0 332 95�4
saskatchewan (e) 2,983 124 4�2 21 0�7 2,838 95�1
saskatchewan (f) 82 2 2�4 0 0�0 80 97�6
Manitoba (e) 3,027 210 6�9 29 1�0 2,788 92�1
Manitoba (f) 349 23 6�6 4 1�1 322 92�3
ontario (e) 3,522 139 3�9 9 0�3 3,374 95�8
ontario (f) 2,623 110 4�2 4 0�2 2,509 95�7
Quebec (e) 1,875 153 8�2 19 1�0 1,703 90�8
Quebec (f) 3,807 227 6�0 46 1�2 3,534 92�8
New brunswick (e) 1,711 90 5�3 10 0�6 1,611 94�2
New brunswick (f) 1,107 49 4�4 5 0�5 1,053 95�1
Nova scotia (e) 2,735 173 6�3 14 0�5 2,548 93�2
Nova scotia (f) 308 9 2�9 4 1�3 295 95�8
Prince edward island 510 24 4�7 2 0�4 484 94�9
Newfoundland and labrador 2,017 149 7�4 7 0�3 1,861 92�3
Yukon 345 39 11�3 1 0�3 305 88�4
Canada 34,607 2,019 5�8 209 0�6 32,379 93�6
* The number of eligible students does not include exempted students (see Table A-35)�** The students’ participation rate was calculated the following way: number of participating students/number of eligible students
(participating students + non-participating students)�
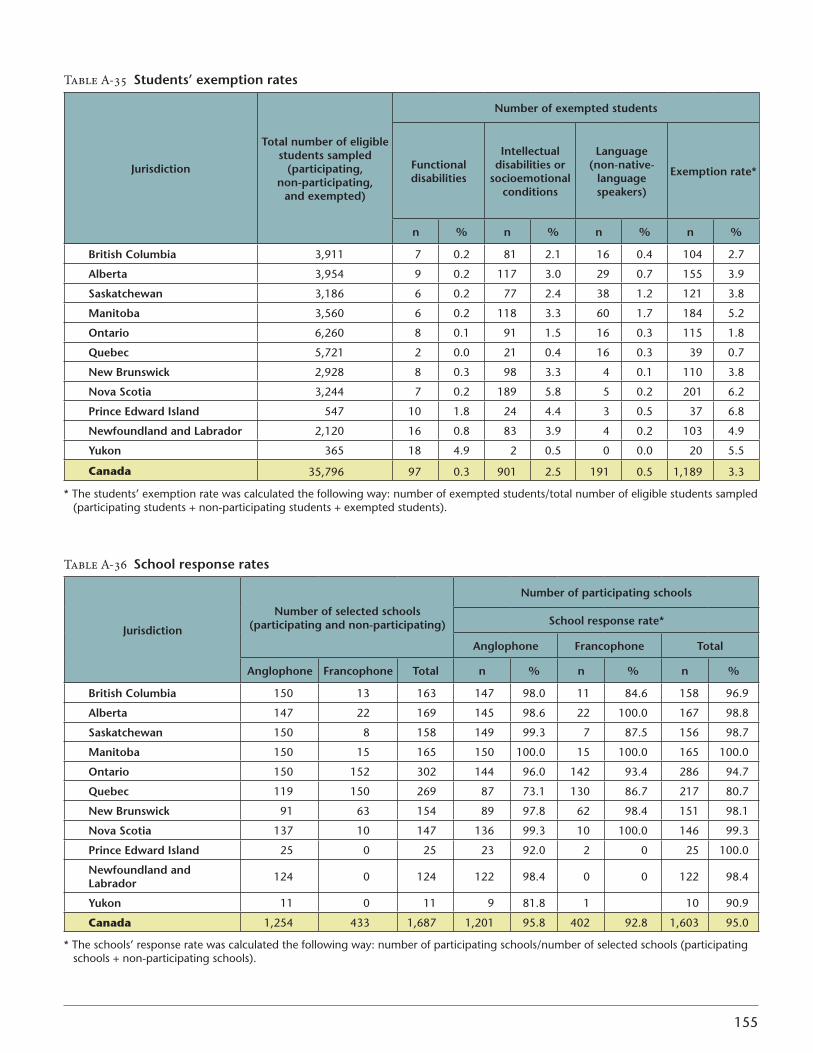
155
Table A-35 students’ exemption rates
Jurisdiction
Total number of eligible students sampled
(participating, non-participating,
and exempted)
Number of exempted students
functional disabilities
intellectual disabilities or
socioemotional conditions
language (non-native-
language speakers)
exemption rate*
n % n % n % n %
british Columbia 3,911 7 0�2 81 2�1 16 0�4 104 2�7
Alberta 3,954 9 0�2 117 3�0 29 0�7 155 3�9
saskatchewan 3,186 6 0�2 77 2�4 38 1�2 121 3�8
Manitoba 3,560 6 0�2 118 3�3 60 1�7 184 5�2
ontario 6,260 8 0�1 91 1�5 16 0�3 115 1�8
Quebec 5,721 2 0�0 21 0�4 16 0�3 39 0�7
New brunswick 2,928 8 0�3 98 3�3 4 0�1 110 3�8
Nova scotia 3,244 7 0�2 189 5�8 5 0�2 201 6�2
Prince edward island 547 10 1�8 24 4�4 3 0�5 37 6�8
Newfoundland and labrador 2,120 16 0�8 83 3�9 4 0�2 103 4�9
Yukon 365 18 4�9 2 0�5 0 0�0 20 5�5
Canada 35,796 97 0�3 901 2�5 191 0�5 1,189 3�3
* The students’ exemption rate was calculated the following way: number of exempted students/total number of eligible students sampled (participating students + non-participating students + exempted students)�
Table A-36 school response rates
Jurisdiction
Number of selected schools (participating and non-participating)
Number of participating schools
school response rate*
Anglophone francophone Total
Anglophone francophone Total n % n % n %
british Columbia 150 13 163 147 98�0 11 84�6 158 96�9
Alberta 147 22 169 145 98�6 22 100�0 167 98�8
saskatchewan 150 8 158 149 99�3 7 87�5 156 98�7
Manitoba 150 15 165 150 100�0 15 100�0 165 100�0
ontario 150 152 302 144 96�0 142 93�4 286 94�7
Quebec 119 150 269 87 73�1 130 86�7 217 80�7
New brunswick 91 63 154 89 97�8 62 98�4 151 98�1
Nova scotia 137 10 147 136 99�3 10 100�0 146 99�3
Prince edward island 25 0 25 23 92�0 2 0 25 100�0
Newfoundland and labrador 124 0 124 122 98�4 0 0 122 98�4
Yukon 11 0 11 9 81�8 1 10 90�9
Canada 1,254 433 1,687 1,201 95�8 402 92�8 1,603 95�0
* The schools’ response rate was calculated the following way: number of participating schools/number of selected schools (participating schools + non-participating schools)�