PCAN: 3D Attention Map Learning Using Contextual Information...
10
PCAN: 3D Attention Map Learning Using Contextual Information for Point Cloud Based Retrieval Wenxiao Zhang, Chunxia Xiao School of Computer Science, Wuhan University, China [email protected] [email protected] Abstract Point cloud based retrieval for place recognition is an emerging problem in vision field. The main challenge is how to find an efficient way to encode the local features into a discriminative global descriptor. In this paper, we propose a Point Contextual Attention Network (PCAN), which can predict the significance of each local point feature based on point context. Our network makes it possible to pay more at- tention to the task-relevent features when aggregating local features. Experiments on various benchmark datasets show that the proposed network can provide outperformance than current state-of-the-art approaches. 1. Introduction The task of visual localization is a core problem in computer vision, which can be widely applied in aug- mented reality[24], robot navigation [22, 6, 39, 38], and autonomous driving[7, 18]. Visual localization is always defined as follows: Given an image from a scene, the pur- pose is to predict the location where the photo is taken. The common process to complete this task is first to construct a large 2D image database, and then retrieval an image from the database which is closest to the query image. According to whether storing 3D point cloud in database, existing lo- calization methods can be catagorized into image-retrieval based methods [23, 17, 28, 21] and direct 2D-3D matching based methods [16, 15, 35, 35]. All these methods are im- age based retrieval. However, image based retrieval always suffers from the illumination conditions. e.g. different day time, different climate environment, season changes. As the 3D scanned tech becomes mature, e.g. 3D Lidar sensor is widely used in robotics and autonomous driving, point cloud based retrieval for place recognition is first proposed in PointNetVLAD [1], a deep network for large-scale 3D point cloud retrieval. It uses PointNet [25] to extract local features which are then fed into a NetVLAD [2] to get the final discriminative global descriptor. Feature Extraction F 1 F 2 F N ... ... Score 1 Score 2 Score N X Global Feature X X Point 1 Point 2 Point N ... (b) Local Features Contextual Attention Map (c) (a) 1 Point Contextual Attention Network Figure 1. (a) Our Point Contextual Attention Network (PCAN) takes the per-point local features and produces an attention map which estimates an attention score for each point based on the contextual information. (b) The input point cloud. (c) The vi- sualization of the attention map. Actcually, when aggregating the local features into a global one, it is more reasonable to reweight the contribu- tions for each local point feature before being aggregated to the global descriptor for distributing more attention to the task-relevant regions. For instance, in localization task, the time-varying objects such as pedestrians, or floating noisy pieces caused by unknown objects may lead to false re- trieval results. There has been a number of works focus on selecting the most important or interesting local features for local- ization in 2D image area [9, 13, 33]. Most of these works pay attention to the discriminative local features in feature space which can represent the image more efficiently. Kim et al.[12] addresses the problem that the significance of a lo- cal feature in a 2D image is largely effected by its context in 12436
Transcript of PCAN: 3D Attention Map Learning Using Contextual Information...
PCAN: 3D Attention Map Learning Using Contextual Information for Point
Cloud Based Retrieval
Wenxiao Zhang, Chunxia Xiao
School of Computer Science, Wuhan University, China
[email protected] [email protected]
Abstract
Point cloud based retrieval for place recognition is an
emerging problem in vision field. The main challenge is how
to find an efficient way to encode the local features into a
discriminative global descriptor. In this paper, we propose
a Point Contextual Attention Network (PCAN), which can
predict the significance of each local point feature based on
point context. Our network makes it possible to pay more at-
tention to the task-relevent features when aggregating local
features. Experiments on various benchmark datasets show
that the proposed network can provide outperformance than
current state-of-the-art approaches.
1. Introduction
The task of visual localization is a core problem in
computer vision, which can be widely applied in aug-
mented reality[24], robot navigation [22, 6, 39, 38], and
autonomous driving[7, 18]. Visual localization is always
defined as follows: Given an image from a scene, the pur-
pose is to predict the location where the photo is taken. The
common process to complete this task is first to construct a
large 2D image database, and then retrieval an image from
the database which is closest to the query image. According
to whether storing 3D point cloud in database, existing lo-
calization methods can be catagorized into image-retrieval
based methods [23, 17, 28, 21] and direct 2D-3D matching
based methods [16, 15, 35, 35]. All these methods are im-
age based retrieval. However, image based retrieval always
suffers from the illumination conditions. e.g. different day
time, different climate environment, season changes. As
the 3D scanned tech becomes mature, e.g. 3D Lidar sensor
is widely used in robotics and autonomous driving, point
cloud based retrieval for place recognition is first proposed
in PointNetVLAD [1], a deep network for large-scale 3D
point cloud retrieval. It uses PointNet [25] to extract local
features which are then fed into a NetVLAD [2] to get the
final discriminative global descriptor.
Feature
Extraction
F1
F2
FN
... ...
Score1
Score2
ScoreN
X
Global
Feature
X
X
Point1
Point2
PointN
...
(b)
Local
Features
Contextual
Attention Map
(c)
(a)
1
Point Contextual
Attention Network
Figure 1. (a) Our Point Contextual Attention Network (PCAN)
takes the per-point local features and produces an attention map
which estimates an attention score for each point based on the
contextual information. (b) The input point cloud. (c) The vi-
sualization of the attention map.
Actcually, when aggregating the local features into a
global one, it is more reasonable to reweight the contribu-
tions for each local point feature before being aggregated to
the global descriptor for distributing more attention to the
task-relevant regions. For instance, in localization task, the
time-varying objects such as pedestrians, or floating noisy
pieces caused by unknown objects may lead to false re-
trieval results.
There has been a number of works focus on selecting
the most important or interesting local features for local-
ization in 2D image area [9, 13, 33]. Most of these works
pay attention to the discriminative local features in feature
space which can represent the image more efficiently. Kim
et al.[12] addresses the problem that the significance of a lo-
cal feature in a 2D image is largely effected by its context in
432112436
conv (w,b) 1x1xDxK
softmax
Point ContextualAttention Network
N x 1
VLA
D
core
L2 n
orm
aliz
ati
on
intr
a-n
orm
aliz
ati
on
FC L
aye
r
L2 n
orm
aliz
ati
on
NetVLAD Layer
Glo
bal Fe
atu
re
Attention Map
Local features extraction
N x 3 N x D
PointNet
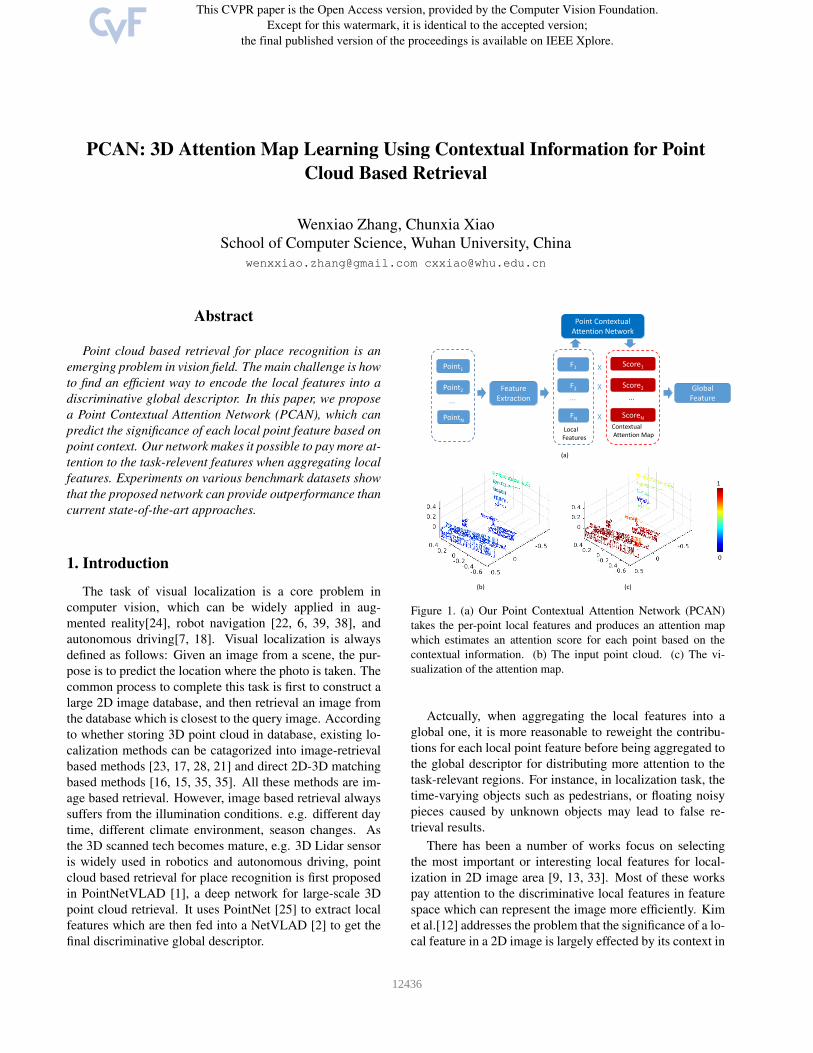
Figure 2. Overall network architecture. The network takes N points as input and uses the PointNet to extract local point features. Our
Point Contextual Attention Network then takes the local point feaures and output a per-point attention map of size N × 1. To efficiently
leverage the attention map, we apply the attention map on the NetVLAD layer during feature aggregation. Finally, a fully connected(FC)
layer is used to reduce the dimension of the feature vector and the L2 normalization is applied.
the scene and proposes a Contextual Reweighting Network
(CRN).
We notice that context information is also essential in
predicting the significance of local point features in point
cloud based tasks. Since we do not use the color as the net-
work input to avoid the false matching caused by different
illumination conditions, each point more on their surround-
ings to infer point-wise semantic information. For instance,
a sphere constructed by several points can be a street lamp
when there is a lamp holder alike structure near by, while it
also can be floating noises when it has no neighborhoods in
a big search radius and is far away from all other points.
In this paper, we propose a novel context-aware
reweighting network for 3D point cloud as illustrated in Fig.
1. The PCAN takes the local point features and produces an
attention map which estimates a weight for each point based
on the contextual information (Fig. 1 (a)). Unlike 2D im-
ages, convolution operator can not be directly used in point
clouds due to the sensitivity to the input permutation. In-
spired by PointNet++ [27], we consider to use ball query
search which depends on different query radius to aggre-
gate muti-scale features. Both quality and quantity results
on the benchmark datasets show the ability of our network
in finding more important features to produce a more dis-
criminative global descriptor.
2. Related work
Handcrafted 3D Descriptors. Extracting robust local ge-
ometric descriptors has been a core problem in 3D vision.
Some classic descriptors have been developed in the early
years, such as Spin Images [10] and Geometry Histograms
[5]. Recent works include Point Feature Histograms (PFH)
[30], Fast Point Feature Histograms (FPFH) [29], Signature
of Histogram Orientations(SHOT) [32]. Some of these de-
scriptors are already included in PCL [31]. Most of these
hand-crafted descriptors are designed for specific tasks and
they are sensitive to noisy, incomplete RGB-D images cap-
tured by sensors. Besides, these methods focus on extract-
ing local descriptors which are not applicable to extracting
global features due to the huge computation.
Learned 3D Global Descriptors. With the breakthroughs
of some learning based 2D vision tasks over the past few
years, e.g. image classification, object detection, more and
more researchers focus on representing 3D geometry us-
ing learning methods. In the early days, several works
use volumetric representations as network input and de-
velop learned descriptors for object retrieval and classifica-
tion [37, 20, 26]. Recently researchers shifted to use raw
point cloud [40, 34, 14]. PointNet [25] directly handles
point cloud and uses symmetric function to make the out-
put invariant to the order permutation of the input points.
PointNet++ [27] leverages neighborhoods at multiple scales
to capture local structures. Several network architectures on
point cloud are proposed in succession mainly for classifi-
cation and segmentation. [36] proposes Parametric Contin-
uous Convolution, a new learnable operator that operates
over non-grid structured data. All these works focus on ex-
tracting features from 3D data at a global level, but most
of them aim at handling complete 3D models instead of 3D
scanned data which is incomplete and noisy.
Learned 3D Local Descriptors. 3DMatch [41] uses voxel
grid as input and introduced a 3D convolution network to
distinguish the positive and negative pairs. Compact Ge-
ometric Features (CGF) [11] uses histogram representation
as network input to learn a compact local descriptor. PPFnet
[4] and PPF-FoldNet [3] directly operate on points and uses
a point pair feature encoding of the local 3D geometry into
patches. 3DFeat-Net [8] proposes a weakly supervised net-
432212437
work that learns both 3D feature detector and descriptor.
However, these descriptors aiming at extracting local fea-
tures are difficult to be applied in extracting global features
due to the data increasing.
Point cloud based retrieval can be defined as a match-
ing problem of the global descriptors of 3D point clouds.
Mikaela and Gim [1] first propose PointNetVLAD which
is a deep network combining PointNet [25] and NetVLAD
[2] to extract the global descriptor from a scanned 3D point
cloud for retrieval task. Though PointNetVLAD is more ef-
ficient to add a NetVLAD layer to the global feature than
just using the vanilla PointNet architecture, it does not dis-
criminate the local features which positively contribute to
the final global feature representations. Based on these ob-
servations, we add a context-aware attention mechanism to
the global feature extraction pipeline.
3. Network
The overall architecture of our network is shown in Fig.
2. We use the PointNet to extract local point features, and
the input is a set of 3D points with coordinates which is
denoted as P = {p1, ..., pN} ∈ R3. Our Point Contextual
Attention Network then takes the local point feaures and
output a per-point attention map of size N × 1. Instead of
directly multiplying the local features by the corresponding
scores on the attention map, we apply the attention map on
the NetVLAD layer during feature aggregation. The details
of our PCAN and feature aggregation process is described
in Sec. 3.2.1.
3.1. Local feature extraction
Similar to PointNetVLAD, we use PointNet as the basic
network to extract per-point local features. The PointNet
contains 2 transformation nets and 5 shared fully connected
layers which is the same as the architecture used in Point-
NetVLAD.
3.2. Attention map
When computing an attention map for all the input
points, we formulate the process as follows: After the lo-
cal feature extraction, we get the per-point local features
which are denoted as F = {f1, ..., fN} ∈ RD, where D
denotes the output feature dim of each point. Our goal is to
learn a score matrix of size N×C, where C can be 1 which
represents one score for one point, or the same as the lo-
cal feature dim which represents one score for one channel.
The attention score s and the local feature f at the space
location l is denoted as sl and fl. We do a multiply between
the local feature map and the attention map:
Fw = {s1 × f1, ..., sN × fN}. (1)
Fw denotes the reweighted local feature map. The final step
is to aggregate the Fw into a global descriptor.
Local Features(N×K)
SAG Layer3[NM,r3,K3,D3]
SAG Layer2[NM,r2,K2,D2]
SAG Layer1[NM,r1,K1,D1]
concat
SAG Layer4[NA,rA,KA,DA]
FP layer1(DF1)
NM×(D1+D2+D3)
NA×DA
Multi-scale Feature Concating
Feature Accumulation
FP layer2(DF2)
NM×DF1
N×DF2
FC layers
Attention Map(N×1)
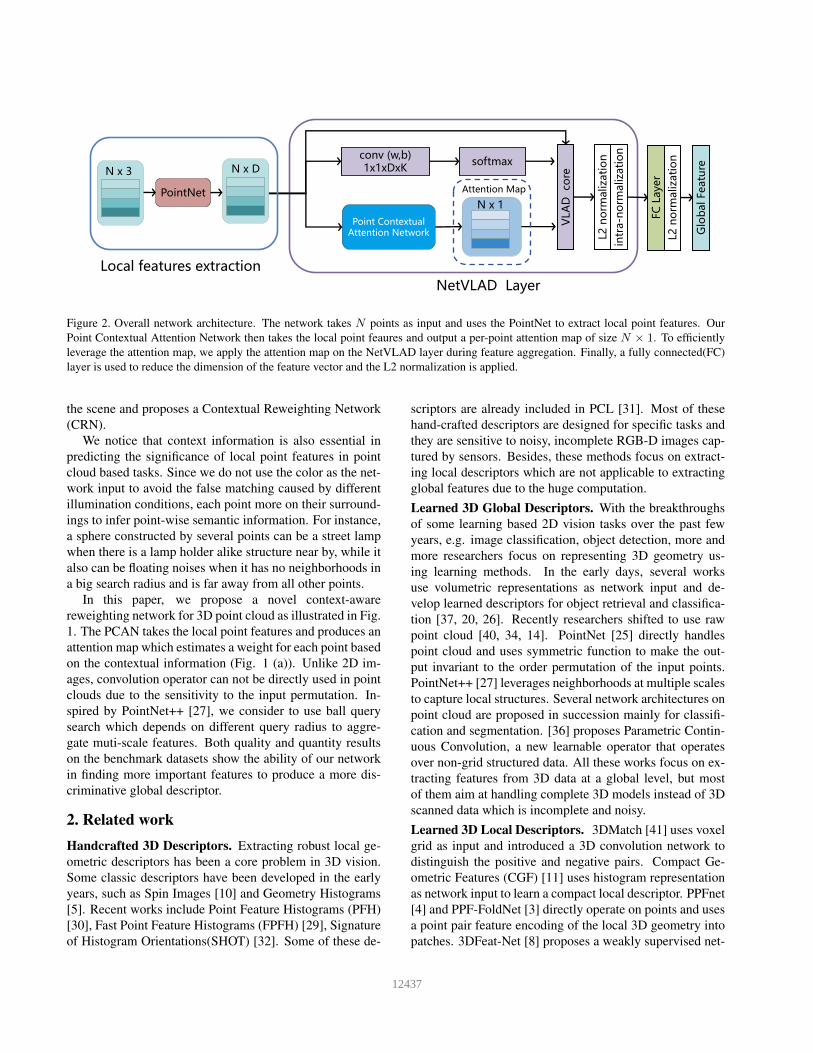
Figure 3. PCAN architecture. PCAN takes the per-point local fea-
tures and outputs an attention map representing the significance of
spatial regions. It uses ball query search with different radius to
aggregate multi-scale contextual information.
To get an effective attention map, we proposed a point
contextual network which concerns multi-scale context in-
formation to get an attention map. The output attention map
is of size N × 1 where we assign one score for one point.
3.2.1 Contextual Attention Map
Multi-scale Contextual Information Aggregation In
CRN [12], it uses context filters to obtain multi-scale con-
textual information implemented by convolution operator
with different kernel sizes. However, convolution operator
can not be directly applied on point cloud due to the order-
less property of the point cloud. Inspired by PointNet++
[27], we use ball query search to aggregate multi-scale con-
textual information around a point.
To group the contextual information of a point, it in-
volves two main operations: sampling and grouping. We
use the implementation of the sampling and grouping layer
introduced in PointNet++. The sampling layer samples a
sub set of N ′ points from the origin N points using itera-
tive farthest point sampling (FPS) algorithm. The grouping
layer uses ball query to find the neighborhoods. Given a ra-
dius r, ball query finds points that are within the radius r
to the query point. The input to this layer is a point set of
size N × (d + C) and the coordinates of a set of sampled
centroids of size N ′×d. The output are groups of point sets
of size N ′×K× (d+C), where each group corresponds to
a local region and K is the number of points in the neigh-
borhood of centroid points. Following the grouping layer,
the PointNet layer with a pooling operation is used to ag-
gregate the neighborhood information. So the final output
432312438
data size is N ′ × (d + C ′). We also use the feature prop-
agation(FP) layer introduced in PointNet++. It propagates
features with distance based interpolation and across level
skip links which can be considered as an upsampling opera-
tion. We use the FP layer to produce the final attention map.
Refer to PointNet++ [27] for more details.
For a clear expression, we use the following notations:
SAG(N, r,K,D) layer includes a sampling layer which
samples K local neighborhoods, a grouping layer with ball
radius r and a PointNet of with the final output dim N ×D.
FP(D) layer is the same with the FP layer introduced in
PointNet++ and D represents the final output feature dim.
The architecture of our PCAN is shown in Fig. 3. To
aggregate multi-scale features, we use three SAG layers for
grouping the neighbor points with different ball query ra-
dius but with the same sampling number.
We then concatenate these features to a multi-scale fea-
ture of size N ′ ×D. A following SAG layer groups all the
points for feature accumulation. The accumulated feature
is then fed to FP layers to recover the original point num-
ber. Finally, two fully connected layers are used to obtain
the attention map of size N × 1. Note that a sigmod activa-
tion function is applied to the attention map to restrict each
attention score to 0− 1.
Feature Aggregation Since our goal is to apply the at-
tention map on the point cloud feature extraction pipeline,
thus the final step is to aggregate the reweighted local fea-
tures into a discriminative and compact global representa-
tion. PointNetVLAD uses a NetVLAD layer as a part of the
network and it outperforms the original PointNet in retrieval
task. Rather than directly multiplying the local features by
the corresponding score on the attention map, we apply the
attention map on the NetVLAD layer. The attention score
s and the local feature f at the space location l is denoted
as sl and fl. The NetVLAD layer learns K visual words
{c1, .., ck|ck ∈ RD}, and the output subvector correspond-
ing to the ck is denoted as Vk. Vk is computed as the ac-
cumulation of differences between fl and ck, weighted by
a soft assignment akl which computes a weight of fl to ck.
The original VLAD representation V is denoted as:
V = [V1, ..., VK ], (2)
where
Vk =∑
j∈R
akl (fl − ck). (3)
R denotes a set of spatial location in the feature map. We
apply the learned attention map to the NetVLAD layer
which reweights the VLAD representation Vk as follows:
Vk =∑
l∈R
sl · akl (fl − ck). (4)
The soft assignment operation is the same as the implemen-
tation described in PointNetVLAD. Our learned attention
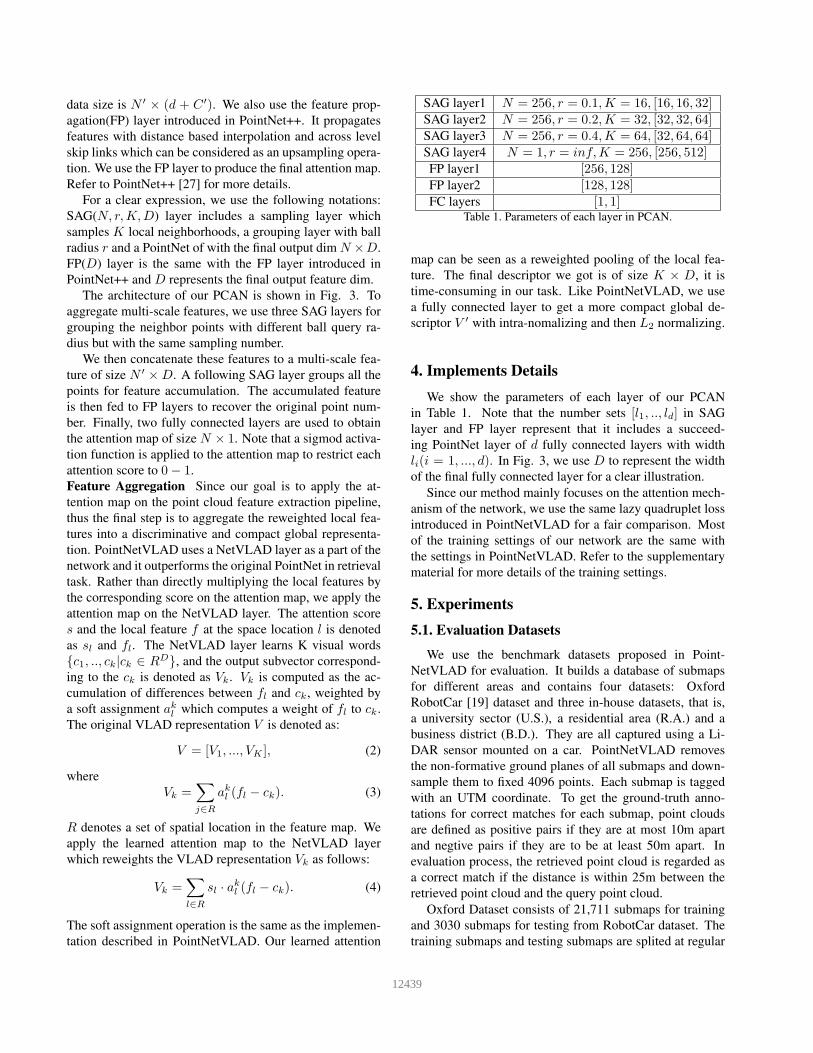
SAG layer1 N = 256, r = 0.1,K = 16, [16, 16, 32]SAG layer2 N = 256, r = 0.2,K = 32, [32, 32, 64]SAG layer3 N = 256, r = 0.4,K = 64, [32, 64, 64]SAG layer4 N = 1, r = inf,K = 256, [256, 512]FP layer1 [256, 128]FP layer2 [128, 128]FC layers [1, 1]
Table 1. Parameters of each layer in PCAN.
map can be seen as a reweighted pooling of the local fea-
ture. The final descriptor we got is of size K × D, it is
time-consuming in our task. Like PointNetVLAD, we use
a fully connected layer to get a more compact global de-
scriptor V ′ with intra-nomalizing and then L2 normalizing.
4. Implements Details
We show the parameters of each layer of our PCAN
in Table 1. Note that the number sets [l1, .., ld] in SAG
layer and FP layer represent that it includes a succeed-
ing PointNet layer of d fully connected layers with width
li(i = 1, ..., d). In Fig. 3, we use D to represent the width
of the final fully connected layer for a clear illustration.
Since our method mainly focuses on the attention mech-
anism of the network, we use the same lazy quadruplet loss
introduced in PointNetVLAD for a fair comparison. Most
of the training settings of our network are the same with
the settings in PointNetVLAD. Refer to the supplementary
material for more details of the training settings.
5. Experiments
5.1. Evaluation Datasets
We use the benchmark datasets proposed in Point-
NetVLAD for evaluation. It builds a database of submaps
for different areas and contains four datasets: Oxford
RobotCar [19] dataset and three in-house datasets, that is,
a university sector (U.S.), a residential area (R.A.) and a
business district (B.D.). They are all captured using a Li-
DAR sensor mounted on a car. PointNetVLAD removes
the non-formative ground planes of all submaps and down-
sample them to fixed 4096 points. Each submap is tagged
with an UTM coordinate. To get the ground-truth anno-
tations for correct matches for each submap, point clouds
are defined as positive pairs if they are at most 10m apart
and negtive pairs if they are to be at least 50m apart. In
evaluation process, the retrieved point cloud is regarded as
a correct match if the distance is within 25m between the
retrieved point cloud and the query point cloud.
Oxford Dataset consists of 21,711 submaps for training
and 3030 submaps for testing from RobotCar dataset. The
training submaps and testing submaps are splited at regular
432412439
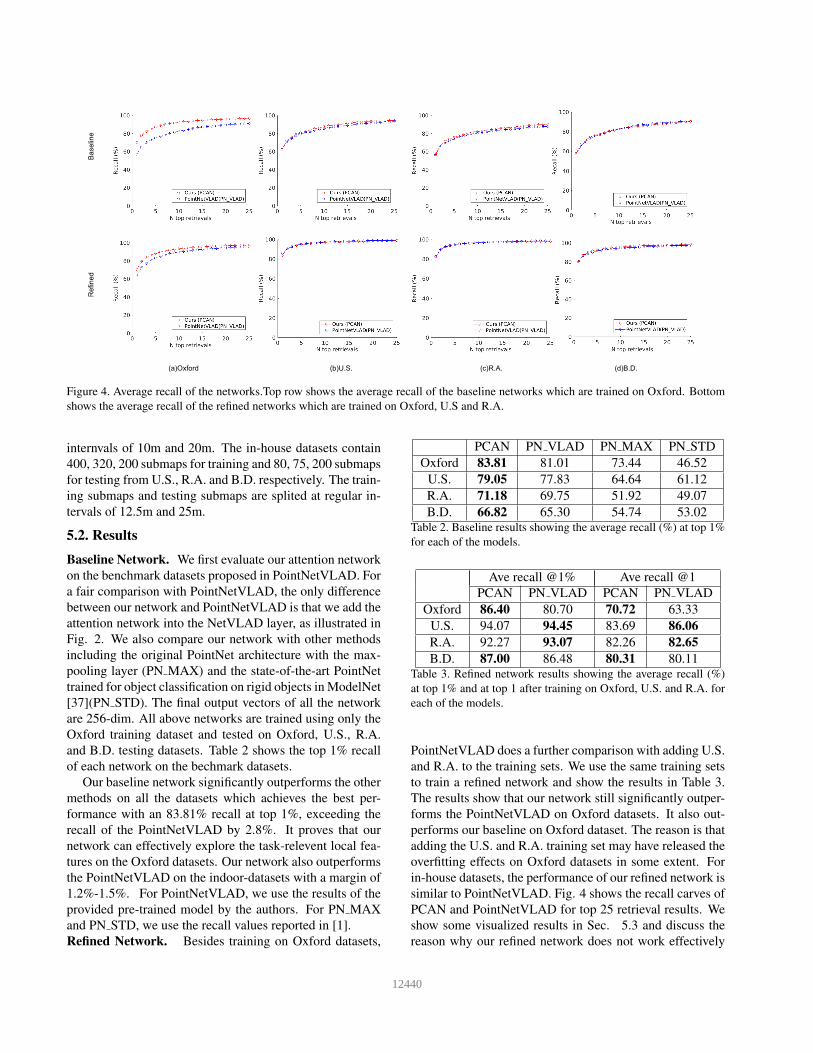
(a)Oxford (b)U.S. (c)R.A. (d)B.D.
Figure 4. Average recall of the networks.Top row shows the average recall of the baseline networks which are trained on Oxford. Bottom
shows the average recall of the refined networks which are trained on Oxford, U.S and R.A.
internvals of 10m and 20m. The in-house datasets contain
400, 320, 200 submaps for training and 80, 75, 200 submaps
for testing from U.S., R.A. and B.D. respectively. The train-
ing submaps and testing submaps are splited at regular in-
tervals of 12.5m and 25m.
5.2. Results
Baseline Network. We first evaluate our attention network
on the benchmark datasets proposed in PointNetVLAD. For
a fair comparison with PointNetVLAD, the only difference
between our network and PointNetVLAD is that we add the
attention network into the NetVLAD layer, as illustrated in
Fig. 2. We also compare our network with other methods
including the original PointNet architecture with the max-
pooling layer (PN MAX) and the state-of-the-art PointNet
trained for object classification on rigid objects in ModelNet
[37](PN STD). The final output vectors of all the network
are 256-dim. All above networks are trained using only the
Oxford training dataset and tested on Oxford, U.S., R.A.
and B.D. testing datasets. Table 2 shows the top 1% recall
of each network on the bechmark datasets.
Our baseline network significantly outperforms the other
methods on all the datasets which achieves the best per-
formance with an 83.81% recall at top 1%, exceeding the
recall of the PointNetVLAD by 2.8%. It proves that our
network can effectively explore the task-relevent local fea-
tures on the Oxford datasets. Our network also outperforms
the PointNetVLAD on the indoor-datasets with a margin of
1.2%-1.5%. For PointNetVLAD, we use the results of the
provided pre-trained model by the authors. For PN MAX
and PN STD, we use the recall values reported in [1].
Refined Network. Besides training on Oxford datasets,
PCAN PN VLAD PN MAX PN STD
Oxford 83.81 81.01 73.44 46.52
U.S. 79.05 77.83 64.64 61.12
R.A. 71.18 69.75 51.92 49.07
B.D. 66.82 65.30 54.74 53.02Table 2. Baseline results showing the average recall (%) at top 1%
for each of the models.
Ave recall @1% Ave recall @1
PCAN PN VLAD PCAN PN VLAD
Oxford 86.40 80.70 70.72 63.33
U.S. 94.07 94.45 83.69 86.06
R.A. 92.27 93.07 82.26 82.65
B.D. 87.00 86.48 80.31 80.11Table 3. Refined network results showing the average recall (%)
at top 1% and at top 1 after training on Oxford, U.S. and R.A. for
each of the models.
PointNetVLAD does a further comparison with adding U.S.
and R.A. to the training sets. We use the same training sets
to train a refined network and show the results in Table 3.
The results show that our network still significantly outper-
forms the PointNetVLAD on Oxford datasets. It also out-
performs our baseline on Oxford dataset. The reason is that
adding the U.S. and R.A. training set may have released the
overfitting effects on Oxford datasets in some extent. For
in-house datasets, the performance of our refined network is
similar to PointNetVLAD. Fig. 4 shows the recall carves of
PCAN and PointNetVLAD for top 25 retrieval results. We
show some visualized results in Sec. 5.3 and discuss the
reason why our refined network does not work effectively
432512440
(a)
(b)
(c)
(d)
Query Query
(Attention Map)PCAN PCAN
(Attenion Map)PN_VLAD
0 1
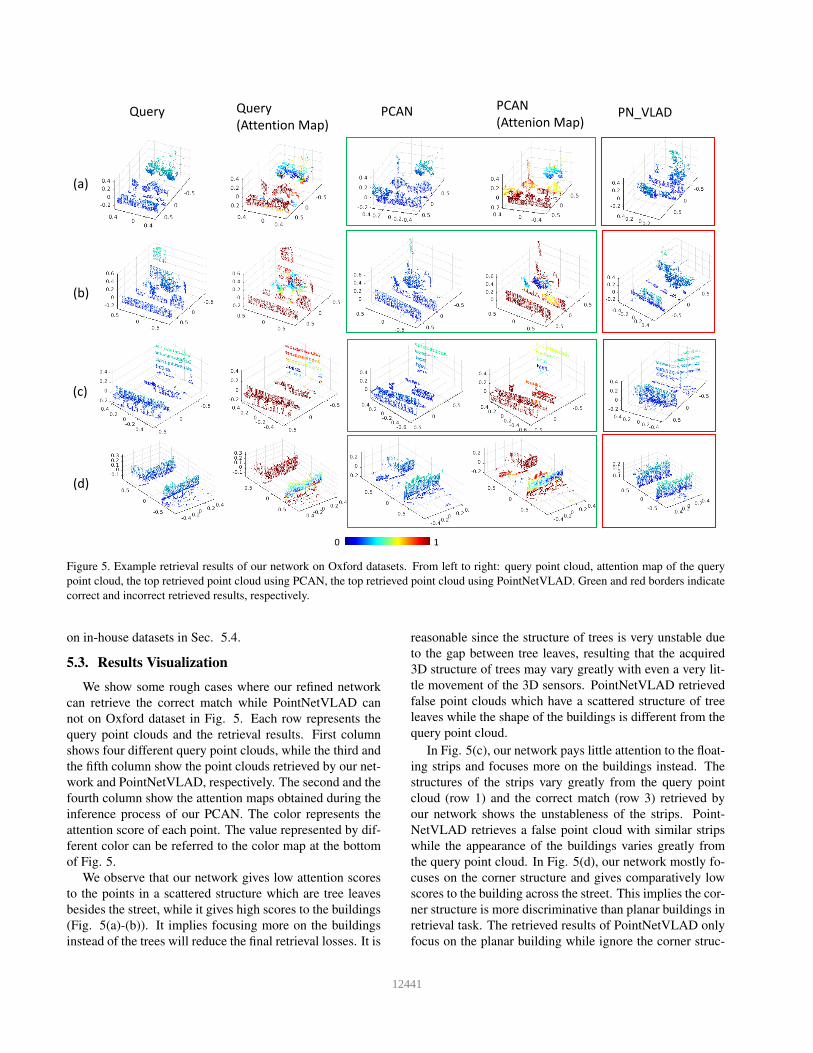
Figure 5. Example retrieval results of our network on Oxford datasets. From left to right: query point cloud, attention map of the query
point cloud, the top retrieved point cloud using PCAN, the top retrieved point cloud using PointNetVLAD. Green and red borders indicate
correct and incorrect retrieved results, respectively.
on in-house datasets in Sec. 5.4.
5.3. Results Visualization
We show some rough cases where our refined network
can retrieve the correct match while PointNetVLAD can
not on Oxford dataset in Fig. 5. Each row represents the
query point clouds and the retrieval results. First column
shows four different query point clouds, while the third and
the fifth column show the point clouds retrieved by our net-
work and PointNetVLAD, respectively. The second and the
fourth column show the attention maps obtained during the
inference process of our PCAN. The color represents the
attention score of each point. The value represented by dif-
ferent color can be referred to the color map at the bottom
of Fig. 5.
We observe that our network gives low attention scores
to the points in a scattered structure which are tree leaves
besides the street, while it gives high scores to the buildings
(Fig. 5(a)-(b)). It implies focusing more on the buildings
instead of the trees will reduce the final retrieval losses. It is
reasonable since the structure of trees is very unstable due
to the gap between tree leaves, resulting that the acquired
3D structure of trees may vary greatly with even a very lit-
tle movement of the 3D sensors. PointNetVLAD retrieved
false point clouds which have a scattered structure of tree
leaves while the shape of the buildings is different from the
query point cloud.
In Fig. 5(c), our network pays little attention to the float-
ing strips and focuses more on the buildings instead. The
structures of the strips vary greatly from the query point
cloud (row 1) and the correct match (row 3) retrieved by
our network shows the unstableness of the strips. Point-
NetVLAD retrieves a false point cloud with similar strips
while the appearance of the buildings varies greatly from
the query point cloud. In Fig. 5(d), our network mostly fo-
cuses on the corner structure and gives comparatively low
scores to the building across the street. This implies the cor-
ner structure is more discriminative than planar buildings in
retrieval task. The retrieved results of PointNetVLAD only
focus on the planar building while ignore the corner struc-
432612441
(a)
Query Query
(Attention Map)PCAN
PCAN
(Attention Map)
(b)
(c)
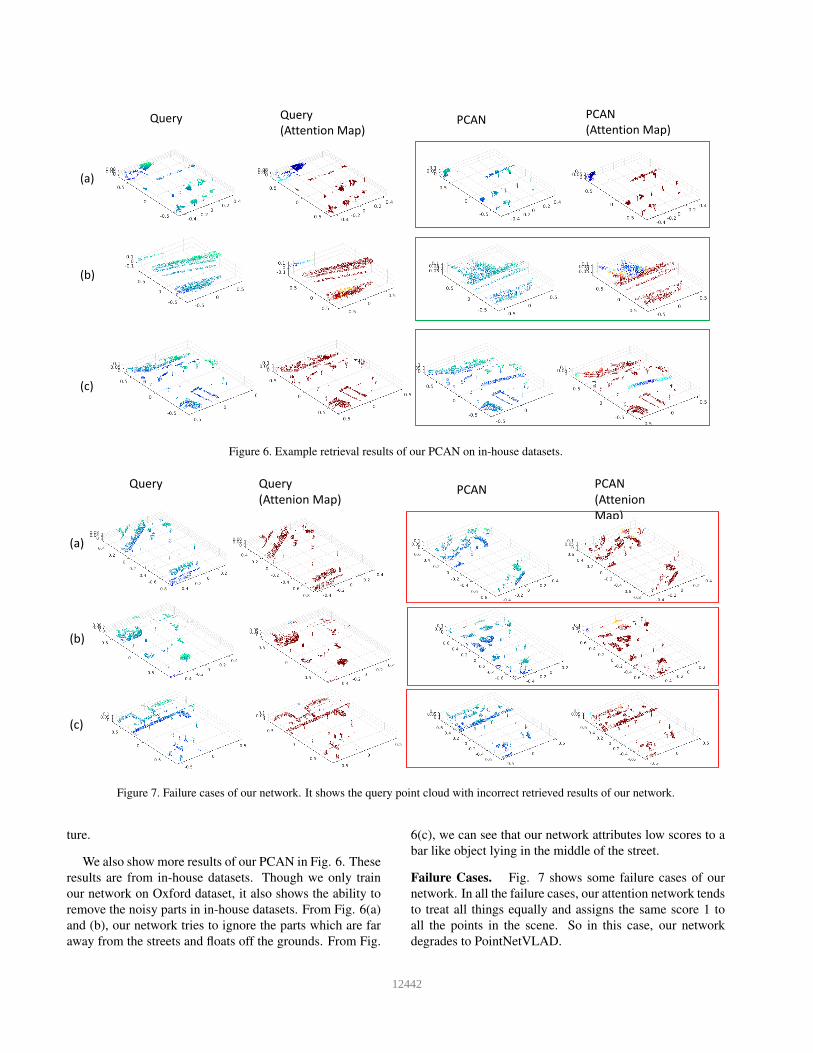
Figure 6. Example retrieval results of our PCAN on in-house datasets.
(a)
(b)
(c)
Query Query
(Attenion Map)PCAN
PCAN
(Attenion
Map)
Figure 7. Failure cases of our network. It shows the query point cloud with incorrect retrieved results of our network.
ture.
We also show more results of our PCAN in Fig. 6. These
results are from in-house datasets. Though we only train
our network on Oxford dataset, it also shows the ability to
remove the noisy parts in in-house datasets. From Fig. 6(a)
and (b), our network tries to ignore the parts which are far
away from the streets and floats off the grounds. From Fig.
6(c), we can see that our network attributes low scores to a
bar like object lying in the middle of the street.
Failure Cases. Fig. 7 shows some failure cases of our
network. In all the failure cases, our attention network tends
to treat all things equally and assigns the same score 1 to
all the points in the scene. So in this case, our network
degrades to PointNetVLAD.
432712442
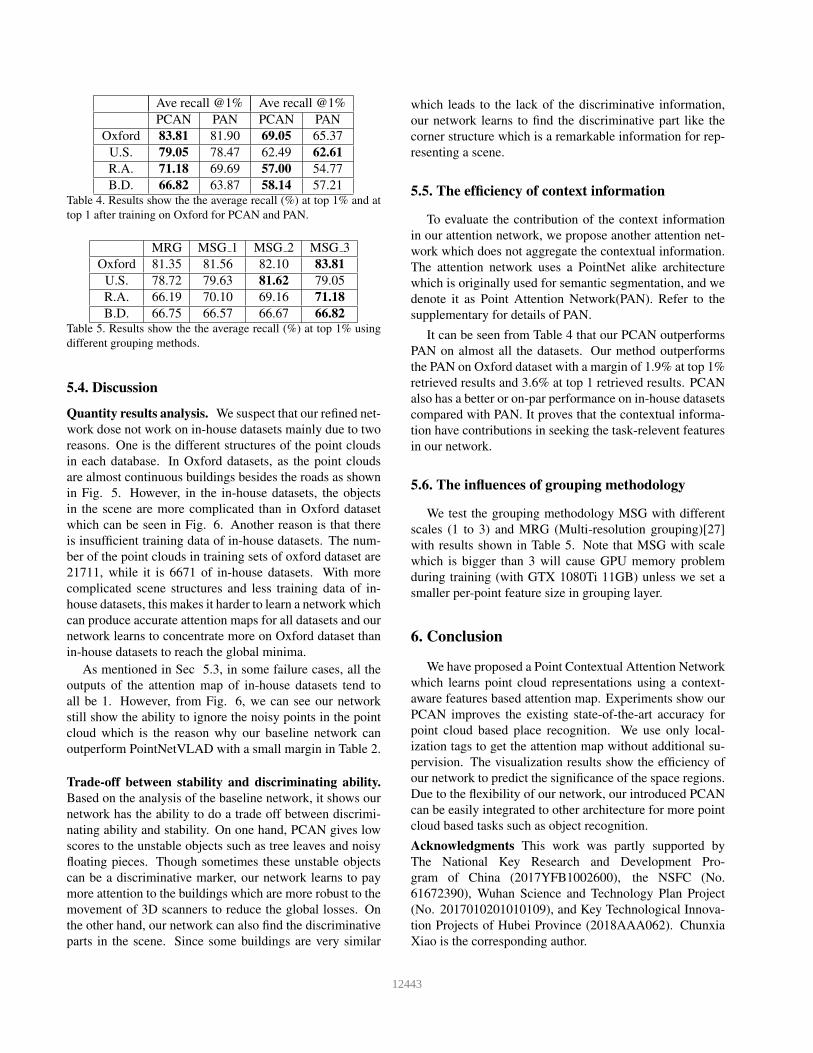
Ave recall @1% Ave recall @1%
PCAN PAN PCAN PAN
Oxford 83.81 81.90 69.05 65.37
U.S. 79.05 78.47 62.49 62.61
R.A. 71.18 69.69 57.00 54.77
B.D. 66.82 63.87 58.14 57.21Table 4. Results show the the average recall (%) at top 1% and at
top 1 after training on Oxford for PCAN and PAN.
MRG MSG 1 MSG 2 MSG 3
Oxford 81.35 81.56 82.10 83.81
U.S. 78.72 79.63 81.62 79.05
R.A. 66.19 70.10 69.16 71.18
B.D. 66.75 66.57 66.67 66.82Table 5. Results show the the average recall (%) at top 1% using
different grouping methods.
5.4. Discussion
Quantity results analysis. We suspect that our refined net-
work dose not work on in-house datasets mainly due to two
reasons. One is the different structures of the point clouds
in each database. In Oxford datasets, as the point clouds
are almost continuous buildings besides the roads as shown
in Fig. 5. However, in the in-house datasets, the objects
in the scene are more complicated than in Oxford dataset
which can be seen in Fig. 6. Another reason is that there
is insufficient training data of in-house datasets. The num-
ber of the point clouds in training sets of oxford dataset are
21711, while it is 6671 of in-house datasets. With more
complicated scene structures and less training data of in-
house datasets, this makes it harder to learn a network which
can produce accurate attention maps for all datasets and our
network learns to concentrate more on Oxford dataset than
in-house datasets to reach the global minima.
As mentioned in Sec 5.3, in some failure cases, all the
outputs of the attention map of in-house datasets tend to
all be 1. However, from Fig. 6, we can see our network
still show the ability to ignore the noisy points in the point
cloud which is the reason why our baseline network can
outperform PointNetVLAD with a small margin in Table 2.
Trade-off between stability and discriminating ability.
Based on the analysis of the baseline network, it shows our
network has the ability to do a trade off between discrimi-
nating ability and stability. On one hand, PCAN gives low
scores to the unstable objects such as tree leaves and noisy
floating pieces. Though sometimes these unstable objects
can be a discriminative marker, our network learns to pay
more attention to the buildings which are more robust to the
movement of 3D scanners to reduce the global losses. On
the other hand, our network can also find the discriminative
parts in the scene. Since some buildings are very similar
which leads to the lack of the discriminative information,
our network learns to find the discriminative part like the
corner structure which is a remarkable information for rep-
resenting a scene.
5.5. The efficiency of context information
To evaluate the contribution of the context information
in our attention network, we propose another attention net-
work which does not aggregate the contextual information.
The attention network uses a PointNet alike architecture
which is originally used for semantic segmentation, and we
denote it as Point Attention Network(PAN). Refer to the
supplementary for details of PAN.
It can be seen from Table 4 that our PCAN outperforms
PAN on almost all the datasets. Our method outperforms
the PAN on Oxford dataset with a margin of 1.9% at top 1%
retrieved results and 3.6% at top 1 retrieved results. PCAN
also has a better or on-par performance on in-house datasets
compared with PAN. It proves that the contextual informa-
tion have contributions in seeking the task-relevent features
in our network.
5.6. The influences of grouping methodology
We test the grouping methodology MSG with different
scales (1 to 3) and MRG (Multi-resolution grouping)[27]
with results shown in Table 5. Note that MSG with scale
which is bigger than 3 will cause GPU memory problem
during training (with GTX 1080Ti 11GB) unless we set a
smaller per-point feature size in grouping layer.
6. Conclusion
We have proposed a Point Contextual Attention Network
which learns point cloud representations using a context-
aware features based attention map. Experiments show our
PCAN improves the existing state-of-the-art accuracy for
point cloud based place recognition. We use only local-
ization tags to get the attention map without additional su-
pervision. The visualization results show the efficiency of
our network to predict the significance of the space regions.
Due to the flexibility of our network, our introduced PCAN
can be easily integrated to other architecture for more point
cloud based tasks such as object recognition.
Acknowledgments This work was partly supported by
The National Key Research and Development Pro-
gram of China (2017YFB1002600), the NSFC (No.
61672390), Wuhan Science and Technology Plan Project
(No. 2017010201010109), and Key Technological Innova-
tion Projects of Hubei Province (2018AAA062). Chunxia
Xiao is the corresponding author.
432812443
References
[1] Mikaela Angelina Uy and Gim Hee Lee. Pointnetvlad: Deep
point cloud based retrieval for large-scale place recognition.
In The IEEE Conference on Computer Vision and Pattern
Recognition (CVPR), June 2018.
[2] Relja Arandjelovic, Petr Gronat, Akihiko Torii, Tomas Pa-
jdla, and Josef Sivic. Netvlad: Cnn architecture for weakly
supervised place recognition. In Proceedings of the IEEE
Conference on Computer Vision and Pattern Recognition,
pages 5297–5307, 2016.
[3] Haowen Deng, Tolga Birdal, and Slobodan Ilic. Ppf-foldnet:
Unsupervised learning of rotation invariant 3d local descrip-
tors. arXiv preprint arXiv:1808.10322, 2018.
[4] Haowen Deng, Tolga Birdal, and Slobodan Ilic. Ppfnet:
Global context aware local features for robust 3d point
matching. Computer Vision and Pattern Recognition
(CVPR). IEEE, 1, 2018.
[5] Andrea Frome, Daniel Huber, Ravi Kolluri, Thomas Bulow,
and Jitendra Malik. Recognizing objects in range data us-
ing regional point descriptors. In European conference on
computer vision, pages 224–237. Springer, 2004.
[6] Yanping Fu, Qingan Yan, Long Yang, Jie Liao, and Chunxia
Xiao. Texture mapping for 3d reconstruction with rgb-d sen-
sor. In Proceedings of the IEEE Conference on Computer
Vision and Pattern Recognition, pages 4645–4653, 2018.
[7] Gim Hee Lee, Friedrich Faundorfer, and Marc Pollefeys.
Motion estimation for self-driving cars with a generalized
camera. In Proceedings of the IEEE Conference on Com-
puter Vision and Pattern Recognition, pages 2746–2753,
2013.
[8] Zi Jian Yew and Gim Hee Lee. 3dfeat-net: Weakly super-
vised local 3d features for point cloud registration. In Pro-
ceedings of the European Conference on Computer Vision
(ECCV), pages 607–623, 2018.
[9] Hyo Jin Kim, Enrique Dunn, and Jan-Michael Frahm. Pre-
dicting good features for image geo-localization using per-
bundle vlad. In Proceedings of the IEEE International Con-
ference on Computer Vision, pages 1170–1178, 2015.
[10] Andrew E Johnson and Martial Hebert. Using spin images
for efficient object recognition in cluttered 3d scenes. IEEE
Transactions on Pattern Analysis & Machine Intelligence,
(5):433–449, 1999.
[11] Marc Khoury, Qian-Yi Zhou, and Vladlen Koltun. Learn-
ing compact geometric features. In Proc. of the IEEE Conf.
on Computer Vision and Pattern Recognition, pages 153–61,
2017.
[12] Hyo Jin Kim, Enrique Dunn, and Jan-Michael Frahm.
Learned contextual feature reweighting for image geo-
localization. In Proceedings of the IEEE Conference on
Computer Vision and Pattern Recognition (CVPR), vol-
ume 5, page 8, 2017.
[13] Jan Knopp, Josef Sivic, and Tomas Pajdla. Avoiding confus-
ing features in place recognition. In European Conference
on Computer Vision, pages 748–761. Springer, 2010.
[14] Jiaxin Li, Ben M Chen, and Gim Hee Lee. So-net: Self-
organizing network for point cloud analysis. arXiv preprint
arXiv:1803.04249, 2018.
[15] Yunpeng Li, Noah Snavely, and Daniel P Huttenlocher. Lo-
cation recognition using prioritized feature matching. In
European conference on computer vision, pages 791–804.
Springer, 2010.
[16] Liu Liu, Hongdong Li, and Yuchao Dai. Efficient global
2d-3d matching for camera localization in a large-scale 3d
map. In Computer Vision (ICCV), 2017 IEEE International
Conference on, pages 2391–2400. IEEE, 2017.
[17] Liu Liu, Hongdong Li, and Yuchao Dai. Deep stochastic
attraction and repulsion embedding for image based local-
ization. arXiv preprint arXiv:1808.08779, 2018.
[18] Liu Liu, Hongdong Li, Yuchao Dai, and Quan Pan. Ro-
bust and efficient relative pose with a multi-camera system
for autonomous driving in highly dynamic environments.
IEEE Transactions on Intelligent Transportation Systems,
19(8):2432–2444, 2018.
[19] Will Maddern, Geoffrey Pascoe, Chris Linegar, and Paul
Newman. 1 year, 1000 km: The oxford robotcar dataset.
The International Journal of Robotics Research, 36(1):3–15,
2017.
[20] Daniel Maturana and Sebastian Scherer. Voxnet: A 3d con-
volutional neural network for real-time object recognition.
In Intelligent Robots and Systems (IROS), 2015 IEEE/RSJ
International Conference on, pages 922–928. IEEE, 2015.
[21] Eric Muller-Budack, Kader Pustu-Iren, and Ralph Ewerth.
Geolocation estimation of photos using a hierarchical model
and scene classification. In Proceedings of the European
Conference on Computer Vision (ECCV), pages 563–579,
2018.
[22] Raul Mur-Artal, Jose Maria Martinez Montiel, and Juan D
Tardos. Orb-slam: a versatile and accurate monocular slam
system. IEEE Transactions on Robotics, 31(5):1147–1163,
2015.
[23] Hyeonwoo Noh, Andre Araujo, Jack Sim, Tobias Weyand,
and Bohyung Han. Largescale image retrieval with attentive
deep local features. In Proceedings of the IEEE International
Conference on Computer Vision, pages 3456–3465, 2017.
[24] Liyuan Pan, Yuchao Dai, Miaomiao Liu, and Fatih Porikli.
Simultaneous stereo video deblurring and scene flow estima-
tion. In Computer Vision and Pattern Recognition (CVPR),
2017 IEEE Conference on, pages 6987–6996. IEEE, 2017.
[25] Charles R Qi, Hao Su, Kaichun Mo, and Leonidas J Guibas.
Pointnet: Deep learning on point sets for 3d classifica-
tion and segmentation. Proc. Computer Vision and Pattern
Recognition (CVPR), IEEE, 1(2):4, 2017.
[26] Charles R Qi, Hao Su, Matthias Nießner, Angela Dai,
Mengyuan Yan, and Leonidas J Guibas. Volumetric and
multi-view cnns for object classification on 3d data. In Pro-
ceedings of the IEEE conference on computer vision and pat-
tern recognition, pages 5648–5656, 2016.
[27] Charles Ruizhongtai Qi, Li Yi, Hao Su, and Leonidas J
Guibas. Pointnet++: Deep hierarchical feature learning on
point sets in a metric space. In Advances in Neural Informa-
tion Processing Systems, pages 5099–5108, 2017.
[28] Filip Radenovic, Giorgos Tolias, and Ondrej Chum. Cnn
image retrieval learns from bow: Unsupervised fine-tuning
with hard examples. In European conference on computer
vision, pages 3–20. Springer, 2016.
432912444
[29] Radu Bogdan Rusu, Nico Blodow, and Michael Beetz.
Fast point feature histograms (fpfh) for 3d registration. In
Robotics and Automation, 2009. ICRA’09. IEEE Interna-
tional Conference on, pages 3212–3217. Citeseer, 2009.
[30] Radu Bogdan Rusu, Nico Blodow, Zoltan Csaba Marton, and
Michael Beetz. Aligning point cloud views using persistent
feature histograms. In Intelligent Robots and Systems, 2008.
IROS 2008. IEEE/RSJ International Conference on, pages
3384–3391. IEEE, 2008.
[31] Radu Bogdan Rusu and Steve Cousins. 3d is here: Point
cloud library (pcl). In Robotics and automation (ICRA), 2011
IEEE International Conference on, pages 1–4. IEEE, 2011.
[32] Samuele Salti, Federico Tombari, and Luigi Di Stefano.
Shot: Unique signatures of histograms for surface and tex-
ture description. Computer Vision and Image Understand-
ing, 125:251–264, 2014.
[33] Grant Schindler, Matthew Brown, and Richard Szeliski.
City-scale location recognition. In Computer Vision and
Pattern Recognition, 2007. CVPR’07. IEEE Conference on,
pages 1–7. IEEE, 2007.
[34] Hang Su, Varun Jampani, Deqing Sun, Subhransu Maji,
Evangelos Kalogerakis, Ming-Hsuan Yang, and Jan Kautz.
SPLATNet: Sparse lattice networks for point cloud process-
ing. In Proceedings of the IEEE Conference on Computer
Vision and Pattern Recognition, pages 2530–2539, 2018.
[35] Carl Toft, Erik Stenborg, Lars Hammarstrand, Lucas Brynte,
Marc Pollefeys, Torsten Sattler, and Fredrik Kahl. Semantic
match consistency for long-term visual localization. In Pro-
ceedings of the European Conference on Computer Vision
(ECCV), pages 383–399, 2018.
[36] Shenlong Wang, Simon Suo, Wei-Chiu Ma, Andrei
Pokrovsky, and Raquel Urtasun. Deep parametric continu-
ous convolutional neural networks. In Proceedings of the
IEEE Conference on Computer Vision and Pattern Recogni-
tion, pages 2589–2597, 2018.
[37] Zhirong Wu, Shuran Song, Aditya Khosla, Fisher Yu, Lin-
guang Zhang, Xiaoou Tang, and Jianxiong Xiao. 3d
shapenets: A deep representation for volumetric shapes. In
Proceedings of the IEEE conference on computer vision and
pattern recognition, pages 1912–1920, 2015.
[38] Qingan Yan, Long Yang, Chao Liang, Huajun Liu, Ruimin
Hu, and Chunxia Xiao. Geometrically based linear iterative
clustering for quantitative feature correspondence. In Com-
puter Graphics Forum, volume 35, pages 1–10. Wiley Online
Library, 2016.
[39] Qingan Yan, Long Yang, Ling Zhang, and Chunxia Xiao.
Distinguishing the indistinguishable: Exploring structural
ambiguities via geodesic context. In Proceedings of the IEEE
Conference on Computer Vision and Pattern Recognition,
pages 3836–3844, 2017.
[40] Yaoqing Yang, Chen Feng, Yiru Shen, and Dong Tian. Fold-
ingnet: Point cloud auto-encoder via deep grid deformation.
In Proc. IEEE Conf. on Computer Vision and Pattern Recog-
nition (CVPR), volume 3, 2018.
[41] Andy Zeng, Shuran Song, Matthias Nießner, Matthew
Fisher, Jianxiong Xiao, and Thomas Funkhouser. 3dmatch:
Learning local geometric descriptors from rgb-d reconstruc-
tions. In Computer Vision and Pattern Recognition (CVPR),
2017 IEEE Conference on, pages 199–208. IEEE, 2017.
433012445