pcaExplorer: Interactive Visualization of RNA-seq Data ...
23
Package ‘pcaExplorer’ February 21, 2022 Type Package Title Interactive Visualization of RNA-seq Data Using a Principal Components Approach Version 2.21.0 Date 2021-09-20 Description This package provides functionality for interactive visualization of RNA-seq datasets based on Principal Components Analysis. The methods provided allow for quick information extraction and effective data exploration. A Shiny application encapsulates the whole analysis. License MIT + file LICENSE LazyData TRUE Imports DESeq2, SummarizedExperiment, GenomicRanges, IRanges, S4Vectors, genefilter, ggplot2 (>= 2.0.0), heatmaply, plotly, scales, NMF, plyr, topGO, limma, GOstats, GO.db, AnnotationDbi, shiny (>= 0.12.0), shinydashboard, shinyBS, ggrepel, DT, shinyAce, threejs, biomaRt, pheatmap, knitr, rmarkdown, base64enc, tidyr, grDevices, methods Suggests testthat, BiocStyle, airway, org.Hs.eg.db, htmltools URL https://github.com/federicomarini/pcaExplorer, https://federicomarini.github.io/pcaExplorer/ BugReports https://github.com/federicomarini/pcaExplorer/issues biocViews ImmunoOncology, Visualization, RNASeq, DimensionReduction, PrincipalComponent, QualityControl, GUI, ReportWriting VignetteBuilder knitr RoxygenNote 7.1.2 Encoding UTF-8 NeedsCompilation no git_url https://git.bioconductor.org/packages/pcaExplorer git_branch master git_last_commit a5af062 1
Transcript of pcaExplorer: Interactive Visualization of RNA-seq Data ...

Package ‘pcaExplorer’February 21, 2022
Type Package
Title Interactive Visualization of RNA-seq Data Using a PrincipalComponents Approach
Version 2.21.0
Date 2021-09-20
Description This package provides functionality for interactive visualizationof RNA-seq datasets based on Principal Components Analysis. The methods providedallow for quick information extraction and effective data exploration. A Shinyapplication encapsulates the whole analysis.
License MIT + file LICENSE
LazyData TRUE
Imports DESeq2, SummarizedExperiment, GenomicRanges, IRanges,S4Vectors, genefilter, ggplot2 (>= 2.0.0), heatmaply, plotly,scales, NMF, plyr, topGO, limma, GOstats, GO.db, AnnotationDbi,shiny (>= 0.12.0), shinydashboard, shinyBS, ggrepel, DT,shinyAce, threejs, biomaRt, pheatmap, knitr, rmarkdown,base64enc, tidyr, grDevices, methods
Suggests testthat, BiocStyle, airway, org.Hs.eg.db, htmltools
URL https://github.com/federicomarini/pcaExplorer,
https://federicomarini.github.io/pcaExplorer/
BugReports https://github.com/federicomarini/pcaExplorer/issues
biocViews ImmunoOncology, Visualization, RNASeq, DimensionReduction,PrincipalComponent, QualityControl, GUI, ReportWriting
VignetteBuilder knitr
RoxygenNote 7.1.2
Encoding UTF-8
NeedsCompilation no
git_url https://git.bioconductor.org/packages/pcaExplorer
git_branch master
git_last_commit a5af062
1

2 correlatePCs
git_last_commit_date 2021-10-26
Date/Publication 2022-02-21
Author Federico Marini [aut, cre] (<https://orcid.org/0000-0003-3252-7758>)
Maintainer Federico Marini <[email protected]>
R topics documented:correlatePCs . . . . . . . . . . . . . . . . . . . . . . . . . . . . . . . . . . . . . . . . . 2distro_expr . . . . . . . . . . . . . . . . . . . . . . . . . . . . . . . . . . . . . . . . . 3geneprofiler . . . . . . . . . . . . . . . . . . . . . . . . . . . . . . . . . . . . . . . . . 4genespca . . . . . . . . . . . . . . . . . . . . . . . . . . . . . . . . . . . . . . . . . . . 4get_annotation . . . . . . . . . . . . . . . . . . . . . . . . . . . . . . . . . . . . . . . . 7get_annotation_orgdb . . . . . . . . . . . . . . . . . . . . . . . . . . . . . . . . . . . . 8hi_loadings . . . . . . . . . . . . . . . . . . . . . . . . . . . . . . . . . . . . . . . . . 9limmaquickpca2go . . . . . . . . . . . . . . . . . . . . . . . . . . . . . . . . . . . . . 10makeExampleDESeqDataSet_multifac . . . . . . . . . . . . . . . . . . . . . . . . . . . 11pair_corr . . . . . . . . . . . . . . . . . . . . . . . . . . . . . . . . . . . . . . . . . . . 12pca2go . . . . . . . . . . . . . . . . . . . . . . . . . . . . . . . . . . . . . . . . . . . . 13pcaExplorer . . . . . . . . . . . . . . . . . . . . . . . . . . . . . . . . . . . . . . . . . 15pcaExplorer-pkg . . . . . . . . . . . . . . . . . . . . . . . . . . . . . . . . . . . . . . 16pcaplot . . . . . . . . . . . . . . . . . . . . . . . . . . . . . . . . . . . . . . . . . . . . 17pcaplot3d . . . . . . . . . . . . . . . . . . . . . . . . . . . . . . . . . . . . . . . . . . 18pcascree . . . . . . . . . . . . . . . . . . . . . . . . . . . . . . . . . . . . . . . . . . . 19plotPCcorrs . . . . . . . . . . . . . . . . . . . . . . . . . . . . . . . . . . . . . . . . . 20topGOtable . . . . . . . . . . . . . . . . . . . . . . . . . . . . . . . . . . . . . . . . . 20
Index 23
correlatePCs Principal components (cor)relation with experimental covariates
Description
Computes the significance of (cor)relations between PCA scores and the sample experimental co-variates, using Kruskal-Wallis test for categorial variables and the cor.test based on Spearman’scorrelation for continuous variables
Usage
correlatePCs(pcaobj, coldata, pcs = 1:4)
Arguments
pcaobj A prcomp object
coldata A data.frame object containing the experimental covariates
pcs A numeric vector, containing the corresponding PC number

distro_expr 3
Value
A data.frame object with computed p values for each covariate and for each principal component
Examples
library(DESeq2)dds <- makeExampleDESeqDataSet_multifac(betaSD_condition = 3, betaSD_tissue = 1)rlt <- DESeq2::rlogTransformation(dds)pcaobj <- prcomp(t(assay(rlt)))correlatePCs(pcaobj, colData(dds))
distro_expr Plot distribution of expression values
Description
Plot distribution of expression values
Usage
distro_expr(rld, plot_type = "density")
Arguments
rld A DESeqTransform object.
plot_type Character, choose one of boxplot, violin or density. Defaults to density
Value
A plot with the distribution of the expression values
Examples
dds <- makeExampleDESeqDataSet_multifac(betaSD_condition = 3, betaSD_tissue = 1)rlt <- DESeq2::rlogTransformation(dds)distro_expr(rlt)

4 genespca
geneprofiler Extract and plot the expression profile of genes
Description
Extract and plot the expression profile of genes
Usage
geneprofiler(se, genelist = NULL, intgroup = "condition", plotZ = FALSE)
Arguments
se A DESeqDataSet object, or a DESeqTransform object.
genelist An array of characters, including the names of the genes of interest of which theprofile is to be plotted
intgroup A factor, needs to be in the colnames of colData(se)
plotZ Logical, whether to plot the scaled expression values. Defaults to FALSE
Value
A plot of the expression profile for the genes
Examples
dds <- makeExampleDESeqDataSet_multifac(betaSD_condition = 3, betaSD_tissue = 1)rlt <- DESeq2::rlogTransformation(dds)geneprofiler(rlt, paste0("gene", sample(1:1000, 20)))geneprofiler(rlt, paste0("gene", sample(1:1000, 20)), plotZ = TRUE)
genespca Principal components analysis on the genes
Description
Computes and plots the principal components of the genes, eventually displaying the samples as ina typical biplot visualization.

genespca 5
Usage
genespca(x,ntop,choices = c(1, 2),arrowColors = "steelblue",groupNames = "group",biplot = TRUE,scale = 1,pc.biplot = TRUE,obs.scale = 1 - scale,var.scale = scale,groups = NULL,ellipse = FALSE,ellipse.prob = 0.68,labels = NULL,labels.size = 3,alpha = 1,var.axes = TRUE,circle = FALSE,circle.prob = 0.69,varname.size = 4,varname.adjust = 1.5,varname.abbrev = FALSE,returnData = FALSE,coordEqual = FALSE,scaleArrow = 1,useRownamesAsLabels = TRUE,point_size = 2,annotation = NULL
)
Arguments
x A DESeqTransform object, with data in assay(x), produced for example byeither rlog or varianceStabilizingTransformation
ntop Number of top genes to use for principal components, selected by highest rowvariance
choices Vector of two numeric values, to select on which principal components to plot
arrowColors Vector of character, either as long as the number of the samples, or one singlevalue
groupNames Factor containing the groupings for the input data. Is efficiently chosen as the(interaction of more) factors in the colData for the object provided
biplot Logical, whether to additionally draw the samples labels as in a biplot represen-tation
6 genespca
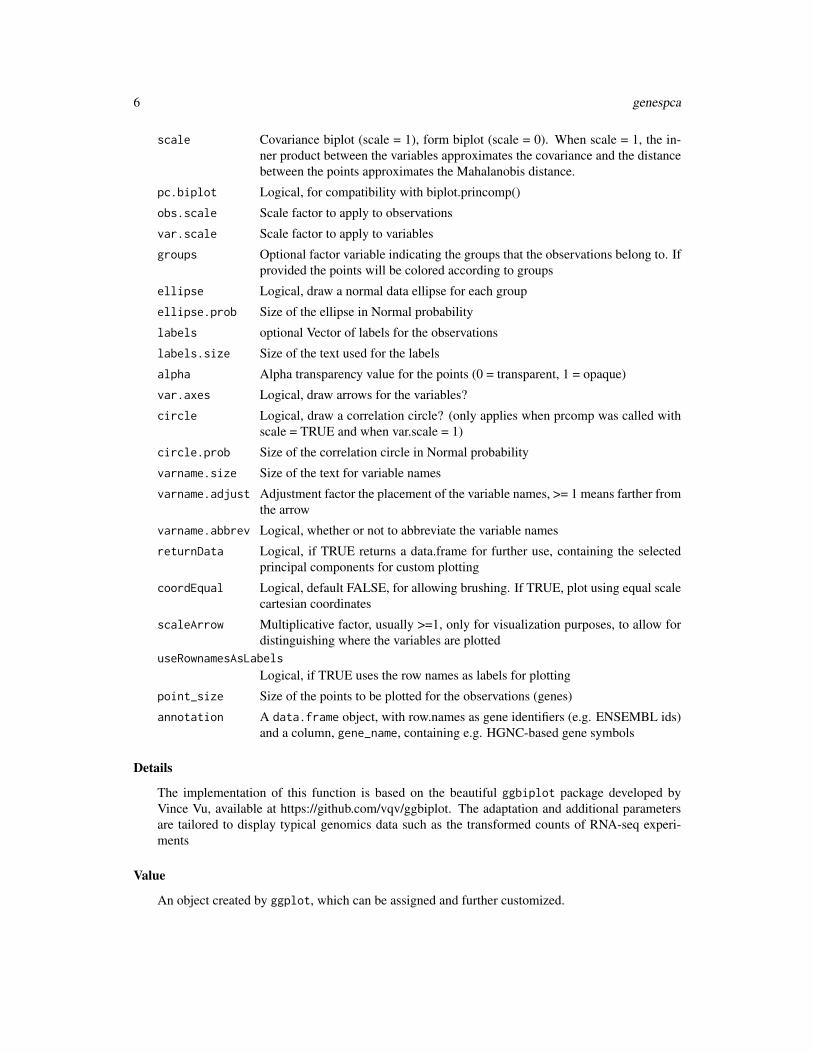
scale Covariance biplot (scale = 1), form biplot (scale = 0). When scale = 1, the in-ner product between the variables approximates the covariance and the distancebetween the points approximates the Mahalanobis distance.
pc.biplot Logical, for compatibility with biplot.princomp()
obs.scale Scale factor to apply to observations
var.scale Scale factor to apply to variables
groups Optional factor variable indicating the groups that the observations belong to. Ifprovided the points will be colored according to groups
ellipse Logical, draw a normal data ellipse for each group
ellipse.prob Size of the ellipse in Normal probability
labels optional Vector of labels for the observations
labels.size Size of the text used for the labels
alpha Alpha transparency value for the points (0 = transparent, 1 = opaque)
var.axes Logical, draw arrows for the variables?
circle Logical, draw a correlation circle? (only applies when prcomp was called withscale = TRUE and when var.scale = 1)
circle.prob Size of the correlation circle in Normal probability
varname.size Size of the text for variable names
varname.adjust Adjustment factor the placement of the variable names, >= 1 means farther fromthe arrow
varname.abbrev Logical, whether or not to abbreviate the variable names
returnData Logical, if TRUE returns a data.frame for further use, containing the selectedprincipal components for custom plotting
coordEqual Logical, default FALSE, for allowing brushing. If TRUE, plot using equal scalecartesian coordinates
scaleArrow Multiplicative factor, usually >=1, only for visualization purposes, to allow fordistinguishing where the variables are plotted
useRownamesAsLabels
Logical, if TRUE uses the row names as labels for plotting
point_size Size of the points to be plotted for the observations (genes)
annotation A data.frame object, with row.names as gene identifiers (e.g. ENSEMBL ids)and a column, gene_name, containing e.g. HGNC-based gene symbols
Details
The implementation of this function is based on the beautiful ggbiplot package developed byVince Vu, available at https://github.com/vqv/ggbiplot. The adaptation and additional parametersare tailored to display typical genomics data such as the transformed counts of RNA-seq experi-ments
Value
An object created by ggplot, which can be assigned and further customized.

get_annotation 7
Examples
library(DESeq2)dds <- makeExampleDESeqDataSet_multifac(betaSD_condition = 3, betaSD_tissue = 1)rlt <- rlogTransformation(dds)groups <- colData(dds)$conditiongroups <- factor(groups, levels = unique(groups))cols <- scales::hue_pal()(2)[groups]genespca(rlt, ntop=100, arrowColors = cols, groupNames = groups)
groups_multi <- interaction(as.data.frame(colData(rlt)[, c("condition", "tissue")]))groups_multi <- factor(groups_multi, levels = unique(groups_multi))cols_multi <- scales::hue_pal()(length(levels(groups_multi)))[factor(groups_multi)]genespca(rlt, ntop = 100, arrowColors = cols_multi, groupNames = groups_multi)
get_annotation Get an annotation data frame from biomaRt
Description
Get an annotation data frame from biomaRt
Usage
get_annotation(dds, biomart_dataset, idtype)
Arguments
dds A DESeqDataSet objectbiomart_dataset
A biomaRt dataset to use. To see the list, type mart = useMart('ensembl'),followed by listDatasets(mart).
idtype Character, the ID type of the genes as in the row names of dds, to be used forthe call to getBM
Value
A data frame for ready use in pcaExplorer, retrieved from biomaRt.
Examples
library(airway)data(airway)airwaydds_airway <- DESeq2::DESeqDataSetFromMatrix(assay(airway),
colData = colData(airway),design = ~dex+cell)
## Not run:
8 get_annotation_orgdb
get_annotation(dds_airway, "hsapiens_gene_ensembl", "ensembl_gene_id")
## End(Not run)
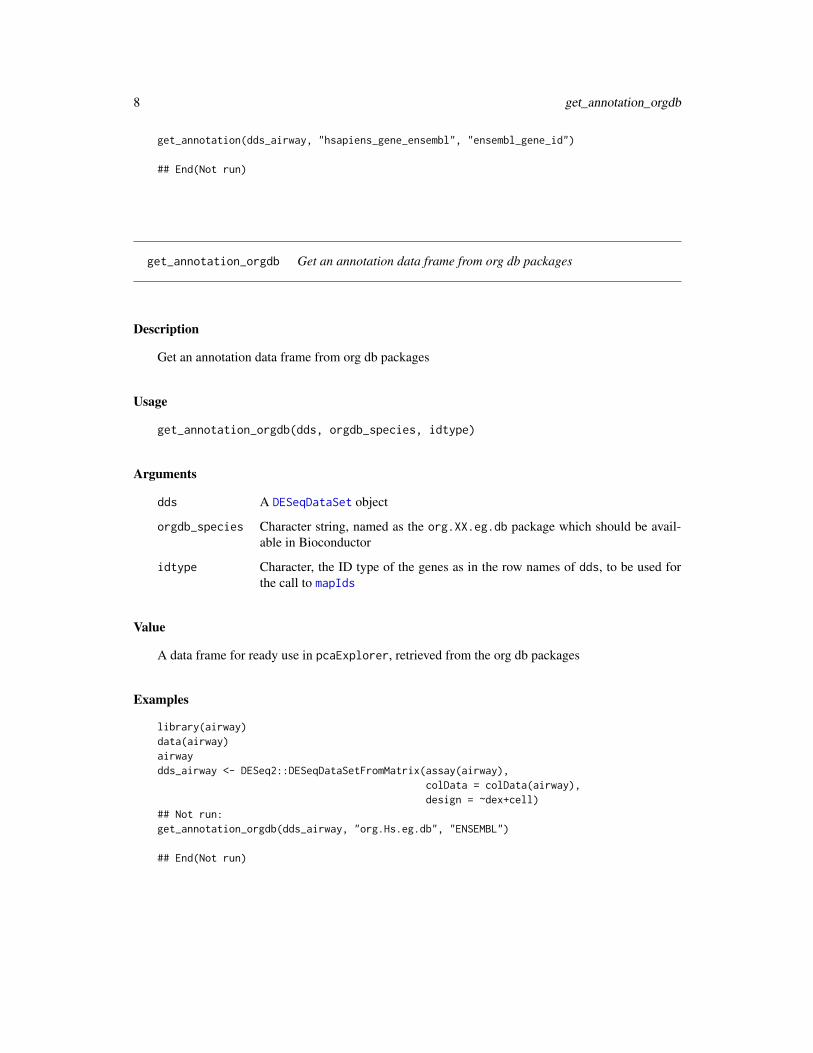
get_annotation_orgdb Get an annotation data frame from org db packages
Description
Get an annotation data frame from org db packages
Usage
get_annotation_orgdb(dds, orgdb_species, idtype)
Arguments
dds A DESeqDataSet object
orgdb_species Character string, named as the org.XX.eg.db package which should be avail-able in Bioconductor
idtype Character, the ID type of the genes as in the row names of dds, to be used forthe call to mapIds
Value
A data frame for ready use in pcaExplorer, retrieved from the org db packages
Examples
library(airway)data(airway)airwaydds_airway <- DESeq2::DESeqDataSetFromMatrix(assay(airway),
colData = colData(airway),design = ~dex+cell)
## Not run:get_annotation_orgdb(dds_airway, "org.Hs.eg.db", "ENSEMBL")
## End(Not run)

hi_loadings 9
hi_loadings Extract genes with highest loadings
Description
Extract genes with highest loadings
Usage
hi_loadings(pcaobj,whichpc = 1,topN = 10,exprTable = NULL,annotation = NULL,title = "Top/bottom loadings"
)
Arguments
pcaobj A prcomp object
whichpc An integer number, corresponding to the principal component of interest
topN Integer, number of genes with top and bottom loadings
exprTable A matrix object, e.g. the counts of a DESeqDataSet. If not NULL, returns thecounts matrix for the selected genes
annotation A data.frame object, with row.names as gene identifiers (e.g. ENSEMBL ids)and a column, gene_name, containing e.g. HGNC-based gene symbols
title The title of the plot
Value
A ggplot2 object, or a matrix, if exprTable is not null
Examples
dds <- makeExampleDESeqDataSet_multifac(betaSD = 3, betaSD_tissue = 1)rlt <- DESeq2::rlogTransformation(dds)pcaobj <- prcomp(t(SummarizedExperiment::assay(rlt)))hi_loadings(pcaobj, topN = 20)hi_loadings(pcaobj, topN = 10, exprTable = dds)hi_loadings(pcaobj, topN = 10, exprTable = counts(dds))

10 limmaquickpca2go
limmaquickpca2go Functional interpretation of the principal components, based on sim-ple overrepresentation analysis
Description
Extracts the genes with the highest loadings for each principal component, and performs functionalenrichment analysis on them using the simple and quick routine provided by the limma package
Usage
limmaquickpca2go(se,pca_ngenes = 10000,inputType = "ENSEMBL",organism = "Mm",loadings_ngenes = 500,background_genes = NULL,scale = FALSE,...
)
Arguments
se A DESeqTransform object, with data in assay(se), produced for example byeither rlog or varianceStabilizingTransformation
pca_ngenes Number of genes to use for the PCA
inputType Input format type of the gene identifiers. Deafults to ENSEMBL, that then will beconverted to ENTREZ ids. Can assume values such as ENTREZID,GENENAME orSYMBOL, like it is normally used with the select function of AnnotationDbi
organism Character abbreviation for the species, using org.XX.eg.db for annotationloadings_ngenes
Number of genes to extract the loadings (in each direction)background_genes
Which genes to consider as background.
scale Logical, defaults to FALSE, scale values for the PCA
... Further parameters to be passed to the goana routine
Value
A nested list object containing for each principal component the terms enriched in each direction.This object is to be thought in combination with the displaying feature of the main pcaExplorerfunction

makeExampleDESeqDataSet_multifac 11
Examples
library(airway)library(DESeq2)library(limma)data(airway)airwaydds_airway <- DESeqDataSet(airway, design = ~ cell + dex)## Not run:rld_airway <- rlogTransformation(dds_airway)goquick_airway <- limmaquickpca2go(rld_airway,
pca_ngenes = 10000,inputType = "ENSEMBL",organism = "Hs")
## End(Not run)
makeExampleDESeqDataSet_multifac
Make a simulated DESeqDataSet for two or more experimental factors
Description
Constructs a simulated dataset of Negative Binomial data from different conditions. The foldchanges between the conditions can be adjusted with the betaSD_condition and the betaSD_tissuearguments.
Usage
makeExampleDESeqDataSet_multifac(n = 1000,m = 12,betaSD_condition = 1,betaSD_tissue = 3,interceptMean = 4,interceptSD = 2,dispMeanRel = function(x) 4/x + 0.1,sizeFactors = rep(1, m)
)
Arguments
n number of rows (genes)
m number of columns (samples)betaSD_condition
the standard deviation for condition betas, i.e. beta ~ N(0,betaSD)
betaSD_tissue the standard deviation for tissue betas, i.e. beta ~ N(0,betaSD)
12 pair_corr
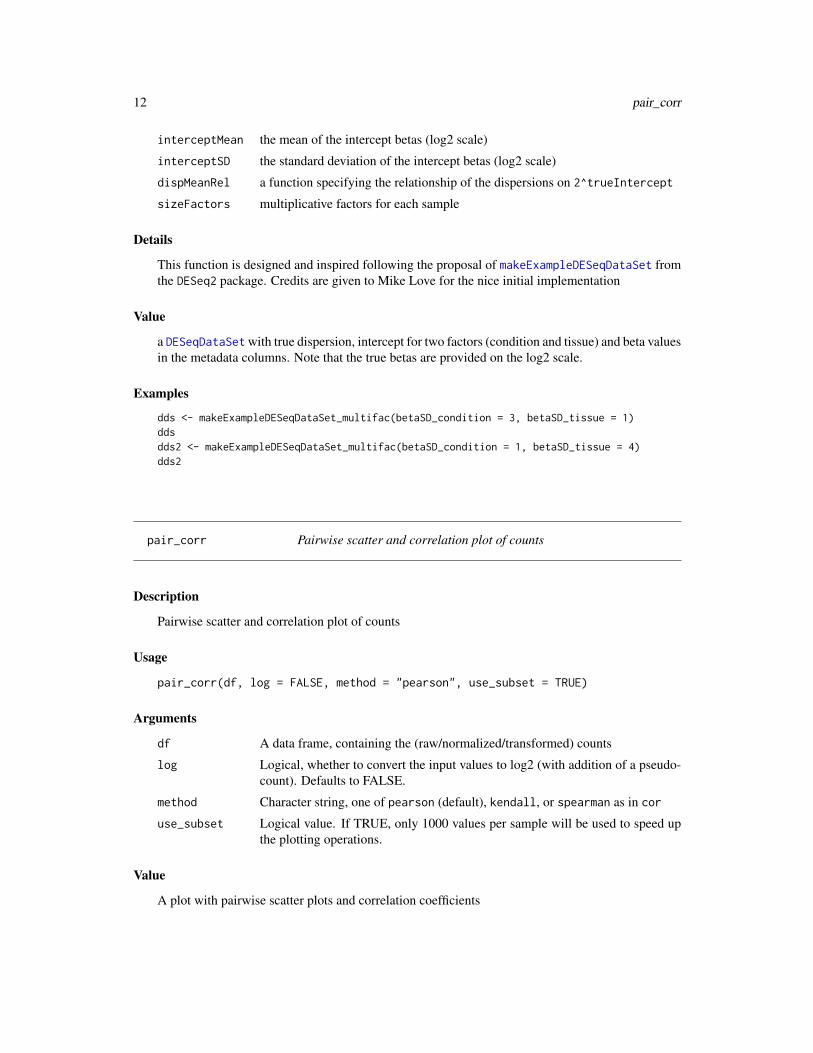
interceptMean the mean of the intercept betas (log2 scale)
interceptSD the standard deviation of the intercept betas (log2 scale)
dispMeanRel a function specifying the relationship of the dispersions on 2^trueIntercept
sizeFactors multiplicative factors for each sample
Details
This function is designed and inspired following the proposal of makeExampleDESeqDataSet fromthe DESeq2 package. Credits are given to Mike Love for the nice initial implementation
Value
a DESeqDataSet with true dispersion, intercept for two factors (condition and tissue) and beta valuesin the metadata columns. Note that the true betas are provided on the log2 scale.
Examples
dds <- makeExampleDESeqDataSet_multifac(betaSD_condition = 3, betaSD_tissue = 1)ddsdds2 <- makeExampleDESeqDataSet_multifac(betaSD_condition = 1, betaSD_tissue = 4)dds2
pair_corr Pairwise scatter and correlation plot of counts
Description
Pairwise scatter and correlation plot of counts
Usage
pair_corr(df, log = FALSE, method = "pearson", use_subset = TRUE)
Arguments
df A data frame, containing the (raw/normalized/transformed) counts
log Logical, whether to convert the input values to log2 (with addition of a pseudo-count). Defaults to FALSE.
method Character string, one of pearson (default), kendall, or spearman as in cor
use_subset Logical value. If TRUE, only 1000 values per sample will be used to speed upthe plotting operations.
Value
A plot with pairwise scatter plots and correlation coefficients

pca2go 13
Examples
library(airway)data(airway)airwaydds_airway <- DESeq2::DESeqDataSetFromMatrix(assay(airway),
colData = colData(airway),design = ~dex+cell)
pair_corr(counts(dds_airway)[1:100, ]) # use just a subset for the example
pca2go Functional interpretation of the principal components
Description
Extracts the genes with the highest loadings for each principal component, and performs functionalenrichment analysis on them using routines and algorithms from the topGO package
Usage
pca2go(se,pca_ngenes = 10000,annotation = NULL,inputType = "geneSymbol",organism = "Mm",ensToGeneSymbol = FALSE,loadings_ngenes = 500,background_genes = NULL,scale = FALSE,return_ranked_gene_loadings = FALSE,annopkg = NULL,...
)
Arguments
se A DESeqTransform object, with data in assay(se), produced for example byeither rlog or varianceStabilizingTransformation
pca_ngenes Number of genes to use for the PCA
annotation A data.frame object, with row.names as gene identifiers (e.g. ENSEMBL ids)and a column, gene_name, containing e.g. HGNC-based gene symbols
inputType Input format type of the gene identifiers. Will be used by the routines of topGO
organism Character abbreviation for the species, using org.XX.eg.db for annotationensToGeneSymbol
Logical, whether to expect ENSEMBL gene identifiers, to convert to gene sym-bols with the annotation provided
14 pca2go
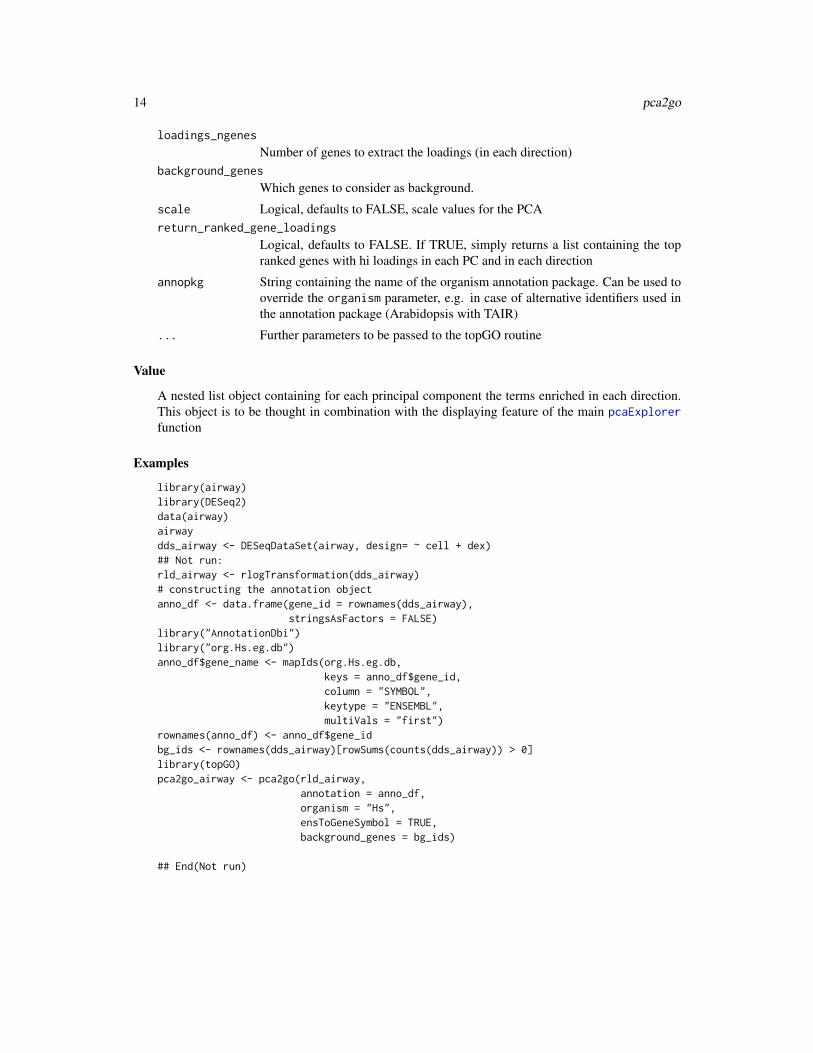
loadings_ngenes
Number of genes to extract the loadings (in each direction)background_genes
Which genes to consider as background.
scale Logical, defaults to FALSE, scale values for the PCAreturn_ranked_gene_loadings
Logical, defaults to FALSE. If TRUE, simply returns a list containing the topranked genes with hi loadings in each PC and in each direction
annopkg String containing the name of the organism annotation package. Can be used tooverride the organism parameter, e.g. in case of alternative identifiers used inthe annotation package (Arabidopsis with TAIR)
... Further parameters to be passed to the topGO routine
Value
A nested list object containing for each principal component the terms enriched in each direction.This object is to be thought in combination with the displaying feature of the main pcaExplorerfunction
Examples
library(airway)library(DESeq2)data(airway)airwaydds_airway <- DESeqDataSet(airway, design= ~ cell + dex)## Not run:rld_airway <- rlogTransformation(dds_airway)# constructing the annotation objectanno_df <- data.frame(gene_id = rownames(dds_airway),
stringsAsFactors = FALSE)library("AnnotationDbi")library("org.Hs.eg.db")anno_df$gene_name <- mapIds(org.Hs.eg.db,
keys = anno_df$gene_id,column = "SYMBOL",keytype = "ENSEMBL",multiVals = "first")
rownames(anno_df) <- anno_df$gene_idbg_ids <- rownames(dds_airway)[rowSums(counts(dds_airway)) > 0]library(topGO)pca2go_airway <- pca2go(rld_airway,
annotation = anno_df,organism = "Hs",ensToGeneSymbol = TRUE,background_genes = bg_ids)
## End(Not run)
pcaExplorer 15
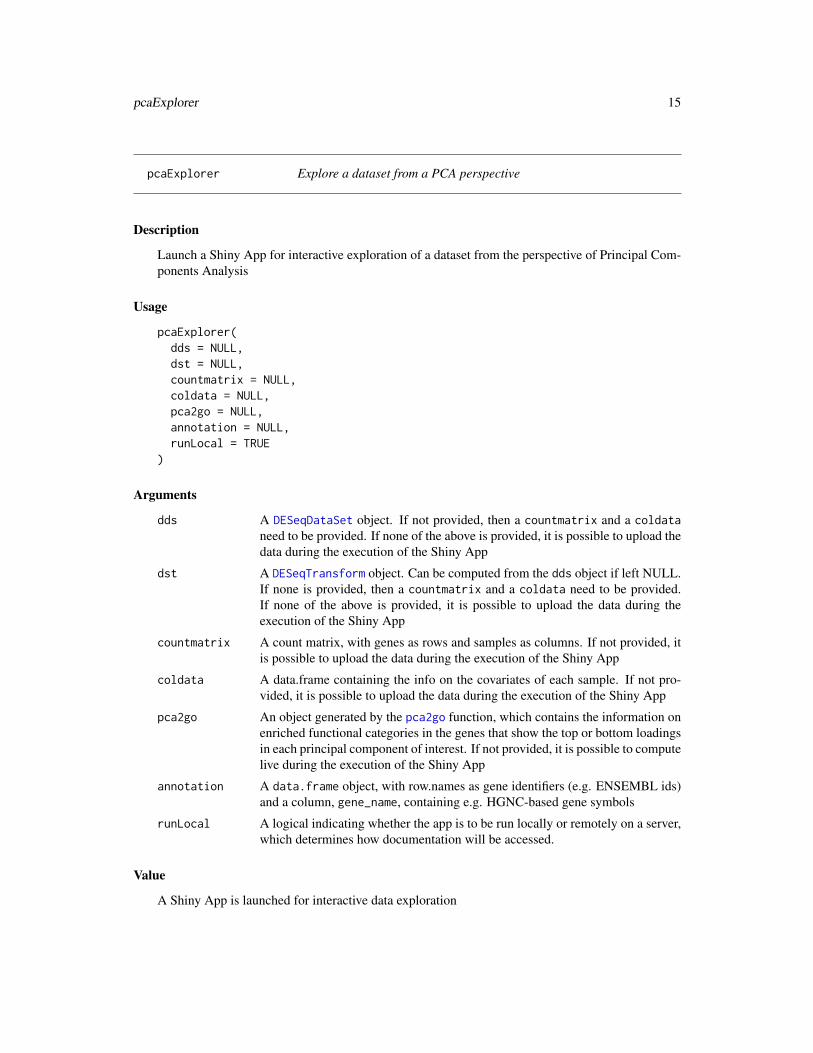
pcaExplorer Explore a dataset from a PCA perspective
Description
Launch a Shiny App for interactive exploration of a dataset from the perspective of Principal Com-ponents Analysis
Usage
pcaExplorer(dds = NULL,dst = NULL,countmatrix = NULL,coldata = NULL,pca2go = NULL,annotation = NULL,runLocal = TRUE
)
Arguments
dds A DESeqDataSet object. If not provided, then a countmatrix and a coldataneed to be provided. If none of the above is provided, it is possible to upload thedata during the execution of the Shiny App
dst A DESeqTransform object. Can be computed from the dds object if left NULL.If none is provided, then a countmatrix and a coldata need to be provided.If none of the above is provided, it is possible to upload the data during theexecution of the Shiny App
countmatrix A count matrix, with genes as rows and samples as columns. If not provided, itis possible to upload the data during the execution of the Shiny App
coldata A data.frame containing the info on the covariates of each sample. If not pro-vided, it is possible to upload the data during the execution of the Shiny App
pca2go An object generated by the pca2go function, which contains the information onenriched functional categories in the genes that show the top or bottom loadingsin each principal component of interest. If not provided, it is possible to computelive during the execution of the Shiny App
annotation A data.frame object, with row.names as gene identifiers (e.g. ENSEMBL ids)and a column, gene_name, containing e.g. HGNC-based gene symbols
runLocal A logical indicating whether the app is to be run locally or remotely on a server,which determines how documentation will be accessed.
Value
A Shiny App is launched for interactive data exploration
16 pcaExplorer-pkg
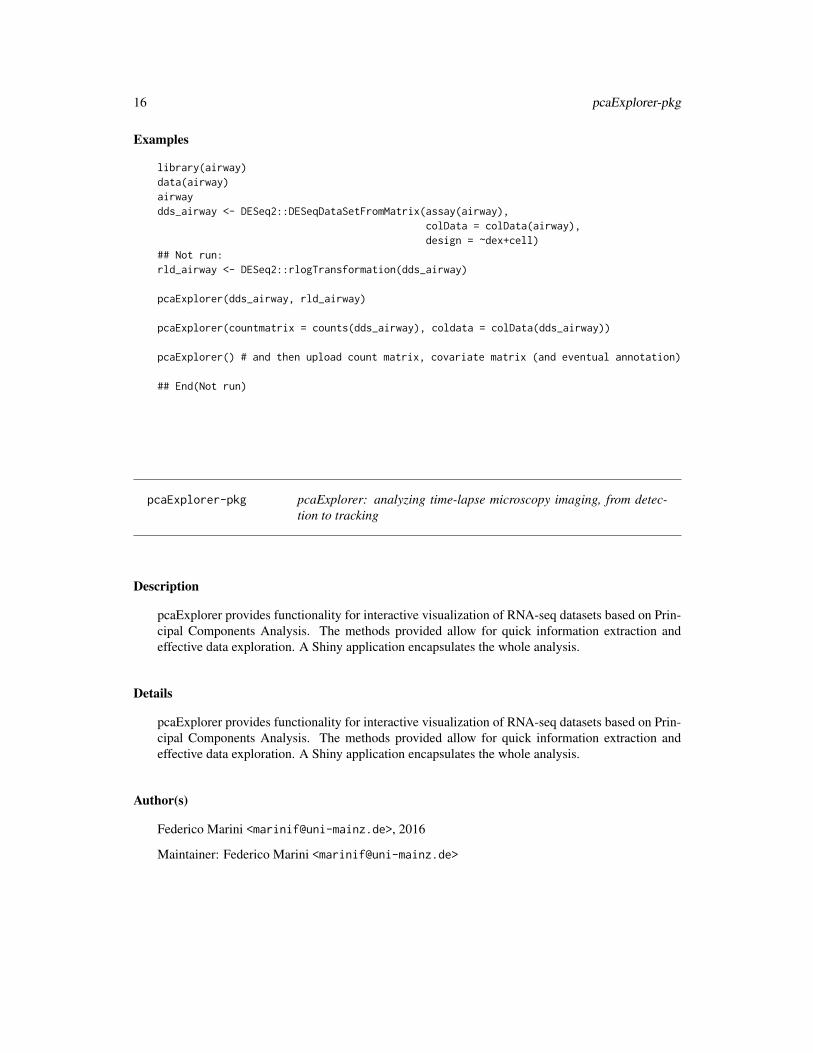
Examples
library(airway)data(airway)airwaydds_airway <- DESeq2::DESeqDataSetFromMatrix(assay(airway),
colData = colData(airway),design = ~dex+cell)
## Not run:rld_airway <- DESeq2::rlogTransformation(dds_airway)
pcaExplorer(dds_airway, rld_airway)
pcaExplorer(countmatrix = counts(dds_airway), coldata = colData(dds_airway))
pcaExplorer() # and then upload count matrix, covariate matrix (and eventual annotation)
## End(Not run)
pcaExplorer-pkg pcaExplorer: analyzing time-lapse microscopy imaging, from detec-tion to tracking
Description
pcaExplorer provides functionality for interactive visualization of RNA-seq datasets based on Prin-cipal Components Analysis. The methods provided allow for quick information extraction andeffective data exploration. A Shiny application encapsulates the whole analysis.
Details
pcaExplorer provides functionality for interactive visualization of RNA-seq datasets based on Prin-cipal Components Analysis. The methods provided allow for quick information extraction andeffective data exploration. A Shiny application encapsulates the whole analysis.
Author(s)
Federico Marini <[email protected]>, 2016
Maintainer: Federico Marini <[email protected]>

pcaplot 17
pcaplot Sample PCA plot for transformed data
Description
Plots the results of PCA on a 2-dimensional space
Usage
pcaplot(x,intgroup = "condition",ntop = 500,returnData = FALSE,title = NULL,pcX = 1,pcY = 2,text_labels = TRUE,point_size = 3,ellipse = TRUE,ellipse.prob = 0.95
)
Arguments
x A DESeqTransform object, with data in assay(x), produced for example byeither rlog or varianceStabilizingTransformation
intgroup Interesting groups: a character vector of names in colData(x) to use for group-ing
ntop Number of top genes to use for principal components, selected by highest rowvariance
returnData logical, if TRUE returns a data.frame for further use, containing the selectedprincipal components and intgroup covariates for custom plotting
title The plot title
pcX The principal component to display on the x axis
pcY The principal component to display on the y axis
text_labels Logical, whether to display the labels with the sample identifiers
point_size Integer, the size of the points for the samples
ellipse Logical, whether to display the confidence ellipse for the selected groups
ellipse.prob Numeric, a value in the interval [0;1)
Value
An object created by ggplot, which can be assigned and further customized.

18 pcaplot3d
Examples
dds <- makeExampleDESeqDataSet_multifac(betaSD_condition = 3, betaSD_tissue = 1)rlt <- DESeq2::rlogTransformation(dds)pcaplot(rlt, ntop = 200)
pcaplot3d Sample PCA plot for transformed data
Description
Plots the results of PCA on a 3-dimensional space, interactively
Usage
pcaplot3d(x,intgroup = "condition",ntop = 500,returnData = FALSE,title = NULL,pcX = 1,pcY = 2,pcZ = 3,text_labels = TRUE,point_size = 3
)
Arguments
x A DESeqTransform object, with data in assay(x), produced for example byeither rlog or varianceStabilizingTransformation
intgroup Interesting groups: a character vector of names in colData(x) to use for group-ing
ntop Number of top genes to use for principal components, selected by highest rowvariance
returnData logical, if TRUE returns a data.frame for further use, containing the selectedprincipal components and intgroup covariates for custom plotting
title The plot title
pcX The principal component to display on the x axis
pcY The principal component to display on the y axis
pcZ The principal component to display on the z axis
text_labels Logical, whether to display the labels with the sample identifiers
point_size Integer, the size of the points for the samples

pcascree 19
Value
A html-based visualization of the 3d PCA plot
Examples
dds <- makeExampleDESeqDataSet_multifac(betaSD_condition = 3, betaSD_tissue = 1)rlt <- DESeq2::rlogTransformation(dds)pcaplot3d(rlt, ntop = 200)
pcascree Scree plot of the PCA on the samples
Description
Produces a scree plot for investigating the proportion of explained variance, or alternatively thecumulative value
Usage
pcascree(obj, type = c("pev", "cev"), pc_nr = NULL, title = NULL)
Arguments
obj A prcomp object
type Display absolute proportions or cumulative proportion. Possible values: "pev"or "cev"
pc_nr How many principal components to display max
title Title of the plot
Value
An object created by ggplot, which can be assigned and further customized.
Examples
dds <- makeExampleDESeqDataSet_multifac(betaSD_condition = 3, betaSD_tissue = 1)rlt <- DESeq2::rlogTransformation(dds)pcaobj <- prcomp(t(SummarizedExperiment::assay(rlt)))pcascree(pcaobj, type = "pev")pcascree(pcaobj, type = "cev", title = "Cumulative explained proportion of variance - Test dataset")

20 topGOtable
plotPCcorrs Plot significance of (cor)relations of covariates VS principal compo-nents
Description
Plots the significance of the (cor)relation of each covariate vs a principal component
Usage
plotPCcorrs(pccorrs, pc = 1, logp = TRUE)
Arguments
pccorrs A data.frame object generated by correlatePCs
pc An integer number, corresponding to the principal component of interest
logp Logical, defaults to TRUE, displays the -log10 of the pvalue instead of the pvalue itself
Value
A base plot object
Examples
library(DESeq2)dds <- makeExampleDESeqDataSet_multifac(betaSD_condition = 3, betaSD_tissue = 1)rlt <- rlogTransformation(dds)pcaobj <- prcomp(t(assay(rlt)))res <- correlatePCs(pcaobj, colData(dds))plotPCcorrs(res)
topGOtable Extract functional terms enriched in the DE genes, based on topGO
Description
A wrapper for extracting functional GO terms enriched in the DE genes, based on the algorithm andthe implementation in the topGO package
topGOtable 21
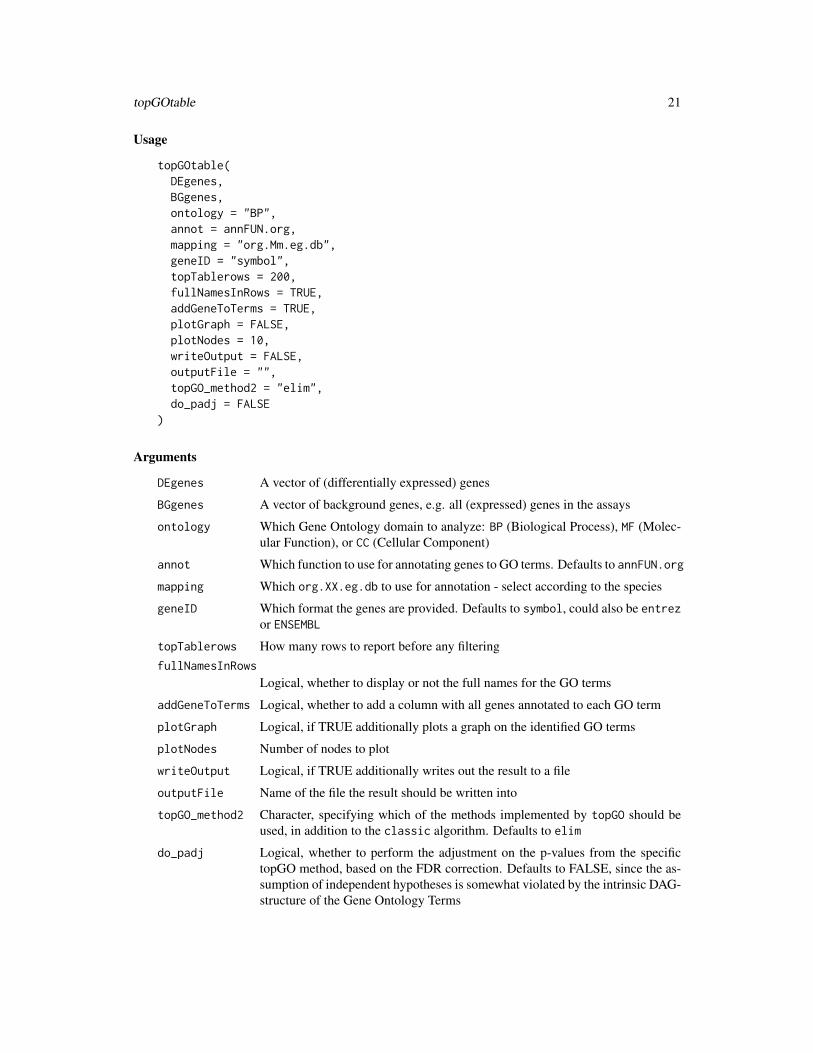
Usage
topGOtable(DEgenes,BGgenes,ontology = "BP",annot = annFUN.org,mapping = "org.Mm.eg.db",geneID = "symbol",topTablerows = 200,fullNamesInRows = TRUE,addGeneToTerms = TRUE,plotGraph = FALSE,plotNodes = 10,writeOutput = FALSE,outputFile = "",topGO_method2 = "elim",do_padj = FALSE
)
Arguments
DEgenes A vector of (differentially expressed) genes
BGgenes A vector of background genes, e.g. all (expressed) genes in the assays
ontology Which Gene Ontology domain to analyze: BP (Biological Process), MF (Molec-ular Function), or CC (Cellular Component)
annot Which function to use for annotating genes to GO terms. Defaults to annFUN.org
mapping Which org.XX.eg.db to use for annotation - select according to the species
geneID Which format the genes are provided. Defaults to symbol, could also be entrezor ENSEMBL
topTablerows How many rows to report before any filteringfullNamesInRows
Logical, whether to display or not the full names for the GO terms
addGeneToTerms Logical, whether to add a column with all genes annotated to each GO term
plotGraph Logical, if TRUE additionally plots a graph on the identified GO terms
plotNodes Number of nodes to plot
writeOutput Logical, if TRUE additionally writes out the result to a file
outputFile Name of the file the result should be written into
topGO_method2 Character, specifying which of the methods implemented by topGO should beused, in addition to the classic algorithm. Defaults to elim
do_padj Logical, whether to perform the adjustment on the p-values from the specifictopGO method, based on the FDR correction. Defaults to FALSE, since the as-sumption of independent hypotheses is somewhat violated by the intrinsic DAG-structure of the Gene Ontology Terms

22 topGOtable
Details
Allowed values assumed by the topGO_method2 parameter are one of the following: elim, weight,weight01, lea, parentchild. For more details on this, please refer to the original documentationof the topGO package itself
Value
A table containing the computed GO Terms and related enrichment scores
Examples
library(airway)library(DESeq2)data(airway)airwaydds_airway <- DESeqDataSet(airway, design= ~ cell + dex)# Example, performing extraction of enriched functional categories in# detected significantly expressed genes## Not run:dds_airway <- DESeq(dds_airway)res_airway <- results(dds_airway)library("AnnotationDbi")library("org.Hs.eg.db")res_airway$symbol <- mapIds(org.Hs.eg.db,
keys = row.names(res_airway),column = "SYMBOL",keytype = "ENSEMBL",multiVals = "first")
res_airway$entrez <- mapIds(org.Hs.eg.db,keys = row.names(res_airway),column = "ENTREZID",keytype = "ENSEMBL",multiVals = "first")
resOrdered <- as.data.frame(res_airway[order(res_airway$padj),])de_df <- resOrdered[resOrdered$padj < .05 & !is.na(resOrdered$padj),]de_symbols <- de_df$symbolbg_ids <- rownames(dds_airway)[rowSums(counts(dds_airway)) > 0]bg_symbols <- mapIds(org.Hs.eg.db,
keys = bg_ids,column = "SYMBOL",keytype = "ENSEMBL",multiVals = "first")
library(topGO)topgoDE_airway <- topGOtable(de_symbols, bg_symbols,
ontology = "BP",mapping = "org.Hs.eg.db",geneID = "symbol")
## End(Not run)

Index
correlatePCs, 2, 20
DESeqDataSet, 4, 7–9, 12, 15DESeqTransform, 3–5, 10, 13, 15, 17, 18distro_expr, 3
geneprofiler, 4genespca, 4get_annotation, 7get_annotation_orgdb, 8getBM, 7
hi_loadings, 9
limmaquickpca2go, 10
makeExampleDESeqDataSet, 12makeExampleDESeqDataSet_multifac, 11mapIds, 8
pair_corr, 12pca2go, 13, 15pcaExplorer, 10, 14, 15pcaExplorer-pkg, 16pcaplot, 17pcaplot3d, 18pcascree, 19plotPCcorrs, 20
rlog, 5, 10, 13, 17, 18
topGOtable, 20
varianceStabilizingTransformation, 5,10, 13, 17, 18
23