PC4A AMR Indicator Framework - London Borough of … and planning/PC4A...PC4A – AMR Indicator...
15
PC4A – AMR Indicator Framework Core Strategy Theme and associated summary objectives AMR Output Indicator & target AMR outcome indicator and target SPATIAL POLICIES AND SITES - Transforming places in line with the borough wide and local visions (S1-6) S-OP1 Strategic Sites Progress S-OP2 Use of S policies i) for refusals; ii) proportion of times supported at appeal (no specific target; should be using regularly if effective, and supported at appeal the majority of times used) S-OUT1 A Place Where People Choose to Live, Work and Stay i) [former H-OUT/C5] Levels of out-migration to other UK authorities ii) Satisfaction with the area - if possible breakdown by CF area , and add in ‘desire to move to a better area’ stats [former CIS-OUT/C4) (Increase or maintenance at a high level (over 75%) SUCCESSFUL PLACES - Place-making (SP1) - Promoting Healthy Urban Planning (SP2) - Securing Quality Urban Design in Places (SP3) - Strategic management of tall buildings (SP4) - Re-valuing of heritage and other assets (SP5) - Promoting quality town SP-OP1 Place-making support i) Up to date (up to 5 years old) Masterplans, site briefs, tall buildings studies and SPDs related to strategic sites and town centres (should be increasing up to number of strategic sites/town centres) ii) [Former LO-EQW5] Environmental improvement a) Environmental Improvement schemes implemented b) Developer contributions for environmental improvement schemes SP-OUT1 Successful Place-making and Quality Urban Design i) [former H-OUT/C4] Crime and fear of crime ii) [former EQW-OUT/C6] Environmental nuisance levels See also S-OUT1 SP-OUT2 Healthier People and Places i) [former EQW-OUT/C7] Mortality rate ii) [Former CIS-OUT/C3] Rates of physical activity,
Transcript of PC4A AMR Indicator Framework - London Borough of … and planning/PC4A...PC4A – AMR Indicator...

PC4A – AMR Indicator Framework
Core Strategy Theme and associated summary objectives
AMR Output Indicator & target AMR outcome indicator and target
SPATIAL POLICIES AND SITES - Transforming places in line with the borough wide and local visions (S1-6)
S-OP1 Strategic Sites Progress S-OP2 Use of S policies i) for refusals; ii) proportion of times supported at appeal (no specific target; should be using regularly if effective, and supported at appeal the majority of times used)
S-OUT1 A Place Where People Choose to Live, Work and Stay i) [former H-OUT/C5] Levels of out-migration to other UK authorities ii) Satisfaction with the area - if possible breakdown by CF area , and add in ‘desire to move to a better area’ stats [former CIS-OUT/C4) (Increase or maintenance at a high level (over 75%)
SUCCESSFUL PLACES - Place-making (SP1) - Promoting Healthy
Urban Planning (SP2) - Securing Quality Urban
Design in Places (SP3) - Strategic management
of tall buildings (SP4) - Re-valuing of heritage
and other assets (SP5) - Promoting quality town
SP-OP1 Place-making support i) Up to date (up to 5 years old) Masterplans, site briefs, tall buildings studies and SPDs related to strategic sites and town centres (should be increasing up to number of strategic sites/town centres) ii) [Former LO-EQW5] Environmental improvement
a) Environmental Improvement schemes implemented
b) Developer contributions for environmental improvement schemes
SP-OUT1 Successful Place-making and Quality Urban Design i) [former H-OUT/C4] Crime and fear of crime ii) [former EQW-OUT/C6] Environmental nuisance levels See also S-OUT1 SP-OUT2 Healthier People and Places i) [former EQW-OUT/C7] Mortality rate ii) [Former CIS-OUT/C3] Rates of physical activity,

PC4A – AMR Indicator Framework
Core Strategy Theme and associated summary objectives
AMR Output Indicator & target AMR outcome indicator and target
and local centres (SP6) - Promoting quality
corridors (SP7)
No specific target, but monitor for ongoing commitment to improvements and adequate mitigation. SP-OP2 Healthy Urban Planning i) No of new takeaways permitted (no specific target: monitor for evidence of downward trend or sustained low levels) ii) Controlling environmental nuisance and health impacts - EnvHealth comments used in planning refusals on A5, A3, A4, B2 and B8 uses - and input of Public Health (Andre) to decisions No specific target: monitor for indication of ongoing influence/commitment to improvements including enforcement and liaison health experts SP-OP3 Securing Quality Urban Design i) [former LO-EQW6] Design Panel activity (No specific target; monitor for effectiveness) ii) [former H6] Building for Life Assessments (Majority good or excellent)
childhood obesity and mortality linked to circulatory diseases iii) Air Quality Exceedences (part former TA-OUT/C4) To be monitored against Host Borough Averages and London average where possible to assess convergence; otherwise monitor for appropriate trends in line with SEA objectives SP-OUT3 Heritage Protection [former EQW-OUT/C2 ] Historic buildings and monuments at risk (decline) SP-OUT4 Town Centre Health [part former BTC-OUT/C6] i) Vacancy Levels and non-retail uses in primary frontages in town centres ii) Historic buildings at risk within defined town centres iii) Quality Leisure: Proportion of leisure uses in town centres that betting shops, amusement arcades and hot food takeaways account for

PC4A – AMR Indicator Framework
Core Strategy Theme and associated summary objectives
AMR Output Indicator & target AMR outcome indicator and target
iii) [former LO-TAN4] Inclusive access improvements (No specific target: monitor for indication of ongoing commitment to improvements) SP-OP4 Strategic direction of tall buildings Proportion of tallest (20 storey plus) buildings permitted outside Stratford Metropolitan and Canning Town town centre (at least 99% should be in these areas) SP-OP5 Re-valuing heritage and other place-making assets i) [former LO-EQW3] Conservation area appraisals and Management Plans in place (Full coverage) ii) Conservation and heritage studies completed as part of masterplanning/strategic site development (No specific target - should relate to SP-OP2i and SP-OP3) iii) [former LO-EQW2] Protected trees lost (No specific target: monitor trend to ensure reasonable protection is being afforded
(i-iii - no specific target, monitor for downward trend or sustained low levels) iv) Perceived improvement to town centres (Stratford/Canning Town) (positive trend) v) Other town centre health indicators as available (monitor for positive trends or stability within healthy parameters)
PC4A – AMR Indicator Framework
Core Strategy Theme and associated summary objectives
AMR Output Indicator & target AMR outcome indicator and target
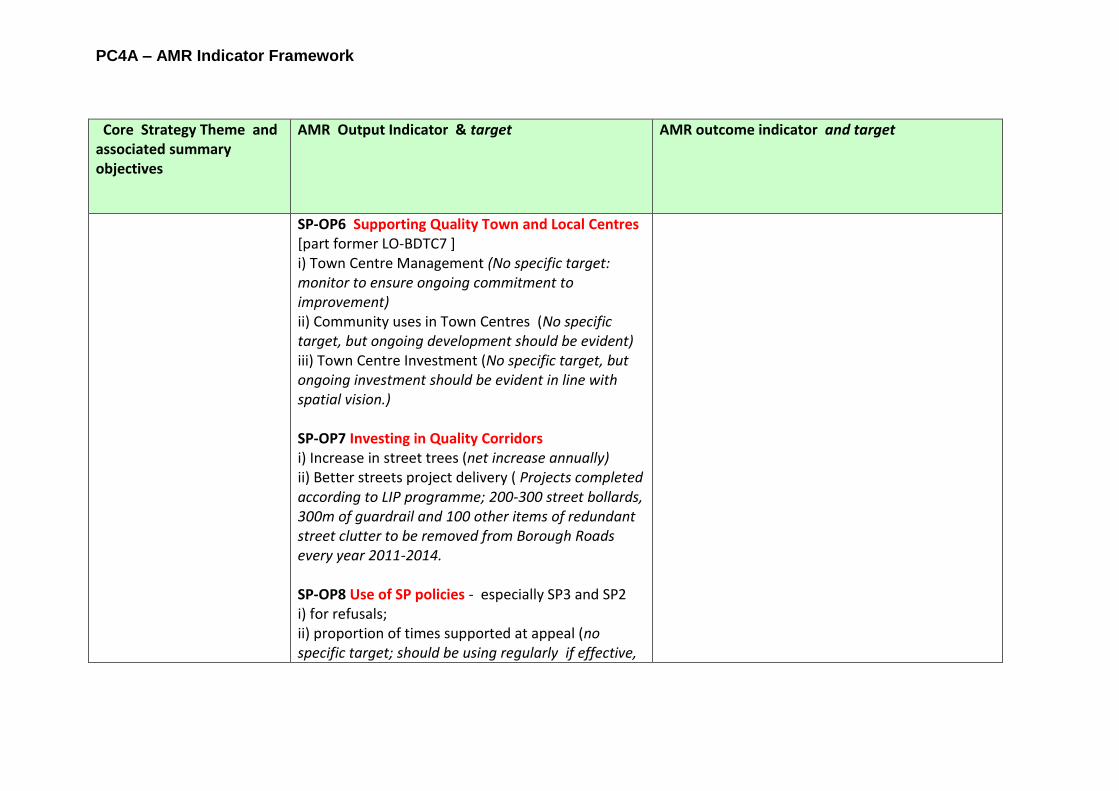
SP-OP6 Supporting Quality Town and Local Centres [part former LO-BDTC7 ] i) Town Centre Management (No specific target: monitor to ensure ongoing commitment to improvement) ii) Community uses in Town Centres (No specific target, but ongoing development should be evident) iii) Town Centre Investment (No specific target, but ongoing investment should be evident in line with spatial vision.) SP-OP7 Investing in Quality Corridors i) Increase in street trees (net increase annually) ii) Better streets project delivery ( Projects completed according to LIP programme; 200-300 street bollards, 300m of guardrail and 100 other items of redundant street clutter to be removed from Borough Roads every year 2011-2014. SP-OP8 Use of SP policies - especially SP3 and SP2 i) for refusals; ii) proportion of times supported at appeal (no specific target; should be using regularly if effective,

PC4A – AMR Indicator Framework
Core Strategy Theme and associated summary objectives
AMR Output Indicator & target AMR outcome indicator and target
and supported at appeal the majority of times used) See also infrastructure monitoring, plus SP-OP1.
JOBS - Promoting investment
in the New Economy (J1)
- Effective use of
employment land (J2) - Enhancing Skills and
access to employment (J3)
J-OP1 Promoting Investment in the New Economy i) [former BD1] Additional employment floorspace (No specific target: maintain trend in line with ongoing development of strategic sites) ii) [former LO-BDTC3] Tourism and leisure development in Stratford and Royal Docks (No specific target - monitor for ongoing development as per strategic site aspirations) iii) Investment in employment hubs (No specific target, but ongoing investment should be evident).
J-OUT1 Economic Development - Business domain i) [former BTC-OUT/C1] Businesses by sector ii) [former BTC-OUT/C4] New business formation and Survival
a) Rate of Business Formation per 10,000 b) 3 year business survival rate
iii) Vacancy rates on Employment Land (should be steady) J-OUT2 Economic Development – employee domain

PC4A – AMR Indicator Framework
Core Strategy Theme and associated summary objectives
AMR Output Indicator & target AMR outcome indicator and target
iv) [former LO-BDTC2] Small business space a) Live/work units b) Small business space (<1000sqm) recorded as
part of larger schemes c) Affordable workspace/local business
occupancy provision (No specific target - continue to add to provision) v) Business Support (no specific target, monitor in line with Regeneration Directorate service plan and for evidence of ongoing S106 negotiations of local procurement) J-OP3 Enhancing skills and access to work i) [part former LO-BDTC6] Employability outputs linked to Planning
a) Workplace Beneficiaries b) Local labour agreements
(a) maintain and increase in line with Council or other targets b) trend commensurate with major development progress) ii) [part former LO-BDTC6] Education and training Facility developments ( Deliver in line with
i) [former BTC-OUT/C2] Jobs, employment and activity Rates ii) [former BTC-OUT/C3] Low earnings and deprivation (proxy) iii) [former BTC-OUT/C5] Proportion of working age population qualified to level 2 or more
To be monitored against Host Borough Averages and London average where possible to assess convergence; otherwise monitor for appropriate trends in line with SEA objectives See also town centre health monitoring – SP-OUT4

PC4A – AMR Indicator Framework
Core Strategy Theme and associated summary objectives
AMR Output Indicator & target AMR outcome indicator and target
infrastructure delivery plan) iii) New childcare provision (target in line with infrastructure needs – annual sufficiency statement) J-OP4 Use of J policies in refusals; proportion of times J policies supported at appeal (no specific target; should be using regularly if effective, and supported at appeal the majority of times used) See also town centre monitoring (SP-OP6 and INF-OP5) and infrastructure monitoring, particularly transport projects.
HOMES - Building Sustainable
Mixed Communities (H1)
- Ensuring people can afford to live locally, as their circumstances change (H2)
- Meeting specialist accommodation needs (H3)
H-OP1 Building Mixed and Balanced Communities i) [former H2] Net additional dwellings and housing trajectory (As per London Plan and core strategy.) ii) [former LO-H1] Housing density (Apply only on major housing developments; no specific target. Monitor against ranges in London Plan for PTAL level, for appropriateness) iii) [part former LO-H2] Housing mix and choice a) Family housing
i. Gain (approvals and completions, monitor all bedroom numbers)
H-OUT1 Housing need (former H-OUT/C1) a) Homeless Households in temporary accommodation b) Number of Households on the Local Authority waiting list H-OUT2 Housing quality (stock condition) [former H-OUT/C2] H-OUT3 Housing affordability [former H-OUT/C3]

PC4A – AMR Indicator Framework
Core Strategy Theme and associated summary objectives
AMR Output Indicator & target AMR outcome indicator and target
- Protecting and Re-shaping existing housing stock (H4)
ii. Houses cf. flats (approvals) (i. 39% 3 bed; ii. No specific target - monitor for
upward trend in terms of proportion of houses ) b) Proportion of units of particular sizes delivered by tenure (including Affordable Rent; no specific target, monitor for more balanced provision, notably upward trend in market provision of family units) c) Overall size mix within tenures (no specific target: monitor for more balanced provision notably upward trend in market provision)
iv) Housing Quality a) Alignment with London Plan space standards (approvals; sample if necessary) b) Existing stock improvements (including enforcement action)
c) Wheelchair homes (net completions) d) Lifetime Homes (net completions)
( a. 100%; b) no specific target – monitor for ongoing action; c) 10% of majors; d) 100%) H-OP2 Affordable housing i) [former H5] Gross affordable housing completions
To be monitored against Host Borough Averages and London average where possible to assess convergence; otherwise monitor for appropriate trends in line with SEA objectives See also S-OUT1 and SP-OUT1 re population churn, quality of design.

PC4A – AMR Indicator Framework
Core Strategy Theme and associated summary objectives
AMR Output Indicator & target AMR outcome indicator and target
(Social Rent, Intermediate and Affordable Rent) ii) % of affordable housing in new development (As per London Plan – 50% of net additional housing for that year, and CS negotiation targets of 35-50%, 60:40 split (65/;35 in Canning Town regeneration areas). H-OP3 Specialist Forms of Housing Net provision of specialist housing (completions) i) Sheltered ii) Extra care iii) Live-work iv) Hostel beds v) Serviced apartments vi) HMOs vii) Specialist student flats viii) Gypsy-traveller pitches (i-vi no specific target, monitor for provision and proportion of housing delivery to check for displacement; vii against GTAA) H-OP4 Protecting and Re-Shaping Existing Housing i) Loss of residential - C2, C3, C4 and HMOs (SG) (via

PC4A – AMR Indicator Framework
Core Strategy Theme and associated summary objectives
AMR Output Indicator & target AMR outcome indicator and target
approvals): a) Net loss to ST lettings b) Net overall loss
ii) [former H4] Loss of family homes (approvals; none) H-OP5 Use of H policies – i) for refusals; ii) proportion of times supported at appeal (no specific target; should be using regularly if effective, and supported at appeal the majority of times used) See also SP-OP3 and SC-OP1/2 and Infrastructure INF-OP5iii
SUSTAINABILITY AND CLIMATE CHANGE - Climate Change
Adaptation and Mitigation (SC1)
- Reducing Carbon Emissions (SC2)
- Managing Flood Risk (SC3)
SC-OP1/2: Climate change adaptation and mitigation and reducing carbon emissions BREAAM and Code for Sustainable Homes Scores of major consents(100% of major consents to meet Code level 4/BREEAM Very Good or subsequent standard) SC-OP3 Managing Flood Risk i) Planning permissions granted contrary to EA advice
SC-OUT1 Resource use efficiency [Part EQW-OUT/C1, part H-OUT/C6] i) Water consumption per capita ii) CO2 emissions (proxy for energy) iii) Environmental performance of housing stock
SC-OUT2 Environmental Protection and Enhancement i) [former EQW-OUT/C3] Amount of natural green

PC4A – AMR Indicator Framework
Core Strategy Theme and associated summary objectives
AMR Output Indicator & target AMR outcome indicator and target
- Promoting and Enhancing Biodiversity (SC4)
([former E1] Zero, subject to careful analysis of conditions etc that often address their concerns) ii) Flood protection projects delivered as part of consents and otherwise (to be monitored in line with Infrastructure Delivery Plan) SC-OP4 Promoting and enhancing biodiversity i) Biodiversity enhancements to be delivered as part of major consents ii) [former E2] Changes in areas of biodiversity importance (No net loss) SC-OP5 Use of SC policies i) for refusals; ii) proportion of times upheld at appeal (no specific target; should be using regularly if effective, and supported at appeal the majority of times used as a refusal reason) See also infrastructure indicators INF-OP1-4
space (SINCs and area deficient in nature conservation interest) ii) [former EQW-OUT/C5] River water quality To be monitored against Host Borough Averages and London average where possible to assess convergence; otherwise monitor for appropriate trends in line with SEA objectives

PC4A – AMR Indicator Framework
Core Strategy Theme and associated summary objectives
AMR Output Indicator & target AMR outcome indicator and target
INFRASTRUCTURE - Secure strategic
transport investment (INF1)
- Secure a more sustainable pattern of movement (INF2)
- Improve the sustainability of waste management (INF3)
- Secure the delivery o f local heat and power networks (INF4)
- Strategically manage town and local centres as part of a network and hierarchy (INF5)
- Improve the quality and quantity of open space (INF6)
- Protect and enhance the Blue Ribbon network (INF7)
INF-OP1 Securing Strategic Transport Investment - [former LO-TA1] Milestones in transport schemes ( Monitor as per Infrastructure Delivery Plan ) INF-OP2 Promoting a more sustainable pattern of movement i) [former LO-TAN5] School travel plans in place (Complete coverage) ii) [part former LO-CIS1, part LO-TA2] New development – accessibility (PTAL) and access to infrastructure and employment (No specific target: ongoing improvements should be evident) iii) Cycle parking (L Plan minima achieved; also 200 cycle parking spaces on street p.a) iv) Electric charging points (No specific target – monitor to show increase) INF-OP3 Securing more sustainable waste management [former W1] New waste management facilities [Monitor in line with Infrastructure Delivery Plan, bearing in mind sub-regional waste apportionment and management]
INF-OUT1 Better Transport and Connectivity i) Modal shift a) Walking mode share Percentage of personal walking trips originating in borough, (39.0% 2007/8-2009/10 average; 39.3% share in 2014; 40.5% by 2026) b) Cycling mode share cycling trips originating in borough (average day, 7 day week; Baseline: 1.0% 2007-10 average; Short term target 1.7% by 2014 Longer term target 4.5% by 2026) ii) [former TA-OUT/C2] Traffic volume and congestion (proxy) (Excess waiting time: 1.2 minutes 2014, 1.3 minutes 2018; Bus journey time route no. 25 eastbound, PM peak 14.34 minutes 2014 to be maintained to 2018; Bus journey time route no. 115 eastbound, PM peak 17.17 minutes 2014, to be maintained to 2018; Bus journey time route 300, northbound, PM peak, 6.79 minutes 2014, to be maintained to 2018) iii) Road traffic casualties (KSIs) - Percentage change per million vehicle km from 1994-1998 average. (89.09 end 2013/14 (2010-2012 three year average); 83.52 end 2020/21 (2017-2019 three

PC4A – AMR Indicator Framework
Core Strategy Theme and associated summary objectives
AMR Output Indicator & target AMR outcome indicator and target
- Ensure community facilities keep pace with needs (INF8)
- Provide for appropriate delivery mechanisms and monitoring (INF9)
INF-OP4 Promoting Local Heat and Power Networks Energy projects delivered /KM of heat network delivered (to be monitored in line with Infrastructure Delivery Plan, should show a sustained increase in heat network infrastructure) INF-OP5 Strategic Management of the Town Centre Network i) [former BD4] Floorspace for town centre uses Increase in proportion in town centres, subject to strategic regeneration ambitions elsewhere in the borough. ii) Delivery of town centre strategic sites and new local centres as part of strategic sites Iin line with timescales envisaged in sites schedule) iii) [part LO-BDTC7] Conversion of out of centre commercial to residential use (no specific target, but should be a sustained pattern) INF-OP6/7 Securing Improvements to Open Space and the blue ribbon network [part former LO-EQW1, part LO-CIS3]
year average) against base line 92.8 per mvk.)
INF-OUT2 Environmental impacts of transport [former TA-OUT/C4] i) Complaints about transport noise ii) Transport related CO2 emissions See also SP-OUT2iii INF-OUT3 More Sustainable Waste Management [part former EQW-OUT/C1] i) Proportion of waste dealt with within the
borough/ELWA area (no specific target- ii) [former W2] Waste arising by management type
(Increase recovery (recycling and composting) and reduce landfill. Recycling and composting waste (Municipal Solid Waste) baseline 40% in 2011; targets 45% in 2016; 50% in 2021; C, E and D (construction, excavation and demolition) waste: 95% in 2020; C&I (commercial and industrial waste) 56% in 2011; 64% in 2016; 70% in 2021)

PC4A – AMR Indicator Framework
Core Strategy Theme and associated summary objectives
AMR Output Indicator & target AMR outcome indicator and target
i) Open space losses and gains ii) Open space improvements iii) Blue ribbon improvements - to access etc (No net loss over 5 year period and increases/improvements in line with Infrastructure Delivery Plan and policies.)
INF-OP8 Ensuring community facilities keep pace with need i) [former LO-CIS2] Net new community infrastructure floorspace in new and established neighbourhoods (strategic sites in the Arc cf. Urban Newham; no specific target: monitor alongside Infrastructure Delivery Plan to show ongoing commitment to improvements in Urban Newham and elsewhere, with no net loss unless balanced by changes in access/multi-purpose facilities) ii) Provision of multi-purpose community facilities (100% of community facilities should be multi-purpose INF-OP9 Securing Appropriate Infrastructure Delivery Mechanisms
INF-OUT4 Open Space Quality [former CIS-OUT/C2] i) Proportion of Parks with Green Flag status ii) Satisfaction with Parks (No specific target, should be increasing or steady) INF-OUT5 Infrastructure Sufficiency i) [former CIS-OUT/C1] Distribution of key
community facilities in the borough (proxy; no specific target, monitor reasonable distribution according to population
ii) Any other data on infrastructure sufficiency (No specific target, deficiencies should be reducing)

PC4A – AMR Indicator Framework
Core Strategy Theme and associated summary objectives
AMR Output Indicator & target AMR outcome indicator and target
i) [former LO-CIS3] Developer contributions for community infrastructure and open space improvements (Secured – Spent – Received by category and CF Area, plus case studies to show percent funded by S106 ; no specific target: monitor to show ongoing commitment to provision as part of development, alongside Infrastructure Delivery Plan) ii) CIL Charging Schedule and Receipts /Spend (in place by mid 2013; receipts in line with expectations) iii) Overall IDP progress and other infrastructure delivery mechanisms (joint working etc) (in line with IDP timescales etc) INF-OP10 Use of INF policies i) for refusals; ii) proportion of times supported at appeal (no specific target; should be using regularly if effective, and supported at appeal the majority of times used) See also SC-OP3 and SP-OP7