PC - Monsoon and agriculturebackoffice.phillipcapital.in/Backoffice/Researchfiles/PC...Monsoon and...
26
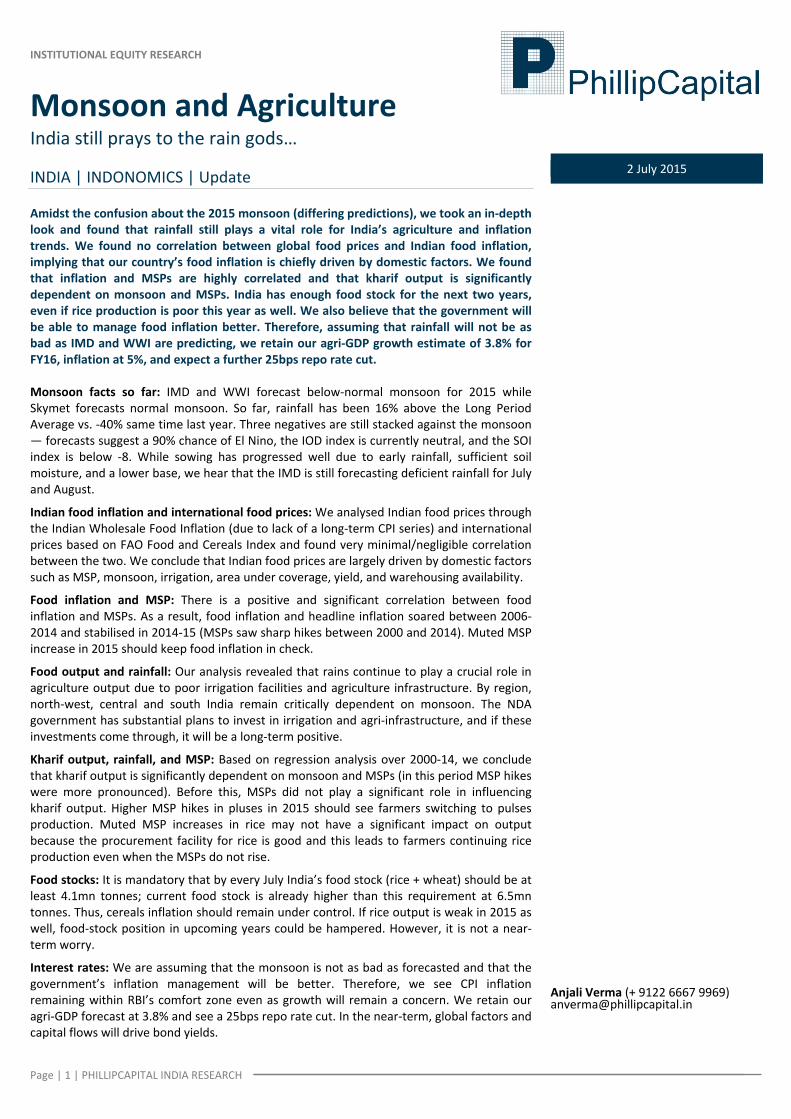
INSTITUTIONAL EQUITY RESEARCH Page | 1 | PHILLIPCAPITAL INDIA RESEARCH Monsoon and Agriculture India still prays to the rain gods… INDIA | INDONOMICS | Update 2 July 2015 Amidst the confusion about the 2015 monsoon (differing predictions), we took an in‐depth look and found that rainfall still plays a vital role for India’s agriculture and inflation trends. We found no correlation between global food prices and Indian food inflation, implying that our country’s food inflation is chiefly driven by domestic factors. We found that inflation and MSPs are highly correlated and that kharif output is significantly dependent on monsoon and MSPs. India has enough food stock for the next two years, even if rice production is poor this year as well. We also believe that the government will be able to manage food inflation better. Therefore, assuming that rainfall will not be as bad as IMD and WWI are predicting, we retain our agri‐GDP growth estimate of 3.8% for FY16, inflation at 5%, and expect a further 25bps repo rate cut. Monsoon facts so far: IMD and WWI forecast below‐normal monsoon for 2015 while Skymet forecasts normal monsoon. So far, rainfall has been 16% above the Long Period Average vs. ‐40% same time last year. Three negatives are still stacked against the monsoon — forecasts suggest a 90% chance of El Nino, the IOD index is currently neutral, and the SOI index is below ‐8. While sowing has progressed well due to early rainfall, sufficient soil moisture, and a lower base, we hear that the IMD is still forecasting deficient rainfall for July and August. Indian food inflation and international food prices: We analysed Indian food prices through the Indian Wholesale Food Inflation (due to lack of a long‐term CPI series) and international prices based on FAO Food and Cereals Index and found very minimal/negligible correlation between the two. We conclude that Indian food prices are largely driven by domestic factors such as MSP, monsoon, irrigation, area under coverage, yield, and warehousing availability. Food inflation and MSP: There is a positive and significant correlation between food inflation and MSPs. As a result, food inflation and headline inflation soared between 2006‐ 2014 and stabilised in 2014‐15 (MSPs saw sharp hikes between 2000 and 2014). Muted MSP increase in 2015 should keep food inflation in check. Food output and rainfall: Our analysis revealed that rains continue to play a crucial role in agriculture output due to poor irrigation facilities and agriculture infrastructure. By region, north‐west, central and south India remain critically dependent on monsoon. The NDA government has substantial plans to invest in irrigation and agri‐infrastructure, and if these investments come through, it will be a long‐term positive. Kharif output, rainfall, and MSP: Based on regression analysis over 2000‐14, we conclude that kharif output is significantly dependent on monsoon and MSPs (in this period MSP hikes were more pronounced). Before this, MSPs did not play a significant role in influencing kharif output. Higher MSP hikes in pluses in 2015 should see farmers switching to pulses production. Muted MSP increases in rice may not have a significant impact on output because the procurement facility for rice is good and this leads to farmers continuing rice production even when the MSPs do not rise. Food stocks: It is mandatory that by every July India’s food stock (rice + wheat) should be at least 4.1mn tonnes; current food stock is already higher than this requirement at 6.5mn tonnes. Thus, cereals inflation should remain under control. If rice output is weak in 2015 as well, food‐stock position in upcoming years could be hampered. However, it is not a near‐ term worry. Interest rates: We are assuming that the monsoon is not as bad as forecasted and that the government’s inflation management will be better. Therefore, we see CPI inflation remaining within RBI’s comfort zone even as growth will remain a concern. We retain our agri‐GDP forecast at 3.8% and see a 25bps repo rate cut. In the near‐term, global factors and capital flows will drive bond yields. Anjali Verma (+ 9122 6667 9969) [email protected]
Transcript of PC - Monsoon and agriculturebackoffice.phillipcapital.in/Backoffice/Researchfiles/PC...Monsoon and...
INSTITUTIONAL EQUITY RESEARCH
Page | 1 | PHILLIPCAPITAL INDIA RESEARCH
Monsoon and Agriculture India still prays to the rain gods… INDIA | INDONOMICS | Update
2 July 2015
Amidst the confusion about the 2015 monsoon (differing predictions), we took an in‐depth look and found that rainfall still plays a vital role for India’s agriculture and inflation trends. We found no correlation between global food prices and Indian food inflation, implying that our country’s food inflation is chiefly driven by domestic factors. We found that inflation and MSPs are highly correlated and that kharif output is significantly dependent on monsoon and MSPs. India has enough food stock for the next two years, even if rice production is poor this year as well. We also believe that the government will be able to manage food inflation better. Therefore, assuming that rainfall will not be as bad as IMD and WWI are predicting, we retain our agri‐GDP growth estimate of 3.8% for FY16, inflation at 5%, and expect a further 25bps repo rate cut. Monsoon facts so far: IMD and WWI forecast below‐normal monsoon for 2015 while Skymet forecasts normal monsoon. So far, rainfall has been 16% above the Long Period Average vs. ‐40% same time last year. Three negatives are still stacked against the monsoon — forecasts suggest a 90% chance of El Nino, the IOD index is currently neutral, and the SOI index is below ‐8. While sowing has progressed well due to early rainfall, sufficient soil moisture, and a lower base, we hear that the IMD is still forecasting deficient rainfall for July and August.
Indian food inflation and international food prices: We analysed Indian food prices through the Indian Wholesale Food Inflation (due to lack of a long‐term CPI series) and international prices based on FAO Food and Cereals Index and found very minimal/negligible correlation between the two. We conclude that Indian food prices are largely driven by domestic factors such as MSP, monsoon, irrigation, area under coverage, yield, and warehousing availability.
Food inflation and MSP: There is a positive and significant correlation between food inflation and MSPs. As a result, food inflation and headline inflation soared between 2006‐2014 and stabilised in 2014‐15 (MSPs saw sharp hikes between 2000 and 2014). Muted MSP increase in 2015 should keep food inflation in check.
Food output and rainfall: Our analysis revealed that rains continue to play a crucial role in agriculture output due to poor irrigation facilities and agriculture infrastructure. By region, north‐west, central and south India remain critically dependent on monsoon. The NDA government has substantial plans to invest in irrigation and agri‐infrastructure, and if these investments come through, it will be a long‐term positive.
Kharif output, rainfall, and MSP: Based on regression analysis over 2000‐14, we conclude that kharif output is significantly dependent on monsoon and MSPs (in this period MSP hikes were more pronounced). Before this, MSPs did not play a significant role in influencing kharif output. Higher MSP hikes in pluses in 2015 should see farmers switching to pulses production. Muted MSP increases in rice may not have a significant impact on output because the procurement facility for rice is good and this leads to farmers continuing rice production even when the MSPs do not rise.
Food stocks: It is mandatory that by every July India’s food stock (rice + wheat) should be at least 4.1mn tonnes; current food stock is already higher than this requirement at 6.5mn tonnes. Thus, cereals inflation should remain under control. If rice output is weak in 2015 as well, food‐stock position in upcoming years could be hampered. However, it is not a near‐term worry.
Interest rates: We are assuming that the monsoon is not as bad as forecasted and that the government’s inflation management will be better. Therefore, we see CPI inflation remaining within RBI’s comfort zone even as growth will remain a concern. We retain our agri‐GDP forecast at 3.8% and see a 25bps repo rate cut. In the near‐term, global factors and capital flows will drive bond yields.
Anjali Verma (+ 9122 6667 9969) [email protected]
Page | 2 | PHILLIPCAPITAL INDIA RESEARCH
INDONOMICS UPDATE
While IMD has forecasted a below‐normal monsoon in 2015, for now, rainfall is 16% ahead of LPA (lower than 26% above LPA a week back – implying risks still persist if pace weakens in the coming months). In this report, we looked at the crucial (or not so crucial) role that monsoon plays for Indian agriculture output, inflation, and MSPs. We also analysed the government’s ability to manage food inflation through imports and policy actions, in case of adverse monsoon impact.
Monsoon: The facts so far… The various monsoon forecasts: While IMD and World Weather Inc predict below‐normal monsoon, Skymet says it will be normal. • IMD’s forecast – below normal at 88% of LPA: The Indian Meteorological
Department has forecasted that 2015 monsoon will be 12% lower than the Long Period Average (LPA) with deficiency across zones. IMD’s forecast by region: North‐West India 85% of LPA Deficient Central India 90% of LPA Below normal North‐East India 90% of LPA Below normal South Peninsula 92% of LPA Below normal
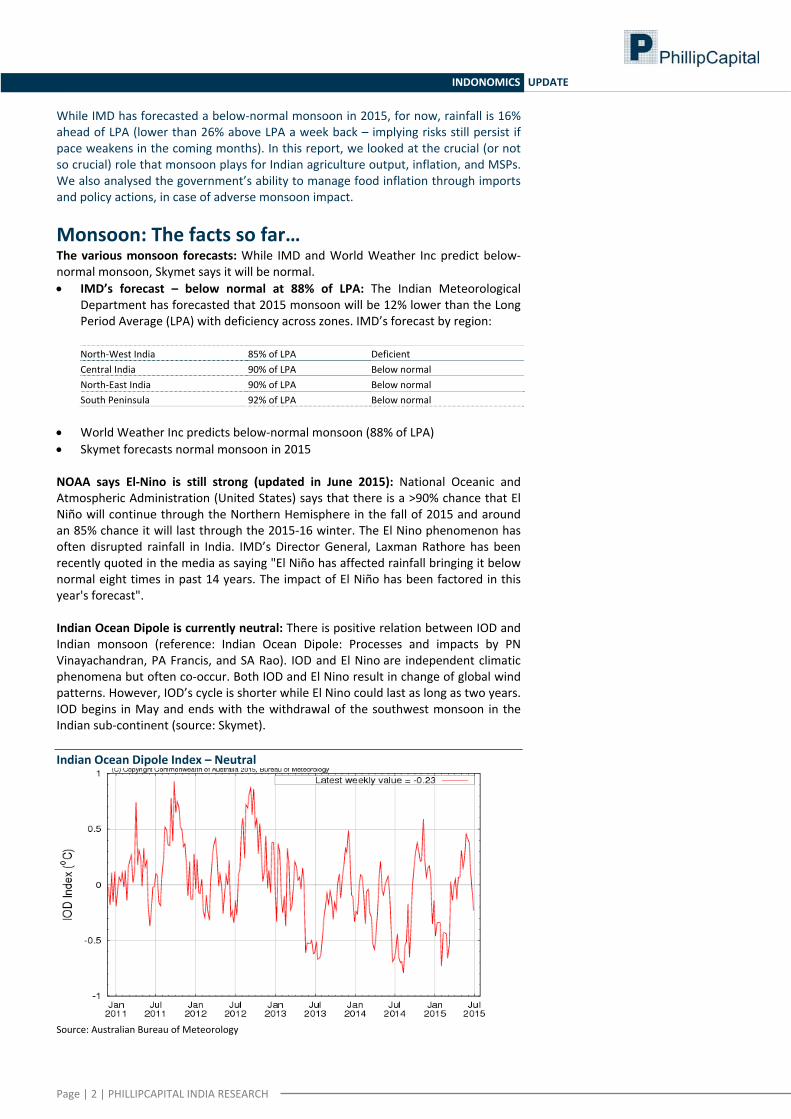
• World Weather Inc predicts below‐normal monsoon (88% of LPA) • Skymet forecasts normal monsoon in 2015 NOAA says El‐Nino is still strong (updated in June 2015): National Oceanic and Atmospheric Administration (United States) says that there is a >90% chance that El Niño will continue through the Northern Hemisphere in the fall of 2015 and around an 85% chance it will last through the 2015‐16 winter. The El Nino phenomenon has often disrupted rainfall in India. IMD’s Director General, Laxman Rathore has been recently quoted in the media as saying "El Niño has affected rainfall bringing it below normal eight times in past 14 years. The impact of El Niño has been factored in this year's forecast". Indian Ocean Dipole is currently neutral: There is positive relation between IOD and Indian monsoon (reference: Indian Ocean Dipole: Processes and impacts by PN Vinayachandran, PA Francis, and SA Rao). IOD and El Nino are independent climatic phenomena but often co‐occur. Both IOD and El Nino result in change of global wind patterns. However, IOD’s cycle is shorter while El Nino could last as long as two years. IOD begins in May and ends with the withdrawal of the southwest monsoon in the Indian sub‐continent (source: Skymet). Indian Ocean Dipole Index – Neutral
Source: Australian Bureau of Meteorology
Page | 3 | PHILLIPCAPITAL INDIA RESEARCH
INDONOMICS UPDATE
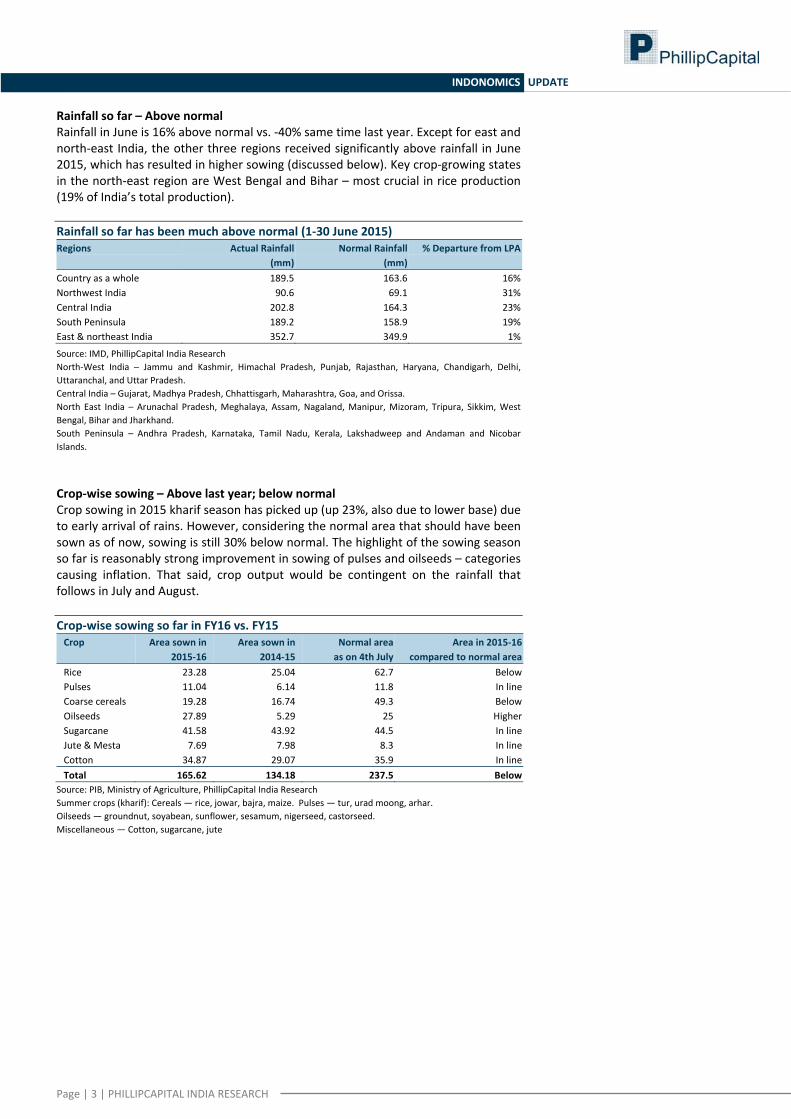
Rainfall so far – Above normal Rainfall in June is 16% above normal vs. ‐40% same time last year. Except for east and north‐east India, the other three regions received significantly above rainfall in June 2015, which has resulted in higher sowing (discussed below). Key crop‐growing states in the north‐east region are West Bengal and Bihar – most crucial in rice production (19% of India’s total production). Rainfall so far has been much above normal (1‐30 June 2015) Regions Actual Rainfall Normal Rainfall % Departure from LPA
(mm) (mm) Country as a whole 189.5 163.6 16%Northwest India 90.6 69.1 31%Central India 202.8 164.3 23%South Peninsula 189.2 158.9 19%East & northeast India 352.7 349.9 1%
Source: IMD, PhillipCapital India Research North‐West India – Jammu and Kashmir, Himachal Pradesh, Punjab, Rajasthan, Haryana, Chandigarh, Delhi, Uttaranchal, and Uttar Pradesh. Central India – Gujarat, Madhya Pradesh, Chhattisgarh, Maharashtra, Goa, and Orissa. North East India – Arunachal Pradesh, Meghalaya, Assam, Nagaland, Manipur, Mizoram, Tripura, Sikkim, West Bengal, Bihar and Jharkhand. South Peninsula – Andhra Pradesh, Karnataka, Tamil Nadu, Kerala, Lakshadweep and Andaman and Nicobar Islands. Crop‐wise sowing – Above last year; below normal Crop sowing in 2015 kharif season has picked up (up 23%, also due to lower base) due to early arrival of rains. However, considering the normal area that should have been sown as of now, sowing is still 30% below normal. The highlight of the sowing season so far is reasonably strong improvement in sowing of pulses and oilseeds – categories causing inflation. That said, crop output would be contingent on the rainfall that follows in July and August. Crop‐wise sowing so far in FY16 vs. FY15 Crop Area sown in
2015‐16 Area sown in
2014‐15 Normal area as on 4th July
Area in 2015‐16 compared to normal area
Rice 23.28 25.04 62.7 BelowPulses 11.04 6.14 11.8 In lineCoarse cereals 19.28 16.74 49.3 BelowOilseeds 27.89 5.29 25 HigherSugarcane 41.58 43.92 44.5 In lineJute & Mesta 7.69 7.98 8.3 In lineCotton 34.87 29.07 35.9 In lineTotal 165.62 134.18 237.5 Below
Source: PIB, Ministry of Agriculture, PhillipCapital India Research Summer crops (kharif): Cereals — rice, jowar, bajra, maize. Pulses — tur, urad moong, arhar. Oilseeds — groundnut, soyabean, sunflower, sesamum, nigerseed, castorseed. Miscellaneous — Cotton, sugarcane, jute
Page | 4 | PHILLIPCAPITAL INDIA RESEARCH
INDONOMICS UPDATE
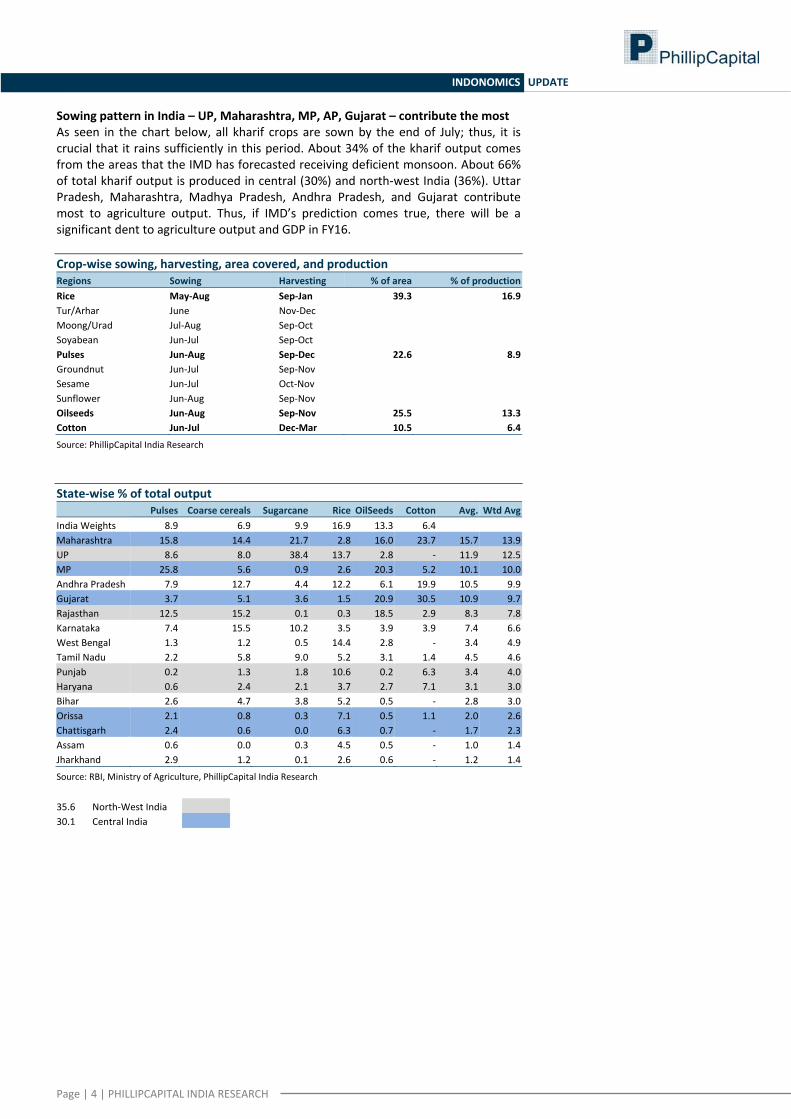
Sowing pattern in India – UP, Maharashtra, MP, AP, Gujarat – contribute the most As seen in the chart below, all kharif crops are sown by the end of July; thus, it is crucial that it rains sufficiently in this period. About 34% of the kharif output comes from the areas that the IMD has forecasted receiving deficient monsoon. About 66% of total kharif output is produced in central (30%) and north‐west India (36%). Uttar Pradesh, Maharashtra, Madhya Pradesh, Andhra Pradesh, and Gujarat contribute most to agriculture output. Thus, if IMD’s prediction comes true, there will be a significant dent to agriculture output and GDP in FY16. Crop‐wise sowing, harvesting, area covered, and production Regions Sowing Harvesting % of area % of productionRice May‐Aug Sep‐Jan 39.3 16.9Tur/Arhar June Nov‐Dec Moong/Urad Jul‐Aug Sep‐Oct Soyabean Jun‐Jul Sep‐Oct Pulses Jun‐Aug Sep‐Dec 22.6 8.9Groundnut Jun‐Jul Sep‐Nov Sesame Jun‐Jul Oct‐Nov Sunflower Jun‐Aug Sep‐Nov Oilseeds Jun‐Aug Sep‐Nov 25.5 13.3Cotton Jun‐Jul Dec‐Mar 10.5 6.4
Source: PhillipCapital India Research State‐wise % of total output
Pulses Coarse cereals Sugarcane Rice OilSeeds Cotton Avg. Wtd AvgIndia Weights 8.9 6.9 9.9 16.9 13.3 6.4Maharashtra 15.8 14.4 21.7 2.8 16.0 23.7 15.7 13.9UP 8.6 8.0 38.4 13.7 2.8 ‐ 11.9 12.5MP 25.8 5.6 0.9 2.6 20.3 5.2 10.1 10.0Andhra Pradesh 7.9 12.7 4.4 12.2 6.1 19.9 10.5 9.9Gujarat 3.7 5.1 3.6 1.5 20.9 30.5 10.9 9.7Rajasthan 12.5 15.2 0.1 0.3 18.5 2.9 8.3 7.8Karnataka 7.4 15.5 10.2 3.5 3.9 3.9 7.4 6.6West Bengal 1.3 1.2 0.5 14.4 2.8 ‐ 3.4 4.9Tamil Nadu 2.2 5.8 9.0 5.2 3.1 1.4 4.5 4.6Punjab 0.2 1.3 1.8 10.6 0.2 6.3 3.4 4.0Haryana 0.6 2.4 2.1 3.7 2.7 7.1 3.1 3.0Bihar 2.6 4.7 3.8 5.2 0.5 ‐ 2.8 3.0Orissa 2.1 0.8 0.3 7.1 0.5 1.1 2.0 2.6Chattisgarh 2.4 0.6 0.0 6.3 0.7 ‐ 1.7 2.3Assam 0.6 0.0 0.3 4.5 0.5 ‐ 1.0 1.4Jharkhand 2.9 1.2 0.1 2.6 0.6 ‐ 1.2 1.4
Source: RBI, Ministry of Agriculture, PhillipCapital India Research
35.6 North‐West India 30.1 Central India
Page | 5 | PHILLIPCAPITAL INDIA RESEARCH
INDONOMICS UPDATE
Kharif crop matrix In order to gauge production and prices of respective commodities and Indian agriculture output, we looked at key kharif crops, their state‐wise production, exports, imports, area under cultivation, yield, MSPs, and domestic and international price scenarios. • Crucial states: Key kharif crop‐producing states are Uttar Pradesh, Maharashtra,
Madhya Pradesh, Andhra Pradesh, Gujarat, Rajasthan, and Karnataka. • Exports: Agri exports to India’s total exports were at 10% in FY15 similar to FY14.
Highest share is that of rice (2.5% of India’s total exports) followed by 1.6% of buffalo meat. In general, the Indian government discourages agri exports in order to meet domestic demand and for inflation management.
• Imports: Agri imports formed 3.5% of India’s total imports in FY15 vs. 2.5% in FY14. Imports of kharif crops are negligible; the highest share is that of edible oil (2.0‐2.5%) followed by pulses (0.5‐1.0%). We expect pulses imports to be higher in FY16.
• Area under cultivation: Maximum agrarian area is covered by rice (39%)/ wheat (28%), followed by oilseeds (26%) coarse cereals (23%), pulses (23%), and cotton (10%).
• Yield: Rice enjoys the highest yield (2,424 kg/hectare), followed by coarse cereals (1677), oilseeds (1153), pulses (764), and cotton (532).
• Production: Stagnant across segments. • Domestic prices: Domestically, prices are contained for rice, sugar, cotton, and
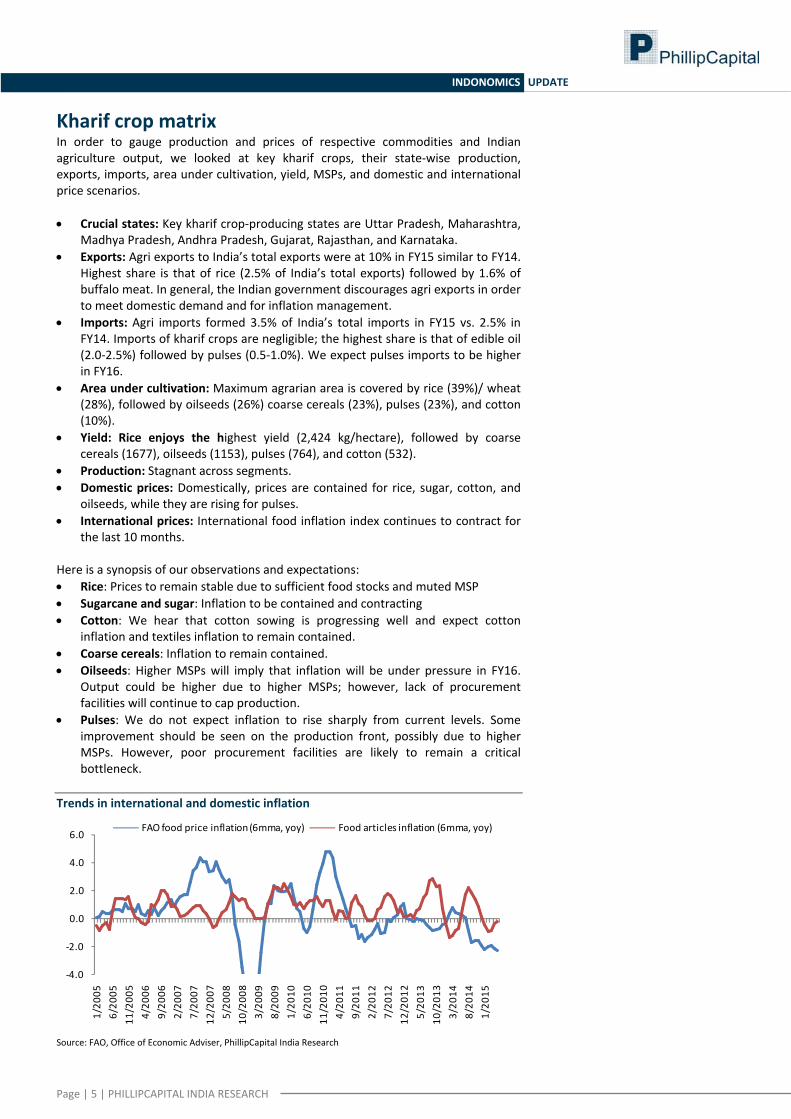
oilseeds, while they are rising for pulses. • International prices: International food inflation index continues to contract for
the last 10 months. Here is a synopsis of our observations and expectations: • Rice: Prices to remain stable due to sufficient food stocks and muted MSP • Sugarcane and sugar: Inflation to be contained and contracting • Cotton: We hear that cotton sowing is progressing well and expect cotton
inflation and textiles inflation to remain contained. • Coarse cereals: Inflation to remain contained. • Oilseeds: Higher MSPs will imply that inflation will be under pressure in FY16.
Output could be higher due to higher MSPs; however, lack of procurement facilities will continue to cap production.
• Pulses: We do not expect inflation to rise sharply from current levels. Some improvement should be seen on the production front, possibly due to higher MSPs. However, poor procurement facilities are likely to remain a critical bottleneck.
Trends in international and domestic inflation
‐4.0
‐2.0
0.0
2.0
4.0
6.0
1/20
056/20
0511
/200
54/20
069/20
062/20
077/20
0712
/200
75/20
0810
/200
83/20
098/20
091/20
106/20
1011
/201
04/20
119/20
112/20
127/20
1212
/201
25/20
1310
/201
33/20
148/20
141/20
15
FAO food price inflation (6mma, yoy) Food articles inflation (6mma, yoy)
Source: FAO, Office of Economic Adviser, PhillipCapital India Research
Page | 6 | PHILLIPCAPITAL INDIA RESEARCH
INDONOMICS UPDATE
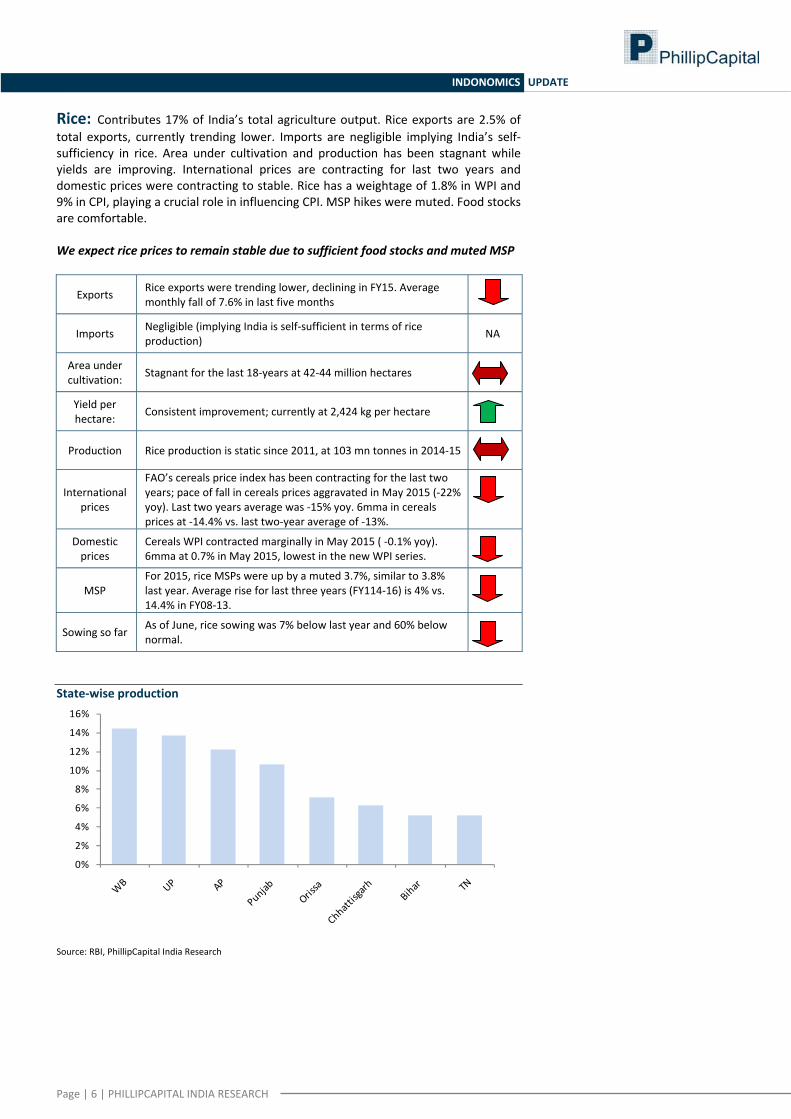
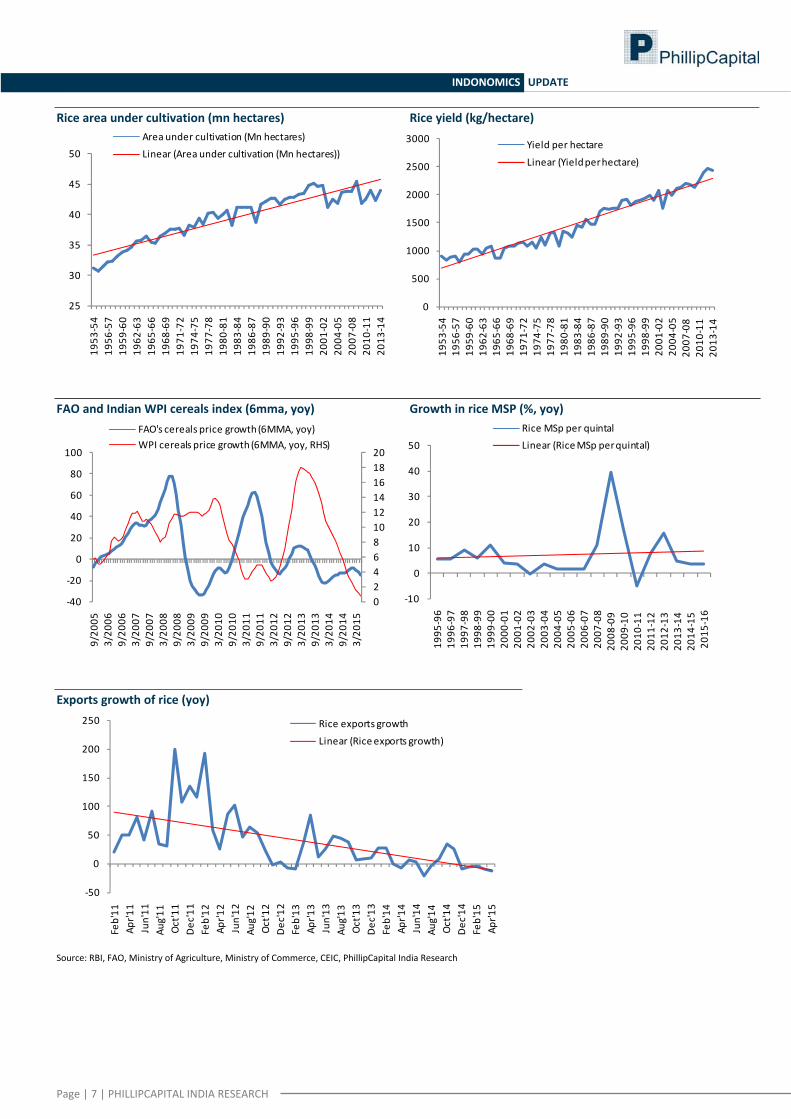
Rice: Contributes 17% of India’s total agriculture output. Rice exports are 2.5% of total exports, currently trending lower. Imports are negligible implying India’s self‐sufficiency in rice. Area under cultivation and production has been stagnant while yields are improving. International prices are contracting for last two years and domestic prices were contracting to stable. Rice has a weightage of 1.8% in WPI and 9% in CPI, playing a crucial role in influencing CPI. MSP hikes were muted. Food stocks are comfortable. We expect rice prices to remain stable due to sufficient food stocks and muted MSP
Exports Rice exports were trending lower, declining in FY15. Average monthly fall of 7.6% in last five months
Imports Negligible (implying India is self‐sufficient in terms of rice production) NA
Area under cultivation: Stagnant for the last 18‐years at 42‐44 million hectares
Yield per hectare: Consistent improvement; currently at 2,424 kg per hectare
Production Rice production is static since 2011, at 103 mn tonnes in 2014‐15
International prices
FAO’s cereals price index has been contracting for the last two years; pace of fall in cereals prices aggravated in May 2015 (‐22% yoy). Last two years average was ‐15% yoy. 6mma in cereals prices at ‐14.4% vs. last two‐year average of ‐13%.
Domestic prices
Cereals WPI contracted marginally in May 2015 ( ‐0.1% yoy). 6mma at 0.7% in May 2015, lowest in the new WPI series.
MSP For 2015, rice MSPs were up by a muted 3.7%, similar to 3.8% last year. Average rise for last three years (FY114‐16) is 4% vs. 14.4% in FY08‐13.
Sowing so far As of June, rice sowing was 7% below last year and 60% below normal.
State‐wise production
0%
2%
4%
6%
8%
10%
12%
14%
16%
Source: RBI, PhillipCapital India Research
Page | 7 | PHILLIPCAPITAL INDIA RESEARCH
INDONOMICS UPDATE
Rice area under cultivation (mn hectares) Rice yield (kg/hectare)
25
30
35
40
45
50
1953
‐54
1956
‐57
1959
‐60
1962
‐63
1965
‐66
1968
‐69
1971
‐72
1974
‐75
1977
‐78
1980
‐81
1983
‐84
1986
‐87
1989
‐90
1992
‐93
1995
‐96
1998
‐99
2001
‐02
2004
‐05
2007
‐08
2010
‐11
2013
‐14
Area under cultivation (Mn hectares)
Linear (Area under cultivation (Mn hectares))
0
500
1000
1500
2000
2500
3000
1953
‐54
1956
‐57
1959
‐60
1962
‐63
1965
‐66
1968
‐69
1971
‐72
1974
‐75
1977
‐78
1980
‐81
1983
‐84
1986
‐87
1989
‐90
1992
‐93
1995
‐96
1998
‐99
2001
‐02
2004
‐05
2007
‐08
2010
‐11
2013
‐14
Yield per hectare
Linear (Yield per hectare)
FAO and Indian WPI cereals index (6mma, yoy) Growth in rice MSP (%, yoy)
02468101214161820
‐40
‐20
0
20
40
60
80
100
9/20
053/20
069/20
063/20
079/20
073/20
089/20
083/20
099/20
093/20
109/20
103/20
119/20
113/20
129/20
123/20
139/20
133/20
149/20
143/20
15
FAO's cereals price growth (6MMA, yoy)WPI cereals price growth (6MMA, yoy, RHS)
‐10
0
10
20
30
40
5019
95‐96
1996
‐97
1997
‐98
1998
‐99
1999
‐00
2000
‐01
2001
‐02
2002
‐03
2003
‐04
2004
‐05
2005
‐06
2006
‐07
2007
‐08
2008
‐09
2009
‐10
2010
‐11
2011
‐12
2012
‐13
2013
‐14
2014
‐15
2015
‐16
Rice MSp per quintalLinear (Rice MSp per quintal)
Exports growth of rice (yoy)
‐50
0
50
100
150
200
250
Feb'11
Apr'1
1Jun'11
Aug'11
Oct'11
Dec'11
Feb'12
Apr'1
2Jun'12
Aug'12
Oct'12
Dec'12
Feb'13
Apr'1
3Jun'13
Aug'13
Oct'13
Dec'13
Feb'14
Apr'1
4Jun'14
Aug'14
Oct'14
Dec'14
Feb'15
Apr'1
5
Rice exports growth
Linear (Rice exports growth)
Source: RBI, FAO, Ministry of Agriculture, Ministry of Commerce, CEIC, PhillipCapital India Research
Page | 8 | PHILLIPCAPITAL INDIA RESEARCH
INDONOMICS UPDATE
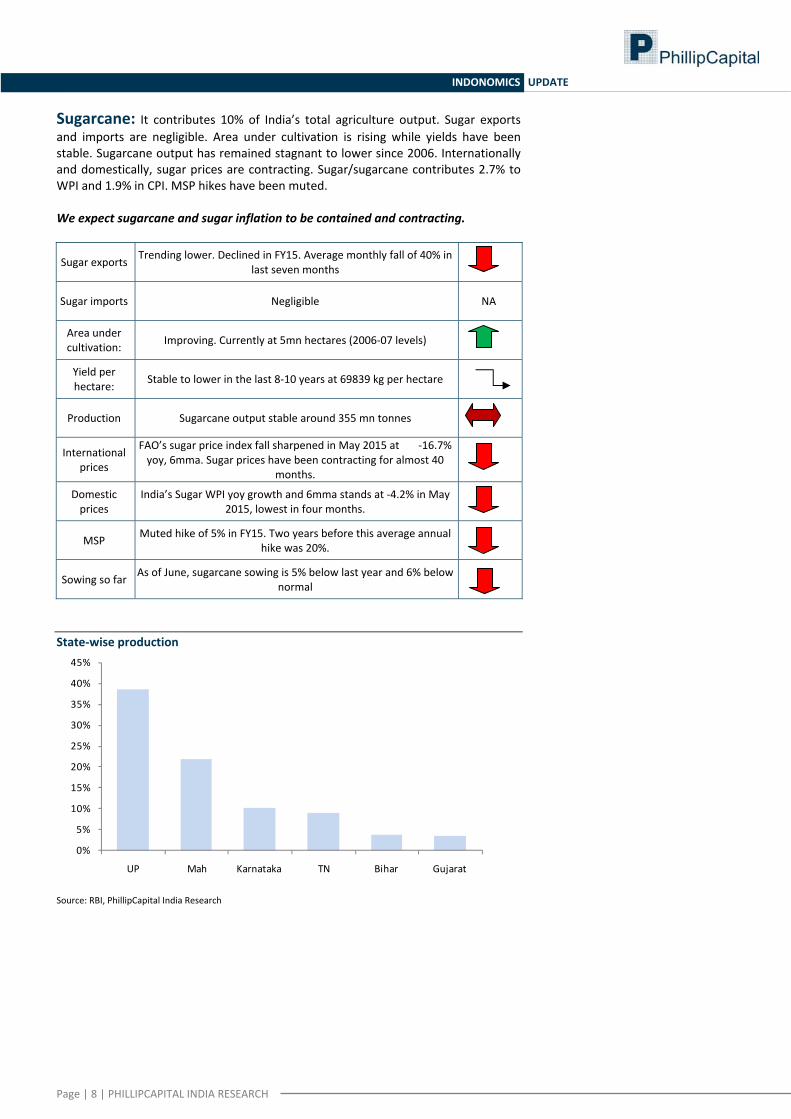
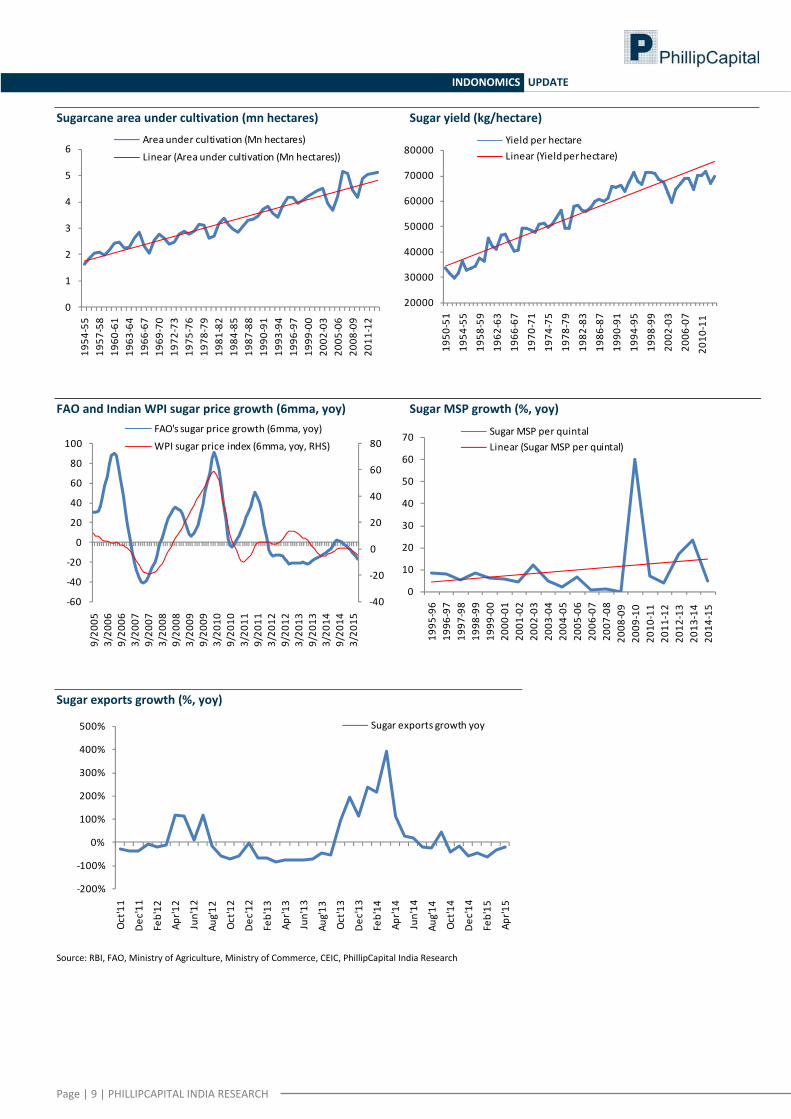
Sugarcane: It contributes 10% of India’s total agriculture output. Sugar exports and imports are negligible. Area under cultivation is rising while yields have been stable. Sugarcane output has remained stagnant to lower since 2006. Internationally and domestically, sugar prices are contracting. Sugar/sugarcane contributes 2.7% to WPI and 1.9% in CPI. MSP hikes have been muted. We expect sugarcane and sugar inflation to be contained and contracting.
Sugar exports Trending lower. Declined in FY15. Average monthly fall of 40% in last seven months
Sugar imports Negligible NA
Area under cultivation: Improving. Currently at 5mn hectares (2006‐07 levels)
Yield per hectare: Stable to lower in the last 8‐10 years at 69839 kg per hectare
Production Sugarcane output stable around 355 mn tonnes
International prices
FAO’s sugar price index fall sharpened in May 2015 at ‐16.7% yoy, 6mma. Sugar prices have been contracting for almost 40
months.
Domestic prices
India’s Sugar WPI yoy growth and 6mma stands at ‐4.2% in May 2015, lowest in four months.
MSP Muted hike of 5% in FY15. Two years before this average annual hike was 20%.
Sowing so far As of June, sugarcane sowing is 5% below last year and 6% below normal
State‐wise production
0%
5%
10%
15%
20%
25%
30%
35%
40%
45%
UP Mah Karnataka TN Bihar Gujarat
Source: RBI, PhillipCapital India Research
Page | 9 | PHILLIPCAPITAL INDIA RESEARCH
INDONOMICS UPDATE
Sugarcane area under cultivation (mn hectares) Sugar yield (kg/hectare)
0
1
2
3
4
5
6
1954
‐55
1957
‐58
1960
‐61
1963
‐64
1966
‐67
1969
‐70
1972
‐73
1975
‐76
1978
‐79
1981
‐82
1984
‐85
1987
‐88
1990
‐91
1993
‐94
1996
‐97
1999
‐00
2002
‐03
2005
‐06
2008
‐09
2011
‐12
Area under cultivation (Mn hectares)
Linear (Area under cultivation (Mn hectares))
20000
30000
40000
50000
60000
70000
80000
1950
‐51
1954
‐55
1958
‐59
1962
‐63
1966
‐67
1970
‐71
1974
‐75
1978
‐79
1982
‐83
1986
‐87
1990
‐91
1994
‐95
1998
‐99
2002
‐03
2006
‐07
2010
‐11
Yield per hectareLinear (Yield per hectare)
FAO and Indian WPI sugar price growth (6mma, yoy) Sugar MSP growth (%, yoy)
‐40
‐20
0
20
40
60
80
‐60
‐40
‐20
0
20
40
60
80
100
9/20
053/20
069/20
063/20
079/20
073/20
089/20
083/20
099/20
093/20
109/20
103/20
119/20
113/20
129/20
123/20
139/20
133/20
149/20
143/20
15
FAO's sugar price growth (6mma, yoy)
WPI sugar price index (6mma, yoy, RHS)
0
10
20
30
40
50
60
7019
95‐96
1996
‐97
1997
‐98
1998
‐99
1999
‐00
2000
‐01
2001
‐02
2002
‐03
2003
‐04
2004
‐05
2005
‐06
2006
‐07
2007
‐08
2008
‐09
2009
‐10
2010
‐11
2011
‐12
2012
‐13
2013
‐14
2014
‐15
Sugar MSP per quintalLinear (Sugar MSP per quintal)
Sugar exports growth (%, yoy)
‐200%
‐100%
0%
100%
200%
300%
400%
500%
Oct'11
Dec'11
Feb'12
Apr'1
2
Jun'12
Aug'12
Oct'12
Dec'12
Feb'13
Apr'1
3
Jun'13
Aug'13
Oct'13
Dec'13
Feb'14
Apr'1
4
Jun'14
Aug'14
Oct'14
Dec'14
Feb'15
Apr'1
5
Sugar exports growth yoy
Source: RBI, FAO, Ministry of Agriculture, Ministry of Commerce, CEIC, PhillipCapital India Research
Page | 10 | PHILLIPCAPITAL INDIA RESEARCH
INDONOMICS UPDATE
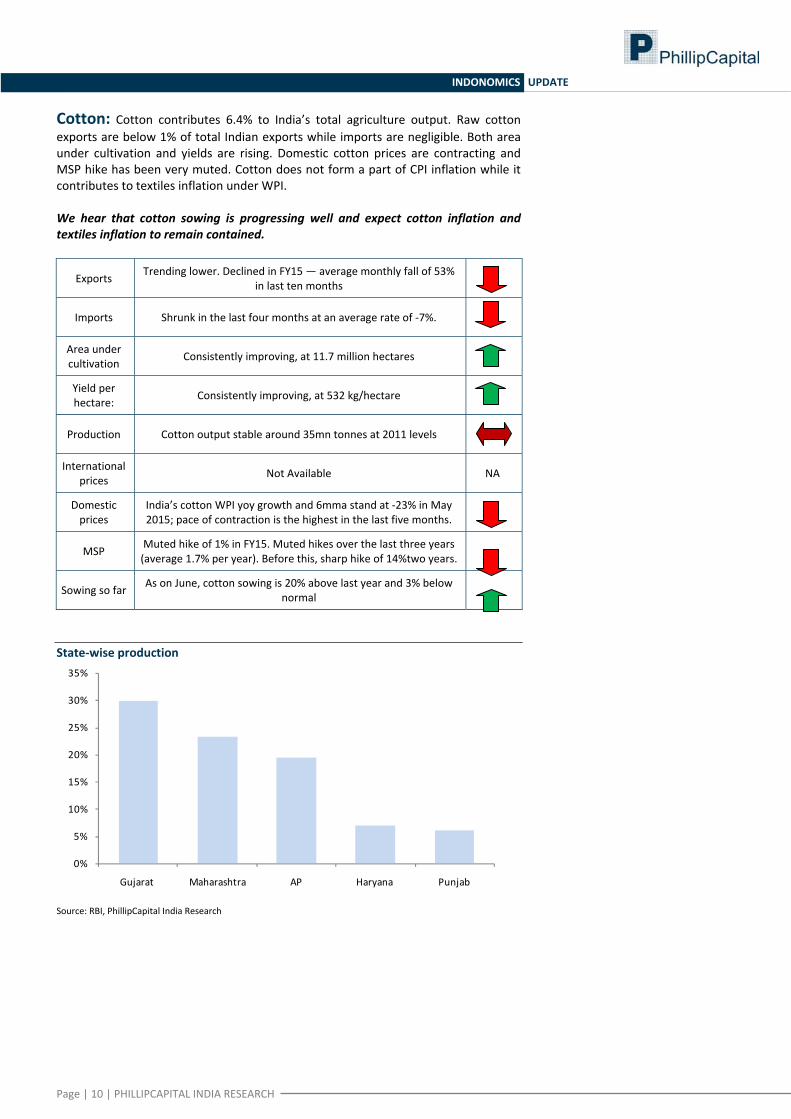
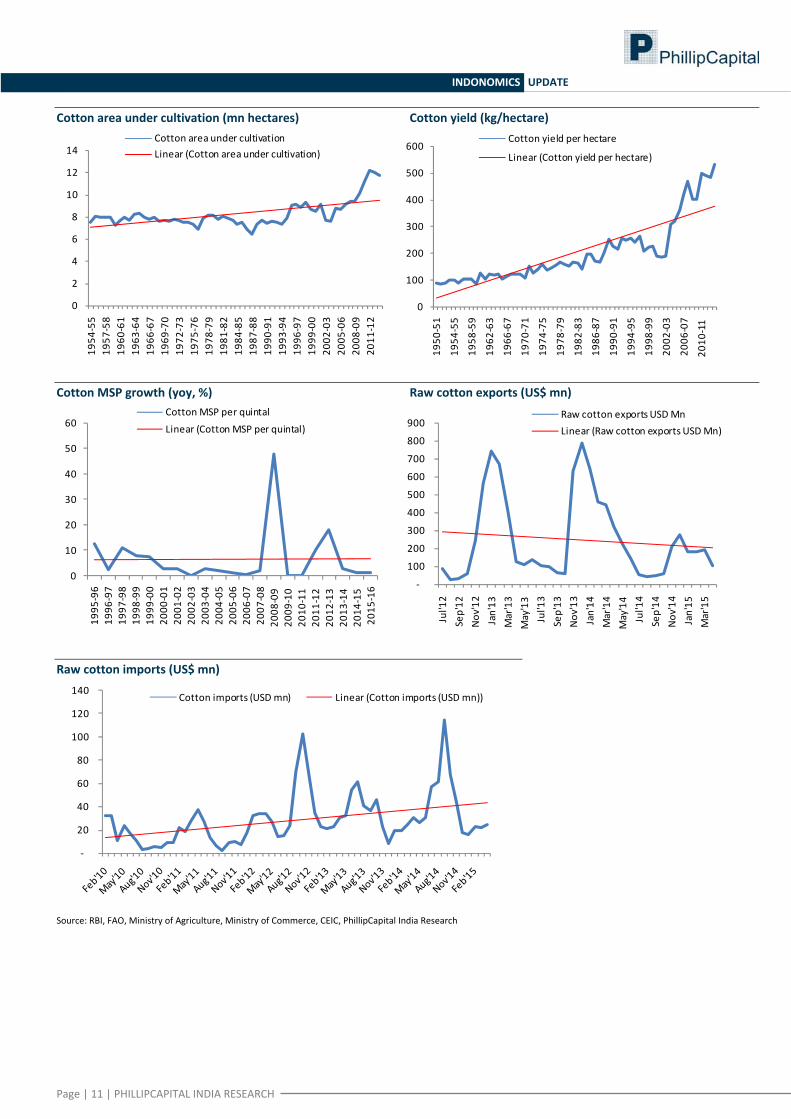
Cotton: Cotton contributes 6.4% to India’s total agriculture output. Raw cotton exports are below 1% of total Indian exports while imports are negligible. Both area under cultivation and yields are rising. Domestic cotton prices are contracting and MSP hike has been very muted. Cotton does not form a part of CPI inflation while it contributes to textiles inflation under WPI. We hear that cotton sowing is progressing well and expect cotton inflation and textiles inflation to remain contained.
Exports Trending lower. Declined in FY15 — average monthly fall of 53% in last ten months
Imports Shrunk in the last four months at an average rate of ‐7%.
Area under cultivation Consistently improving, at 11.7 million hectares
Yield per hectare: Consistently improving, at 532 kg/hectare
Production Cotton output stable around 35mn tonnes at 2011 levels
International prices Not Available NA
Domestic prices
India’s cotton WPI yoy growth and 6mma stand at ‐23% in May 2015; pace of contraction is the highest in the last five months.
MSP Muted hike of 1% in FY15. Muted hikes over the last three years (average 1.7% per year). Before this, sharp hike of 14%two years.
Sowing so far As on June, cotton sowing is 20% above last year and 3% below normal
State‐wise production
0%
5%
10%
15%
20%
25%
30%
35%
Gujarat Maharashtra AP Haryana Punjab
Source: RBI, PhillipCapital India Research
Page | 11 | PHILLIPCAPITAL INDIA RESEARCH
INDONOMICS UPDATE
Cotton area under cultivation (mn hectares) Cotton yield (kg/hectare)
0
2
4
6
8
10
12
14
1954
‐55
1957
‐58
1960
‐61
1963
‐64
1966
‐67
1969
‐70
1972
‐73
1975
‐76
1978
‐79
1981
‐82
1984
‐85
1987
‐88
1990
‐91
1993
‐94
1996
‐97
1999
‐00
2002
‐03
2005
‐06
2008
‐09
2011
‐12
Cotton area under cultivationLinear (Cotton area under cultivation)
0
100
200
300
400
500
600
1950
‐51
1954
‐55
1958
‐59
1962
‐63
1966
‐67
1970
‐71
1974
‐75
1978
‐79
1982
‐83
1986
‐87
1990
‐91
1994
‐95
1998
‐99
2002
‐03
2006
‐07
2010
‐11
Cotton yield per hectare
Linear (Cotton yield per hectare)
Cotton MSP growth (yoy, %) Raw cotton exports (US$ mn)
0
10
20
30
40
50
60
1995
‐96
1996
‐97
1997
‐98
1998
‐99
1999
‐00
2000
‐01
2001
‐02
2002
‐03
2003
‐04
2004
‐05
2005
‐06
2006
‐07
2007
‐08
2008
‐09
2009
‐10
2010
‐11
2011
‐12
2012
‐13
2013
‐14
2014
‐15
2015
‐16
Cotton MSP per quintal
Linear (Cotton MSP per quintal)
‐
100
200
300
400
500
600
700
800
900
Jul'12
Sep'12
Nov'12
Jan'13
Mar'13
May'13
Jul'13
Sep'13
Nov'13
Jan'14
Mar'14
May'14
Jul'14
Sep'14
Nov'14
Jan'15
Mar'15
Raw cotton exports USD MnLinear (Raw cotton exports USD Mn)
Raw cotton imports (US$ mn)
‐
20
40
60
80
100
120
140 Cotton imports (USD mn) Linear (Cotton imports (USD mn))
Source: RBI, FAO, Ministry of Agriculture, Ministry of Commerce, CEIC, PhillipCapital India Research
Page | 12 | PHILLIPCAPITAL INDIA RESEARCH
INDONOMICS UPDATE
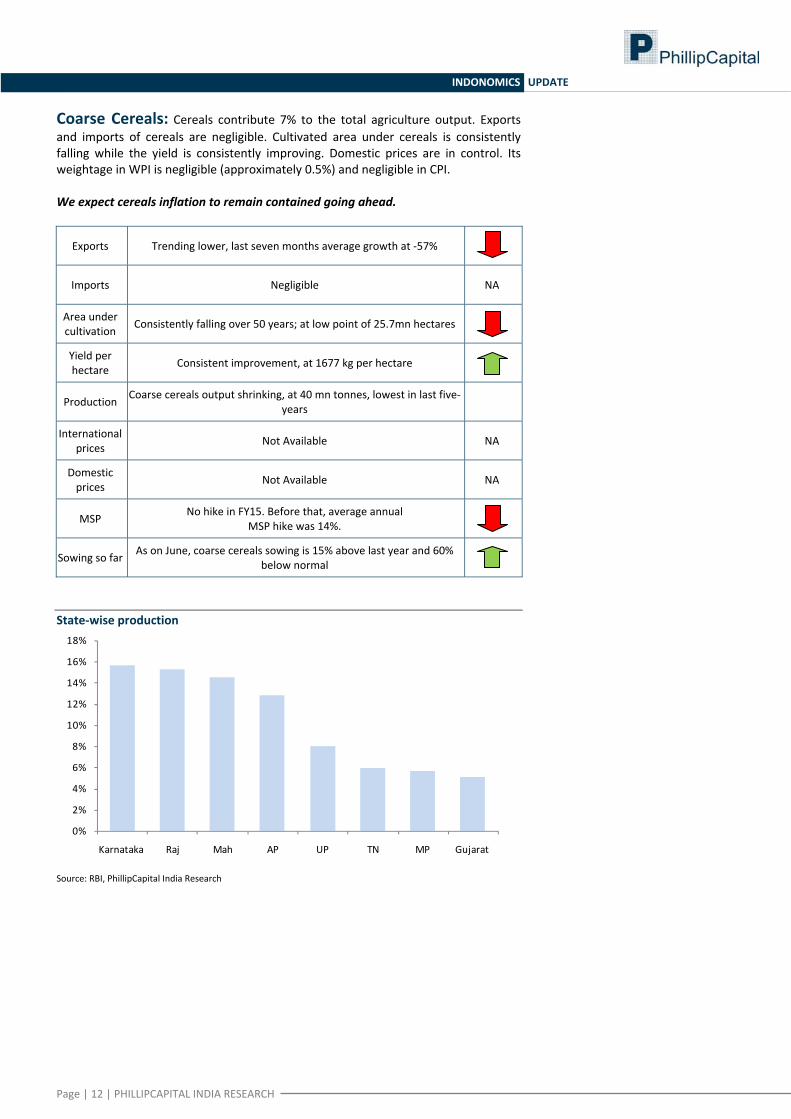
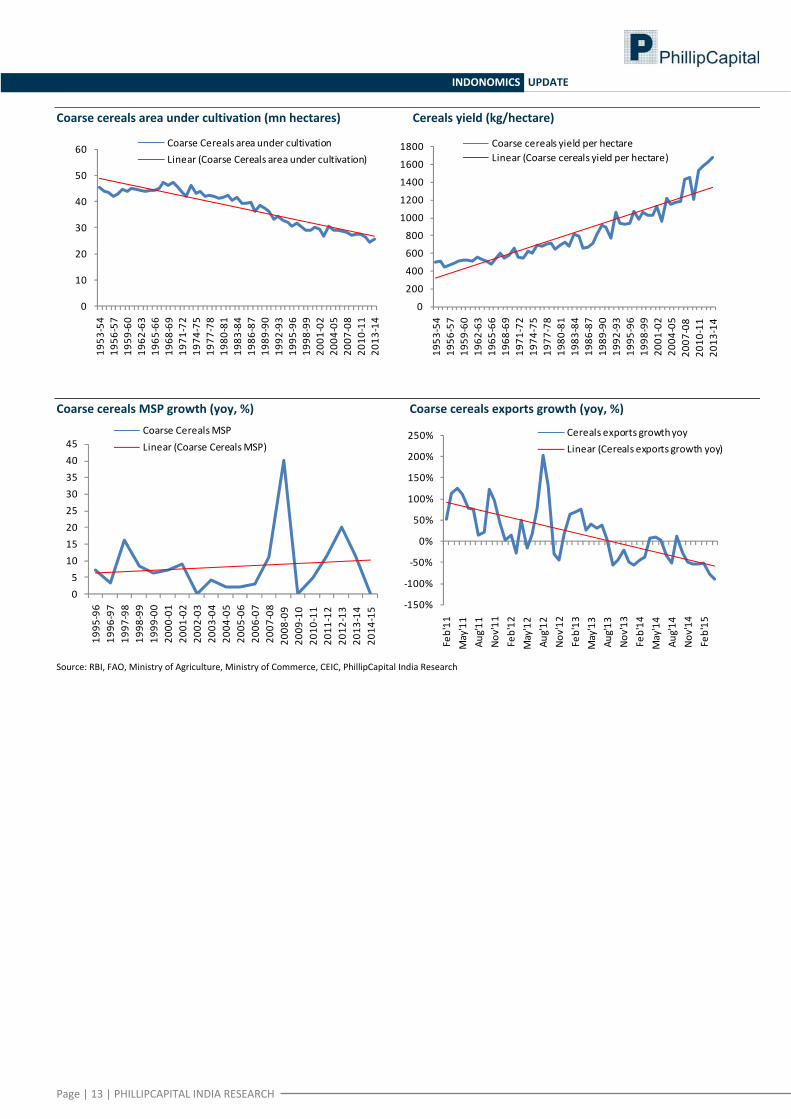
Coarse Cereals: Cereals contribute 7% to the total agriculture output. Exports and imports of cereals are negligible. Cultivated area under cereals is consistently falling while the yield is consistently improving. Domestic prices are in control. Its weightage in WPI is negligible (approximately 0.5%) and negligible in CPI. We expect cereals inflation to remain contained going ahead.
Exports Trending lower, last seven months average growth at ‐57%
Imports Negligible NA
Area under cultivation Consistently falling over 50 years; at low point of 25.7mn hectares
Yield per hectare Consistent improvement, at 1677 kg per hectare
Production Coarse cereals output shrinking, at 40 mn tonnes, lowest in last five‐years
International prices Not Available NA
Domestic prices Not Available NA
MSP No hike in FY15. Before that, average annual MSP hike was 14%.
Sowing so far As on June, coarse cereals sowing is 15% above last year and 60% below normal
State‐wise production
0%
2%
4%
6%
8%
10%
12%
14%
16%
18%
Karnataka Raj Mah AP UP TN MP Gujarat
Source: RBI, PhillipCapital India Research
Page | 13 | PHILLIPCAPITAL INDIA RESEARCH
INDONOMICS UPDATE
Coarse cereals area under cultivation (mn hectares) Cereals yield (kg/hectare)
0
10
20
30
40
50
60
1953
‐54
1956
‐57
1959
‐60
1962
‐63
1965
‐66
1968
‐69
1971
‐72
1974
‐75
1977
‐78
1980
‐81
1983
‐84
1986
‐87
1989
‐90
1992
‐93
1995
‐96
1998
‐99
2001
‐02
2004
‐05
2007
‐08
2010
‐11
2013
‐14
Coarse Cereals area under cultivationLinear (Coarse Cereals area under cultivation)
0
200
400
600
800
1000
1200
1400
1600
1800
1953
‐54
1956
‐57
1959
‐60
1962
‐63
1965
‐66
1968
‐69
1971
‐72
1974
‐75
1977
‐78
1980
‐81
1983
‐84
1986
‐87
1989
‐90
1992
‐93
1995
‐96
1998
‐99
2001
‐02
2004
‐05
2007
‐08
2010
‐11
2013
‐14
Coarse cereals yield per hectareLinear (Coarse cereals yield per hectare)
Coarse cereals MSP growth (yoy, %) Coarse cereals exports growth (yoy, %)
05
1015202530354045
1995
‐96
1996
‐97
1997
‐98
1998
‐99
1999
‐00
2000
‐01
2001
‐02
2002
‐03
2003
‐04
2004
‐05
2005
‐06
2006
‐07
2007
‐08
2008
‐09
2009
‐10
2010
‐11
2011
‐12
2012
‐13
2013
‐14
2014
‐15
Coarse Cereals MSPLinear (Coarse Cereals MSP)
‐150%
‐100%
‐50%
0%
50%
100%
150%
200%
250%Feb'11
May'11
Aug'11
Nov'11
Feb'12
May'12
Aug'12
Nov'12
Feb'13
May'13
Aug'13
Nov'13
Feb'14
May'14
Aug'14
Nov'14
Feb'15
Cereals exports growth yoyLinear (Cereals exports growth yoy)
Source: RBI, FAO, Ministry of Agriculture, Ministry of Commerce, CEIC, PhillipCapital India Research
Page | 14 | PHILLIPCAPITAL INDIA RESEARCH
INDONOMICS UPDATE
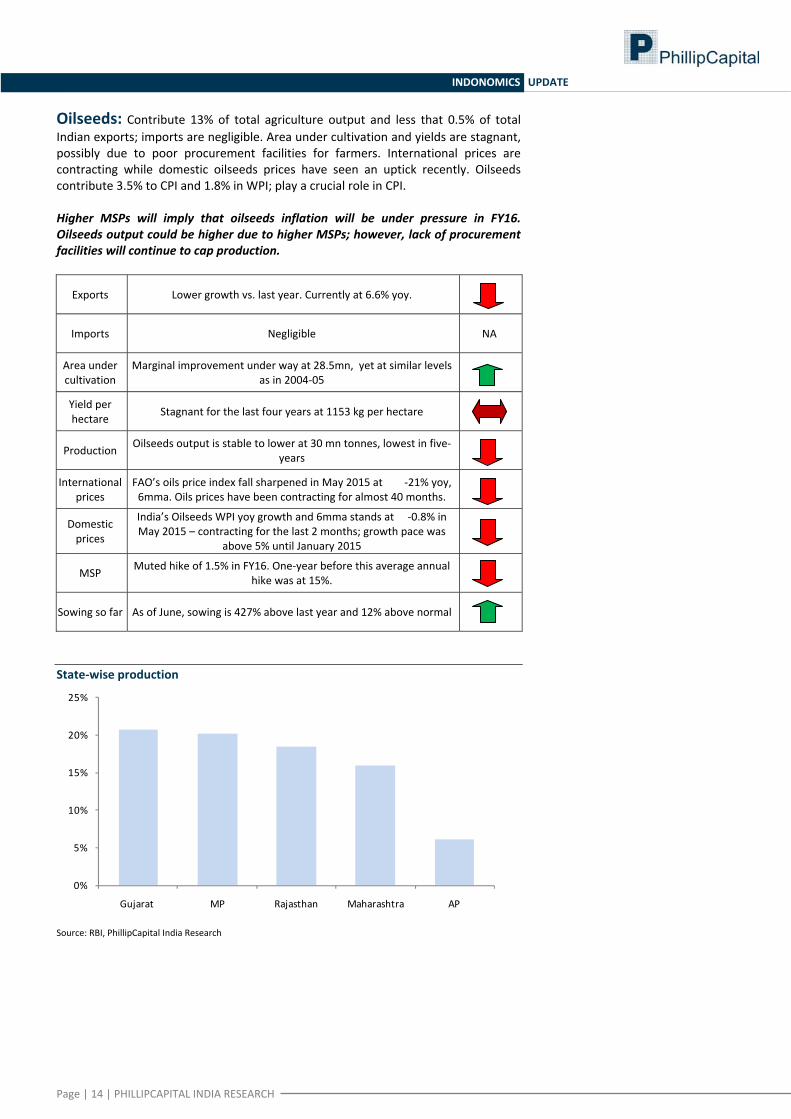
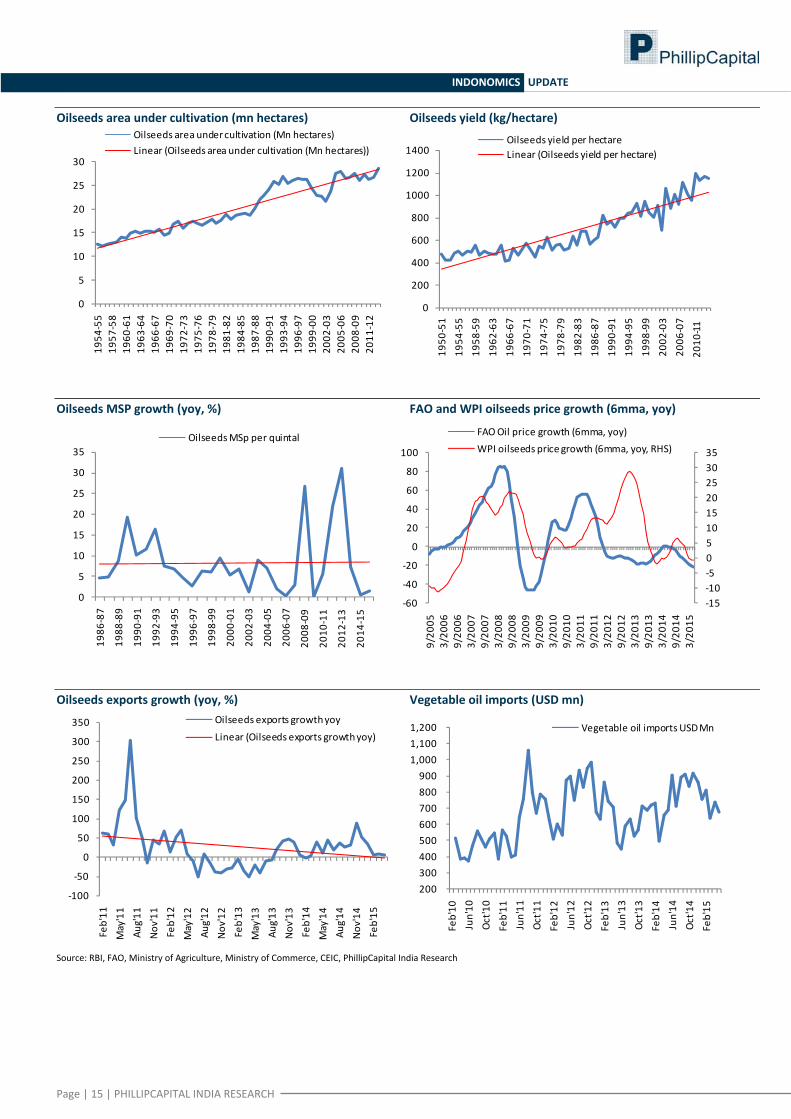
Oilseeds: Contribute 13% of total agriculture output and less that 0.5% of total Indian exports; imports are negligible. Area under cultivation and yields are stagnant, possibly due to poor procurement facilities for farmers. International prices are contracting while domestic oilseeds prices have seen an uptick recently. Oilseeds contribute 3.5% to CPI and 1.8% in WPI; play a crucial role in CPI. Higher MSPs will imply that oilseeds inflation will be under pressure in FY16. Oilseeds output could be higher due to higher MSPs; however, lack of procurement facilities will continue to cap production.
Exports Lower growth vs. last year. Currently at 6.6% yoy.
Imports Negligible NA
Area under cultivation
Marginal improvement under way at 28.5mn, yet at similar levels as in 2004‐05
Yield per hectare Stagnant for the last four years at 1153 kg per hectare
Production Oilseeds output is stable to lower at 30 mn tonnes, lowest in five‐years
International prices
FAO’s oils price index fall sharpened in May 2015 at ‐21% yoy, 6mma. Oils prices have been contracting for almost 40 months.
Domestic prices
India’s Oilseeds WPI yoy growth and 6mma stands at ‐0.8% in May 2015 – contracting for the last 2 months; growth pace was
above 5% until January 2015
MSP Muted hike of 1.5% in FY16. One‐year before this average annual hike was at 15%.
Sowing so far As of June, sowing is 427% above last year and 12% above normal
State‐wise production
0%
5%
10%
15%
20%
25%
Gujarat MP Rajasthan Maharashtra AP
Source: RBI, PhillipCapital India Research
Page | 15 | PHILLIPCAPITAL INDIA RESEARCH
INDONOMICS UPDATE
Oilseeds area under cultivation (mn hectares) Oilseeds yield (kg/hectare)
0
5
10
15
20
25
30
1954
‐55
1957
‐58
1960
‐61
1963
‐64
1966
‐67
1969
‐70
1972
‐73
1975
‐76
1978
‐79
1981
‐82
1984
‐85
1987
‐88
1990
‐91
1993
‐94
1996
‐97
1999
‐00
2002
‐03
2005
‐06
2008
‐09
2011
‐12
Oilseeds area under cultivation (Mn hectares)Linear (Oilseeds area under cultivation (Mn hectares))
0
200
400
600
800
1000
1200
1400
1950
‐51
1954
‐55
1958
‐59
1962
‐63
1966
‐67
1970
‐71
1974
‐75
1978
‐79
1982
‐83
1986
‐87
1990
‐91
1994
‐95
1998
‐99
2002
‐03
2006
‐07
2010
‐11
Oilseeds yield per hectareLinear (Oilseeds yield per hectare)
Oilseeds MSP growth (yoy, %) FAO and WPI oilseeds price growth (6mma, yoy)
0
5
10
15
20
25
30
35
1986
‐87
1988
‐89
1990
‐91
1992
‐93
1994
‐95
1996
‐97
1998
‐99
2000
‐01
2002
‐03
2004
‐05
2006
‐07
2008
‐09
2010
‐11
2012
‐13
2014
‐15
Oilseeds MSp per quintal
‐15‐10‐505101520253035
‐60
‐40
‐20
0
20
40
60
80
100
9/20
053/20
069/20
063/20
079/20
073/20
089/20
083/20
099/20
093/20
109/20
103/20
119/20
113/20
129/20
123/20
139/20
133/20
149/20
143/20
15
FAO Oil price growth (6mma, yoy)WPI oilseeds price growth (6mma, yoy, RHS)
Oilseeds exports growth (yoy, %) Vegetable oil imports (USD mn)
‐100
‐50
0
50
100
150
200
250
300
350
Feb'11
May'11
Aug'11
Nov'11
Feb'12
May'12
Aug'12
Nov'12
Feb'13
May'13
Aug'13
Nov'13
Feb'14
May'14
Aug'14
Nov'14
Feb'15
Oilseeds exports growth yoy
Linear (Oilseeds exports growth yoy)
200 300 400 500 600 700 800 900
1,000 1,100 1,200
Feb'10
Jun'10
Oct'10
Feb'11
Jun'11
Oct'11
Feb'12
Jun'12
Oct'12
Feb'13
Jun'13
Oct'13
Feb'14
Jun'14
Oct'14
Feb'15
Vegetable oil imports USD Mn
Source: RBI, FAO, Ministry of Agriculture, Ministry of Commerce, CEIC, PhillipCapital India Research
Page | 16 | PHILLIPCAPITAL INDIA RESEARCH
INDONOMICS UPDATE
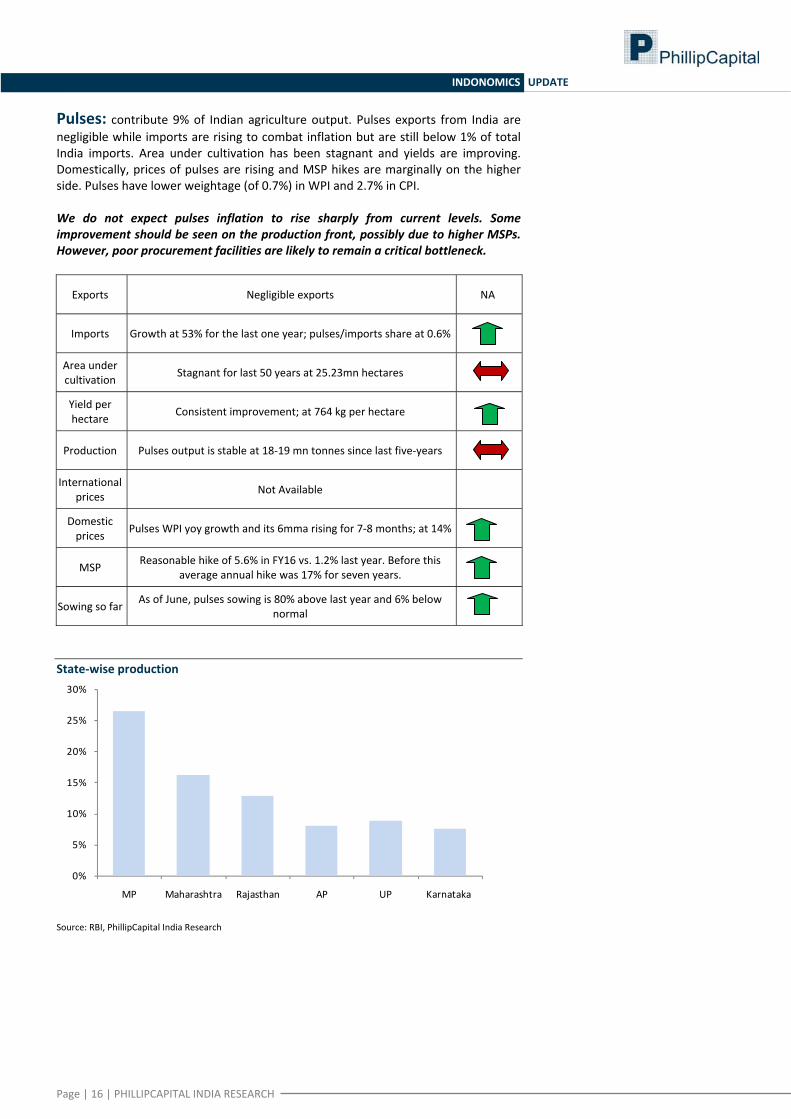
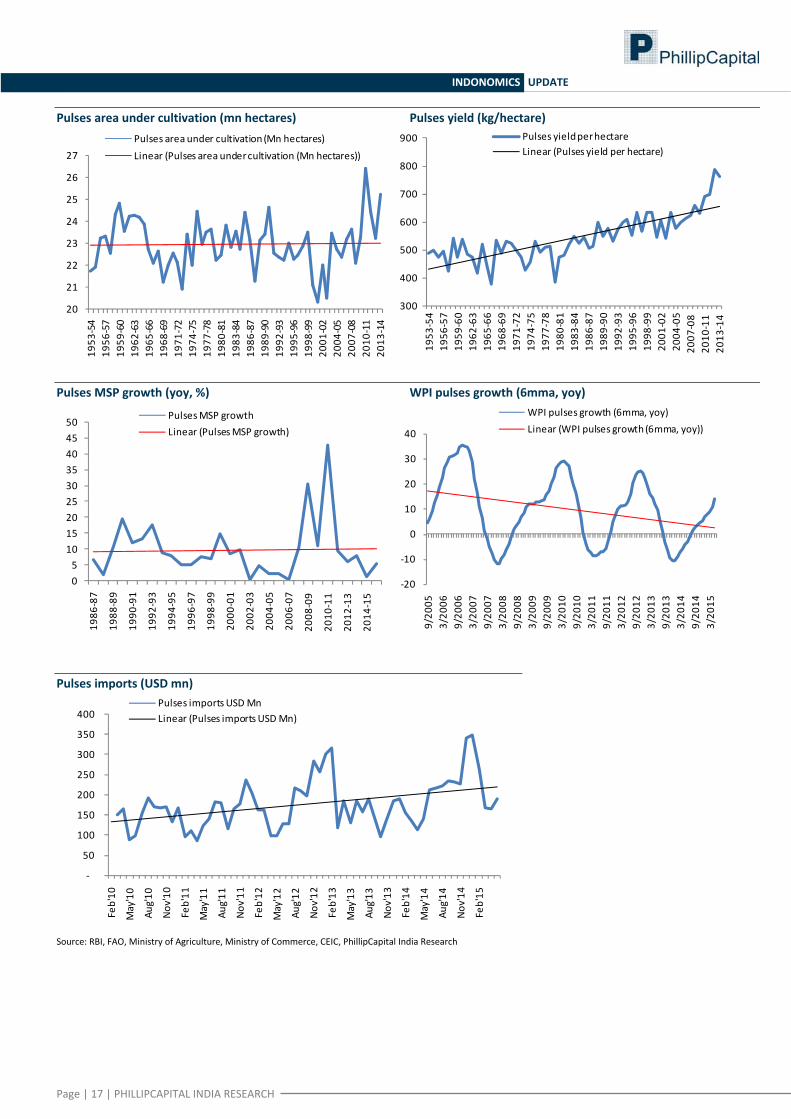
Pulses: contribute 9% of Indian agriculture output. Pulses exports from India are negligible while imports are rising to combat inflation but are still below 1% of total India imports. Area under cultivation has been stagnant and yields are improving. Domestically, prices of pulses are rising and MSP hikes are marginally on the higher side. Pulses have lower weightage (of 0.7%) in WPI and 2.7% in CPI. We do not expect pulses inflation to rise sharply from current levels. Some improvement should be seen on the production front, possibly due to higher MSPs. However, poor procurement facilities are likely to remain a critical bottleneck.
Exports Negligible exports NA
Imports Growth at 53% for the last one year; pulses/imports share at 0.6%
Area under cultivation Stagnant for last 50 years at 25.23mn hectares
Yield per hectare Consistent improvement; at 764 kg per hectare
Production Pulses output is stable at 18‐19 mn tonnes since last five‐years
International prices Not Available
Domestic prices Pulses WPI yoy growth and its 6mma rising for 7‐8 months; at 14%
MSP Reasonable hike of 5.6% in FY16 vs. 1.2% last year. Before this average annual hike was 17% for seven years.
Sowing so far As of June, pulses sowing is 80% above last year and 6% below normal
State‐wise production
0%
5%
10%
15%
20%
25%
30%
MP Maharashtra Rajasthan AP UP Karnataka
Source: RBI, PhillipCapital India Research
Page | 17 | PHILLIPCAPITAL INDIA RESEARCH
INDONOMICS UPDATE
Pulses area under cultivation (mn hectares) Pulses yield (kg/hectare)
20
21
22
23
24
25
26
27
1953
‐54
1956
‐57
1959
‐60
1962
‐63
1965
‐66
1968
‐69
1971
‐72
1974
‐75
1977
‐78
1980
‐81
1983
‐84
1986
‐87
1989
‐90
1992
‐93
1995
‐96
1998
‐99
2001
‐02
2004
‐05
2007
‐08
2010
‐11
2013
‐14
Pulses area under cultivation (Mn hectares)Linear (Pulses area under cultivation (Mn hectares))
300
400
500
600
700
800
900
1953
‐54
1956
‐57
1959
‐60
1962
‐63
1965
‐66
1968
‐69
1971
‐72
1974
‐75
1977
‐78
1980
‐81
1983
‐84
1986
‐87
1989
‐90
1992
‐93
1995
‐96
1998
‐99
2001
‐02
2004
‐05
2007
‐08
2010
‐11
2013
‐14
Pulses yield per hectareLinear (Pulses yield per hectare)
Pulses MSP growth (yoy, %) WPI pulses growth (6mma, yoy)
05
101520253035404550
1986
‐87
1988
‐89
1990
‐91
1992
‐93
1994
‐95
1996
‐97
1998
‐99
2000
‐01
2002
‐03
2004
‐05
2006
‐07
2008
‐09
2010
‐11
2012
‐13
2014
‐15
Pulses MSP growthLinear (Pulses MSP growth)
‐20
‐10
0
10
20
30
409/20
053/20
069/20
063/20
079/20
073/20
089/20
083/20
099/20
093/20
109/20
103/20
119/20
113/20
129/20
123/20
139/20
133/20
149/20
143/20
15
WPI pulses growth (6mma, yoy)Linear (WPI pulses growth (6mma, yoy))
Pulses imports (USD mn)
‐
50
100
150
200
250
300
350
400
Feb'10
May'10
Aug'10
Nov'10
Feb'11
May'11
Aug'11
Nov'11
Feb'12
May'12
Aug'12
Nov'12
Feb'13
May'13
Aug'13
Nov'13
Feb'14
May'14
Aug'14
Nov'14
Feb'15
Pulses imports USD MnLinear (Pulses imports USD Mn)
Source: RBI, FAO, Ministry of Agriculture, Ministry of Commerce, CEIC, PhillipCapital India Research
Page | 18 | PHILLIPCAPITAL INDIA RESEARCH
INDONOMICS UPDATE
Indian food inflation and international food prices We did an in‐depth analysis of Indian wholesale food inflation (lack of long‐term CPI series) and international prices based on FAO Food and Cereals Index. We find minimal/negligible correlation between the two (barring for pulses and edible oil). This is largely due to India being self‐sufficient in agriculture production; thus there is minimal influence of the international prices. Therefore, we conclude that Indian food prices are largely driven by domestic factors such as MSP, monsoon, irrigation, area under coverage, yield, and warehousing availability. Internationally, food inflation has been contracting for last ten‐months.
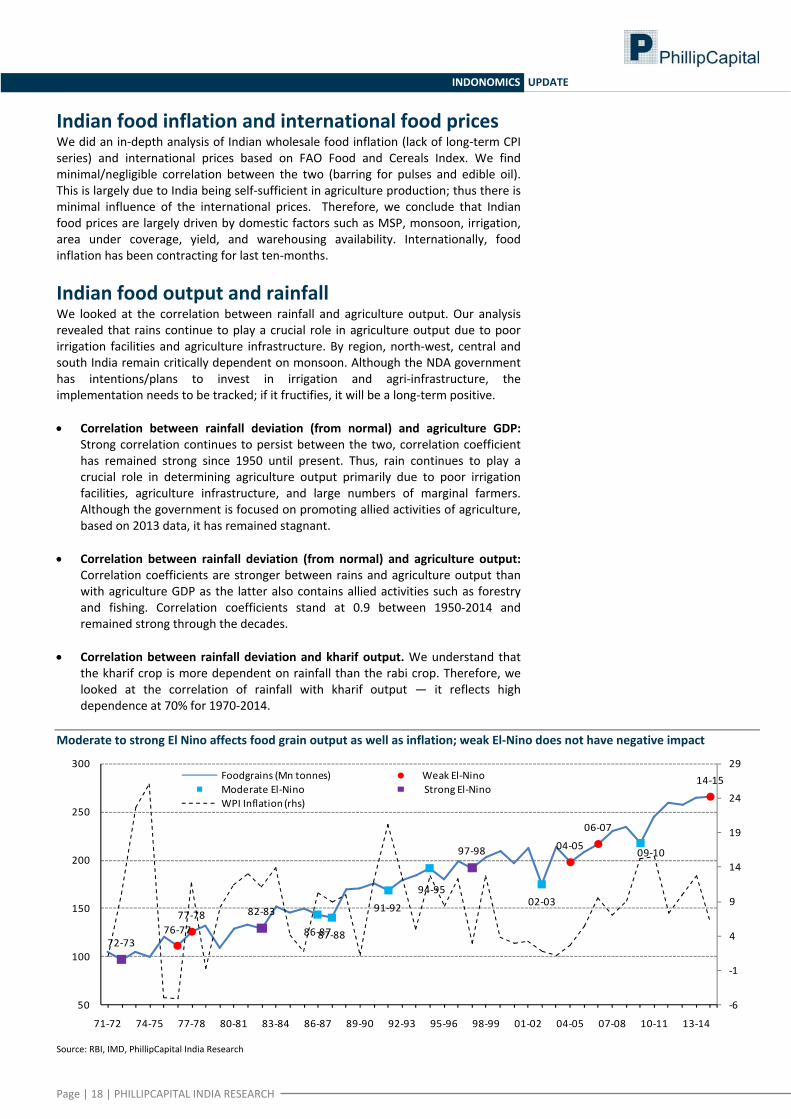
Indian food output and rainfall We looked at the correlation between rainfall and agriculture output. Our analysis revealed that rains continue to play a crucial role in agriculture output due to poor irrigation facilities and agriculture infrastructure. By region, north‐west, central and south India remain critically dependent on monsoon. Although the NDA government has intentions/plans to invest in irrigation and agri‐infrastructure, the implementation needs to be tracked; if it fructifies, it will be a long‐term positive. • Correlation between rainfall deviation (from normal) and agriculture GDP:
Strong correlation continues to persist between the two, correlation coefficient has remained strong since 1950 until present. Thus, rain continues to play a crucial role in determining agriculture output primarily due to poor irrigation facilities, agriculture infrastructure, and large numbers of marginal farmers. Although the government is focused on promoting allied activities of agriculture, based on 2013 data, it has remained stagnant.
• Correlation between rainfall deviation (from normal) and agriculture output:
Correlation coefficients are stronger between rains and agriculture output than with agriculture GDP as the latter also contains allied activities such as forestry and fishing. Correlation coefficients stand at 0.9 between 1950‐2014 and remained strong through the decades.
• Correlation between rainfall deviation and kharif output. We understand that
the kharif crop is more dependent on rainfall than the rabi crop. Therefore, we looked at the correlation of rainfall with kharif output — it reflects high dependence at 70% for 1970‐2014.
Moderate to strong El Nino affects food grain output as well as inflation; weak El‐Nino does not have negative impact
76‐7777‐78
04‐05
06‐07
14‐15
86‐8787‐88
91‐92
94‐9502‐03
09‐10
72‐73
82‐83
97‐98
‐6
‐1
4
9
14
19
24
29
50
100
150
200
250
300
71‐72 74‐75 77‐78 80‐81 83‐84 86‐87 89‐90 92‐93 95‐96 98‐99 01‐02 04‐05 07‐08 10‐11 13‐14
Foodgrains (Mn tonnes) Weak El‐NinoModerate El‐Nino Strong El‐NinoWPI Inflation (rhs)
Source: RBI, IMD, PhillipCapital India Research
Page | 19 | PHILLIPCAPITAL INDIA RESEARCH
INDONOMICS UPDATE
• Correlation between region‐wise rainfall and kharif output: We conclude that
North‐West India is significantly dependent on monsoon (correlation coefficient of 0.6 between 1970‐2014). Monsoon is relatively important for central India (correlation coefficient of 0.6 in 1970‐2014) and south peninsular India (correlation coefficient of 0.5 in 1970‐2014) and is the least relevant for North‐East India.
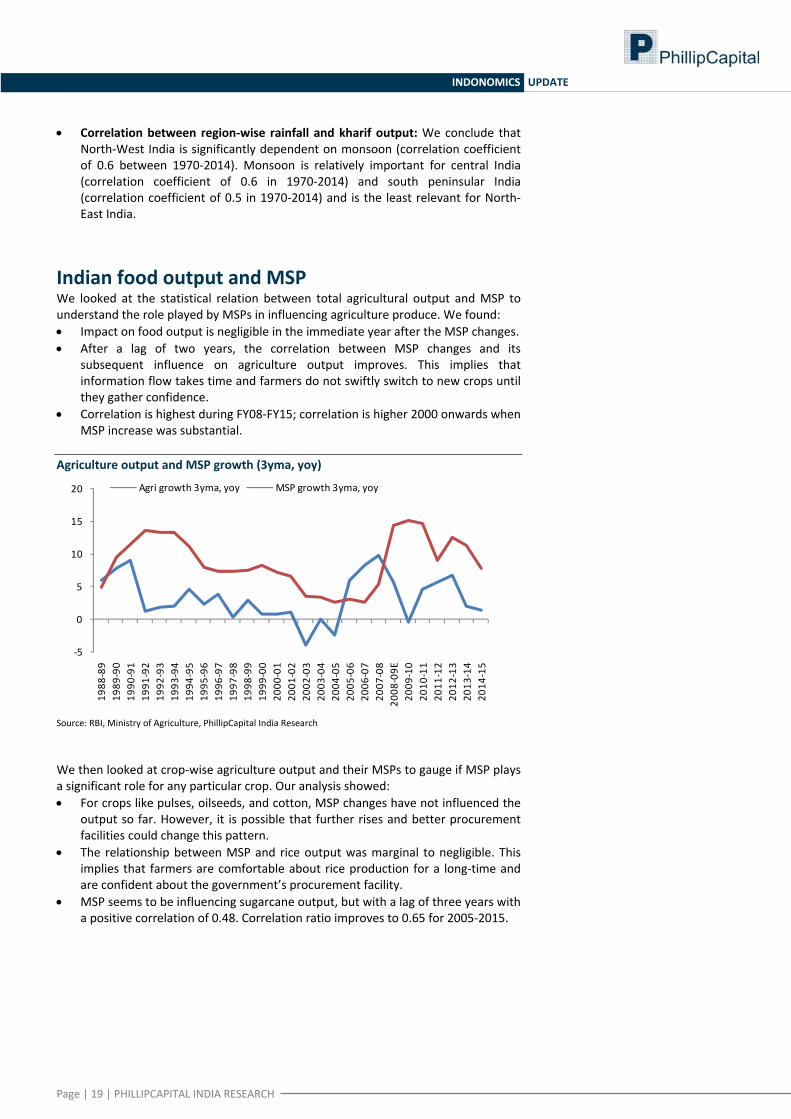
Indian food output and MSP We looked at the statistical relation between total agricultural output and MSP to understand the role played by MSPs in influencing agriculture produce. We found: • Impact on food output is negligible in the immediate year after the MSP changes. • After a lag of two years, the correlation between MSP changes and its
subsequent influence on agriculture output improves. This implies that information flow takes time and farmers do not swiftly switch to new crops until they gather confidence.
• Correlation is highest during FY08‐FY15; correlation is higher 2000 onwards when MSP increase was substantial.
Agriculture output and MSP growth (3yma, yoy)
‐5
0
5
10
15
20
1988
‐89
1989
‐90
1990
‐91
1991
‐92
1992
‐93
1993
‐94
1994
‐95
1995
‐96
1996
‐97
1997
‐98
1998
‐99
1999
‐00
2000
‐01
2001
‐02
2002
‐03
2003
‐04
2004
‐05
2005
‐06
2006
‐07
2007
‐08
2008
‐09E
2009
‐10
2010
‐11
2011
‐12
2012
‐13
2013
‐14
2014
‐15
Agri growth 3yma, yoy MSP growth 3yma, yoy
Source: RBI, Ministry of Agriculture, PhillipCapital India Research We then looked at crop‐wise agriculture output and their MSPs to gauge if MSP plays a significant role for any particular crop. Our analysis showed: • For crops like pulses, oilseeds, and cotton, MSP changes have not influenced the
output so far. However, it is possible that further rises and better procurement facilities could change this pattern.
• The relationship between MSP and rice output was marginal to negligible. This implies that farmers are comfortable about rice production for a long‐time and are confident about the government’s procurement facility.
• MSP seems to be influencing sugarcane output, but with a lag of three years with a positive correlation of 0.48. Correlation ratio improves to 0.65 for 2005‐2015.
Page | 20 | PHILLIPCAPITAL INDIA RESEARCH
INDONOMICS UPDATE
Indian Kharif output, rainfall, and MSP Based on a regression analysis over 2004‐14, we found that kharif output is significantly dependent on monsoon as well as MSP (in this period the MSP hike was more pronounced). Before this, MSP did not play a significant role in influencing kharif output. We conclude that: • Rainfall quantum along with spatial and temporal distribution plays a crucial role
in summer (kharif) crop output. • Higher MSP hikes in pulses in 2015 should aid farmers in switching to pulses
production. Muted MSP hike in rice may not have significant impact on output, as better procurement facility for rice will keep farmers accustomed to producing rice.
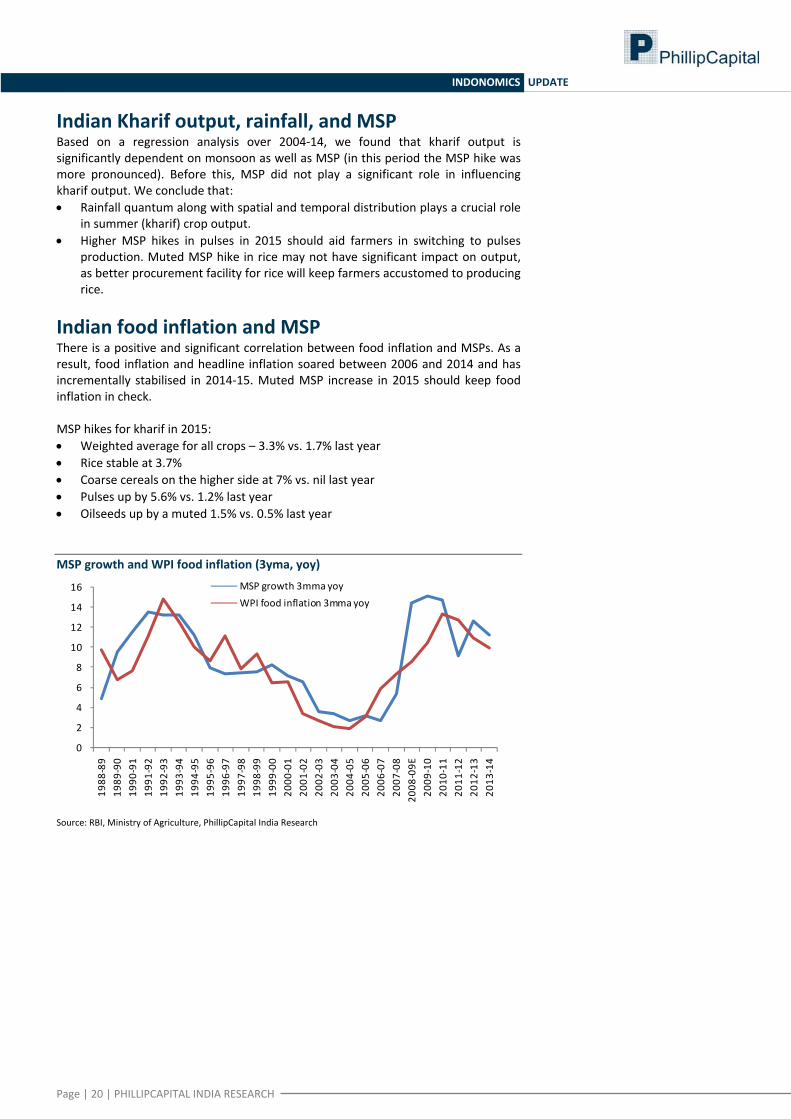
Indian food inflation and MSP There is a positive and significant correlation between food inflation and MSPs. As a result, food inflation and headline inflation soared between 2006 and 2014 and has incrementally stabilised in 2014‐15. Muted MSP increase in 2015 should keep food inflation in check. MSP hikes for kharif in 2015: • Weighted average for all crops – 3.3% vs. 1.7% last year • Rice stable at 3.7% • Coarse cereals on the higher side at 7% vs. nil last year • Pulses up by 5.6% vs. 1.2% last year • Oilseeds up by a muted 1.5% vs. 0.5% last year MSP growth and WPI food inflation (3yma, yoy)
0
2
4
6
8
10
12
14
16
1988
‐89
1989
‐90
1990
‐91
1991
‐92
1992
‐93
1993
‐94
1994
‐95
1995
‐96
1996
‐97
1997
‐98
1998
‐99
1999
‐00
2000
‐01
2001
‐02
2002
‐03
2003
‐04
2004
‐05
2005
‐06
2006
‐07
2007
‐08
2008
‐09E
2009
‐10
2010
‐11
2011
‐12
2012
‐13
2013
‐14
MSP growth 3mma yoyWPI food inflation 3mma yoy
Source: RBI, Ministry of Agriculture, PhillipCapital India Research
Page | 21 | PHILLIPCAPITAL INDIA RESEARCH
INDONOMICS UPDATE
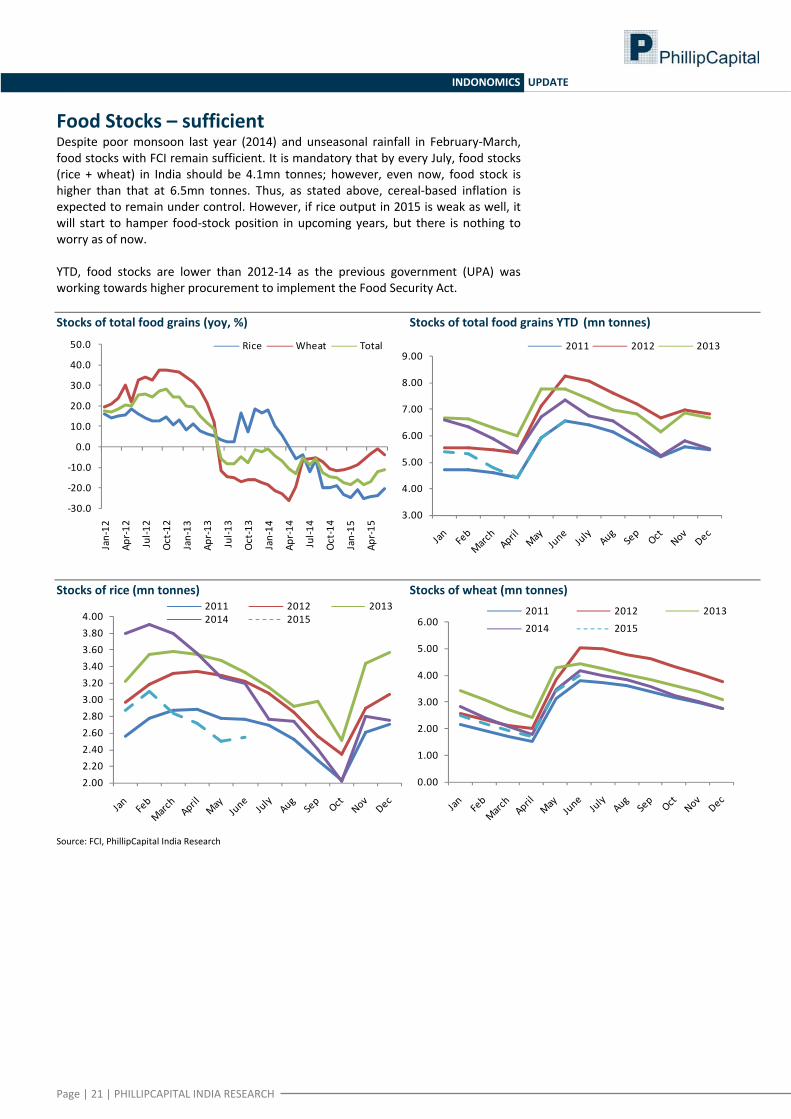
Food Stocks – sufficient Despite poor monsoon last year (2014) and unseasonal rainfall in February‐March, food stocks with FCI remain sufficient. It is mandatory that by every July, food stocks (rice + wheat) in India should be 4.1mn tonnes; however, even now, food stock is higher than that at 6.5mn tonnes. Thus, as stated above, cereal‐based inflation is expected to remain under control. However, if rice output in 2015 is weak as well, it will start to hamper food‐stock position in upcoming years, but there is nothing to worry as of now. YTD, food stocks are lower than 2012‐14 as the previous government (UPA) was working towards higher procurement to implement the Food Security Act. Stocks of total food grains (yoy, %) Stocks of total food grains YTD (mn tonnes)
‐30.0
‐20.0
‐10.0
0.0
10.0
20.0
30.0
40.0
50.0
Jan‐12
Apr‐12
Jul‐1
2
Oct‐12
Jan‐13
Apr‐13
Jul‐1
3
Oct‐13
Jan‐14
Apr‐14
Jul‐1
4
Oct‐14
Jan‐15
Apr‐15
Rice Wheat Total
3.00
4.00
5.00
6.00
7.00
8.00
9.002011 2012 2013
Stocks of rice (mn tonnes) Stocks of wheat (mn tonnes)
2.002.202.402.602.803.003.203.403.603.804.00
2011 2012 20132014 2015
0.00
1.00
2.00
3.00
4.00
5.00
6.002011 2012 2013
2014 2015
Source: FCI, PhillipCapital India Research
Page | 22 | PHILLIPCAPITAL INDIA RESEARCH
INDONOMICS UPDATE
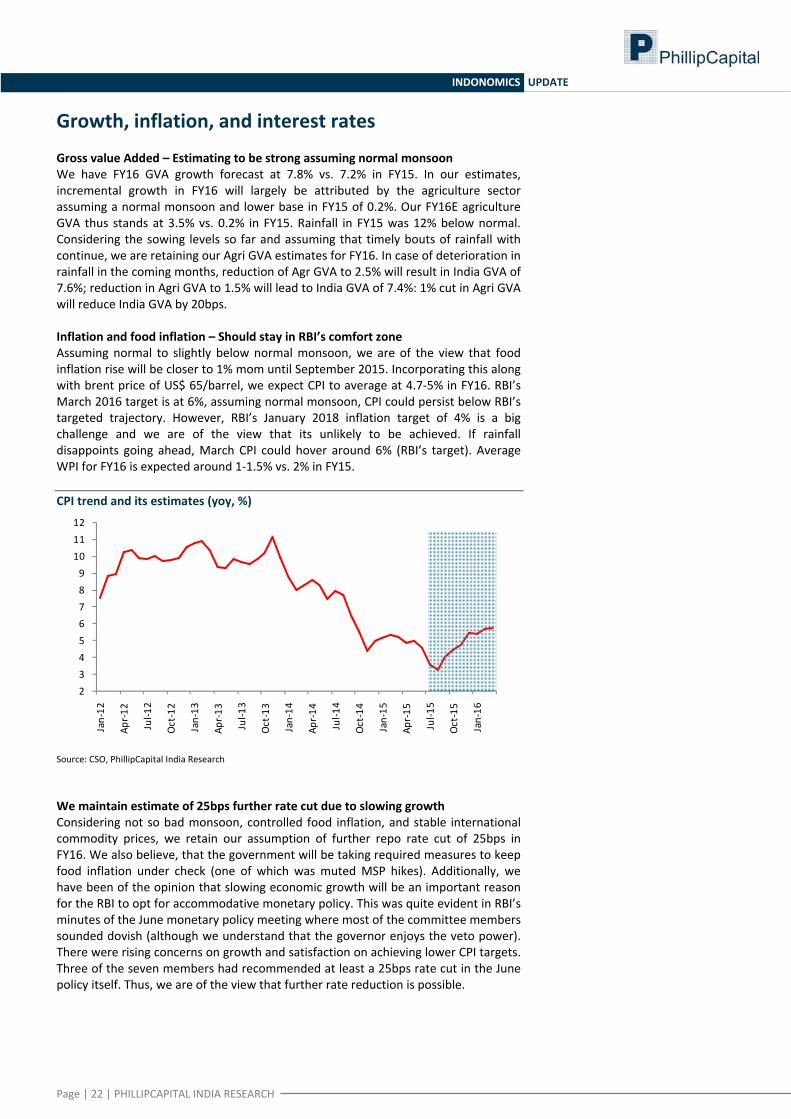
Growth, inflation, and interest rates Gross value Added – Estimating to be strong assuming normal monsoon We have FY16 GVA growth forecast at 7.8% vs. 7.2% in FY15. In our estimates, incremental growth in FY16 will largely be attributed by the agriculture sector assuming a normal monsoon and lower base in FY15 of 0.2%. Our FY16E agriculture GVA thus stands at 3.5% vs. 0.2% in FY15. Rainfall in FY15 was 12% below normal. Considering the sowing levels so far and assuming that timely bouts of rainfall with continue, we are retaining our Agri GVA estimates for FY16. In case of deterioration in rainfall in the coming months, reduction of Agr GVA to 2.5% will result in India GVA of 7.6%; reduction in Agri GVA to 1.5% will lead to India GVA of 7.4%: 1% cut in Agri GVA will reduce India GVA by 20bps. Inflation and food inflation – Should stay in RBI’s comfort zone Assuming normal to slightly below normal monsoon, we are of the view that food inflation rise will be closer to 1% mom until September 2015. Incorporating this along with brent price of US$ 65/barrel, we expect CPI to average at 4.7‐5% in FY16. RBI’s March 2016 target is at 6%, assuming normal monsoon, CPI could persist below RBI’s targeted trajectory. However, RBI’s January 2018 inflation target of 4% is a big challenge and we are of the view that its unlikely to be achieved. If rainfall disappoints going ahead, March CPI could hover around 6% (RBI’s target). Average WPI for FY16 is expected around 1‐1.5% vs. 2% in FY15. CPI trend and its estimates (yoy, %)
23456789
101112
Jan‐12
Apr‐12
Jul‐1
2
Oct‐12
Jan‐13
Apr‐13
Jul‐1
3
Oct‐13
Jan‐14
Apr‐14
Jul‐1
4
Oct‐14
Jan‐15
Apr‐15
Jul‐1
5
Oct‐15
Jan‐16
Source: CSO, PhillipCapital India Research We maintain estimate of 25bps further rate cut due to slowing growth Considering not so bad monsoon, controlled food inflation, and stable international commodity prices, we retain our assumption of further repo rate cut of 25bps in FY16. We also believe, that the government will be taking required measures to keep food inflation under check (one of which was muted MSP hikes). Additionally, we have been of the opinion that slowing economic growth will be an important reason for the RBI to opt for accommodative monetary policy. This was quite evident in RBI’s minutes of the June monetary policy meeting where most of the committee members sounded dovish (although we understand that the governor enjoys the veto power). There were rising concerns on growth and satisfaction on achieving lower CPI targets. Three of the seven members had recommended at least a 25bps rate cut in the June policy itself. Thus, we are of the view that further rate reduction is possible.
Page | 23 | PHILLIPCAPITAL INDIA RESEARCH
INDONOMICS UPDATE
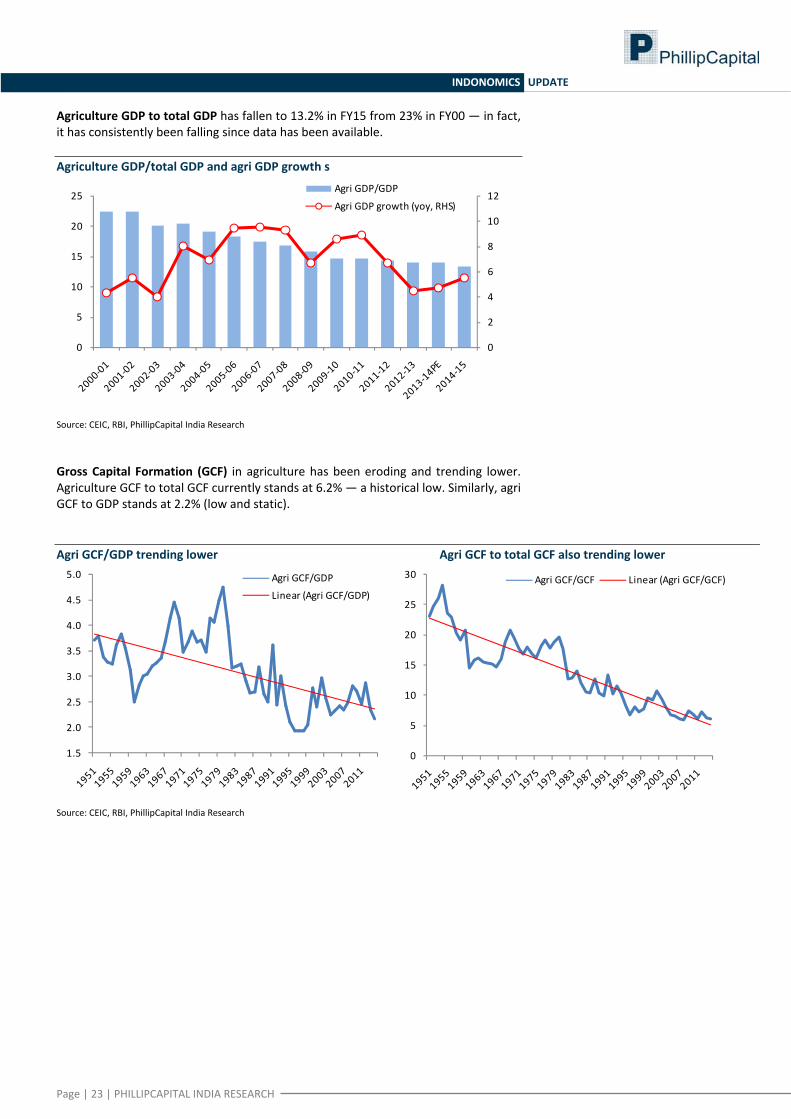
Agriculture GDP to total GDP has fallen to 13.2% in FY15 from 23% in FY00 — in fact, it has consistently been falling since data has been available. Agriculture GDP/total GDP and agri GDP growth s
0
2
4
6
8
10
12
0
5
10
15
20
25Agri GDP/GDP
Agri GDP growth (yoy, RHS)
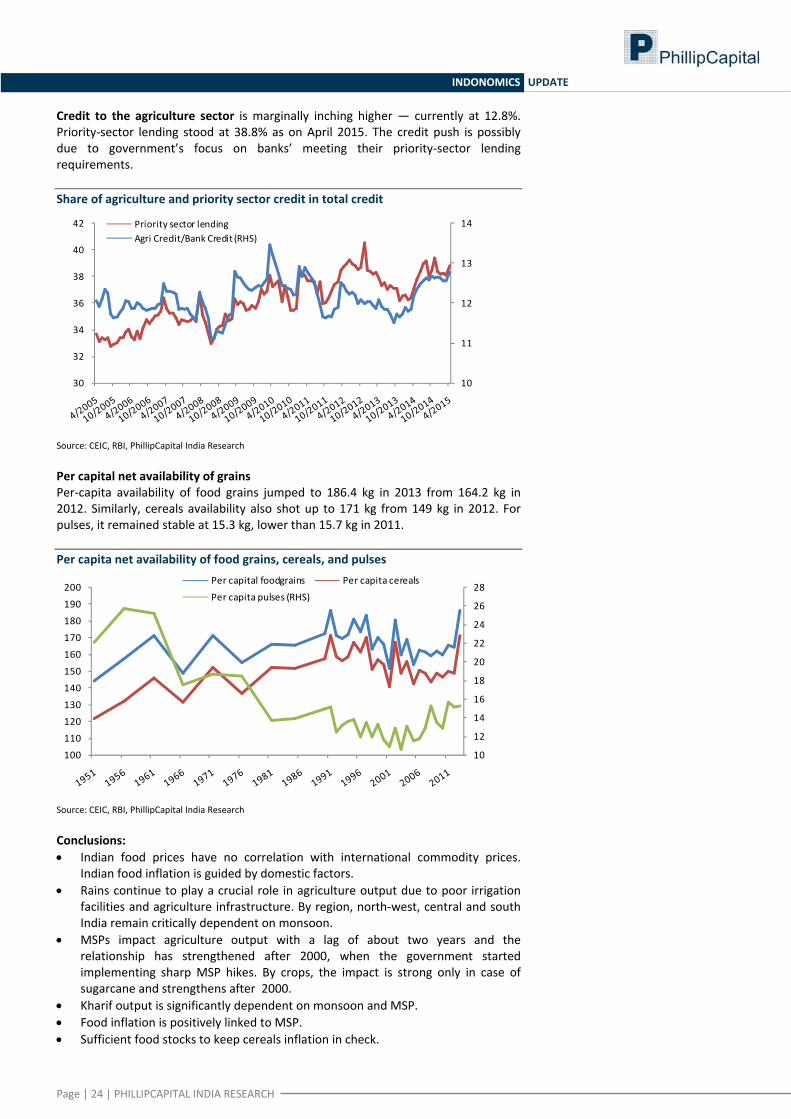
Source: CEIC, RBI, PhillipCapital India Research Gross Capital Formation (GCF) in agriculture has been eroding and trending lower. Agriculture GCF to total GCF currently stands at 6.2% — a historical low. Similarly, agri GCF to GDP stands at 2.2% (low and static). Agri GCF/GDP trending lower Agri GCF to total GCF also trending lower
1.5
2.0
2.5
3.0
3.5
4.0
4.5
5.0 Agri GCF/GDP
Linear (Agri GCF/GDP)
0
5
10
15
20
25
30 Agri GCF/GCF Linear (Agri GCF/GCF)
Source: CEIC, RBI, PhillipCapital India Research
Page | 24 | PHILLIPCAPITAL INDIA RESEARCH
INDONOMICS UPDATE
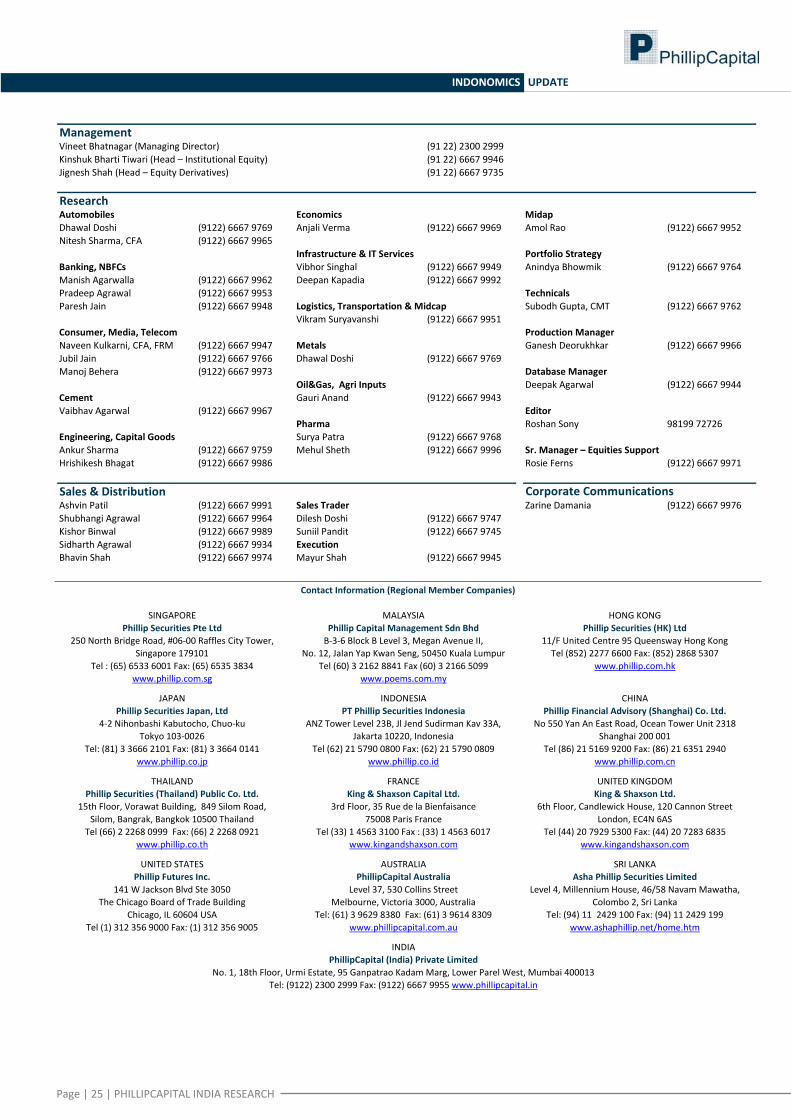
Credit to the agriculture sector is marginally inching higher — currently at 12.8%. Priority‐sector lending stood at 38.8% as on April 2015. The credit push is possibly due to government’s focus on banks’ meeting their priority‐sector lending requirements. Share of agriculture and priority sector credit in total credit
10
11
12
13
14
30
32
34
36
38
40
42 Priority sector lendingAgri Credit/Bank Credit (RHS)
Source: CEIC, RBI, PhillipCapital India Research Per capital net availability of grains Per‐capita availability of food grains jumped to 186.4 kg in 2013 from 164.2 kg in 2012. Similarly, cereals availability also shot up to 171 kg from 149 kg in 2012. For pulses, it remained stable at 15.3 kg, lower than 15.7 kg in 2011. Per capita net availability of food grains, cereals, and pulses
10
12
14
16
18
20
22
24
26
28
100
110
120
130
140
150
160
170
180
190
200Per capital foodgrains Per capita cereals
Per capita pulses (RHS)
Source: CEIC, RBI, PhillipCapital India Research Conclusions: • Indian food prices have no correlation with international commodity prices.
Indian food inflation is guided by domestic factors. • Rains continue to play a crucial role in agriculture output due to poor irrigation
facilities and agriculture infrastructure. By region, north‐west, central and south India remain critically dependent on monsoon.
• MSPs impact agriculture output with a lag of about two years and the relationship has strengthened after 2000, when the government started implementing sharp MSP hikes. By crops, the impact is strong only in case of sugarcane and strengthens after 2000.
• Kharif output is significantly dependent on monsoon and MSP. • Food inflation is positively linked to MSP. • Sufficient food stocks to keep cereals inflation in check.
Page | 25 | PHILLIPCAPITAL INDIA RESEARCH
INDONOMICS UPDATE
Management
(91 22) 2300 2999Kinshuk Bharti Tiwari (Head – Institutional Equity) (91 22) 6667 9946
(91 22) 6667 9735
Research Economics Midap
Dhawal Doshi (9122) 6667 9769 Anjali Verma (9122) 6667 9969 Amol Rao (9122) 6667 9952Nitesh Sharma, CFA (9122) 6667 9965
Infrastructure & IT Services Portfolio StrategyBanking, NBFCs Vibhor Singhal (9122) 6667 9949 Anindya Bhowmik (9122) 6667 9764Manish Agarwalla (9122) 6667 9962 Deepan Kapadia (9122) 6667 9992Pradeep Agrawal (9122) 6667 9953 TechnicalsParesh Jain (9122) 6667 9948 Logistics, Transportation & Midcap Subodh Gupta, CMT (9122) 6667 9762
Vikram Suryavanshi (9122) 6667 9951Consumer, Media, Telecom Production ManagerNaveen Kulkarni, CFA, FRM (9122) 6667 9947 Metals Ganesh Deorukhkar (9122) 6667 9966Jubil Jain (9122) 6667 9766 Dhawal Doshi (9122) 6667 9769Manoj Behera (9122) 6667 9973 Database Manager
Oil&Gas, Agri Inputs Deepak Agarwal (9122) 6667 9944Cement Gauri Anand (9122) 6667 9943Vaibhav Agarwal (9122) 6667 9967 Editor
Pharma Roshan Sony 98199 72726Engineering, Capital Goods Surya Patra (9122) 6667 9768Ankur Sharma (9122) 6667 9759 Mehul Sheth (9122) 6667 9996 Sr. Manager – Equities SupportHrishikesh Bhagat (9122) 6667 9986 Rosie Ferns (9122) 6667 9971
Sales & Distribution Ashvin Patil (9122) 6667 9991 Sales Trader Zarine Damania (9122) 6667 9976Shubhangi Agrawal (9122) 6667 9964 Dilesh Doshi (9122) 6667 9747 Kishor Binwal (9122) 6667 9989 Suniil Pandit (9122) 6667 9745Sidharth Agrawal (9122) 6667 9934 ExecutionBhavin Shah (9122) 6667 9974 Mayur Shah (9122) 6667 9945
Corporate Communications
Vineet Bhatnagar (Managing Director)
Jignesh Shah (Head – Equity Derivatives)
Automobiles
Contact Information (Regional Member Companies)
SINGAPORE Phillip Securities Pte Ltd
250 North Bridge Road, #06‐00 Raffles City Tower, Singapore 179101
Tel : (65) 6533 6001 Fax: (65) 6535 3834 www.phillip.com.sg
MALAYSIA Phillip Capital Management Sdn Bhd B‐3‐6 Block B Level 3, Megan Avenue II,
No. 12, Jalan Yap Kwan Seng, 50450 Kuala Lumpur Tel (60) 3 2162 8841 Fax (60) 3 2166 5099
www.poems.com.my
HONG KONG Phillip Securities (HK) Ltd
11/F United Centre 95 Queensway Hong Kong Tel (852) 2277 6600 Fax: (852) 2868 5307
www.phillip.com.hk
JAPAN Phillip Securities Japan, Ltd
4‐2 Nihonbashi Kabutocho, Chuo‐ku Tokyo 103‐0026
Tel: (81) 3 3666 2101 Fax: (81) 3 3664 0141 www.phillip.co.jp
INDONESIA PT Phillip Securities Indonesia
ANZ Tower Level 23B, Jl Jend Sudirman Kav 33A, Jakarta 10220, Indonesia
Tel (62) 21 5790 0800 Fax: (62) 21 5790 0809 www.phillip.co.id
CHINA Phillip Financial Advisory (Shanghai) Co. Ltd.
No 550 Yan An East Road, Ocean Tower Unit 2318 Shanghai 200 001
Tel (86) 21 5169 9200 Fax: (86) 21 6351 2940 www.phillip.com.cn
THAILAND Phillip Securities (Thailand) Public Co. Ltd.
15th Floor, Vorawat Building, 849 Silom Road, Silom, Bangrak, Bangkok 10500 Thailand
Tel (66) 2 2268 0999 Fax: (66) 2 2268 0921 www.phillip.co.th
FRANCE King & Shaxson Capital Ltd.
3rd Floor, 35 Rue de la Bienfaisance 75008 Paris France
Tel (33) 1 4563 3100 Fax : (33) 1 4563 6017 www.kingandshaxson.com
UNITED KINGDOM King & Shaxson Ltd.
6th Floor, Candlewick House, 120 Cannon Street London, EC4N 6AS
Tel (44) 20 7929 5300 Fax: (44) 20 7283 6835 www.kingandshaxson.com
UNITED STATES Phillip Futures Inc.
141 W Jackson Blvd Ste 3050 The Chicago Board of Trade Building
Chicago, IL 60604 USA Tel (1) 312 356 9000 Fax: (1) 312 356 9005
AUSTRALIA PhillipCapital Australia
Level 37, 530 Collins Street Melbourne, Victoria 3000, Australia
Tel: (61) 3 9629 8380 Fax: (61) 3 9614 8309 www.phillipcapital.com.au
SRI LANKA Asha Phillip Securities Limited
Level 4, Millennium House, 46/58 Navam Mawatha, Colombo 2, Sri Lanka
Tel: (94) 11 2429 100 Fax: (94) 11 2429 199 www.ashaphillip.net/home.htm
INDIA PhillipCapital (India) Private Limited
No. 1, 18th Floor, Urmi Estate, 95 Ganpatrao Kadam Marg, Lower Parel West, Mumbai 400013 Tel: (9122) 2300 2999 Fax: (9122) 6667 9955 www.phillipcapital.in
Page | 26 | PHILLIPCAPITAL INDIA RESEARCH
INDONOMICS UPDATE
Disclosures and Disclaimers PhillipCapital (India) Pvt. Ltd. has three independent equity research groups: Institutional Equities, Institutional Equity Derivatives and Private Client Group. This report has been prepared by Institutional Equities Group. The views and opinions expressed in this document may or may not match or may be contrary at times with the views, estimates, rating, target price of the other equity research groups of PhillipCapital (India) Pvt. Ltd. This report is issued by PhillipCapital (India) Pvt. Ltd. which is regulated by SEBI. PhillipCapital (India) Pvt. Ltd. is a subsidiary of Phillip (Mauritius) Pvt. Ltd. References to "PCIPL" in this report shall mean PhillipCapital (India) Pvt. Ltd unless otherwise stated. This report is prepared and distributed by PCIPL for information purposes only and neither the information contained herein nor any opinion expressed should be construed or deemed to be construed as solicitation or as offering advice for the purposes of the purchase or sale of any security, investment or derivatives. The information and opinions contained in the Report were considered by PCIPL to be valid when published. The report also contains information provided to PCIPL by third parties. The source of such information will usually be disclosed in the report. Whilst PCIPL has taken all reasonable steps to ensure that this information is correct, PCIPL does not offer any warranty as to the accuracy or completeness of such information. Any person placing reliance on the report to undertake trading does so entirely at his or her own risk and PCIPL does not accept any liability as a result. Securities and Derivatives markets may be subject to rapid and unexpected price movements and past performance is not necessarily an indication to future performance. This report does not have regard to the specific investment objectives, financial situation and the particular needs of any specific person who may receive this report. Investors must undertake independent analysis with their own legal, tax and financial advisors and reach their own regarding the appropriateness of investing in any securities or investment strategies discussed or recommended in this report and should understand that statements regarding future prospects may not be realized. In no circumstances it be used or considered as an offer to sell or a solicitation of any offer to buy or sell the Securities mentioned in it. The information contained in the research reports may have been taken from trade and statistical services and other sources, which we believe are reliable. PhillipCapital (India) Pvt. Ltd. or any of its group/associate/affiliate companies do not guarantee that such information is accurate or complete and it should not be relied upon as such. Any opinions expressed reflect judgments at this date and are subject to change without notice Important: These disclosures and disclaimers must be read in conjunction with the research report of which it forms part. Receipt and use of the research report is subject to all aspects of these disclosures and disclaimers. Additional information about the issuers and securities discussed in this research report is available on request. Certifications: The research analyst(s) who prepared this research report hereby certifies that the views expressed in this research report accurately reflect the research analyst’s personal views about all of the subject issuers and/or securities, that the analyst have no known conflict of interest and no part of the research analyst’s compensation was, is or will be, directly or indirectly, related to the specific views or recommendations contained in this research report. The Research Analyst certifies that he /she or his / her family members does not own the stock(s) covered in this research report. Independence/Conflict: PhillipCapital (India) Pvt. Ltd. has not had an investment banking relationship with, and has not received any compensation for investment banking services from, the subject issuers in the past twelve (12) months, and PhillipCapital (India) Pvt. Ltd does not anticipate receiving or intend to seek compensation for investment banking services from the subject issuers in the next three (3) months. PhillipCapital (India) Pvt. Ltd is not a market maker in the securities mentioned in this research report, although it or its employees, directors, or affiliates may hold either long or short positions in such securities. PhillipCapital (India) Pvt. Ltd may not hold more than 1% of the shares of the company(ies) covered in this report. Suitability and Risks: This research report is for informational purposes only and is not tailored to the specific investment objectives, financial situation or particular requirements of any individual recipient hereof. Certain securities may give rise to substantial risks and may not be suitable for certain investors. Each investor must make its own determination as to the appropriateness of any securities referred to in this research report based upon the legal, tax and accounting considerations applicable to such investor and its own investment objectives or strategy, its financial situation and its investing experience. The value of any security may be positively or adversely affected by changes in foreign exchange or interest rates, as well as by other financial, economic or political factors. Past performance is not necessarily indicative of future performance or results. Sources, Completeness and Accuracy: The material herein is based upon information obtained from sources that PCIPL and the research analyst believe to be reliable, but neither PCIPL nor the research analyst represents or guarantees that the information contained herein is accurate or complete and it should not be relied upon as such. Opinions expressed herein are current opinions as of the date appearing on this material and are subject to change without notice. Furthermore, PCIPL is under no obligation to update or keep the information current. Copyright: The copyright in this research report belongs exclusively to PCIPL. All rights are reserved. Any unauthorized use or disclosure is prohibited. No reprinting or reproduction, in whole or in part, is permitted without the PCIPL’s prior consent, except that a recipient may reprint it for internal circulation only and only if it is reprinted in its entirety. Caution: Risk of loss in trading in can be substantial. You should carefully consider whether trading is appropriate for you in light of your experience, objectives, financial resources and other relevant circumstances. For U.S. persons only: This research report is a product of PhillipCapital (India) Pvt Ltd. which is the employer of the research analyst(s) who has prepared the research report. The research analyst(s) preparing the research report is/are resident outside the United States (U.S.) and are not associated persons of any U.S. regulated broker‐dealer and therefore the analyst(s) is/are not subject to supervision by a U.S. broker‐dealer, and is/are not required to satisfy the regulatory licensing requirements of FINRA or required to otherwise comply with U.S. rules or regulations regarding, among other things, communications with a subject company, public appearances and trading securities held by a research analyst account. This report is intended for distribution by PhillipCapital (India) Pvt Ltd. only to "Major Institutional Investors" as defined by Rule 15a‐6(b)(4) of the U.S. Securities and Exchange Act, 1934 (the Exchange Act) and interpretations thereof by U.S. Securities and Exchange Commission (SEC) in reliance on Rule 15a 6(a)(2). If the recipient of this report is not a Major Institutional Investor as specified above, then it should not act upon this report and return the same to the sender. Further, this report may not be copied, duplicated and/or transmitted onward to any U.S. person, which is not the Major Institutional Investor. In reliance on the exemption from registration provided by Rule 15a‐6 of the Exchange Act and interpretations thereof by the SEC in order to conduct certain business with Major Institutional Investors, PhillipCapital (India) Pvt Ltd. has entered into an agreement with a U.S. registered broker‐dealer, Marco Polo Securities Inc. ("Marco Polo").Transactions in securities discussed in this research report should be effected through Marco Polo or another U.S. registered broker dealer. PhillipCapital (India) Pvt. Ltd. Registered office: No. 1, 18th Floor, Urmi Estate, 95 Ganpatrao Kadam Marg, Lower Parel West, Mumbai 400013