PBT (14.8) (6.1) (2.1) 37.1 APP Securities Company ... · APP Securities Pty Ltd ... operation of...
18
APP Securities Pty Ltd ABN 45 112 871 842 5 December 2017 1 Sydney Office: Level 41, 259 George Street Sydney NSW 2000 Australia Tel: (61) 2 9226 0000 Website: www.appsecurities.com.au APP Securities Company Research 5 December 2017 Sky and Space Global Communications SAS-ASX A$ 0.14 TARGET PRICE A$0.45 SPECULATIVE BUY Sky & Space Global Ltd. is a company that aims to engage in deployment and operation of nano-satellites in orbit to provide global communication infrastructure. The Company was founded by three founders Meir Moalem, Meidad Pariente and Yonatan Shrama. David Fraser +61 2 9226 0092 [email protected] Sky & Space Global – Nano-satellite company set to revolutionise equatorial communications Sky and Space Global (SAS) SAS aims to provide low cost, nano-satellite communication coverage on an anywhere to everywhere base with relatively low maintenance costs. Furthermore, SAS develops proprietary network management software systems that enable satellites to autonomously manage deployment, orbital control and M2M communication with little interference from ground stations. This reduces capital expenditure, launch and operating costs and will allow SAS to provide cost effective solutions to the telecommunication and international transport industries. Investor return Based on our price target, SAS offers investors a total stock return of over 200%. If we assume that SAS’s revenue in FY22F, on 200 satellites, is at the top end of the company’s guidance range (A$1,000m) then the stock in our view could be valued well over A$2.50. The three key issues for the stock in our view are technology, cost and the size of the potential revenue. SAS continues to sign contracts that are providing investors with more certainty around the capital cost of the planned constellation going forward. What remains as the key question is the quantum, timing and the risk associated with the potential revenue streams. Once SAS starts to sign contracts with reputable credit worthy telecommunications companies the earnings outlook will de-risk resulting in higher revenue forecasts and lower discount rates being applied to the future cash flows resulting in higher valuations. A capital raise in 2018 likely in our view With a forecast capital spend of A$65m in FY19F and cash on the balance sheet of A$10m as at FY17, we believe SAS will need to come to market in 2018. We have assumed an A$50m capital raise in our FY18F forecasts. This is unlikely to occur before SAS has signed some meaningful telecommunication commercial agreements with service providers in the equatorial regions. Valuation We have a 12 month forward “base case” discounted cash flow valuation for SAS of $0.45; thus, our price target of $0.45. This is based on a 1.0m customer base spread evenly over voice and data, messaging and machine to machine (M2M). We have assumed plans are priced at a 50% discount to the lowest pricing being offered by competitors in the relevant services. This translates to a revenue forecast of A$206m in FY22F that is ~66% below managements “bottom of the range” guidance of A$600m. Given it will not be until 2020 that the proposed 200 nano-sats will be fully operational, our forecasts have a significant amount of risk associated with them. We also suspect we may be being unduly conservative. Thus, we rate an investment in SAS at this stage as Speculative but believe the potential return outweighs the risk. Company Data Shares outstanding (m) 1,695 Price ($) 0.140 Market Capitalisation ($m) 237.4 Free Float (%) 42.2% Free Float Market Capitalisation ($m) 100.2 12 month low ($) 0.07 12 month high ($) 0.28 Average daily volume (3 month) ('000) Data Source: FactSet Earnings Summary (A$m) Year end June FY17 FY18F FY19F FY20F Sales revenue 0.0 2.6 26.3 86.1 EBITDA (14.9) (5.5) 14.0 69.7 PBT (14.8) (6.1) (2.1) 37.1 Underlying NPAT (14.8) (7.8) (4.5) 28.0 Reported NPAT (14.9) (7.8) (4.5) 28.0 Reported EPS (c) (1.1) (0.5) (0.2) 1.4 Underlying EPS diluted (c) (1.1) (0.5) (0.2) 1.3 Underlying P/E (x) (34.5) (28.7) (64.8) 10.4 DPS (c) 0.0 0.0 0.0 1.0 Payout ratio (%) 0% 0% 0% 50% Franking (%) 0% 0% 0% 0% Dividend yield (%) 0.0% 0.0% 0.0% 7.1% Gross Yield (%) 0.0% 0.0% 0.0% 7.1% Data Source: Company, APP Securities Share Price Performance $0.00 $0.05 $0.10 $0.15 $0.20 $0.25 $0.30 Nov 16 Jan 17 Mar 17 May 17 Jul 17 Sep 17 Nov 17 Source: FactSet APP Securities contributes all company estimates to Bloomberg, Thomson Reuters, FactSet and Capital IQ.
Transcript of PBT (14.8) (6.1) (2.1) 37.1 APP Securities Company ... · APP Securities Pty Ltd ... operation of...

APP Securities Pty Ltd ABN 45 112 871 842 5 December 2017 1
Sydney Office: Level 41, 259 George Street Sydney NSW 2000 Australia Tel: (61) 2 9226 0000 Website: www.appsecurities.com.au
APP Securities Company Research 5 December 2017
Sky and Space Global Communications SAS-ASX A$ 0.14 TARGET PRICE A$0.45 SPECULATIVE BUY
Sky & Space Global Ltd. is a company that aims to engage in deployment and operation of nano-satellites in orbit to provide global communication infrastructure. The Company was founded by three founders Meir Moalem, Meidad Pariente and Yonatan Shrama.
David Fraser +61 2 9226 0092 [email protected]
Sky & Space Global – Nano-satellite company set to revolutionise equatorial communications
Sky and Space Global (SAS)
SAS aims to provide low cost, nano-satellite communication coverage on an anywhere to everywhere base with relatively low maintenance costs. Furthermore, SAS develops proprietary network management software systems that enable satellites to autonomously manage deployment, orbital control and M2M communication with little interference from ground stations. This reduces capital expenditure, launch and operating costs and will allow SAS to provide cost effective solutions to the telecommunication and international transport industries.
Investor return
Based on our price target, SAS offers investors a total stock return of over 200%. If we assume that SAS’s revenue in FY22F, on 200 satellites, is at the top end of the company’s guidance range (A$1,000m) then the stock in our view could be valued well over A$2.50.
The three key issues for the stock in our view are technology, cost and the size of the potential revenue. SAS continues to sign contracts that are providing investors with more certainty around the capital cost of the planned constellation going forward. What remains as the key question is the quantum, timing and the risk associated with the potential revenue streams. Once SAS starts to sign contracts with reputable credit worthy telecommunications companies the earnings outlook will de-risk resulting in higher revenue forecasts and lower discount rates being applied to the future cash flows resulting in higher valuations.
A capital raise in 2018 likely in our view
With a forecast capital spend of A$65m in FY19F and cash on the balance sheet of A$10m as at FY17, we believe SAS will need to come to market in 2018. We have assumed an A$50m capital raise in our FY18F forecasts. This is unlikely to occur before SAS has signed some meaningful telecommunication commercial agreements with service providers in the equatorial regions.
Valuation
We have a 12 month forward “base case” discounted cash flow valuation for SAS of $0.45; thus, our price target of $0.45.
This is based on a 1.0m customer base spread evenly over voice and data, messaging and machine to machine (M2M). We have assumed plans are priced at a 50% discount to the lowest pricing being offered by competitors in the relevant services. This translates to a revenue forecast of A$206m in FY22F that is ~66% below managements “bottom of the range” guidance of A$600m.
Given it will not be until 2020 that the proposed 200 nano-sats will be fully operational, our forecasts have a significant amount of risk associated with them. We also suspect we may be being unduly conservative.
Thus, we rate an investment in SAS at this stage as Speculative but believe the potential return outweighs the risk.
Company Data
Shares outstanding (m) 1,695
Price ($) 0.140
Market Capitalisation ($m) 237.4
Free Float (%) 42.2%
Free Float Market Capitalisation ($m) 100.2
12 month low ($) 0.07
12 month high ($) 0.28
Average daily volume (3 month) ('000)
Data Source: FactSet
Earnings Summary (A$m)
Year end June FY17 FY18F FY19F FY20F
Sales revenue 0.0 2.6 26.3 86.1
EBITDA (14.9) (5.5) 14.0 69.7
PBT (14.8) (6.1) (2.1) 37.1
Underlying NPAT (14.8) (7.8) (4.5) 28.0
Reported NPAT (14.9) (7.8) (4.5) 28.0
Reported EPS (c) (1.1) (0.5) (0.2) 1.4
Underlying EPS diluted (c) (1.1) (0.5) (0.2) 1.3
Underlying P/E (x) (34.5) (28.7) (64.8) 10.4
DPS (c) 0.0 0.0 0.0 1.0
Payout ratio (%) 0% 0% 0% 50%
Franking (%) 0% 0% 0% 0%
Dividend yield (%) 0.0% 0.0% 0.0% 7.1%
Gross Yield (%) 0.0% 0.0% 0.0% 7.1%
Data Source: Company, APP Securities
Share Price Performance
$0.00
$0.05
$0.10
$0.15
$0.20
$0.25
$0.30
Nov 16 Jan 17 Mar 17 May 17 Jul 17 Sep 17 Nov 17
Source: FactSet
APP Securities contributes all company estimates to Bloomberg, Thomson Reuters, FactSet and Capital IQ.

Sky and Space Global APP Securities Research
APP Securities Pty Ltd ABN 45 112 871 842 5 December 2017 2
Sydney Office: Level 41, 259 George Street Sydney NSW 2000 Australia Tel: (61) 2 9226 0000 Website: www.appsecurities.com.au
Sky and Space Global
Summary Profit and Loss A$m FY16 FY17 FY18F FY19F FY20F
Recommendation Speculative Buy Sales revenue 0.0 0.0 2.6 26.3 86.1
Price ($) 0.14 Other operating costs (5.8) (14.9) (8.2) (12.3) (16.4)
Target Price ($) 0.45 EBITDA (5.8) (14.9) (5.5) 14.0 69.7
Upside (Downside) (%) 221.4% D&A 0.0 0.0 (0.7) (16.3) (32.3)
Gross Yield (%) 0.0% EBIT (5.8) (14.9) (6.2) (2.3) 37.3
Total Stock Return (%) 221.4% Net interest 0.0 0.1 0.1 0.3 (0.2)
Shares (m) 1,695 PBT (5.8) (14.8) (6.1) (2.1) 37.1
Diluted shares(m) 1,721 Tax 0.0 0.0 (1.7) (2.4) (9.1)
Market Capitalisation ($m) 237.4 Profit (5.8) (14.8) (7.8) (4.5) 28.0
Free Float Market Capitalisation ($m) 100.2 Minority interests 0.0 0.0 0.0 0.0 0.0
Underlying NPAT (5.8) (14.8) (7.8) (4.5) 28.0
Description
Non-recurring items (0.0) (0.1) 0.0 0.0 0.0
Reported NPAT (5.8) (14.9) (7.8) (4.5) 28.0
Cashflow A$m FY16 FY17 FY18F FY19F FY20F
Operating EBITDA (5.8) (14.9) (5.5) 14.0 69.7
Change in working capital 0.1 0.2 (0.2) (0.0) 0.0
Net interest 0.0 0.1 0.1 0.3 (0.2)
Tax paid 0.0 0.0 0.0 0.0 (4.9)
Other 5.3 11.4 0.0 0.0 0.0
Valuation Operating cashflow (0.3) (3.3) (5.7) 14.3 64.6
Discounted cash flow (12 month forward) $0.45 Capital expenditure (0.3) (4.9) (4.8) (64.7) (66.0)
Net Divestment/(Acquistions) 0.0 0.0 0.0 0.0 0.0
Other 0.2 0.0 0.0 0.0 0.0
Financial Metrics FY16 FY17 FY18F FY19F FY20F Investing cashflow (0.1) (4.9) (4.8) (64.7) (66.0)
Reported EPS (c) (1.7) (1.1) (0.5) (0.2) 1.4 Change in Debt 0.0 0.0 0.0 9.2 7.6
Underlying EPS (c) (1.7) (1.1) (0.5) (0.2) 1.4 Change in Equity 4.6 15.5 50.0 0.0 0.0
Underlying EPS diluted (c) (0.8) (1.1) (0.5) (0.2) 1.3 Dividends paid 0.0 0.0 0.0 0.0 (10.3)
Underlying P/E (x) (10.6) (33.9) (28.3) (64.0) 10.3 Other (0.3) (1.2) (3.8) 0.0 0.0
Underlying P/E (diluted) (x) (21.5) (34.5) (28.7) (64.8) 10.4 Financing cashflow 4.2 14.4 46.2 9.2 (2.7)
DPS (c) 0.0 0.0 0.0 0.0 1.0 Net cashflow 3.8 6.2 35.8 (41.2) (4.1)
Payout ratio (%) 0.0% 0.0% 0.0% 0.0% 50.0%
Franking (%) 0% 0% 0% 0% 0% Balance Sheet A$m FY16 FY17 FY18F FY19F FY20F
Dividend yield (%) 0.0% 0.0% 0.0% 0.0% 7.1% Cash and Deposits 3.9 9.9 45.8 4.6 0.5
Gross Yield (%) 0.0% 0.0% 0.0% 0.0% 7.1% Receivables 0.1 0.4 0.7 5.3 17.2
Book value (c) 0.3 0.9 2.6 2.5 3.6 Financial assets 0.0 0.0 0.0 0.0 0.0
Net Tangible Assets (c) 0.3 0.9 2.6 2.5 3.6 Other Current Assets 0.0 0.0 0.0 0.0 0.0
Price to Book value (x) 67.7 39.8 5.3 5.5 3.9 Total Current Assets 3.9 10.3 46.4 9.8 17.7
Price to NTA (x) 67.7 39.8 5.3 5.5 3.9 PPE 0.1 4.1 8.2 56.5 90.2
Cash Conversion n/m n/m n/m 100% 100% Deferred tax assets 0.0 o 0.0 0.0 0.0
Op. cashflow per share (c) (0.1) (0.6) (0.7) (2.4) (0.1) Intangibles (incl. goodwill) 0.1 1.1 1.1 1.1 1.1
Price to OCFS (x) (373) (156) (39.5) 20.4 4.5 Other 0.0 0.0 0.0 0.0 0.0
Interest cover (EBIT/Net int) (x) n/m n/m n/m n/m n/m Total Non Current Assets 0.3 5.2 9.3 57.6 91.3
Underlying ROE (%) n/m n/m n/m -8.3% 43.8% Total Assets 4.2 15.5 55.7 67.5 109.0
Underlying ROA (%) n/m n/m n/m -0.9% 10.6% Payables 0.2 0.6 0.7 5.3 17.2
Interest Bearing Debt 0.0 0.0 0.0 0.0 0.0
Multiples FY16 FY17 FY18F FY19F FY20F Other 0.0 0.0 0.0 0.0 0.0
Net debt (3.9) (9.9) (45.8) 4.7 16.3 Total Current Liabilities 0.2 0.6 0.7 5.3 17.3
Market Equity (Y/E) 221.2 581.6 287.4 287.4 287.4 Interest Bearing Debt 0.0 0.0 0.0 9.2 16.8
EV 217.3 571.7 241.6 292.0 303.7 Long Term Provisions 0.0 0.0 0.0 0.0 0.0
EV/EBITDA (x) (37.7) (38.5) (43.7) 20.8 4.4 Deferred Tax 0.0 0.0 0.0 0.0 0.0
EV/EBIT (x) (37.7) (38.5) (38.9) (125.0) 8.1 Total Non Current Liabilities 0.0 0.0 0.0 9.2 16.8
Total Liabilities 0.2 0.6 0.7 14.5 34.1
Growth Rates FY16 FY17 FY18F FY19F FY20F Shareholders Equity 9.5 30.6 80.6 80.6 80.6
Revenue growth (%) n/m n/m n/m n/m 227% Retained Earnings/(Losses) (5.8) (20.6) (28.4) (32.9) (18.9)
EBITDA growth (%) n/m n/m n/m n/m 397.2% Reserves/Other 0.1 3.3 2.8 5.2 13.2
NPAT growth (%) n/m n/m n/m n/m -723.6% Minority Interests 0.0 0.0 0.0 0.0 0.0
Underlying EPS (dil) growth (%) n/m n/m n/m n/m n/m Total Equity 4.2 14.9 55.0 52.9 74.9
SAS-ASX
Sky & Space Global Ltd. is a company that aims to engage in deployment and
operation of nano-satellites in orbit to provide global communication infrastructure.
Its core business is to construct a communication infrastructure based on nano-
satellite technology and develop software systems that will deploy, maintain orbit
control and handle communication code between each of the nano-satellites to
provide global coverage once a sufficient global network of nano-satellites is
deployed. The company was founded by Mr. Meidad Pariente and is headquartered
in Perth, Australia.

Sky and Space Global APP Securities Research
APP Securities Pty Ltd ABN 45 112 871 842 5 December 2017 3
Sydney Office: Level 41, 259 George Street Sydney NSW 2000 Australia Tel: (61) 2 9226 0000 Website: www.appsecurities.com.au
Investment Case – Yet another disrupter
In our view, Sky and Space Global (SAS) will provide customers with an attractive alternative option in the
satellite communication industry given its low capital cost of deployment compared with existing players.
SAS plans to earn revenue from two main sources:
Wholesale revenue from direct customer sales – regional telecommunications providers, global
corporates, airline/shipping/infrastructure companies, governments;
Fee for services per bandwidth through reseller agreements – retail customers via deals with global
Telcos.
SAS holds an advantage in the complete system and not only just the satellites themselves. The satellites,
network, software, orbits, frequencies, customers and market access all collectively provide a first mover
advantage to SAS in APP’s view.
It is developing its own network management software, using specific orbits, SAS is licensing spectrum with the
International Telecommunications Union (ITU), and has the advantage of being a “first mover”.
Its nano-satellite technology will be upgraded constantly as it plans to replace 25% of the constellation on a
yearly basis. This means that the services provided are always improving and more importantly will enable SAS
to keep up with the market as it ultimately moves from 4G into 5G in the mid 2020’s..
This in conjunction with the customer’ base SAS is building will make it difficult for newcomers to become a
commercial threat easily.
Figure 1. The Pearls – SAS Constellation satellites
Source: Company data
We have modelled the company and have applied in our view very conservative revenue assumptions. This,
given the capital to construct the constellation has yet to be raised and the constellation has yet to be deployed.
Despite our FY22F revenue assumption being down 65% of managements low case scenario we can demonstrate
a valuation of $0.45 per share on a post equity raise diluted basis.
This gives investors a forecast return of over 200%.
Given it will not be until 2020 that the proposed ~200 nano-sats will be fully operational, our forecasts have a
significant amount of risk associated with them.
Thus, we rate an investment in SAS at this stage as Speculative but believe the potential return outweighs the
risk

Sky and Space Global APP Securities Research
APP Securities Pty Ltd ABN 45 112 871 842 5 December 2017 4
Sydney Office: Level 41, 259 George Street Sydney NSW 2000 Australia Tel: (61) 2 9226 0000 Website: www.appsecurities.com.au
How have we modelled Sky and Space Global?
What we needed to consider
SAS has provided the market with indicative revenue guidance of A$600m-A$1,000m once a full constellation of
about 200 nano-satellites are in orbit and in operation forecast to be in 2020.
The key drivers to derive a forecast profit and loss are:
Timing of nano-satellite deployment,
Capital cost of nano-satellites,
Cost of deploying nano-satellites which is forecast to be low due to the dedicated launches of clusters
of satellites per launch,
Customer numbers and customer split; i.e. number of M2M, text only, and voice and data customers,
Plan pricing,
Usage of plans; i.e. messages/month/customer; texts/month/customer; M2M
messages/month/customer,
Growth in customer numbers and customer usage, and
Operating costs which are likely to be very low due to an autonomous network and satellites
management in space.
Given the capital and deployment cost is well established now and operating costs are expected to be small in
the context of the potential revenues, the key risk to our forecasts is the size of equity raise ($ amount and new
shares issued) and the derivation of the revenue line.
Potential customer base
Over the equatorial region of the globe (key geographic focus for SAS will be Latin American, Asian and African
regions) it is estimated that between 2.5b-3.5b people have limited access to reliable telecommunications
infrastructure.
SAS estimate, of that number, 750m have no access.
Very simplistically if SAS could pick up 1% it would amount to 7.5m customers. As noted below our base case
assumption to justify a $0.45 price target is 1.2m customers by FY22F.
Figure 2. Sky and Space Global addressable market
Source: Company data
As a check to the reasonableness of our assumptions I would direct readers to the GSMA website. (GSMA
represents the interests of nearly 800 mobile operators worldwide and more than 300 companies in the broader
mobile ecosystem, including handset and device makers, software companies, equipment providers and internet
companies, as well as organisations in adjacent industry sectors) .
https://www.gsma.com/
GSMA provide outlook forecasts for all aspects the global mobile market. Rather than reproduce its findings we
just note a few of the GSMA forecasts below to demonstrate the size of the opportunity in just a number of
SAS’s target markets and the global market:
Unique mobile subscribers in the Caribbean and Latin America are forecast to grow from 451m to
511m from 2016 to 2020

Sky and Space Global APP Securities Research
APP Securities Pty Ltd ABN 45 112 871 842 5 December 2017 5
Sydney Office: Level 41, 259 George Street Sydney NSW 2000 Australia Tel: (61) 2 9226 0000 Website: www.appsecurities.com.au
Subscriber identity modules (SIM) connections in the Caribbean and Latin America are forecast to grow
from 675m to 771m from 2016 to 2020
Cellular M2M connections in the Caribbean and Latin America are forecast to grow from 25m to 53m
from 2016 to 2020
Operator revenue in Caribbean and Latin America is forecast to grow from $74b to $86.7b from 2016
to 2020
Unique mobile subscribers in the West Africa are forecast to grow from 172m to 220m from 2016 to
2020
SIM connections in West Africa are forecast to grow from 320m to 411m from 2016 to 2020
Operator revenue in West Africa is forecast to grow from $15.6b to $16.5b from 2016 to 2020
Unique mobile subscribers in the sub Saharan Africa are forecast to grow from 420m to 535m from
2016 to 2020
SIM connections in sub Saharan Africa are forecast to grow from 731m to 942m from 2016 to 2020
Mobile data traffic to grow at a CAGR of 66% from 2016 to 2020
Operator revenue in sub Saharan Africa is forecast to grow from $40b to $43b from 2016 to 2020
Unique mobile subscribers globally are forecast to grow from 4.7b to 5.6b from 2016 to 2020.
Sky and Space Global Model Assumptions
Key assumptions we have made to build forecast profit and loss and cash flow statements are:
67 nano-satellites deployed in FY19F, FY20F and FY21F. I.e. 200 deployed over three years with full deployment completed in 2020 at a cost of US$150m. The SAS target is based on existing contracts with the satellite supplier and the launch provider, which are scheduled to support full deployment by mid 2020.
These contracts are meeting the schedule so far (with a Preliminary Design Review (PDR) completed at GomSpace and Virgin Orbit about to perform the 1
st launch early 2018). That leaves the company with
over 6 months buffer on the timeline, so that by the end of FY20 the constellation is fully deployed. Also, revenues from a partial constellation are also very high, with only full 24/7 voice calls on northern/southern latitudes susceptible to deployment
Cost of satellites forecast at US$0.70m inflating at 2.0%, including construction and deployment costs. NB: Cost of launching the nano-satellites is capitalised in to the cost and depreciated over four years.
Satellites “killed” after four years and replaced so 50 new nano’s launched every year starting in FY22F. NB: We note this is a strong competitive advantage SAS will have over other satellite communications providers. That is, given the low capex cost, SAS will be able to replace the constellation every four years as new technology advances as we roll from 4G into 5G in the mid 2020’s.
Operating expenditure ramping up to A$16m per annum in FY20F.
Cash tax rate of 19% (SAS will be UK based for tax purposes). NB: UK tax is expected to drop to 17% by FY20, This, is also excluding any specific tax benefits for the space sector in UK that may arise.
An assumption that once proven, SAS will raise debt in the back end of FY19 to fund the final roll out of the constellation rather than coming to the market again for additional equity.
Forecast dividends potentially to commence in FY20F at a 50% payout ratio, if the current timetable is met. SAS have stated that it will target a higher payout ratio.
Current shares on issue are 1,695m. We assume A$50m is raised at $0.15 per share (345m new shares). NB: Again; we note this is very conservative as we would expect SAS not to raise new equity until there is some positive news priced into the market and also not below the pricing of the last equity raise of A$0.19 in May 2017.
Additionally, we assume the ~25.5m performance rights outstanding will issue lifting the diluted shares on issue and thus by year end FY18F, the fully diluted number of shares on issue would be 2,054m.
An AUDUSD cross rate of 0.760.
Sky and Space Global APP Securities Research
APP Securities Pty Ltd ABN 45 112 871 842 5 December 2017 6
Sydney Office: Level 41, 259 George Street Sydney NSW 2000 Australia Tel: (61) 2 9226 0000 Website: www.appsecurities.com.au
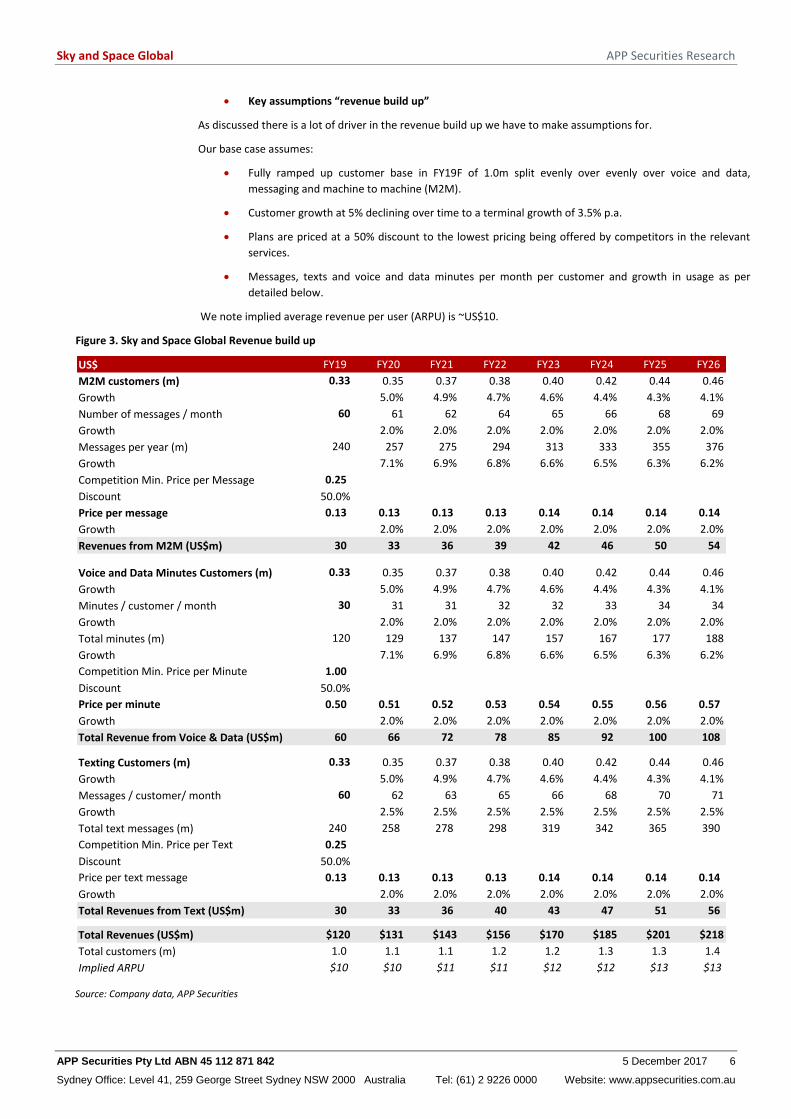
Key assumptions “revenue build up”
As discussed there is a lot of driver in the revenue build up we have to make assumptions for.
Our base case assumes:
Fully ramped up customer base in FY19F of 1.0m split evenly over evenly over voice and data,
messaging and machine to machine (M2M).
Customer growth at 5% declining over time to a terminal growth of 3.5% p.a.
Plans are priced at a 50% discount to the lowest pricing being offered by competitors in the relevant
services.
Messages, texts and voice and data minutes per month per customer and growth in usage as per
detailed below.
We note implied average revenue per user (ARPU) is ~US$10.
Figure 3. Sky and Space Global Revenue build up
US$ FY19 FY20 FY21 FY22 FY23 FY24 FY25 FY26
M2M customers (m) 0.33 0.35 0.37 0.38 0.40 0.42 0.44 0.46
Growth 5.0% 4.9% 4.7% 4.6% 4.4% 4.3% 4.1%
Number of messages / month 60 61 62 64 65 66 68 69
Growth 2.0% 2.0% 2.0% 2.0% 2.0% 2.0% 2.0%
Messages per year (m) 240 257 275 294 313 333 355 376
Growth 7.1% 6.9% 6.8% 6.6% 6.5% 6.3% 6.2%
Competition Min. Price per Message 0.25
Discount 50.0%
Price per message 0.13 0.13 0.13 0.13 0.14 0.14 0.14 0.14
Growth 2.0% 2.0% 2.0% 2.0% 2.0% 2.0% 2.0%
Revenues from M2M (US$m) 30 33 36 39 42 46 50 54
Voice and Data Minutes Customers (m) 0.33 0.35 0.37 0.38 0.40 0.42 0.44 0.46
Growth 5.0% 4.9% 4.7% 4.6% 4.4% 4.3% 4.1%
Minutes / customer / month 30 31 31 32 32 33 34 34
Growth 2.0% 2.0% 2.0% 2.0% 2.0% 2.0% 2.0%
Total minutes (m) 120 129 137 147 157 167 177 188
Growth 7.1% 6.9% 6.8% 6.6% 6.5% 6.3% 6.2%
Competition Min. Price per Minute 1.00
Discount 50.0%
Price per minute 0.50 0.51 0.52 0.53 0.54 0.55 0.56 0.57
Growth 2.0% 2.0% 2.0% 2.0% 2.0% 2.0% 2.0%
Total Revenue from Voice & Data (US$m) 60 66 72 78 85 92 100 108
Texting Customers (m) 0.33 0.35 0.37 0.38 0.40 0.42 0.44 0.46
Growth 5.0% 4.9% 4.7% 4.6% 4.4% 4.3% 4.1%
Messages / customer/ month 60 62 63 65 66 68 70 71
Growth 2.5% 2.5% 2.5% 2.5% 2.5% 2.5% 2.5%
Total text messages (m) 240 258 278 298 319 342 365 390
Competition Min. Price per Text 0.25
Discount 50.0%
Price per text message 0.13 0.13 0.13 0.13 0.14 0.14 0.14 0.14
Growth 2.0% 2.0% 2.0% 2.0% 2.0% 2.0% 2.0%
Total Revenues from Text (US$m) 30 33 36 40 43 47 51 56
Total Revenues (US$m) $120 $131 $143 $156 $170 $185 $201 $218
Total customers (m) 1.0 1.1 1.1 1.2 1.2 1.3 1.3 1.4
Implied ARPU $10 $10 $11 $11 $12 $12 $13 $13
Source: Company data, APP Securities

Sky and Space Global APP Securities Research
APP Securities Pty Ltd ABN 45 112 871 842 5 December 2017 7
Sydney Office: Level 41, 259 George Street Sydney NSW 2000 Australia Tel: (61) 2 9226 0000 Website: www.appsecurities.com.au
Figure 4. Sky and Space Global Satellite Deployment
US$m FY18 FY19 FY20 FY21 FY22 FY23 FY24 FY25 FY26
Total nano-satellites year beginning 0 3 67 133 200 200 200 200 200
New satellites 3 67 67 67
Replacement 50 50 50 50 50
Satelites killed (3) (50) (50) (50) (50) (50)
Total nano-satellites year end 3 67 133 200 200 200 200 200 200
Average satellites 2 35 100 167 200 200 200 200 200
Satellite Capex
Per satellite 0.70 0.71 0.73 0.74 0.76 0.77 0.79 0.80 0.82
Cost growth 2.0% 2.0% 2.0% 2.0% 2.0% 2.0% 2.0% 2.0%
New & replacement satellites 3.0 66.7 66.7 66.7 50.0 50.0 50.0 50.0 50.0
Capex 2.1 47.6 48.6 49.5 37.9 38.6 39.4 40.2 41.0
Additional Depreciation 0.5 11.9 12.1 12.4 9.5 9.7 9.9 10.1 10.3
Asset life for depreciation 4.0 4.0 4.0 4.0 4.0 4.0 4.0 4.0 4.0
Source: Company data, APP Securities
Our base case assumes revenue in FY22F of A$206m; well down (66%) on managements guidance of A$600m-
A$1,000m.
Given the low operating costs of the business, operating cash flow in FY22F is forecast at A$166m (A$0.08) per
share) with free cash flow (post replacing 25% of the constellation) forecast at A$114m (A$0.05) per share).
For modelling we have assumed revenue grows straight line from US$20m in FY19F to our “revenue build up”
model forecast in FY22F of US$156m (A$206m).
Figure 5. Sky and Space Profit and Loss
US$m FY18 FY19 FY20 FY21 FY22 FY23 FY24 FY25 FY26
Total Sales 2 20 65 111 156 170 185 201 218
Other Operating Expenses (4) (4) (4) (4) (4) (4) (4) (5) (5)
Product & Manufacturing (3) (6) (9) (9) (9) (10) (10) (10) (11)
Total operating expenditure (6) (9) (13) (13) (13) (14) (14) (15) (15)
EBITDA (4) 11 53 98 143 156 171 186 203
Depreciation (1) (12) (25) (37) (46) (44) (41) (39) (40)
EBIT (5) (2) 28 61 97 113 129 147 163
A$m FY18 FY19 FY20 FY21 FY22 FY23 FY24 FY25 FY26
Total Sales 3 26 86 146 206 224 244 265 287
Total other operating expenditure (8) (12) (16) (17) (18) (18) (19) (20) (20)
EBITDA (6) 14 70 129 188 206 225 245 267
Depreciation (1) (16) (32) (49) (60) (57) (54) (51) (52)
EBIT (6) (2) 37 80 128 148 170 194 214
Source: Company data, APP Securities

Sky and Space Global APP Securities Research
APP Securities Pty Ltd ABN 45 112 871 842 5 December 2017 8
Sydney Office: Level 41, 259 George Street Sydney NSW 2000 Australia Tel: (61) 2 9226 0000 Website: www.appsecurities.com.au
Valuation
Discounted cash flow valuation
We have used a cost of equity of 16.0% based off an equity beta of 2.00 given business risk and the early stage of
the business ramp up, a risk-free rate of 4.0% and a market risk premium of 6.0%. We note that the two closest
global listed comparative companies, Globalstar (GSAT) and Iridium Communications (IRDM) have FactSet betas
of 2.2 and 1.9 respectively. Clearly “space” is deemed risky.
We have assumed that once the project has ramped up and established low risk counterparties have been
signed up as clients the vehicle should be able to hold a meaningful level of debt given its infrastructure like
characteristics. We have thus assumed a target debt to enterprise level of 20% in our weighted average cost of
capital (WACC) calculation resulting in a WACC of 13.8%.
We have discounted 10 years of free cash flows and applied a nominal terminal growth rate of 3.0% (2.5%
inflation and 0.5% real growth). Clearly as the project proceeds and de-risks, our cash flow forecasts will firm up
and our discount rate will lower.
Figure 6. Sky and Space Global Discounted Cash Flow Valuation
DCF Operating Cash Flows FY18F FY19F FY20F FY21F FY22F FY23F FY24F FY25F FY26F FY27F Terminal
EBITA (6) (2) 37 80 128 148 170 194 214 236
Actual forecast cash tax 0 0 (5) (14) (22) (25) (29) (33) (37) (40)
Depreciation 1 16 32 49 60 57 54 51 52 53
Increase in Working Capital (0) 0 0 0 0 0 0 0 0 0
Capital Expenditure (5) (65) (66) (67) (52) (53) (54) (55) (57) (58)
Acquisitions/Other/Disposals 0 0 0 0 0 0 0 0 0 0
Capital Raised 50 0 0 0 0 0 0 0 0 0
Standard Free Cashflow 39 (51) (1) 48 114 127 141 157 174 192 1,780
FCF Timing Factor 1 2 3 4 5 6 7 8 9 10 11
Discount Factor 1 1 1 2 2 2 2 3 3 3 4
Discounted FCF 37 (41) (1) 30 63 62 61 59 57 56 455
Valuation $m
Explicit Cashflows (10 Years) 383
Terminal Value 455
Total Firm Value 838
Plus Cash (Net debt) 46
Option exercise cash 0
Total Equity Claims 884
Diluted Shares 2,078
Per Share Value $0.43
Source: Company data, APP Securities
We note that if we assume a 5m customer base (less than 1% of the potential addressable market of 750m),
based on our 50% discount pricing assumption, the model generates US$782m (A$1,029m) of revenue in FY22F,
which is in line with the top of SAS’s revenue guidance of A$1,000m in FY22F.
This values SAS at A$2.80.
Figure 7. Sky and Space Global Sensitivity to Customer Numbers (m) and Pricing Discount
0 0.50 1.00 1.50 2.00 2.50 3.00 3.50 4.00 4.50 5.00
10% 0.37 0.90 1.43 1.97 2.50 3.03 3.57 4.10 4.63 5.17
20% 0.31 0.78 1.26 1.73 2.20 2.68 3.15 3.63 4.10 4.57
30% 0.25 0.66 1.08 1.49 1.91 2.32 2.74 3.15 3.57 3.98
40% 0.19 0.54 0.90 1.26 1.61 1.97 2.32 2.68 3.03 3.39
50% 0.13 0.43 0.72 1.02 1.31 1.61 1.91 2.20 2.50 2.80
60% 0.07 0.31 0.54 0.78 1.02 1.26 1.49 1.73 1.97 2.20
70% 0.01 0.19 0.37 0.54 0.72 0.90 1.08 1.26 1.43 1.61
80% -0.06 0.07 0.19 0.31 0.43 0.54 0.66 0.78 0.90 1.02
90% -0.13 -0.06 0.01 0.07 0.13 0.19 0.25 0.31 0.37 0.43
Source: Company data, APP Securities

Sky and Space Global APP Securities Research
APP Securities Pty Ltd ABN 45 112 871 842 5 December 2017 9
Sydney Office: Level 41, 259 George Street Sydney NSW 2000 Australia Tel: (61) 2 9226 0000 Website: www.appsecurities.com.au
Company Overview
Sky and Space Global (SAS) is an Australian listed, United Kingdom (UK) based Nano-satellite communication
company with branches in Israel and Poland. The company was founded in 2015 by Israeli satellite and
aerospace experts and listed on the ASX in May 2016. It was listed as SSG before Burleson Energy Limited’s (BUR)
complete acquisition, to which they changed their operations from development of petroleum and gas in USA to
operations of a narrow-band communication network.
SAS aims to provide low cost, Nano-satellite communication coverage on an anywhere to everywhere base with
relatively low maintenance costs. Furthermore, SAS develops proprietary network management software
systems that enable satellites to autonomously manage deployment, orbital control and M2M communication
with little interference from ground stations. This reduces capital expenditure, launch and operating costs SAS
and can provide cost effective solutions to the telecommunication and international transport industries.
Sky and Space Global satellites conform to the CubeSat standard and will be built at an estimated cost of around
US0.5m per unit not including launch costs in the range of US$0.25m per satellite with a total launched cost of
US$0.7m per nano. The company plans to deploy the next generation of about 200 nano-satellites (8U) in low
orbit over the equatorial region to provide narrowband communications that it expects will cost US$150m to
complete in total. The satellites will have a design life of five to seven years. After four years, SAS intends to drop
them back to Earth to dispose of them. The company intends to replace 25% of the constellation each year,
replacing 50 satellites with new versions.
Currently the Company’s “3 diamonds” Nano-satellites (3U) are orbiting space, their dimensions being 10cm x
10cm x 30cm in size, weighing 3.125 kg and have a variety of potential communications applications. SAS has
completed operations testing and executed first binding commercial agreements. (see Partners below)
Commercial demonstrations have begun where their significant revenues expected from the constellation. The 3
Diamonds are only technology demonstrators, which, due to the high demand and the 3D capabilities, have
become commercial assets. Services have been sold to SatSpace Africa and will earn about A$3m p.a. and
SAS wants to break into the global telecommunications market given the current substantial demand and
expected growth in the next decade. This presents a significant market opportunity for the company, as over 4
billion people in the world lack mobile coverage, especially those in the equatorial regions.
Figure 8. Sky and Space Global addressable market
Source: Company data

Sky and Space Global APP Securities Research
APP Securities Pty Ltd ABN 45 112 871 842 5 December 2017 10
Sydney Office: Level 41, 259 George Street Sydney NSW 2000 Australia Tel: (61) 2 9226 0000 Website: www.appsecurities.com.au
Company Strategy
SAS’s initial strategy is to launch its 200 Nano-satellite constellations by 2020 to provide affordable satellite
narrowband communication services globally, including: Voice, Instant Messaging, M2M/internet of things (IoT),
Data transfer etc., with their current target being the equatorial region which lacks telecommunication coverage.
SAS’s business strategy is to:
Provide global, low orbit communication infrastructure and services via SAS’s own Nano-satellite
constellation;
Nano-satellite platform is to provide communication infrastructure and services for:
Premium customers (global corporates, airline/shipping companies);
Retail customers via deals with Global Telcos, especially attractive in remote or underdeveloped areas;
Band width satellite communication providers
Machine-to-mchine (M2M) as part of the Internet of things (IoT)
Real-time tracking for airliners and shipping companies
Complementary service for cellular networks in Latin Americas, Asian and African regions with poor
coverage
Ad-hoc disaster and crisis areas solutions
Premium secure services
Offer store and forward service at affordable rates;
Plan to take advantage of the increasing demand of bandwidth and the lack of responsiveness to this
demand from the industry;
Not only does SAS wants to expand the reach of satellite technology in less developed areas, but also
democratise it to become an affordable commercial product globally. Global communication via satellites is
expensive, hardly accessible to everyday users, and requires dedicated transceivers.
Current service pricing denies access to potential customers globally and SAS plans to take advantage of this by
democratising its accessibility by providing affordable rates. There is a multitude of industries which could
benefit such as aviation, shipping and remote location enterprises.
The company plans to expand its initial constellation of circa 200 nano-satellites to a global constellation of circa
1000 nano-satellites in the future. This will provide full global coverage in contrast to the proposed equatorial
coverage with the initial constellation.
This project is forecasted to take 3-5 years to complete, from its inception in and expanding into the future
beyond 2020.
We have not assumed an expansion to global coverage in our modelling.
Figure 9. Sky and Space Global Revenue Opportunities
Source: Company data

Sky and Space Global APP Securities Research
APP Securities Pty Ltd ABN 45 112 871 842 5 December 2017 11
Sydney Office: Level 41, 259 George Street Sydney NSW 2000 Australia Tel: (61) 2 9226 0000 Website: www.appsecurities.com.au
Clients and Commercial Partners
The company aims to provide high quality and highly secure communications bandwidth to customers across the
globe and is specifically targeting 4 key areas of communications:voice recording, instant messaging, text and
data store and forward services.
GomSpace:
Gomspace constructed the 3 Diamonds and has been selected to construct the constellation of 200 Pearls
The constellation contract has successfully past the PDR (Preliminary Design Review) stage
Sat-Space Africa:
Agreement for bandwidth provided by “3 Diamonds”;
Sat-Space Africa is a Pan-African communications company with operations and infrastructure in 27 African
countries;
Sat-Space has secured commercial contracts to sell SAS bandwidth to end users;
Executed a binding commercial contract.
BeepTool Communications:
Agreement for bandwidth provided by “3 Diamonds”;
BeepTool is a mobile payment, messaging and voice application used across the African continent; that has
grown to over 1m subscribers
We note that in October this year SAS and BeepTool demonstrated the world’s first financial transaction
using nanosatellites. The tests used the Company’s “Chatellite” app and BeepTool’s software. Financial
transactions were made from one phone to another using SAS’s three Diamonds nano-satellites
Binding agreement is in final stages
Globalsat Group:
Agreement to explore the provision of SAS’s communication services to Globalsat end-users;
Globalsat provides Mobile Satellite Services, with a strong presence across South and Latin America;
Parties to provide commercial demonstration of services during H2 2017;
Virgin Galactic Partnership / Virgin Orbit:
In October 2016, Sky and Space Global signed an MOU with Virgin Galactic;
Virgin and SAS are to explore the potential to create a satellite communications network to provide
connectivity to its LauncherOne carrier aircraft, Cosmic Girl;
Presents a substantial commercial opportunity;
D-Orbit:
Sky and Space Global (SAS) has signed a binding agreement with Italian space system company, D-Orbit, to
provide launch and deployment services for the upcoming roll-out of the SAS nanosatellite constellation
The partnership will allow SAS to maximize the operational capabilities and potential revenue generation
for their upcoming nanosatellite constellation
The agreement follows the recent announcement of the Pearls, the next generation of SAS nanosatellites,
which will be launched into space and were unveiled at the International Astronautical Congress in Adelaide
in September.
Social Finance Systems:
SFS acquired SocialEco who SAS was previously dealing with.
In October SAS successfully integrated and tested its Android application called “Chatellite” using the Social
Finance Systems Humanity $1 smartphone. The Chatellite app went operational on this $1 smartphone and
worked seamlessly. The test was successful and messages where sent and received between the Humanity
$1 smartphone and a regular phone using the 3 Diamonds nanosatellites.
WeFarm:

Sky and Space Global APP Securities Research
APP Securities Pty Ltd ABN 45 112 871 842 5 December 2017 12
Sydney Office: Level 41, 259 George Street Sydney NSW 2000 Australia Tel: (61) 2 9226 0000 Website: www.appsecurities.com.au
In May 2017, SAS signed a Memorandum of Understand (MOU) with WeFarm Ltd, the world’s largest
knowledge and data network for small-scale farmers.
The MOU was to explore the integration of the SAS Nano-satellite communication platform into WeFarm’s
process of on-boarding users, who are small-scale farmers living in remote and isolated locations
RBC Signals:
Sky and Space Global partnered with Seattle-based RBC Signals, a U.S. company that provides a global
network of ground stations by using excess capacity from existing facilities. Following the 3 Diamonds
launch, SAS used a RBC Signals ground station in Prudhoe Bay, Alaska, for initial communications with the
satellites. In May 2017, SAS signed a Memorandum of Understand (MOU) with WeFarm Ltd, the world’s
largest knowledge and data network for small-scale farmers.
Check Point Software Technologies:
SAS is partnering with Check Point Software Technologies to integrate cybersecurity solutions into the SAS
space and ground networks.
Check Point is one of the largest cyber security vendors globally, protecting customers from cyberattacks by
detecting and removing malware and other types of threats.
SCISYS:
SAS has contracted the UK software and services company SCISYS PLC to build the system simulator for the
SAS ‘Pearls’ Constellation of nanosatellites
The simulator is designed as a high-fidelity, high performance solution which will enable SAS to validate and
fine tune operations quickly and effectively, maximising service provision

Sky and Space Global APP Securities Research
APP Securities Pty Ltd ABN 45 112 871 842 5 December 2017 13
Sydney Office: Level 41, 259 George Street Sydney NSW 2000 Australia Tel: (61) 2 9226 0000 Website: www.appsecurities.com.au
Market conditions
Demand for communications services has grown substantially over the past five years in both developed and
developing countries. This growth also potentially translates into growth for the satellite communications
market in the future as they can compensate for the gaps in the current telecommunications market.
Within developed countries, communication coverage is well established, with household and commercial
customers being the biggest beneficiaries of fierce competition within the industry. Lower prices have been the
most immediate benefit for customers, and these lower prices have enabled much higher use of
telecommunication services, particularly in the mobile segment. This trend may also transliterate to the satellite
communications segment; hence SAS has a strong case in providing lower satellite phone rates than what is
commercially available today. However lower prices have placed pressure on profit margins and now Telcos are
introducing innovative value-added services (such as free music streaming and live sport streaming), further
embedding telecommunications into the daily lives of businesses and consumers. Changes in the mobile space
over the past five years have exemplified this trend; with mobile phones now providing a range of services.
These include voice messaging, email, internet browsing, online banking, GPS mapping and modem services (via
tethering). This large service range has allowed a growing number of consumers and small businesses to rely
solely on wireless services for all of their communication needs, facilitating a boom in smartphone and tablet use.
Due to this strong dependency on wireless connectivity, it opens up an opportunity for the satellites market in
the future and for SAS as they can provide connectivity anywhere within range of a satellite.
In developing countries, there is a strong demand for telecommunication coverage given an estimate 4 billion
people are without coverage, but implementation is limited. This is largely due to 4 key factors: infrastructure,
affordability, skills and awareness, and local adoption. Infrastructure is a main reason simply because a stable,
fast connection isn’t available most of the time. Approximately 31% of the global population don’t have 3G
coverage whilst 15% have no electricity, which implies some developed areas just aren’t optimised for
telecommunications. Affordability is also a main factor preventing many people in developed countries from
access to telecommunications. Broadband is only affordable for the entire population in just 29 countries whilst
13% of the world population are living below the poverty line. Skills and awareness is also another barrier as
some may not understand how connectivity services work due to their lack of experience. Local Adoption is also
a problem as a considerable majority of online content (80%) is only available in 10 languages, which is spoken
by less than 50% of the entire global population.
Regulatory environment
All UK operators of satellites, or other space vehicles, must obtain a licence from the UK Space Agency and take
out third party insurance. The Outer Space Act 1986 requires a party carrying out certain space activities to
indemnify the Government. Until 2015, indemnity had to be provided on an unlimited liability basis. Section 12
of the Deregulation Act 2015, however, makes provision for the Government to limit a party’s liability at €60
million. The Government has also waived Insurance Premium Tax on satellite launches. These changes have been
warmly welcomed by the industry, with UK space describing them as having helped “to create a level playing
field for UK companies”
However, regulations fail to keep pace with new trends in the sector, especially the growth of small satellites and
satellite constellations, and further reform is still necessary. Richard Peckham from Airbus Group described the
current regulations as having been “written on the assumption that satellites were big things and you just
launched one of them, and that was it. If you are looking to launch hundreds of small satellites [ … ] you have to
have a much more flexible approach”.UK requires the operator to have insurance to cover all parts of the
mission (pre-launch, launch and in orbit insurance). The current regulations to be particularly prohibitive for
small satellites on the grounds that having “full insurance for in-orbit operations [generates] a higher cost for
building and launching Nano-satellites registered in the UK”. The annual insurance premiums required to cover
the €60 million of third-party liability insurance were “many times the cost of building and launching a basic
CubeSat or other small spacecraft making it completely uneconomic to license small British spacecraft”
We note that SAS received formal approval from the UK communications regulator, Ofcom, confirming the
‘bringing into use’ (BIU) classification of its 3 Diamonds nanosatellites. BIU is a critical regulatory classification
step that confirms the existence of an actual satellite in space by proving the capability of transmitting or
receiving signals from a space station, deployed and maintained at a specific orbit for a continuous period of 90
days. This marks a significant technical milestone for the Company, and is another critical part of the unique
intellectual property and value that has been created for all SAS shareholders to date. This process is part of the

Sky and Space Global APP Securities Research
APP Securities Pty Ltd ABN 45 112 871 842 5 December 2017 14
Sydney Office: Level 41, 259 George Street Sydney NSW 2000 Australia Tel: (61) 2 9226 0000 Website: www.appsecurities.com.au
Satellite Filing procedures required by the International Telecommunication Union (ITU) and local regulators
such as Ofcom, for specific frequency registration. The SAS ITU filings for the frequencies related to the SSG‐CSL
and SSG‐3D satellite systems used for the launch of the 3 Diamonds have been validated by the regulators. This
is a major step for SAS as this provides regulatory confirmation of its ability to deliver services using the 3
Diamonds.
Comparative companies
There are a number of global companies operating in the satellite space. We do not believe any of them are true
comparables and SAS will be a key disrupter to the space.
Figure 10. Global Listed Comparative Companies
Beta
Ticker Company Price (LC)
Market
Cap.(A$m) Sales EBITDA FY1 FY2 FY1 (x) FY2 (x) FY1 FY2
CMTL Comtech Telecommunications Corp. 21.67 657 550 74 0.4 0.7 53.6 30.0 9.4 8.1 1.7
GILT Gilat Satellite Networks Ltd. 7.59 547 280 15 - - n/m n/m 0.5
GSAT Globalstar, Inc. 1.58 2,593 - (26) (0.1) (0.1) n/m n/m 98.4 86.5 2.3
IRDM Iridium Communications Inc. 12.35 1,591 434 229 0.8 0.4 15.0 31.6 9.6 9.0 2.0
ISAT-LON Inmarsat plc 4.83 3,920 985 546 0.3 0.3 15.0 15.6 6.7 6.4 0.9
KVHI KVH Industries, Inc. 10.80 248 176 12 (0.5) (0.2) n/m n/m 30.7 15.3 2.2
SDA-ASX SpeedCast International Ltd 5.18 1,211 - 52 0.2 0.3 22.2 15.5 10.3 8.3 0.5
ORBC ORBCOMM Inc. 10.76 1,030 - 29 (0.8) (0.1) n/m n/m 20.9 15.3 1.1
VSAT ViaSat, Inc. 74.24 5,734 - 283 (0.0) 0.5 n/m 136.3 19.0 12.8 1.5
SAS-ASX Sky and Space Global Ltd. 0.15 246 - (15) (0.5) (0.2) n/m n/m n/m n/m
Average 26.5 45.8 25.6 20.2 1.4
Median 18.6 30.0 14.6 10.9 1.5
FY0 EPS P/E EV/EBITDA
Source: FactSet

Sky and Space Global APP Securities Research
APP Securities Pty Ltd ABN 45 112 871 842 5 December 2017 15
Sydney Office: Level 41, 259 George Street Sydney NSW 2000 Australia Tel: (61) 2 9226 0000 Website: www.appsecurities.com.au
Risk Factors
Competition
SAS operates in the telecommunications services industry with a focus on the niche satellite communications
markets. Currently major players who dominate the satellite communications market globally are Inmarsat,
Iridium, Thuraya and Globalstar.
The global narrow band Satellite market is currently worth US$5.5bn for the use of mobile satellite
communications devices (excluding TV). The industry is expected to grow significantly each year as the demand
for wireless connectivity increases and shifts away from wired connectivity (submarine cables).
SAS’s major competitors have established a strong presence in the satellite global market. They have
considerably more technological, financial and marketing resources than SAS. Competition within the satellite
market is dominated by pricing, as currently the commercialisation of satellite technology is stagnant due to
prices being too expensive for the ordinary consumer. Hence SAS may be able to cater to this demand with the
savings derived from the use of its disruptive Nano-technology.
Economic
SAS has a key geographic focus on Latin American, Asian and African regions with poor coverage as well as
disaster and crisis areas. A downturn of economic conditions in these markets could negatively affect SAS’s
earning ability. SAS believe communication services revenues are less susceptible to economic downturn.
Loss of key contracts and or obtaining repeat business
SAS business model requires signing partnership/customer agreements with local satellite communication
providers. SAS has started at an early stage negotiation with such SatCom providers. However, there are factors
beyond SAS control (such as local economy, competitor’s activity, sitcom provider considerations etc) that may
delay or preclude these agreements.
Besides, SAS would lose key contracts due to increasing competition in this industry and the presence of new
entrants. The SAS business model and strategy is based on low pricing for market penetration. Competitors may
select to use an aggressive pricing policy to defend their market share, even at the cost of a loss. We note that
diversity over geographical regions, sectors and customers provides for a less susceptible business model.
Technology
Nanosatellites: Although SAS develops and provides technical specifications, SAS does not plan (at the moment)
to manufacture its own hardware. SAS will outsource Nano-satellites manufacturing, while using mostly
customer off the shelf (COTS) hardware to meet many technological needs as part of its business model. As such,
SAS will depend on subcontractors meeting the demand and specifications for its Nano-satellites, assuming the
risk of a subcontractor not meeting the requirements.
Software development: Major effort is dedicated to software management, specifically for satellite
communication network management. Software development is always a risk for budget and schedule, both for
development itself and also for debugging and proofing of software.
Ground system procurement and integration: SAS’s nanosatellites will be controlled by a ground control system,
which is a strictly COTS product that will require integration and testing. Once SAS procures an appropriate COTS
ground control system, it will select a suitable location to place it, this is yet unknown and will be determined
prior to the launch. The placement of the ground control system may require approval of the relevant local
authorities. We understand that there are so many options for this so the risk is very low
Communication hardware and link budget: SAS plans to use COTS communication hardware, with performance
meeting operational requirements according to analysis and specifications. Failure of hardware, or even reduced
performance of hardware (according to specifications), may lead to degradation in system performance.
Regulatory environment

Sky and Space Global APP Securities Research
APP Securities Pty Ltd ABN 45 112 871 842 5 December 2017 16
Sydney Office: Level 41, 259 George Street Sydney NSW 2000 Australia Tel: (61) 2 9226 0000 Website: www.appsecurities.com.au
The Company will incur ongoing costs and obligations associated with compliance with necessary regulations.
Any failure to comply with regulations may result in additional costs for corrective measures, penalties or in
restrictions on the Company’s proposed business operations. In addition, changes in regulations could require
extensive changes to the Company’s operations, increased compliance costs or give rise to material liabilities,
which could have a material adverse effect on the business, results of operations and financial condition of the
Company. The Company’s ability to operate in the future will depend in part on whether it is able to effectively
commercialise its potential interests in products. This will depend on successful completion of product
development activities, obtaining regulatory approval and on there being commercial demand for such products
which cannot be guaranteed.
Space weather events
Extreme space weather events such as solar flares, solar eruptions, gamma ray bursts etc. are a rare possibility.
Although SAS hardware will be designed and tested to withstand nominal space environment conditions, SAS
satellites (as most satellites currently in use) are not designed to withstand such an extreme event.
Free float and management overhang
With only 42% free float, liquidity in the stock is tight and the ability to enter and exit the register is a
consideration. As noted earlier we expect a capital raising in 2018 to fund the capital cost of the nano-satellite
deployment so free float will lift.

Sky and Space Global APP Securities Research
APP Securities Pty Ltd ABN 45 112 871 842 5 December 2017 17
Sydney Office: Level 41, 259 George Street Sydney NSW 2000 Australia Tel: (61) 2 9226 0000 Website: www.appsecurities.com.au
Board and Management Meir Moalem - CEO and Managing Director
A jet fighter pilot, Lt. Col (Res.) of the IAF, has over 20 years of experience in management, R&D and operation of state-of-the-art projects in Space Systems and Unmanned Aerial Systems, among those acting as a deputy sq. commander and leading the MEIDEX experiment on Space Shuttle Columbia (STS-107) as the project manager for Israel’s first astronaut flight, managing Israel’s satellite projects (such as Ofeq, Tecsar) and more. Meir has a B.Sc. in Physics and Computer Sciences (with honours) and an M.A. from the Diplomacy and National Security executive program (with honours). Currently he is working on his PhD in national security and space programs in Tel Aviv University, Israel. Meir has also received the Israel National Defence award in 2009.
Brett Mitchell - Executive Director- Corporate
Mr Mitchell is a corporate finance executive with over 25 years of experience primarily in the finance, capital markets and resources industries. He has been involved in the founding, financing and management of early stage resources and technology companies and currently holds executive roles on Sky and Space Global Ltd (ASX:SAS) and MGC Pharmaceuticals Ltd (ASX:MXC). Mr Mitchell holds a Bachelor of Economics from the University of Western Australia and is also a member of the Australian Institute of Company Directors (AICD).
Peter Wall - Non-Executive Chairman
Mr Wall is a partner at Steinepreis Paganin, a Perth law firm, which he joined in January 2000. Mr Wall has a wide range of experience in all forms of mergers and acquisitions (including takeovers and schemes of arrangement) and has also advised on numerous successful IPO’s and back door listings on the ASX. In addition, Mr Wall specialises in corporate reconstructions and recapitalisations of listed entities, acting as principal or advisor to the transaction. Mr Walls other core areas of practice include information technology, energy and resources, capital markets, corporate and strategic advice, securities law, commercial law and contract law.
Maya Glickman- Pariente - COO and Non-Executive Director
Highly experienced and regarded as a global industry leader, Maya Glickman-Pariente is Sky and Space Global (UK) Ltd’s Chief Operating Officer and will lead the team on satellite mission analysis, mission control software development, and operations management. Maya is MASTER STK certified and was a Senior Satellite Engineer of communications satellite with wide experience in satellite operations. Maya was part of the AMOS-3 development team, LEOP and IOT missions as well as the AMOS-1 end of life mission team. Maya designed and optimized several large-scale constellations for earth observation and communication use, and was involved in the assembly, integration and testing of “Duchifat-1”, the first Israeli Nanosatellites. Maya has a B.Sc. in Aerospace Engineering and M.E in System Engineering, both from the Technion University, Aerospace faculty, and is also a graduate of the 2004 ISU summer session program in Adelaide, Australia. Recently, Maya was nominated Associate Chair of the space engineering department in the International Space University summer session program 2016.
Yonatan Shrama - VP Business Development and Non-Executive Director
Yonatan has over 12 years of experience in business development and entrepreneurship in automotive technology systems, medical equipment and high technology security equipment. Yonatan has extensive experience in managing teams and processes. Yonatan is currently the chairman of Enigmo, a Cyber company, and VP Bizdev at SPACECIALIST.
Meidad Pariente - CTO
With more than 20 years of satellite and aerospace industry experience, Meidad is a founder of Sky and Space Global and its Chief Technical Officer. Meidad started as AMOS-1 satellite operator, later was the Deputy Mission Manager of AMOS-2, Chief systems engineer of AMOS-3 successfully launched in 2008, and special engineering advisor for AMOS-5, launched in 2011. Meidad was the chief systems engineer and led a team of Israeli engineers and scientists designing the VENUS project, an Israeli-French hyperspectral satellite. Meidad is a leading nanosatellite expert, having led projects in Israel, Europe and the USA. In 2014 Meidad and Maya led the “Duchifat-1” project, the first Israeli nanosatellite which was launched successfully in June 2014 as part of a tertiary project. The Nano-satellite is still fully operational. Meidad holds a B.Sc in Physics from Tel Aviv University and a M.E. in Systems Engineering from the Technion Aerospace faculty.
Rachel Kerr - Company Secretary
Mrs Kerr has 7 years’ experience as a Company Secretary on both private and public companies, working on acquisitions, capital raisings, listing of companies on ASX, due diligence reviews and compliance of public companies. Mrs Kerr is also Company Secretary of MGC Pharmaceuticals Ltd.
Sky and Space Global APP Securities Research
APP Securities Pty Ltd ABN 45 112 871 842 5 December 2017 18
Sydney Office: Level 41, 259 George Street Sydney NSW 2000 Australia Tel: (61) 2 9226 0000 Website: www.appsecurities.com.au
This research report was prepared solely by APP Securities Pty Ltd (ABN 45 112 871 842) (AFSL 307 706) (“APP Securities”). ASX Limited (ABN 98 008 624 691) “ASX” did not prepare any part of the report and has not contributed in any way to its content. The role of ASX in relation to the preparation of the research reports is limited to funding their preparation, by APP Securities, in accordance with the ASX Equity Research Scheme.
ASX does not provide financial product advice. The views expressed in this research report may not necessarily reflect the views of ASX. To the maximum extent permitted by law, no representation, warranty or undertaking, express or implied, is made and no responsibility or liability is accepted by ASX as to the adequacy, completeness or reasonableness of the research report.
This research is subject to the disclosures and restrictions set out below. This Research remains the property of APP Securities. No material contained in this Research may be reproduced or distributed without prior written approval of APP Securities, except as allowed by the Copyright Act. This Research is current at the date of publishing. For updates or further information regarding this research, please contact your advisor. APP Securities does or seeks to undertake business with companies covered in its research, therefore, Investors should consider this report as only a single factor in making their investment decisions. For explanations regarding ratings and other important disclosures, please refer to the disclosure section at the end of this document.
Analyst Certification:
The research analyst(s) identified on the cover of this report individually certify that in respect of each security or issuer that the research analyst covers that: this report accurately reflects his or her personal views about any and all of the subject issuer(s) or securities; and no part of the research analyst’s compensation was, is, or will be directly or indirectly related to the specific recommendation(s) or views expressed by the research analyst(s) in this report.
General Disclosure
APP Securities and its associates (as defined in Chapter 1 of the Corporations Act 2001), officers, directors, employees and agents, from time to time, may own or have positions in securities of the company(ies) covered in this report and may trade in the securities mentioned either as principal or agent or may be materially interested in such securities.
APP Securities does and seeks to do business with companies covered in its research reports. As a result, investors should be aware that the firm may have a conflict of interest that could affect the objectivity of this report. Investors should consider this report as only a single factor in making their investment decision.
Contact with Sky and Space Global has been made during the preparation of this report for assistance with the verification of facts.
APP Securities Pty Ltd has not received during the past 12-months compensation for financial and advisory services from the company, its parent or its wholly owned or majority owned subsidiary.
Disclaimer & Warning
This report may contain general advice or recommendations which, while believed to be accurate at the time of publication, are not appropriate for all persons or accounts. This report does not purport to contain all the information that a prospective investor may require. Before making an investment or trading decision, the recipient must consider market developments subsequent to the date of this document, and whether the advice is appropriate in light of his or her financial circumstances or seek further advice on its appropriateness or should form his/her own independent view given the person’s investment objectives, financial situation and particular needs regarding any securities or Financial Products mentioned herein. Information in this document has been obtained from sources believed to be true but neither APP Securities nor its associates make any recommendation or warranty concerning the Financial Products or the accuracy, or reliability or completeness of the information or the performance of the companies referred to in this document. Past performance is not indicative of future performance. This document is not an offer, invitation, solicitation or recommendation with respect to the subscription for, purchase or sale of any Financial Product, and neither this document or anything in it shall form the basis of any contract or commitment. Although every attempt has been made to verify the accuracy of the information contained in the document, liability for any errors or omissions (except any statutory liability which cannot be excluded) is specifically excluded by APP Securities, its associates, officers, directors, employees and agents. The securities of such company (ies) may not be eligible for sale in all jurisdictions or to all categories of investors.
Analysts’ Compensation: The research analysts responsible for the preparation of this report receive compensation based upon various factors, including the quality and accuracy of the analyst(s) research, client evaluation feedback, independent survey rankings and overall firm revenues, which include revenues from, among other business units and corporate finance.
Other International Investors: International investors outside the US, UK, UAE or Canada are encouraged to contact their local regulatory authorities to determine whether any restrictions apply to their ability to purchase this investment and should seek their own advice
Recipient Representations/Warranties: By accepting this report, the recipient represents and warrants that he or she is entitled to receive such report in accordance with the restrictions set out in this document and agrees to be bound by the limitations contained herein. Any failure to comply with these limitations may constitute a violation of law.
Meanings of APP Securities Stock Ratings
Buy – Describes stocks that we expect to provide a total return (price appreciation plus gross yield) of 10% or more within a 12-month period.
Hold – Describes stocks that we expect to provide a total return (price appreciation plus gross yield) of 0% to 10% within a 12-month period.
Sell – Describes stocks that we expect to provide a total return (price appreciation plus gross yield) of less than 0% within a 12-month period.
NR – The investment rating and price target have been temporarily suspended. Such suspensions are in compliance with applicable regulations and/or APP Securities policies.
CS – Coverage Suspended. APP Securities has suspended coverage of this company.
Speculative Buy – Describes stocks we research with a positive bias, whose company fundamentals and/or financials are being covered, but for which there is insufficient information for APP Securities to assign a Buy or Sell rating.
Speculative Sell – Describes stocks we research with a negative bias, whose company fundamentals and/or financials are being covered, but for which there is insufficient information for APP Securities to assign a Buy or Sell rating.
Monitor – Describes stocks whose company fundamentals and/or financials are being monitored, or for which no financial projections or opinions on the investment merits of the company are provided.
It is permitted for the total expected returns to be temporarily outside the prescribed ranges due to extreme market volatility or other justifiable company or industry-specific reasons.
Free Float (float / current shares outstanding) *100 – This float figure is the number of shares that are available to the public and is calculated by subtracting the shares held by insiders and those deemed to be stagnant shareholders. Stagnant holders include ESOP's, ESOT's, QUEST's, employee benefit trusts, founding shareholder equity stake plus senior management equity stake, corporations not actively managing money, venture capital companies and shares held by Governments.
Terminal Value methodology - APP Securities' Discounted Cash Flow (DCF) valuation applies a terminal growth rate to the last forecast year's cash flow and discounts the amount using Weighted Average Cost of Capital (WACC). The Terminal Value is tested using ASX-listed company multiples. For resource company’s there is no terminal value because cash flows are forecast to the end of mine life.
© Copyright APP Securities Pty Ltd