PBF Energy Inc.investors.pbfenergy.com/~/media/Files/P/PBF-Energy-I… · · 2016-01-12PBF Energy...
22
PBF Energy Inc. January 2014
Transcript of PBF Energy Inc.investors.pbfenergy.com/~/media/Files/P/PBF-Energy-I… · · 2016-01-12PBF Energy...

PBF Energy Inc. January 2014

2
Legal Notice / Forward-Looking Statements
This presentation contains forward-looking statements made by PBF Energy Inc. (the “Company” or “PBF”) and
its management. Such statements are based on current expectations, forecasts and projections, including, but not
limited to, anticipated financial and operating results, plans, objectives, expectations and intentions that are not
historical in nature. Forward-looking statements should not be read as a guarantee of future performance or
results, and may not necessarily be accurate indications of the times at, or by which, such performance or results
will be achieved. Forward-looking statements are based on information available at the time, and are subject to
various risks and uncertainties that could cause the Company’s actual performance or results to differ materially
from those expressed in such statements. Factors that could impact such differences include, but are not limited
to, changes in general economic conditions; volatility of crude oil and other feedstock prices; fluctuations in the
prices of refined products; the impact of disruptions to crude or feedstock supply to any of our refineries, including
disruptions due to problems with third party logistics infrastructure; effects of litigation and government investigations; the
timing and announcement of any potential acquisitions and subsequent impact of any future acquisitions on our capital
structure, financial condition or results of operations; changes or proposed changes in laws or regulations or differing
interpretations or enforcement thereof affecting our business or industry, including any lifting by the federal government of
the restrictions on exporting U.S. crude oil; actions taken or non-performance by third parties, including suppliers,
contractors, operators, transporters and customers; adequacy, availability and cost of capital; work stoppages or
other labor interruptions; operating hazards, natural disasters, weather-related delays, casualty losses and other
matters beyond our control; inability to complete capital expenditures, or construction projects that exceed
anticipated or budgeted amounts; inability to successfully integrate acquired refineries or other acquired
businesses or operations; effects of existing and future laws and governmental regulations, including
environmental, health and safety regulations; and, various other factors.
Forward-looking statements reflect information, facts and circumstances only as of the date they are made. The
Company assumes no responsibility or obligation to update forward-looking statements to reflect actual results,
changes in assumptions or changes in other factors affecting forward-looking information after such date.

3
U.S. Refining Industry Strengths
Inexpensive
Natural Gas
Growth in supply driving decline in U.S. natural gas pricing
― U.S. natural gas currently priced more than 60% below Europe
― ~$0.10 / bbl benefit to domestic refiners for every $1 / MMBtu
difference in natural gas price
North American
Crude
Oil Production
Secular growth in North American crude oil production
― Favorable price dislocations between North American crude
and rest of world
Complex
Refineries
U.S. average refinery Nelson Complexity of 10.8 versus Western
European average refinery Nelson Complexity of 7.8
Product
Exports
Cost and technological advantages have spurred export
opportunities
― East Coast to Europe, West Africa, and Latin America
Why will the U.S. refining industry prosper for the next 5 years?

4
PBF owns three oil refineries located in Ohio,
Delaware and New Jersey
― Aggregate throughput capacity of
approximately 540,000 barrels per day
― Weighted average Nelson Complexity of 11.3
― Fifth largest U.S. independent refiner
― East Coast rail infrastructure results in the
entire system having access to WTI-based,
cost-advantaged crude supply
Summary Company Profile
Cushing
Toledo
Paulsboro
Delaware City
Region
Throughput
Capacity (bpd)
Date
Acquired
Nelson
Complexity
Replacement
Cost
Benchmark
Crack Spread
Mid-Continent 170,000 3/1/2011 9.2 $2.4 billion WTI (Chicago) 4-3-1
East Coast 370,000 2010 12.2 $5.8 billion Dated Brent (NYH) 2-1-1
Total 540,000 11.3 (1) $8.2 billion
(1) Represents weighted average Nelson Complexity for PBF’s three refineries

5
Increasing East Coast access to currently cost-advantaged North American crude oil
PBF’s onsite rail-infrastructure at Delaware City provides the
opportunity to save approximately $3/bbl on delivered Bakken
barrels versus using 3rd party facilities
North American Crude Production
U.S. crude production is estimated
to grow by 55% (3 million bpd)
from 2010 through 2014
― Pushes barrels South (via
water, pipeline and rail), East
and West (primarily by rail)
― Ultimately displaces USGC
imports
Canadian crude production is
expected to grow by 32%
(900 kbpd) from 2010 through
2014
― Bitumen by rail advantaged
versus pipeline transportation
of diluted crudes
6
5.2 5.5
8.5 9.0 9.6
2.5 2.8
3.7 3.9
4.9
7.7 8.3
12.2 12.9
14.4
-
2.0
4.0
6.0
8.0
10.0
12.0
14.0
16.0
2005 2010 2014 2015 2020
MM
bp
d
US CanadaSource: EIA, CAPP
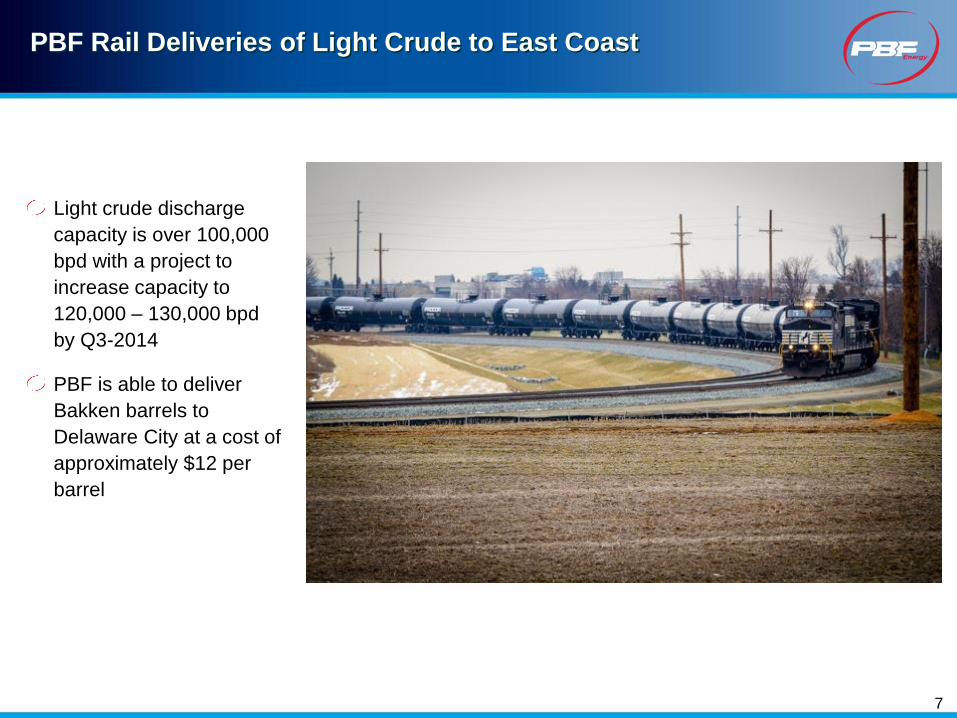
PBF Rail Deliveries of Light Crude to East Coast
Light crude discharge
capacity is over 100,000
bpd with a project to
increase capacity to
120,000 – 130,000 bpd
by Q3-2014
PBF is able to deliver
Bakken barrels to
Delaware City at a cost of
approximately $12 per
barrel
7

PBF Rail Deliveries of Canadian Heavy Crude to East Coast
PBF’s heavy crude unloading capacity is
expected to double from approximately
40,000 bpd to approximately 80,000 bpd
by Q3-2014 as PBF completes its ongoing
rail expansion project and infrastructure
projects are completed in Canada
Deliveries of Canadian heavy crude are
dependent on access to coiled and
insulated railcars as well as rail
transloading facilities in Canada
Transportation costs for Canadian-heavy
are expected to decline from above $20
per barrel to below $17 per barrel as PBF-
controlled railcar fleet expands and the
benefits of unit-train economics are
realized
8

9
Crude-by-Rail Pipeline
Planned Leased or Owned Railcars
Note: Schedule is subject to change based on current company plans and on current third party railcar manufacturer delivery schedules
Longer-term focus on logistics
― Rail services agreements with Norfolk Southern and BNSF
Increased ability to load unit trains
― Transloading agreement with Savage in Trenton, ND
Advantageous commercial arrangements with crude producers
― Supply agreement with Continental Resources for Bakken
Ensuring delivery
― Agreement with Trinity for delivery of rail cars
― PBF’s fleet of new railcars meet the highest DOT-111A standards
― Increased availability of “delivered” deals
1,808 1,966 2,023 2,625
3,100 3,800
4,516 4,600 1,283 1,300 1,300
1,300 1,300
1,300
1,300 1,300
-
1,000
2,000
3,000
4,000
5,000
6,000
1Q14 2Q14 3Q14 4Q14 1Q15 2Q15 3Q15 4Q15
Coiled & Insulated General Purpose

10
Widening Crude Differentials
Crude differentials widened out during the fourth quarter of 2013 and PBF
expects to realize the benefits of the wider differentials as crude
purchased during the fourth quarter is processed at our refineries in the
latter part of Q4-13 and the beginning of Q1-14
$/bbl Q1 – Q3-2103
Average
Q4-2013
Average
WCS-Brent (32.67) (43.15)
Bakken-Brent (13.05) (22.72)
ASCI-Brent (4.30) (13.53)
Syncrude-WTI 2.26 (9.35)
Increasing North American production, North American crude oil
distribution logistics, seasonality and other events will continue to impact
differentials and PBF expects differentials to remain volatile but favorable
for US refiners

11
Brent versus WTI
Widening Brent – WTI differential positively impacts cost-advantage of
North American produced crude oils
(35.00)
(30.00)
(25.00)
(20.00)
(15.00)
(10.00)
(5.00)
-
5.00
10.00
Jan Feb Mar Apr May Jun Jul Aug Sep Oct Nov Dec
$/b
bl
WTI - Brent
Min Max (07 to 11) 2013 2012 Average (07 to 11)Source: Platts

12
WCS versus Brent
Expanding differentials positively impact rail economics for Canadian
Heavy crude oil processed at PBF’s East Coast refineries
(70.00)
(60.00)
(50.00)
(40.00)
(30.00)
(20.00)
(10.00)
-
10.00
Jan Feb Mar Apr May Jun Jul Aug Sep Oct Nov Dec
$/b
bl
WCS - Brent
Min Max (07 to 11) 2013 2012 Average (07 to 11)Source: Platts

Bakken versus Brent
13
(50.00)
(45.00)
(40.00)
(35.00)
(30.00)
(25.00)
(20.00)
(15.00)
(10.00)
(5.00)
-
Jan Feb Mar Apr May Jun Jul Aug Sep Oct Nov Dec
$/b
bl
Bakken - Brent
Min Max (10 to 12) 2013 Average (10 to 12)Source: Platts
Note: Prior to May 2010 Bakken pricing is unavailable
Expanding differentials positively impact rail economics for Mid-continent
light-sweet crude oil processed at PBF’s East Coast refineries

14
ASCI Differential versus Brent
ASCI is an indicator for medium-sour barrels processed
at PBF’s East Coast facilities
(25.00)
(20.00)
(15.00)
(10.00)
(5.00)
-
5.00
Jan Feb Mar Apr May Jun Jul Aug Sep Oct Nov Dec
$/b
bl
ASCI - Brent
Min Max (07 to 11) 2013 2012 Average (07 to 11)Source: Platts, Argus

15
PBF’s Key Mid-continent differential versus WTI
Toledo processes approximately 35% to 40% Syncrude
(25.00)
(20.00)
(15.00)
(10.00)
(5.00)
-
5.00
10.00
15.00
20.00
Jan Feb Mar Apr May Jun Jul Aug Sep Oct Nov Dec
$/b
bl
Syncrude - WTI
Min Max (07 to 11) 2013 2012 Average (07 to 11)Source: Platts

PBF’s East Coast Benchmark Crack
16
NYH 2:1:1 = ((–2*Dated Brent) + (1*NY RBOB) + (1*NO.2 Heating Oil))/2
-
5.00
10.00
15.00
20.00
25.00
30.00
Jan Feb Mar Apr May Jun Jul Aug Sep Oct Nov Dec
$/b
bl
NYH 2:1:1
Min Max (07 to 11) 2013 2012 Average (07 to 11)Source: Platts
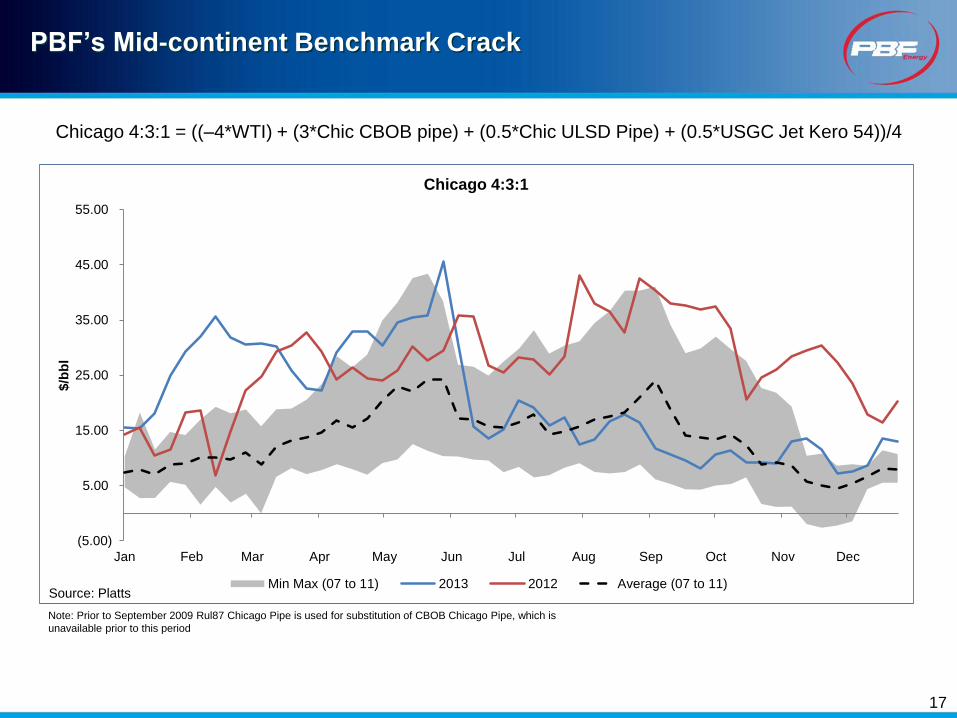
PBF’s Mid-continent Benchmark Crack
Chicago 4:3:1 = ((–4*WTI) + (3*Chic CBOB pipe) + (0.5*Chic ULSD Pipe) + (0.5*USGC Jet Kero 54))/4
17
(5.00)
5.00
15.00
25.00
35.00
45.00
55.00
Jan Feb Mar Apr May Jun Jul Aug Sep Oct Nov Dec
$/b
bl
Chicago 4:3:1
Min Max (07 to 11) 2013 2012 Average (07 to 11)Source: Platts
Note: Prior to September 2009 Rul87 Chicago Pipe is used for substitution of CBOB Chicago Pipe, which is
unavailable prior to this period

18
PBF MLP
Submitted confidential registration statement in August 2013
PBF has identified a pool of assets that could be contributed to a
logistics-focused Master Limited Partnership (MLP)
Possible MLP assets include but are not limited to:
― Rail terminals and railcars
― Refinery truck terminals
― Pipeline assets
― Tank storage facilities
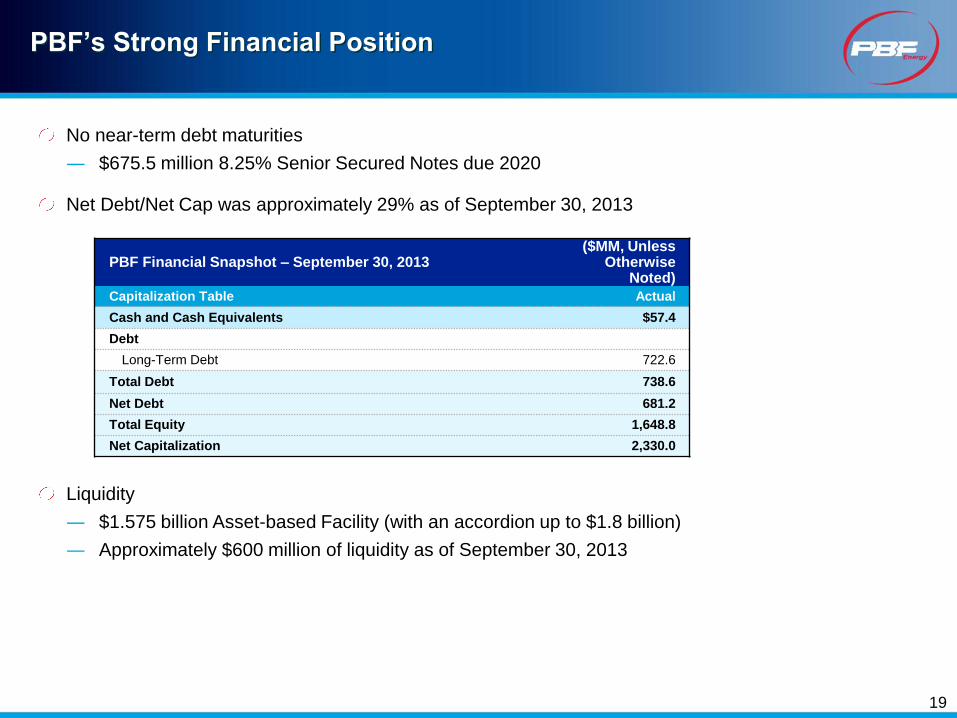
No near-term debt maturities
― $675.5 million 8.25% Senior Secured Notes due 2020
Net Debt/Net Cap was approximately 29% as of September 30, 2013
Liquidity
― $1.575 billion Asset-based Facility (with an accordion up to $1.8 billion)
― Approximately $600 million of liquidity as of September 30, 2013
19
PBF’s Strong Financial Position
PBF Financial Snapshot – September 30, 2013 ($MM, Unless
Otherwise Noted)
Capitalization Table Actual
Cash and Cash Equivalents $57.4
Debt
Long-Term Debt 722.6
Total Debt 738.6
Net Debt 681.2
Total Equity 1,648.8
Net Capitalization 2,330.0

20
PBF’s Fourth Quarter 2013 Cash Highlights
All figures displayed below are estimates, unaudited, subject to change, are
provided for information purposes only and are not indicative of the actual
earnings of the company for the period
In Q4-13, PBF generated an estimated $125-$150 million of cash from
operations and working capital
PBF’s Q4-2013 Cash Highlights
($MM, Unless Otherwise
Noted)
Est. Cash and Cash Equivalents as of December 31, 2013 $75
Est. Total Debt outstanding as of December 31, 2013 $745 – $755
Est. Net Debt at December 31, 2013 $670 – $680
Est. Uses of cash in Q4-2013
Est. Decrease in Net Debt from September 30, 2013 $0 – $10
Est. Q4 Capital Expenditures $85 – $100
Dividend Payments $30
Est. Cash Interest Expense $10
Est. Cash generated from Operations/Working Capital $125 – $150
21
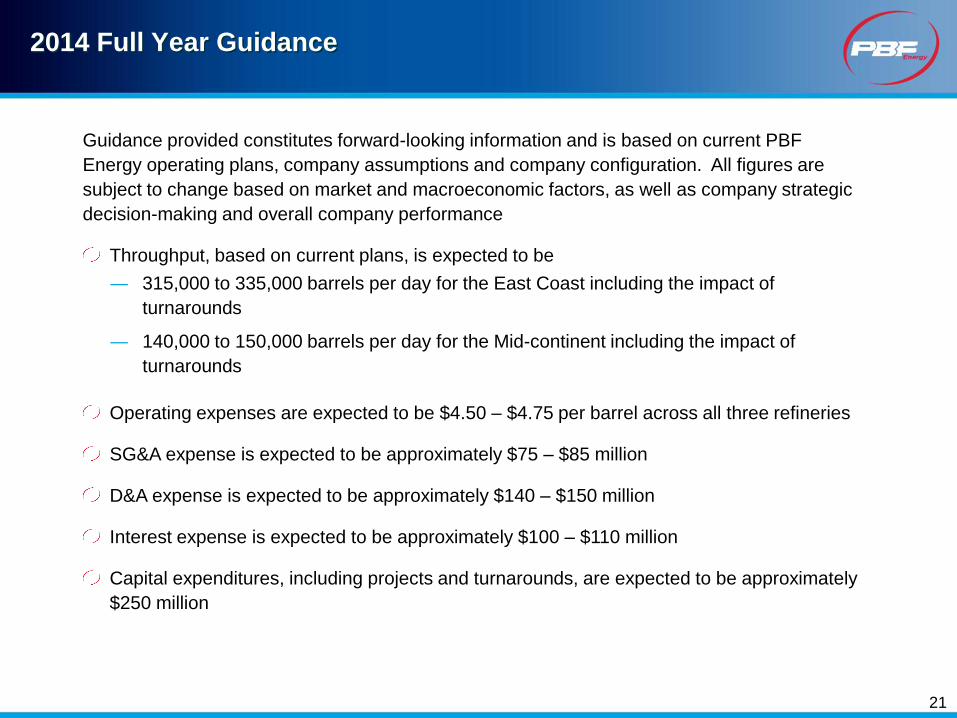
2014 Full Year Guidance
Guidance provided constitutes forward-looking information and is based on current PBF
Energy operating plans, company assumptions and company configuration. All figures are
subject to change based on market and macroeconomic factors, as well as company strategic
decision-making and overall company performance
Throughput, based on current plans, is expected to be
― 315,000 to 335,000 barrels per day for the East Coast including the impact of
turnarounds
― 140,000 to 150,000 barrels per day for the Mid-continent including the impact of
turnarounds
Operating expenses are expected to be $4.50 – $4.75 per barrel across all three refineries
SG&A expense is expected to be approximately $75 – $85 million
D&A expense is expected to be approximately $140 – $150 million
Interest expense is expected to be approximately $100 – $110 million
Capital expenditures, including projects and turnarounds, are expected to be approximately
$250 million