
P/B - · PDF fileBajaj Finance- The Leader in Consumer Product Finance ... With SME Lending...
8
27-Nov-17 Bajaj Finance- The Leader in Consumer Product Finance 2QFY18 1QFY18 4QFY17 Promoters 55 58 58 DII 7 6 2 FII 21 19 19 Others 17 18 20 Financials/Valuation FY15 FY16 FY17 FY18E FY19E 1Mn 3Mn 1Yr NII 2872 4030 5469 7592 10155 Absolute -1 -2 53 PPP 1741 2507 3636 4879 6643 Rel.to Nifty -1 -7 31 PAT 898 1279 1837 2491 3477 NIM % 10.2 10.5 10.5 10.7 10.6 EPS (Rs) 18 24 34 43 60 EPS growth (%) 24 33 41 29 40 ROE (%) 20 21 22 19 20 ROA (%) 3.1 3.2 3.3 3.9 4.1 BV 960 1368 176 278 331 P/B (X) 4.3 5.1 6.7 6.4 5.4 P/E (x) 22.8 29.0 35.0 41.3 29.6 BAF IN BLOOMBERG - SWETA PADHI DEEPAK KUMAR [email protected] Narnolia Securities Ltd Please refer to the Disclaimers at the end of this Report Av. Volume (,000) 45.51 BAJFINANCE is trading at its higher range of P/B. 52wk Range H/L 1989/762 Mkt Capital (Rs Cr) 102927 Previous Target Price N/A Upside 11% Change from Previous N/A CMP 1785 Target Price 1988 INDUSTRY - NIFTY - NBFC BSE Code - BAJFINANC E NSE Code - 500034 With the customer base of over 22 Million, BAF finance 60% of loans to its existing customer. Management expects this ratio to be 70% over a period of time. Despite the aggressive growth in AUM, management of BAJFINANCE has demonstrated their capabilities to keep the delinquencies at lower level in comparison to its peers even in challenging macro situation. During the 2Q FY18 results, BAF has reported healthy set of numbers with PAT growing at 37% and net income registering 39% growth YoY. AUM also registered healthy growth of 38%. Assets Quality remained stable with GNPA at 1.7%. We value Bajaj Finance at Rs 1988 (6x BVPS FY19e) and recommend ACCUMULATE on the stock. 10389 Bajaj Finance is a leading financier in consumer durable products and one of the fastest growing NBFC with the AUM size of over Rs 70,000 Cr. AUM has grown at 35% CAGR over the last 5 years while earnings have also registered with 35% CAGR during the same period. With the strategically diversifying the product portfolio and aggressively expanding the distribution network position Bajaj Finance in a sweet spot to reap the benefit from rising consumer product demand in India. Over a period of time management has been proactively investing in its capabilities to enhance the technology, process and people. Currently management is again focusing on BAF 2.0 strategy which emphasises on expanding distribution, product, process and brand building. We expect this will provide operating leverage in medium to longer term. Company Data Stock Performance % Share Holding Pattern % 80 100 120 140 160 180 200 BAJFINANCE NIFTY - 1.0 2.0 3.0 4.0 5.0 6.0 7.0 8.0 P/B
Transcript of P/B - · PDF fileBajaj Finance- The Leader in Consumer Product Finance ... With SME Lending...
27-Nov-17
Bajaj Finance- The Leader in Consumer Product Finance
2QFY18 1QFY18 4QFY17
Promoters 55 58 58
DII 7 6 2
FII 21 19 19
Others 17 18 20
Financials/Valuation FY15 FY16 FY17 FY18E FY19E
1Mn 3Mn 1Yr NII 2872 4030 5469 7592 10155
Absolute -1 -2 53 PPP 1741 2507 3636 4879 6643
Rel.to Nifty -1 -7 31 PAT 898 1279 1837 2491 3477
NIM % 10.2 10.5 10.5 10.7 10.6
EPS (Rs) 18 24 34 43 60
EPS growth (%) 24 33 41 29 40
ROE (%) 20 21 22 19 20
ROA (%) 3.1 3.2 3.3 3.9 4.1
BV 960 1368 176 278 331
P/B (X) 4.3 5.1 6.7 6.4 5.4
P/E (x) 22.8 29.0 35.0 41.3 29.6
BAF INBLOOMBERG -
SWETA PADHI
DEEPAK [email protected]
Narnolia Securities LtdPlease refer to the Disclaimers at the end of this Report
Av. Volume (,000) 45.51
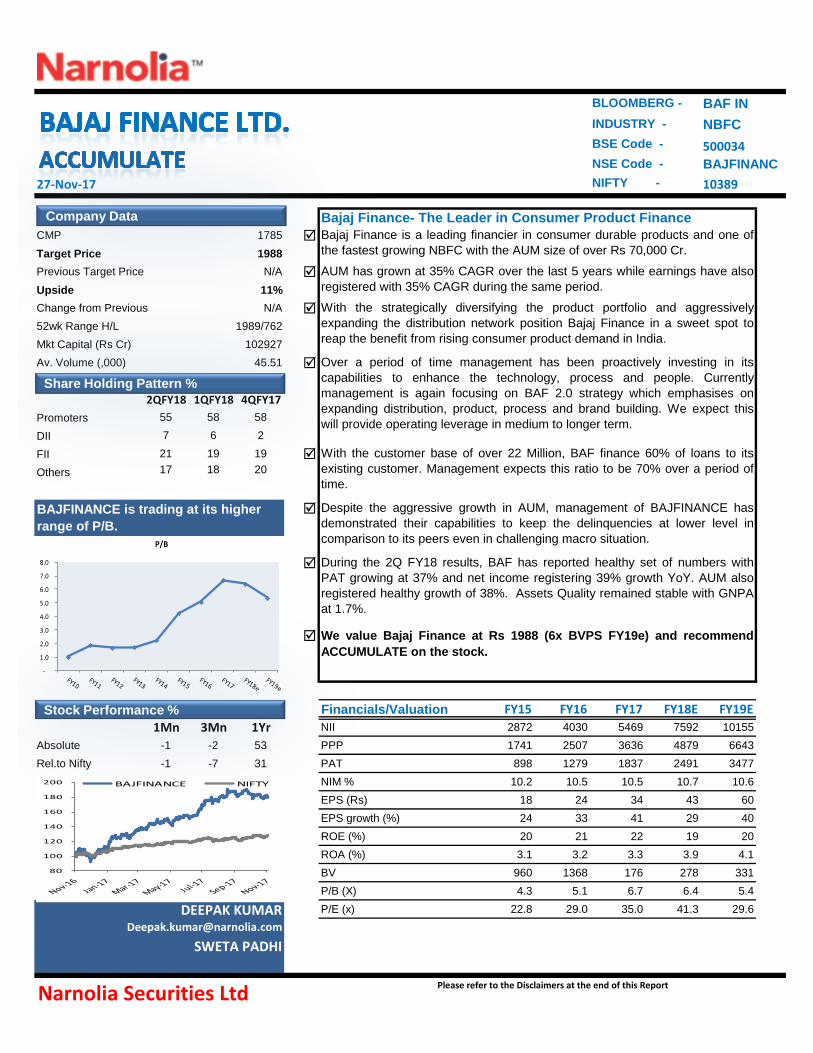
BAJFINANCE is trading at its higher
range of P/B.
52wk Range H/L 1989/762
Mkt Capital (Rs Cr) 102927
Previous Target Price N/A
Upside 11%
Change from Previous N/A
CMP 1785
Target Price 1988
INDUSTRY -
NIFTY -
NBFC
BSE Code -
BAJFINANC
E
NSE Code -
500034
With the customer base of over 22 Million, BAF finance 60% of loans to its
existing customer. Management expects this ratio to be 70% over a period of
time.
Despite the aggressive growth in AUM, management of BAJFINANCE has
demonstrated their capabilities to keep the delinquencies at lower level in
comparison to its peers even in challenging macro situation.
During the 2Q FY18 results, BAF has reported healthy set of numbers with
PAT growing at 37% and net income registering 39% growth YoY. AUM also
registered healthy growth of 38%. Assets Quality remained stable with GNPA
at 1.7%.
We value Bajaj Finance at Rs 1988 (6x BVPS FY19e) and recommend
ACCUMULATE on the stock.
10389
Bajaj Finance is a leading financier in consumer durable products and one of
the fastest growing NBFC with the AUM size of over Rs 70,000 Cr.
AUM has grown at 35% CAGR over the last 5 years while earnings have also
registered with 35% CAGR during the same period.
With the strategically diversifying the product portfolio and aggressively
expanding the distribution network position Bajaj Finance in a sweet spot to
reap the benefit from rising consumer product demand in India.
Over a period of time management has been proactively investing in its
capabilities to enhance the technology, process and people. Currently
management is again focusing on BAF 2.0 strategy which emphasises on
expanding distribution, product, process and brand building. We expect this
will provide operating leverage in medium to longer term.
Company Data
Stock Performance %
Share Holding Pattern %
80
100
120
140
160
180
200 BAJFINANCE NIFTY
-
1.0
2.0
3.0
4.0
5.0
6.0
7.0
8.0
P/B

Financials 2QFY17 3QFY17 4QFY17 1QFY18 2QFY18 YoY % QoQ% FY16 FY17 YoY %
Interest Inc. 2,180 2,527 2,461 2,915 2,852 30.8% -2.1% 6,957 9,272 33.3%
Interest Exp. 956 980 984 1,078 1,144 19.6% 6.1% 2,927 3,803 29.9%
NII 1,224 1,547 1,477 1,837 1,709 39.6% -7.0% 4,030 5,469 35.7%
Other Income 19 27 8 14 16 -15.2% 14.6% 427 731 71.2%
Total Income 1,410 1,749 1,689 2,087 1,959 38.9% -6.1% 4,536 6,226 37.3%
Ope Exp. 614 719 710 876 875 42.4% 0.0% 1,949 2,564 31.6%
PPP 795 1,030 979 1,211 1,083 36.2% -10.5% 2,507 3,636 45.0%
Provisions 169 180 290 286 228 34.7% -20.2% 543 818 50.7%
PBT 626 850 690 925 856 36.6% -7.6% 1,965 2,818 43.4%
Tax 219 294 241 323 299 36.6% -7.7% 686 981 43.0%
Exceptional Item - - - - -
Net Profit 408 556 449 602 557 37% -7.5% 1,279 1,837 43.6%
Profitability Metrix 2QFY17 3QFY17 4QFY17 1QFY18 2QFY18 YoY(+/-) QoQ(+/-) FY16 FY17 YoY %
C/I Ratio % 43.6 41.1 42.0 42.0 44.7 1.1 2.7 43.7 41.4 -2.38
Empl. Cost/ Tot. Exp. % 34.7 35.1 37.2 35.2 38.4 3.7 3.2 14.1 15.0 0.90
Other Exp/Tot. Exp.% 34.7 36.1 28.8 31.4 58.8 24.2 27.4 14.5 12.9 -1.52
Provision/PPP % 21.3 17.5 29.6 23.6 21.0 -0.2 -2.6 21.6 22.5 0.85
Tax Rate % 34.9 34.6 34.9 34.9 34.9 0.0 0.0 34.9 34.8 -0.10
Int Exp./Int Inc. (%) 43.9 38.8 40.0 37.0 40.1 -3.8 3.1 42.1 41.0 -1.05
Other Income/NII % 0.1 0.1 0.1 0.1 0.1 0.0 0.0 0.0 0.0 -0.01
PPP/ Net Income % 56.4 58.9 58.0 58.0 55.3 -1.1 -2.7 56.3 58.6 2.38
PAT/ Net Income % 28.9 31.8 26.6 28.9 28.4 -0.5 -0.4 28.7 29.6 0.93
NII Growth % (YoY) 36.4 26.5 45.5 43.2 39.6 3.2 -3.6 40.3 35.7 -4.61
PPP Growth YoY % 40.8 33.5 51.7 45.7 36.2 -4.6 -9.5 44.0 45.0 1.00
PAT Growth % YoY 45.9 36.0 42.6 42.0 36.6 -9.4 -5.4 42.4 43.6 1.21
Narnolia Securities LtdPlease refer to the Disclaimers at the end of this Report
BAF reported healthy set of all round performance across the parameters. PAT grew by 37% YoY and
Net Income grew by 39% YoY on the back of strong AUM growth.
Operating profit grew at 36% offsetting the trend of 40% growth in the last 2 quarters; this has happened
with rising cost/ income ratio, it has increased to 44.7% in 2QFY18 from 43.6% in 2QFY17. Rise in C/I
ratio was due to implementation of BAF 2.0 strategy by management. Overall operating expenses grew
by 42% YoY. In the near term C/I ratio is expect to remain elevated due the BAF 2.0 strategy.
With the stable assets quality, credit cost remained in line with past trend. Credit cost was 1.3% for 2Q
FY18.
Calculated NIM has improved by 8 bps to 9.69% on the back decline in cost of fund. Management
recently raised capital which will further support the margin expansion in near term.
Quarterly Performance
Profitability remained healthy, Margins continue to expand.
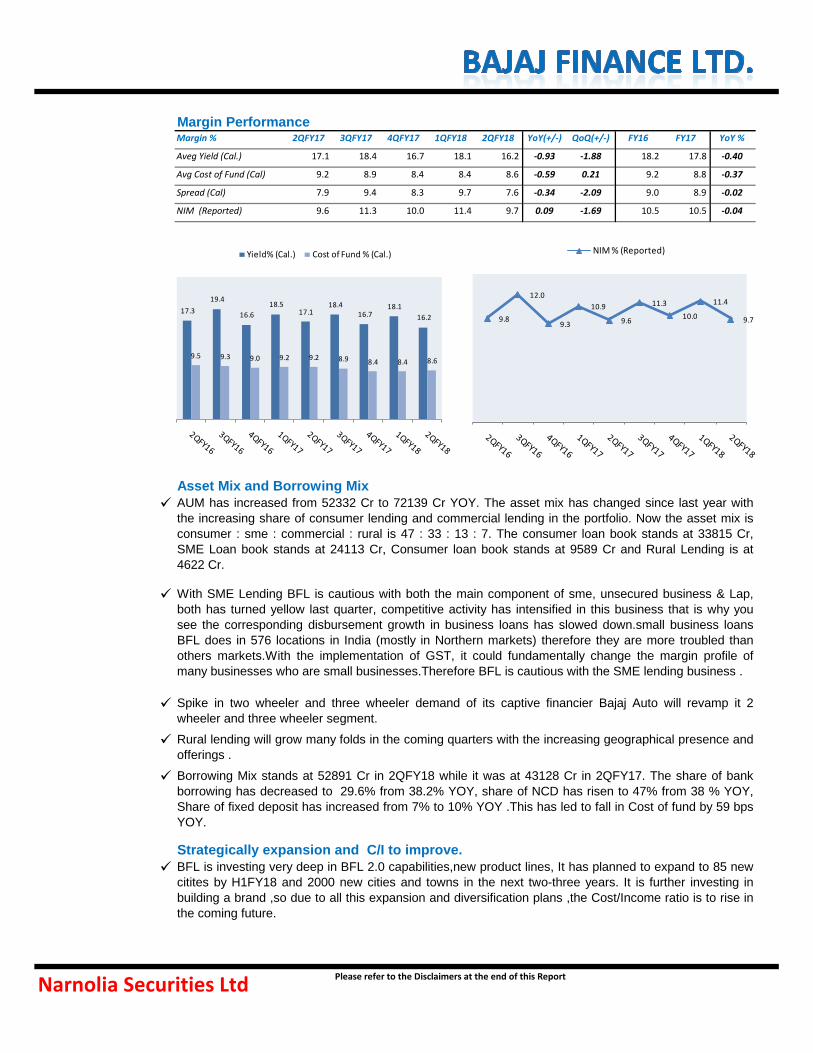
Margin % 2QFY17 3QFY17 4QFY17 1QFY18 2QFY18 YoY(+/-) QoQ(+/-) FY16 FY17 YoY %
Aveg Yield (Cal.) 17.1 18.4 16.7 18.1 16.2 -0.93 -1.88 18.2 17.8 -0.40
Avg Cost of Fund (Cal) 9.2 8.9 8.4 8.4 8.6 -0.59 0.21 9.2 8.8 -0.37
Spread (Cal) 7.9 9.4 8.3 9.7 7.6 -0.34 -2.09 9.0 8.9 -0.02
NIM (Reported) 9.6 11.3 10.0 11.4 9.7 0.09 -1.69 10.5 10.5 -0.04
Margin Performance
AUM has increased from 52332 Cr to 72139 Cr YOY. The asset mix has changed since last year with
the increasing share of consumer lending and commercial lending in the portfolio. Now the asset mix is
consumer : sme : commercial : rural is 47 : 33 : 13 : 7. The consumer loan book stands at 33815 Cr,
SME Loan book stands at 24113 Cr, Consumer loan book stands at 9589 Cr and Rural Lending is at
4622 Cr.
BFL is investing very deep in BFL 2.0 capabilities,new product lines, It has planned to expand to 85 new
citites by H1FY18 and 2000 new cities and towns in the next two-three years. It is further investing in
building a brand ,so due to all this expansion and diversification plans ,the Cost/Income ratio is to rise in
the coming future.
With SME Lending BFL is cautious with both the main component of sme, unsecured business & Lap,
both has turned yellow last quarter, competitive activity has intensified in this business that is why you
see the corresponding disbursement growth in business loans has slowed down.small business loans
BFL does in 576 locations in India (mostly in Northern markets) therefore they are more troubled than
others markets.With the implementation of GST, it could fundamentally change the margin profile of
many businesses who are small businesses.Therefore BFL is cautious with the SME lending business .
Spike in two wheeler and three wheeler demand of its captive financier Bajaj Auto will revamp it 2
wheeler and three wheeler segment.
Rural lending will grow many folds in the coming quarters with the increasing geographical presence and
offerings .
Borrowing Mix stands at 52891 Cr in 2QFY18 while it was at 43128 Cr in 2QFY17. The share of bank
borrowing has decreased to 29.6% from 38.2% YOY, share of NCD has risen to 47% from 38 % YOY,
Share of fixed deposit has increased from 7% to 10% YOY .This has led to fall in Cost of fund by 59 bps
YOY.
Asset Mix and Borrowing Mix
Strategically expansion and C/I to improve.
Narnolia Securities LtdPlease refer to the Disclaimers at the end of this Report
17.3
19.4
16.6
18.5 17.1
18.4 16.7
18.1
16.2
9.5 9.3 9.0 9.2 9.2 8.9 8.4 8.4 8.6
Yield% (Cal.) Cost of Fund % (Cal.)
9.8
12.0
9.3
10.9
9.6
11.3
10.0
11.4
9.7
NIM % (Reported)

Assets Quality
Performance 2QFY17 3QFY17 4QFY17 1QFY18 2QFY18 YoY(+/-) QoQ(+/-) FY16 FY17 YoY %
GNPA (Rs in Cr) 808.0 820.0 982.4 1136.0 1187.0 46.9% 4.5% 538.0 722.0 34.2%
GNPA % 1.6 1.5 1.7 1.7 1.7 0.10 -0.02 1.2 1.5 0.24
NNPA (Rs in Cr) 218.0 217.0 255.4 352.0 356.0 63.3% 1.1% 122.9 198.0 61.1%
NNPA % 0.4 0.4 0.4 0.5 0.5 0.08 -0.02 0.3 0.4 0.13
PCR % (reported) 80.0 77.2 72.6 73.0 73.5 -6.46 0.52 77.2 72.6 -4.57
Narnolia Securities LtdPlease refer to the Disclaimers at the end of this Report
BFL is cautious in SME segment because of implementation of gst ,the northern markets are affected
with this formalisation process and their margins can be severly affected, therefore BFL has pulled back
in SME lending business.
Concall Highlights :
Accelerated provision of INR300m due to the impact of GST and demonetization.
In last five months RBL has issued 135000cards. It further targets to be amongst 4-5 largest cobranded
distributors in next 3 years.
Substantial investment in strategy BFL 2.0.
Distribution and expansion of existing product lines and also launch of new product lines.It plan to
enterinto 85 new cities/towns in 1HFY18 and almost 2000 cities/ towns in the next 2-3 years.
AUM (excluding commercial loans) top-20 cities cater to 35% of it. 5 years from now top-20 cities should
contribute to <20% of AUM (excluding commercial loans).
60% of our loans are existing customers. We want to take that 60% to 70% in the next two years to
three years horizon.
Rural Business to expand strongly and to become 10% - 12% of the balance sheet in the next three
years to four years horizon.
Stable Non-Performing Assets.
GNPA has decreased to 1.68% from 1.70% QOQ, NNPA has decreased to .51% from .53% QOQ.
Credit Cost has declined from 1.77% to 1.29% QOQ.
CRAR has increased to 25.42% in 2QFY18 from 20.15% in 1QFY18. Tier 1 capital has increased to
19.86 % from 14.20% QOQ.
Its GNPA in the SME segment remained stable QoQ at 1.9% but declined to 2.1% in the consumer
segment from 2.3% in 1QFY18; GNPA in rural increased to 0.85% from 0.75% in 1QFY18.
1.7
1.3 1.2
1.5 1.6
1.5
1.7 1.7 1.7
0.5
0.3 0.3 0.4 0.4 0.4 0.4
0.5 0.5
GNPA % NNPA %
68.0
71.0
68.0
73.0
80.0
77.2
72.6 73.0 73.5
PCR % (Calculated)

2QFY16 3QFY16 4QFY16 1QFY17 2QFY17 3QFY17 4QFY17 1QFY18 2QFY18
AUM 37,964 43,452 44,229 49,608 52,332 57,605 60,194 68,883 72,139
>> Growth YoY % 36 41 36 40 38 33 36 39 38
Borrowings 30,072 34,214 37,025 40,155 43,128 44,531 49,250 53,569 52,891
>> Growth YoY % 30 37 39 41 43 30 33 33 23
AUM
On Book 37,964 43,452 44,229 49,608 52,332 57,605 60,194 68,883 72,139
Off Book 36,515 41,760 42,756 47,923 49,981 54,285 56,832 65,121 68,614
Consumer Lending 41 42 43 44 46 47 45 46 47
SME lending 47 44 42 40 39 37 36 34 33
Commercial Lending 10 11 12 12 12 12 14 15 13
Rural Lending 2 3 3 3 4 4 5 6 6
View and Valuation
AUM Composition %
Performance in Charts and Graphs
Business Analysis (Rs in Cr)
Narnolia Securities LtdPlease refer to the Disclaimers at the end of this Report
Bajaj Finance (BAF) is one of the fastest growing NBFC with the AUM clocking a growth of 35% CAGR
over FY12 to FY17. Diversification of assets, efficient management, delinquency control and
strategically investments in franchise are the key drivers for BAF over a period a time. Continuous
expansion of network and reaching to the newer geographies have led to mountain the customer base
of over 22 million which is one of the major strength for BAF to support the growth in its retail lending
business. Customer acquisition has been also supported strongly by quick turnaround time for which
management has continuously invested in technology and process and thus, it gives BAF an edge over
its peers in retail financing segment.
With the diversification of portfolio, AUM has continuously outpaced the industry growth despite
checking delinquency ratio to the lower side among peers. Management has been prudent in early
recognising of stress and decision making which has helped BAF in keeping healthy assets quality
even in challenging economic situation. BAF is one of the leading players in consumer durable finance
business and has been continuously gaining the market share on the back of strong distribution
network. Management is still focusing on expanding the distribution network and to reach newer
geographical area. We expect with the scaling of consumer durable and SME business, BAF is well
poised to set 32%+ AUM CAGR over FY17 to FY20.
Margins are expect to remain stable in near term due to scaling of high yield consumer durable, recent
capital raising and declining cost of fund from MCLR reduction by banks. Management has been
focusing on expansion and digitalization under BAF 2.0 strategy which will increase the cost to income
ratio in near terms.
We expect BAF to report RoE of 20% and RoA of 4% in FY19. We value Bajaj Finance at Rs 1988
(6x BVPS FY19e) and recommend ACCUMULATE on the stock.

Healthy AUM growth trend
Narnolia Securities LtdPlease refer to the Disclaimers at the end of this Report
Borrowing shifted towards NCDs
Total Cross Sell Franchisee
Asset Portfolio
Provision/Aum
Continuous improvement in C/I ratio.
35.6
41.0
36.5 39.5
37.8
32.6
36.1 38.9 37.8
-
5.0
10.0
15.0
20.0
25.0
30.0
35.0
40.0
45.0
-
10,000
20,000
30,000
40,000
50,000
60,000
70,000
80,000
AUM Growth YoY %
FY13 FY14 FY15 FY16 FY17 2QFY18
Banks Non convertible debentures
Fixed deposits Tier 2 debt
Commercial paper Others4
9.1
54
.0
40
.8
58
.1
40
.8
33
.5
51
.7
45
.7
36
.2
43.9 41.6
43.9 41.4
43.6 41.1 42.0 42.0
44.7
Operating Profit Growth YoY % C/I Ratio %
0
50
100
150
200
250
Cross Sell Franchisee (In Lacs.) Total Franchisee (In Lacs.)
-
0.50
1.00
1.50
2.00
2.50
Credit Cost
0
10000
20000
30000
40000
50000
60000
70000
80000
Consumer Lending SME lending
Commercial Lending Rural Lending

Balance Sheet Rs in Crores Key Ratios & Assumptions Y/E March FY16 FY17 FY18E FY19E Y/E March FY16 FY17 FY18E FY19E
Share Capital 54 109 115 115 Balance Sheet Metrics
>> Equity Capital 54 109 115 115 AUM 44,229 60,194 81,262 109,704
>> Preference Capital >> Off-Book AUM 1,473 3,362 4,063 5,485
Reserves & Surplus 7,271 9,491 15,923 18,984 AUM Growth (%) 36.5 36.1 35.0 35.0
Networth 7,325 9,600 16,038 19,100 Borrowing Growth (%) 38.7 33.0 25.0 38.1
Change (%) 52.6 31.1 67.1 19.1 Loan/Borrowing Ratio 1.2 1.2 1.3 1.3
Total Borrowing 37,025 49,250 61,562 85,042 CRAR (%) 20 20 23 20
Change (%) 38.7 33.0 25.0 38.1 >> Tier 1 (%) 16.1 14.6 18.5 16.4
Provisions 885 1295 1693 2339 >> Tier 2 (%) 3.4 5.7 4.0 3.4
Other Liability 1,739 3,579 4,648 6,421 Debt/Equity (x) 5.1 5.1 3.8 4.5
Total Liabilities 46,973 63,725 83,941 112,900 Assets Quality Metrics
Assets Side Gross NPA (Rs) 538 982 1,312 1,667
Investments 1,034 4,075 3,007 3,675 Gross NPA (%) 1.23 1.68 1.70 1.60
Loans 43,831 58,239 79,111 106,799 Net NPA (Rs) 123 255 394 467
Change (%) 38.6 32.9 35.8 35.0 Net NPA (%) 0.28 0.44 0.51 0.45
Fixed Assets 287 361 488 603 Specific Prov. Coverage (%) 77.0 74.0 70.0 72.0
Other Assets 492 693 894 1,132 Prov. Exp/Average Loan (%) 1.4 1.6 1.5 1.4
Cash Balance 1,329 357 442 690 Margin Metrics
Total Assets 46,973 63,725 83,941 112,900 Yield On Advances (%) 18.2 17.8 17.3 17.1
Cost Of Funds (%) 9.2 8.8 8.4 8.4
Spread (%) 9.0 8.9 8.9 8.7
Income Statement Rs in Crores NIM (%) 10.5 10.5 10.7 10.6
Y/E March FY16 FY17 FY18E FY19E Profitability & Effeciency Metrics
Interest income 6,957 9,272 12,247 16,291 Int. Expended/Int.Earned (%) 42.1 41.0 38.0 37.7
Interest expended 2,927 3,803 4,655 6,136 Other Income/NII (%) 10.6 13.4 13.9 13.1
Net Interest Income 4,030 5,469 7,592 10,155 Op. Profit/ Net Income (%) 56.3 58.6 56.4 57.8
Change (%) 40.3 35.7 38.8 33.8 Net Profit/Net Income (%) 28.7 29.6 28.8 30.3
Other Income 427 731 1,057 1,334 Cost to Income (%) 43.7 41.4 43.6 42.2
Change (%) 43.2 71.2 44.5 26.3 Employee Exp/ Net Income (%) 14.1 15.0 16.4 14.8
Total Net Income 4,457 6,200 8,648 11,490 Cost on Average Assets (%) 4.9 4.6 5.9 5.8
Change (%) 41 39 39 33 Provisions/PPP (%) 21.6 22.5 21.6 19.7
Operating Expenses 1,949 2,564 3,769 4,847 Tax Rate (%) 34.9 34.8 34.9 34.8
Change (%) 36.5 31.6 47.0 28.6 Valuation Ratio Metrics
> Employee Expenses 630 932 1,414 1,701 EPS (Rs) 23.9 33.6 43.2 60.3
Change (%) 39.7 48.0 51.8 20.3 Change (%) 33.0 40.7 28.7 39.5
> Other Expenses 1,320 1,633 2,355 3,146 ROAE (%) 21.1 21.7 19.4 19.8
Pre-provisioning Profit 2,507 3,636 4,879 6,643 ROAA (%) 3.2 3.3 3.9 4.1
Change (%) 44.0 45.0 34.2 36.2 Dividend Payout (%) 12.6 12.9 12.8 11.9
Provisions 543 818 1,054 1,310 Dividend yield (%) 1.0 0.3 0.3 0.3
Change (%) 41.2 50.7 28.8 24.3 DPS 25.0 3.6 4.6 6.0
PBT 1,965 2,818 3,825 5,332 Book Value (Rs) 137 176 278 331
Tax 686 981 1,333 1,856 Change (%) 42.5 28.4 58.5 19.1
Profit After Tax 1,279 1,837 2,491 3,477 P/B (X) 4.3 5.1 6.7 6.4
Change (%) 42.4 43.6 35.7 39.5 P/E (X) 29.0 35.0 41.3 29.6
Adjusted PAT 1,279 1,837 2,491 3,477
Change (%) 42.4 43.6 35.7 39.5
P/E (X) 7.85139 3.96793 11.65051 9.168229
Financials Snap Shot
Narnolia Securities Ltd Please refer to the Disclaimers at the end of this Report

Narnolia Securities Ltd201 | 2nd Floor | Marble Arch Building | 236B-AJC Bose Road |
Kolkata-700 020 , Ph : 033-40501500
email: [email protected], website
: www.narnolia.com
Risk Disclosure & Disclaimer: This report/message is for the personal information of
the authorized recipient and does not construe to be any investment, legal or taxation
advice to you. Narnolia Securities Ltd. (Hereinafter referred as NSL) is not soliciting any
action based upon it. This report/message is not for public distribution and has been
furnished to you solely for your information and should not be reproduced or
redistributed to any other person in any from. The report/message is based upon publicly
available information, findings of our research wing “East wind” & information that we
consider reliable, but we do not represent that it is accurate or complete and we do not
provide any express or implied warranty of any kind, and also these are subject to change
without notice. The recipients of this report should rely on their own investigations,
should use their own judgment for taking any investment decisions keeping in mind that
past performance is not necessarily a guide to future performance & that the the value of
any investment or income are subject to market and other risks. Further it will be safe to
assume that NSL and /or its Group or associate Companies, their Directors, affiliates
and/or employees may have interests/ positions, financial or otherwise, individually or
otherwise in the recommended/mentioned securities/mutual funds/ model funds and
other investment products which may be added or disposed including & other mentioned
in this report/message.


