
Paying the Price for Flexibility : Unemployment Insurance and the Temporary Staffing Industry
27
84 Working Working Working Working Working USA USA USA USA USA—Winter 2002–3 Mehta and Theodore WorkingUSA, vol. 6, no. 3, Winter 2002–3, pp. 84–110. © 2003 M.E. Sharpe, Inc. All rights reserved. ISSN 1089–7011 / 2003 $9.50 + 0.00. CHIRAG MEHTA is a research associate with the University of Illinois at Chicago Center for Urban Economic Development. His areas of research include low-wage labor market analysis, labor market policy interventions, and welfare reform policy. NIK THEODORE is an assistant professor in the Urban Planning and Policy Program and director of the Center for Urban Economic Development at the University of Illinois at Chicago. Funding for this research was provided by the Ford Foundation. This paper was prepared for presentation at America’s Workforce Network Research Conference, sponsored by the U.S. Department of Labor, Washington, DC, June 25–26, 2001. Paying the Price for Flexibility Unemployment Insurance and the Temporary Staffing Industry Chirag Mehta and Nik Theodore Increasingly, employers reduce costs through outsourcing work to temporary staffing agencies, displacing the price of unemployment to temporary staffing agencies and their workers. Outsourcing work, Mehta and Theodore observe, reduces the cost for on-site employers while greatly increasing labor market turbulence even in times of economic growth, as temporary staffing agencies lay off workers to reduce their own unemployment insurance costs. T HE PHENOMENAL GROWTH OF THE TEMPORARY STAFFING INDUSTRY (TSI) was one of the defining features of the 1990s economic expan- sion, coming as it did on the heels of the 1980s when the num- ber of temporary staffing agencies operating in U.S. labor markets
-
Upload
chirag-mehta -
Category
Documents
-
view
215 -
download
2
Transcript of Paying the Price for Flexibility : Unemployment Insurance and the Temporary Staffing Industry

84 WorkingWorkingWorkingWorkingWorkingUSAUSAUSAUSAUSA—Winter 2002–3
Mehta and Theodore
WorkingUSA, vol. 6, no. 3, Winter 2002–3, pp. 84–110.© 2003 M.E. Sharpe, Inc. All rights reserved.
ISSN 1089–7011 / 2003 $9.50 + 0.00.
CHIRAG MEHTA is a research associate with the University of Illinois at Chicago Center for UrbanEconomic Development. His areas of research include low-wage labor market analysis, labor marketpolicy interventions, and welfare reform policy. NIK THEODORE is an assistant professor in theUrban Planning and Policy Program and director of the Center for Urban Economic Development atthe University of Illinois at Chicago. Funding for this research was provided by the Ford Foundation.This paper was prepared for presentation at America’s Workforce Network Research Conference,sponsored by the U.S. Department of Labor, Washington, DC, June 25–26, 2001.
Paying the Price forFlexibilityUnemployment Insurance and the TemporaryStaff ing Industry
Chirag Mehta and Nik Theodore
Increasingly, employers reduce costs through outsourcingwork to temporary staffing agencies, displacing the priceof unemployment to temporary staffing agencies andtheir workers. Outsourcing work, Mehta and Theodoreobserve, reduces the cost for on-site employers whilegreatly increasing labor market turbulence even in timesof economic growth, as temporary staffing agencies layoff workers to reduce their own unemployment insurancecosts.
THE PHENOMENAL GROWTH OF THE TEMPORARY STAFFING INDUSTRY (TSI)was one of the defining features of the 1990s economic expan-sion, coming as it did on the heels of the 1980s when the num-
ber of temporary staffing agencies operating in U.S. labor markets

Paying the Price for Flexibility
WorkingWorkingWorkingWorkingWorkingUSAUSAUSAUSAUSA—Winter 2002–3 85
more than doubled. Between 1993 and 2000, average daily employ-ment in the TSI increased by 92 percent from 1.32 million to 2.54million jobs nationwide (Brogan 2001), a growth trajectory that wasdriven by increases in blue-collar employment as well as by modestincreases in clerical and professional placements (Belman and Golden2000; Estavão and Lach 2000).
It appears that over the past three decades, the TSI has establisheda unique position in the U.S. economy, operating as a buffer duringcyclical swings and contributing to the dynamism of the economythrough the enhancement of labor market flexibility (see Katz andKrueger 1999). During this period, temporary employment has ex-panded rapidly prior to macroeconomic upswings, while sharp de-clines in temporary employment have led the economy into recessions,a pattern that was most pronounced during the mid-1980s recovery,1990s recovery, and 2001–2 recession (Theodore and Peck 2002; seealso Segal 1996; Segal and Sullivan 1997). The counterpoint to theTSI’s rapid growth during the 1990s expansion is evident during theeconomic slowdown/recession that began in the fourth quarter of2000 and continued through the first quarter of 2002, when the TSIshed more than 661,000 jobs (BLS 2002). In the early months of theofficial recession, job losses in the TSI accounted for approximatelyhalf of all job losses nationwide. Hence, this relatively small sectorhas borne the brunt of job losses as unemployment that occurs in awide array of manufacturing, construction, trade, and services indus-tries is displaced onto the TSI and its workers.
The speed and intensity with which the TSI experienced job lossesin the 2001–2 recession suggests that firms’ use of temporary-agencyworkers has retained a pronounced cyclical sensitivity and that thesefirms use their temporary workforces as a rather blunt instrument forbalancing labor demand and supply. Firms have turned to temporarystaffing agencies to assist them in implementing strategies of laborflexibility, calling on agencies to remove constraints that otherwiseprevent employers from independently carrying out flexible staffingstrategies on a large scale.
The first constraint is on the efficient recruitment and immediate

86 WorkingWorkingWorkingWorkingWorkingUSAUSAUSAUSAUSA—Winter 2002–3
Mehta and Theodore
deployment of workers on an as-needed basis. Whereas some firmsmaintain lists of on-call workers and direct-hire temporaries who canbe recalled on short notice, the costs associated with recruiting di-rect-hire temps increases dramatically, and additional costs may beincurred if job tasks are left unfinished while companies await neededworkers. Staffing agencies help remove this constraint by performingthe recruitment function and providing a ready source of labor fortheir clients.
The second constraint concerns the legal responsibilities and costsassociated with employing workers. Since most agencies are the legalemployers of the workers they supply to business clients, temporarystaffing agencies relieve their clients of these responsibilities and costs.Consequently, agencies assume responsibility for paying payroll taxesand ensuring compliance with many of the legal safeguards that are inplace to protect employees. Of particular importance is the role the TSIplays in relieving its business clients of the responsibility for contrib-uting unemployment insurance (UI) taxes for their temporaryworkforces. Temporary staffing agencies contribute UI taxes for allworkers they supply to their business clients, and, consequently, stateshold agencies responsible when those workers claim UI benefits.
Generally, states will penalize employers that lay off workers whogo on to claim UI benefits by increasing their UI tax rates. The systemof calibrating employers’ tax rates to their layoff experience is com-monly referred to as “experience-rating.” In part, the states’ intent inexperience-rating UI tax rates is to deter employers from temporarilylaying off their workforces.
The effectiveness of the deterrence, however, may be compromisedwhen staffing agencies become the legal employer of their clients’temporary workforces. When a work-site employer cancels an orderfor temporary workers and these workers become unemployed andclaim UI benefits, the costs associated with unemployment compen-sation are directly borne by the staffing agency, not by the work-siteemployer. Thus, the UI tax in such cases does not operate as a disin-centive to work-site employers intending to lay off their temporary-agency workers.
Paying the Price for Flexibility
WorkingWorkingWorkingWorkingWorkingUSAUSAUSAUSAUSA—Winter 2002–3 87
This paper explores the implications of work-site employers’ in-creasing use of temporary-agency workers for the continued effec-tiveness of UI systems in deterring temporary layoffs. The next sectionreviews the efficacy of experience-rated UI tax systems for discourag-ing temporary layoffs. This is followed by an examination of the roleof the TSI in employers’ flexibility strategies and an analysis of theextent to which the TSI has relieved work-site employers of responsi-bility for compensating unemployed workers. Using data from eightstates with a large number of temporary workers, this section exam-ines the extent to which the TSI has witnessed rising UI claims dur-ing the 1993–2000 recovery. The final section presents a discussion ofpolicy alternatives to improve the effectiveness of UI in discouragingchronic, temporary layoffs.
Experience-Rated UI Taxes: A Deterrent toTemporary Layoffs
Unemployment insurance systems are designed to achieve multiplegoals, including to discourage employers from chronically laying offworkers. This section reviews research on the principal mechanismthrough which states impose costs on employers for temporary lay-offs—experience-rating provisions that link UI tax rates to employers’recent layoff experience.
The experience-rating component of UI systems operates to reducethe incidence of layoffs in two related ways. First, experience-ratingformulas impose costs for layoffs on employers, thereby creating afinancial incentive for firms to reduce the size and frequency of lay-offs. Second, these mechanisms ensure that tax contributions madeby low-turnover firms do not subsidize high-turnover firms by set-ting each employer’s tax rate at such a level that their contributionscover the claims charged against their account. It is through theseexperience-rating provisions of state UI systems that the social costsof involuntary unemployment are (to a certain extent) internalizedby employers.
Experience-rated UI tax systems are designed to discourage layoffs

88 WorkingWorkingWorkingWorkingWorkingUSAUSAUSAUSAUSA—Winter 2002–3
Mehta and Theodore
by calibrating an employer’s UI tax contributions to the rise and fallin the magnitude of UI benefit claims made by its laid-off employeesrelative to the size of the employer’s remaining payroll. Generally, asthe number of UI benefit claims increases, all else being equal, so toodo the UI tax contributions paid by the former employers of UI claim-ants. These tax contributions are deposited into a state-managed trustfund that is used to pay for UI benefit claims.
All states experience-rate employers’ UI tax rates in some manner.While the mechanisms for experience-rating UI tax rates differ, allstates use variations on two methods. Thirty-three states use the re-serve-ratio method that indexes UI tax rates to the ratio of anemployer’s UI account balances (UI tax contributions minus UI ben-efits charged) to the size of the employer’s payroll. The remainingseventeen states use the benefit-ratio method that indexes UI tax ratesto the ratio of the dollar value of UI benefits charged to an employerrelative to the size of the employer’s payroll over a specified period oftime (U.S. DOL ETA 2000). Additionally, some states weight anemployer’s UI tax rates to account for the overall layoff experience inthe industry in which the employer operates, or for the unemploy-ment rate in the local labor market.
States determine an employer’s actual UI tax contributions byapplying a firm’s UI tax rate to a portion of its current payroll (thetaxable wage base). Typically, employers pay UI taxes on the first$12,000 (the average taxable wage base for all states) of eachemployee’s earnings (U.S. DOL ETA 2000). In addition, the taxablewage base is capped. Thus, adding additional earnings by existingemployees in excess of the limit on taxable wages will not impact anemployer’s UI tax contributions. Adding employees to the payroll, onthe other hand, will in most cases increase an employer’s total UI taxcontributions.
To experience-rate UI taxes, states must determine which of aclaimant’s previous employers is responsible for causing theclaimant’s unemployment. When a worker claims UI benefits, somestates will charge the total value of those benefits only to theclaimant’s most recent employer. However, if a claimant worked for
Paying the Price for Flexibility
WorkingWorkingWorkingWorkingWorkingUSAUSAUSAUSAUSA—Winter 2002–3 89
multiple employers during the base period (typically defined as themost recent four of the last five completed quarters), most stateswill divide the total charge between all of the worker’s employers,assuming that all are responsible for the worker’s unemployment.The amount of benefits charged to each employer is proportionalto the share of total earnings the claimant received from each em-ployer during the base period.1
Research on the efficacy of UI tax systems demonstrates that experi-ence-rating reduces the incidence of temporary layoffs. In their analysisof UI taxes and seasonal unemployment, David Card and Phillip Levine(1994) found a strong negative relationship between experience-ratingin UI systems and the rate of temporary layoffs generated by employers.Their analysis indicated that this negative relationship is strongest inhigh-layoff industries as well as during recessionary periods. Likewise,James Albrecht and Susan Vroman’s (1999) analysis of UI tax systemsfound a negative correlation between experience-rated UI taxes andtemporary layoffs. The authors explain that experience-rating acts as apenalty to firms that generate unemployment, inducing employers toadopt higher-wage, lower-turnover strategies. Presumably, employerstake into account the increased costs associated with layoffs. Employerswould rather achieve efficiencies by paying workers higher wages to in-crease productivity than by laying off workers and absorbing higher UIcosts.
Other studies have indicated that greater reliance on experience-rating mechanisms in UI systems further minimizes the incidence oftemporary layoffs. More heavily experience-rated systems include thosethat apply a wider range of tax rates, allowing greater distinctions tobe made between high- and low-turnover employers. Similarly, UIsystems that apply tax rates to a greater share of an employer’s tax-able wage base are also considered to be more extensively experience-rated because the financial consequences of higher UI taxes are moresevere. Using an econometric model to test the impacts of variousexperience-rated UI systems, Ronald Moomaw (1998) found that stateswith the highest taxable wage base encounter 40 percent lower unem-ployment rates when other leading variables are held equal. Likewise,
90 WorkingWorkingWorkingWorkingWorkingUSAUSAUSAUSAUSA—Winter 2002–3
Mehta and Theodore
Card and Levine (1994) found that as the extent to which UI taxes areexperience-rated increases, seasonal fluctuations in layoffs commonto manufacturing and construction are also moderated. Furthermore,studies by Martin Feldstein (1978) and Robert Topel (1983) suggestthat a fully experience-rated UI system would eliminate 50 percent ofall temporary layoffs, again suggesting that experienced-rated UI taxsystems discourage employers from cycling their workforces throughtemporary layoffs (see also Card and Levine 1994).
Temping and the Externalization of UI Costs
Under traditional employment arrangements, the experience-ratingmechanisms of state UI systems operate to discourage chronic, tem-porary layoffs and to encourage “high road” business practices. Incases where layoffs are necessary, employers bear some of the associ-ated costs, and workers receive a reduced share of their previous earn-ings while searching for work. However, the introduction of temporarystaffing agencies into the employment arrangement, functioning asthey do as the de jure employers of temp workers, “decouples” thecause-and-effect relationship between the generation of unemploy-ment and the costs of UI incurred by work-site employers. The use oftemporary staffing agencies allows work-site employers to external-ize some of the costs of unemployment, particularly in cyclicallyvolatile, high-turnover industries and in those occupations where highturnover is the norm. The outsourcing of high-turnover occupationsto temporary staffing agencies weakens the influence of experience-rating policy mechanisms, which have been shown to have positivelabor-market effects through their influence on employers’ staffingstrategies. Work-site employers (the de facto employers that controlproduction timetables and work flows as well as worker deployment)may terminate job assignments filled by temporary-agency workers—in many cases resulting in UI claims—without any repercussions ontheir UI tax rates. Instead, the benefits claimed by laid-off temporary-agency workers are charged to the accounts of staffing agencies.
The growing use of temporary-agency workers has consequently

Paying the Price for Flexibility
WorkingWorkingWorkingWorkingWorkingUSAUSAUSAUSAUSA—Winter 2002–3 91
shifted a greater share of the costs for compensating unemployed work-ers “downstream” in the employment relationship—away from work-site employers and toward the TSI and its workforce. The magnitude ofthis shift during the period 1993–2000 has been striking. Table 1 pre-sents data on the percentage change in the number of UI weeks claimedfrom workers’ “primary” and “last” employers, aggregated from eightstates: Arizona, California, Florida, Illinois, Massachusetts, New York,Texas, and Washington. These states were selected because they have alarge TSI, collectively comprising 50 percent of temporary-agency (em-ployment services) employment nationwide, thereby permitting ananalysis of the changing impact of UI on the temporary staffing indus-try and on the industries of some of its business clients.
The data presented in Table 1 show that temporary staffing agen-cies became the primary or last employer of a growing proportion ofUI claimants during the period 1993–2000.2 According to these esti-
Table 1
Change in UI Weeks Claimed by Industry Group, Selected States,1993–2000 (percent)
% change in weeks claimed
Primary LastIndustry employer employer
Employment services +60 +29Construction –35 –36Manufacturing –42 –42Wholesale trade –29 –30Retail trade –47 –47Transportation and warehousing –16 –19Professional, scientific, and technical services –32 –32Health care and social assistance –12 –17Accommodation and food services –44 –42Other services (except public administration) –19 –28Administrative support (excludingemployment services) –25 –23
Source: U.S. DOL ETA. 2001. Unpublished data.Note: Estimates are based on Benefit Accuracy Measurement (BAM) sample collected by the U.S.Department of Labor from state UI agencies. The states are: Arizona, California, Florida, Illinois,Massachusetts, New York, Texas, and Washington.
92 WorkingWorkingWorkingWorkingWorkingUSAUSAUSAUSAUSA—Winter 2002–3
Mehta and Theodore
mates, UI weeks claimed by workers employed primarily by employ-ment service agencies3 increased by nearly 60 percent, while in everymajor industry group, UI weeks claimed declined by 16 percent to 47percent.4 The change in weeks claimed in industries representing thelast employer of UI claimants followed a similar pattern. Consideringthat, in most states, primary employers often bear the greatest re-sponsibility for UI benefit claims, it is important to note that by 2000,employment service agencies were the primary employers of UI claim-ants nearly as often as they were the last employers, a shift that re-f lects the growing role that staffing agencies play in shapingemployment opportunities. In 1993, employment agencies were iden-tified as the last employers in 1.87 million UI weeks claimed and theprimary employers in 1.38 million UI weeks claimed. By 2000, thegap had shrunk to 0.2 million UI weeks claimed.
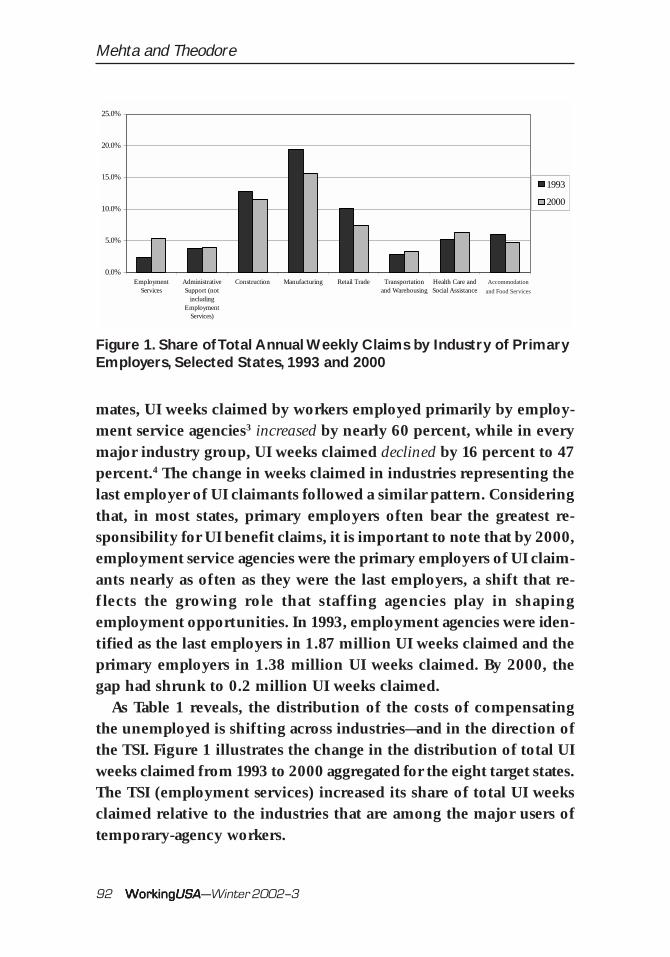
As Table 1 reveals, the distribution of the costs of compensatingthe unemployed is shifting across industries—and in the direction ofthe TSI. Figure 1 illustrates the change in the distribution of total UIweeks claimed from 1993 to 2000 aggregated for the eight target states.The TSI (employment services) increased its share of total UI weeksclaimed relative to the industries that are among the major users oftemporary-agency workers.
Figure 1. Share of Total Annual Weekly Claims by Industry of PrimaryEmployers, Selected States, 1993 and 2000
0.0%
5.0%
10.0%
15.0%
20.0%
25.0%
EmploymentServices
AdministrativeSupport (not
includingEmployment
Services)
Construction Manufacturing Retail Trade Transportationand Warehousing
Health Care andSocial Assistance
Accomodationand Food Services
1993
2000
Accommodation
and Food Services
Paying the Price for Flexibility
WorkingWorkingWorkingWorkingWorkingUSAUSAUSAUSAUSA—Winter 2002–3 93
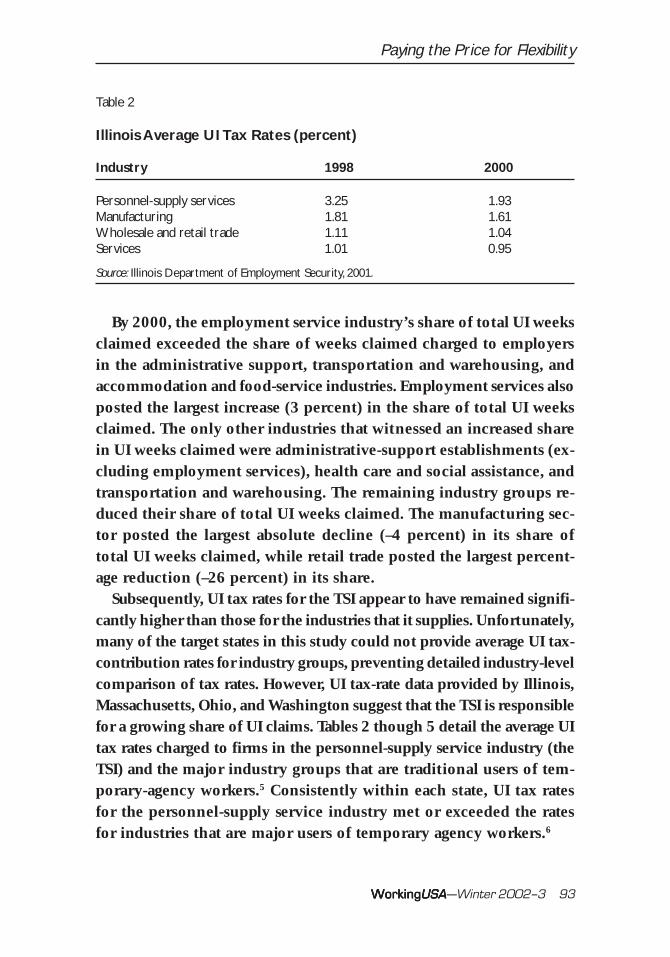
By 2000, the employment service industry’s share of total UI weeksclaimed exceeded the share of weeks claimed charged to employersin the administrative support, transportation and warehousing, andaccommodation and food-service industries. Employment services alsoposted the largest increase (3 percent) in the share of total UI weeksclaimed. The only other industries that witnessed an increased sharein UI weeks claimed were administrative-support establishments (ex-cluding employment services), health care and social assistance, andtransportation and warehousing. The remaining industry groups re-duced their share of total UI weeks claimed. The manufacturing sec-tor posted the largest absolute decline (–4 percent) in its share oftotal UI weeks claimed, while retail trade posted the largest percent-age reduction (–26 percent) in its share.
Subsequently, UI tax rates for the TSI appear to have remained signifi-cantly higher than those for the industries that it supplies. Unfortunately,many of the target states in this study could not provide average UI tax-contribution rates for industry groups, preventing detailed industry-levelcomparison of tax rates. However, UI tax-rate data provided by Illinois,Massachusetts, Ohio, and Washington suggest that the TSI is responsiblefor a growing share of UI claims. Tables 2 though 5 detail the average UItax rates charged to firms in the personnel-supply service industry (theTSI) and the major industry groups that are traditional users of tem-porary-agency workers.5 Consistently within each state, UI tax ratesfor the personnel-supply service industry met or exceeded the ratesfor industries that are major users of temporary agency workers.6
Table 2
Illinois Average UI Tax Rates (percent)
Industry 1998 2000
Personnel-supply services 3.25 1.93Manufacturing 1.81 1.61Wholesale and retail trade 1.11 1.04Services 1.01 0.95
Source: Illinois Department of Employment Security, 2001.
94 WorkingWorkingWorkingWorkingWorkingUSAUSAUSAUSAUSA—Winter 2002–3
Mehta and Theodore
UI Cost Savings for Work-Site Employers
The total UI tax contributions made by the TSI represents, to a largedegree, the UI-related cost savings to employers using temporary-agency workers rather than employing their temporary workforcesdirectly. Of our target states, only Washington was able to providedata detailing employers’ UI tax contributions aggregated by detailed
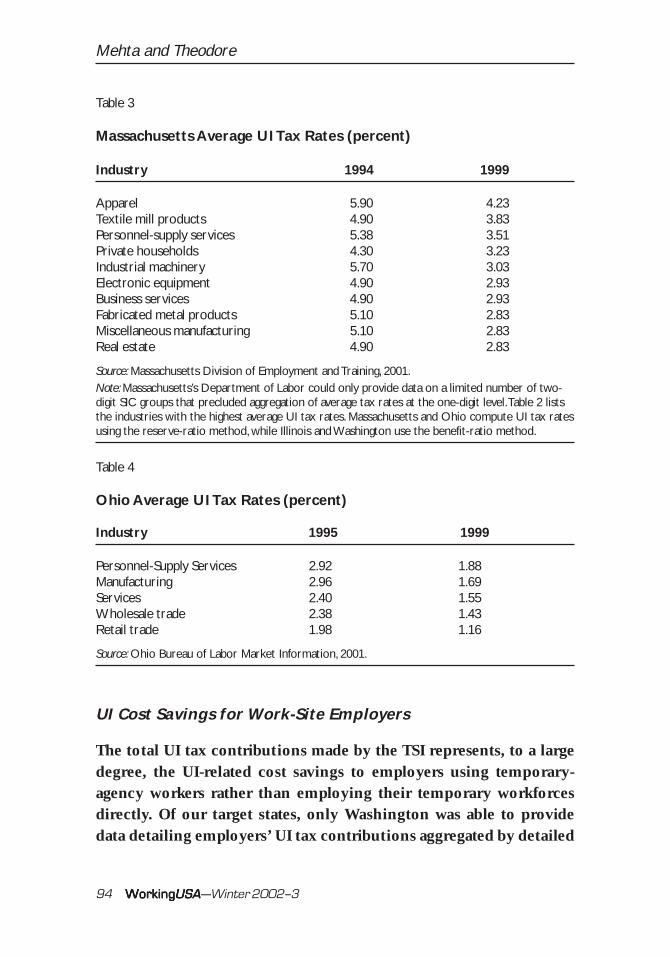
Table 4
Ohio Average UI Tax Rates (percent)
Industry 1995 1999
Personnel-Supply Services 2.92 1.88Manufacturing 2.96 1.69Services 2.40 1.55Wholesale trade 2.38 1.43Retail trade 1.98 1.16
Source: Ohio Bureau of Labor Market Information, 2001.
Table 3
Massachusetts Average UI Tax Rates (percent)
Industry 1994 1999
Apparel 5.90 4.23Textile mill products 4.90 3.83Personnel-supply services 5.38 3.51Private households 4.30 3.23Industrial machinery 5.70 3.03Electronic equipment 4.90 2.93Business services 4.90 2.93Fabricated metal products 5.10 2.83Miscellaneous manufacturing 5.10 2.83Real estate 4.90 2.83
Source: Massachusetts Division of Employment and Training, 2001.Note: Massachusetts’s Department of Labor could only provide data on a limited number of two-digit SIC groups that precluded aggregation of average tax rates at the one-digit level. Table 2 liststhe industries with the highest average UI tax rates. Massachusetts and Ohio compute UI tax ratesusing the reserve-ratio method, while Illinois and Washington use the benefit-ratio method.
Paying the Price for Flexibility
WorkingWorkingWorkingWorkingWorkingUSAUSAUSAUSAUSA—Winter 2002–3 95
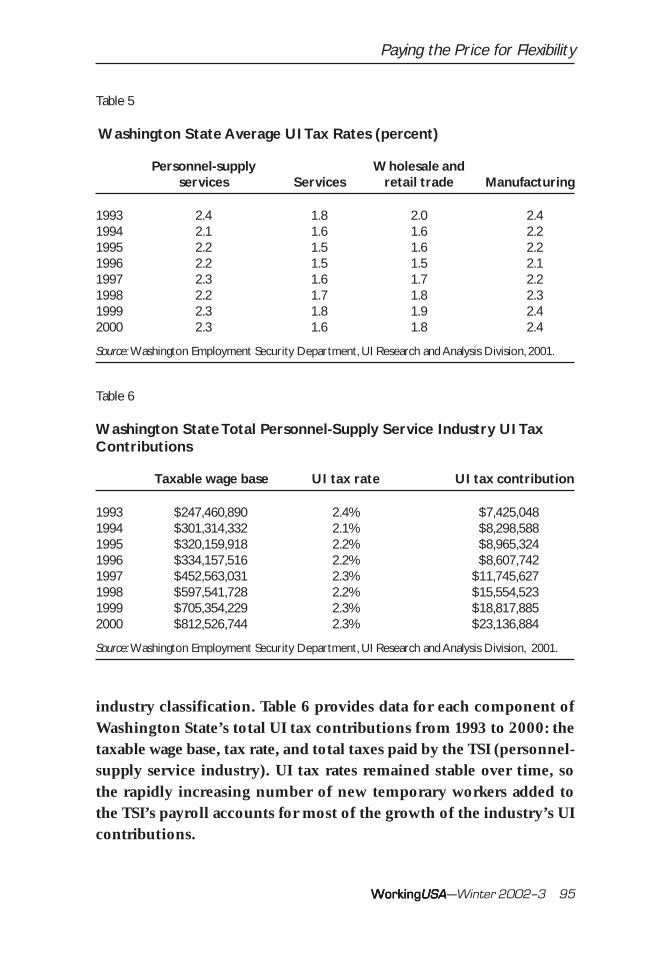
industry classification. Table 6 provides data for each component ofWashington State’s total UI tax contributions from 1993 to 2000: thetaxable wage base, tax rate, and total taxes paid by the TSI (personnel-supply service industry). UI tax rates remained stable over time, sothe rapidly increasing number of new temporary workers added tothe TSI’s payroll accounts for most of the growth of the industry’s UIcontributions.
Table 6
Washington State Total Personnel-Supply Service Industry UI TaxContributions
Taxable wage base UI tax rate UI tax contribution
1993 $247,460,890 2.4% $7,425,0481994 $301,314,332 2.1% $8,298,5881995 $320,159,918 2.2% $8,965,3241996 $334,157,516 2.2% $8,607,7421997 $452,563,031 2.3% $11,745,6271998 $597,541,728 2.2% $15,554,5231999 $705,354,229 2.3% $18,817,8852000 $812,526,744 2.3% $23,136,884
Source: Washington Employment Security Department, UI Research and Analysis Division, 2001.
Table 5
Washington State Average UI Tax Rates (percent)
Personnel-supply Wholesale andservices Services retail trade Manufacturing
1993 2.4 1.8 2.0 2.41994 2.1 1.6 1.6 2.21995 2.2 1.5 1.6 2.21996 2.2 1.5 1.5 2.11997 2.3 1.6 1.7 2.21998 2.2 1.7 1.8 2.31999 2.3 1.8 1.9 2.42000 2.3 1.6 1.8 2.4
Source: Washington Employment Security Department, UI Research and Analysis Division, 2001.
96 WorkingWorkingWorkingWorkingWorkingUSAUSAUSAUSAUSA—Winter 2002–3
Mehta and Theodore
If work-site employers in Washington contributed UI taxes on thetaxable wage base of workers they procured through staffing agen-cies, they would have incurred approximately an additional $23 mil-lion in UI taxes in 2000—the amount contributed by the personnel-supplyservice industry to insure its temporary workforce. Aside from havingsaved this direct cost of insuring temporary workers, work-site em-ployers gained additional cost savings by shedding the segments oftheir workforces most likely to endure layoffs, claim UI benefits, anddrive up UI tax rates on the remainder of employers’ taxable wage bases.In this way, temporary staffing agencies help work-site employersshield the taxable wage base of their core workforces from higher UItax rates.
Low UI Recipiency Among Temp Workers Understates theExternalization of UI Costs
The TSI would have faced higher UI tax rates than already is the caseif temporary-agency workers received unemployment compensationat rates closer to the average for all workers. Wayne Vroman (1998)found that temporary-agency workers experience the lowest UIrecipiency rates relative to other contingent workers (independentcontractors, part-time workers, and on-call workers) and all adultworkers regardless of type of employment contract. In 1994, the aver-age UI recipiency rate (defined as the number of workers receivingunemployment compensation relative to the total number of unem-ployed workers) for all workers twenty-five years old and older was39 percent. For temporary-agency workers, this figure was only 28percent. Furthermore, temporary-agency workers receive UI compen-sation at lower rates relative to rates for workers in industries thatrepresent the largest users of temporary agency services. Vroman foundthat UI recipiency was 46 percent for all manufacturing workers (six-teen years old and older) and 34 percent for all clerical and salesworkers, both far greater than the 28 percent recipiency rate for tempworkers.
Several factors explain why temporary-agency workers experience
Paying the Price for Flexibility
WorkingWorkingWorkingWorkingWorkingUSAUSAUSAUSAUSA—Winter 2002–3 97
lower UI recipiency rates relative to workers in standard employmentrelationships. First, many (48 percent) temporary-agency workers workfull-time but for only part of the year, making it difficult for them tomeet earnings thresholds that in part determine benefit eligibility(authors’ calculations from the March supplement to the Current Popu-lation Survey, 1993–2000). Of these workers, only 15 percent receivedUI benefits during their current spell of unemployment. Second, tem-porary-agency workers often are low-wage workers, compounding thedifficulty in meeting earnings thresholds. According to a study bythe General Accounting Office (2000) examining the role UI plays asa safety net for workers, low-wage workers were twice as likely to beout of work as higher-wage workers, but only half as likely to receiveUI benefits.
Temp-Agency Worker Utilization Strategies ExplainExternalization of UI Costs
The magnitude of the shift in responsibility for compensating un-employed workers from work-site employers to the TSI is predictableconsidering that many (perhaps most) work-site employers employ-ing temps “churn” these workers through job slots characterized by ahigh degree of turnover and involuntary layoffs. According to anUpjohn Institute employer survey examining flexible staffing arrange-ments, employers most commonly reported that they use temporary-agency workers to: (1) provide needed assistance at times ofunexpected increases in business; (2) fill in temporarily for absentemployees; and (3) fill vacancies until regular employees are hired(Houseman 1997). Only 5 percent of employers reported that theyfilled positions with temporary-agency workers for more than oneyear. These findings are supported by an American Management As-sociation survey that found that 91 percent of employers cited flex-ibility in staffing as a “very important” or “somewhat important”reason for their use of contingent workers (Staffing Industry Analysts2000). Another management survey found that the staffing for thecompletion of special projects and staffing for peak periods accounted

98 WorkingWorkingWorkingWorkingWorkingUSAUSAUSAUSAUSA—Winter 2002–3
Mehta and Theodore
for more than half of all temporary-agency worker usage (Flynn 1995).Statistics on the job tenure of temporary-agency workers support
results from employer surveys suggesting that individual temporaryworkers typically are employed at a given work site on only a short-term basis. Approximately 45 percent of temporary workers spend,on average, less than six months on any single job assignment, while72 percent worked for less than one year on a single assignment(Cohany 1996). In comparison, almost half of all workers hired per-manently and directly by employers spend four years or more on thejob. Workers in flexible arrangements (including temporary-agencyworkers) comprise approximately one-quarter of all workers, yet ac-count for approximately 40 percent of workers with job tenures ofless than one year (Cohany 1996).
Occupational characteristics of temporary-agency workers compiledby the Bureau of Labor Statistics through the Occupational Employ-ment Survey confirm that the top occupations held by temporary-agency workers tend to be low-wage jobs. Table 7 identifies the topten occupations held by temporary-agency workers in 1999 (com-prising 42 percent of all temporary-agency assignments). With theexception of technical occupations and health-care practitioners, tem-porary-agency workers are predominantly found in manufacturing,retail trade, sales, and service occupations.
The intermittent nature of most temporary job assignments meansthat temporary-agency workers spend extended periods involuntarilyunemployed and potentially eligible to collect UI benefits. WayneVroman’s (1998) examination of UI recipiency rates for workers innonstandard employment arrangements found that temporary-agencyworkers were unemployed at a rate of 40 percent, compared to 10percent for all adult workers (see also Houseman and Polivka 1999).
Costs Do Not Move “Upstream”: Temp Agencies AbsorbIncreased UI Costs
In most markets, severe price competition between temporary staff-ing agencies significantly limits the ability of agencies to pass in-

Paying the Price for Flexibility
WorkingWorkingWorkingWorkingWorkingUSAUSAUSAUSAUSA—Winter 2002–3 99
creasing UI costs back onto their high-turnover clients in the form ofhigher billing rates—further insulating work-site employers from UI-related costs resulting from their flexible staffing arrangements. Insome specialized niches of temporary labor markets, such as marketsfor executives, scientists, and nurses where demand for these workersconsistently outpaces the supply of labor, temporary agencies maysuccessfully charge higher billing rates and thus can more completelyrecover rising UI costs. But for the majority of temporary-staffingagencies that primarily supply clerical and blue-collar workers, height-ened competition in local labor markets has forced agencies to ab-sorb higher UI costs (Theodore and Peck 2002).
Given the pricing strategies of the market leaders, this heightenedprice competition and downward pressures on margins is likely tocontinue. As John Bowmer, former CEO of Adecco, the largest staff-
Table 7
Occupational Distribution in the Personnel Supply Service Industry,1999
Total staffing Share of totalindustry staffing industry Median
Occupation employment employment wage
Laborers and freight, stock, andmaterial movers 292,100 7.7% $7.32
Office clerks, general 271,730 7.2% $8.99Packers and packagers, hand 182,070 4.8% $6.87Helpers—production workers 170,380 4.5% $7.19Data entry keyers 140,740 3.7% $9.09Health-care practitioners andtechnical occupations 129,010 3.4% $20.15
Secretaries, except legal,medical, and executive 120,790 3.2% $10.69
Sales and related occupations 118,780 3.1% $10.86Customer servicerepresentatives 109,660 2.9% $9.82
Receptionists and informationclerks 91,990 2.4% $9.00
Total 1,627,250 42.9%
Source: Bureau of Labor Statistics, Occupational Employment Survey, 2000.

100 WorkingWorkingWorkingWorkingWorkingUSAUSAUSAUSAUSA—Winter 2002–3
Mehta and Theodore
ing company in the world, explained, “Certainly, one of the globaltrends that is out there and not likely to disappear soon is the trendto lower margins. In some part, this is the inevitable price to be paidfor having higher visibility and bigger volumes with clients” (quotedin Staffing Industry Analysts 1999a). According to some industry ana-lysts, larger staffing agencies are culpable for imposing high degreesof price competition on the rest of the industry, a strategy that ana-lysts say is intended to force out of business smaller competitors thatare less able to absorb rising costs. Adecco is only one of several large,publicly held staffing agencies that have been accused by its com-petitors of creating downward pressures on billing rates. Manpoweralso has been widely criticized for cutting billing rates to “[go] forshare over profit” in order to seize control of the French temporarylabor market (Staffing Industry Analysts 1999b). Falling gross mar-gins for some of the largest corporate players in the staffing industry,such as Adecco, Kelly Services, and Manpower, reflect this purportedstrategy. In 2000, Adecco reported gross margins of 18.7 percent, KellyServices reported 17.6 percent, and Manpower reported 18 percent(Staffing Industry Analysts 2001). Since 1992, gross margins for KellyServices and Manpower have declined from 21.7 percent and 21.8percent, respectively, to their current levels.
Unfortunately, a comprehensive assessment of price competitionin the TSI cannot be completed due to the lack of publicly availablelongitudinal data on staffing agency billing rates. However, relyingon indices of competition, interviews with staffing agencies, and pub-lished accounts, it is possible to characterize the nature of this com-petition and its impact on agencies’ cost-recovery strategies. NikTheodore and Jamie Peck (2002) provide an analysis of TSI marketcompetition in twenty major metropolitan areas in the United States.Using the Hershenfeld-Hirshman Index (a measure of market con-centration/market competition), they find that the TSI is a “competi-tive” industry in two-thirds of the metropolitan areas and that between1994 and 1999 it became more concentrated (less competitive) inonly three of these metropolitan areas. Based on such statistical mea-sures as well as interviews with temporary staffing agencies, the au-

Paying the Price for Flexibility
WorkingWorkingWorkingWorkingWorkingUSAUSAUSAUSAUSA—Winter 2002–3 101
thors find that the dramatic growth in the number of agencies operat-ing in U.S. markets, along with falling gross margins across the larg-est industry segments, strongly suggests that these markets arecharacterized by intense price-based competition. Most staffing agen-cies have responded to this situation by pursuing high-volume strat-egies, cutting costs, and experimenting with horizontal diversification(Theodore and Peck 2002).
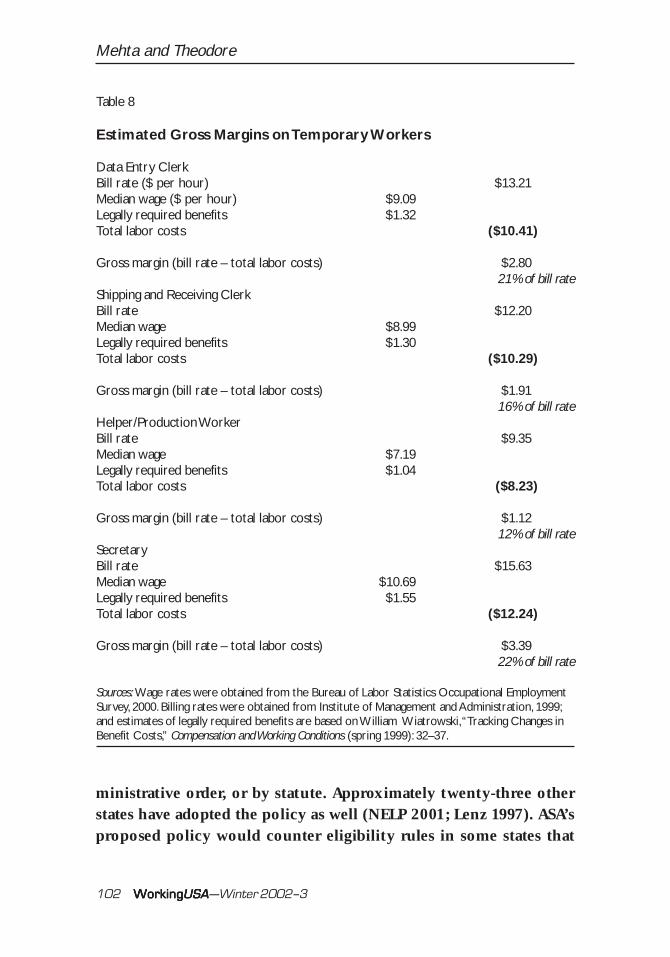
Price competition in the light industrial and clerical segments ofthe staffing industry—segments that account for 67 percent of theTSI’s placements—has driven billing rates and gross margins to sur-prisingly low levels (Brogan 2001). Table 8 presents estimates of bill-ing rates and average gross margins (bill rate per hour for temporaryworkers less total labor costs) for four categories of temporary work-ers: data entry clerks, shipping and receiving clerks, helper/produc-tion workers, and secretaries. Gross margins do not account foroperating expenses outside of the direct costs of compensating tem-porary workers, so actual margins will be even narrower than the 10–22 percent gross margins estimated in Table 8.
Because of the high degree of price competition in the TSI, staff-ing agencies have few avenues through which to recover increased UIexpenses from their clients. Agencies’ cost-recovery strategies musttherefore rely on reducing the costs of doing business by containingadministrative costs, holding down wages paid to temporary work-ers, and limiting future UI claims in order to maintain control overtheir UI tax rates. This imperative to hold down labor costs partlyexplains efforts on the part of TSI representatives to pass regulationsat the state level to make it more difficult for temporary-agency workersto collect UI benefits. The American Staffing Association (ASA), themain industry association, has promoted a model unemployment in-surance policy with considerable success (NATSS 1999). This modelpolicy requires temporary workers to return to their temporary staff-ing agency upon completion of job assignments and require workersto accept “suitable” employment or else be ineligible for UI. Of theeight states examined here, Florida, Illinois, and Texas have adopted aversion of ASA’s model UI policy either through regulation or ad-
102 WorkingWorkingWorkingWorkingWorkingUSAUSAUSAUSAUSA—Winter 2002–3
Mehta and Theodore
Table 8
Estimated Gross Margins on Temporary Workers
Data Entry ClerkBill rate ($ per hour) $13.21Median wage ($ per hour) $9.09Legally required benefits $1.32Total labor costs ($10.41)
Gross margin (bill rate – total labor costs) $2.8021% of bill rate
Shipping and Receiving ClerkBill rate $12.20Median wage $8.99Legally required benefits $1.30Total labor costs ($10.29)
Gross margin (bill rate – total labor costs) $1.9116% of bill rate
Helper/Production WorkerBill rate $9.35Median wage $7.19Legally required benefits $1.04Total labor costs ($8.23)
Gross margin (bill rate – total labor costs) $1.1212% of bill rate
SecretaryBill rate $15.63Median wage $10.69Legally required benefits $1.55Total labor costs ($12.24)
Gross margin (bill rate – total labor costs) $3.3922% of bill rate
Sources: Wage rates were obtained from the Bureau of Labor Statistics Occupational EmploymentSurvey, 2000. Billing rates were obtained from Institute of Management and Administration, 1999;and estimates of legally required benefits are based on William Wiatrowski, “Tracking Changes inBenefit Costs,” Compensation and Working Conditions (spring 1999): 32–37.
ministrative order, or by statute. Approximately twenty-three otherstates have adopted the policy as well (NELP 2001; Lenz 1997). ASA’sproposed policy would counter eligibility rules in some states that
Paying the Price for Flexibility
WorkingWorkingWorkingWorkingWorkingUSAUSAUSAUSAUSA—Winter 2002–3 103
under some circumstances allow temporary-agency workers to quitan assignment or allow them to refuse additional temporary assign-ments in order to seek permanent work without the risk of disquali-fication from UI eligibility. No state definitively allows workers witha history of temporary work to refuse an assignment in order toseek permanent work. However, of the states studied here, Massa-chusetts and New York do not necessarily disqualify workers for re-fusing new assignments upon completion of their temporaryassignments in order to seek permanent work (Chasanov 1995).
Policy Discussion
As U.S. firms continue to pursue labor-flexibility and cost-minimiza-tion strategies through the outsourcing of high-turnover positionsto the TSI, the resultant externalization of the costs of unemploy-ment poses significant challenges to UI policy. By using temp agen-cies to supply workers, work-site employers are able to shieldthemselves from UI claims made by these workers when they be-come unemployed. In the process, the effectiveness of experience-rated UI systems to discourage chronic, temporary layoffs is greatlydiminished.
To remedy this failure of UI policy to adequately respond to risingunemployment rates of workers placed by the TSI, states should con-sider revising UI policy instruments to internalize the UI-related costsof laying off temporary-agency workers within the operating budgetsof work-site employers. For example, states could require work-siteemployers to contribute UI taxes for procured temporary-agencyworkers. Under such a policy, states would charge UI claims made bytemporary workers to the accounts of work-site employers where theyheld their last or primary job assignment. Temporary staffing agen-cies could continue to perform payroll functions for their clients andshoulder legal and financial responsibility for other areas of employ-ment law. However, work-site employers would carry the responsibilityfor insuring procured temporary-agency workers against involuntaryunemployment.
104 WorkingWorkingWorkingWorkingWorkingUSAUSAUSAUSAUSA—Winter 2002–3
Mehta and Theodore
Some states regulate employee-leasing arrangements in this man-ner. Kentucky, for example, defines the business client as the em-ployer of leased employees for the purpose of determining liabilityfor UI contributions (Lenz 1997). Similarly, although less explicit intheir intent, several other states hold the entity that supervises, con-trols the work of, and has the authority to terminate leased employ-ees—most often the work-site employer—responsible for UI taxcontributions. In these cases, states experience-rate work-site employ-ers’ UI tax rates for the benefit claims of its leased employees.
A second option would be to weight UI tax rates of work-site em-ployers that use temporary staffing agencies to account for the UI-claims experience of the TSI. States may prefer the weighting optionrather than holding work-site employers directly accountable for UItax contributions, because it requires fewer changes to current pay-roll arrangements between temporary staffing agencies and their cli-ents. Some states weight employers’ UI tax rates to account for theUI-claims experience of the industry in which they operate, the rea-son being that the risk of unemployment within an entire industry isreflected to some degree upon all the firms that comprise that indus-try. Similarly, work-site employers are responsible for a significantshare of the risk of unemployment within the TSI. Therefore, statesmight weight work-site employers’ UI tax rates to reflect layoff expe-rience in the TSI.
Minimally, states should address the low UI recipiency rates facedby temporary-agency workers by altering eligibility requirements.States should target inherent biases against unemployed temporary-agency workers in UI rules that relate to earnings thresholds, benefitlevels, and the definition of a voluntary quit (see NELP 1997 and2001 for a thorough discussion of policy alternatives for restoringthe UI safety net for contingent workers).
Reduce Earnings Thresholds to Expand Eligibility
Reducing both aggregate base-period earnings and high-quarter earn-ings thresholds would mitigate inherent biases encountered in eligi-
Paying the Price for Flexibility
WorkingWorkingWorkingWorkingWorkingUSAUSAUSAUSAUSA—Winter 2002–3 105
bility rules by temporary-agency workers. Studies indicate that earn-ings thresholds significantly impact access to UI for unemployed low-wage workers. For example, the GAO (2000) found that a $1,000increase in minimum earnings requirements, holding other policyfactors constant, decreases UI recipiency rates by nearly 5 percent.
Temporary workers face disadvantages under most UI eligibilityrules related to base-period earnings partly because they tend to earnless than their counterparts in standard employment relationships.Analysis of the 1999 contingent worker supplement to the CPS indi-cates that part-time and full-time contingent workers consistentlyearn less per week compared to their counterparts in standard em-ployment relationships (Hipple 2001). Furthermore, examination ofearnings characteristics of unemployed temporary-agency workersfrom the 1993–2000 March supplement to the CPS indicates that me-dian hourly wages are significantly and positively correlated to theincidence of receipt of UI (correlation coefficient of –.129, significantat the .01 level).
Another disadvantage that unemployed temporary-agency workersface in securing eligibility is the difficulty in obtaining consistentwork assignments. According to the GAO (2000), current average base-period earnings thresholds are attainable for minimum-wage work-ers in all states if they work twenty hours per week for more thanforty weeks during the base period. Lowering earnings requirementsmay also increase the share of unemployed temporary-agency work-ers eligible to apply for UI benefits. According to results from a 1993supplement to the CPS designed to examine the characteristics of UIrecipients, 15 percent of job losers (involuntarily unemployed per-sons) did not file for benefits because they believed they had notworked or earned enough to be eligible—the most common reasonfor nonfiling among job losers (Wandner and Stettner 2000).
Increase Benefit Levels
Increasing benefit levels might also increase the rate of UI applica-tion among temporary-agency workers. On average, state UI pro-
106 WorkingWorkingWorkingWorkingWorkingUSAUSAUSAUSAUSA—Winter 2002–3
Mehta and Theodore
grams replace 33 percent of claimants’ average weekly earnings. Basedon this estimate, a typical full-time temporary-agency worker earn-ing $470 per week (the national average weekly earnings for tempo-rary-agency workers) could expect to receive only $155 per week inunemployment compensation (authors’ calculations based on Hipple2001).
Existing research on recipiency rates indicates that increasing ben-efit levels would positively impact the number of unemployed per-sons claiming UI benefits. Patricia Anderson and Bruce Meyer’s (1997)model of UI take-up rates suggests that increasing benefit levels by 10percent would increase the UI recipiency rate for all workers by 2–2.5percent. The GAO (2000) estimates a 4 percent decline in UI recipiencyfor every 10 percent drop in replacement of earnings.
Change Voluntary Quit Rules to Facilitate Search forFull-Time Work
States should allow temporary-agency workers the opportunity toseek permanent employment and still claim UI even if temporaryassignments are available. In most states, however, a voluntary quitor refusal of new assignments disqualifies temps from being eligiblefor UI. According to a survey conducted by the U.S. Department ofLabor, of our target states, only Massachusetts and New York allowworkers under some circumstances to voluntarily quit temporary workassignments in order to search for permanent work (Chasanov 1995).California, Illinois, Texas, and Washington rarely will allow workerswith a history of temporary work to refuse new temporary work as-signments to search for permanent work and remain eligible to col-lect UI. Texas and Florida disqualify temporary workers from UIeligibility if they do not return to their staffing agency upon comple-tion of job assignments prior to filing a UI claim.
Appropriately, states should not charge temporary staffing agencyaccounts for UI claims by temporary agency workers refusing suit-able temporary assignments. States allow some UI benefits to go un-charged because of the reason for job separation. For example, a person

Paying the Price for Flexibility
WorkingWorkingWorkingWorkingWorkingUSAUSAUSAUSAUSA—Winter 2002–3 107
who involuntarily leaves a job because his or her spouse was forcedto move out of town for work may still remain eligible for UI. In suchcases, states will not charge claimants’ benefits to their previousemployer(s). Similarly, states could encourage temporary workers toseek permanent work without punishing temporary staffing agenciesby providing uncharged UI benefits to temporary workers for thelength of their job search.
Conclusion
The continuing growth of the TSI has been fueled by demands bywork-site employers for workers employed under flexible employ-ment contracts. This demand has drawn increasing numbers of workersinto temporary employment arrangements, where they are assignedby temp agencies to jobs on an as-needed basis. This paper has exam-ined one outcome of the growing use of temporary-agency workers—the displacement of the costs for unemployment compensation fromwork-site employers onto the TSI and its workforce. It has been shownthat many industries have effectively outsourced their unemploymentand its associated costs to the TSI and, in the process, have violatedthe spirit and intent of experience-rated UI systems. For workers, thishas meant that local labor markets are further destabilized as theeffectiveness of experience-rating provisions in state UI systems indeterring layoffs has been undermined. This has led to increased tur-bulence in labor markets, even during a robust economic expansion.Unless policymakers reform state UI systems to account for the in-creased prevalence of UI claims made by the former employees of theTSI, work-site employers will continue to externalize the costs ofunemployment, thereby reducing employment tenures and increas-ing turnover in local labor markets.
Notes
1. Experience-rated UI tax systems can impose significant additional costs onemployers that frequently lay off workers. It has been determined that a layoff of
108 WorkingWorkingWorkingWorkingWorkingUSAUSAUSAUSAUSA—Winter 2002–3
Mehta and Theodore
fifty workers at one time can raise UI tax rates for an employer by two to threepercentage points every year in some states (Lambert and Leban 1999). For even amidsized employer, this can result in sizable tax contributions. In 1998, firms paid,on average, $208 per worker for unemployment insurance.
2. Unemployment insurance is distributed to eligible unemployed workers on aweekly basis. At the time of the initial claim, a determination is made as to which ofthe workers’ previous employers is responsible for the unemployment. The BAMpopulation includes payments from the state UI, UCFE (federal civilian), and UCX(military) unemployment compensation programs. The estimates do not indicatethe number of persons who claimed the total number of UI weeks. According tostatisticians at the U.S. DOL Employment Training Administration, the average du-ration of UI weeks claimed for temporary-agency workers was approximately 12weeks, and 13.6 weeks for all other workers (U.S. DOL ETA 2001). The estimates alsodo not indicate whether the last or primary employer was charged for the UI claim.
3. Employment services defined by the North American Industry Classifica-tion System includes employment placement agencies, temporary help services,and employee leasing services. Nationwide in 1999, temporary-help services ac-counted for approximately 70 percent of all employment in the employment ser-vices industry.
4. The average annual percentage change in weeks claimed was negative for allmajor industry groups. Employment services posted a 4 percent annual change inweeks claimed.
5. States reported tax rates by industry group using the SIC coding system. Per-sonnel-supply services, SIC 736, includes help-supply services and employment agen-cies. According to County Business Pattern data collected by the U.S. Census Bureau,nationwide in 1997, help-supply services, which include temporary-help service andemployee leasing, accounted for 93 percent of total employment in personnel supplyservices. Massachusetts and Ohio compute UI tax rates using the reserve-ratio method,while Illinois and Washington use the benefit-ratio method (U.S. DOL ETA 2000).
6. Average tax rates on construction firms are an exception. The seasonal natureof the industry and its relatively higher degree of unionization generally translateinto more UI weeks claimed charged to construction firms and, subsequently, higherUI tax rates for the industry.
References
Albrecht, James, and Susan Vroman. 1999. “Unemployment Compensation Financeand Efficiency Wages.” Journal of Labor Economics 17, no. 1: 141–67.
Anderson, Patricia, and Bruce Meyer. 1997. “Unemployment Insurance Takeup Ratesand the After-Tax Value of Benefits.” Quarterly Journal of Economics (August):913–37.
Belman, Dale, and Lonnie Golden. 2000. “Nonstandard and Contingent Employ-ment: Contrasts by Job Type, Industry and Occupation.” In Nonstandard Work:The Nature and Challenges of Changing Employment Arrangements, ed. F. Carré,M.A. Ferber, L. Golden, and S.A. Herzenberg, pp. 167–212. Champaign, IL: In-dustrial Relations Research Association.
Paying the Price for Flexibility
WorkingWorkingWorkingWorkingWorkingUSAUSAUSAUSAUSA—Winter 2002–3 109
Brogan, Timothy W. 2001. Scaling New Heights: ASA’s Annual Analysis of the StaffingIndustry. Washington, DC: American Staffing Association.
Bureau of Labor Statistics (BLS). 2002. “Employment Situation: January 2002”(www.bls.gov/news.release/empsit.nr0.htm, downloaded February 5, 2002).
———. 2000. Occupational Employment Survey, Industry Staffing Patterns, U.S. Data(www.bls.gov/oes/oes_dl.htm, downloaded on April 28, 2001).
Card, David, and Phillip Levine. 1994. “Unemployment Insurance Taxes and theCyclical and Seasonal Properties of Unemployment.” Journal of Public Econom-ics 53, no. 1: 1–29.
Chasanov, Amy. 1995. Non-monetary Eligibility: State Variations and Effects. Wash-ington, DC: Advisory Council on Unemployment Compensation.
Cohany, Sharon. 1996. “Workers in Alternative Employment Arrangements.” MonthlyLabor Review (October): 31–45.
Estevão, Marcello, and Saul Lach. 2000. “The Evolution of Demand for TemporaryHelp Supply Employment in the United States.” In Nonstandard Work: The Na-ture and Challenges of Changing Employment Arrangements, ed. F. Carré, M.A.Ferber, L. Golden, and S.A. Herzenberg, pp. 123–44. Champaign, IL: IndustrialRelations Research Association.
Feldstein, Martin S. 1978. “The Effects of Unemployment Insurance on TemporaryLayoffs Unemployment.” American Economic Review 68: 834–46.
Flynn, Gillian. 1995. “Contingent Staffing Requires Serious Strategy.” Personnel Journal74: 50–51.
General Accounting Office (GAO). 2000. Unemployment Insurance: Role as Safety Net forLow-Wage Workers Is Limited. Washington, DC: U.S. General Accounting Office.
Hipple, Steven. 2001. “Contingent Work in the Late 1990s.” Monthly Labor Review(March): 3–15.
Houseman, Susan. 1997. Temporary, Part-Time, and Contract Employment in the UnitedStates: New Evidence from an Employer Survey. Kalamazoo, MI: W.E. Upjohn In-stitute for Employment Research.
Houseman, Susan, and Anne Polivka. 1999. The Implications of Flexible Staffing Ar-rangements for Job Stability. Upjohn Institute staff working paper no. 99–056.Kalamazoo, MI: W.E. Upjohn Institute for Employment Research.
Illinois Department of Employment Security. 2001. Unpublished data.Katz, Lawrence F., and Alan B. Kruger. 1999. The High Pressure Labor Market of the
1990s. Working paper no. 416, Industrial Relations Section, Princeton Univer-sity, Princeton, NJ.
Lambert, Adam, and Erik Z. Leban. 1999. “How Unemployment Taxes Can Drive UpMerger Costs.” Mergers and Acquisitions 34, no. 1: 34–37.
Lenz, Edward. 1997. Employer Liability Issues in Third-Party Staffing Arrangements.Alexandria, VA: National Association of Temporary Staffing Services.
Massachusetts Division of Employment and Training. 2001. Unpublished data.Moomaw, Ronald. 1998. “Experience Rating and the Generosity of Unemployment
Insurance: Effects on County and Metropolitan Unemployment Rates.” Journalof Labor Research 19, no. 3: 543–60.
National Association of Temporary Staffing Services (NATSS). 1999. NATSS ModelTemporary Help Unemployment Insurance Law, obtained from NATSS researchstaff. Alexandria, VA.
110 WorkingWorkingWorkingWorkingWorkingUSAUSAUSAUSAUSA—Winter 2002–3
Mehta and Theodore
National Employment Law Project (NELP). 1997. Mending the Unemployment Com-pensation Safety Net for Contingent Workers. New York: National Employment LawProject.
———. 2001. Temp Work and Unemployment Insurance—Helping Employees at Tempo-rary Staffing and Employee Leasing Agencies. New York: National EmploymentLaw Project.
Ohio Bureau of Labor Market Information. 2001. Unpublished data.Segal, Lewis M. 1996. “Flexible Employment: Composition and Trends.” Journal of
Labor Research 17: 525–42.Segal, Lewis M., and Daniel G. Sullivan. 1997. “The Growth of Temporary Services
Work.” Journal of Economic Perspectives 11: 117–36.Staffing Industry Analysts. 1999a. “Editor’s Report—Adecco SA CEO John Bowmer’s
Keynote Speech to the Eighth Annual Staffing Industry Executive Forum.” SIReport 6 (March 30): 9.
———. 1999b. “Editor’s Report—Mitchell Fromstein’s Retirement and the Promotionof Jeffrey Joerres to CEO May Portend a Strategic Shift at Manpower Inc.” SIReport 9 (May 11): 8.
———. 2000. “Need for Flexibility, Not Cost Savings, Drives Contingent Workforce.”SI Report 14 (July 28): 7.
———. 2001. “Public Staffing Company Sales Growth Slows to 14 Percent in 2000.”SI Report 8 (April 27): 10–11.
Theodore, Nik, and Jamie Peck. 2002. “The Temporary Staffing Industry: GrowthImperatives and Limits to Contingency.” Economic Geography 34, no. 3 (in press).
Topel, Robert H. 1983. “On Layoffs and Unemployment Insurance.” American Eco-nomic Review 73: 541–59.
U.S. Department of Labor, Education, and Training Administration (U.S. DOL ETA).2000. Comparison of State Unemployment Insurance Laws. Washington, DC: U.S.Department of Labor, Employment and Training Administration, Office ofWorkforce Security.
———. 2001. Unpublished data.Vroman, Wayne. 1998. Labor Market Changes and Unemployment Insurance Benefit
Availability. Washington, DC: U.S. Department of Labor.Wandner, Stephen, and Andrew Stettner. 2000. “Why Are Many Jobless Workers Not
Applying For Benefits?” Monthly Labor Review (June): 21–32.Washington Employment Security Department, UI Research and Analysis Division.
2001. Unpublished data.Wiatrowski, William. 1999. “Tracking Changes in Benefit Costs.” Compensation and
Working Conditions (spring): 32–37.
To order reprints, call 1-800-352-2210; outside the United States, call 717-632-3535.


![OUTSOURCING - But when companies are outsourcing, it’s reducing the workforce, which can put a strain on other safety-net systems, [such as] unemployment, and paying](https://static.fdocuments.in/doc/165x107/5aa329207f8b9a07758dfdc2/outsourcing-but-when-companies-are-outsourcing-its-reducing-the-workforce.jpg)
