Payday Lending, Bankruptcy, and Insolvency
43
Washington and Lee Law Review Volume 69 | Issue 2 Article 6 Spring 3-1-2012 Payday Lending, Bankruptcy, and Insolvency Richard Hynes Follow this and additional works at: hps://scholarlycommons.law.wlu.edu/wlulr Part of the Banking and Finance Law Commons is Article is brought to you for free and open access by the Washington and Lee Law Review at Washington & Lee University School of Law Scholarly Commons. It has been accepted for inclusion in Washington and Lee Law Review by an authorized editor of Washington & Lee University School of Law Scholarly Commons. For more information, please contact [email protected]. Recommended Citation Richard Hynes, Payday Lending, Bankruptcy, and Insolvency, 69 Wash. & Lee L. Rev. 607 (2012), hps://scholarlycommons.law.wlu.edu/wlulr/vol69/iss2/6
Transcript of Payday Lending, Bankruptcy, and Insolvency

Washington and Lee Law Review
Volume 69 | Issue 2 Article 6
Spring 3-1-2012
Payday Lending, Bankruptcy, and InsolvencyRichard Hynes
Follow this and additional works at: https://scholarlycommons.law.wlu.edu/wlulr
Part of the Banking and Finance Law Commons
This Article is brought to you for free and open access by the Washington and Lee Law Review at Washington & Lee University School of LawScholarly Commons. It has been accepted for inclusion in Washington and Lee Law Review by an authorized editor of Washington & Lee UniversitySchool of Law Scholarly Commons. For more information, please contact [email protected].
Recommended CitationRichard Hynes, Payday Lending, Bankruptcy, and Insolvency, 69 Wash. & Lee L. Rev. 607 (2012),https://scholarlycommons.law.wlu.edu/wlulr/vol69/iss2/6

607
Payday Lending, Bankruptcy, and Insolvency
Richard Hynes*
Abstract
Economic theory suggests that payday lending can either increase or decrease consumer welfare. Consumers can use payday loans to cushion the effects of financial shocks, but payday loans may also increase the chance that consumers will succumb to temptation or cognitive errors and seek instant gratification. Both supporters and critics of payday lending have alleged that the welfare effects of the industry can be substantial and that the legalization of payday lending can even have measurable effects on proxies for financial distress, such as bankruptcy, foreclosure, and property crime. Critics further allege that payday lenders target minority and military communities, making these groups especially vulnerable. If the critics of payday lending are correct, we should see an increase (decrease) in signs of financial distress after the legalization (prohibition) of payday lending, and these changes should be more pronounced in areas with large military or minority populations. This Article uses county-level data to test this theory. The results, like those of the existing literature, are mixed. Bankruptcy filings do not increase after states legalize payday lending, and filings tend to fall in counties with large military communities. This result supports the beneficial view of payday lending, but it may be due to states’ incentives in enacting laws. This Article tests the effect of a change in federal law that should have had a disparate impact according to the prior choice of state law. This second test does not offer clear support for either the beneficial or detrimental view of payday lending. * Professor, University of Virginia School of Law. I thank Josh Fischman, Paul Mahoney, and participants at workshops at the Washington and Lee University School of Law, the Harvard–University of Texas Conference on Commercial Law Realities, the University of Virginia, and the American Law and Economics Association’s Annual Meeting for valuable comments. I thank Jon Ashley, Benjamin Grosz, Ben Hurst, and Joe Wynne for valuable research assistance. All errors remain my own.

608 69 WASH. & LEE L. REV. 607 (2012)
Table of Contents
I. Introduction ............................................................................ 608 II. The Payday-Lending Debate................................................. 613 III. The Regulation of Payday Lending ...................................... 624 A. State Regulation .............................................................. 624 B. Federal Regulation .......................................................... 626 IV. Measuring the Effect of Payday Lending............................. 627 A. The Effect of Changes in State Laws Regulating Payday Lending ........................................... 630 B. The End of the Rent-a-Charter Era ............................... 636 V. Conclusion .............................................................................. 638 Tables ...................................................................................... 640
I. Introduction
In a typical payday loan, a consumer writes a $300 check that is payable in two weeks and receives $255 in cash.1 These terms translate into an annual percentage rate in excess of 450% and a compounded interest rate in excess of 6,800% per year.2 Despite these extremely high rates, the loans are popular; some estimate that payday lenders extend as much as $50 billion in loans each year.3
Some scholars and consumer advocates call for strict usury limits or other laws designed to curtail or eliminate payday lending,4 and a growing number of state legislatures have heeded 1. See, e.g., Michael A. Stegman, Payday Lending, 21 J. ECON. PERSP. 169, 169 (2007) (“Thus, a typical example [of a payday loan] would be that in exchange for a $300 advance until the next payday, the borrower writes a postdated check for $300 and receives $255 in cash—the lender taking a $45 fee off the top.”). 2. See id. at 170 (“When the fee for a short-term payday loan is translated into an annual percentage rate (APR), the implied annual interest rate ranges between 400 and 1000 percent.”). 3. See id. (“Industry sources estimate more than a six-fold growth in payday loan volume in the last few years, from about $8 billion in 1999 to between $40 and $50 billion in 2004.”). 4. See Uriah King & Leslie Parrish, Springing the Debt Trap: Rate Caps Are Only Proven Payday Lending Reform, CTR. FOR RESPONSIBLE LENDING 22

PAYDAY LENDING 609
their call.5 We are also likely to see a substantial increase in federal regulation as the Dodd–Frank Wall Street Reform and Consumer Protection Act6 grants the new Bureau of Consumer Financial Protection authority over payday lenders.7 This Act prohibits the new bureau from setting an interest-rate cap.8 However, the new bureau might try to use its authority to regulate “unfair, deceptive, or abusive” acts to sharply curtail payday lending on the grounds that these loans cause “substantial injury to consumers” without offering sufficient countervailing benefits.9
Some argue that payday loans only appear expensive if one assumes that the consumer has the same options available to the middle-class critic—many payday loan borrowers are severely credit constrained.10 A payday loan may be less expensive than bouncing a check, and payday loans may offer better credit terms than
(Dec. 13, 2007), http://www.responsiblelending.org/payday-lending/research-analysis/springing-the-debt-trap.pdf (encouraging states to pass a small loan cap at or around 36%). For a summary of this debate, see Ronald J. Mann & Jim Hawkins, Just Until Payday, 54 UCLA L. REV. 855 (2007). 5. For example, in 2008, Ohio and New Hampshire set maximum annual interest rates below 50%. See Nat’l Conference of State Legislatures, Payday Lending 2008 Enacted Legislation (Jan. 2009), http://www.ncsl.org/ programs/banking/PaydayLend_2008.htm (last visited Apr. 10, 2012) (listing states that enacted payday lending legislation in 2008) (on file with the Washington and Lee Law Review). For a list of other recent changes, see infra Table 1. 6. See Dodd–Frank Wall Street Reform and Consumer Protection Act, Pub. L. No. 111-203, 124 Stat. 1376 (2010) (establishing financial regulatory reform in the United States after the financial crisis of the late 2000s). 7. See id. §§ 1001–1100H (establishing the Bureau of Consumer Financial Protection and granting it the authority to regulate consumer financial products and services in compliance with federal law, including payday lenders). 8. See id. § 1027 (setting the limits on the authority of the Bureau of Consumer Financial Protection). 9. See id. § 1031 (establishing that the Bureau of Consumer Financial Protection can prevent, through regulation, a “service provider from committing or engaging in an unfair, deceptive, or abusive act” in a financial product transaction that would “cause substantial injury to consumers”). For a recent article discussing the prospect for reform, see Jim Hawkins, The Federal Government in the Fringe Economy, 15 CHAP. L. REV. 23 (2011). 10. See, e.g., Mann & Hawkins, supra note 4, at 885 (“It is easy for upper-middle-class academics that study the topic to think that this lending is unduly risky and that those that engage in it would be better advised to tighten their belts and resist the temptation to borrow.”); see also Stegman, supra note 1, at 173 (“Most payday loan customers are highly credit-constrained.”).

610 69 WASH. & LEE L. REV. 607 (2012)
pawnshops and rent-to-own stores.11 More importantly, payday lending may be better than no credit at all. If a payday loan allows the consumer to repair her automobile, then it may save the consumer’s job and prevent further financial difficulties.12 Critics counter that payday loan borrowers do not repay their loans quickly and instead renew their loans repeatedly; consumers can become ensnared in a debt trap and incur hundreds of dollars in fees for each small loan and can lead to insolvency or bankruptcy.13 Critics further allege that payday lenders target military and minority populations,14 making these groups especially vulnerable. Some scholars take a more agnostic view of payday lending, arguing that this industry is unlikely to have a significant effect on the financial health of consumers because the dollar amounts involved are too small, and the number of available alternatives is too great,15 or because payday lenders and other fringe credit providers take steps
11. See Mann & Hawkins, supra note 4, at 887–95 (explaining that payday lenders may provide better benefits and risks than competing products, such as subprime credit cards, pawnshops, rent-to-own transactions, and illegal sources); see also Adair Morse, Payday Lenders: Heroes or Villains, 102 J. FIN. ECON. 28, 30 (2011) (“[F]or the majority of people in my sample, no obvious alternative to a payday loan exists.”). 12. See Morse, supra note 11, at 28 (“Without access to credit, these small-scale personal emergencies can lead to bounced checks, late fees, utility suspensions, repossessions, and, in some cases, foreclosures, evictions and bankruptcies.”). 13. See, e.g., Uriah King & Leslie Parrish, Phantom Demand: Short-Term Due Date Generates Need for Repeat Payday Loans, Accounting for 76% of Total Volume, CTR. FOR RESPONSIBLE LENDING 19 (July 9, 2009), http://www.responsiblelending.org/payday-lending/research-analysis/phantom-demand-final.pdf (analyzing whether short-term due dates in payday lending can lead to a debt trap). Parrish and King specifically state:
Being trapped in payday loan debt can have dire consequences for the financial health of families and their communities. Excess fees of $3.5 billion per year are drained from trapped borrowers who vainly attempt to retire their payday loan debt. As a result, bank account closures, credit card delinquencies, delayed bill payment and medical care, and bankruptcies are more common among payday borrowers and in communities with access to payday lending and other high-cost forms of credit.
Id. 14. See infra notes 64–66 and accompanying text (discussing whether payday lenders target military and minority populations). 15. See Mann & Hawkins, supra note 4, at 885 (“[T]hese small loans probably do not contribute substantially to financial distress and insolvency.”).

PAYDAY LENDING 611
that ensure that their customers repay.16 The existing empirical literature is inconclusive; some papers find results consistent with the debt–trap hypothesis while other papers find results consistent with the positive or agnostic views of payday lending.17
This Article adds to the empirical literature on payday lending in three ways. First, this Article makes use of the claim that payday lenders target military and minority populations. If payday lending does affect financial distress, its effect should not be uniform throughout the state. We should see a more pronounced effect in areas where payday lenders actually locate. Measuring the correlation between the actual location of payday lenders and financial distress may yield biased results because the expected amount of financial distress may affect where payday lenders choose to open their stores. We can, however, mitigate this bias by using proxies for their choice of location. This Article uses minority, military, and moderate-income populations as proxies for the location of payday lenders. The use of these proxies also allows us to ask whether these groups are particularly vulnerable to payday lending.
The second contribution is the measure of payday lending. Like prior articles, this Article makes use of changes in state laws regulating payday lending across time.18 However, a review of the annual reports of public corporations reveals that, until recently,
16. See Jim Hawkins, Regulating on the Fringe: Reexamining the Link Between Fringe Banking and Financial Distress, 86 IND. L.J. 1361, 1362 (2011) (analyzing “policy implications of determining that fringe banking products do not cause distress”). Hawkins specifically states:
I argue that the link between fringe banking and financial distress is dubious. Because fringe creditors cannot rely on borrowers’ credit scores to predict whether they will be repaid, creditors structure fringe credit products to virtually guarantee repayment. Because repayment is guaranteed by the structure of the transaction, it is nearly impossible for borrowers to take on unmanageable debt loads.
Id. at 1361–62. 17. Compare supra note 13 and accompanying text (suggesting that there is evidence to support the debt–trap hypothesis in some communities with access to payday lending), with supra notes 15–16 and accompanying text (providing examples of papers that take a more agnostic view of payday lending). 18. See, e.g., infra note 58 and accompanying text (referring to an article that made use of changes in Georgia’s state laws regulating payday lending across time to test the debt–trap hypothesis).

612 69 WASH. & LEE L. REV. 607 (2012)
payday lenders had stores in states where their loans were illegal under state law.19 Payday lenders were able to charge rates in excess of state usury limits by partnering with out-of-state banks,20 but the Federal Deposit Insurance Corporation (FDIC) effectively ended these partnerships in 2005.21 This paper makes use of this change in federal law as a natural experiment; the change in federal law should have had little effect in states where payday lending was legal under state law.
This Article follows the literature in using the bankruptcy filing rate as a proxy for financial distress. However, just the attorneys’ fees for a bankruptcy filing can be more than a thousand dollars,22 and many consumers may be too broke to file. This Article, therefore, supplements this measure with property crime rates and the rate at which landlords sue to evict their tenants.23
19. See, e.g., Mann & Hawkins, supra note 4, at 879 (analyzing that recently many of the large national providers of payday loans had locations in Texas). While Texas law has unfavorable usury laws for payday lenders, these national providers were able to bypass Texas state law by partnering with out-of-state banks. Id. In effect, when the national providers partnered with the out-of-state banks, they were able to import the out-of-state banks’ rates. Id. 20. For example, the 2004 Annual Report for Advance America states:
As of December 31, 2004, pursuant to our processing, marketing and servicing agreements with the lending banks, we are the processing, marketing and servicing agent for payday cash advances offered, made and funded by BankWest, Inc., a South Dakota bank . . . in Pennsylvania, First Fidelity Bank, a South Dakota bank, in Michigan, Republic Bank & Trust Company, a Kentucky bank . . . in North Carolina and Texas and Venture Bank, a Washington bank, in Arkansas.
ADVANCE AM., INC., ANNUAL REPORT (Form 10-K) (Mar. 21, 2005), available at http://www.sec.gov/Archives/edgar/data/1299704/000104746905008577/a2154213z10-k.htm. 21. See Mann & Hawkins, supra note 4, at 873 (“In July 2005, however, the FDIC issued its Guidelines on Payday Lending. . . . In practice, these new regulations have made it impractical for state-chartered banks to continue partnering with the major national providers.”); Stegman, supra note 1, at 179 (“[I]n March 2005 the FDIC further tightened its guidance . . . render[ing] the rent-a-bank model obsolete.”). 22. See infra note 99 and accompanying text (discussing average attorneys’ fees in various bankruptcy filings). 23. Adair Morse also looks at property crime. See Morse, supra note 11, at 29 (analyzing whether payday “loans mitigate or exacerbate the effect of financial distress on individuals’ welfare as measured by foreclosures and small property crimes”). Also, Brian Melzer uses various measures drawn from survey data. See Brian T. Melzer, The Real Costs of Credit Access: Evidence from the

PAYDAY LENDING 613
This Article’s results match the conflict currently found in the literature. The regressions that utilize changes in state law are more consistent with the beneficial view of payday lending than the debt–trap hypothesis. When a state legalizes payday lending, bankruptcy filing rates tend to fall in counties with large military communities—one of the communities that payday lenders allegedly target. By contrast, the regressions that make use of the change in federal law do not produce robust results that support either the beneficial view of payday lending or the debt–trap hypothesis.
Part II reviews the current payday-lending debate. Part III briefly describes the regulation of payday lending, and Part IV presents the results. Part V concludes.
II. The Payday-Lending Debate
The fact that consumers use payday loans suggests that they believe that these loans will, on average, improve their welfare. Consumers who suffer income or expense shocks (e.g., a medical bill, a car repair, etc.) may lack the savings necessary to pay in cash. A payday loan could be a cost-effective means of paying these bills; the extremely high annual interest rates may overstate the true cost of payday loans for consumers who repay quickly. Much of the roughly $50 charged for a $300 loan may be needed to cover inherent transaction costs, as other small-scale financial transactions require large fees. For example, Western Union charges $27 to send $300 within the United States.24 The interest rate for a payday loan is dramatically higher than the rates charged by some other lenders, such as credit card issuers, but the consumer may have reached her credit limit and she may be unable to find a loan on more attractive terms.25 If the consumer is severely credit constrained, a payday
Payday Lending Market, 126 Q.J. ECON. 517, 517 (2011) (using mainly data related to geographic differences in the availability of payday loans from survey data to assess “the real effects of credit access among low-income households”). 24. This is the price for the online service. It is slightly cheaper ($24) to send money from one of their locations. Compare and Price Western Union Services, WESTERN UNION, https://wumt.westernunion.com/WUCOMWEB/ shoppingAreaAction.do;jsessionid=dtee6Ms2Vg_nf8fQx0tCsfN?method=load&countryCode=US&languageCode=en&nextSecurePage=Y (last visited Apr. 10, 2012) (on file with the Washington and Lee Law Review). 25. See Morse, supra note 11, at 30 (“Research covering the last three

614 69 WASH. & LEE L. REV. 607 (2012)
loan can help her withstand these shocks and improve her welfare. On the other hand, research suggests that at least some payday loan borrowers were not credit constrained and could have used credit cards or other sources to borrow more cheaply.26 Moreover, a number of scholars allege that consumers may be unable to control their impulses or suffer from cognitive failures that cause them to unduly prefer current over future consumption.27 For these debtors, a relaxation of their credit constraint may reduce their welfare.
A number of prior studies have suggested that the legalization of payday lending can have substantial welfare effects and can even have measurable effects on proxies for financial distress, such as the number of bankruptcy filings,28 home foreclosures, and property crimes.29 Other scholars doubt these claims as a theoretical decades finds that up to 20% of U.S. residents are credit constrained . . . . When expense or income shocks arrive, banks and credit cards usually do not provide these constrained borrowers with distress loans.”). 26. See Sumit Agarwal, Paige Marta Skiba & Jeremy Tobacman, Payday Loans and Credit Cards: New Liquidity and Scoring Puzzles 7 (Working Paper, 2009), available at http://papers.ssrn.com/sol3/papers.cfm?abstract_id=1327125 (“Regarding liquidity, we find that most account holders with a major credit card issuer have substantial unused liquidity on their credit cards at the time they borrow on payday loans.”); Susan P. Carter, Paige Marta Skiba & Jeremy Tobacman, Pecuniary Mistakes? Payday Borrowing by Credit Union Members 1 (Pension Research Council, Working Paper No. 2010-32, 2010), available at http://papers.ssrn.com/sol3/papers.cfm?abstract_id=1707657 (“We observe substantial payday loan use when cheaper sources of liquidity are available . . . .”). 27. See, e.g., David Laibson, Golden Eggs and Hyperbolic Discounting, 112 Q.J. ECON. 443, 443 (1997) (“Hyperbolic discount functions induce dynamically inconsistent preferences, implying a motive for consumers to constrain their own future choices.”). 28. See, e.g., Donald P. Morgan & Michael R. Strain, Payday Holiday: How Households Fare After Payday Credit Bans 3 (Fed. Reserve Bank of N.Y., Working Paper No. 309, 2007), available at http://www.newyorkfed. org/research/staff_reports/sr309.pdf (noting that after a particular credit ban, households in Georgia “were more likely to file for bankruptcy”); Paige Marta Skiba & Jeremy Tobacman, Do Payday Loans Cause Bankruptcy? 1 (Vand. Univ. Law School Law & Econs., Working Paper No. 11-13, 2009), available at http://papers.ssrn.com/sol3/papers.cfm?abstract_ id=1266215 (“We find evidence that access to payday loans does increase personal bankruptcy rates.”). But see Petru S. Stoianovici & Michael T. Maloney, Restrictions on Credit: A Public Policy Analysis of Payday Lending 1 (Working Paper, 2008), available at http://papers.ssrn.com/sol3/papers.cfm?abstract_id=1291278 (“Using state-level data between 1990 and 2006, we find no empirical evidence that payday lending leads to more bankruptcy filings . . . .”). 29. See Morse, supra note 11, at 29 (analyzing whether payday “loans

PAYDAY LENDING 615
matter.30 In an earlier era, some economists argued that usury limits had no real effect on debt levels because they merely caused consumers to switch to other forms of credit, such as retail store credit, that were effectively unregulated.31 The same may be true of payday lending. In the absence of payday loans, consumers may have been able to use other substitutes to meet short-term cash needs or to overspend.32
Some scholars suggest that the dollar amounts of payday loans are too small to have a material effect on financial hardship.33 Those who argue that payday lending can have measurable effects claim that a problem that is small, initially, can lead to a much larger problem. For example, Adair Morse argues that if a consumer lacks access to payday loans and other forms of credit, then even a small-scale emergency can lead to substantial delinquency fees that can in turn lead to major problems, such as foreclosure, eviction, and/or bankruptcy.34 Industry critics argue that payday lending can ensnare consumers in a “debt trap.”35 Many debtors do not repay mitigate or exacerbate the effect of financial distress on individuals’ welfare as measured by foreclosures and small property crimes”). 30. See Mann & Hawkins, supra note 4, at 885 (“[B]ecause the overwhelming majority of payday lending transactions do not result in default on the part of the borrower, there is some reason to think that many of the transactions benefit both the borrower and the lender.”). 31. See, e.g., Richard L. Peterson, Usury Laws and Consumer Credit: A Note, 38 J. FIN. 1299, 1299 (1983) (“Since funds are highly fungible, it is likely that consumers are able to substitute retail-originated credit for other sources of consumer credit at low cost.”). 32. See Mann & Hawkins, supra note 4, at 886–95 (discussing that it would be near impossible to stop consumers from borrowing money if there is a great economic demand for consumer borrowing, even if that means consumers must turn to pawnshops, rent-to-own stores, or illegal sources). 33. See, e.g., id. at 885–86 (“[T]hese small loans probably do not contribute substantially to financial distress and insolvency.”). 34. See Morse, supra note 11, at 29 (explaining what may happen to a consumer lacking access to payday loans in a small-scale emergency). Adair Morse specifically states:
Without access to credit, these small-scale personal emergencies can lead to bounced checks, late fees, utility suspensions, repossessions, and, in some cases, foreclosures, evictions and bankruptcies. The United States works very much on a fee-based system for delinquencies, such that once low-margin individuals get into distress, they often end up in a cycle of debt.
Id. 35. See Stegman, supra note 1, at 176 (“The strongest critics say that

616 69 WASH. & LEE L. REV. 607 (2012)
their loans quickly but instead roll over their debt by taking out a new loan to repay the first loan. The Center for Responsible Lending suggests that these repeat borrowers account for the vast majority (76%) of payday loans.36 In 2008, over 20% of Virginia’s payday loan borrowers had thirteen or more payday loans, and the average number of loans taken out by a borrower was 7.7.37 A recent study of Oklahoma borrowers suggests that in the first year after the average borrower takes out a payday loan, the borrower will be indebted for 212 days.38 Each time a consumer takes out a new loan, the consumer must pay a new set of fees. At roughly $15 to $30 per $100 for each two-week loan, the total fees can quickly exceed the amount originally borrowed. Brian Melzer estimates that about 40% of payday borrowers pay at least $500 in interest each year and that 10% pay “upwards of $1000 in interest annually.”39
In a recent article, Jim Hawkins argued that “the link between fringe banking and financial distress is dubious . . . [b]ecause repayment is guaranteed by the structure of the transaction, [and] it is nearly impossible for borrowers to take on unmanageable debt loads.”40 A relatively small percent of payday loans are charged off payday loans are the credit market’s equivalent of crack cocaine; a highly addictive source of easy money that hooks the unwary consumer into a perpetual cycle of debt . . . . Empirical evidence of the rollover phenomenon and serial borrowing through payday lending abounds.”). 36. See King & Parrish, supra note 13, at 3 (“Short-term due date generates need for repeat payday loans, accounting for 76% of total volume.”). 37. See BUREAU OF FIN. INSTS., STATE CORP. COMM’N, COMMONWEALTH OF VA., THE 2010 ANNUAL REPORT OF THE BUREAU OF FINANCIAL INSTITUTIONS: PAYDAY LENDER LICENSEES, CHECK CASHERS, AND MOTOR VEHICLE TITLE LENDER LICENSEES 7 (2010), available at http://www.scc.virginia.gov/bfi/annual/ar04-10.pdf (stating that 90,155 of 437,025 payday loan borrowers in 2008 took out more than thirteen loans, and the average number of loans taken out by a borrower was 7.7). Virginia enacted new legislation that took effect in January of 2009, and the number of repeat borrowers (and the volume of payday lending in Virginia) declined precipitously. The total volume of payday loans declined from $1,327,345,367 in 2008 to just $170,998,829 in 2010. Id. The number of individuals who received more than thirteen loans declined from 309,951 in 2008 to just one in 2010. Id. 38. See Uriah King & Leslie Parrish, Payday Loans, Inc.: Short on Credit, Long on Debt, CTR. FOR RESPONSIBLE LENDING, 1 (Mar. 31, 2011), http://www.responsiblelending.org/payday-lending/research-analysis/payday-loan-inc.pdf (“[I]n their first year of payday loan use, borrowers are indebted an average of 212 days.”). 39. Melzer, supra note 23, at 549. 40. Hawkins, supra note 16, at 1361–62.

PAYDAY LENDING 617
as uncollectible.41 For example, in 2008, Virginia payday lenders charged off just 3.2% of their loans as uncollectible,42 well below the average national credit card charge-off rate of 5.5% reported by banks in that year.43 To the extent that many payday loans are rolled over, the low charge-off rates are very misleading.44 Payday borrowers are not financially secure. Returning to the Virginia data again, payday lenders received approximately one bad check for every 2.5 individuals who took out a payday loan in 2008, and they charged off more than one bad check for every 4.2 individuals who took out a loan.45 Virginia took steps to limit the number of payday loans that an individual could take out in a single year,46 and the percentage of loans charged off as uncollectible rose substantially to
41. Some argue that the loss rate (bad loan losses divided by the total amount of loans made) for payday loans is so low that payday lenders need not worry about default and, therefore, the high interest rates are unjustified. See, e.g., Stegman, supra note 1, at 180 (“And the payday lender doesn’t have much to worry about, either. The ultimate default rate is 2% of gross loan receivables.”). 42. In 2008, Virginia’s payday lenders charged off $42,482,127 as uncollectible and extended $1,327,345,367 in payday loans. BUREAU OF FIN. INSTS., supra note 37, at 7. 43. Fed. Reserve Bd., Charge-Off and Delinquency Rates on Loans and Leases at Commercial Banks (Nov. 2011), http://www.federalreserve.gov/ releases/chargeoff/chgallsa.htm (last visited Apr. 10, 2012) (on file with the Washington and Lee Law Review). 44. To get a sense of scale, assume that there is a 3% chance that a consumer will default on each loan and that the probability of default does not depend on the number of loans. A consumer who borrows thirteen payday loans in a year has about a 33% chance of defaulting on at least one payday loan (this is just one minus 0.97 raised to the power of thirteen). These assumptions are made for illustrative purposes; they are almost certainly incorrect. Consumers who take out more payday loans may be either more or less likely to default on a single loan than a consumer who just takes out one loan. In addition, the probability of default should be higher than the charge-off rate because the creditor may collect something after default. In fact, Virginia creditors are able to collect in full on more than half of the checks that initially return unpaid. See BUREAU OF FIN. INSTS., supra note 37, at 7 (stating that in Virginia, in 2010, a total of 50,455 borrower checks were returned unpaid, but of these returned checks, 29,981 were ultimately paid). 45. See id. (stating that in 2008, 437,025 individuals in Virginia took out a payday loan, 176,632 checks were returned as unpaid, the payday lenders received payments on 76,724 of these checks, and they charged off 104,832 checks as uncollectible). 46. See Nat’l Conference of State Legislatures, supra note 5 (listing states, including Virginia, that enacted payday lending legislation in 2008).

618 69 WASH. & LEE L. REV. 607 (2012)
9.6% in 2010,47 slightly higher than the average credit card charge-off rate that year of 9.4%.48 The rate at which lenders received bad checks fell slightly (one bad check for every 4.3 borrowers in 2010).49
Payday lending did not cause the insolvency of all of these consumers. Many consumers use these loans for necessities and financial emergencies; these consumers were in financial trouble before they found their way to the payday lender. Those who defend high-interest loans use this fact to argue that payday loans may even reduce financial distress by allowing the consumer to take care of immediate problems (such as overdue rent) before they can become much worse problems (such as eviction).50
Whether payday lending causes or deepens financial distress or insolvency is a question that should play an important role in the policy debate. If no link is shown, critics of the industry could still argue that the tests or proxies are not sufficiently sensitive to find any effect. However, the absence of a measured effect makes it less likely that any effect is economically significant. Critics may also argue in favor of the elimination of these loans, even in the absence of a rise in signs of financial distress, by arguing that they are a horrible deal for consumers. However, there are a number of other goods and services that would appear to be a horrible deal for consumers in general, the poor in particular, and these products do not evoke the same level of passion as high-interest loans.
A finding that payday loans increase financial distress or insolvency is also insufficient to show that these loans should be banned. We could probably reduce insolvency by banning consumer credit,51 but this would almost certainly reduce welfare. If
47. See id. (showing that Virginia payday lenders extended $170,988,829 in payday loans and charged-off $16,406,588 as uncollectible). 48. Fed. Reserve Bd., supra note 43. 49. See BUREAU OF FIN. INSTS., supra note 37, at 7 (showing that 146,319 individuals took out a payday loan, that 50,455 borrower checks were returned unpaid, and that 33,723 checks were ultimately returned as uncollectible). 50. See, e.g., Morse, supra note 11, at 29 (“Without access to credit, these small-scale personal emergencies can lead to bounced checks . . . repossessions, and, in some cases, foreclosures, evictions and bankruptcies.”). 51. I say “probably” because consumers may be rendered insolvent (at least on a cash flow basis) by involuntary claims such as tort judgments or quasi-voluntary claims such as medical bills. Consumer credit may reduce these forms of insolvency by allowing the consumer to use future earnings to pay current expenses.

PAYDAY LENDING 619
consumers consider the risk of insolvency when borrowing, then no regulation is necessary. Policymakers may, however, believe that consumers suffer from cognitive failure52 or fail to consider the effect of their insolvency on third parties.53 Policymakers may, therefore, wish to have some idea of the magnitude of the effect that payday lending has on insolvency. Unfortunately, the results of the literature are inconclusive.54
Some prior empirical studies support the debt–trap hypothesis. Brian Melzer uses a survey in which households report when they have difficulty paying their mortgage, rent, or utility bill, or when they move out of their home due to financial difficulties, or when they delay medical or dental care due to financial circumstances.55 He focuses on the response of households in three states that prohibit payday lending (Massachusetts, New Jersey, and New York) and reports that households in counties that border states that allow payday lending are more likely to report financial trouble than households in other parts of the state.56 He further tests
52. This argument is sometimes phrased in vague terms of “overoptimism.” However, overoptimism can lead consumers to borrow either too little or too much. See Richard M. Hynes, Overoptimism and Overborrowing, 2004 BYU L. REV. 127, 127 (2004) (stating that while scholars have “long argued that overoptimism causes consumers to overborrow,” some forms of overoptimism “may actually cause consumers to borrow less than they would if they accurately perceived the risks they face”). 53. See Mann & Hawkins, supra note 4, at 884 (“Specifically, there is good reason to think that financial distress generates costs for society as a whole that are not borne by the parties to the transaction.”). The effect of the externality of debt is theoretically ambiguous. Consumers may borrow too much because they fail to consider the effect of their insolvency on their friends, family, or social safety net. They may also borrow too little because they fail to consider the benefits that their friends and family derive from the additional consumption possible due to the borrowing. They may also fail to consider the benefits to the social safety net if their borrowing allows them to recover from a financial shock more quickly and therefore not need as much social assistance. 54. For a recent review of the literature, see John P. Caskey, Payday Lending: New Research and the Big Question (Fed. Reserve Bank of Phila. Working Papers Research Dep’t, Paper No. 10-32, 2010), available at http://www.philadelphiafed.org/research-and-data/publications/working-papers/ 2010/wp10-32.pdf. 55. See Melzer, supra note 23, at 517 (describing the survey factors used in Melzer’s study on the effects of credit access among low-income households). 56. See id. at 533 (“The estimated coefficient on PaydayAccess is positive in each family hardship regression, which means that families in payday access areas report more financial problems.”).

620 69 WASH. & LEE L. REV. 607 (2012)
whether households experience an unusual increase in financial trouble if they border a state that has recently legalized payday lending, and two of his nine measures of hardship show results that are statistically significant at the 10% level.57 Dennis Campbell, F. Asis Jerez, and Peter Tafano examine the rate at which banks close accounts without the consent of the account holder, and they find that after Georgia banned payday lending this rate was lower in Georgia’s counties than in the counties of the neighboring states.58 Their results are consistent with the debt–trap hypothesis, but they are also consistent with banks closing troubled accounts that are less profitable due to the loss of overdraft fees as consumers use a cheaper alternative—payday loans.59
Paige Skiba and Jeremy Tobacman used individual-level data from a payday lender in Texas and found that applicants who were given a payday loan were more likely to file for Chapter 13 bankruptcy within one or two years than those who were denied the loan.60 None of their specifications found a statistically significant effect on the rate at which consumers chose the more common form of bankruptcy, Chapter 7.61 North Carolina banned payday lending 57. Id. at 539–40, tbl. V. “Moved Out” (defined as moving out of one’s home or apartments) and “Any Care Postponed” (defined as the postponement or delay of any type of health care) are statistically significant at the 10% level, and “Any Family Hardship” (defined as when a family experiences hardships, such as reducing meals because of lack of money) and “Drug Purchase Postponed” (defined as an indicator for whether an individual has forgone or postponed needed care because of a lack of money or insurance) are close. See id. at 526–47 (defining the measures used for the study and testing how access to payday loans affect economic hardship). 58. See Dennis Campbell, F. Asis Martinez-Jerez & Peter Tufano, Bouncing Out of the Banking System: An Empirical Analysis of Involuntary Account Closures 26–30 (Harvard Bus. Sch. Working Paper, 2008), available at http://papers.ssrn.com/sol3/papers.cfm?abstract_id=1335873 (exploring the link between access to payday lending and involuntary closure activity after the state of Georgia banned payday lending in 2004). 59. See Brian Melzer & Donald P. Morgan, Competition and Adverse Selection in a Consumer Loan Market: The Curious Case of Overdraft vs. Payday Credit 1 (Working Paper, 2008), available at http://www.kellogg.north western.edu/faculty/melzer/ (suggesting that the presence of payday loans may make deposit accounts riskier and less profitable). 60. See Skiba & Tobacman, supra note 28, at 1 (finding evidence that “access to payday loans does increase personal bankruptcy rates”). 61. See id. at 2 (“We find no significant effects on chapter 7 bankruptcies.”). Paige Skiba and Jeremy Tobacman suggest that because payday borrowers have income, they may be encouraged to file under Chapter 13 by either their lawyers

PAYDAY LENDING 621
in 2005, and a survey of low- and middle-income North Carolinians and former payday borrowers suggests that these groups overwhelmingly view the absence of payday lending as beneficial rather than harmful.62 However, less than 8% of those contacted completed the survey, and there is a very large risk that those who bothered to respond are not representative of the entire sample.63
A few studies focus on the impact that payday lending has on military or minority populations. Steven Graves and Christopher Peterson find that payday lenders tend to open stores in areas with large military populations.64 Similarly, Micahel Stegman and Robert Faris and the Center for Responsible Lending find that payday lenders are more likely to concentrate in areas with large minority populations.65 My own empirical methodology relies on the accuracy of these results, but the results themselves are normatively ambiguous. It is possible that these are simply groups who have a greater need for short-term credit. Scott Carrell and Jonathon Zinman provide more direct evidence of a harmful effect;
or the bankruptcy judges. Id. An alternative explanation is that these debtors may lack the cash necessary to pay the fees necessary to file under Chapter 7. By filing under Chapter 13, they can pay their attorneys over time. 62. See Univ. of N.C. Ctr. for Cmty. Capital, North Carolina Consumers After Payday Lending: Attitudes and Experiences with Credit Options, CTR. FOR CMTY. CAPITAL, 1 (Nov. 2007), http://ccc.unc.edu/documents/NC_After_ Payday.pdf (“More than twice as many former payday borrowers reported that the absence of payday lending has had a positive rather than a negative effect on their household.”). 63. See id. at 2 (“The cooperation rate was a low 7.79%, primarily because we were unable to contact anyone at many of the numbers called.”). 64. See Steven M. Graves & Christopher L. Peterson, Predatory Lending and the Military: The Law and Geography of “Payday” Loans in Military Towns, 66 OHIO ST. L.J. 653, 654 (2005) (stating that the article “provides geographic evidence that payday lenders do aggressively target American military personnel, irrespective of most forms of legal regulation”). 65. See Michael A. Stegman & Robert Faris, Payday Lending: A Business Model that Encourages Chronic Borrowing, 17 ECON. DEV. Q. 8, 13 (2003) (noting that one study, for example, showed that Charlotte, NC fringe banks “disproportionately favored high-minority neighborhoods”); see also Wei Li et al., Predatory Profiling: The Role of Race and Ethnicity in the Location of Payday Lenders in California, CTR. FOR RESPONSIBLE LENDING, 25 (Mar. 26, 2009), http://www.responsiblelending.org/california/ca-payday/research-analysis/ predatory-profiling.pdf (“We find that payday lenders tend to locate closer to and cluster in African American and Latino communities.”).

622 69 WASH. & LEE L. REV. 607 (2012)
they find that payday lending reduces the performance and retention of Air Force personnel.66
The evidence in favor of the debt–trap hypothesis must be balanced against a number of studies that are clearly inconsistent with the theory. Jonathon Zinman measures changes in employment and subjective descriptions of well-being in Oregon and Washington surrounding the imposition of a binding rate cap in Oregon in 2007.67 His results suggest that Oregon’s prohibition of payday lending caused: (i) consumers to shift to more expensive sources of credit such as bank overdraft protection, (ii) a fall in employment, (iii) a fall in subjective measures of financial well-being, and (iv) an increase in the rate at which telephones are disconnected.68 However, Zinman’s data are taken from the first five months after the imposition of the rate cap, and he acknowledges that these short-run effects may differ from the long-term effects.69 Adair Morse focuses on the ability of consumers to use payday lending to smooth income after a financial shock.70 Specifically, she measures the resiliency of communities after natural disasters and finds that communities with greater concentrations of payday lenders see a smaller increase in the rate of foreclosure and a smaller increase in the crime rate.71 Morse acknowledges that her
66. See Scott E. Carrell & Jonathan Zinman, In Harm’s Way? Payday Loan Access and Military Personnel Performance 1 (Fed. Reserve Bank of Phila. Working Papers Research Dep’t, Paper No. 08-18, 2008), available at http://papers.ssrn.com/sol3/papers.cfm?abstract_id=1269414 (finding that payday lending has produced “significant average declines in overall job performance and retention” in Air Force personnel). 67. See Jonathan Zinman, Restricting Consumer Credit Access: Household Survey Evidence on Effects Around the Oregon Rate Cap, 34 J. BANKING & FIN. 546, 546 (2009) (“I examine some short-run effects of restricting access, using household panel survey data on payday loan users collected around the imposition of binding restrictions on payday loan terms in Oregon.”). 68. See id. at 554 (discussing the results of Zinman’s study using household survey data on the effects of restricting access to expensive consumer credit on payday loan users). 69. See id. at 553 (acknowledging that “short-run measures may capture transitional rather than equilibrium outcomes,” and that “[b]orrowers may need time to adjust to the new regime”). 70. See Morse, supra note 11, at 38–43 (studying the welfare effects of access to payday loans for credit-constrained individuals due to financial shock). 71. See id. at 29 (explaining that payday lenders can mitigate the number of foreclosures in a given area in the year following a natural disaster, and the “results indicate that payday lenders alleviate individuals’ need to resort to

PAYDAY LENDING 623
test focuses on the possibly beneficial effect of payday lending (helping the consumer withstand an income or expense shock), and that payday lending could also increase financial distress among consumers who suffer from cognitive failures.72
Donald Morgan and Michael Strain use the Survey of Consumer Finance and find that consumers who are deemed to be more vulnerable to predatory lending are less likely to report missing a debt payment if they live in a state that allows payday lending.73 Critics of payday lending may argue, however, that a single missed debt payment does not adequately capture the concept of a debt trap. Payday lending may indeed help the consumer mitigate a temporary setback by allowing her to borrow more to pay old debts. However, an increased debt burden may increase the chance that the consumer experiences more serious credit problems. Donald Morgan and Michael Strain find that states that legalize payday lending tend to experience a decline in variables capturing household credit problems relative to other states, and that states that abolish payday lending experience an increase in these variables.74 Specifically, they find that complaints against debt collectors, automobile and mobile home repossession rates, and bankruptcy filings all increase in states that ban payday lending and decrease in states that liberalize restrictions on payday lending.75 Their results rest on the effects of legal changes in just four states, but Petru Stoinanovici and Michael Maloney also use
small property crimes in times of financial distress”). 72. See id. (“Because I do not identify the net benefit of payday lending across the distribution of borrowers, my results . . . do not speak to the effect on those habitually falling to temptation. In this sense, payday lenders can be both heroes and villains.”). 73. Donald P. Morgan & Michael R. Strain, Defining and Detecting Predatory Lending 3 (Fed. Reserve Bank of N.Y., Working Paper No. 273, 2007), available at http://www.newyorkfed.org/research/staff_reports/sr273.pdf (noting that consumers that are more vulnerable to predatory lending and “happen to live in states that allow unlimited payday loans” are actually “less likely to have missed a debt payment over the previous year”). 74. See Morgan & Strain, supra note 28, at 24 (explaining the results of the study suggest household credit “problems appear less persistent when larger payday loans are available”). 75. See id. at 26 (suggesting states that ban payday lending do not seem better off because “they have bounced more checks, complained more about lenders and debt collectors, and have filed for Chapter 7 (‘no asset’) bankruptcy at a higher rate”).

624 69 WASH. & LEE L. REV. 607 (2012)
state-level bankruptcy data and changes in the regulation of bankruptcy filing, and they too find no evidence that payday lending increases bankruptcy filings.76 However, the use of state-level data may mask any adverse effects on the groups that are allegedly the targets of payday lenders: minorities and the military. Lars Lefgren and Frank McIntyre use zip-code-level data and find no evidence in their cross-sectional regressions that payday lending impacts the bankruptcy filing rate.77 However, they do not test for a possible interaction between payday lending and military and minority communities, and the use of a single time period makes it much more difficult to control for the effect of omitted variables.
III. The Regulation of Payday Lending
Consumer advocacy groups provide thorough summaries of the laws regulating payday lending,78 and so this Part will only outline some basic elements of the law to motivate the tests presented below. Subpart A describes the state laws regulating payday lending, and subpart B describes the federal law.
A. State Regulation
Most states have usury laws that prohibit loans with very high interest rates. Early payday lenders argued that these laws did not apply because they were not making loans and that they were
76. See Stoianovici & Maloney, supra note 28, at 1 (“Using state-level data between 1990 and 2006, we find no empirical evidence that payday lending leads to more bankruptcy filings . . . .”). 77. See Lars Lefgren & Frank McIntyre, Explaining the Puzzle of Cross-State Differences in Bankruptcy Rates, 52 J.L. & ECON. 367, 367 (2009) (revealing, using zip-code-level data, that “payday loan regulations contribute virtually nothing to the cross-state variance in filing rates”). 78. See, e.g., Leah A. Plunkett, Emily Caplan & Nathanael Player, Small Dollar Loan Products Score Card–Updated, NAT’L CONSUMER LAW CTR. 2–4 (May 7, 2010), http://www.nclc.org/images/pdf/high_cost_small_loans/payday_ loans/cu-small-dollar-scorecard-2010.pdf (providing a summary of how states are exercising their authority under state laws involving payday loans, auto-title loans, and other various short-term loans); see also Mann & Hawkins, supra note 4, at 871–80 (providing an overview of laws regulating payday lending).

PAYDAY LENDING 625
charging fees instead of interest.79 Lenders have also sought to evade usury limits by disguising their loans. For example, the Consumers Federation of America claims that a growing number of lenders recharacterize payday loans as short-term Internet access contracts with up-front cash rebates.80
More recently, payday lenders have succeeded in lobbying for explicit regulations that exempt them from standard usury laws.81 These laws vary along several dimensions, including the requirements to obtain a license, the disclosures that a lender must provide to a consumer, the number of times that a lender can “roll over” a loan, and the number of loans that a consumer can have at any one time. Some of these differences could have real effects on consumers, especially in states that have databases that allow the regulator to gather real-time data from all payday lenders. However, this Article will focus solely on whether payday lending is prohibited in a state.
This Article makes use of the time series variation in payday lending. Payday lending has always been illegal in some states and always legal in others due to a lack of usury restrictions. However, the wave of legislation exempting payday lenders from usury laws occurred in the late 1990s and early years of this century, and some states have recently banned payday lending by, for example, capping interest rates at a level at which a lender cannot profitably extend very short-term loans.82 This Article matches these changes to measures of financial distress.
79. See Jean Ann Fox, Unsafe and Unsound: Payday Lenders Hide Behind FDIC Bank Charters to Peddle Usury, CONSUMERS FED’N OF AM. 7 (Mar. 30, 2004, www.consumerfed.org/pdfs/pdlrentabankreport.pdf (“Early payday lenders used inventive schemes to hide the true nature of their loans.”). 80. See id. at 8 (noting that lenders in a growing number of states, such as North Carolina and Indiana, are using the sale of Internet access contracts to disguise their payday lending operations). 81. See id. at 6 (“Payday loan laws enacted in states that also have small loan rate caps and/or usury laws exempt payday loans from application of those laws, granting lenders safe harbor from usury.”). 82. See infra Appendix (providing state laws on payday lending for all fifty states).

626 69 WASH. & LEE L. REV. 607 (2012)
B. Federal Regulation
Many generally applicable consumer lending laws (such as the Truth in Lending Act83) apply to payday loans, and in 2007, Congress prohibited lenders from charging more than 36% interest on loans to military personnel and their dependents.84 However, the most significant federal legislation for the purposes of this Article’s analysis is the ability that federal law grants to federal and state banks to charge interest in excess of the usury limits imposed by the state where the borrower resides. According to the National Bank Act,85 a nationally chartered bank can charge any rate permitted by the state where it is located,86 and the Federal Deposit Insurance Act87 gives state-chartered banks the same right.88 Some lenders partnered with out-of-state banks so that they could lend in states with strict usury limits.89 In 2000 and 2001, the Comptroller of the Currency took steps to prevent nationally chartered banks from forming partnerships with payday lenders, and in 2005, the FDIC adopted regulations designed to discourage state chartered banks from forming these partnerships.90 According to Ronald Mann and 83. See Truth in Lending Act, 15 U.S.C. §§ 1601–1667f (2006) (establishing generally applicable consumer lending laws designed to promote the informed use of consumer credit). 84. See 10 U.S.C. § 987(b) (2006) (stating a creditor “may not impose an annual percentage rate of interest greater than 36 percent with respect to the consumer credit extended to a covered member” of the armed forces or their dependents). 85. See National Bank Act of 1864, 12 U.S.C. §§ 21–216d (2006) (creating a federal–state dual structure banking system in the United States by establishing a system of national charters for banks). 86. See id. § 85 (“Any association may take, receive, reserve, and charge on any loan or discount made, or upon any notes, bills of exchange, or other evidences of debt, interest at the rate allowed by the laws of the State . . . where the bank is located.”); see also Marquette Nat’l Bank v. First Omaha Serv. Corp., 439 U.S. 299, 308 (1978) (noting a designated national bank may charge interest rates governed by federal law). 87. See Federal Deposit Insurance Act, 12 U.S.C. §§ 1811–1831aa (2006) (establishing the Federal Deposit Insurance Corporation to insure the deposits of specified banks and savings associations). 88. See id. § 1831d(a) (stating that “to prevent discrimination against State-chartered insured depository institutions,” state-chartered banks may charge any rate permitted by the state where it is located). 89. See supra note 20 and accompanying text (providing Advance America as an example of a payday lender that is partnering with out-of-state banks). 90. See Mann & Hawkins, supra note 4, at 873 (explaining that the FDIC’s

PAYDAY LENDING 627
Jim Hawkins, “[B]y early 2006, the rent-a-charter era had come to an end.”91
One could argue that payday lending was legal in every state until the FDIC eliminated the partnerships between payday lenders and out-of-state banks. However, this argument almost surely overstates the importance of these partnerships. First, the prior literature suggests that some states, such as New York, were able to effectively prohibit payday lending even before the FDIC reforms by challenging the claim that the out-of-state bank made the payday loan.92 Second, very small firms dominated the payday lending market during the period studied by this Article,93 and these firms may have found it too costly to partner with an out-of-state bank. I therefore conduct two tests. The first uses a measure (Payday) that asks simply whether payday lending was legal under state law in the prior year. The second uses a measure (FDIC) that focuses solely on the change in federal law; this change should have had a much greater impact on counties in states that had laws prohibiting payday lending but were unable to enforce these laws.
IV. Measuring the Effect of Payday Lending
This Article searches for a correlation between the legalization of payday lending and various measures of financial hardship. I use three basic measures: bankruptcy, property crime rates, and landlord–tenant disputes. I focus most heavily on bankruptcy
2005 regulations “do not directly prohibit partnering with third-party payday lenders, [but] they do impose onerous capital requirements” and limit the extensions, deferrals, and renewals for payday loans); Stegman, supra note 1, at 178–79 (discussing the Comptroller of the Currency’s advisories “that promised closer scrutiny and additional examinations of banks and thrifts that were partnering with payday loan companies”). Also, “[i]n July 2003, the FDIC issued its own guidelines for state-chartered banks engaged with payday lenders.” Id. at 179. 91. Mann & Hawkins, supra note 4, at 877. 92. See id. at 879–80 (“What raises our interest, however, is the utter absence of New York locations from the annual reports of the large national providers.”). 93. See id. at 866 (“On the other hand, the majority of stores in the industry are still small shops as large national providers have less than 5000 locations, far less than a quarter of the total stores. The mom-and-pop providers still dominate the market.”).

628 69 WASH. & LEE L. REV. 607 (2012)
because it is the more common measure of financial distress and, as a federal law, has a common meaning across states. Bankrupt consumers can choose to file under Chapter 7 or Chapter 13.94 Chapter 7 offers the consumer a quick discharge of her unsecured debts, but the consumer can only keep assets used as collateral (the car, the home) if her secured creditor consents; Chapter 13 offers the consumer more protection against these secured creditors, but if she is to receive a discharge the consumer must remain in bankruptcy and make payments for three to five years.95 I do not have a strong theory predicting that payday lending should have a different impact depending on the type of bankruptcy, and so I test for the effect on total nonbusiness bankruptcies, nonbusiness Chapter 7 bankruptcies, and Chapter 13 bankruptcies. All measures are expressed per 100,000 individuals.96 I use county-level data from 1998 through 2009 provided by the Administrative Office of the U.S. Courts.97 Bankruptcy is, however, an imperfect measure of financial
94. Consumers can also file under Chapter 11, but very few do. Of the 1,536,799 nonbusiness bankruptcies filed in 2010, just 1,939 (.01%) were filed under Chapter 11. See Admin. Office of the U.S. Cts., Bankruptcy Statistics, http://www.uscourts.gov/Statistics/BankruptcyStatistics.aspx (last visited Apr. 10, 2012) (providing statistics and tables on United States bankruptcy filings dating back as far as the 1990s) (on file with the Washington and Lee Law Review). 95. For a description of these options, see BARRY E. ADLER, DOUGLAS G. BAIRD & THOMAS H. JACKSON, BANKRUPTCY (4th ed. 2007). 96. I used county population estimates from the Bureau of the Census. Bureau of the Census, Population and Housing Unit Estimates (Jan. 5, 2012), http://www.census.gov/popest/estimates.html (last visited Apr. 8, 2012) (on file with the Washington and Lee Law Review). Although I have bankruptcy data for 2010, county population estimates for 2010 were incomplete. I tested both the filing rate and the log of the filing rate, though I do not have a strong theoretical reason to choose one over the other, and the residuals of each type of regression approximate a normal distribution due to the inclusion of both fixed-county and fixed-year effects. The results of the log regressions are similar to those of the untransformed variables and are available upon request. 97. 2010 data is available as well, but I do not have population data for all counties in 2010. Specifically, I use bankruptcies listed in Report F5-A downloaded from PACER. The Administrative Office data lists a small number of filings in the “wrong” jurisdiction. For example, filings for Los Angeles County appear in multiple districts within California. I tried two approaches. First, I simply summed the number of bankruptcies for a given county regardless of where the petition was filed. Second, I used only the highest number of bankruptcies filed in a single district for that county. There is no real difference in the two approaches. Even after converting the data into filing rates (dividing by population), the correlation between the two measures is approximately

PAYDAY LENDING 629
distress. The available evidence suggests that the vast majority of consumers who cannot or will not repay their debts do not file for bankruptcy.98 Many debtors are simply too broke to file; attorneys’ fees average more than $1,000 in Chapter 7, and in some jurisdictions, Chapter 13 attorneys’ fees average $4,000.99 Consumers who take out payday loans may be especially unlikely to file. In 2008, Virginia’s payday lenders charged off 104,832 checks as uncollectible.100 By contrast, Virginians filed 27,580 nonbusiness bankruptcy petitions in 2008,101 and it is likely that many bankrupt debtors never visited a payday lender.
Adair Morse suggests that the presence of payday lending can have a measurable effect on the crime rate.102 I test this by examining the change in the number of burglaries, larcenies, motor vehicle thefts, and all property crimes after the legalization of payday lending.103 All crime rates are expressed per 100,000 residents. Insolvent consumers may have difficulty paying their rent, and I test whether there is a change in the rate of eviction after the legalization of payday lending. Specifically, I look at the
0.995. I therefore present the results for the measure that sums bankruptcies for each county across all districts. 98. See Amanda Dawsey, Richard M. Hynes & Lawrence Ausubel, The Regulation of Non-Judicial Debt Collection and the Consumer’s Choice Among Repayment, Bankruptcy and Informal Bankruptcy 1 (Univ. of Va. Law Sch. Law & Econs. Research Paper Series,Working Paper No. 2009-13, 2009), available at http://papers.ssrn.com/sol3/papers.cfm?abstract_id=1487649 (noting that the “majority of defaulting consumers do not file for bankruptcy”). 99. See U.S. GOV’T ACCOUNTABILITY OFFICE, BANKRUPTCY REFORM: DOLLAR COSTS ASSOCIATED WITH THE BANKRUPTCY ABUSE PREVENTION AND CONSUMER PROTECTION ACT OF 2005 8 (2010), available at http://www.gao.gov/ new.items/d08697.pdf (estimating the average attorneys’ fees for a Chapter 7 and Chapter 13 bankruptcy). 100. BUREAU OF FIN. INSTS., supra note 37, at 7. 101. ADMIN. OFFICE OF U.S. CTS., TABLE F-2: U.S. BANKRUPTCY COURTS–BUSINESS AND NON-BUSINESS BANKRUPTCY CASES COMMENCED BY CHAPTER OF THE BANKRUPTCY CODE, DURING THE 12-MONTH PERIOD ENDED DECEMBER 31, 2008 (2008), available at http://www.uscourts.gov/uscourts/Statistics/Statistical TablesForTheFederalJudiciary/2008/dec08/F02Dec08.pdf. 102. See Morse, supra note 11, at 29 (analyzing whether payday “loans mitigate or exacerbate the effect of financial distress on individuals’ welfare as measured by foreclosures and small property crimes”). 103. The number of these arrests is taken from the Uniform Crime Reporting Program Data, and I use data from 1996–2008. I test total property crimes, larceny, burglary, and motor vehicle thefts.

630 69 WASH. & LEE L. REV. 607 (2012)
number of landlord–tenant disputes in Florida,104 Maryland,105 and North Carolina.106 Litigation rates vary dramatically from state to state due to differences in landlord–tenant and civil procedure rules,107 and the model relies on fixed-county effects to account for many of these differences. North Carolina prohibited payday lending in December of 2005, providing the basis of this test.108 I am also able to make use of the change in FDIC rules, as this change and an increase in penalties for violating usury laws caused some national lenders to withdraw from the North Carolina market.
A. The Effect of Changes in State Laws Regulating Payday Lending
Equation 1: yit=α + β1*Paydayi,t-1 + β2*Unempi,t-1 + β3*(Unempi,t-1)2 + β4*Exempi,t + β5*(Exempi,t)2+ β6*Paydayi,t-1 *Militaryi + β7*Paydayi,t-1 *(Militaryi)2 + β8*Paydayi,t-1 *Minorityi + β9*Paydayi,t-1 *(Minorityi)2 + β10*Paydayi,t-1 *Incl15i+ β11*Paydayi,t-1 *Inc1550 i + β12*BAPCPAi,t *Militaryi + β13* BAPCPAi,t *(Militaryi)2 + β14* BAPCPAi,t *Minorityi
+ β15* BAPCPAi,t *(Minorityi)2 + β16* BAPCPAi,t *Incl15i + β16* BAPCPAi,t *Inc1550 i + ui+vt + eit
I begin first with regressions that focus solely on state laws. Equation 1 presents the full specification. All regressions include fixed-county and fixed-year effects; the fixed-county effects will account for any differences between counties that do not change over time, and the fixed-year effects will account for any macroeconomic shocks or legal changes that affected all counties 104. Statistics for evictions in County Civil Courts in Florida are available at http://trialstats.flcourts.org/. 105. Statistics for District Court landlord–tenant filings in Maryland are available at http://www.courts.state.md.us/publications.html. 106. The North Carolina Courts sent statistics on Summary Ejectment by County by email. Georgia also makes county-level eviction data available, but I do not use it in the presented regressions for reasons described below. 107. For a discussion of these differences, see Richard M. Hynes, Broke But Not Bankrupt: Consumer Debt Collection in State Court, 60 FLA. L. REV. 1 (2008). 108. See Scott A. Hefner, Payday Lending in North Carolina: Now You See It, Now You Don’t, 11 N.C. BANKING INST. 263, 264 (2007) (“On December 22, 2005, Commissioner of Banks, Joseph A. Smith, Jr., put an end to ‘rent-a-charter’ payday lending in North Carolina by holding that the practice violated the North Carolina Consumer Finance Act.”).

PAYDAY LENDING 631
equally. All regressions also include the unemployment rate in the county from the prior year (Unempi,t-1), and regressions that use the bankruptcy filing rate as the dependent variable include the real value (adjusted for inflation) of property exemptions available in the state, which is measured by the exemptions available to married homeowners with two children (Exempi,t).109 To account for any nonlinear effects (e.g., the effect of a ten thousand dollar increase in exemptions may not be equal to ten times the effect of a one thousand dollar increase in exemptions), I include the squared value of these terms. I use the county as the unit of observation, and county population varies tremendously. My regressions are weighted by the county’s population in 2000. All standard errors allow for clustering at the state level.
The regressions include a dummy variable equal to one if payday lending was legal in that state in the prior year (Paydayi,t-1);110 I lag this variable as there is usually some delay between the time of the onset of financial distress and the filing of a bankruptcy petition.111 The coefficient on this dummy variable estimates the change in the measure of financial distress (bankruptcy, crime, or landlord–tenant litigation) after a state legalizes payday lending.
Prior research suggests that payday lenders locate in areas with large military or minority populations.112 If this is correct, we should expect the legalization or prohibition of payday lending to have a disproportionate effect in these areas. I therefore include the interaction between the dummy for payday lending and the percent 109. Many states have exemptions that are limited by type rather than dollar amount. To minimize this problem, I consider only homestead exemptions, automobile exemptions, and exemptions that can be used to exempt cash (“wildcard” exemptions). Unfortunately, a few states have “unlimited” homestead or motor-vehicle exemptions. To address this, I cap the value of a homestead exemption at $500,000 in 2005 and the motor-vehicle exemption at $30,000. For other years, I adjust the caps for inflation. 110. If payday lending were legal in only part of that year, I set the dummy variable equal to that fraction of the year in which payday lending was legal. 111. See, e.g., Ronald J. Mann & Katherine M. Porter, Saving Up for Bankruptcy, 98 GEO. L.J. 289, 292 (2010) (examining “why people file [bankruptcy] when they do and what distinguishes those who choose to file from those who delay or avoid filing”). 112. See supra notes 64–66 and accompanying text (providing research that suggests payday lenders target geographic locations with large military and minority populations).
632 69 WASH. & LEE L. REV. 607 (2012)
of the population in 2000 that was nonwhite (Paydayi,t-1*minorityi) and the percent of the workforce that was in the military (Paydayi,t-
1*militaryi).113 I include the square of each of these values to account for nonlinear effects.
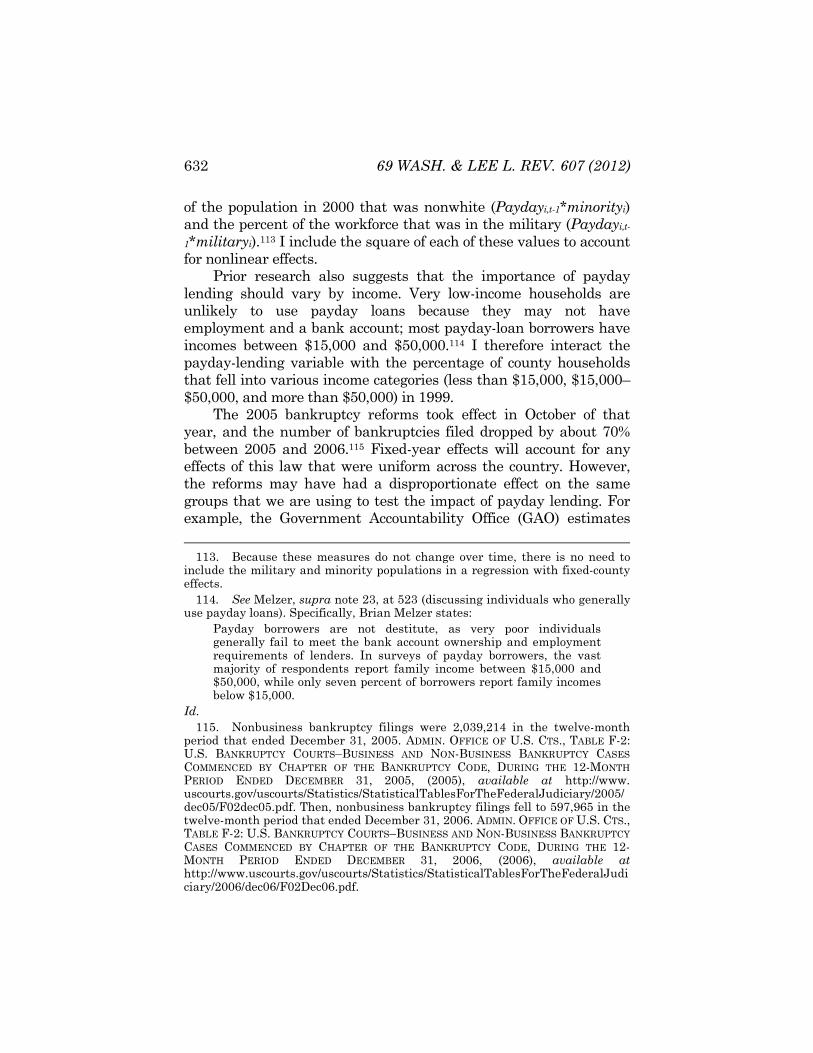
Prior research also suggests that the importance of payday lending should vary by income. Very low-income households are unlikely to use payday loans because they may not have employment and a bank account; most payday-loan borrowers have incomes between $15,000 and $50,000.114 I therefore interact the payday-lending variable with the percentage of county households that fell into various income categories (less than $15,000, $15,000–$50,000, and more than $50,000) in 1999.
The 2005 bankruptcy reforms took effect in October of that year, and the number of bankruptcies filed dropped by about 70% between 2005 and 2006.115 Fixed-year effects will account for any effects of this law that were uniform across the country. However, the reforms may have had a disproportionate effect on the same groups that we are using to test the impact of payday lending. For example, the Government Accountability Office (GAO) estimates 113. Because these measures do not change over time, there is no need to include the military and minority populations in a regression with fixed-county effects. 114. See Melzer, supra note 23, at 523 (discussing individuals who generally use payday loans). Specifically, Brian Melzer states:
Payday borrowers are not destitute, as very poor individuals generally fail to meet the bank account ownership and employment requirements of lenders. In surveys of payday borrowers, the vast majority of respondents report family income between $15,000 and $50,000, while only seven percent of borrowers report family incomes below $15,000.
Id. 115. Nonbusiness bankruptcy filings were 2,039,214 in the twelve-month period that ended December 31, 2005. ADMIN. OFFICE OF U.S. CTS., TABLE F-2: U.S. BANKRUPTCY COURTS–BUSINESS AND NON-BUSINESS BANKRUPTCY CASES COMMENCED BY CHAPTER OF THE BANKRUPTCY CODE, DURING THE 12-MONTH PERIOD ENDED DECEMBER 31, 2005, (2005), available at http://www. uscourts.gov/uscourts/Statistics/StatisticalTablesForTheFederalJudiciary/2005/dec05/F02dec05.pdf. Then, nonbusiness bankruptcy filings fell to 597,965 in the twelve-month period that ended December 31, 2006. ADMIN. OFFICE OF U.S. CTS., TABLE F-2: U.S. BANKRUPTCY COURTS–BUSINESS AND NON-BUSINESS BANKRUPTCY CASES COMMENCED BY CHAPTER OF THE BANKRUPTCY CODE, DURING THE 12-MONTH PERIOD ENDED DECEMBER 31, 2006, (2006), available at http://www.uscourts.gov/uscourts/Statistics/StatisticalTablesForTheFederalJudiciary/2006/dec06/F02Dec06.pdf.

PAYDAY LENDING 633
that the average attorneys’ fees for the simplest form of bankruptcy (Chapter 7) increased by 51% percent,116 and this may have a disproportionate effect on lower-income or minority groups if these groups are more cash constrained. Precisely which groups would be most affected is, however, theoretically ambiguous because the poorest debtors may have already found bankruptcy to be too expensive. One existing empirical paper implies that this theoretical effect may have been practically insignificant. Elizabeth Warren and her co-authors searched the bankruptcy records and found that “those who filed in 2007 largely have the same income profile as those who filed in 2001”;117 they did not find evidence suggesting that the reforms had a disproportionate effect on lower-income households. I still control for a possible disparate effect by interacting a dummy variable that equals after BAPCPA took effect (BAPCPAi,t) with the same variables used to interact with payday lending (minority, military populations, and income).
Table 1 presents summary statistics and Table 2 presents the results. Although my focus is on payday lending, it is worth pausing to note that the coefficients on unemployment take the expected sign and are statistically significant. However, the coefficient on exemptions is not statistically significant. This is roughly consistent with prior literature, which fails to show a robust connection between property exemptions and the filing rate.118 It is also worth noting that the regressions suggest that the effect of the 2005 bankruptcy reforms may have varied significantly by county. In particular, the reforms seem to have had the greatest effect in counties in which a large percentage of households earn between $15,000 and $50,000.
116. See U.S. GOV’T ACCOUNTABILITY OFFICE, supra note 99, at 21 (“Based on our sample of bankruptcy files, we estimate that the average attorney fee for a Chapter 7 case has increased roughly 50 percent since the Bankruptcy Reform Act.”). 117. See Robert M. Lawless et al., Did Bankruptcy Reform Fail? An Empirical Study of Consumer Debtors, 82 AM. BANKR. L.J. 349, 353 (2008) (“The data indicate that those who filed in 2007 largely have the same income profile as those who filed in 2001 . . . .”). The authors of this study stressed the absence of a change in the number of high-income filers rather than the absence of low-income filers. Id. 118. See, e.g., Richard Hynes & Eric Posner, The Law and Economics of Consumer Finance, 4 AM. L. & ECON. REV. 168 (2002) (surveying the literature).

634 69 WASH. & LEE L. REV. 607 (2012)
The regressions presented in Table 2 do not provide overwhelming support for either side of the debate, but they are more consistent with the beneficial view of payday lending than the debt–trap hypothesis. The beneficial view of payday lending predicts that legalization should cause a decrease in bankruptcy filings, and that this decrease should be more pronounced in areas where payday lenders choose to locate—areas with large military, minority, and moderate-income populations. The debt–trap hypothesis predicts the opposite—legalization should increase bankruptcy filings, and this increase should be more pronounced in areas with large military, minority, and moderate income populations. The regression that excludes all interactions (Column 1 of Table 2A) does estimate a positive effect on the bankruptcy filing rate, but this estimate is not statistically significant. From the perspective of the debt–trap hypothesis, all of the interaction terms have the wrong sign. Although the coefficients on the interactions between payday lending and moderate income and minority population variables are not statistically significant, the coefficients on the interaction with the percentage of the workforce in the military are negative and statistically significant. The signs of the interaction terms lend some support to the beneficial view of payday lending. However, to make the claim that the legalization of payday lending decreases bankruptcy filings in areas with large military populations, one must consider the coefficients on Paydayi,t-1, Paydayi,t-1*militaryi, and Paydayi,t-1*(militaryi)2. Column 5 estimates that legalization reduces bankruptcy filings in counties in which the percentage of the workforce is between 2% and 21%. Only five of the 3,109 counties for which I have data have military populations that account for more than 21% of the workforce, and only one of these counties has a population that exceeds 100,000.119 If a county’s workforce were 5% military, the number of nonbusiness bankruptcy filings per 100,000 would fall by between 54% and 87% (12%–19%) after the legalization of payday lending.
Table 2B shows that the results are fairly robust against alternative specifications. Only the coefficients on the interaction between payday lending and military employment are consistently 119. These counties are Chattahoochee, GA (population of 14,990, 60.3%), Liberty, GA (population of 61,448, 27.8%), Pulaski, MO (population of 41,712, 26.9%), Onslow, NC (population of 149,774, 28.2%), and Coryell, TX (population of 75,010, 23.9%).
PAYDAY LENDING 635
significant. The first Column of Table 2B demonstrates that basic results continue to hold when one examines the log of the filing rate. Extremely large counties can have substantial intracounty diversity, and extremely small counties may have too few residents to yield reliable results. Column 1 therefore excludes counties with year 2000 populations that exceed 1,000,000 or fall below 10,000; the results remain largely the same. Military families may also be unusually reluctant to file for bankruptcy; perhaps they are simply more willing to endure the financial distress caused by payday lending without filing. However, the results do not materially change if I reduce the population of each county by the percentage of the workforce that is in the military (Column 3). The bankruptcy reforms of 2005 had a profound effect on bankruptcy practice,120 and the interaction variables and fixed-year effects may not adequately control for these changes. Column 4 therefore excludes all data from after 2004. This exclusion has the added benefit of excluding any effects of the 2007 federal law that prohibits high-interest loans to military personnel.121 The coefficient on the interaction between payday lending and the military population does fall, but it remains negative and significant at the 11% level.122 Column 5 allows for state-specific trends in the bankruptcy filing rate and, again, the basic results do not change. Columns 6 and 7 look only at Chapter 7 filings, and Columns 8 and 9 look only at Chapter 13 filings. It is only if one restricts attention to Chapter 13 filings that the interaction between payday lending and the military population loses its significance.
Table 2C examines the interaction between the legalization of payday lending, the crime rate, and the number of eviction suits. The results are, again, more consistent with the beneficial view of payday lending. The basic specifications suggest that the crime rate (measured by all property crimes, burglary, and larceny) tends to fall after the legalization of payday lending. However, we should expect any effect from the legalization of payday lending to be most 120. See supra note 115 and accompanying text (discussing how nonbusiness bankruptcy filings fell dramatically after the 2005 bankruptcy reforms). 121. See supra note 84 and accompanying text (describing the 2007 federal law prohibiting high-interest loans to military personnel). 122. Because of the negative (but statistically insignificant) coefficient on payday lending alone, Column 4 predicts a negative effect on payday lending over a larger range of military employment—up to about 31%.

636 69 WASH. & LEE L. REV. 607 (2012)
concentrated where these lenders tend to locate, and most of the interaction terms are statistically insignificant. Only the interaction between the legalization of payday lending and the minority population is statistically significant, and this is only true for the regression using burglary as the dependent variable. While these regressions are more consistent with the beneficial view of payday lending, they provide only weak support for this view.
B. The End of the Rent-a-Charter Era
Although the state-law analysis provides little support for the debt–trap hypothesis,123 this may be due to the difficulty of determining the presence of payday lending. Some states that technically prohibited payday lending may have been unwilling to devote the resources necessary to enforce the law. Other states may have wanted to enforce the law but were unable to do so due to the ability of payday lenders to partner with out-of-state banks.124 Finally, states that expect the level of financial distress to increase due to other factors may be less likely to approve payday lending out of a fear that their citizens would be particularly vulnerable. This would bias the results against the debt–trap hypothesis. Of course, states that expect an increase in financial distress due to other factors may be more likely to approve payday lending to increase the availability of credit. This could bias the results in favor of the debt–trap hypothesis; the net direction of the bias is unknown.
This subpart presents the results of an alternative test that is less sensitive to these problems. Specifically, it looks to the FDIC regulatory changes that effectively eliminated the rent-a-charter era.125 This change should have had very little effect in states that allowed payday lending or in states, such as New York, that somehow managed to enforce their payday lending laws before the
123. See supra note 13 and accompanying text (discussing the debt–trap hypothesis and explaining its rationale). 124. See Mann & Hawkins, supra note 4, at 872 (“During the early years of this decade . . . many banks partnered with large national providers so that those providers could use the federal preemptive shelter available to the banks to operate programs that otherwise would have violated state usury laws.”). 125. See supra notes 90–91 and accompanying text (discussing the end of the rent-a-charter era.)

PAYDAY LENDING 637
change.126 This test solves the problem created by the potential effect of financial distress on the choice of payday lending regulation, but it does so at the cost of statistical power. I exclude counties in states that changed their laws regulating payday lending during the window studied. I begin my window in 2003 to reduce the number of states lost. The counties in North Carolina and Pennsylvania are my treated observations.127 Because this test focuses on changes in the laws of just two states, there is more of a risk that the results could be due to omitted variables.
The FDIC action should have had an effect similar to the prohibition of payday lending. To avoid confusion about the meaning of the sign of a variable, I define FDIC to be a dummy variable equal to zero if the FDIC action affected a state in a given year; otherwise, it is equal to one. If payday lending reduces financial distress, the coefficients on FDIC and the interactions with military and minority populations should be negative (as with prior regressions). The FDIC changes should have reduced financial distress in the treated states, and this effect should have been most pronounced in counties with large military and minority populations.
Table 3 examines changes in the bankruptcy filing rate, and the results do not offer significant support for either the beneficial or the detrimental view of payday lending. The most basic specification (Column 1 of Table 3A) once again does not yield a statistically significant estimate of the effect of the legalization of payday lending on bankruptcy filings. Unlike the results of the tests based on changes in state law (Table 2), the coefficients on the interaction between payday lending and large military and minority populations are positive rather than negative. However, only military or minority interaction coefficients in Columns 1, 3, and 5 of Table 3B are statistically significant, and none of the military or minority interaction coefficients in Table 3A are statistically significant. In other words, some of the regressions suggest that the 126. See id. at 880 (finding that “New York has managed to exclude payday lenders . . . through conspicuously aggressive enforcement” of its payday lending laws). 127. Although payday lending has always been illegal in Georgia, the Georgia legislature made payday lending a felony in May of 2004. See GA. CODE ANN. § 16-17-2(d) (2011). I exclude Georgia as a state that changed its laws on payday lending during the relevant period. The results are not very different if one includes Georgia, although a few more coefficients are statistically significant.

638 69 WASH. & LEE L. REV. 607 (2012)
FDIC’s prohibition on the rent-a-charter arrangement reduced bankruptcies in counties with large military or minority populations relative to other counties within the state, but this result does not hold in most specifications. Moreover, four specifications suggest that the FDIC action prohibiting the rent-a-charter arrangements actually increased the number of bankruptcies in areas in which a large percentage of households earn between $15,000 and $50,000—the very households that are likely to frequent payday lenders.128
The regressions using the crime rate or the eviction rate (Table 3C) do not offer clear support for either side in the debate, but they are once again more consistent with the beneficial view of payday lending. Only the larceny-rate regression suggests an increase in the relative crime rate in states affected by the FDIC’s change, though the total property crime rate comes close to significance at the 10% level. Each regression that includes an interaction term suggests that the change in the crime rate was more pronounced in areas with large military or minority populations.
V. Conclusion
The recent debates over payday lending are the latest installment in a centuries-old conflict over high-interest loans. By now, the theoretical arguments are clearly defined. Those who oppose regulation cite the freedom of contract129 or claim that credit can help smooth consumption and mitigate income and expense shocks.130 Those who support regulation claim that high-interest loans ensnare consumers in a debt trap and increase financial
128. See JOHN P. CASKEY, THE ECONOMICS OF PAYDAY LENDING 2 (2002) (“Surveys of payday loan customers find that . . . about half of the customers reported household incomes of between $25,000 and $50,000. The remaining customers were almost equally divided between those with household incomes under $25,000 and those with incomes over $50,000.”). 129. See Todd J. Zywicki, The Economics and Regulation of Bank Overdraft Protection 32–33 (Mercatus Ctr. at George Mason Univ., Working Paper No. 11-41, 2011), available at http://mercatus.org/sites/default/files/publication/ Overdraft_Protection_Zywicki10.24.11.pdf (arguing that “freedom of contract is most likely more efficient than regulation” to protect consumers from high-interest payday loans). 130. See supra notes 10–12 and accompanying text (referencing and discussing scholarly works that propound the benefits of payday lending).

PAYDAY LENDING 639
hardship.131 Still others maintain that regulation is likely to be ineffective because consumers and lenders will find ways to evade the law.132 Given the theoretical ambiguity, empirical tests can play an important role in guiding policymakers. Unfortunately, the existing empirical tests are inconclusive. Some studies find that payday loans increase signs of financial distress, some find that they reduce signs of distress, and still others fail to find a statistically significant effect.133
This Article uses the claim that payday lenders target military and minority populations to test the relationship between payday lending and evidence of financial hardship. The results are similarly mixed. Consistent with the beneficial view of payday lending, this Article finds that as states legalize payday lending the bankruptcy filing rate tends to fall in counties with large military populations. While this result is robust against a variety of alternative specifications, I failed to find a statistically significant effect in areas with large minority populations.
I supplement this first test with another that examines the effect of the FDIC’s efforts to end the partnership between banks and payday lenders in 2005.134 This move should have had the effect of banning payday lending in some states where payday lending was otherwise legal. These results provide less support for the beneficial view of payday lending, but they do not support the debt–trap hypothesis either. On balance, the results do not suggest that the FDIC’s reform caused a statistically significant change in bankruptcy filing rates in counties with large military or minority populations.
131. See supra note 13 and accompanying text (discussing the debt–trap hypothesis and explaining its rationale). 132. See supra notes 15–16 and accompanying text (describing how some scholars take an agnostic view of payday lending and arguing that both lenders and consumers find ways to evade payday lending laws). 133. See supra notes 55–77 and accompanying text (discussing prior empirical research on payday lending and the policy perspectives that each supports). 134. See supra notes 20–21 and accompanying text (discussing the effects of the FDIC’s 2005 regulatory efforts to end the partnerships between banks and payday lenders).

640 69 WASH. & LEE L. REV. 607 (2012)
Tables
Table 1: Summary Statistics (Weighted by County Population in 2000) Variable Obs. Mean Std. Dev.
Payday: One if payday lending legal in prior year (1998–2009) 40,417 0.59 0.49 Nonbusiness bankruptcies per 100,000 37,296 455 249 Chapter 7 nonbusiness bankruptcies per 100,000 37,296 323 181 Chapter 13 bankruptcies per 100,000 37,296 131 140 Property crime arrests per 100,000 40,411 535 311 Burglary arrests per 100,000 40,411 96 66 Larceny arrests per 100,000 40,411 389 247 Motor vehicle theft arrests per 100,000 40,411 45 44 Landlord tenant suits in lower court per 100,000 1,701 3,032 6,208 Unemployment rate in prior year 34,174 5.00 1.84 Exemptions: Sum of homestead and personal property exemptions available to married couples in tens of thousands of 2008 dollars with caps on unlimited exemptions 49,278 16.81 20.41 Military: military as percent of civilian and government workforce 3,109 0.53 1.83 Minority: Nonwhite as percent of population 3,109 24.9 17.1 Inc.<15: percent of households with income less than$15,000 in 1999 3,109 16 6 Inc.15–50: percent with income between $15,000 and $50,000 3,109 42 7 Inc.>50: percent with income greater than $50,000 3,109 42 12
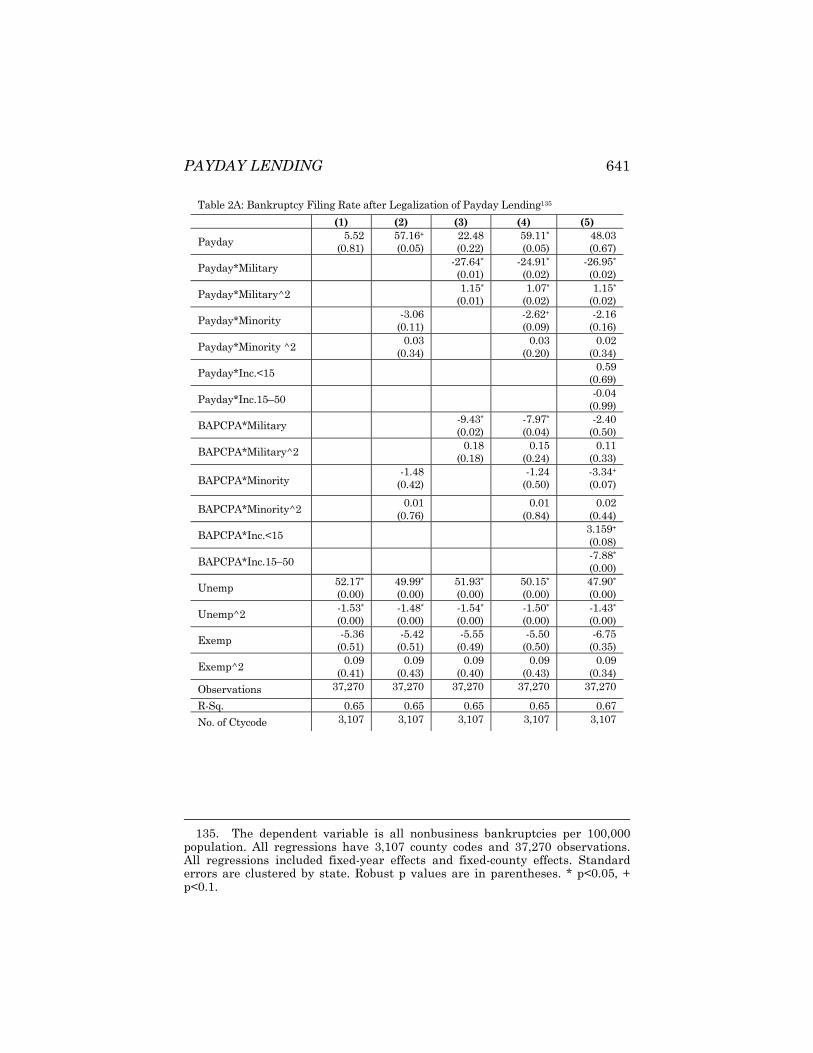
PAYDAY LENDING 641
Table 2A: Bankruptcy Filing Rate after Legalization of Payday Lending135 (1) (2) (3) (4) (5)
Payday 5.52 (0.81)
57.16+ (0.05)
22.48 (0.22)
59.11* (0.05)
48.03 (0.67)
Payday*Military -27.64* (0.01)
-24.91* (0.02)
-26.95* (0.02)
Payday*Military^2 1.15* (0.01)
1.07* (0.02)
1.15* (0.02)
Payday*Minority -3.06 (0.11)
-2.62+ (0.09)
-2.16 (0.16)
Payday*Minority ^2 0.03 (0.34)
0.03 (0.20)
0.02 (0.34)
Payday*Inc.<15 0.59 (0.69)
Payday*Inc.15–50 -0.04 (0.99)
BAPCPA*Military -9.43* (0.02)
-7.97* (0.04)
-2.40 (0.50)
BAPCPA*Military^2 0.18 (0.18)
0.15 (0.24)
0.11 (0.33)
BAPCPA*Minority -1.48
(0.42) -1.24
(0.50) -3.34+ (0.07)
BAPCPA*Minority^2 0.01 (0.76)
0.01 (0.84)
0.02 (0.44)
BAPCPA*Inc.<15 3.159+ (0.08)
BAPCPA*Inc.15–50 -7.88* (0.00)
Unemp 52.17* (0.00)
49.99* (0.00)
51.93* (0.00)
50.15* (0.00)
47.90* (0.00)
Unemp^2 -1.53* (0.00)
-1.48* (0.00)
-1.54* (0.00)
-1.50* (0.00)
-1.43* (0.00)
Exemp -5.36 (0.51)
-5.42 (0.51)
-5.55 (0.49)
-5.50 (0.50)
-6.75 (0.35)
Exemp^2 0.09 (0.41)
0.09 (0.43)
0.09 (0.40)
0.09 (0.43)
0.09 (0.34)
Observations 37,270 37,270 37,270 37,270 37,270
R-Sq. 0.65 0.65 0.65 0.65 0.67 No. of Ctycode 3,107 3,107 3,107 3,107 3,107
135. The dependent variable is all nonbusiness bankruptcies per 100,000 population. All regressions have 3,107 county codes and 37,270 observations. All regressions included fixed-year effects and fixed-county effects. Standard errors are clustered by state. Robust p values are in parentheses. * p<0.05, + p<0.1.

642 69 WASH. & LEE L. REV. 607 (2012)
Tabl
e 2B
: Ban
krup
tcy
Filin
g Ra
te A
fter L
egal
izat
ion
of P
ayda
y Le
ndin
g (P
ayda
y)13
6
(9)
Ch.
13
-28.
95
(0.3
0)
-4.0
9 (0
.47)
0.15
(0
.50)
-0.1
6 (0
.79)
0.00
(0
.65)
-0.4
6 (0
.68)
0.91
(0
.29)
37,2
70
0.25
3,10
7
(8)
Ch.
13
-0.5
7 (0
.95)
32,2
7 0
0.20
3,10
7
(7)
Ch. 7
78.4
1 (0
.48)
-22.
89*
(0.0
2)
1.00
4*
(0.0
1)
-2.0
1 (0
.13)
0.02
(0
.42)
1.09
(0
.45)
-0.9
9 (0
.61)
32,2
70
0.69
3,10
7
(6)
Ch. 7
6.26
(0
.80)
37,2
7 0
0.68
3,10
7
(5)
Stat
e Tr
ends
-50.
86
(0.4
0)
-16.
47+
(0.0
8)
0.72
1*
(0.0
4)
-0.2
8 (0
.86)
-0.0
1 (0
.61)
3.39
(0
.12)
0.66
(0
.69)
37,2
70
0.70
3,10
7
(4)
Pre-
2005
-130
.90
(0.3
6)
-17.
96
(0.1
0)
0.70
5+
(0.0
7)
0.43
(0
.74)
-0.0
2 (0
.30)
4.06
* (0
.04)
2.57
(0
.42)
21,7
49
0.39
3,10
7
(3)
Non
-M
ilita
ry
46.6
3 (0
.68)
-26.
39*
(0.0
2)
1.13
6*
(0.0
2)
-2.1
6 (0
.16)
0.02
(0
.33)
0.57
(0
.70)
-0.0
1 (1
.00)
37,2
70
0.67
3,10
7
(2)
“Med
ium
” Co
untie
s
-1.4
9 (0
.99)
-23.
47*
(0.0
2)
1.00
3*
(0.0
2)
-2.1
4 (0
.21)
0.02
(0
.37)
0.25
(0
.87)
0.95
(0
.54)
28,7
50
0.68
2,39
7
(1)
Log
of
Filin
g Ra
te
0.24
(0
.45)
-0.0
5*
(0.0
1)
0.00
3*
(0.0
1)
0.00
(0
.39)
0.00
(0
.83)
0.00
9*
(0.0
3)
-0.0
1 (0
.35)
36,9
57
0.78
3,10
7
Payd
ay
Payd
ay
*Mili
tary
Payd
ay
*Mili
tary
^2
Payd
ay
*Min
ority
Payd
ay
*Min
ority
^2
Payd
ay
*Inc
.<15
Payd
ay
*Inc
. 15K
to
50K
Obs
erva
tions
R-Sq
uare
d
No.
of
Ctyc
ode
136. The dependent variable in Column 1 uses the log of the bankruptcy filing rate. Column 2 excludes counties with a population in the year 2000 that was either greater than 1,000,000 or less than 10,000. Column 3 multiplies the bankruptcy filing rate by the percent of employment that is nonmilitary. Column 4 uses only data from before 2005. Column 5 includes state-specific trends as explanatory variables. Columns 6 and 7 examine the Chapter 7 filing rate and Columns 8 and 9 examine the Chapter 13 filing rate. All regressions included fixed-year effects and fixed-county effects as well as the unemployment rate, exemptions, and the square of the unemployment rate and exemptions. Regressions that include data from 2005 and after include interactions with BAPCPA. Standard errors are clustered by county. Robust p values are in parentheses. * p<0.05, + p<0.1.

PAYDAY LENDING 643
Tabl
e 2C
: Leg
aliz
atio
n of
Pay
day
Lend
ing
and
Oth
er P
roxi
es fo
r Dis
tres
s137
(10)
Evic
tion
Suits
-814
.9*
(0.0
4)
-31.
83
(0.1
0)
(0.1
1)
6.73
(0
.29)
-0.0
7 (0
.27)
0.82
(0
.88)
15.4
6 (0
.20)
1,70
1
0.08
189
(9)
20.9
0 (0
.85)
1,70
1
0.06
189
(8)
Mot
or V
ehic
le
Thef
t
10.8
2 (0
.57)
0.27
(0
.87)
-0
.01
(0.8
5)
-0.2
5 (0
.54)
0.00
(0
.81)
0.13
(0
.80)
-0.1
4 (0
.78)
40,3
84
0.11
3,10
8
(7) -1.3
9 (0
.71)
40,3
84
0.10
3,10
8
(6)
Larc
eny
79.1
8 (0
.30)
-2.9
9 (0
.58)
0.
24
(0.2
9)
-2.2
6 (0
.28)
0.01
(0
.62)
3.37
(0
.28)
-2.9
3 (0
.25)
40,3
84
0.18
3,10
8
(5)
-41.
34*
(0.0
3)
40,3
84
0.17
3,10
8
(4)
Burg
lary
21.5
9*
(0.0
3)
0.40
(0
.75)
0.
01
(0.8
2)
-0.6
74*
(0.0
2)
0.00
(0
.55)
0.12
(0
.87)
-0.4
8 (0
.22)
40,3
84
0.13
3,10
8
(3)
-12.
74*
(0.0
0)
40,3
84
0.12
3,10
8
(2)
All P
rope
rty
Crim
e 110.
30
(0.2
4)
-2.4
9 (0
.66)
0.
24
(0.3
3)
-3.1
8 (0
.20)
0.02
(0
.65)
3.59
(0
.31)
-3.5
1 (0
.22)
40,3
84
0.20
3,10
8
(1)
-56.
05
(0.0
1)
40,3
8 4
0.19
3,10
8
Vari
able
s
Payd
ay
Payd
ay*
Mili
tary
Pa
yday
* M
ilita
ry^2
Payd
ay*
Min
ority
Payd
ay*M
inor
ity^
2 Payd
ay*I
nc.<
15K
Payd
ay*
Inc.
15K
to
50K
Obs
erva
tions
R-sq
uare
d
No.
of C
tyco
de
137. All dependent variables are expressed per 100,000 population. All regressions included fixed-year effects, fixed-county effects, the unemployment rate and the square of the unemployment rate, and interactions with BAPCPA. Standard errors are clustered by county. Robust p values are in parentheses. * p<0.05, + p<0.1.

644 69 WASH. & LEE L. REV. 607 (2012)
Table 3A: Bankruptcy Filing Rate After FDIC’s Act to End “Rent-A-Charter” Era138
(1) (2) (3) (4) (5)
FDIC 43.25 (0.17)
-14.37 (0.53)
40.74 (0.21)
358.1* (0.00)
319.5* (0.00)
FDIC*Military 6.95
(0.18)
4.53 (0.55)
FDIC*Military^2 -0.30 (0.23)
0.01
(0.97)
FDIC*Minority 2.05
(0.33)
0.13 (0.95)
FDIC*Minority^2 0.01
(0.65)
0.02 (0.31)
FDIC*Inc.<15K 7.52+ (0.08)
4.27+ (0.10)
FDIC* Inc. 15–50 -10.32* (0.00)
-8.70* (0.00)
Observations 18,095 18,095 18,095 18,095 18,095
R-squared 0.74 0.75 0.74 0.77 0.77
No. of Ctycode 2,587 2,587 2,587 2,587 2,587
138. The dependent variable is all nonbusiness bankruptcies per 100,000 population. All regressions included fixed-year effects, fixed-county effects, the unemployment rate, exemptions, the square of the unemployment rate and exemptions, and interactions with BAPCPA. Standard errors are clustered by state. Robust p values are in parentheses. * p<0.05, + p<0.1.

PAYDAY LENDING 645
Table 3B: Bankruptcy Filings After FDIC’s Act to End “Rent-A-Charter” Era139 (1) (2) (3) (4) (5) (6) (7)
Log of Filing Rate
“Medium” Counties
State Trends Ch. 7 Ch. 7 Ch. 13 Ch. 13
FDIC 0.40
(0.16) 230.7*
(0.00)7.36
(0.96)4.03
(0.88)211.9+
(0.06)45.73* (0.00)
26.31 (0.76)
FDIC*Military 0.01
(0.44) 8.41
(0.11)9.35*
(0.00)14.34*
(0.02) -0.95
(0.71)
FDIC*Military^2 0.00
(0.82) -0.09
(0.66)-0.11
(0.20)-0.388+
(0.07) 0.02
(0.79)
FDIC*Minority 0.00585*
(0.08) 0.18
(0.93)2.80
(0.13)0.26
(0.89) 0.60
(0.48)
FDIC*Minority^2 0.00
(0.26) -0.02
(0.65)-0.04
(0.12)-0.01
(0.74) 0.01
(0.25)
FDIC*Inc.<15 0.01
(0.22) 0.28
(0.91)6.27*
(0.02)2.90
(0.22) 2.10* (0.07)
FDIC* Inc. 15–50 -0.01
(0.14) -5.39*
(0.00)-3.61
(0.22)-6.28*
(0.00) -0.93
(0.69) Observations 18,981 13,601 19,208 18,095 18,095 19,208 19,208
R-Squared 0.861 0.768 0.817 0.763 0.793 0.298 0.343
No. of Ctycode 2,745 1,945 2,746 2,587 2,587 2,746 2,746
139. The dependent variable in Column 1 uses the log of the bankruptcy filing rate. Column 2 excludes counties with a population in the year 2000 that was either greater than 1,000,000 or less than 10,000. Column 3 includes state-specific trends as explanatory variables. Column 4 and 5 examine the Chapter 7 filing rate and Column 6 and 7 examine the Chapter 13 filing rate. All regressions included fixed-year effects and fixed-county effects as well as the unemployment rate, exemptions, and the square of the unemployment rate and exemptions. Standard errors are clustered by county. Robust p values are in parentheses. * p<0.05, + p<0.1.
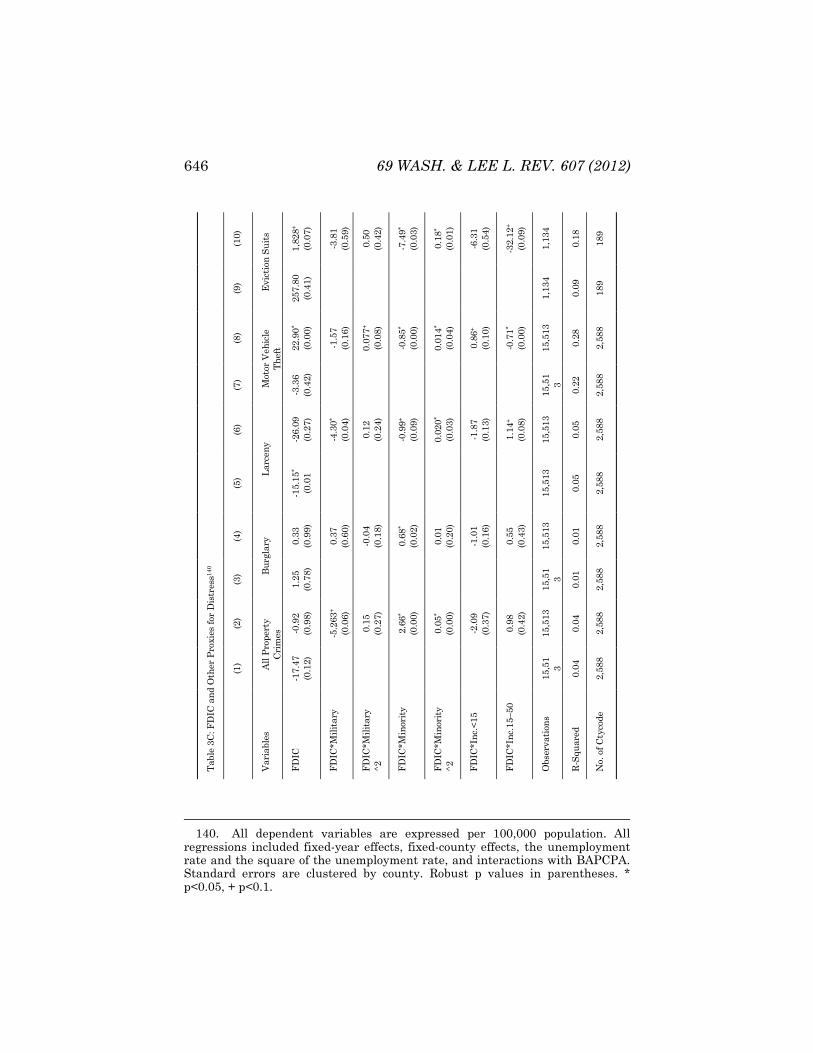
646 69 WASH. & LEE L. REV. 607 (2012)
Ta
ble
3C: F
DIC
and
Oth
er P
roxi
es fo
r D
istr
ess1
40
(10)
Evic
tion
Suits
1,82
8+
(0.0
7)
-3.8
1 (0
.59)
0.50
(0
.42)
-7.4
9*
(0.0
3)
0.18
* (0
.01)
-6.3
1 (0
.54)
-32.
12+
(0.0
9)
1,13
4
0.18
189
(9)
257.
80
(0.4
1)
1,13
4
0.09
189
(8)
Mot
or V
ehic
le
Thef
t 22.9
0*
(0.0
0)
-1.5
7 (0
.16)
0.07
7+
(0.0
8)
-0.8
5*
(0.0
0)
0.01
4*
(0.0
4)
0.86
+ (0
.10)
-0.7
1*
(0.0
0)
15,5
13
0.28
2,58
8
(7)
-3.3
6 (0
.42)
15,5
13 0.22
2,58
8
(6)
Larc
eny -2
6.09
(0
.27)
-4.3
0*
(0.0
4)
0.12
(0
.24)
-0.9
9+
(0.0
9)
0.02
0*
(0.0
3)
-1.8
7 (0
.13)
1.14
+ (0
.08)
15,5
13
0.05
2,58
8
(5)
-15.
15*
(0.0
1
15,5
13
0.05
2,58
8
(4)
Burg
lary
0.33
(0
.99)
0.37
(0
.60)
-0.0
4 (0
.18)
0.68
* (0
.02)
0.01
(0
.20)
-1.0
1 (0
.16)
0.55
(0
.43)
15,5
13
0.01
2,58
8
(3)
1.25
(0
.78)
15,5
13 0.01
2,58
8
(2)
All P
rope
rty
Crim
es -0.9
2 (0
.98)
-5.2
63+
(0.0
6)
0.15
(0
.27)
2.66
* (0
.00)
0.05
* (0
.00)
-2.0
9 (0
.37)
0.98
(0
.42)
15,5
13
0.04
2,58
8
(1)
-17.
47
(0.1
2)
15,5
13 0.04
2,58
8
Vari
able
s
FDIC
FDIC
*Mili
tary
FDIC
*Mili
tary
^2
FDIC
*Min
ority
FDIC
*Min
ority
^2
FDIC
*Inc
.<15
FDIC
*Inc
.15–
50
Obs
erva
tions
R-Sq
uare
d
No.
of C
tyco
de
140. All dependent variables are expressed per 100,000 population. All regressions included fixed-year effects, fixed-county effects, the unemployment rate and the square of the unemployment rate, and interactions with BAPCPA. Standard errors are clustered by county. Robust p values in parentheses. * p<0.05, + p<0.1.

PAYDAY LENDING 647
Table 4: State Laws on Payday Lending
State Legal in Period Citation AL 6/30/2003 ALA. CODE § 5-18A-1 et seq. (2011). AK 1/1/2005 ALASKA STAT. § 06.50.400 (2011) AZ 4/1/2000–
7/1/2010 ARIZ. REV. STAT. ANN. § 6-1251 (2011); http://www.azdfi.gov/ news/AG_Letter_to_Payday_Lenders_060910.pdf.
AR 4/7/1999–3/18/2008
ARK. CODE ANN. § 23-52-101 et seq. (2011); ARK. CONST. of 1874, art. XIX, § 13 (repealed 2011); http://www.paydayloaninfo.org/elements/www.payday loaninfo.org/File/08_07_attorney_general.pdf.
CA 1/1/1997 CAL. FIN. CODE §§ 23000–23106 (2011). CO 7/1/2000 COLO. REV. STAT. § 5-3.1-101 (2011). CT Never CONN. GEN. STAT. § 36A-563 (2011). DE Always Delaware enacted licensing legislation effective 7/9/2002. DEL. CODE
ANN. tit. 5, §§ 2227 et seq., 2744 (2011). I code Delaware as always allowing payday lending due to an alleged lack of effective usury limits on small loans. http://www.consumerfed.org/pdfs/safeharbor.pdf.
FL Always FLA. STAT. ANN. § 560.401 et seq. (2011); FLA. ADMIN. CODE ANN. r. 69V-560.901 et seq. (2011). I code Florida as always allowing payday lending because prior law did allow check cashers to charge fees for cashing postdated checks. http://www.consumerfed.org/pdfs/safeharbor.pdf.
GA Never Though payday lending has always been illegal in Georgia, the state did pass legislation effective in May of 2004 that made the practice a felony. GA. CODE ANN. §§ 16-17-1 to -10 (2011).
HI 7/1/1999 HAW. REV. STAT. ANN. § 480F-1 et seq. (2011). ID Always Idaho enacted legislation effective 7/1/2003. IDAHO CODE ANN. § 28-
46-401 et seq. (2011). I code Idaho as always allowing payday lending due to an alleged lack of effective usury limits on small loans. http://www.consumerfed.org/pdfs/safeharbor.pdf.
IL Always Illinois enacted legislation effective 12/6/2005. 815 ILL. COMP. STAT. ANN. 122/1-1 et seq. (2011). I code Illinois as always allowing payday lending due to an alleged lack of effective usury limits on small loans. http://www.consumerfed.org/pdfs/safeharbor.pdf.
IN Always Ind. Code Ann. § 24-4.5-7-101 et seq. (effective 3/14/2002). I code Indiana as always allowing payday lending because prior law allowed the lender to assess minimum fees of $33. http://www.consumerfed.org/pdfs/safeharbor.pdf.
IA Always IOWA CODE ANN. § 533D.1 et seq. (2011). KS Always KAN. STAT. ANN. § 16A-2-404 (2011). KY Always KAN. STAT. ANN. § 16A-2-404 (2011). LA 8/15/1997 Act of June 11, 1997, no. 41, § 1, 1997 La. Acts 1, 132, repealed by Act
of July 12, 1999, no. 1315, ch. 2-A, 1999 La. Acts 2671, 3529; LA. CONST. of 1974, art. III, § 19.
ME Never ME. REV. STAT. ANN. tit. 9-a, § 2-401 (2011); ME. REV. STAT. ANN. tit. 32, § 6138 (2011).
MD Never MD. CODE ANN., COM. LAW § 12-306(a)(2)(i) (2011). MA Never MASS. GEN. LAWS ANN. ch. 140, § 96 (2011). MI 11/28/2005 MICH. COMP. LAWS § 487.2121 et seq. (2011). MN Always legal MINN. STAT. ANN. § 47.60 (2011). MS 7/1/1998 MISS. CODE ANN. § 75-67-501 et seq. (2011).

648 69 WASH. & LEE L. REV. 607 (2012)
State Legal in Period Citation MO Always legal MO. ANN. STAT. § 408.500 et seq. (2011); MO. CODE REGS. ANN. tit. 4,
§ 140-11.010 et seq. (2011). MT Always legal MONT. CODE ANN. § 31-1-701 et seq. (2011). I code Montana as always
allowing payday lending due to an alleged lack of effective usury limits on small loans. http://www.consumerfed.org/pdfs/safeharbor.pdf.
NE Always legal NEB. REV. STAT. § 45-904 (2011). NV 7/1/1998 NEV. REV. STAT. § 604.010 et seq. (2010), repealed by NEV. REV. STAT.
§ 604A.010 et seq. (2010). NH 1/1/2000–
1/1/2009 N.H. REV. STAT. ANN. § 399-A:1 et seq. (2011).
NJ Never N.J. STAT. ANN. § 2C:21-19 (2011). NM Always legal N.M. STAT. ANN. § 58-15-33 (2011). I code New Mexico as always
allowing payday lending due to an alleged lack of effective usury limits on small loans. http://www.consumerfed.org/pdfs/safeharbor.pdf.
NY Always illegal N.Y. PENAL LAW § 190.40 (2011). NC 10/1/1997–
8/31/1997 N.C. GEN. STAT. § 53-281 (2011), amended by Act of July 31, 2001, ch. 323, § 1, 2001 N.C. Sess. Laws 1, 960 (expired 2001).
ND 4/19/2001 N.D. CENT. CODE § 13-08-01 et seq. (2011), amended by Act of Apr. 11, 2005, ch. 127, 2005 N.D. Laws 1, 661.
OH 9/1/2008 OHIO REV. CODE ANN. § 1315.35 et seq. (repealed 2008). OK 9/1/2003 OKLA. STAT. ANN. tit. 59, § 3101 et seq. (2011). OR Prohibited
7/1/2007 OR. REV. STAT. § 725.625 (2011), repealed by Act of June 26, 2007, ch. 603, § 11, 2007 Or. Laws 993, 1569 (2007).
PA Never 7 PA. STAT. ANN. § 6213 (2011). RI 7/1/2001 R.I. GEN. LAWS ANN. §§ 19-14.4-1, -4 (2011), amended by Act of July 9,
2005, ch. 230, § 1, 2005 R.I. Pub. Laws 755, 1302. SC 6/11/1998 S.C. CODE ANN. § 34-39-110 et seq. (2011). SD Always S.D. CODIFIED LAWS § 54-4-36 et seq. (2011). I code South Dakota as
always allowing payday lending due to a lack of an effective small loan usury cap. http://www.consumerfed.org/pdfs/safeharbor.pdf
TN 10/1/1997 TENN. CODE ANN. § 45-17-101 et seq. (2011); TENN. COMP. R. & REGS. 0180-28-.01 (2011).
TX 9/1/1997 TEX. FIN. CODE ANN. § 342.251 et seq. (2011). Industry trade groups list Texas as having unfavorable payday lending laws, but consumer advocacy groups list Texas as having laws that are too favorable to payday lending. The results are robust against a recoding of Texas as prohibiting payday lending.
UT Always Utah enacted payday lending legislation effective 5/3/1999. UTAH CODE ANN. § 7-23-101 et seq. (2011). I code Utah as always allowing payday lending due to a lack of effective usury laws. http://www.consumerfed.org/pdfs/safeharbor.pdf.
VT Never VT. STAT. ANN. tit. 9, § 41a (2011). VA 7/1/2002 VA. CODE ANN. § 6.2-1800 et seq. (2011). WA Always WASH. REV. CODE § 31.45.010 et seq. (2011). WV Never W. VA. CODE § 46A-4-107(2) (2011). WI Always WIS. STAT. §§ 138.04, .05 (2011). WY 7/1/1996 WYO. STAT. ANN. § 40-14-362 et seq. (2011).