PAY IT FORWARD - Miss Wallace's Classroommisswallacesclassroom.weebly.com/uploads/4/9/6/7/...watch a...
29
PAY IT FORWARD Name ______________________________ Hour _________ Due Date __________ Score _______ / _______ We will begin the year by discussing exactly what geography and 8th grade social studies will be about. We will watch a clip from the movie Pay it Forward to help us begin to understand the importance of social studies to our everyday lives. Along with the clip of the movie, we will answer questions and discuss the world around us. This is also an opportunity for the class to begin to contribute and share ideas in an orderly fashion. Before watching the clips, think about and answer the following. 1. What is social studies? 2. Why, if at all, do you think it is important to learn social studies? 3. What, if anything, would you like to or expect to learn in this social studies class? After or while watching the clips, answer the following questions: 1. What do you think Mr. Simonet means by the “Middle School Bridge?” 2. How does Mr. Simonet describe social studies? 3. Do you believe it is true that the world expects nothing of 11 year olds? Explain. 4. What do you think about Trevor’s idea to change the world. Do you think it would work? Explain 1
Transcript of PAY IT FORWARD - Miss Wallace's Classroommisswallacesclassroom.weebly.com/uploads/4/9/6/7/...watch a...

PAY IT FORWARD Name ______________________________ Hour _________ Due Date __________ Score _______ / _______
We will begin the year by discussing exactly what geography and 8th grade social studies will be about. We will watch a clip from the movie Pay it Forward to help us begin to understand the importance of social studies to our everyday lives. Along with the clip of the movie, we will answer questions and discuss the world around us. This is also an opportunity for the class to begin to contribute and share ideas in an orderly fashion. Before watching the clips, think about and answer the following.
1. What is social studies?
2. Why, if at all, do you think it is important to learn social studies?
3. What, if anything, would you like to or expect to learn in this social studies class?
After or while watching the clips, answer the following questions:
1. What do you think Mr. Simonet means by the “Middle School Bridge?”
2. How does Mr. Simonet describe social studies?
3. Do you believe it is true that the world expects nothing of 11 year olds? Explain.
4. What do you think about Trevor’s idea to change the world. Do you think it would work? Explain
1

4
WHAT ARE CONTINENTS?
Name ______________________________ Hour _________ Due Date __________ Score _______ / _______
With all the drifting and crashing of the continents, it’s a wonder they’ve stood still long enough for people to give them names. The breakup of the ancient super continents left us with seven so-called continents. They are defined as the large unbroken masses of land into which the Earth’s surface is divided. But that provides a lot of leeway and provokes some logical questions. Is Europe really a continent? Why isn’t India one? How can islands be a part of a continent if they’re not connected to the mainland?
From ancient times to relatively recent ones, people acknowledged only three continents: Europe, Asia, and Africa. The next two, North and South America, weren’t recognized until after Columbus’s voyages although evidence proves travelers had visited the America’s prior to Columbus. Australia and Antarctica, which existed only in theory as Terra Australia Icognita since the time of Ptolemy, went undiscovered and unmapped by Europeans for centuries. Australia wasn’t named and put on the maps until the nineteenth century. Antarctica was discovered in 1820, when Nathanial Palmer, an American whaling captain found islands off the mainland, and a Russian admiral named von Bellingshausen reached the continental mainland of Antarctica in 1821.
Use the map below to label the seven continents and four oceans.
2
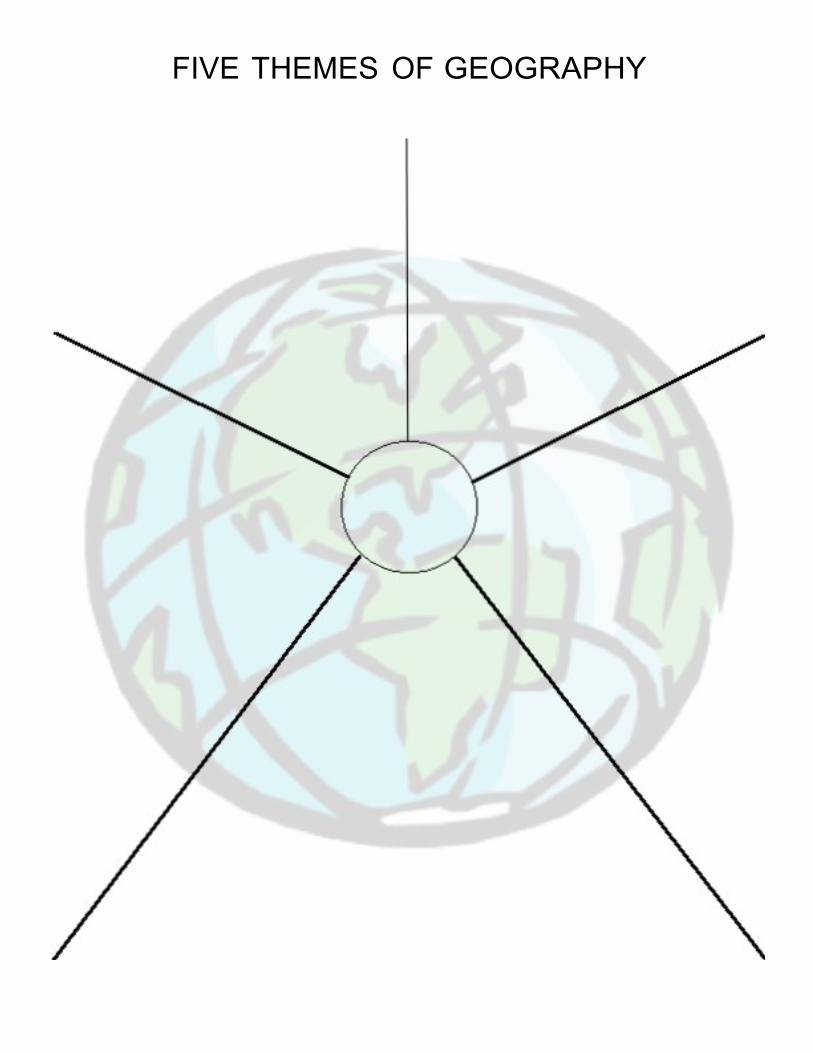
FIVE THEMES OF GEOGRAPHY

DIRECTION AND DISTANCE ACTIVITY
Name ______________________________ Hour _________ Due Date __________ Score _______ / _______
Have you ever drawn a map in the dirt to show someone where you live? Such drawings were some of the earliest maps. Other early maps were made of sticks tied together, or pieces of wood sewn to a piece of sealskin. People have used maps for thousands of years to show where places are, how far it is from one place to another, and the direction to travel to get from here to there. Maps are important tools. Maps tell us where to catch a bus and where that bus will take us. Maps help us find our friend’s house in a part of town or state to which we are moving.
Direction is one of the most important things we can learn from a map. You use direction every day- left, right, forward, back, up, down. But these directions depend on where you are and which way you are facing. Maps use the directions north, south, east, and west. These directions don’t change. North will always be towards the north pole of the earth. If you stand facing the north pole, east will be to your right. West will be to your left. South will be behind you.
Usually, north will be at the top of a map. However, this is not always true. You must check to be sure. Mapmakers use a compass rose or north arrow to show directions. In this class we will also call the indication of direction by the term orientation. If there is no compass rose or north arrow, or other symbol north should be at the top of the map. All maps that we will make as a class must include some form of orientation.
Fill in the missing directions on these compass roses. Notice that north is not always in the same place.
N N SW
S A map is a drawing of part of the earth. Maps are drawn so that a certain distance on the map represents a much larger distance on the earth. This makes it possible to show the whole earth on a piece of paper the size of this page. Not all maps are the size of this page, of course. Look at the maps on the wall of the classroom. Each map is a different size and shows a different size area of the earth’s surface. What ties them all together is fact that they show the same earth. In order to tell us what distance they represent, each map must have a scale. Here are some examples of map scales. Notice that all lines are the same length, but that each line represents a different distance.
0 Miles
0 Miles
0 Miles
1
200 1000
4
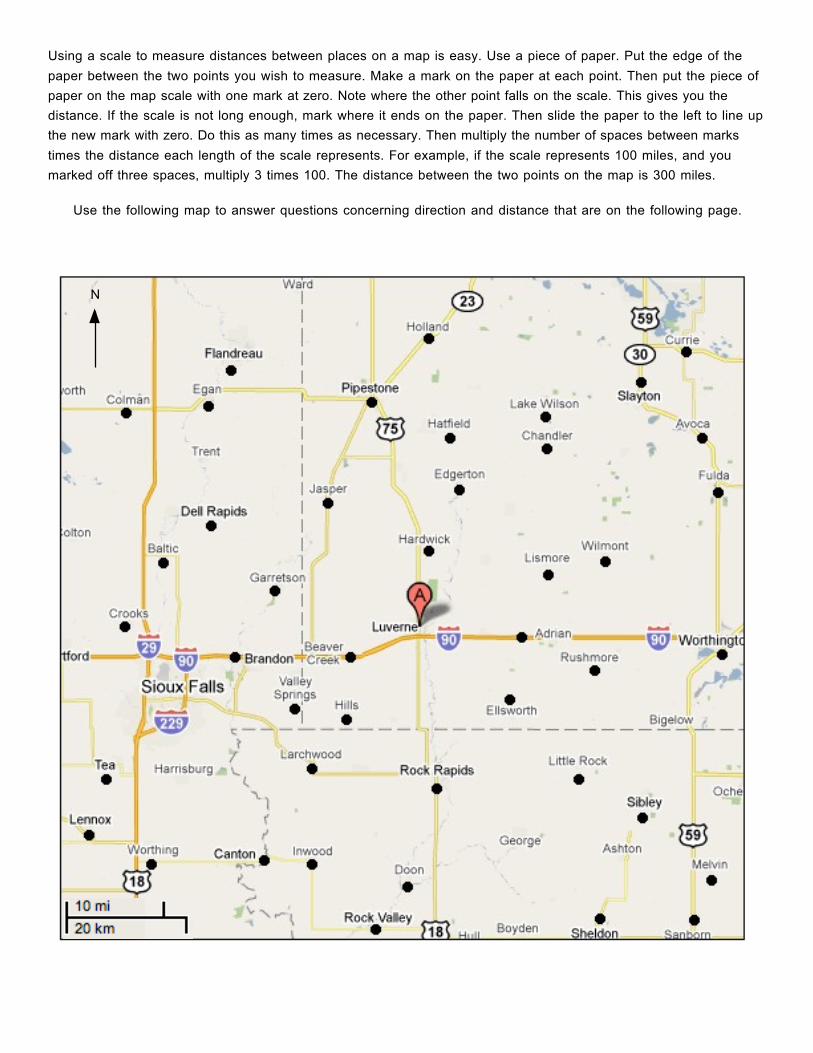
Using a scale to measure distances between places on a map is easy. Use a piece of paper. Put the edge of the paper between the two points you wish to measure. Make a mark on the paper at each point. Then put the piece of paper on the map scale with one mark at zero. Note where the other point falls on the scale. This gives you the distance. If the scale is not long enough, mark where it ends on the paper. Then slide the paper to the left to line up the new mark with zero. Do this as many times as necessary. Then multiply the number of spaces between marks times the distance each length of the scale represents. For example, if the scale represents 100 miles, and you marked off three spaces, multiply 3 times 100. The distance between the two points on the map is 300 miles.
Use the following map to answer questions concerning direction and distance that are on the following page.
N

DIRECTION AND DISTANCE ACTIVITY
Name ______________________________ Hour _________ Due Date __________ Score _______ / _______
1. What on the map indicates direction? _______________________________
2. What on the map indicates distance? _______________________________
3. If you were in Luverne, in which direction would you travel to reach each of the following destinations?
Use directions such as northwest when necessary.
a. Sibley, Iowa ______________
b. Dell Rapids, South Dakota ______________
c. Lennox, South Dakota ______________
d. Pipestone, Minnesota ______________
e. Avoca, Minnesota ______________
f. Worthington, Minnesota ______________
g. Garretson, South Dakota ______________
h. Canton, South Dakota ______________
i. Sioux Falls, South Dakota ______________
j. Hardwick, Minnesota ______________
k. Rock Rapids, Iowa ______________
l. Ellsworth, Minnesota ______________ 4. Using the scale on the map, find the distance between the following locations. (Use miles)
a. Pipestone and Slayton ________________
b. Sioux Falls and Luverne ________________
c. Worthington and Ellsworth ________________
d. Dell Rapids and Tea ________________
e. Hills and Luverne ________________
f. Hardwick and Lennox ________________
g. Inwood and Wilmont ________________
h. Garretson and Sioux Falls ________________
i. Flandreau and Canton ________________
j. Rock Valley and Luverne ________________
k. Fulda and Harrisburg ________________
6
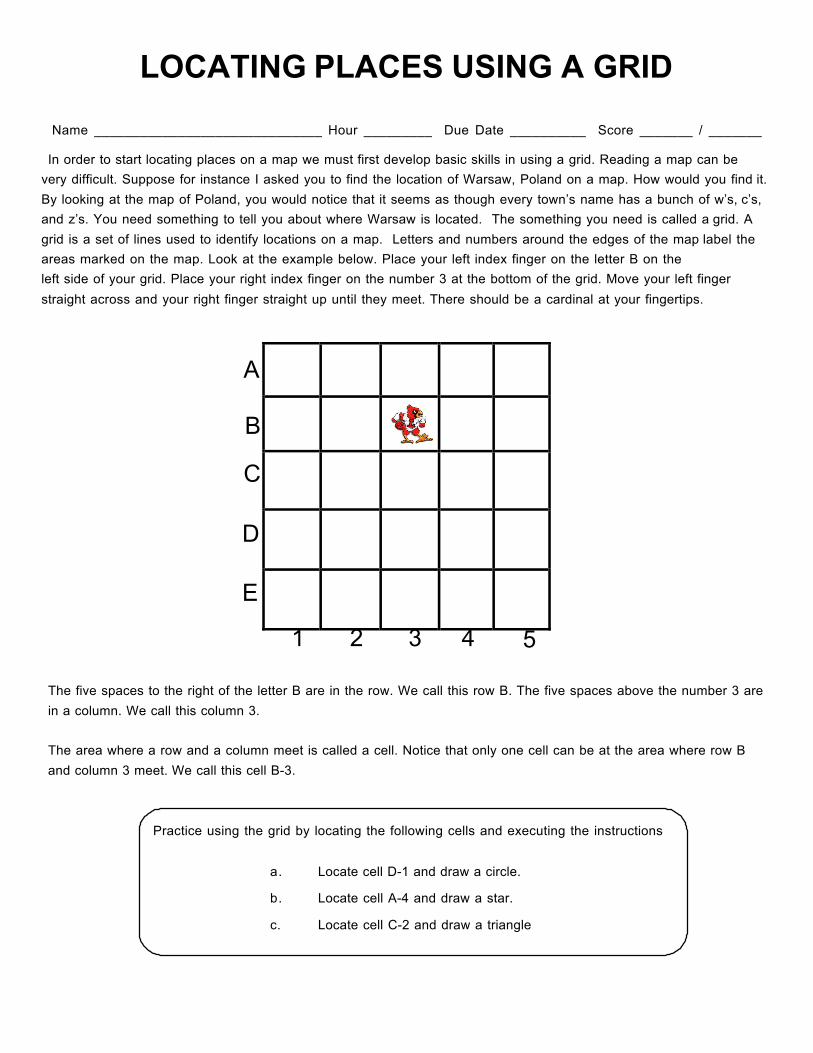
LOCATING PLACES USING A GRID
Name ______________________________ Hour _________ Due Date __________ Score _______ / _______
In order to start locating places on a map we must first develop basic skills in using a grid. Reading a map can be very difficult. Suppose for instance I asked you to find the location of Warsaw, Poland on a map. How would you find it. By looking at the map of Poland, you would notice that it seems as though every town’s name has a bunch of w’s, c’s, and z’s. You need something to tell you about where Warsaw is located. The something you need is called a grid. A grid is a set of lines used to identify locations on a map. Letters and numbers around the edges of the map label the areas marked on the map. Look at the example below. Place your left index finger on the letter B on the left side of your grid. Place your right index finger on the number 3 at the bottom of the grid. Move your left finger straight across and your right finger straight up until they meet. There should be a cardinal at your fingertips.
A
B C
D
E
1 2 3 4 5 The five spaces to the right of the letter B are in the row. We call this row B. The five spaces above the number 3 are in a column. We call this column 3.
The area where a row and a column meet is called a cell. Notice that only one cell can be at the area where row B and column 3 meet. We call this cell B-3.
Practice using the grid by locating the following cells and executing the instructions
a. Locate cell D-1 and draw a circle.
b. Locate cell A-4 and draw a star.
c. Locate cell C-2 and draw a triangle

G
LOCATING PLACES USING A GRID
Name ______________________________ Hour _________ Due Date __________ Score _______ / _______
A
B
Luverne Public Schools
C
Vets
Home
Rock County
Pool
Herman Motors
D
E Rock County Fairgrounds
City Park
Ethanol Plant
F
Papik Motors
McDonald’s
1 2 3 4 5
8
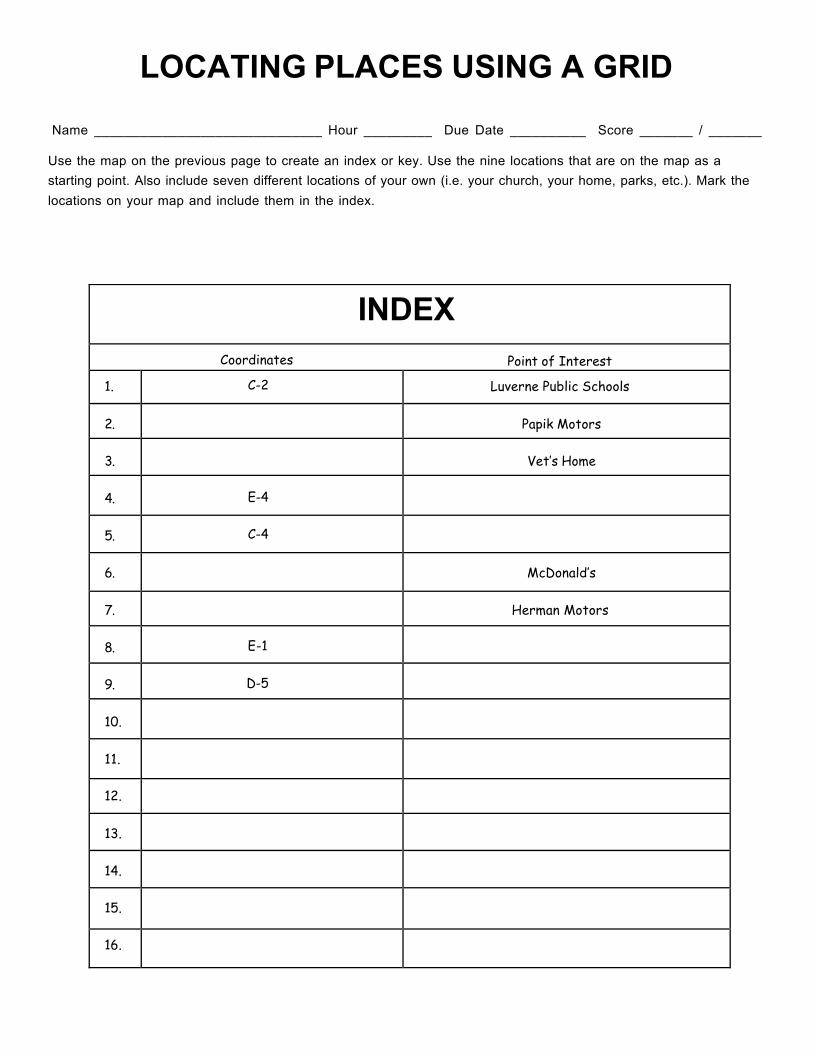
INDEX
Coordinates Point of Interest 1. C-2 Luverne Public Schools
2.
Papik Motors
3.
Vet’s Home
4.
E-4
5.
C-4
6.
McDonald’s
7.
Herman Motors
8.
E-1
9.
D-5
10.
11.
12.
13.
14.
15.
16.
LOCATING PLACES USING A GRID
Name ______________________________ Hour _________ Due Date __________ Score _______ / _______
Use the map on the previous page to create an index or key. Use the nine locations that are on the map as a starting point. Also include seven different locations of your own (i.e. your church, your home, parks, etc.). Mark the locations on your map and include them in the index.

H
U T
INTRO TO LATITUDE AND LONGITUDE
Name ______________________________ Hour _________ Due Date __________ Score _______ / _______
The grid system we just learned about gives us a way to locate the exact position of different places on a map. A similar system covers the entire earth so that at any given point we can be said to have an absolute or exact location. We know that a grid is made up of two sets of lines. these lines cross each other. The grid system we use on earth is known as latitude and longitude. Use the following chart to begin to understand the basics of latitude and longitude.
What is latitude? How is it measured?
Lines of latitude are imaginary lines that run completely around the globe-full circles. If you travel along any of these lines you are going east and west. The equator is numbered 0 degrees or 0 o . The equator divides the world into two halves or hemispheres: the Northern Hemisphere and the Southern Hemisphere. All places that are north of the equator are said t o have north latitude. All of the places south of the equator are said to have south latitude.
All lines of latitude are parallel. This means that no matter how far two lines of latitude are extended they would never meet. Because of this fact, sometimes lines of latitude are also called parallels. In order to prevent maps from becoming too cluttered with lines, mapmakers show only a few degree lines of latitude, generally 10 or 20 degrees apart. The diagram below shows lines of latitude that are 10 oapart. Starting from 0 o , the equator, the lines of latitude are numbered north and south to 90. o The North Pole is 90 o N, and the South Pole is 90 o S. Identify the latitude of the following locations on the simple diagram.
90
E 80
N 70
A: ___________ B: ___________
I 60 O D 50
R M 4 C: ___________
D: ___________ 30
T J 20 C 10
0
S H 10 20
O K 30 G 40
A 50 F 60
B 70 H 80
L
90
E: ___________ F: ___________ G: ___________ H: ___________ I: ___________ J: ___________ K: ___________ L: ___________ M: ___________
o You can easily determine how many degrees separate one place from another place. For example, M is on the 50 N
o o line of latitude; C is on the 10 N line of latitude. By subtracting, we find that M is 40 further north than C. How many degrees of latitude separate the following?
E from J? ___________ M from H? L from G? ___________ A from C? ___________ D from B? ___________ K from I? ___________

What is longitude? How is it measured? To locate places exactly on a globe or map it is necessary to have north-south lines-lines of longitude-that cross with the east-west lines of latitude. Once it is known where the lines cross, any place on the globe can be given an exact location. Lines of longitude are imaginary lines that extend from the North Pole to the South Pole. Lines of longitude are not parallel. All the lines meet at the North Pole and the South Pole. All of same-numbered east or west lines of longitude are equidistant apart at the equator. All lines of longitude are measured east or west of the prime meridian.
o Prime meridian is another way of saying the 0 line of longitude. Lines of longitude are often shown on maps as
o o o being 10 apart at the equator. Sometimes they are shown as being 15 apart, or even 30 apart. How they are spaced and numbered depends on the purpose of the map. The numbering of the lines continues for 180 to the
o o east and 180 to the west, for a total of 360 , a full circle. The prime meridian and its continuation on the other side
o of the world, 180 , divides the world into two equal parts: The Eastern Hemisphere and the Western Hemisphere. Identify the missing numbers and the longitude of the following points on the map.
A: ________ B: ________ C: ________ D: ________ E: ________
F: ________ G: ________ H: ________ I: ________ J: ________
W E S T E A S T
G H
C
D
I
30 15 0 15 30
A E
F J
B

7. 51 N 1 W _______________________ _______________________
8. 19 N 99 W _______________________ _______________________
INTRO TO LATITUDE AND LONGITUDE
Name ______________________________ Hour _________ Due Date __________ Score _______ / _______
Directions: Use the map on the next page to find the latitude and longitude for the following...
Latitude Longitude How far? N or S? How far? E or W?
1. Canberra, Australia ______ ______ ______ ______
2. Madrid, Spain ______ ______ ______ ______
3. Kingston, Jamaica ______ ______ ______ ______
4. Santiago, Chile ______ ______ ______ ______
5. Moscow, Russia ______ ______ ______ ______
6. Colombo, Sri Lanka ______ ______ ______ ______
7. Athens, Greece ______ ______ ______ ______
8. Tokyo, Japan ______ ______ ______ ______
9. Accra, Ghana ______ ______ ______ ______
10. Lima, Peru ______ ______ ______ ______
11. Baghdad, Iraq ______ ______ ______ ______
12. Kabul, Afghanistan ______ ______ ______ ______
13. Washington D.C., U.S. ______ ______ ______ ______ Directions: Use the latitude and longitude coordinates from the maps to find the following ....
City Continent
1. 40 N 11 6 E _______________________ _______________________
2. 15 S 47 W _______________________ _______________________
3. 45 N 77 W _______________________ _______________________
4. 60 N 11 E _______________________ _______________________
5. 3 S 38 E _______________________ _______________________
6. 35 S 19 E _______________________ _______________________
12

Ottawa
Helsinki
London
Moscow
Mexico City
Washington, D.C.
Kingston
Madrid
Athens
Baghdad
Kabul
Beijing Tokyo
Lima
Brasillia
Accra Nairobi
Colombo
Santiago Cape Town
Canberra
15

During class today we will be playing a variation of the game BATTLESHIP. The game is based on a gird system and in other variations of the game they grid includes letters and numbers. In our version, we will be using the latitude and longitude grid of the earth to identify locations.
Use the following instructions to get started
Step one : Before play begins, each player arranges a number of ships secretly on the grid for that player. Each
ship occupies a number of consecutive squares on the grid, arranged either horizontally or vertically. The number of squares for each ship is determined by the type of the ship. The ships cannot overlap (i.e.. at most one ship can occupy any given square in the grid). The types and numbers of ships allowed are the same for each player.
In our game we will have a total of seven ships. Different types of ships take up a different number of squares.
Type of ship
Number
Size
Aircraft Carrier
1
7
Battleship
1
5
Cruiser 1 4
Destroyer 2 3
Submarine 2 2
Step two: Use the second grid to record the shots you have taken at your opponents ships.
Step three: Rock, paper, scissors to determine who begins. ONE TIME. NO BEST OF THREE.
Step four: Begin play following the instructions below. After the ships have been positioned, the game proceeds in a series of rounds. In each round, each player has a turn. During a turn, the player announces a list of target squares in the opponents' grid which are to be shot at. If a ship occupies one of the squares, then it takes a hit. When all of the squares of a ship have been hit, the ship is sunk. After the target list has been given, the opponent then announces which of his ships have been hit. If at the end of a round all of one player's ships have been sunk, the game ends and the other player wins. If all of both players ships are sunk, the game ends in a tie. The number of target squares that a player may shoot at in a given turn is determined by the condition of the players' own ships at the beginning of the round. Each player has many shots as he or she has vessels afloat in each turn. Thus each time a player's ship is entirely destroyed, that player has one fewer shot on all subsequent turns.
14

MY SHIPS
Use this page to plot out where your ships are. Remember that you must place them where two lines intersect. Use the chart on the pervious page to determine the number of ships and size of each ship. You may only place the ships on water.

MY SHOTS
Use this page to plot out the shots that you take. Mark where you guess that your opponents ships are at. Use a different symbol for hits and misses.
16

17
Name ______________________________ Hour _________ Due Date __________ Score _______ / _______
My BATTLESHIP ships are located at the following coordinates:
Latitude Longitude
Aircraft Carrier 1. ______ _______ _______ _______ HIT
2. ______ _______ _______ _______ HIT
3. ______ _______ _______ _______ HIT
4. ______ _______ _______ _______ HIT
5. ______ _______ _______ _______ HIT
6. ______ _______ _______ _______ HIT
7. ______ _______ _______ _______ HIT
Battleship 1. ______ _______ _______ _______ HIT
2. ______ _______ _______ _______ HIT
3. ______ _______ _______ _______ HIT
4. ______ _______ _______ _______ HIT
5. ______ _______ _______ _______ HIT
Cruiser 1. ______ _______ _______ _______ HIT
2. ______ _______ _______ _______ HIT
3. ______ _______ _______ _______ HIT
4. ______ _______ _______ _______ HIT
Destroyer # 1 1. ______ _______ _______ _______ HIT
2. ______ _______ _______ _______ HIT
3. ______ _______ _______ _______ HIT
Destroyer # 2 1. ______ _______ _______ _______ HIT
2. ______ _______ _______ _______ HIT
3. ______ _______ _______ _______ HIT
Submarine # 1 1. ______ _______ _______ _______ HIT
2. ______ _______ _______ _______ HIT
Submarine # 2 1. ______ _______ _______ _______ HIT
2. ______ _______ _______ _______ HIT

Name ______________________________ Hour _________ Due Date __________ Score _______ / _______
My BATTLESHIP guesses were as follows:
Latitude Longitude
1. ______ _______ _______ _______ HIT MISS
2. ______ _______ _______ _______ HIT MISS
3. ______ _______ _______ _______ HIT MISS
4. ______ _______ _______ _______ HIT MISS
5. ______ _______ _______ _______ HIT MISS
6. ______ _______ _______ _______ HIT MISS
7. ______ _______ _______ _______ HIT MISS
8. ______ _______ _______ _______ HIT MISS
9. ______ _______ _______ _______ HIT MISS
10. ______ _______ _______ _______ HIT MISS
11. ______ _______ _______ _______ HIT MISS
12. ______ _______ _______ _______ HIT MISS
13. ______ _______ _______ _______ HIT MISS
14. ______ _______ _______ _______ HIT MISS
15. ______ _______ _______ _______ HIT MISS
16. ______ _______ _______ _______ HIT MISS
17. ______ _______ _______ _______ HIT MISS
18. ______ _______ _______ _______ HIT MISS
19. ______ _______ _______ _______ HIT MISS
20. ______ _______ _______ _______ HIT MISS
21. ______ _______ _______ _______ HIT MISS
22. ______ _______ _______ _______ HIT MISS
23. ______ _______ _______ _______ HIT MISS
24. ______ _______ _______ _______ HIT MISS
25. ______ _______ _______ _______ HIT MISS
26. ______ _______ _______ _______ HIT MISS
27. ______ _______ _______ _______ HIT MISS
18

conditions that are useful in forecasting the weather.
THE GEOGRAPHER’S TOOLS
Name ______________________________ Hour _________ Due Date __________ Score _______ / _______
Maps and Globes A geographer’s tools include maps, globes, and data that can be displayed in a variety of ways. The oldest known map is a Babylonian clay tablet created about 2,500 years ago. The tablet is about four inches high and shows the Babylonian world surrounded by water. Over the centuries, mapmaking evolved into a very complex task. However, a map’s function has remained the same to show locations of places, landforms, and bodies of water, and where they are in relation to other parts of the earth.
Two Dimensions or Three
A globe is a three-dimensional representation of the earth. It provides a way to view the earth as it travels through space. But since the earth is a sphere, we can see only one half of it at any time. For certain tasks, globes are not very practical because they are not easily portable. People often prefer to use maps, which are two-dimensional graphic representations of selected parts of the earth’s surface. Maps are easily portable and can be drawn to any scale needed. The disadvantage of a map is that distortion occurs as the earth’s surface is flattened to create the map. A cartographer, or mapmaker, reduces some types of distortion by using different types of map projections. A map projection is a way of drawing the earth’s surface that reduces distortion caused by presenting a round earth on flat paper.
Types of Maps
The three types of maps are general reference maps, thematic maps, and navigational maps. A general reference map is sometimes called a topographic map, which is a representation of natural and man made features on the earth. Thematic maps emphasize specific kinds of information, such as climate or population density. Sailors and pilots use the third type of map-navigation maps.
The Science of Mapmaking
A cartographer decides what type of map to create by considering how the map will be used. Keeping that purpose in mind, he or she then determines how much detail to show and what size the map should be.
Surveying
The first step in making a map is to complete a field survey. Surveyors observe, measure, and record what they see in a specific area. Today, most mapping is done by remote sensing, the gathering of geographic information from a distance by an instrument that is not physically in contact with the mapping site. These data are gathered primarily by aerial photography or by satellites. The data gathered includes information such as elevation, differences in land cover, and variations in temperature. This information is recorded and converted to a gray image. Cartographers then use these data and computer software to construct maps.
Satellites
Today, geographers rely heavily on satellites to provide geographic data. Two of the best-known satellites are Landsat and GOES. Landsat is actually a series of satellites that orbit more than 100 miles above the earth. Each time a satellite makes an orbit, it picks up data in an area 115 miles wide. Landsat can scan the entire earth in 16 days. Geostationary Operational Environment Satellite (GOES) is a weather satellite. This satellite flies in orbit at the same speed as the earth’s rotation. By doing so, it always views the same area. It gathers images of atmospheric

Geographic Information Systems The newest tool in the geographer’s toolbox is Geographic Information Systems (GIS). GIS stores information about the world in a digital database. GIS has the ability to combine information from a variety of sources and display it in ways that allow the user to visualize the use of space in different ways. When using the system, geographers must look at a problem and decide what types of geographic information would help them solve the problem. The information could include maps, aerial photographs, satellite images, or other data. Next, they select the appropriate layers of information. Then, GIS creates a composite map combining the information.
Global Positioning System
A familiar tool of geographers is GPS or Global Positioning System. It was originally developed to help military forces know exactly where they were on the earth’s surface. The system uses a series of 24 satellites called Navstars, which beam information to the earth. The exact position—latitude, longitude, altitude, and time—is displayed on a hand–held receiver. Hikers, explorers, sailors, and drivers use GPS devices to determine location. They are also used to track animals. Geographers use a variety of other tools including photographs, cross sections, models, cartograms, and population pyramids. These tools help geographers to visualize and display information for analysis. They are looking for patterns and connections in the data they find.
1. How long ago was the first map created? What function of maps has remained the same over time?
2. A 3 dimensional representation of the earth is called a . A 2 dimensional
representation of the earth or selected potions of the earths surface is called a _____________________ .
3. What advantages do maps have compared t o a globe?
4. What is distortion? What things on a map can be distorted?
5. What is a cartographer?
6. The process of putting the round earth on a flat surface is called ___________________________.
7. What are the 3 types of maps mentioned in the text?
8. Based on what you know and what you read, how do you think mapmaking has changed over time?
20

THE GEOGRAPHER’S TOOLS
Name ______________________________ Hour _________ Due Date __________ Score _______ / _______
Maps have guided humans through the world for almost all of time. They are considered one of the most long lasting and simplest form of communication. Maps can contain an enormous amount of power. Power is the ability to do work. Which is what maps do: They work. They work in at least two ways. In the first, they operate effectively. They work, that is.... they don’t fail. On the contrary, they succeed, they achieve effects, they get things done. Hey! It works! But of course to do this maps must work in the other way as well, that is , toil, that is labor. Map sweat, they strain, they apply themselves. The ends achieved with so much effort? The ceaseless reproduction of the culture that brings them into being.
Maps are representations and simplifications of the earths surface. Each map is made with a specific purpose in mind. Each map is intended to show something. What the map shows is a choice mad by the cartographer or person making the map. Compile a list of possible reasons to make or use a map. Be creative and try to be as specific as possible.
1. 2. 3.
4.
5.
6.
7.
8.
9.
10.
In order to communicate, every map must include six essential components. On every map that we will make in this class we must include TODALS.
T-
O-
D-
A-
L-
S-

MAP PROJECTIONS
Name------------ Hour _
PLANAR PROJECTIONS
Due Dote _ Score I _
A planar projet;tion is a projet;tionona flat smface.Thsi projection is also called an azimuthalprojection.It dsi torts size ardshape.To the rightis a type of planar projection.
CONICAL PROJECTIONS
A coni:al p-ojection is a projection onto a cone.Thsi projection shom shape fairly accuftJleJy.but it distorts l andmasses at the ecges of the map.
The tlzimuthnlproja::tion shows the earth ro that a line from the central point to any other point on the map gives the shortest distance between the two points.Size andshape are distorted.
Conci alprojections are often used to shewt l andmasses tlllt extend overlarge areas going east and west

MAP PROJECTIONS
Name Hour _
CYliNDRICAl PROJECTIONS
Due Date -------- Score I _
A cindricalprojectionis a projection onto a cylinder. Thsi ptojection shewtS the entrie earth oo one map. Included here are three types of cylindricalp-ojections.
The cylindrci alprojedion called homolosine is sometimes called an·intsrrupted map," because the oceans are dH-ided.Thsi projection shoW'S the accurate shapes and silas of thelandmasses.but dsi tances on the map are not corred.
In the cirdricalprojection mled Mercator,the shapes of the continents are dsi torted at the poles andsomewhat compressed near the equator. For exampe. the island of Gramland is actually one-eighth the size of South America.
A Robineon projedionis a t)pEI of cylindrci alprojection. commonly used in tald:books.It shom the entrie earth with near1y the true sizes and shapes of the continents and oceans. H CM'S\'ef, the shapes of thelandfonns near tte poles appear flat.

MAP PROJECTIONS
Projection Name
Drawing (Looks Like)
Used For What ( Best Quality )
Distortions
Planar (Azimuthal)
Conic
Cylindrical (Mercator)
Cylindrical (Interrupted)
Robinson
24

ORANGE MAP
Name ______________________________ Hour _________ Due Date __________ Score _______ / _______
Every cartographer is faced with the problem of transforming the curved surface of the earth onto a flat plane with a minimum of distortion. The systematic transformation o f locations on the earth (spherical surface) to locations on a map (flat surface) is called projection.
It is not possible to represent on a flat map the spatial relationships of angle, distance, direction and area that only a globe can show faithfully. As a result, projection systems inevitably involve some distortion. There are an infinite number of possible map projections, all of which distort one or more of the characteristics at the globe in varying degrees. Each projection represents the earths round surface in a different way and has a different purpose.
The orange activity is a example of how the earths round surface can be represented on a flat surface . The steps are as follows:
1. Imagine the orange as the earth and note where different continents and oceans would be located.
2. Peel the orange and attempt to keep the peel in one piece.
3. Place the peel on your blank piece of paper and flatten it out. You will be creating a map of the world with your peel as an outline. The area that the peel covers represents the entire area of the surface of the earth. All land masses and water should be accounted for on the map.
4. Begin your map of the world by locating and drawing the following important lines of latitude and longitude.
a. Equator b. Prime meridian c. International date line d. Tropic of Cancer e. Tropic of Capricorn
5. Continue by drawing and labeling the seven continents as well as the oceans. a. North America b. South America c. Europe d. Asia e. Africa f. Australia g. Antarctica
6. Include TODALS on your map. a. Title b. Orientation c. Date d. Author e. Legend f. Scale
25

WORLD POPULATION MAP
Name ______________________________ Hour _________ Due Date __________ Score _______ / _______
The five color population map is an example of a special purpose map called a choropleth map.
1. Plot the data. Before we locate countries or label anything on the map, we must determine what our categories will be. Use the data from the countries ranked by population to create a line graph that shows the distribution of the countries.
2. Create 5 categories (Groups) When all the data has been plotted, create 5 categories by looking for
gaps in the data. Categories should indicate that the nations of that color have something in common
3. Locate nations and color them based on the category they are in. After you have created 5 groups,
begin locating all countries in group #1 and color all of them the same color. It is not necessary to write the name of each country on the map, but simply color the country based on the group it falls into. Latitude and longitude are include to help in locating each country.
4. Include all essential parts of the map. Title Orientation Date Author Legend Scale
26

1 China 1,339,170,000 Asia 40 N 100 E
2
India
1,184,597,000
Asia
20 N
80 E
3
United States
309,966,000
North America
4
Indonesia
234,181,400
Asia
0
120 E
5
Brazil
193,359,000
South America
10 S
50 W
6
Pakistan
170,251,500
Asia
30 N
70 E
7
Bangladesh
164,425,000
Asia
23 N
90 E
8
Nigeria
158,259,000
Africa
10 N
10 E
9
Russia
141,927,297
Asia
60 N
100 E
10
Japan
127,380,000
Asia
40 N
140 E
11
Mexico
108,396,211
North America
20 N
100 W
12
Philippines
94,013,200
Asia
10 N
120 E
13
Vietnam
85,789,573
Asia
15 N
100 E
14
Germany
81,757,600
Europe
50 N
10 E
15
Ethiopia
79,221,000
Africa
10 N
40 E
16
Egypt
78,844,000
Africa
30 N
30 E
17
Iran
75,078,000
Asia
30 N
50 E
18
Turkey
72,561,312
Asia
40 N
30 E
19
Dem. Rep. of Congo
67,827,000
Africa
0
25 E
20
France
65,447,374
Europe
45 N
0
21
Thailand
63,525,062
Asia
15 N
100 E
22
United Kingdom
62,041,708
Europe
55 N
0
23
Italy
60,340,328
Europe
45 N
10 E
24
Myanmar (Burma)
50,496,000
Asia
22 N
98 E
25
South Africa
49,991,300
Africa
29 S
24 E
COUNTRIES RANKED BY POPULATION
Name ______________________________ Hour _________ Due Date __________ Score _______ / _______
Country Population Continent Latitude Longitude
27

COUNTRIES RANKED BY POPULATION
Name ______________________________ Hour _________ Due Date __________ Score _______ / _______
26
Country
South Korea
Population
49,773,145
Continent
Asia
Latitude
35 N
Longitude
130 E
27
Spain
46,951,532
Europe
40 N
4 W
28
Ukraine
45,871,738
Europe
49 N
32 E
29
Colombia
45,568,000
South America
4 N
72 W
30
Tanzania
45,040,000
Africa
6 S
35 E
31
Kenya
40,863,000
Africa
1 N
38 E
32
Argentina
40,518,951
South America
34 S
64 W
33
Sudan
39,154,490
Africa
15 N
30 E
34
Poland
38,167,329
Europe
52 N
20 E
35
Algeria
35,423,000
Africa
28 N
3 E
36
Canada
34,206,000
North America
60 N
95 W
37
Uganda
33,796,000
Africa
1 N
32 E
38
Morocco
31,891,000
Africa
32 N
5 W
39
Iraq
31,467,000
Asia
33 N
44 E
40
Nepal
29,853,000
Asia
28 N
84 E
41
Peru
29,461,933
South America
10 S
76 W
42
Afghanistan
29,117,000
Asia
33 N
65 E
43
Venezuela
28,886,000
South America
8 N
66 W
44
Malaysia
28,306,700
Asia
2 N
112 E
45
Uzbekistan
27,794,000
Asia
41 N
64 E
46
Saudi Arabia
26,246,000
Asia
25 N
45 E
47
Ghana
24,333,000
Africa
8 N
2 W
48
Yemen
24,256,000
Asia
15 N
48 E
49
North Korea
23,991,000
Asia
40 N
127 E
50
Mozambique
23,406,000
Africa
18 S
35 E
28

WORLD POPULATION MAP DATA PLOT 20 30 40 50 60 70 80 90 100 110 120 130 140 150 160 170 180 190 234 309 1184 1339
Population in Millions (2010 estimates)
29