Pavescan Evaluation of In-Place Asphalt Mixture Density ...
22
1 Pavescan Evaluation of In-Place Asphalt Mixture Density Chris Barnes, Ph.D., P.Eng., Associate Materials Engineer, Wood Environment & Infrastructure Solutions Adam Marlin, P.Eng., Pavement Management Engineer, Nova Scotia Transportation and Infrastructure Renewal Paper prepared for Testing and Modeling of Roadway/Embankment Materials and Geotechnical Engineering session of the 2021 TAC Conference and Exhibition
Transcript of Pavescan Evaluation of In-Place Asphalt Mixture Density ...

1
Pavescan Evaluation of In-Place Asphalt Mixture Density
Chris Barnes, Ph.D., P.Eng., Associate Materials Engineer,
Wood Environment & Infrastructure Solutions
Adam Marlin, P.Eng., Pavement Management Engineer,
Nova Scotia Transportation and Infrastructure Renewal
Paper prepared for Testing and Modeling of Roadway/Embankment Materials and Geotechnical
Engineering session of the 2021 TAC Conference and Exhibition

2
ABSTRACT
Dielectric profiling systems developed under the US Federal Highways Administration Strategic Highway
Research Program 2 (SHRP2) Solutions program provide a means to estimate the in-place compaction of
asphalt concrete by correlation to the relative dielectric constant of the near-surface materials. The
Pavescan™ system, a ground penetrating radar-based surface dielectric profiling system produced by
Geophysical Survey Systems Inc., was used to continuously scan segments of an asphalt concrete
pavement placed during two paving projects in 2019 that were constructed in Nova Scotia. The first
project involved a paving trial of a C-HF asphalt mixture placed on 25 mm thick steel plates to simulate an
orthotropic steel bridge deck. Pavescan™ data was recorded over various sections which received
different levels of compaction effort to create a wide range of in-place density. Excellent correlation was
observed between the surface dielectric measured from the pavement surface reflection and the bulk
density of core samples, yielding a coefficient of determination equal to 92.2%. The trial also indicated
that the minimum mat thickness that could be tested without interference from the underlying steel plate
was approximately 45 mm. The correlation developed for test data obtained on the steel plates did not
accurately predict the bulk density of the same asphalt mixture compacted on granular base, indicating
an interaction between compaction and the underlying base stiffness. Pavescan™ surveys were also
completed on five segments of asphalt mixture placed on a rural roadway. The most accurate predictions
of bulk density resulted when using daily calibrations of bulk density from cores and the measured surface
dielectric constant with a 94.7% rate of correctly predicting air void contents above and below 7.5%. A
comparison of the Pavescan™ results and quality assurance sampling within the same locations of the mat
provided consistent measures of quality. However, contour plots of the surface dielectric or interpreted
compaction were effective in mapping lower levels of compaction associated with transverse and
longitudinal cold joints in the mat.
3
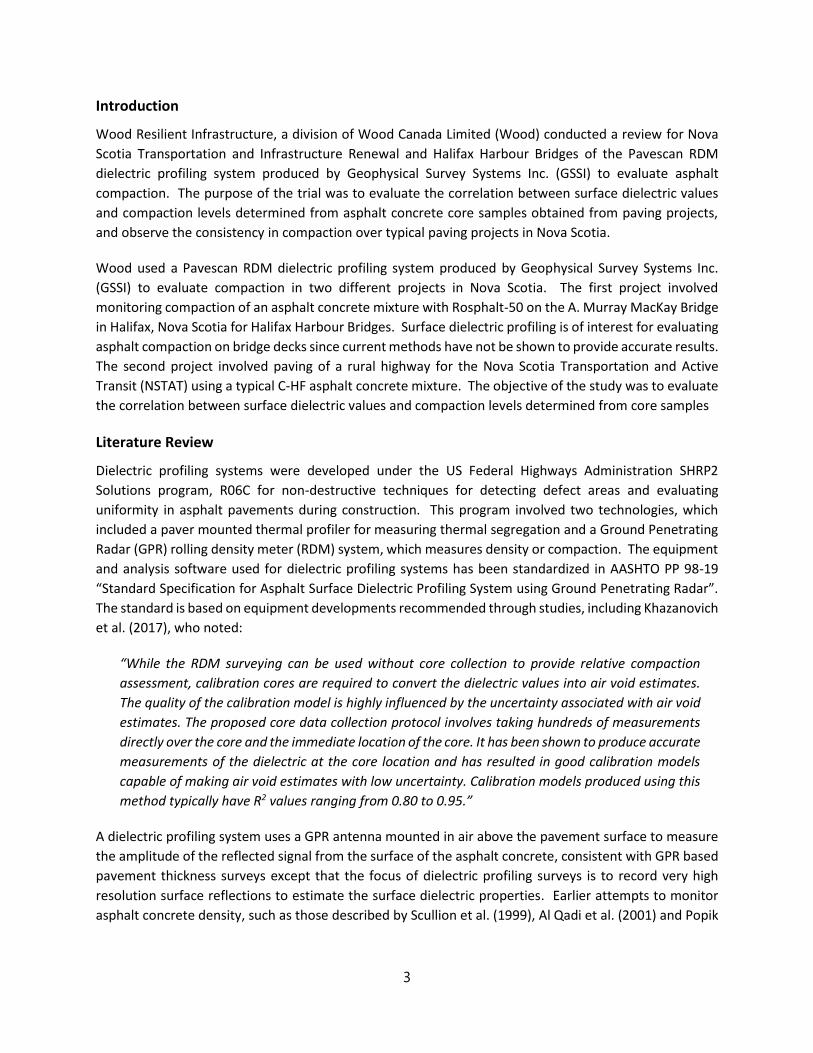
Introduction
Wood Resilient Infrastructure, a division of Wood Canada Limited (Wood) conducted a review for Nova
Scotia Transportation and Infrastructure Renewal and Halifax Harbour Bridges of the Pavescan RDM
dielectric profiling system produced by Geophysical Survey Systems Inc. (GSSI) to evaluate asphalt
compaction. The purpose of the trial was to evaluate the correlation between surface dielectric values
and compaction levels determined from asphalt concrete core samples obtained from paving projects,
and observe the consistency in compaction over typical paving projects in Nova Scotia.
Wood used a Pavescan RDM dielectric profiling system produced by Geophysical Survey Systems Inc.
(GSSI) to evaluate compaction in two different projects in Nova Scotia. The first project involved
monitoring compaction of an asphalt concrete mixture with Rosphalt-50 on the A. Murray MacKay Bridge
in Halifax, Nova Scotia for Halifax Harbour Bridges. Surface dielectric profiling is of interest for evaluating
asphalt compaction on bridge decks since current methods have not be shown to provide accurate results.
The second project involved paving of a rural highway for the Nova Scotia Transportation and Active
Transit (NSTAT) using a typical C-HF asphalt concrete mixture. The objective of the study was to evaluate
the correlation between surface dielectric values and compaction levels determined from core samples
Literature Review
Dielectric profiling systems were developed under the US Federal Highways Administration SHRP2
Solutions program, R06C for non-destructive techniques for detecting defect areas and evaluating
uniformity in asphalt pavements during construction. This program involved two technologies, which
included a paver mounted thermal profiler for measuring thermal segregation and a Ground Penetrating
Radar (GPR) rolling density meter (RDM) system, which measures density or compaction. The equipment
and analysis software used for dielectric profiling systems has been standardized in AASHTO PP 98-19
“Standard Specification for Asphalt Surface Dielectric Profiling System using Ground Penetrating Radar”.
The standard is based on equipment developments recommended through studies, including Khazanovich
et al. (2017), who noted:
“While the RDM surveying can be used without core collection to provide relative compaction
assessment, calibration cores are required to convert the dielectric values into air void estimates.
The quality of the calibration model is highly influenced by the uncertainty associated with air void
estimates. The proposed core data collection protocol involves taking hundreds of measurements
directly over the core and the immediate location of the core. It has been shown to produce accurate
measurements of the dielectric at the core location and has resulted in good calibration models
capable of making air void estimates with low uncertainty. Calibration models produced using this
method typically have R2 values ranging from 0.80 to 0.95.”
A dielectric profiling system uses a GPR antenna mounted in air above the pavement surface to measure
the amplitude of the reflected signal from the surface of the asphalt concrete, consistent with GPR based
pavement thickness surveys except that the focus of dielectric profiling surveys is to record very high
resolution surface reflections to estimate the surface dielectric properties. Earlier attempts to monitor
asphalt concrete density, such as those described by Scullion et al. (1999), Al Qadi et al. (2001) and Popik

4
et al. (2010), involved air-launched antennas often used in pavement thickness surveys, which helped
support the development of current surface dielectric profiler systems conforming with AASHTO PP98-19.
Surface dielectric profiling systems use higher frequency antennas for higher sensitivity of the surface
dielectric properties. Asphalt concrete is a dielectric material which partially transmits and partially
reflects the incident GPR energy. The amplitude of the reflected and transmitted components depends
on the differences in the relative dielectric properties of the air and asphalt “layers” which meet at the
surface interface. Air has a relative dielectric constant equal to 1, so the amplitude of the pavement
surface reflection depends on its relative dielectric constant. For a newly placed, well controlled asphalt
mixture, the moisture content is essentially zero and the aggregate and binder content should not vary
considerably, so the relative dielectric constant is therefore assumed to vary with the air-void content. A
less compact asphalt layer with higher void content results in a lower relative dielectric constant for
asphalt concrete while a more compact asphalt layer with lower void content results in a higher relative
dielectric constant. The amount of incident energy arriving at the pavement surface, Ai, is commonly
measured from a calibration file using a thin metal plate which is placed at the same operating height as
the pavement surface and is assumed to reflect 100% of the incident energy. The relative dielectric
constant of the asphalt concrete is calculated based on Equation 1.
𝑒𝑟 = (1 + (𝐴0 𝐴𝑖⁄ )
1 − (𝐴0 𝐴𝑖⁄ ))
2
Equation 1
Where:
er is the dielectric constant of the asphalt concrete surface materials;
A0 is the amplitude of the GPR reflection measured from the asphalt concrete surface; and,
Ai is the amplitude of the GPR reflection measured from a flat metal plate.
Dielectric profile surveys are conducted after allowing the test system to warm up for 10 minutes to
maintain a consistent transmission power to ensure repeatable consistent data. The GPR data is recorded
at pre-set intervals over a distance that is measured using a calibrated distance measurement encoder.
Most asphalt concrete is placed in mats that are compacted to thicknesses exceeding 30 to 40 mm, so it
becomes necessary to calibrate the surface dielectric measurement to either bulk relative densities
measured per AASHTO T166 from core specimens or either void content or percent compaction
determined from the bulk relative density values and the maximum theoretical specific gravity of the mix
according to AASHTO T209 in order to provide an estimate of these compacted physical properties in the
mat. At the time of this study, GSSI was developing a calibration procedure that was based on testing the
surface reflection and bulk relative density of laboratory specimens produced using a gyratory compactor
to a range of void contents.
Dielectric profiling surveys should be completed as soon as possible after final compaction of the new
asphalt layer to avoid the effects of construction traffic and debris on the surface amplitude
measurements. Conway et al. (2017) noted that site conditions which add uncertainty or affect the
operation of the RDM system should be avoided which include hot mix asphalt overlays less than one inch
(25 mm) or greater than 3.5 inches (87.5 mm) in thickness, stone mastic asphalt, permeable friction
courses, temperatures less than 40 F (4.4 °C), and rainfall or other conditions that lead to wet pavement.

5
Construction traffic may further knead and close the pavement surface layer which influences the
reflection amplitude. The GSSI Pavescan RDM surface dielectric profiling system uses a 2.0 GHz antenna
for recording the surface reflection data. Wave velocity is equal to the product of frequency and
wavelength, and the speed of the GPR signal through a dielectric material is often simplified for low-loss
materials as the speed of light in a vacuum = 300 mm/ns divided by the square root of the relative
dielectric constant. If the thickness of asphalt concrete that influences the surface reflection is assumed
to be one half of pulse wavelength, then this represents approximately 30 to 40 mm for relative dielectric
constants ranging from 6.0 to 3.5. Water and debris accumulation on the surface will influence the
measured dielectric, shifting it to a higher value that is more indicative of a lower void content. Water
has a dielectric constant of approximately 81, so subtle changes in moisture content will have a significant
impact on the surface reflection amplitude. As a result, dielectric profile surveys should be completed
after any residual moisture from rolling operations has evaporated from the mat. Metallic tape for
marking paint striping and clayey soil materials are both conductive and can also significantly influence
the surface reflection amplitude.
Surface dielectric profiling technology has been implemented successfully by several State agencies,
including Maine, Minnesota, Nebraska and Alaska. Alaska Department of Transportation has been using
intelligent compaction and paver mounted infra-red scanners as contractor pay factors as part of project
acceptance since 2016, and has been one of the first states to propose using surface dielectric profiling
for evaluating a compaction bonus on overbanded longitudinal joints (Sommerfeldt, 2019). The Alaskan
joint compaction bonus is based on the compaction level and percent conformance to specified
compaction levels per 100 foot station of distance along the project.
A. Murray MacKay Bridge Paving Trial
The A. Murray MacKay suspension bridge is approximately 1,200 m in length and spans over Halifax
Harbour connecting the cities of Halifax and Dartmouth. This was the first suspension bridge built in North
America using an orthotropic steel deck over the approximately 740 m length of the suspended span. The
orthotropic deck span is constructed of individual plate segments that are inter-connected using steel
splice plates placed above the main deck plate.
A 12.5 mm C-HF hot mix asphalt concrete with Rosphalt-50 additive was selected for paving the deck,
based on enhanced waterproofing and improved resistance to fatigue cracking and rutting of the mixture
as indicated by the manufacturer. The specified thickness of the wearing surface for this deck was
originally 50 mm which was to be placed as a single lift. Monitoring compaction using conventional
nuclear density gauges was considered unreliable for this project due to the influence of the orthotropic
steel deck. The Pavescan RDM system appeared to be a feasible solution for monitoring hot mix asphalt
compaction on bridge decks due to the relatively thin depth of asphalt concrete surface that affects the
dielectric value measurement. If the steel plate remained outside of this depth of influence, it would have
no impact on the compaction measurements developed using the Pavescan RDM system, unlike a nuclear
density gauge.
The project specifications required that a paving trial be conducted to evaluate the proposed mix design
and the roller pattern required to develop the low void content required for waterproofing. A trial was
conducted using the proposed mixture placed on a granular surfaced lot at the paving contractor’s asphalt

6
cement terminal. The mixture was placed at the proposed spread rate over a section that was
approximately 70 m in length. A portion of the trial section was placed on two 25 mm thick steel plates
totalling approximately 10 m in length to simulate paving on the orthotropic steel deck. The granular
surface was roughly levelled to support the steel plates. The steel plate test section was divided and
marked into six zones which received different levels of roller passes to provide a wide range of void
contents in the materials as shown in Figure 1.
Five lines of surface dielectric data were recorded along the length of the trial section, at transverse offsets
of 0.5, 1.0, 1.5, 2.0 and 2.5 m from the edge of the mat. Each survey line and core location were marked
on the asphalt concrete surface, adjacent to each survey line to avoid unintended effects on the surface
reflection amplitude. High-definition core calibration files were recorded at exact pre-marked locations
where cores samples would be obtained from the mat. An additional line of surface dielectric data was
recorded at several other marked locations of the mat that was placed directly on the granular surface of
the lot.
Approximate limits of
steel plate base
support
6 Passes
5 Passes
4 Passes
3 Passes
2 Passes
1 Pass

7
Figure 1 – Roller marks indicating various compaction levels in trial section placed over steel plates.
The variation in the calculated surface dielectric over the surface of the trial placement on the steel plates
is shown via a plan view contour plot in Figure 2. It is evident from the roller marks observed in Figure 1
and the contour plot in Figure 2 that the rolling operations were not exactly aligned within the six zones,
but a variation in the surface dielectric can be observed from left to right across the plot which shows a
decrease in the dielectric value with a lower number of roller passes applied to the mat.
Figure 2 - Variation in surface dielectric at trial section for MacKay Bridge paving trial.
An area of very large dielectric values ranging up to a value of 22,000 was observed between distances of
7.2 to approximately 9.7 m where the steel plates terminated. Later analysis of cores and the GPR data
files recorded by the Pavescan RDM system near this area of anomalous high amplitude reflections
indicated that the asphalt concrete thickness decreased to approximately 37 mm or less. Dielectric values
leading up to this zone were in the range of 3.7 to 3.9, which would represent depth of influence equal to
39 mm that would impact the surface reflection amplitude. Steel essentially provides complete reflection
of the GPR signal versus the relatively low dielectric value of the asphalt concrete. As the mat thickness
decreases, the high amplitude steel reflection superimposes with the asphalt reflection, causing dramatic
increases in the surface reflection amplitude and the resulting calculated dielectric value. Asphalt
mixtures which may have high levels of air voids and corresponding dielectric values approaching 3.0
would be limited to a minimum thickness of approximately 43 mm for results that would not be influenced
by underlying materials.
Core samples from survey lines 2, 3, 4, and 5 were obtained at the exact marked locations where the
Pavescan calibration files were obtained. The bulk density was tested for each core according to AASHTO
T166, from which the air void content was determined based on the maximum theoretical density
determined for the mix according to AASHTO T209. Table 1 lists the core ID, density, air void content, and
average surface dielectric value measured each specific core location. The laboratory data for cores from
survey lines 2, 3, and 5 were analyzed to develop a correlation between the surface dielectric value and
6 Passes 5 Passes 4 Passes 3 Passes 2 Passes 1 Pass

8
the air void content. Core data from survey line 4 was provided to the analyst after the correlation was
developed to objectively check the accuracy of the model.
Table 1 - Asphalt concrete core density, air void content, and mean surface dielectric values used to
develop predictive models.
Test
Location
Average Surface
Dielectric
Bulk Density
(kg/m3)
Void Content
(%)
L2-2 4.064 2205 8.2
L2-3 4.172 2222 7.5
L2-4 4.204 2234 7.0
L2-5 4.299 2284 5.0
L2-6 4.332 2308 4.0
L3-1 3.812 2007 16.5
L3-2 3.911 2133 11.2
L3-3 4.109 2190 8.9
L3-4 4.148 2232 7.1
L3-5 4.281 2268 5.6
L3-6 4.409 2310 3.9
L5-1 3.766 2086 13.2
L5-2 4.046 2151 10.5
L5-3 4.063 2211 8.0
L5-4 4.260 2251 6.3
L5-5 4.233 2272 5.5
L5-6 4.378 2319 3.5
Linear and exponential regression models were developed to predict the air-void content as a function of
the surface dielectric value, as shown in Figure 3. Both models provided similar coefficients of
determination with R2 = 91.7% for the linear model and R2 = 92.2% for the exponential model. However,
based on a Sum of the Squared Errors (SSE) equal to 16.1% for the linear model versus SSE = 21.7% for the
exponential model, the linear model appeared to provide the most accurate prediction of the in-place
void content. The average absolute residual error for the exponential model was 0.82% air voids with a
standard deviation of 0.80% air voids, while the linear model yielded an average absolute residual error
of 0.74% air voids with a standard deviation of 0.65% air voids. It is observed that the linear model appears
to result in slightly lower residuals at lower air void content values.
Table 2 lists the bulk density, air void content, average surface dielectric, and predicted air-void content
for cores obtained from GPR survey line 4 (L-Series) and three cores obtained from a section of the trial
placed directly on the granular surfaced lot (G-Series). The predicted air-void content is based on the
linear model developed from the data provided in Table 1 from asphalt concrete specimens compacted
on the steel plates. The residual errors between the predicted and actual air-void contents for core
samples obtained from GPR survey line 4 ranged from 2.5% air voids for specimen L4-1 with an actual air
void content of 9.8% to 0.1% air voids for specimen L4-6 which had an actual air void content of 3.7%.

9
The average absolute value of the residual errors for the GPR line 4 cores was 0.8% air voids, while the
median value was 0.5% air voids.
It is interesting to observe that the average absolute residual of the predictions made for the section of
the mat placed without a supporting steel plate placed on the granular lot was 1.4% air voids with a
median value of 1.3% voids. This appears to indicate that the model does not exhibit the same level of
accuracy between these sections of the trial pavement having different support conditions. Despite
similar surface dielectric values, differences in the bulk relative density seem to exist over the depth of
the mat. It is commonly accepted that the effectiveness of granular material compaction depends on part
in the stiffness of the support conditions upon which it is placed, and it is likely that different correlation
functions between surface dielectric and air void content may be required for different base support
conditions due to variations in the development of a bulk density “gradient” over the thickness of the
mat.
Table 2 – Comparison between predicted air void content and validation core results.
Test
Location
Average Surface
Dielectric Value
Bulk Density
(kg/m3)
Void Content
(%)
Predicted Void
Content (%)
L4-1 4.170 2310 9.8 7.3
L4-2 4.328 2274 5.1 4.5
L4-3 4.095 2193 8.5 8.7
L4-4 4.235 2234 6.7 6.2
L4-5 4.367 2308 3.7 3.8
G1-1 4.173 2339 5.5 7.3
G1-2 4.350 2336 2.8 4.1
G1-3 4.368 2272 2.7 3.8

10
Figure 3 – Relationship between surface dielectric value and air void content.
Based on these results which confirmed the accuracy of the linear model, the Pavescan RDM was expected
to provide a high degree of accuracy for monitoring the in-place compaction on the bridge during paving
operations. This would be the first time that the surface dielectric profiling would be applied to paving
on an orthotropic steel deck, providing an accurate method for non-destructively monitoring in-place
compaction for quality control and quality assurance purposes.
Unfortunately, a change occurred which prevented the use of the Pavescan RDM for quality control during
paving operations on the bridge and further evaluation of its capacity for mapping density variations
throughout the project. The construction plan for paving the orthotropic steel deck was adjusted to
provide the required smoothness on the deck because it was expected that the placement of a single 50-
mm lift would result in significant bumps at the deck splice plate locations. After Wood verified via a
calibrated GPR survey that the existing pavement thickness on the deck exceeded 60 mm, the design
changed from a single 50-mm lift to the placement of one 38-mm thick base course, followed by localized
grinding of high spots at the splice place locations, and the placement of a final 22-mm thick surface course
using a nominal 6.3 mm maximum aggregate size to be paved in echelon over both northbound lanes.
The Pavescan correlation developed using a 12.5-mm aggregate was not expected to be representative
of the more finely graded 6.3 mm surface course mixture. Attempts to monitor the base course
compaction on the bridge deck confirmed distortion of the surface reflection by the orthotropic steel deck
plate reflection below the 38-mm thick asphalt concrete layer.
This project identified minimum lift thickness requirements to avoid interference from underlying
materials and confirmed the effectiveness and accuracy of the method for predicting compaction levels
in asphalt concrete.

11
Rural Highway Paving Project
A second case study involved using the Pavescan RDM system for asphalt concrete compaction along
segments of a 2-lane rural highway that was being reconstructed. The original asphalt concrete pavement
structure was pulverized and recompacted in-place in 2018, with asphalt paving deferred until 2019.
Surface dielectric profiling was completed on several sections of the 17.5 km paving project over the
course of five days.
Daily paving operations were generally completed one lane at a time within a lane closure to
accommodate traffic on the open lane. The initial segment generally consisted of several hundred metres
of hot mix asphalt concrete placed in the closed lane before switching lanes and placing a longer segment
in the opposite traffic direction. Generally, the third and final placement of the day would involve paving
the first lane up to the termination of the second placement in the opposite lane. Local traffic was being
escorted by traffic accommodations vehicles operating in the open lane while paving operations were
underway in the closed lane. This paving approach somewhat limited access for the Pavescan RDM data
collection because the surface dielectric profiling could not interfere with either paving operations or
traffic being carried in the open lane. The length of the test sections needed to be long enough to highlight
any possible variations in the mat and to be representative of the project, while allowing enough time to
complete the survey, select and scan core locations, and to remove the core specimens before paving
operations changed from one lane to the other.
Wood attempted to survey a portion of the daily paving completed in each lane, with a short section of
overlap between the scanned areas, where possible. Data collection began after paving operations had
progressed several hundred meters along the route to avoid any disruption to construction and to allow
moisture from the rolling operations to evaporate. The Pavescan RDM system was started and calibrated
after the required 10-minute warm-up period each morning. Surface dielectric values were monitored
during data collection to note unusually high, low, and typical values to direct the location of core samples
which were re-surveyed using “core calibration” scans. After surveying the test segment along the first
portion of the daily placement, a second survey area was established in the opposite lane with some
length of overlap where possible, enabling a full scan of the paved surface effectively from shoulder to
shoulder.
Surface dielectric profile surveys were completed on five different segments of the highway as listed in
Table 3. The Pavescan RDM data was recorded at eleven offsets from the shoulder of the first daily test
segment, including the longitudinal construction joint along the centreline where possible.
Table 3 – Variation in maximum theoretical density over Pavescan RDM testing days.
Pavescan RDM Testing Date Chainage (m) Maximum Theoretical Density
(kg/m3)
Oct 25 15+400 m to 15+800 m 2482
Oct 28 10+900 m to 11+463 m 2484
Oct 29 9+100 m to 9+940 m 2483
Oct 30 7+700 m to 8+370 m 2482
Nov 4 5+540 m to 6+000 m 2484

12
Core locations were selected to sample the daily range of dielectric values for surveys conducted on
October 28, 29, 30 and November 4. Core samples were tested at Wood’s materials laboratory in
Dartmouth NS to determine the bulk relative density. The void content was determined based on the
Maximum Theoretical Density (MTD) determined from loose samples of the mixture sampled each day as
listed in Table 3. The average MTD was 2483 kg/m3 with a standard deviation of 3.7 kg/m3, resulting in a
coefficient of variation of 0.15%. These results indicate that mixture production was consistent in quality.
The highest impact of such small variations in the MTD of the mixture placed at any given core location
on the calculated void content would be ± 0.23% void content for the range of bulk densities observed
from the core samples. The average MTD for a given test day was used in calculating the void content of
core specimens to ensure an even lower potential error.
Survey Results
Surface dielectric profile data across each test section were tabulated and analyzed to develop contour
maps shown in Figure 4. Significant variations in surface dielectric values were observed by transverse
position across the lanes. Sporadic occurrences of lower dielectric values less than 4.3 with elevated air
void contents were observed near the shoulders and the centreline construction joint between the two
lanes. This appears to be the result of mixture segregation and either confinement of the mix preventing
adequate particle movement and kneading and/ or base layer movement which reduced the effectiveness
of compaction effort. These issues appeared to be especially prevalent at transverse joints within the first
few metres of each placement and along both confined and unconfined longitudinal mat edges.
Recognizing the likelihood of segregation and compaction issues at these locations, the Nova Scotia
Standard Specification for Highway Construction and Maintenance includes guidance regarding the
location of core samples for quality control and quality assurance purposes. Section 6.2.4 in Division 4,
Section 19 “Superpave End Product Specification (EPS)”, states that cores shall not be taken within 0.15
m of the pavement edge or longitudinal joint, nor closer than 6 m to a transverse joint. While this avoids
localized segregation/ compaction issues from influencing the statistics representing the bulk of the
pavement quality, defects at these locations are overlooked within the current QA/QC methodology yet
have significant impact on the maintenance requirement and service life of the pavement. Identification
of these defects has been made by visual inspection by the Department or their designated
representatives. The Pavescan RDM results appear to provide an objective and quantifiable means by
which areas of segregation exhibiting excessive void content can be identified and located within a
compacted mat. Further development of this technology for mounting on roller compaction equipment
could provide a valuable tool to contractors for quality control purposes.

13
Figure 4 - Variation in surface dielectric value over test sections.
October 25, 2019
October 28, 2019
October 29, 2019
October 30, 2019
November 4, 2019

14
Model Calibration
Four to five core locations were sampled on the October 28, 29, 30 and November 4 Pavescan survey days
based on relatively high, low, and average surface dielectric values observed during testing. The bulk
relative density of each core was tested to determine the air void content based on the average MTD for
the lot corresponding to the location of each core sample, as shown in Table 3. Table 4 lists the sampling
date, range of chainage describing the corresponding Pavescan RDM test section, surface dielectric value
at the exact core location, and the bulk density and air void content of each core specimen. These values
were used to develop calibration models for predicting air void contents at each Pavescan measurement.
Table 4 – Bulk density and Air Void Content of Calibration Core Samples
Sampling Date Chainage (m) Surface Dielectric Bulk Density
(kg/m3)
Air Void Content
(%)
Oct 28 10+900 m to
11+463 m
4.02 2153 13.3
4.37 2230 10.3
4.86 2422 2.6
4.11 2154 13.4
4.51 2347 5.6
Oct 29 9+100 m to
9+940 m
4.50 2349 5.5
4.85 2385 4.1
4.96 2421 2.7
4.46 2321 6.7
4.31 2124 14.6
Oct 30 7+700 m to
8+370 m
4.32 2277 8.4
4.82 2408 3.2
4.51 2317 6.8
3.97 2072 16.7
Nov 4 5+540 m to
6+000 m
4.49 2222 10.7
5.10 2183 4.6
4.03 2267 15.3
4.56 2106 8.8
4.28 2372 12.2
Daily predictive models of core sample air void contents were developed based on the surface dielectric
value of the pavement at the core sample locations. Wilson et al. (2019) observed a significant interaction
between a given production day and the dielectric value on the corresponding air void content, causing a
shift in the calibration function. It was speculated that “When the calibration shifts, it could be a result of
changes in the produced mix (change in asphalt content, aggregate substitution, etc.). Though
researchers sampled plant mix each day and tested the asphalt content and theoretical maximum specific
gravity, the variability inherent with each laboratory test makes it difficult to ascribe changes in the
calibration to the mixture alone.” Exponential models relating void content to surface dielectric exhibited
the highest coefficients of determination for this study, compared to the linear model. Table 5 lists the

15
model coefficients developed for each day of asphalt concrete production. The exponential models are
shown in Figure 5.
Table 5 – Daily Exponential Model Coefficients.
Air Void Content = a ▪ e (c ▪ Surface dielectric value)
Production Date a c R2
Oct 28 53,299.3435 -2.0215 93.81%
Oct 29 106,645.2183 -2.1320 86.38%
Oct 30 33,137.7482 -1.9074 98.67%
Nov 4 1,560.9279 -1.1334 98.15%
Figure 5 – Daily exponential air void prediction models.
Figure 6 shows plan view contour plots of the interpreted void content within each test segment. Areas
of high void content are evident at the lower dielectric values observed along the longitudinal joint, at
transverse joints, and at various locations along the shoulders. The void content exhibited for the
November 4 test segment appears to generally higher than in the other segments, but the model still
provides an accurate prediction of the compaction levels for that day. No cause for the change in the
model was determined, but the change in the model behaviour could indicate a change in the material

16
characteristics of the asphalt concrete or compaction characteristics. However, given the consistency in
the maximum theoretical density amongst all test days, it seems unlikely that changes in the material
occurred. It was observed from the MacKay Bridge trial that large differences in base stiffness conditions
cause different relationships between surface dielectric and void content. It is unknown if the base
stiffness conditions were significantly different within the test section that was paved on November 4
compared to the other sections.

17
Figure 6 - Variation in interpreted void content over test sections.
October 25, 2019
October 28, 2019
October 29, 2019
October 30, 2019
November 4, 2019
18
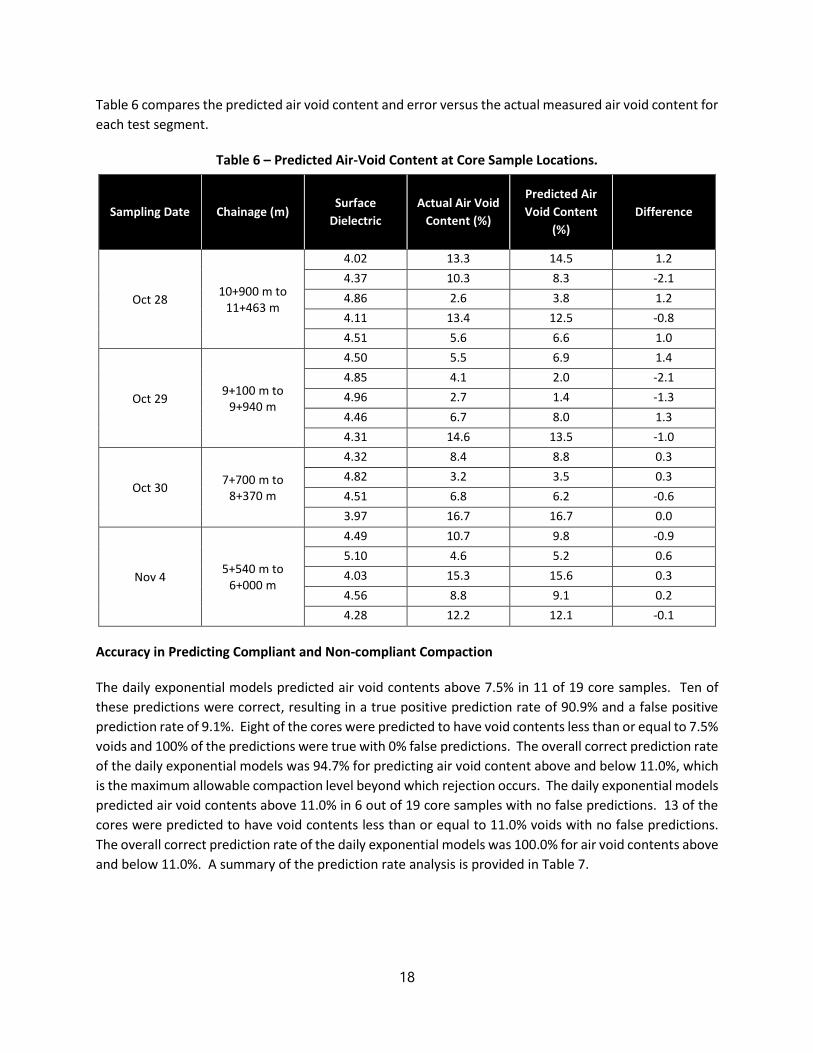
Table 6 compares the predicted air void content and error versus the actual measured air void content for
each test segment.
Table 6 – Predicted Air-Void Content at Core Sample Locations.
Sampling Date Chainage (m) Surface
Dielectric
Actual Air Void
Content (%)
Predicted Air
Void Content
(%)
Difference
Oct 28 10+900 m to
11+463 m
4.02 13.3 14.5 1.2
4.37 10.3 8.3 -2.1
4.86 2.6 3.8 1.2
4.11 13.4 12.5 -0.8
4.51 5.6 6.6 1.0
Oct 29 9+100 m to
9+940 m
4.50 5.5 6.9 1.4
4.85 4.1 2.0 -2.1
4.96 2.7 1.4 -1.3
4.46 6.7 8.0 1.3
4.31 14.6 13.5 -1.0
Oct 30 7+700 m to
8+370 m
4.32 8.4 8.8 0.3
4.82 3.2 3.5 0.3
4.51 6.8 6.2 -0.6
3.97 16.7 16.7 0.0
Nov 4 5+540 m to
6+000 m
4.49 10.7 9.8 -0.9
5.10 4.6 5.2 0.6
4.03 15.3 15.6 0.3
4.56 8.8 9.1 0.2
4.28 12.2 12.1 -0.1
Accuracy in Predicting Compliant and Non-compliant Compaction
The daily exponential models predicted air void contents above 7.5% in 11 of 19 core samples. Ten of
these predictions were correct, resulting in a true positive prediction rate of 90.9% and a false positive
prediction rate of 9.1%. Eight of the cores were predicted to have void contents less than or equal to 7.5%
voids and 100% of the predictions were true with 0% false predictions. The overall correct prediction rate
of the daily exponential models was 94.7% for predicting air void content above and below 11.0%, which
is the maximum allowable compaction level beyond which rejection occurs. The daily exponential models
predicted air void contents above 11.0% in 6 out of 19 core samples with no false predictions. 13 of the
cores were predicted to have void contents less than or equal to 11.0% voids with no false predictions.
The overall correct prediction rate of the daily exponential models was 100.0% for air void contents above
and below 11.0%. A summary of the prediction rate analysis is provided in Table 7.

19
Table 7 – Rate of Correct Predictions for Air Void Above or Below 7.5% and 11.0%.
Rate of Predictions Above and Below 7.5% Air
Void Content
Rate of Predictions Above and Below 11.0% Air Void
Content
≤ 7.5% > 7.5% Overall ≤ 11.0% > 11.0% Overall
90.9% 100.0% 94.7% 100.0% 100.0% 100.0%
Comparison to Quality Assurance Core Sample Results
Thirty-four cores were obtained by the contractor from seven lots of asphalt concrete placed over the
length the project for both quality control and quality assurance testing at predetermined random
locations selected by NSTAT. Five cores were tested from each 2,400 tonne lot of asphalt concrete, except
for a total of four cores obtained from Lot 7 which required less material to complete the project. Table
8 lists the air void contents measured from each core sample and provides the mean and standard
deviation for each lot. The date when the Pavescan RDM survey was completed on a portion of the lot is
also listed. The groups of five air void contents measured from Lots 1, 3, 5 and 7 varied over a range of
1.7% to 2.7% between the minimum and maximum values. The air void contents from Lots 2, 4, and 6
varied over larger ranges from 5.2% to 6.9% up to a single maximum value of 10.2%. The transverse
locations of the core samples were mostly located within the mid-lane area of each mat, from 0.9 m to
2.0 m and from 4.0 to 5.6 m across the full road width. These core locations provide little indication of
the suspect areas along the longitudinal joint and shoulders that were observed within the Pavescan RDM
results.
Table 8 – Air Void Content Observed in Quality Assurance Core Samples.
Lot Survey
Date Core 1 Core 2 Core 3 Core 4 Core 5 Average
Standard
Deviation
1 Oct 25 6.2% 4.1% 5.5% 5.5% 4.8% 5.2% 0.8%
2 Oct 28 8.8% 5.4% 4.4% 3.6% 6.1% 5.7% 2.0%
3 Oct 29 4.4% 5.9% 6.1% 5.5% 5.0% 5.4% 0.7%
4 Oct 30 3.0% 7.2% 4.4% 4.4% 9.9% 5.8% 2.8%
5 Nov 4 8.3% 7.0% 5.8% 7.0% 6.9% 7.0% 0.9%
6 N/A 6.2% 10.2% 7.4% 6.7% 3.9% 6.9% 2.3%
7 N/A 7.2% 8.6% 7.9% 5.9% N/A 7.4% 1.2%
Review of the air void contents predicted by the Pavescan RDM survey using the daily exponential
calibration models exhibited significantly larger mean and standard deviations compared to the quality
assurance core samples listed in Table 8. These larger values are expected since the surface dielectric
survey provides a more complete inspection of the total road surface, including areas that are avoided by
the core sampling protocol per the current NSTAT Standard Specifications. Most of the core samples were
obtained at offsets which place them within the central portion of the lane. Table 9 also lists the mean
and standard deviation of the Pavescan results obtained near the middle for each lane, excluding the
shoulders and centerline areas of the roadway where core samples are not obtained. These statistics are
similar to those developed from the quality assurance core samples but are slightly higher in air void

20
content and variability since they also include the effects associated with transverse joints which are
excluded from the core samples. The difference in mean values between Lots 1, 2, and 4 versus the
corresponding October 25, October 28, and October 30 test sections were 0.4%, 0.4% and 0.0% air void
content, respectively. The difference in these means for Lot 3 and the October 29 test section was higher
at 0.9% air void content, but the Pavescan RDM results also exhibited more significant areas of lower
dielectric/ higher void content adjacent to two transverse joints compared to the October 25, October 28,
and October 30 sections. The Pavescan results appear to overestimate the air void content within the
mat for Lot 5 as expected due to the apparent difference in the calibration model compared to the others,
but the relatively higher air contents within this lot are reflected in both the surface dielectric and core
sample results.
Table 9 – Comparison Statistics for Predicted Air Void Content to Core Samples.
Lot Survey
Date
Pavescan – All Data Pavescan – Midlane Data Core Samples
Average Standard
Deviation Average
Standard
Deviation Average
Standard
Deviation
1 Oct 25 5.9% 2.5% 4.8% 1.0% 5.2% 0.8%
2 Oct 28 6.7% 1.7% 6.1% 1.4% 5.7% 2.0%
3 Oct 29 8.8% 7.1% 6.3% 3.4% 5.4% 0.7%
4 Oct 30 6.8% 3.1% 5.8% 1.7% 5.8% 2.8%
5 Nov 4 10.0% 1.8% 9.4% 1.6% 7.0% 0.9%
A total of 648,000 surface dielectric measurements were obtained from the 10,860 m2 of paved surface
within the five test sections that were scanned for the project. Conversely, a total of 34 quality assurance
core samples were tested to represent the approximate 110,250 m2 total surface area of the project.
Given that the net total of normally distributed random errors over a large number of samples tends to
zero and provided that accurate daily calibration models are developed, it follows that the Pavescan RDM
results likely provide a more accurate and extremely robust statistical measure of the compaction
throughout the test sections than what is provided by the relatively sparse number of core samples which
by design are not representative of the entire roadway surface. This requires careful selection and precise
superposition of the Pavescan RDM data and core samples, ensuring that the full range of measured
dielectric values are evenly represented throughout the calibration model.
The ability of the Pavescan RDM to inspect the compaction quality of the full width roadway and identify
areas of high air void content provides Provincial transportation agencies with the capacity to visualize
and map areas where poor pavement performance is expected to result, including longitudinal and
transverse joint areas which are precluded from conventional quality control/ quality assurance core
sampling. Mapping these areas provides the opportunity to require repair of these areas and/ or update
the current pay adjustment process to reflect the overall quality of the roadway construction. In either
circumstance, the inspection methodology also provides a means by which new placement and
compaction processes can be evaluated to minimize joint compaction issues.

21
Conclusions and Recommendations
This study has determined that the Pavescan RDM surface dielectric profiling system can provide a robust
evaluation of pavement compaction when accurate daily calibration models have been developed for a
specific mixture placed on uniform base support conditions. The exponential function calibration model
should be developed based on selecting core samples which are evenly distributed across the full
spectrum of surface dielectric constants measured over a given production day. Intact, undamaged core
samples must be taken at exact locations marked in the Pavescan data. While calibration models
developed in this study utilized up to five cores per production day, a larger number of daily samples is
expected to provide more accurate models for predicting the air void content at other locations.
Surface dielectric surveys of the mid-lane portions of the roadway provided similar results to quality
assurance core testing results while identifying poor compaction adjacent to transverse joints.
Comprehensive full-width surveys were able to image areas of lower compaction along longitudinal and
associated transverse joints, where conventional quality assurance core sampling tends to avoid these
problematic areas.
Based on review of the Pavescan technology, the following recommendations are provided:
• Use a surveying grade GPS unit during Pavescan RDM surveys to provide horizontal positioning
accuracy in the range of 20 mm or less. This will provide sufficient accuracy to develop contour
plots directly from the Pavescan analysis software data output and enable precise re-location of
areas of interest in the field.
• The Pavescan RDM system could be used to monitor compaction over the entire paved surface
for quality assurance purposes and could provide the basis for a weighted payment adjustment
based on the measured distribution of void content. Current quality control/ quality assurance
coring protocols exclude these problematic areas, leaving significant areas of potential low
compaction and future underperformance unaccounted. Randomly selected test areas could be
surveyed as quality measures for each different lot of asphalt concrete.
• Consider collaborative review and trials of current best practices for longitudinal and transverse
joint compaction with local industry, such as the notch-wedge method used by Alaska Department
of Transportation. Implementation of a longitudinal joint and shoulder compaction bonuses
based on surface dielectric profile testing can provide incentive to improve compaction quality in
these locations.
• Evaluate the Pavescan RDM for monitoring bridge deck pavement compaction and as the basis of
measurement for an updated bridge pavement specification. Along with a waterproofing
membrane, densely compacted asphalt forms a crucial component of the deck waterproofing
protection system that contributes to the longevity of both the protection system and the deck.
Conventional nuclear density gauges are influenced by the density of the concrete deck and
reinforcing steel, while surface dielectric profiling of lifts greater than 40 mm should be feasible.

22
References
AASHTO PP98-19 Standard Specification for Asphalt Surface Dielectric Profiling System using Ground
Penetrating Radar, American Association of State Highway and Transportation Officials, 2019.
Al-Qadi, I. L., S. Lahouar, and A. Loulizi. 2001. "In situ measurements of hot-mix asphalt dielectric
properties." NDT & e International 34.6: 427-434.
Conway R., Hoegh, K., and Khazanovich, L. (2017). “Test Protocol for the Rolling Density Meter”,
http://shrp2.transportation.org/documents/SHRP2_R06C_Test_Protocol_Appendix_r6.pdf.
Hoegh, K., Dai, S., and Khazanovich, L. (2017). “Asphalt Pavement Compaction Assessment using Ground
Penetrating Radar-Arrays”,
http://shrp2.transportation.org/SiteAssets/Pages/R06C_RapidTechnologiestoEnhanceQualityCo
ntrol/RDMpaperForCongressProceedings.pdf.
Khazanovich, L., Hoegh, K., Conway, R., and Dai, S. (2017). “Nondestructive Evaluation of Bituminous
Compaction Uniformity Using Rolling Density”,
http://shrp2.transportation.org/documents/SHRP2_RO6C_NonDestructiveEval_v6.pdf.
Pavescan RDM Manual, Geophysical Survey Systems Inc., MN36-540 Rev E, 2019.
Popik, M., K. Maser, and C. Holzschuher. (2010). "Using high-speed ground penetrating radar for
evaluation of asphalt density measurements." Annual conference & exhibition of the
Transportation Association of Canada.
Scullion, T. and Y. Chen. (1999). Using Ground-Penetrating Radar for Real-Time Quality Control
Measurements on New HMA Surfaces, Report 1702-5, Texas Transportation Institute.