PAVEMENT SURFACE CONDITION RATING MANUAL · Pavement Surface Condition Rating Manual Fifth Edition...
95
PAVEMENT SURFACE CONDITION RATING MANUAL Fifth Edition August, 2016 British Columbia Ministry of Transportation and Infrastructure Construction Maintenance Branch Prepared by: Opus International Consultants (Canada) Limited
Transcript of PAVEMENT SURFACE CONDITION RATING MANUAL · Pavement Surface Condition Rating Manual Fifth Edition...
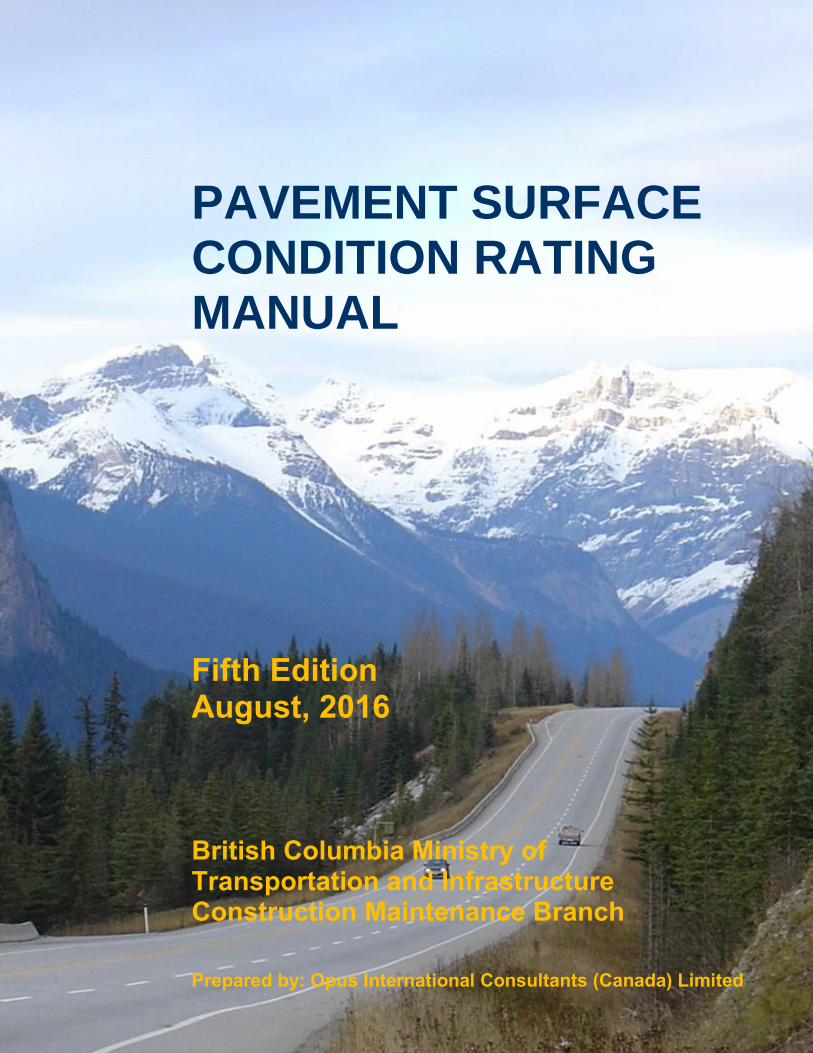
PAVEMENT SURFACE CONDITION RATING MANUAL
Fifth Edition August, 2016 British Columbia Ministry of Transportation and Infrastructure Construction Maintenance Branch Prepared by: Opus International Consultants (Canada) Limited

This page has been intentionally left blank.

Pavement Surface Condition Rating Manual
Fifth Edition
August, 2016
Construction Maintenance Branch
Prepared By:
Opus Consultants International (Canada) Limited

This page has been intentionally left blank.

2016 PAVEMENT SURFACE CONDITION RATING MANUAL
CONSTRUCTION AND MAINTENANCE BRANCH i
Table of Contents Page
1 INTRODUCTION ..........................................................................................1 1.1 Overview ............................................................................................1
1.2 Rating Manual Background ................................................................2
1.3 Format of Manual ...............................................................................2
2 PAVEMENT CONDITION SURVEYS ..........................................................3 2.1 Network Level Surveys ......................................................................3
2.2 Project Level Manual Surveys ...........................................................6
3 SURFACE DISTRESS INSPECTION GUIDELINES ....................................7 3.1 Distress Identification .........................................................................7
3.2 Rating Severity ..................................................................................8
3.3 Rating Density for Network Level Surveys .........................................9
3.4 Network Level Distress Survey Requirements ................................. 13
3.5 Project Level Manual Survey Inspections ........................................ 14
4 FLEXIBLE PAVEMENT DISTRESS RATING ............................................ 15 4.1 Longitudinal Wheel Path Cracking (LWP) ........................................ 16
4.2 Longitudinal Joint Cracking (LJC) .................................................... 19
4.3 Pavement Edge Cracking (PEC) ..................................................... 22
4.4 Transverse Cracking (TC) ................................................................ 25
4.5 Meandering Longitudinal Cracking (MLC)........................................ 28
4.6 Alligator Cracking (AC) .................................................................... 31
4.7 Rutting (RUT) ................................................................................... 34
4.8 Shoving (SHV) ................................................................................. 37
4.9 Distortion (DST) ............................................................................... 39
4.10 Bleeding (BLD) ................................................................................ 41
4.11 Potholes (POT) ................................................................................ 43
4.12 Ravelling (RAV) ............................................................................... 46
5 ROUGHNESS AND RUT DEPTH GUIDELINES ....................................... 49
5.1 Longitudinal Profiles ........................................................................ 49
5.2 Transverse Profiles .......................................................................... 50
5.3 Additional Operational Requirements .............................................. 50
5.4 Transient Events .............................................................................. 51
2016 PAVEMENT SURFACE CONDITION RATING MANUAL
CONSTRUCTION AND MAINTENANCE BRANCH ii
6 NETWORK LEVEL SURVEYS LOCATIONAL REFERENCING ............... 52 6.1 General ............................................................................................ 52
6.2 GPS Measurements......................................................................... 52
6.3 Linear Measurements ...................................................................... 52
6.4 Digital Mapping ................................................................................ 53
6.5 Highway Definitions ......................................................................... 54
6.6 Lane Numbering .............................................................................. 55
6.7 Divided Highways ............................................................................ 56
6.8 Lane Location Referencing .............................................................. 56
6.9 Landmark Referencing..................................................................... 57
7 NETWORK LEVEL SURVEYS QA SPECIFICATIONS ............................. 58 7.1 Introduction ...................................................................................... 58
7.2 Initial Quality Assurance Tests ......................................................... 58
7.3 Field Survey / Distress Rating QA ................................................... 61
7.4 Submitted Data Quality Assurance .................................................. 62
7.5 Data File Specifications ................................................................... 63
7.6 File Examples .................................................................................. 63
7.7 Right of Way Digital Image Specifications ....................................... 68
8 MISCELLANEOUS RATINGS ................................................................... 77 8.1 Drainage Conditions ........................................................................ 78
8.2 Crack Sealing .................................................................................. 80
8.3 Patching ........................................................................................... 81
9 PAVEMENT CONDITION FORMS ............................................................. 83

2016 PAVEMENT SURFACE CONDITION RATING MANUAL
CONSTRUCTION AND MAINTENANCE BRANCH iii
List of Figures Page FIGURE 1 - LOW SEVERITY LWP ............................................................................... 17
FIGURE 2 - MODERATE SEVERITY LWP ................................................................... 17
FIGURE 3 - HIGH SEVERITY LWP (MULTIPLE CRACKS) ......................................... 18
FIGURE 4 - HIGH SEVERITY LWP .............................................................................. 18
FIGURE 5 - LOW SEVERITY LJC ................................................................................ 20
FIGURE 6 - MODERATE SEVERITY LJC .................................................................... 20
FIGURE 7 - HIGH SEVERITY LJC (MULTIPLE CRACKS) ........................................... 21
FIGURE 8 - HIGH SEVERITY LJC (SINGLE CRACK) .................................................. 21
FIGURE 9 - LOW SEVERITY PEC ............................................................................... 23
FIGURE 10 - MODERATE SEVERITY PEC ................................................................. 23
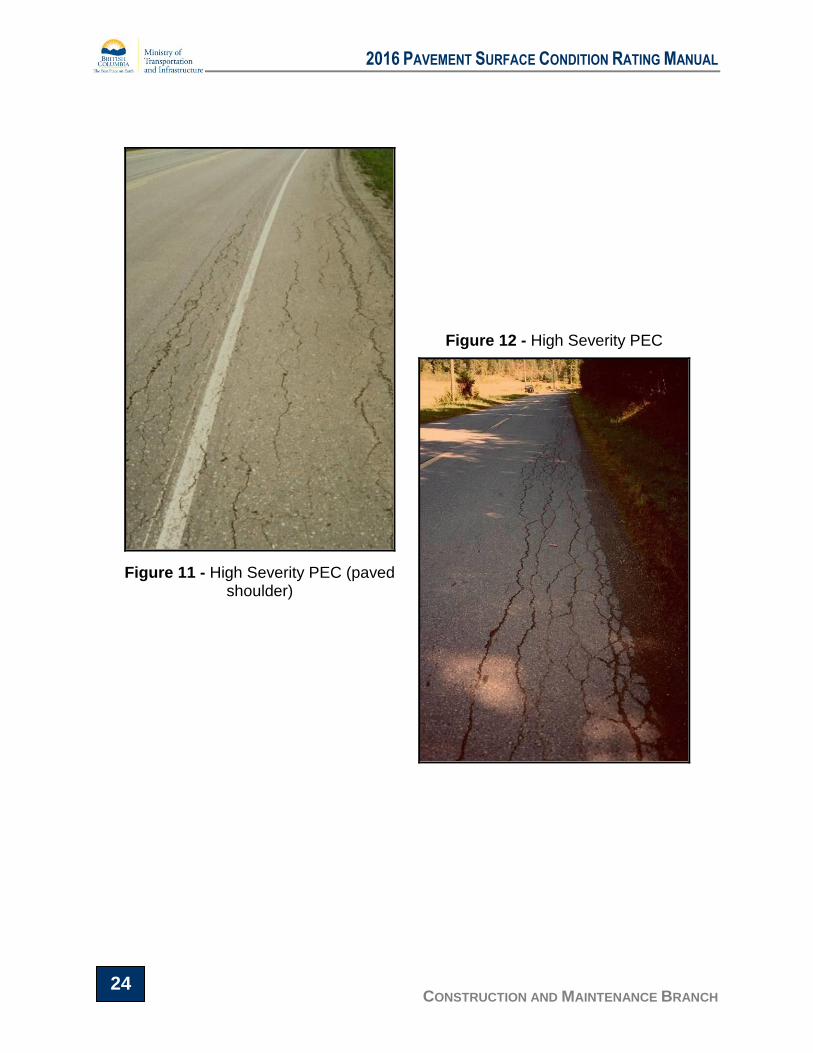
FIGURE 11 - HIGH SEVERITY PEC (PAVED SHOULDER) ........................................ 24
FIGURE 12 - HIGH SEVERITY PEC............................................................................. 24
FIGURE 13 - LOW SEVERITY TC ................................................................................ 26
FIGURE 14 - MODERATE SEVERITY TC .................................................................... 26
FIGURE 15 - HIGH SEVERITY TC (MULTIPLE CRACKING AND SPALLING) ........... 27
FIGURE 16 - HIGH SEVERITY TC ............................................................................... 27
FIGURE 17- LOW SEVERITY MLC .............................................................................. 29
FIGURE 18 - MODERATE SEVERITY MLC ................................................................. 29
FIGURE 19 - HIGH SEVERITY MLC (MULTIPLE AND ALLIGATOR CRACKING) ...... 30
FIGURE 20 - HIGH SEVERITY MLC ............................................................................ 30
FIGURE 21 - MODERATE SEVERITY AC .................................................................... 32
FIGURE 22 - MODERATE SEVERITY AC (LOCALIZED FAILURE) ............................ 32
FIGURE 23 - HIGH SEVERITY AC (SPALLING AND THROUGHOUT DENSITY) ...... 33
FIGURE 24 - HIGH SEVERITY AC WITH BREAK UP AND PUMPING ........................ 33
FIGURE 25 - LOW SEVERITY RUT ............................................................................. 35
FIGURE 26 - MODERATE SEVERITY RUT ................................................................. 35
FIGURE 27 - HIGH SEVERITY RUT WITH .................................................................. 36
FIGURE 28 - HIGH SEVERITY RUT............................................................................. 36
FIGURE 29 - TYPICAL CASE AT DOWNGRADE INTERSECTION ............................. 38

2016 PAVEMENT SURFACE CONDITION RATING MANUAL
CONSTRUCTION AND MAINTENANCE BRANCH iv
FIGURE 30 - HIGH SEVERITY SHV (DEFINED BY RELATIVE ................................... 38
FIGURE 31 - MODERATE SEVERITY DST ................................................................. 40
FIGURE 32 - MODERATE SEVERITY DST ................................................................. 40
FIGURE 33 - MODERATE SEVERITY BLD .................................................................. 42
FIGURE 34 - HIGH SEVERITY BLD ............................................................................. 42
FIGURE 35 - LOW SEVERITY POT (CLOSE UP VIEW) .............................................. 44
FIGURE 36 - MODERATE SEVERITY POT ................................................................. 44
FIGURE 37 - HIGH SEVERITY POTHOLE ................................................................... 45
FIGURE 38 - HIGH SEVERITY POTHOLE WITH ASPHALT BREAK UP .................... 45
FIGURE 39 - MODERATE SEVERITY RAV ................................................................. 47
FIGURE 40 - HIGH SEVERITY RAV............................................................................. 47
FIGURE 41 – ACCEPTABLE DRAINAGE .................................................................... 79
FIGURE 42 – UNACCEPTABLE DRAINAGE ............................................................... 79
FIGURE 43 - LEVEL 1 SEALING .................................................................................. 80
FIGURE 44 - LEVEL 3 SEALING .................................................................................. 80
FIGURE 45 - LEVEL 1 PATCHING ............................................................................... 81
FIGURE 46 - LEVEL 2 PATCHING ............................................................................... 81
2016 PAVEMENT SURFACE CONDITION RATING MANUAL
CONSTRUCTION AND MAINTENANCE BRANCH 1
1 Introduction
1.1 Overview
The British Columbia Ministry of Transportation and Infrastructure (BCMoT) has
implemented a multifaceted pavement asset management program. It is built
around the Roadway Pavement Management System (RPMS) application and
supported by data collection procedures and asset management policies.
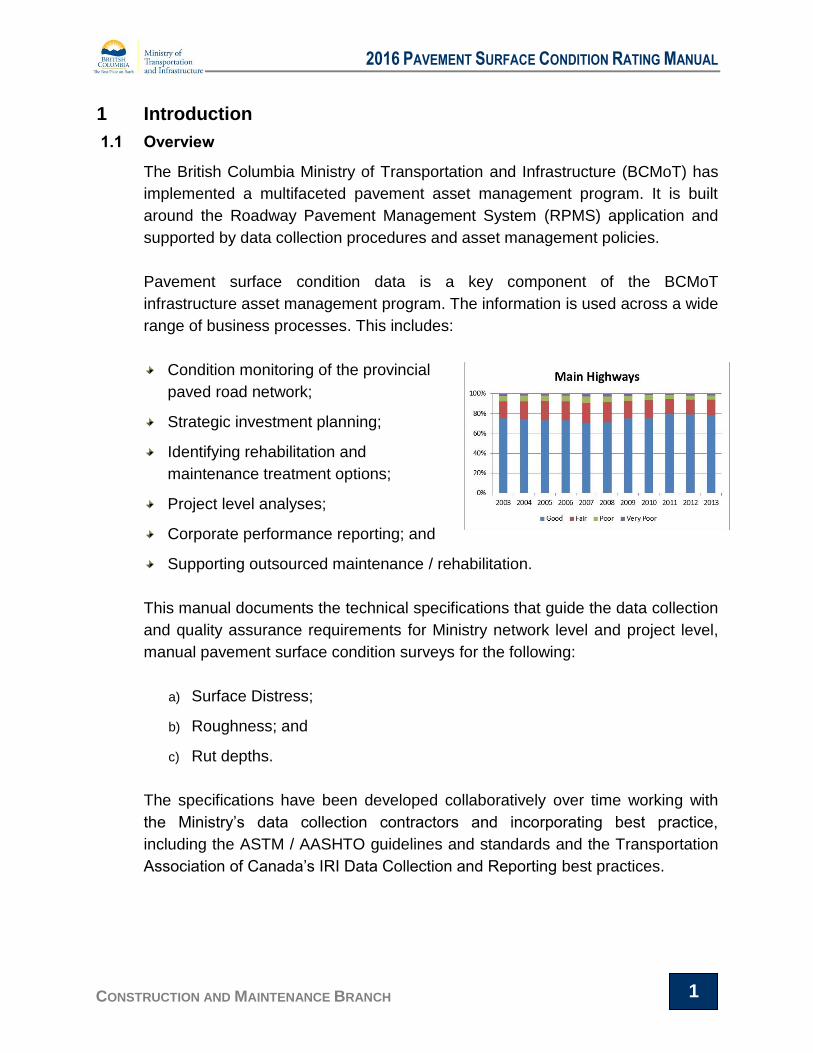
Pavement surface condition data is a key component of the BCMoT
infrastructure asset management program. The information is used across a wide
range of business processes. This includes:
Condition monitoring of the provincial
paved road network;
Strategic investment planning;
Identifying rehabilitation and
maintenance treatment options;
Project level analyses;
Corporate performance reporting; and
Supporting outsourced maintenance / rehabilitation.
This manual documents the technical specifications that guide the data collection
and quality assurance requirements for Ministry network level and project level,
manual pavement surface condition surveys for the following:
a) Surface Distress;
b) Roughness; and
c) Rut depths.
The specifications have been developed collaboratively over time working with
the Ministry’s data collection contractors and incorporating best practice,
including the ASTM / AASHTO guidelines and standards and the Transportation
Association of Canada’s IRI Data Collection and Reporting best practices.
2016 PAVEMENT SURFACE CONDITION RATING MANUAL
CONSTRUCTION AND MAINTENANCE BRANCH 2
1.2 Rating Manual Background
The BCMoT Pavement Surface Condition Rating Manual was originally released
in 1994. It was developed by a committee comprised of provincial rehabilitation
and pavement design personnel.
The manual was subsequently updated in 2002, 2009, and 2012 based on field
experience and input from data collection contractors capturing improvements to
the survey procedures and quality assurance, consolidation of specifications,
advancements in surveying technology and a wider application of the manual.
This fifth release provides further updates on current practices to support Ministry
asset management needs.
1.3 Format of Manual
The manual is structured according to the following chapters:
Chapter 1 - Introduction
Chapter 2 - Pavement Surface Condition Surveys;
Chapter 3 - Flexible Pavement Distresses;
Chapter 4 - Surface Distress Inspection Guidelines;
Chapter 5 - Pavement Roughness and Rut Depth Guidelines;
Chapter 6 - Network Level Surveying Locational Referencing;
Chapter 7 - Network Level Survey QA Specifications;
Chapter 8 - Pavement Performance Indices;
Chapter 9 - Miscellaneous Ratings; and
Chapter 10 - Manual Pavement Condition Rating Forms.
2016 PAVEMENT SURFACE CONDITION RATING MANUAL
CONSTRUCTION AND MAINTENANCE BRANCH 3
2 Pavement Condition Surveys
This chapter provides an overview of current practices for contracted network
level surveys, and for project level distress surveys.
Note: These principles are also applicable to the pavement condition survey
requirements of BCMoT concession agreements. However, the concession
agreements may also contain additional requirements. In the case of any material
contradiction between the information contained in this manual, and that required
in a concession agreement or network level survey contract, the language in the
concession agreement or network level survey contract shall take precedence.
2.1 Network Level Surveys
Network level pavement surface condition surveys are conducted on a cyclical
basis for the provincial road network. The surveys capture the severity and
density of several surface distress types within each surveyed lane, rut depth and
roughness measurements in both wheel paths, and digital images of the right-of-
way.
The objective of the network level surveys is to obtain performance data that is
sufficiently accurate, representative and consistent to support network level
analyses. This involves the survey of the condition of the paved numbered
highways and a representative sample of all paved side roads under the
Ministry's jurisdiction, to identify pavements that are deficient, according to
defined levels of service, and to monitor trends in highway condition. Data is
used to ascertain overall pavement rehabilitation needs and assess appropriate
investment levels to support strategic asset management planning. This in turn
dictates the rating methodology and measuring equipment that are used for the
surveys.
Multi-year pavement condition survey contacts are outsourced to contractors with
multi-function pavement evaluation vehicles equipped with sophisticated on-
board systems and instrumentation. Using third party contractors supports
objectivity and consistency throughout the province. The surveys are guided by
quality assurance procedures to ensure that collected data is accurate,
repeatable, and of consistent quality and integrity from year to year and between
contractors.
2016 PAVEMENT SURFACE CONDITION RATING MANUAL
CONSTRUCTION AND MAINTENANCE BRANCH 4
The network level pavement surface condition surveys are conducted every two
years on the primary highway system, either a two or four year cycle for
secondary highways (depending on highway significance) and every four years
for selected paved side roads.
A brief description of the types of data collected and the equipment used to date
for the network level surveys follows.
2.1.1 Surface Distress
The rating is performed in accordance with this manual. The rating data is
collected continuously and reported at 50 metre intervals. The distress types
included for the network level surveys include:
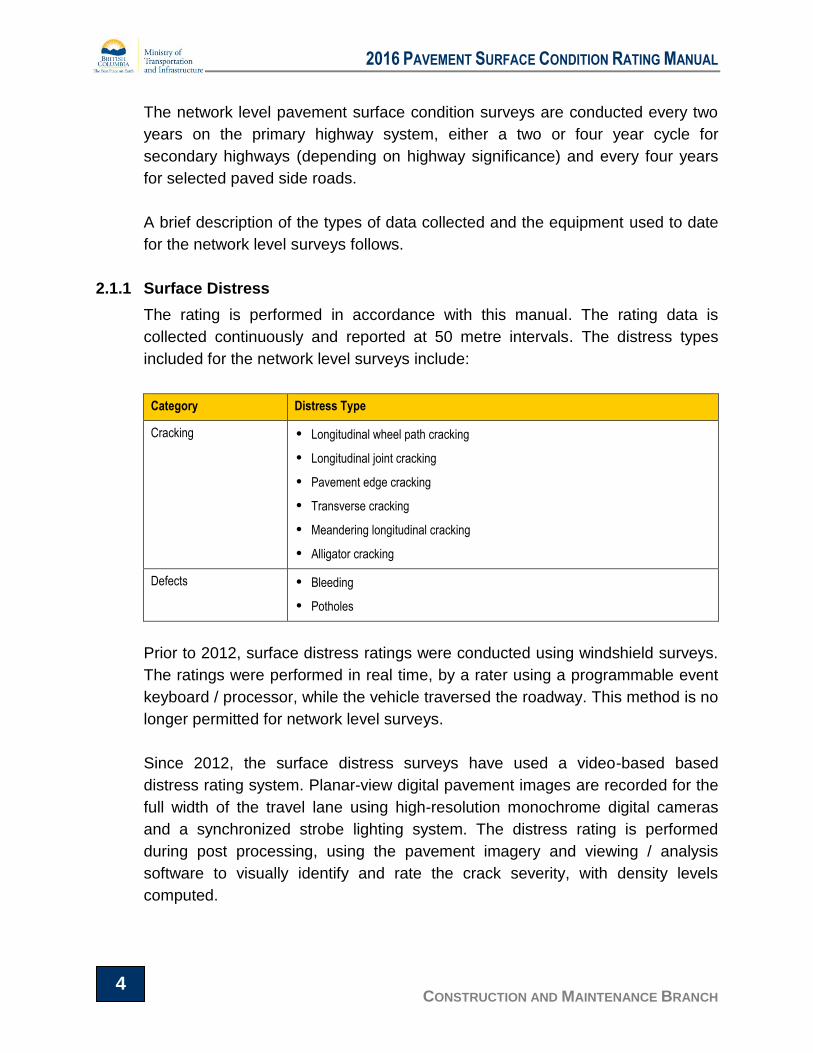
Category Distress Type
Cracking
• Longitudinal wheel path cracking
• Longitudinal joint cracking
• Pavement edge cracking
• Transverse cracking
• Meandering longitudinal cracking
• Alligator cracking
Defects • Bleeding
• Potholes
Prior to 2012, surface distress ratings were conducted using windshield surveys.
The ratings were performed in real time, by a rater using a programmable event
keyboard / processor, while the vehicle traversed the roadway. This method is no
longer permitted for network level surveys.
Since 2012, the surface distress surveys have used a video-based based
distress rating system. Planar-view digital pavement images are recorded for the
full width of the travel lane using high-resolution monochrome digital cameras
and a synchronized strobe lighting system. The distress rating is performed
during post processing, using the pavement imagery and viewing / analysis
software to visually identify and rate the crack severity, with density levels
computed.
2016 PAVEMENT SURFACE CONDITION RATING MANUAL
CONSTRUCTION AND MAINTENANCE BRANCH 5
Fully automated distress rating, using the Laser Crack Measurement System
(LCMS) and crack detection / analysis software has not been used to date for
BCMoT surveys, but is anticipated in the near future.
2.1.2 Rutting
The transverse profile of the travel lane is measured on a continuous basis.
Sensor measurements are recorded across the full lane profile and used to
calculate the average rut depths for each wheel path and the maximum rut depth
in each wheel path. The data is collected continuously and reported at 50 metre
intervals. Both multi-sensor profilers and scanning laser profilers have been used
to date.
2.1.3 Roughness
Longitudinal profile roughness measurements are collected for each wheel path
on a continuous basis using a laser profiler that conforms to the FHWA Class II
Profiler Specification. The data is collected continuously, and reported at 50
metre averaged intervals, as per the International Roughness Index (IRI)
protocols.
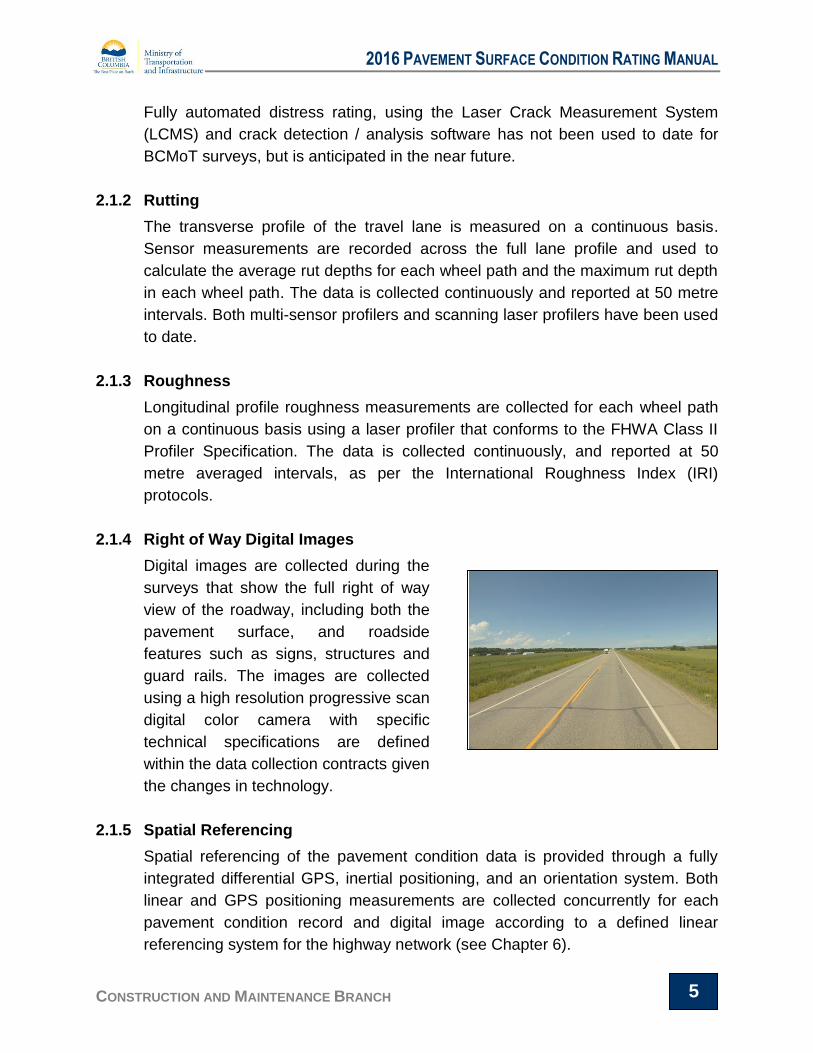
2.1.4 Right of Way Digital Images
Digital images are collected during the
surveys that show the full right of way
view of the roadway, including both the
pavement surface, and roadside
features such as signs, structures and
guard rails. The images are collected
using a high resolution progressive scan
digital color camera with specific
technical specifications are defined
within the data collection contracts given
the changes in technology.
2.1.5 Spatial Referencing
Spatial referencing of the pavement condition data is provided through a fully
integrated differential GPS, inertial positioning, and an orientation system. Both
linear and GPS positioning measurements are collected concurrently for each
pavement condition record and digital image according to a defined linear
referencing system for the highway network (see Chapter 6).
2016 PAVEMENT SURFACE CONDITION RATING MANUAL
CONSTRUCTION AND MAINTENANCE BRANCH 6
2.2 Project Level Manual Surveys
Manual surface distress surveys are sometimes conducted during the more
detailed evaluations that are carried out for candidate rehabilitation project
planning. In addition to distress surveys, this can include geotechnical
investigations, strength testing, coring, and laboratory testing.
The purpose of the project level manual distress surveys is to provide a more
accurate and detailed investigation of the pavement deterioration to assist in
determining appropriate rehabilitation treatments.
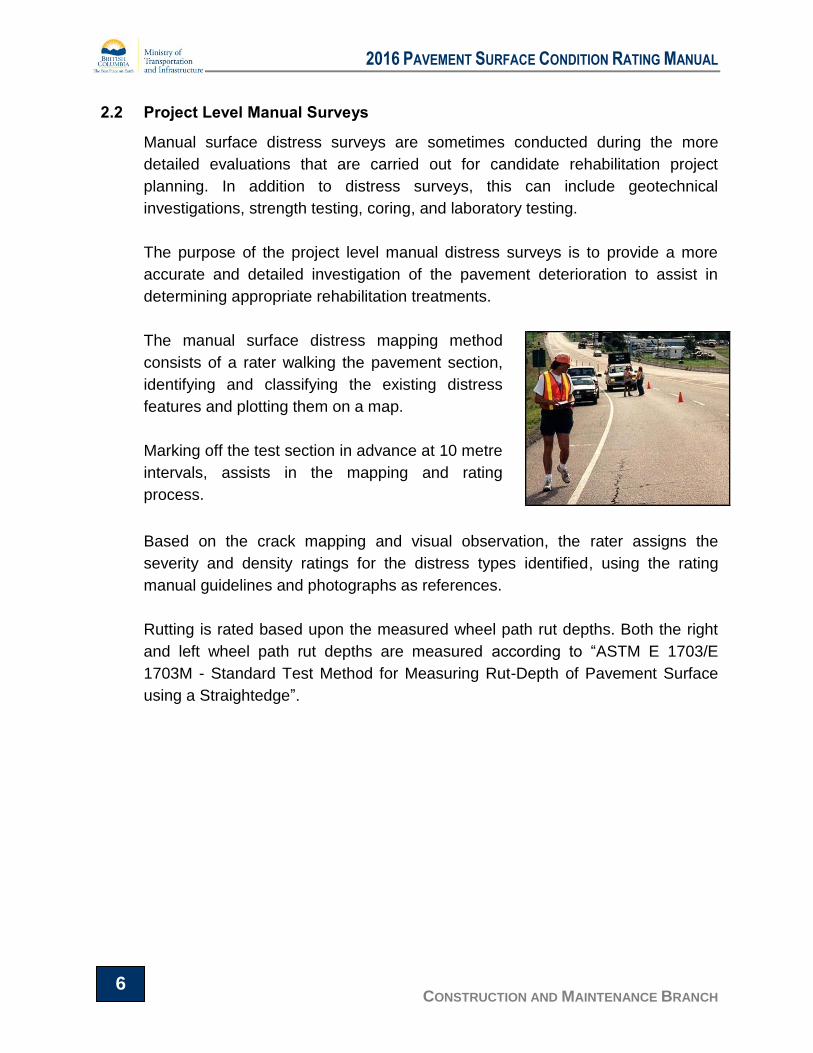
The manual surface distress mapping method
consists of a rater walking the pavement section,
identifying and classifying the existing distress
features and plotting them on a map.
Marking off the test section in advance at 10 metre
intervals, assists in the mapping and rating
process.
Based on the crack mapping and visual observation, the rater assigns the
severity and density ratings for the distress types identified, using the rating
manual guidelines and photographs as references.
Rutting is rated based upon the measured wheel path rut depths. Both the right
and left wheel path rut depths are measured according to “ASTM E 1703/E
1703M - Standard Test Method for Measuring Rut-Depth of Pavement Surface
using a Straightedge”.
2016 PAVEMENT SURFACE CONDITION RATING MANUAL
CONSTRUCTION AND MAINTENANCE BRANCH 7
3 Surface Distress Inspection Guidelines
This chapter provides inspection guidelines for conducting both network level and
manual, project level surface distress surveys.
3.1 Distress Identification
The following are key points with respect to overall distress identification:
Distress ratings apply only to the traveled lane with the exception of
pavement edge and longitudinal joint cracks.
Transverse crack ratings should not be influenced by the shoulder conditions
as some types of pavement rehabilitation (i.e. milling) treat just the main
travelled lane.
Longitudinal joint cracks can occur within +/- 300 mm on either side of the
center line.
If doubt exists as to whether a crack is a longitudinal joint crack or a
longitudinal wheel path crack, assign the latter.
Pavement edge cracks can occur within +/- 300 mm of the pavement edge
line marking (i.e. fog line) or where no line marking exists, within +/-300 mm
of where the line marking would be based on an appropriate lane width for
such a road.
Alligator cracking is a load related distress that is indicative of structural
failure in the layer materials and will generally be either longitudinal or defined
as isolated blowouts.
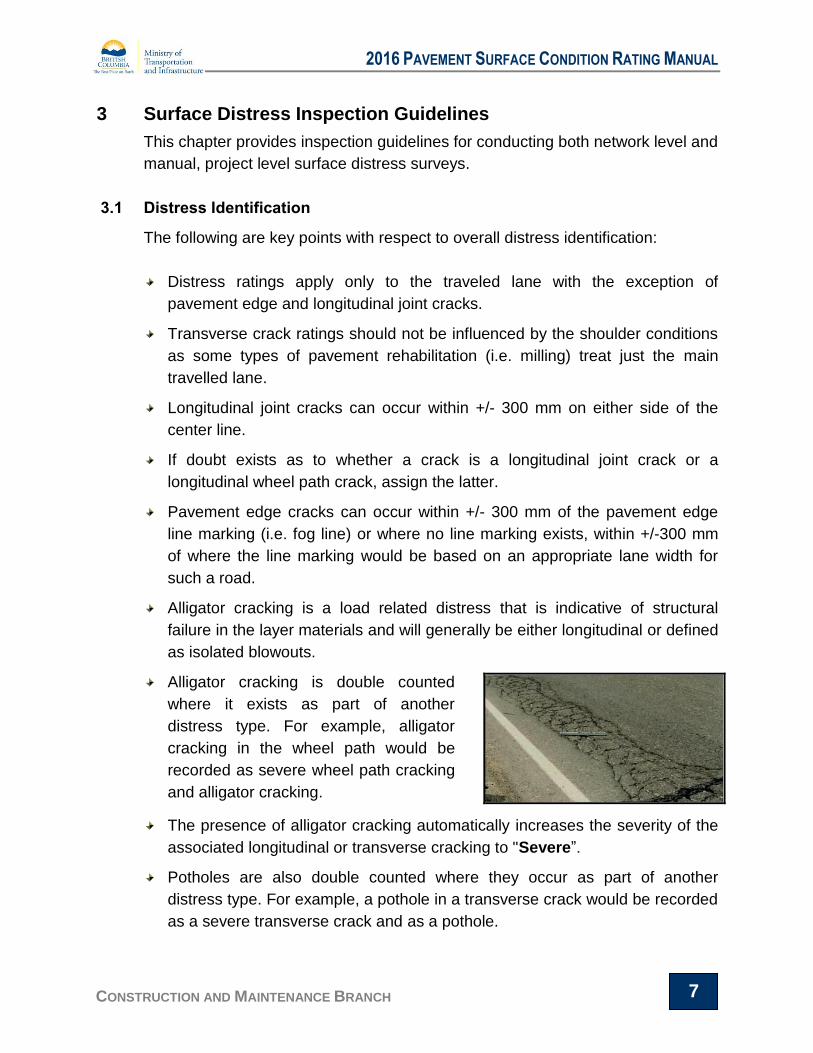
Alligator cracking is double counted
where it exists as part of another
distress type. For example, alligator
cracking in the wheel path would be
recorded as severe wheel path cracking
and alligator cracking.
The presence of alligator cracking automatically increases the severity of the
associated longitudinal or transverse cracking to "Severe”.
Potholes are also double counted where they occur as part of another
distress type. For example, a pothole in a transverse crack would be recorded
as a severe transverse crack and as a pothole.

2016 PAVEMENT SURFACE CONDITION RATING MANUAL
CONSTRUCTION AND MAINTENANCE BRANCH 8
3.2 Rating Severity
The following are key points with respect to rating severity for both, network level
and project level manual surface distress surveys:
10 Percent Rule – when trying to assign
the severity level for an individual crack, if
at least 10% of the crack is in a higher
severity level, the higher level is assigned.
For example, if a transverse crack is 2.0
metres in length, with 0.25 metres
measured at high severity and the
remainder at moderate, the crack is
assigned a high severity level.
Example of 10% Rule
Low severity cracks can only consist of single cracks and no spalling.
Moderate severity cracks can consist of single or multiple cracks with
moderate spalling.
High severity cracks can consist of single or multiple cracks with severe
spalling.
Spalling means significant breakage and chipping of the crack edges.
Cracks that are fully sealed are rated as low severity. Cracks that are not
fully sealed are rated as per the inspection guidelines described in Chapter 4.
Please note that for network level surveys, cracks with intact, or fully effective
sealant are to be rated as low severity. If a crack has not been sealed, or if it
has been sealed and it is apparent that the crack sealant is no longer
effective, it should be rated as per the inspection guidelines contain in
Chapter 4 (refer to Figure 4 for example).
There is no Low severity level for alligator cracking, distortion, raveling and
bleeding – only moderate and high.
The severity rating for rutting is assigned based on the averaged left and right
wheel path rut depth measurements.
Low severity potholes should be clearly distinguishable from surface
ravelling. Small depressions less than 15 cm in diameter and 25 mm deep are
not to be rated as potholes.
2016 PAVEMENT SURFACE CONDITION RATING MANUAL
CONSTRUCTION AND MAINTENANCE BRANCH 9
3.3 Rating Density for Network Level Surveys
The following are key points with respect to rating density for network level
surveys:
Number means the number of transverse cracks or potholes identified within
a single 50 metre length of roadway lane.
Length means the proportionate length of the distress identified within a
single 50 metre length of roadway lane.
Area means the measure area of the surface deterioration in square metres.
Quantification of distress density is based on evaluation of a single 50 metre
length of roadway lane.
The density calculations for longitudinal wheel path cracking, rutting, shoving
and bleeding requires measurement of the surface distress in each wheel
path. The calculated density if is based on the total length of distress over a
single 50 metre length of roadway lane times two (i.e. 50 metre segment: 2 x
50 = 100 metre total wheel path length).
Table 1 on the next page describes how the density ratings presented in this
manual are converted into percentage values for the network level distress
surveys when integrated keyboards are used and there is a transition from
one severity level to another. For other more accurate data acquisition
methods, the actual values can be used.
Additional examples are provided in Chapter 3 for each distress type and
sample files are contained in Chapter 7.

2016 PAVEMENT SURFACE CONDITION RATING MANUAL
CONSTRUCTION AND MAINTENANCE BRANCH 10
Table 1: Conversion of Density Ratings to Percentage Values
Distress Type Severity
Levels
Density
Measure
Basis for Calculation and Acceptable
Density Values
Longitudinal Wheel
Path Cracking
L-M-H Linear
Total combined length of cracking measured in each wheel
path divided by the segment length x 2 (i.e. 100 m)
Longitudinal Joint
Cracking
L-M-H Total length of crack measured divided by the segment length
Pavement Edge
Cracking
L-M-H Total length of crack measured divided by the segment length
Meandering
Longitudinal
Cracking
L-M-H Total length of crack measured divided by the segment length
Bleeding M-H Total length of bleeding measured in each wheel path over combined 100 m wheel path length
Transverse
Cracking
L-M-H Number
• 0% - no transverse cracking is present
• 5% - few (1-2 cracks)
• 35% frequent (3 – 10 cracks)
• 90% - throughout (>10 cracks)
Potholes L-M-H • 0% - none
• 5% - few (1 -2 potholes)
• 35% - frequent (3 to 9 potholes)
• 90% - throughout (> 10 potholes)
Alligator Cracking M-H Area • 0% - none
• 5% - few
• 15% - intermittent
• 35% - frequent
• 65% - extensive
• 90% - throughout
Rutting L-M-H Segment • 0% - neither wheel path rut depths are 3 mm
• 35% -only one wheel path rut depths is 3 mm
• 90% - both wheel path rut depths are 3 mm
2016 PAVEMENT SURFACE CONDITION RATING MANUAL
CONSTRUCTION AND MAINTENANCE BRANCH 11
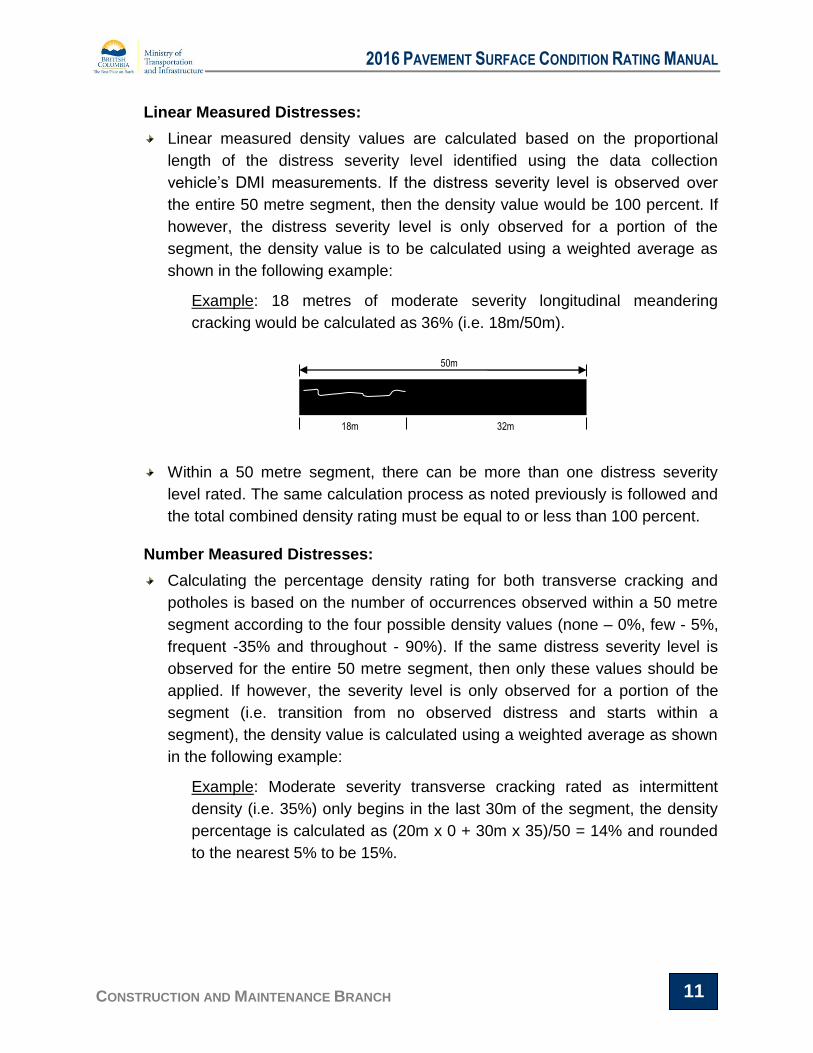
Linear Measured Distresses:
Linear measured density values are calculated based on the proportional
length of the distress severity level identified using the data collection
vehicle’s DMI measurements. If the distress severity level is observed over
the entire 50 metre segment, then the density value would be 100 percent. If
however, the distress severity level is only observed for a portion of the
segment, the density value is to be calculated using a weighted average as
shown in the following example:
Example: 18 metres of moderate severity longitudinal meandering
cracking would be calculated as 36% (i.e. 18m/50m).
Within a 50 metre segment, there can be more than one distress severity
level rated. The same calculation process as noted previously is followed and
the total combined density rating must be equal to or less than 100 percent.
Number Measured Distresses:
Calculating the percentage density rating for both transverse cracking and
potholes is based on the number of occurrences observed within a 50 metre
segment according to the four possible density values (none – 0%, few - 5%,
frequent -35% and throughout - 90%). If the same distress severity level is
observed for the entire 50 metre segment, then only these values should be
applied. If however, the severity level is only observed for a portion of the
segment (i.e. transition from no observed distress and starts within a
segment), the density value is calculated using a weighted average as shown
in the following example:
Example: Moderate severity transverse cracking rated as intermittent
density (i.e. 35%) only begins in the last 30m of the segment, the density
percentage is calculated as (20m x 0 + 30m x 35)/50 = 14% and rounded
to the nearest 5% to be 15%.
50m
18m 32m

2016 PAVEMENT SURFACE CONDITION RATING MANUAL
CONSTRUCTION AND MAINTENANCE BRANCH 12
Similarly, within a 50 metre segment, there can be a transition between
density levels. The same calculation process as noted previously is followed.
Example: The first 30m of a segment exhibits low severity transverse
cracking with a “few” density level (i.e. 5%) and the last 20m is rated at a
“frequent” density (35%), the overall segment density percentage would
be (30m x 5 + 20m x 35)/50 = 17% and rounded to 15% (i.e. nearest 5%)
Within a 50 metre segment, there can be more than one distress severity
level rated. The same calculation process as noted previously is followed and
the total combined density rating must be equal to or less than 100 percent.
Area Measured Distresses:
Calculating the percentage density rating for alligator cracking is performed
the same way as that noted above for transverse cracking and potholes. It is
based however, on the number of occurrences observed within a 50 metre
segment according to the six possible density levels (none – 0%, few - 5%,
intermittent – 15%, frequent -35%, extensive – 65% and throughout - 90%).
If the distress severity level is observed for the entire 50 metre segment, then
only these values should be applied. If however, the distress severity level is
observed for a portion of the segment or there is a transition within the
segment between the two defined severity levels, the density values are
calculated by taking a weighted average as noted above.
50m
30m 20m
50m
20m 30m
2016 PAVEMENT SURFACE CONDITION RATING MANUAL
CONSTRUCTION AND MAINTENANCE BRANCH 13
3.4 Network Level Distress Survey Requirements
The following additional surface distress inspection guidelines are to be applied
when conducting network level surveys:
Surveys are performed according to the distress rating definitions contained
within this manual for the following distress types:
a) Longitudinal wheel path cracking;
b) Longitudinal joint cracking;
c) Pavement edge cracking;
d) Transverse cracking;
e) Meandering longitudinal cracking;
f) Alligator cracking;
g) Rutting;
h) Potholes; and
i) Bleeding.
Rutting is rated using the transverse profile measurements – the severity level
is assigned based on the reported average rut depth value and the density
level, according to Table 1;
The hours of operation of the survey vehicle are between sunrise and one
hour prior to sunset for those surveys that require visual rating of the digital
imagery;
The above hours of operations may not apply for surface distress surveys that
employ more advanced technology, including strobe lighting or fully
automated 3D laser based solutions. Such an assessment will be based on
the contractor’s equipment.
All provincial regulations and traffic control requirements must be followed.
Surveys are not to be conducted when raining.
Distress ratings are conducted on a continuous basis with results reported at
50 metres intervals by the lane specified.
2016 PAVEMENT SURFACE CONDITION RATING MANUAL
CONSTRUCTION AND MAINTENANCE BRANCH 14
3.5 Project Level Manual Survey Inspections
The following additional surface distress inspection guidelines are to be applied
when conducting project level, manual surveys:
Rating segments can be 20 to 50 metres in length and one lane wide for
manual project level surveys
The rater is advised to mark out the test segments in advance using a tape
measure to assist in the distress mapping. Forms to be used for the distress
mapping are provided in this manual.
All provincial regulations and traffic control requirements must be followed.
Each test segment should be evaluated separately, with the distress types
and severity/extent ratings assigned while on the site. Ensure distresses that
occur in the transition between segments are assigned correctly and not
duplicated on adjacent segments.
For distress mapping purposes, abbreviations for the distress types are used
with the severity level identified on the map. For example, TC-M denotes a
transverse crack of moderate severity. Cracks that have been fully sealed are
denoted with a subscript “s” (i.e. TCs).
Any features that cannot be drawn on the distress mapping form should be
noted in the comments section.
Both the left and right wheel path rut depths should be measured at 5 metre
intervals. The highest rut depth measurement identified within the test
segment is used as the criteria for assigning the severity.
Following the manual rating of all the test segments, the rater should walk the
entire site a few times to ensure that the severity and density ratings have
been consistently applied.
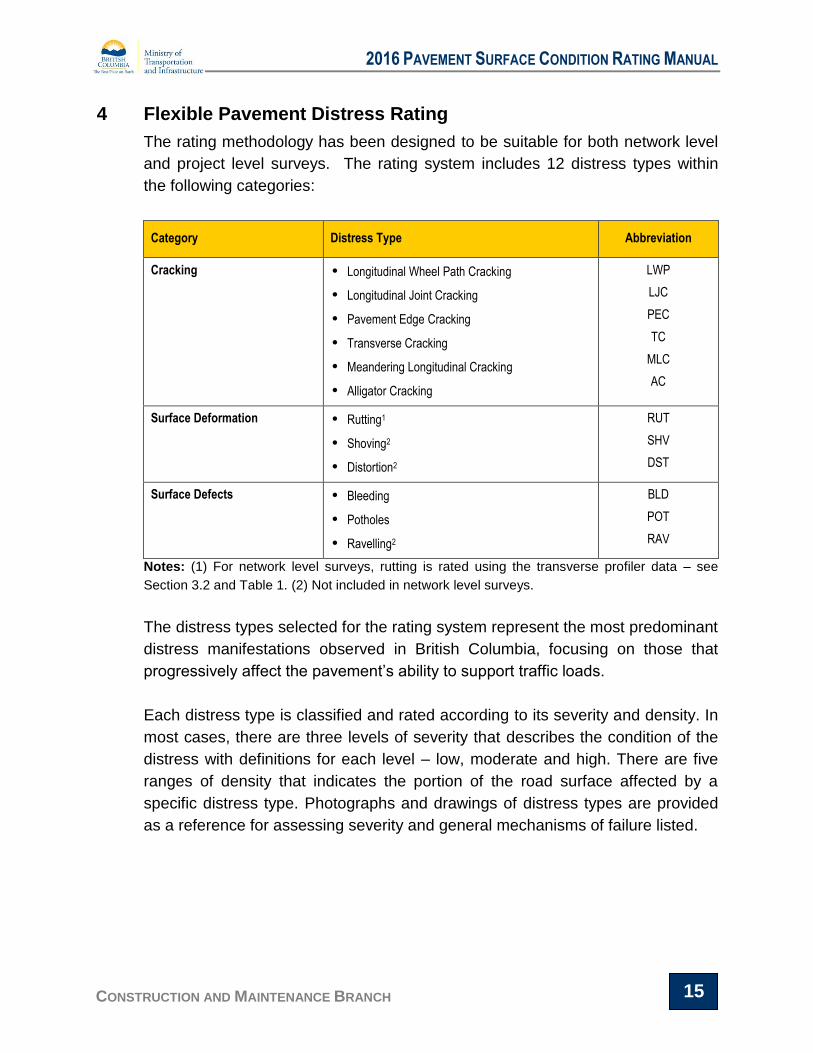
The relative angle of the sun and
the roadway surface viewing
direction can have a significant
impact on visual observations.
When conducting manual surveys,
make sure to view the pavement
from more than one direction.
2016 PAVEMENT SURFACE CONDITION RATING MANUAL
CONSTRUCTION AND MAINTENANCE BRANCH 15
4 Flexible Pavement Distress Rating
The rating methodology has been designed to be suitable for both network level
and project level surveys. The rating system includes 12 distress types within
the following categories:
Category Distress Type Abbreviation
Cracking
• Longitudinal Wheel Path Cracking
• Longitudinal Joint Cracking
• Pavement Edge Cracking
• Transverse Cracking
• Meandering Longitudinal Cracking
• Alligator Cracking
LWP
LJC
PEC
TC
MLC
AC
Surface Deformation • Rutting1
• Shoving2
• Distortion2
RUT
SHV
DST
Surface Defects • Bleeding
• Potholes
• Ravelling2
BLD
POT
RAV
Notes: (1) For network level surveys, rutting is rated using the transverse profiler data – see
Section 3.2 and Table 1. (2) Not included in network level surveys.
The distress types selected for the rating system represent the most predominant
distress manifestations observed in British Columbia, focusing on those that
progressively affect the pavement’s ability to support traffic loads.
Each distress type is classified and rated according to its severity and density. In
most cases, there are three levels of severity that describes the condition of the
distress with definitions for each level – low, moderate and high. There are five
ranges of density that indicates the portion of the road surface affected by a
specific distress type. Photographs and drawings of distress types are provided
as a reference for assessing severity and general mechanisms of failure listed.

2016 PAVEMENT SURFACE CONDITION RATING MANUAL
CONSTRUCTION AND MAINTENANCE BRANCH 16
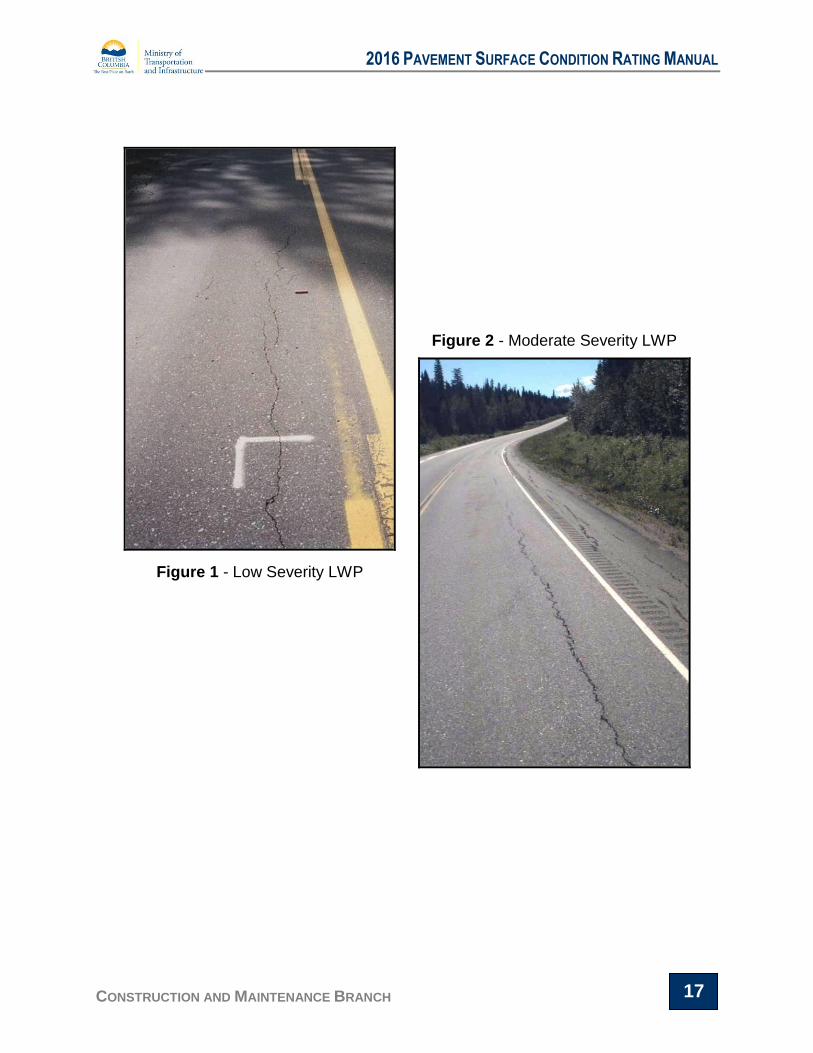
4.1 Longitudinal Wheel Path Cracking (LWP)
Description: Cracks which follow a course predominantly parallel to the
pavement centre line and are located at or near the centre of the wheel path.
Possible Causes: Heavy traffic during spring thaw when pavements are weak.
Severity:
Density:
Example:
Level Description
Low Single cracks with no spalling; mean unsealed crack width < 5mm
Moderate Single or multiple cracks; moderate spalling; mean unsealed crack width 5-20mm
High Single or multiple cracks; severe spalling; mean unsealed crack width >20mm, alligator
Level Description Percent Length Affected
0 None 0%
1 Few < 10%
2 Intermittent 10-20%
3 Frequent 20-50%
4 Extensive 50-80%
5 Throughout 80-100%
2016 PAVEMENT SURFACE CONDITION RATING MANUAL
CONSTRUCTION AND MAINTENANCE BRANCH 17
Figure 1 - Low Severity LWP
Figure 2 - Moderate Severity LWP

2016 PAVEMENT SURFACE CONDITION RATING MANUAL
CONSTRUCTION AND MAINTENANCE BRANCH 18
Figure 3 - High Severity LWP (multiple cracks)
Figure 4 - High Severity LWP
2016 PAVEMENT SURFACE CONDITION RATING MANUAL
CONSTRUCTION AND MAINTENANCE BRANCH 19
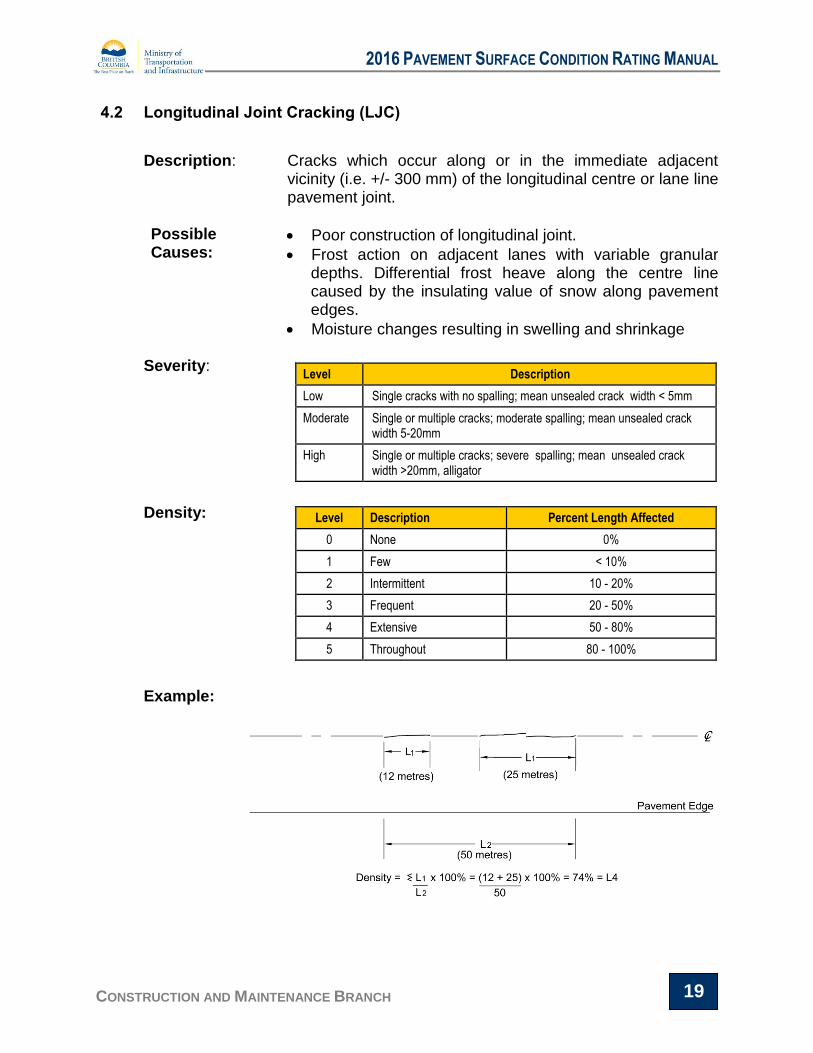
4.2 Longitudinal Joint Cracking (LJC)
Description: Cracks which occur along or in the immediate adjacent
vicinity (i.e. +/- 300 mm) of the longitudinal centre or lane line pavement joint.
Possible Causes:
Poor construction of longitudinal joint.
Frost action on adjacent lanes with variable granular depths. Differential frost heave along the centre line caused by the insulating value of snow along pavement edges.
Moisture changes resulting in swelling and shrinkage
Severity:
Density: Example:
Level Description
Low Single cracks with no spalling; mean unsealed crack width < 5mm
Moderate Single or multiple cracks; moderate spalling; mean unsealed crack width 5-20mm
High Single or multiple cracks; severe spalling; mean unsealed crack width >20mm, alligator
Level Description Percent Length Affected
0 None 0%
1 Few < 10%
2 Intermittent 10 - 20%
3 Frequent 20 - 50%
4 Extensive 50 - 80%
5 Throughout 80 - 100%

2016 PAVEMENT SURFACE CONDITION RATING MANUAL
CONSTRUCTION AND MAINTENANCE BRANCH 20
Figure 5 - Low Severity LJC
Figure 6 - Moderate Severity LJC

2016 PAVEMENT SURFACE CONDITION RATING MANUAL
CONSTRUCTION AND MAINTENANCE BRANCH 21
Figure 7 - High Severity LJC (multiple cracks)
Figure 8 - High Severity LJC (single crack)
2016 PAVEMENT SURFACE CONDITION RATING MANUAL
CONSTRUCTION AND MAINTENANCE BRANCH 22
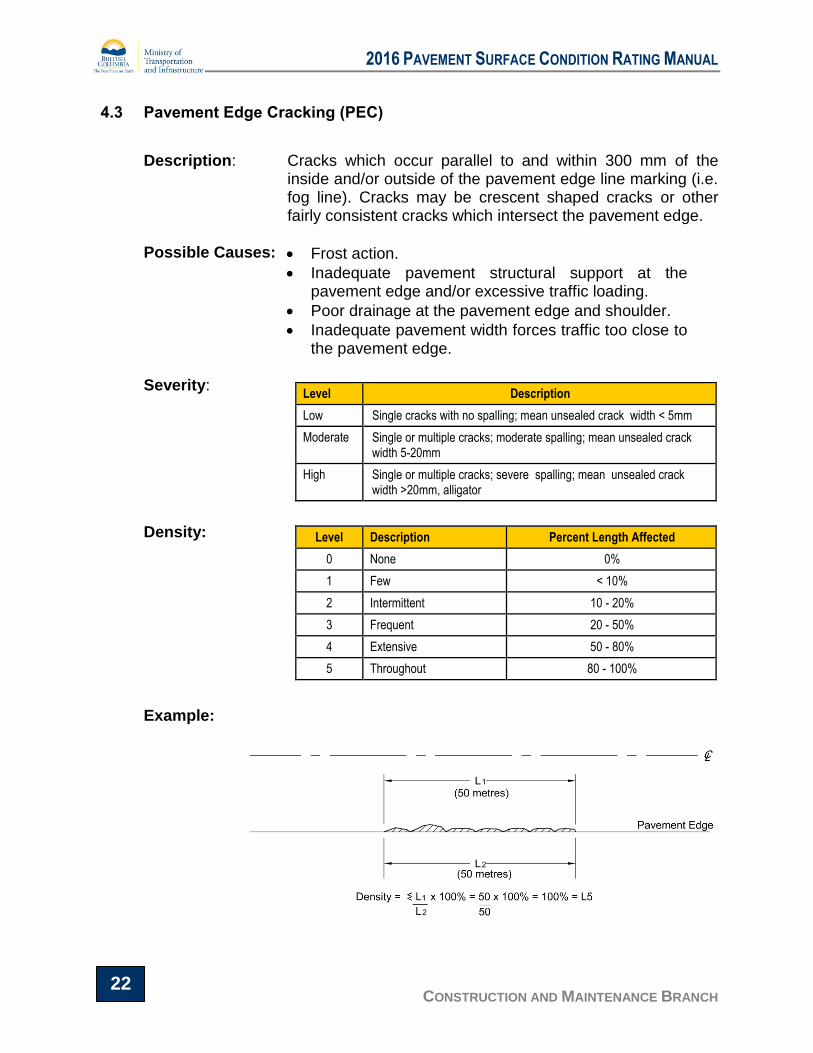
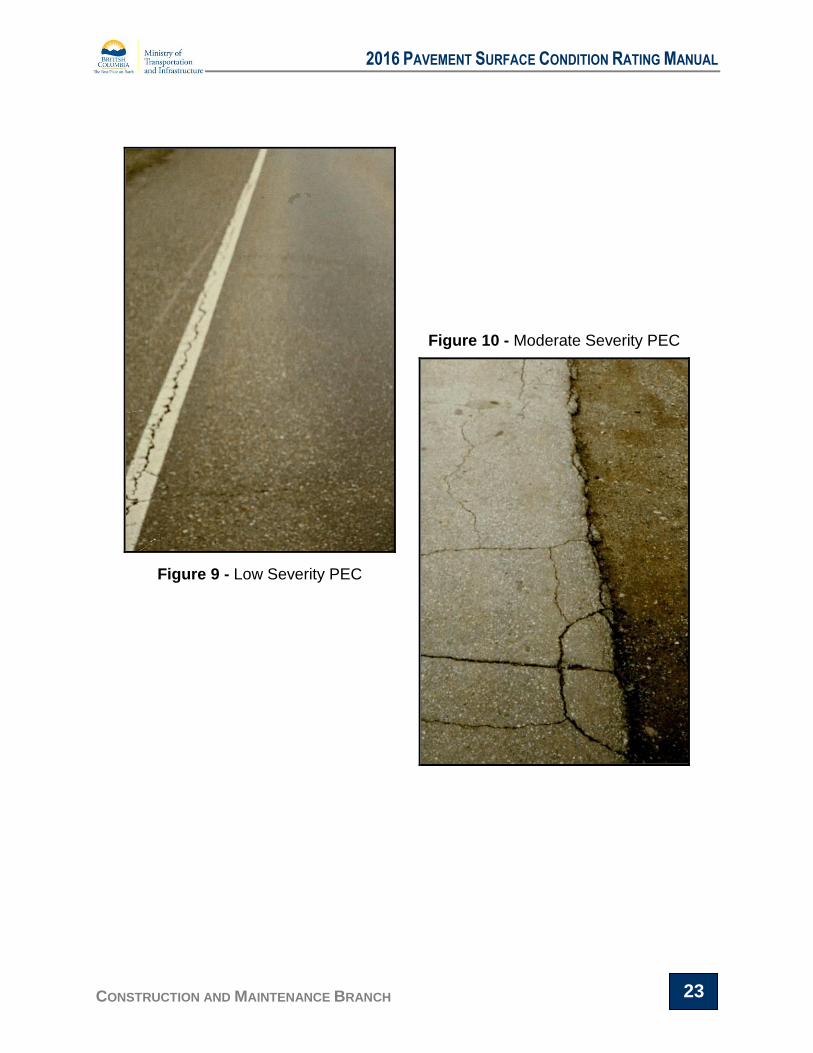
4.3 Pavement Edge Cracking (PEC)
Description: Cracks which occur parallel to and within 300 mm of the
inside and/or outside of the pavement edge line marking (i.e. fog line). Cracks may be crescent shaped cracks or other fairly consistent cracks which intersect the pavement edge.
Possible Causes: Frost action.
Inadequate pavement structural support at the pavement edge and/or excessive traffic loading.
Poor drainage at the pavement edge and shoulder.
Inadequate pavement width forces traffic too close to the pavement edge.
Severity:
Density: Example:
Level Description
Low Single cracks with no spalling; mean unsealed crack width < 5mm
Moderate Single or multiple cracks; moderate spalling; mean unsealed crack width 5-20mm
High Single or multiple cracks; severe spalling; mean unsealed crack width >20mm, alligator
Level Description Percent Length Affected
0 None 0%
1 Few < 10%
2 Intermittent 10 - 20%
3 Frequent 20 - 50%
4 Extensive 50 - 80%
5 Throughout 80 - 100%
2016 PAVEMENT SURFACE CONDITION RATING MANUAL
CONSTRUCTION AND MAINTENANCE BRANCH 23
Figure 9 - Low Severity PEC
Figure 10 - Moderate Severity PEC
2016 PAVEMENT SURFACE CONDITION RATING MANUAL
CONSTRUCTION AND MAINTENANCE BRANCH 24
Figure 11 - High Severity PEC (paved shoulder)
Figure 12 - High Severity PEC
2016 PAVEMENT SURFACE CONDITION RATING MANUAL
CONSTRUCTION AND MAINTENANCE BRANCH 25
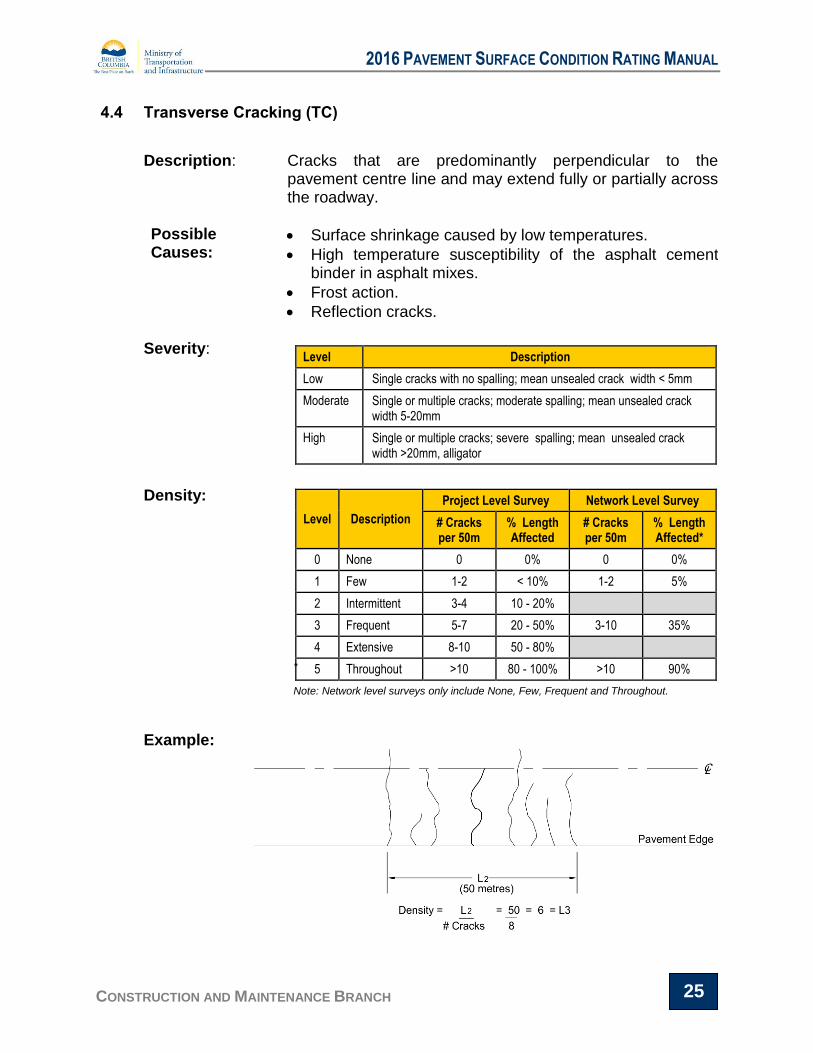
4.4 Transverse Cracking (TC)
Description: Cracks that are predominantly perpendicular to the
pavement centre line and may extend fully or partially across the roadway.
Possible Causes:
Surface shrinkage caused by low temperatures.
High temperature susceptibility of the asphalt cement binder in asphalt mixes.
Frost action.
Reflection cracks. Severity:
Density:
* Note: Network level surveys only include None, Few, Frequent and Throughout.
Example:
Level Description
Low Single cracks with no spalling; mean unsealed crack width < 5mm
Moderate Single or multiple cracks; moderate spalling; mean unsealed crack width 5-20mm
High Single or multiple cracks; severe spalling; mean unsealed crack width >20mm, alligator
Level Description
Project Level Survey Network Level Survey
# Cracks per 50m
% Length Affected
# Cracks per 50m
% Length Affected*
0 None 0 0% 0 0%
1 Few 1-2 < 10% 1-2 5%
2 Intermittent 3-4 10 - 20%
3 Frequent 5-7 20 - 50% 3-10 35%
4 Extensive 8-10 50 - 80%
5 Throughout >10 80 - 100% >10 90%

2016 PAVEMENT SURFACE CONDITION RATING MANUAL
CONSTRUCTION AND MAINTENANCE BRANCH 26
Figure 13 - Low Severity TC
Figure 14 - Moderate Severity TC

2016 PAVEMENT SURFACE CONDITION RATING MANUAL
CONSTRUCTION AND MAINTENANCE BRANCH 27
Figure 15 - High Severity TC (multiple cracking and spalling)
Figure 16 - High Severity TC
2016 PAVEMENT SURFACE CONDITION RATING MANUAL
CONSTRUCTION AND MAINTENANCE BRANCH 28
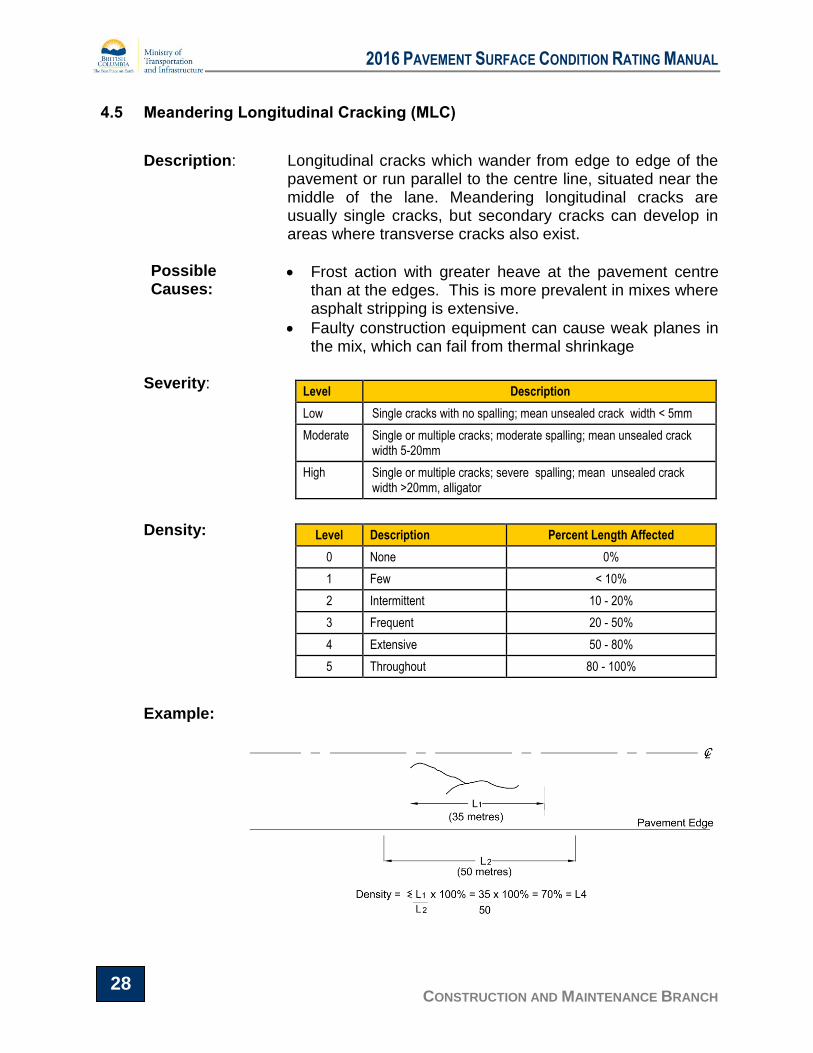
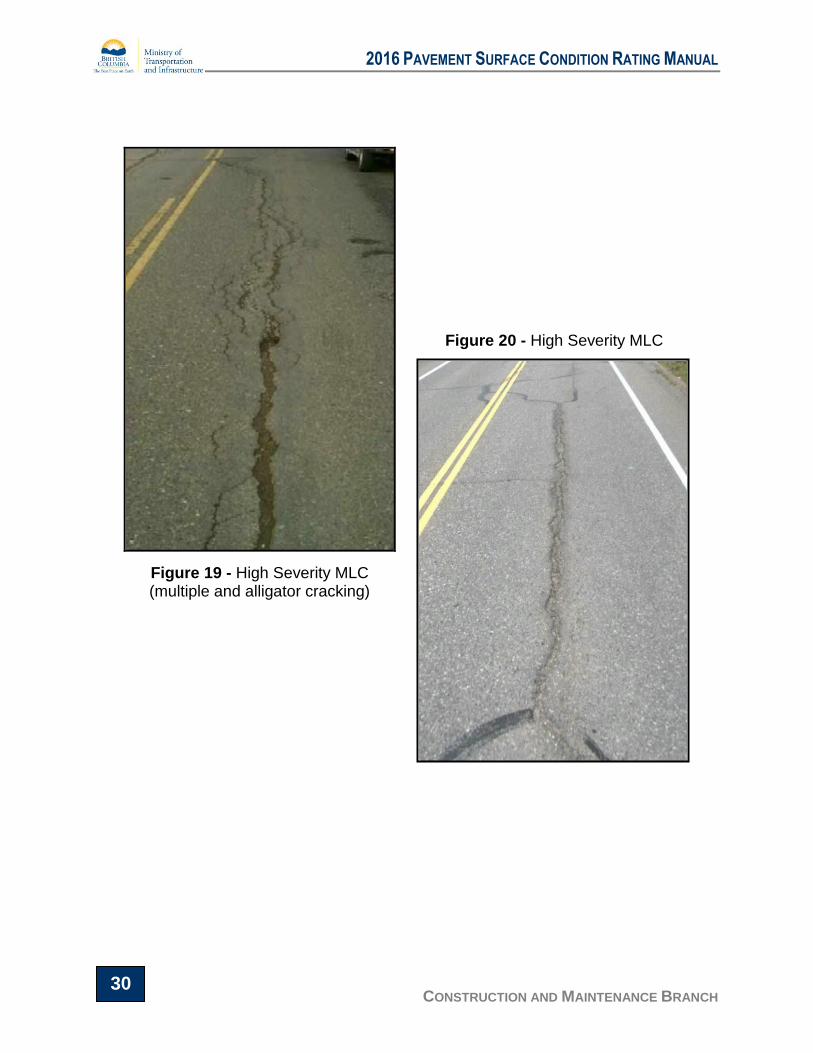
4.5 Meandering Longitudinal Cracking (MLC)
Description: Longitudinal cracks which wander from edge to edge of the
pavement or run parallel to the centre line, situated near the middle of the lane. Meandering longitudinal cracks are usually single cracks, but secondary cracks can develop in areas where transverse cracks also exist.
Possible Causes:
Frost action with greater heave at the pavement centre than at the edges. This is more prevalent in mixes where asphalt stripping is extensive.
Faulty construction equipment can cause weak planes in the mix, which can fail from thermal shrinkage
Severity:
Density: Example:
Level Description
Low Single cracks with no spalling; mean unsealed crack width < 5mm
Moderate Single or multiple cracks; moderate spalling; mean unsealed crack width 5-20mm
High Single or multiple cracks; severe spalling; mean unsealed crack width >20mm, alligator
Level Description Percent Length Affected
0 None 0%
1 Few < 10%
2 Intermittent 10 - 20%
3 Frequent 20 - 50%
4 Extensive 50 - 80%
5 Throughout 80 - 100%

2016 PAVEMENT SURFACE CONDITION RATING MANUAL
CONSTRUCTION AND MAINTENANCE BRANCH 29
Figure 17- Low Severity MLC
Figure 18 - Moderate Severity MLC
2016 PAVEMENT SURFACE CONDITION RATING MANUAL
CONSTRUCTION AND MAINTENANCE BRANCH 30
Figure 19 - High Severity MLC (multiple and alligator cracking)
Figure 20 - High Severity MLC
2016 PAVEMENT SURFACE CONDITION RATING MANUAL
CONSTRUCTION AND MAINTENANCE BRANCH 31
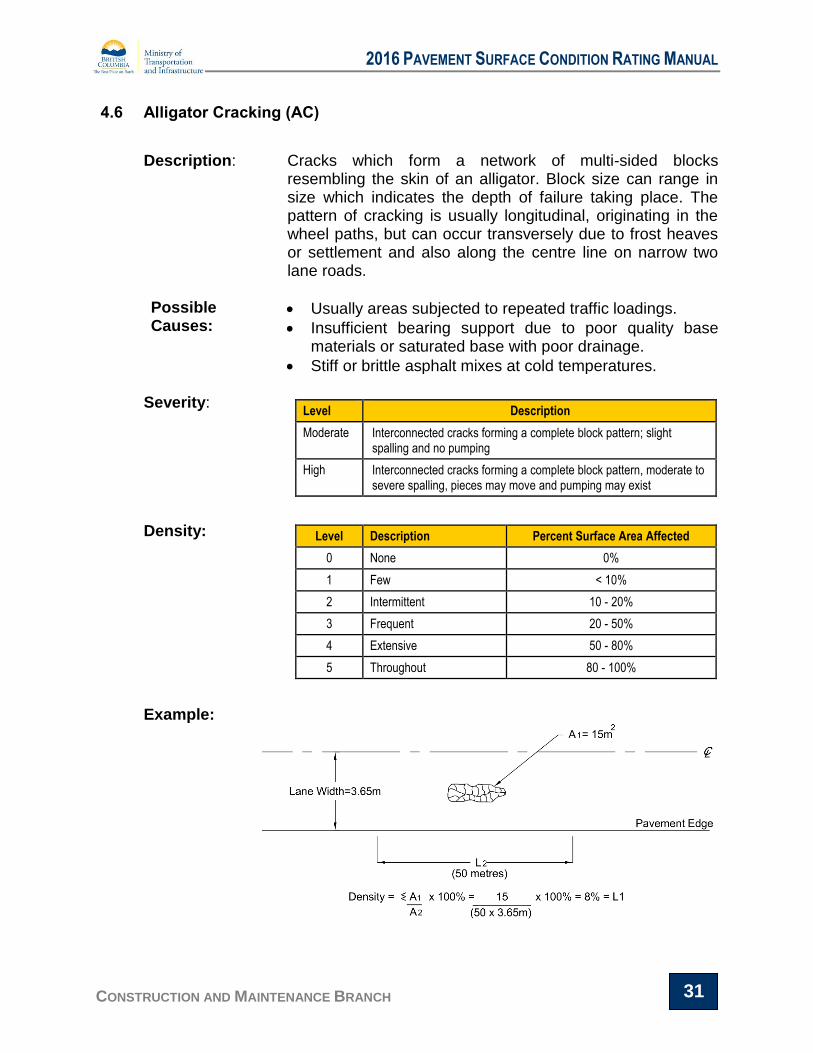
4.6 Alligator Cracking (AC)
Description: Cracks which form a network of multi-sided blocks
resembling the skin of an alligator. Block size can range in size which indicates the depth of failure taking place. The pattern of cracking is usually longitudinal, originating in the wheel paths, but can occur transversely due to frost heaves or settlement and also along the centre line on narrow two lane roads.
Possible Causes:
Usually areas subjected to repeated traffic loadings.
Insufficient bearing support due to poor quality base materials or saturated base with poor drainage.
Stiff or brittle asphalt mixes at cold temperatures. Severity:
Density: Example:
Level Description
Moderate Interconnected cracks forming a complete block pattern; slight spalling and no pumping
High Interconnected cracks forming a complete block pattern, moderate to severe spalling, pieces may move and pumping may exist
Level Description Percent Surface Area Affected
0 None 0%
1 Few < 10%
2 Intermittent 10 - 20%
3 Frequent 20 - 50%
4 Extensive 50 - 80%
5 Throughout 80 - 100%
2016 PAVEMENT SURFACE CONDITION RATING MANUAL
CONSTRUCTION AND MAINTENANCE BRANCH 32
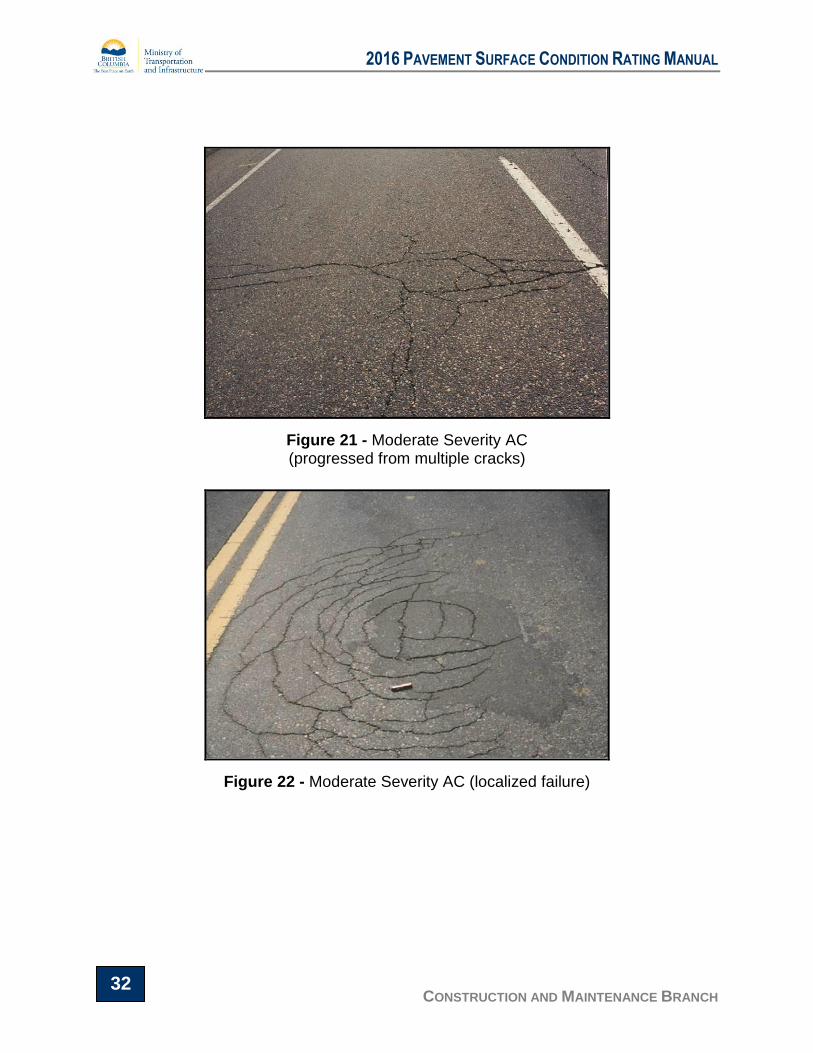
Figure 21 - Moderate Severity AC (progressed from multiple cracks)
Figure 22 - Moderate Severity AC (localized failure)

2016 PAVEMENT SURFACE CONDITION RATING MANUAL
CONSTRUCTION AND MAINTENANCE BRANCH 33
Figure 23 - High Severity AC (spalling and throughout density)
Figure 24 - High Severity AC with break up and pumping
2016 PAVEMENT SURFACE CONDITION RATING MANUAL
CONSTRUCTION AND MAINTENANCE BRANCH 34
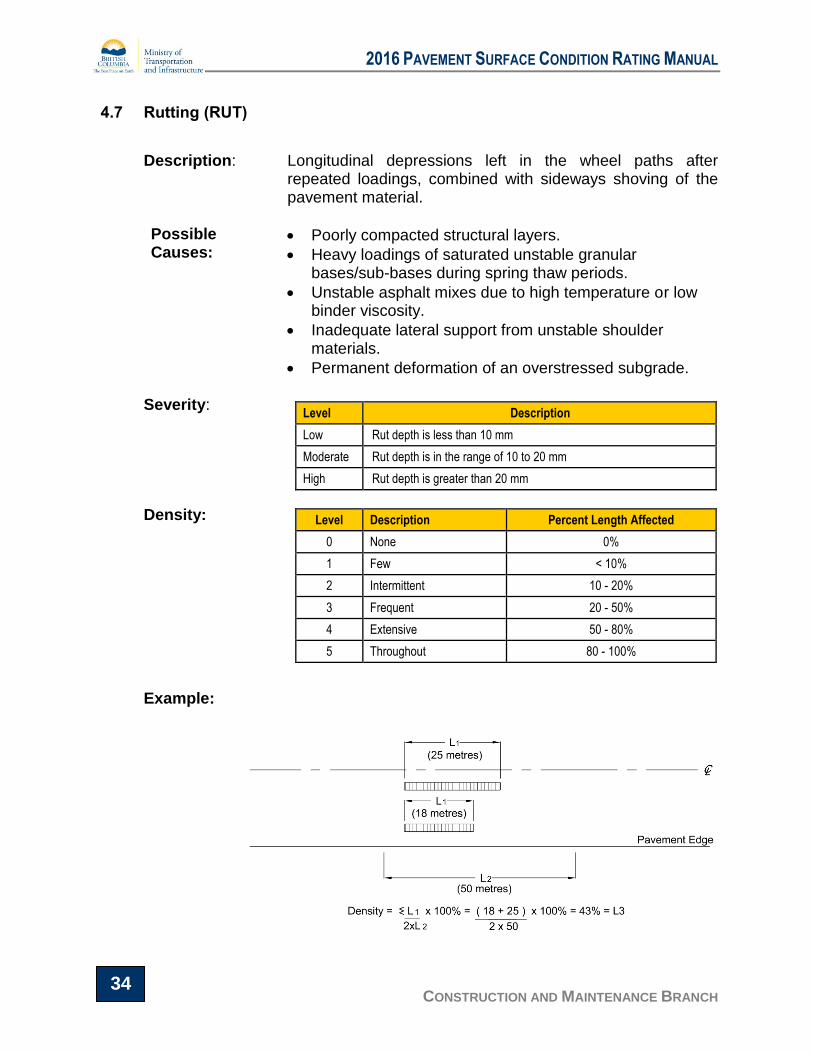
4.7 Rutting (RUT)
Description: Longitudinal depressions left in the wheel paths after
repeated loadings, combined with sideways shoving of the pavement material.
Possible Causes:
Poorly compacted structural layers.
Heavy loadings of saturated unstable granular bases/sub-bases during spring thaw periods.
Unstable asphalt mixes due to high temperature or low binder viscosity.
Inadequate lateral support from unstable shoulder materials.
Permanent deformation of an overstressed subgrade. Severity:
Density: Example:
Level Description
Low Rut depth is less than 10 mm
Moderate Rut depth is in the range of 10 to 20 mm
High Rut depth is greater than 20 mm
Level Description Percent Length Affected
0 None 0%
1 Few < 10%
2 Intermittent 10 - 20%
3 Frequent 20 - 50%
4 Extensive 50 - 80%
5 Throughout 80 - 100%
2016 PAVEMENT SURFACE CONDITION RATING MANUAL
CONSTRUCTION AND MAINTENANCE BRANCH 35
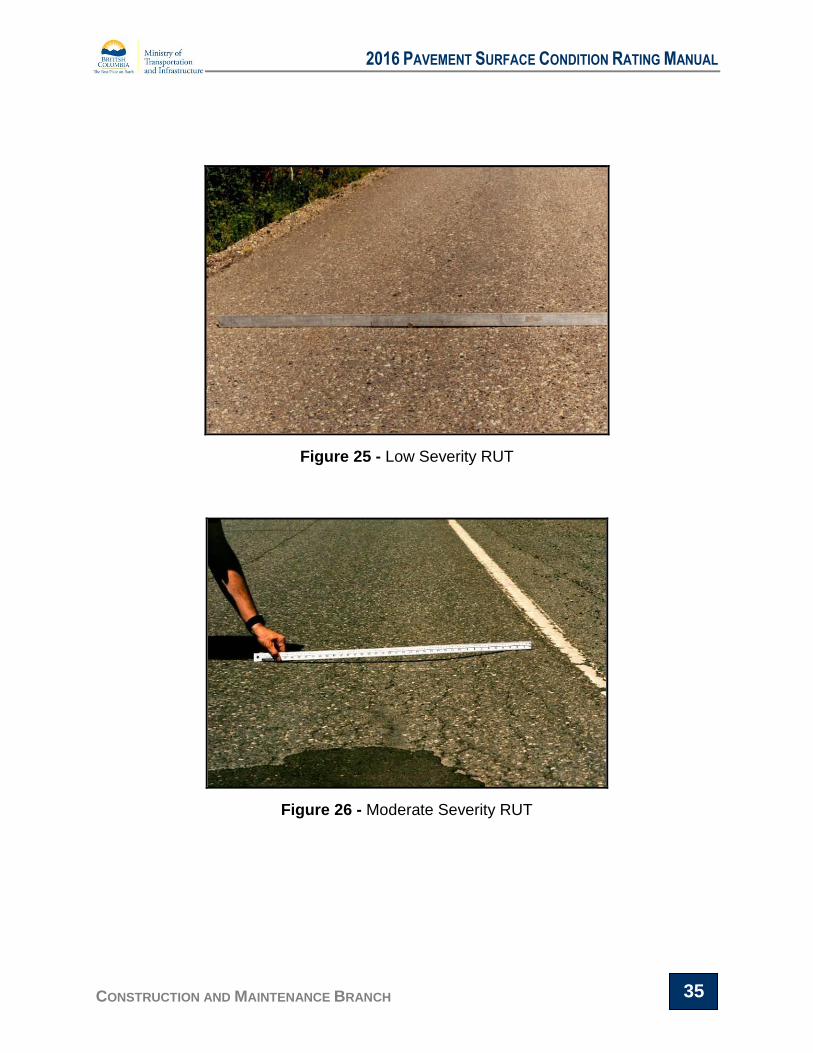
Figure 25 - Low Severity RUT
Figure 26 - Moderate Severity RUT

2016 PAVEMENT SURFACE CONDITION RATING MANUAL
CONSTRUCTION AND MAINTENANCE BRANCH 36
Figure 27 - High Severity RUT with transverse displacement
Figure 28 - High Severity RUT

2016 PAVEMENT SURFACE CONDITION RATING MANUAL
CONSTRUCTION AND MAINTENANCE BRANCH 37
4.8 Shoving (SHV)
Description: Longitudinal displacement of a localized area of the
pavement surface generally caused by braking or accelerating vehicles and usually located on hills, curves or intersections.
Possible Causes:
Stop and start of vehicles at intersections.
Heavy traffic on steep downgrades or upgrades.
Low stability asphalt mix.
Lack of bond in asphalt surface and underlying layer
Unstable granular base
Severity:
Density: Example:
Level Description
Low Barely noticeable to noticeable
Moderate Rough ride
High Very rough ride
Level Description Percent Length Affected
0 None 0%
1 Few < 10%
2 Intermittent 10 - 20%
3 Frequent 20 - 50%
4 Extensive 50 - 80%
5 Throughout 80 - 100%
2016 PAVEMENT SURFACE CONDITION RATING MANUAL
CONSTRUCTION AND MAINTENANCE BRANCH 38
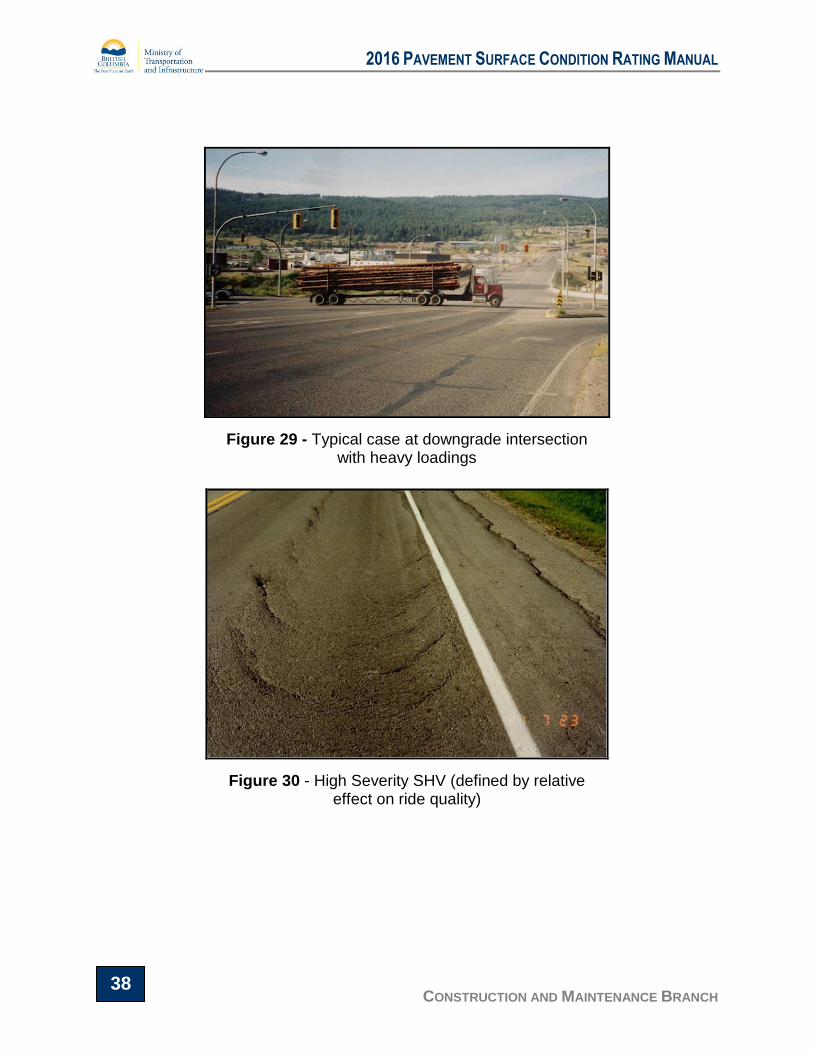
Figure 29 - Typical case at downgrade intersection with heavy loadings
Figure 30 - High Severity SHV (defined by relative effect on ride quality)
2016 PAVEMENT SURFACE CONDITION RATING MANUAL
CONSTRUCTION AND MAINTENANCE BRANCH 39
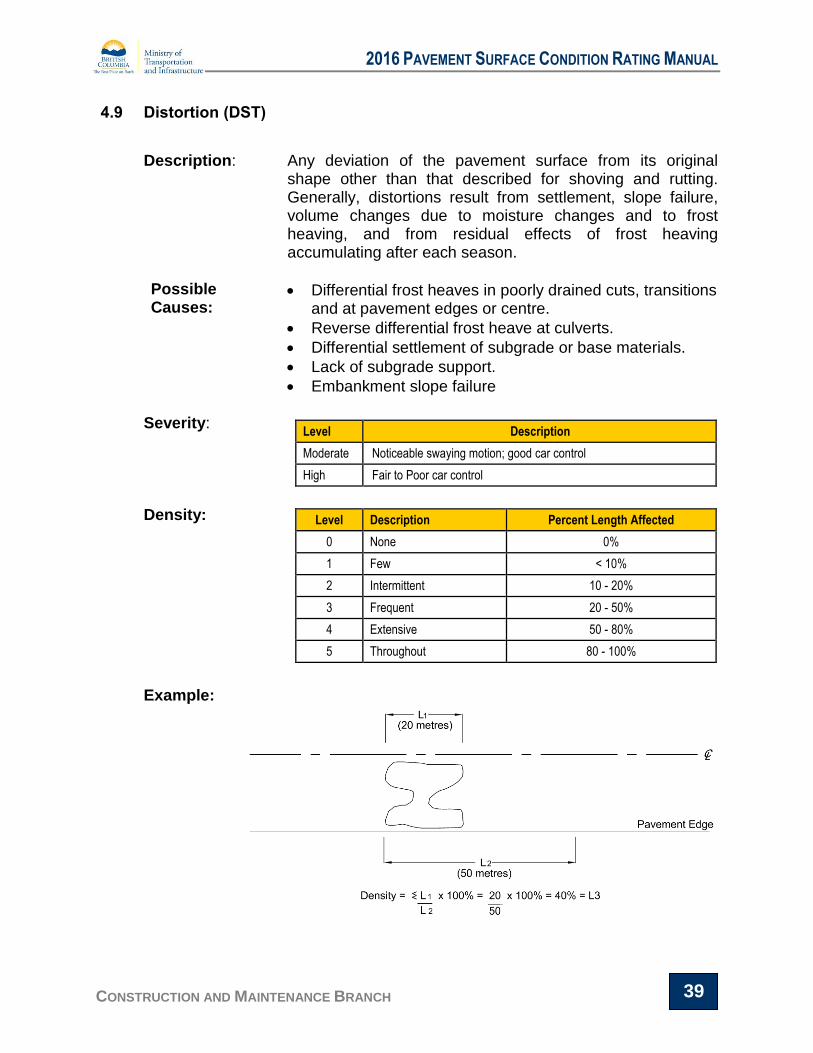
4.9 Distortion (DST)
Description: Any deviation of the pavement surface from its original
shape other than that described for shoving and rutting. Generally, distortions result from settlement, slope failure, volume changes due to moisture changes and to frost heaving, and from residual effects of frost heaving accumulating after each season.
Possible Causes:
Differential frost heaves in poorly drained cuts, transitions and at pavement edges or centre.
Reverse differential frost heave at culverts.
Differential settlement of subgrade or base materials.
Lack of subgrade support.
Embankment slope failure
Severity:
Density:
Example:
Level Description
Moderate Noticeable swaying motion; good car control
High Fair to Poor car control
Level Description Percent Length Affected
0 None 0%
1 Few < 10%
2 Intermittent 10 - 20%
3 Frequent 20 - 50%
4 Extensive 50 - 80%
5 Throughout 80 - 100%

2016 PAVEMENT SURFACE CONDITION RATING MANUAL
CONSTRUCTION AND MAINTENANCE BRANCH 40
Figure 31 - Moderate Severity DST (resulting from differential settlement)
Figure 32 - Moderate Severity DST (example of pavement edge settlement)

2016 PAVEMENT SURFACE CONDITION RATING MANUAL
CONSTRUCTION AND MAINTENANCE BRANCH 41
4.10 Bleeding (BLD)
Description: Excess bituminous binder on the pavement surface can
create a shiny, glass-like, reflective surface that may be tacky to the touch. Bleeding quite often occurs in the wheel paths.
Possible Causes:
Mix design deficiencies where too high an asphalt content relative to voids results in excess asphalt forced to the surface by traffic, especially on hot days.
Paving over surfaces with severe bleeding or the application of a heavy prime or tack coat under a new pavement layer may result in excess primer bleeding through the pavement surface over a period of time.
Poor construction of surface seal coats.
Severity:
Density:
Example:
Level Description
Moderate Distinctive appearance with free excess asphalt
High Gives pavement surface a wet look; tire marks are evident
Level Description Percent Length Affected
0 None 0%
1 Few < 10%
2 Intermittent 10 - 20%
3 Frequent 20 - 50%
4 Extensive 50 - 80%
5 Throughout 80 - 100%
2016 PAVEMENT SURFACE CONDITION RATING MANUAL
CONSTRUCTION AND MAINTENANCE BRANCH 42
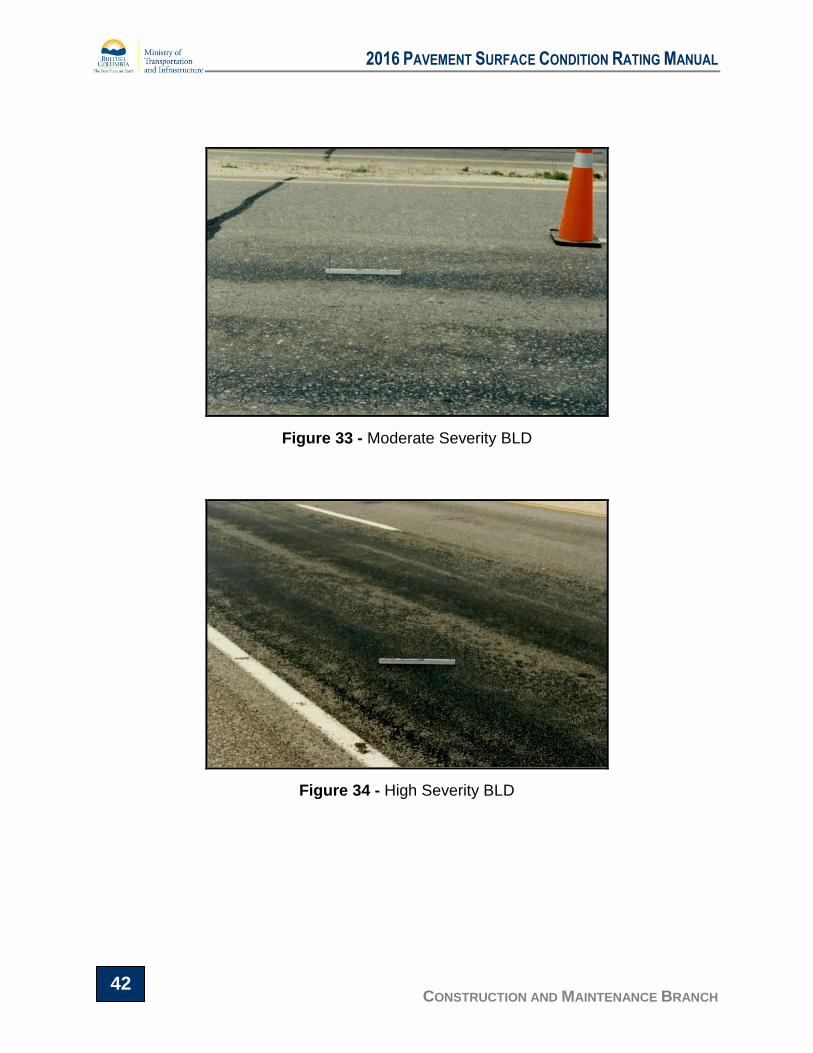
Figure 33 - Moderate Severity BLD
Figure 34 - High Severity BLD

2016 PAVEMENT SURFACE CONDITION RATING MANUAL
CONSTRUCTION AND MAINTENANCE BRANCH 43
4.11 Potholes (POT)
Description: Bowl-shaped holes of various sizes in the pavement surface
that are greater than 175 cm2 in area (~ 15 cm diameter).
Possible Causes:
Thin spot in the asphalt layer.
Localized drainage problems such as water infiltration through poorly bonded pavement structural layers or segregated spots in the asphalt mix where coarse patches allow intrusion of water
Asphalt mix design deficiencies.
Severity:
Density:
* Note: Network Level surveys only include None, Few, Frequent and Throughout.
Example:
Level Description
Low Pothole > 175 cm2 in area (~15cm ø) and less than 25mm deep
Moderate Pothole > 175 cm2 in area (~15cm ø) and 25 to 50mm deep
High Pothole > 175 cm2 in area (~15cm ø) and greater than 50mm deep
Level Description
Project Level Survey Network Level Survey
# Potholes per 50m
% Length Affected
# Potholes per 50m
% Length Affected*
0 None 0 0% 0 0%
1 Few 1-2 < 10% 1-2 5%
2 Intermittent 3-4 10 - 20%
3 Frequent 5-6 20 - 50% 3-9 35%
4 Extensive 7-9 50 - 80%
5 Throughout >=10 80 - 100% >=10 90%

2016 PAVEMENT SURFACE CONDITION RATING MANUAL
CONSTRUCTION AND MAINTENANCE BRANCH 44
Figure 35 - Low Severity POT (close up view)
Figure 36 - Moderate Severity POT

2016 PAVEMENT SURFACE CONDITION RATING MANUAL
CONSTRUCTION AND MAINTENANCE BRANCH 45
Figure 37 - High Severity Pothole
Figure 38 - High Severity Pothole with asphalt break up

2016 PAVEMENT SURFACE CONDITION RATING MANUAL
CONSTRUCTION AND MAINTENANCE BRANCH 46
4.12 Ravelling (RAV)
Description: The progressive loss of the pavement material (both
aggregate particles and bituminous binder) from the surface downward, leaving a rough surface, vulnerable to weather deterioration.
Possible Causes:
Poor adhesion of aggregates due to insufficient asphalt content, clay-coated aggregate, use of wet aggregates or stripping due to water action.
Fracture of aggregate particles by heavy loads or natural causes. The unbound particles are then removed by traffic, reducing the depth of the asphalt.
Poor compaction permits infiltration of water and salts which promote asphalt stripping.
Segregated mix placed during construction.
Aging and weathering.
Severity:
Density: Example:
Level Description
Moderate aggregate and/or binder worn away; surface texture rough and pitted; loose particles exist
High aggregate and/or binder worn away; texture is very rough and pitted
Level Description Percent Length Affected
0 None 0%
1 Few < 10%
2 Intermittent 10 - 20%
3 Frequent 20 - 50%
4 Extensive 50 - 80%
5 Throughout 80 - 100%

2016 PAVEMENT SURFACE CONDITION RATING MANUAL
CONSTRUCTION AND MAINTENANCE BRANCH 47
Figure 39 - Moderate Severity RAV
Figure 40 - High Severity RAV

2016 PAVEMENT SURFACE CONDITION RATING MANUAL
CONSTRUCTION AND MAINTENANCE BRANCH 48
This page has been left intentionally blank.

2016 PAVEMENT SURFACE CONDITION RATING MANUAL
CONSTRUCTION AND MAINTENANCE BRANCH 49
5 Roughness and Rut Depth Guidelines
This chapter provides inspection guidelines for conducting network level
pavement roughness and rut depth surveys.
5.1 Longitudinal Profiles
The following requirements must be followed for measuring longitudinal profiles:
The IRI is to be determined in accordance with ASTM E1926.
Longitudinal profile roughness measurements are to be collected
continuously using a laser based Class 1 inertial profiler as defined by ASTM
E950, or better and AASHTO M 328-10.
The inertial profiler is to be capable of accurately measuring the profile in
each wheel path as per the accuracy requirements set out in Chapter 7.
Contractors are required to provide BCMoT with their data collection and post
processing protocols as defined by the manufacturer of the equipment and
their internal quality management plan. This should include as a minimum the
following:
o Minimum data collection speed;
o Acceleration / deceleration rates;
o Section start-up and termination procedures;
o Transient events;
o Environmental conditions; and
o Other sensor limitations.
During post processing, all readings will be flagged as “invalid” that fall below
the contractor’s minimum allowable operating speed or due to the inertial
profiler signal out of range errors / discontinuities.
The calculated roughness measurements are to be based on the averaged
readings over the preceding 50 metre segment.
The IRI will not be reported for any 50 metre segment that contains flagged
readings as noted above.
IRI values are to be reported to the nearest hundredth (e.g. 0.01 mm/m).
IRI values are to be collected and reported for each wheel-path.
2016 PAVEMENT SURFACE CONDITION RATING MANUAL
CONSTRUCTION AND MAINTENANCE BRANCH 50
5.2 Transverse Profiles
The following requirements must be followed for measuring transverse profiles:
A minimum of 11 transverse profile measurements, collected continuously
across the travelled lane to compute the left and right wheel path rut depths in
accordance with AASHTO PP70-10. Scanning lasers or 3D Laser Crack
Measurement System (LCMS) technology is preferred.
Rut depth measurements are to be equivalent to those that would be
achieved manually, via ASTM E1703/E1703M as determined for each
individual wheel-path referenced to a two (2) metre straight-edge model.
Profiler is capable of accurately measuring rut depths in each wheel path as
per requirements as set out in Chapter 7 as a minimum.
Contractors are required to provide BCMoT with their data collection and post
processing protocols as defined by the manufacturer of the equipment and
their internal quality management plan as described in Section 5.1.
The left and right wheel path transverse profile measurements are to be
based on the averaged readings over the preceding 50 metre segment. The
maximum left and right wheel path transverse profile measurements are to be
reported as the maximum readings within the preceding 50 metre segment.
The following data is to be reported for each 50 metre segment:
o Calculated average rut depth for each wheel-path; and
o Calculated maximum rut depth for each wheel path rounded to the nearest
whole millimeter (i.e. 2 mm).
5.3 Additional Operational Requirements
The following additional operational requirements must be followed when
measuring longitudinal and transverse profiles:
Data collection contractors may be required to obtain a special operating
permit (Form T-53) from the Ministry of Transportation and Infrastructure prior
to conducting surveys on provincial highways and roads.
Network level surveys on undivided highways are to be generally conducted
in one direction of travel only (i.e. one lane) and conducted in both directions
(i.e. one lane on each side) for divided or multi-lane highways. Data collection
in all lanes may be required for other projects.

2016 PAVEMENT SURFACE CONDITION RATING MANUAL
CONSTRUCTION AND MAINTENANCE BRANCH 51
Transient events are to be identified and their location (start km and end km)
referenced according to the linear referencing system.
Construction areas encountered during surveys are to be bypassed.
Where truck climbing/passing lanes occur, the vehicle is to move to the
outside lane (unless both lanes are being surveyed).
5.4 Transient Events
The following transient events are to be recorded while conducting network level
pavement roughness and rut depth surveys:
a) Bridges greater than 50m in length;
b) Steel mesh bridge decks;
c) Railway crossings;
d) Construction zone detours including any temporary pavement;
e) Storm-water drainage / utility infrastructure (i.e. manholes, drains, etc.)
that are located in the travel lane; and
f) Rumble strips that extend into and/or traverse the travel lane.
For each transient event, the start / end kilometre chainages and GPS
coordinates will be recorded.

2016 PAVEMENT SURFACE CONDITION RATING MANUAL
CONSTRUCTION AND MAINTENANCE BRANCH 52
6 Network Level Surveys Locational Referencing
This chapter provides details on the locational referencing method that is to be
used when conducting network level surveys.
6.1 General
Within the corporate RPMS, a standardized locational referencing system is used
to ensure constant referencing from year to year for the pavement performance
data and accurate referencing of attribute data. The Ministry has established a
Linear Referencing System (LRS) that is based on highway sections and anchor
points (i.e. landmarks).
6.2 GPS Measurements
GPS measurements are collected concurrently with the linear distance
measurement instrumentation (DMI). Network level data collection contractors
must use a differential GPS system to improve the real time position accuracy.
The spatial referencing system must include at minimum real-time inertial aided
GPS with satellite based DGPS, 12 channel receiver and an accuracy of less
than 1m horizontal, post processed or with satellite based differential corrections
to accurately determine the true location of the data point, in areas where weak
GPS signals could affect locational accuracy. The differential corrections are
received from Landstar or the Canadian DGPS Service.
6.3 Linear Measurements
Each highway is referenced as a continuous segment from start to end with
landmarks established as additional referencing points along the highway.
Landmarks are physical, long lasting features such as intersections, bridge
abutments or sign posts that are referenced to the highways based on a
kilometre point location. Each highway has a defined start point, a defined end
point, and an assigned cardinal direction. The interval between each pavement
condition data roll-up point, is the driven distance 50m in the cardinal direction
from the start point toward the end point.
All pavement performance data within the RPMS are referenced to the highways
based on the highway ID and the kilometre location as a distance from the start
of the highway. During the surveys, the contractor is required to reference the
designated survey reference landmarks every 20 to 30 kilometres.
2016 PAVEMENT SURFACE CONDITION RATING MANUAL
CONSTRUCTION AND MAINTENANCE BRANCH 53
For highways that have not been realigned, the data collection contractor is to
ensure that their landmark chainages match those used in the Province’s RPMS,
and shall rubber-sheet their data if required to make their data collection
chainages match the Provinces RPMS chainages.
If the data collection contractor identifies what appears to be an error in the
province’s RPMS chainages (such as may occur if a highway has been
realigned); the data collection contractor is to advise the Ministry of the change,
(Highway number, cardinal direction, describe start and end points of variance,
provide updated landmark chainage along the revised alignment), such that the
variance can be reviewed, and if the province agrees with the contractors
findings, the new / correct chainages can then be incorporated into the Provinces
RPMS.
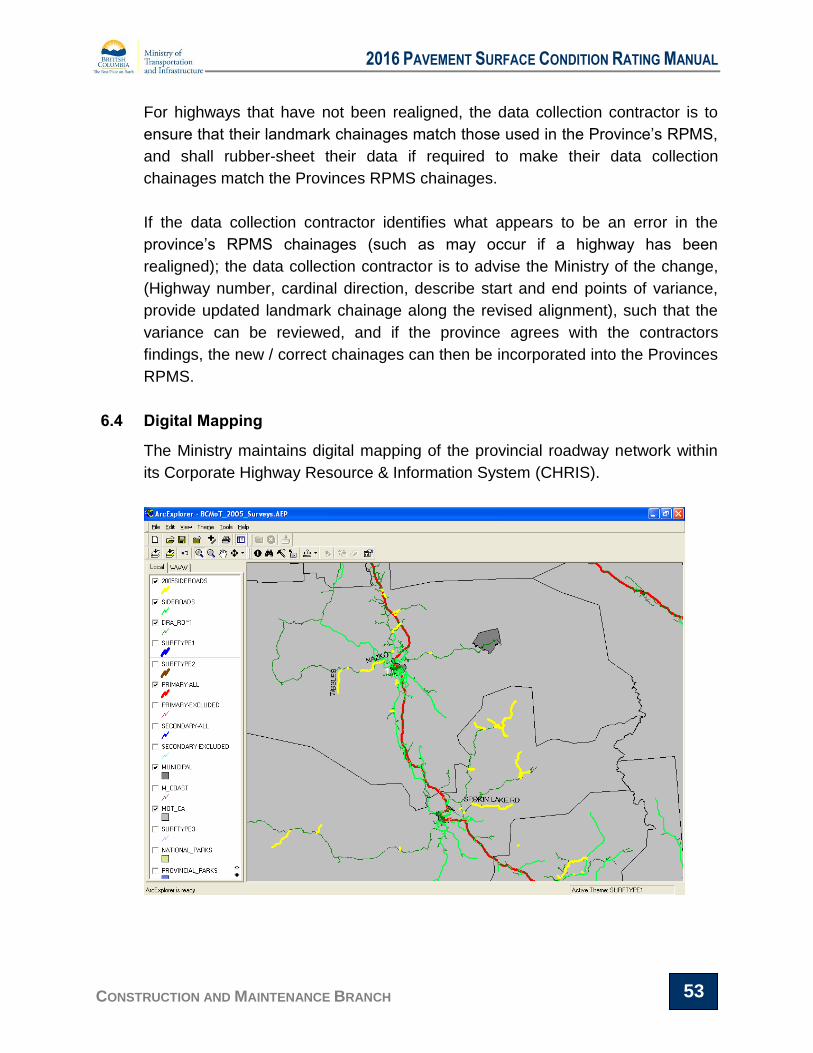
6.4 Digital Mapping
The Ministry maintains digital mapping of the provincial roadway network within
its Corporate Highway Resource & Information System (CHRIS).
2016 PAVEMENT SURFACE CONDITION RATING MANUAL
CONSTRUCTION AND MAINTENANCE BRANCH 54
Shape files of all highways and roads included in the annually contracted network
level surveys are available to support the surveys. Shape files showing the
Digital Road Atlas (The DRA maps all roads in the province - including Municipal
Streets, Forest Service Roads, Mine Trails, and MoT Highways) R&B Contract
Area boundaries (important, as the Contract Area number is the first two digits of
the RFI / Side Road numbering system,) Provincial Parks, Treaty Indian
Reservations, coastline, lakes and rivers and highway surface type are also
available.
The ability to utilize spatial mapping can assist the data collection contractor to
quickly identify and locate survey routes using their on-board GPS equipment
and mapping software.
6.5 Highway Definitions
A highway segment is defined as a length of road that is continuous from the
starting location until any of the following conditions occurs:
Road ends; or
Segment becomes subordinate when there is an overlap with another
highway.
A highway segment shall have:
A described Start Point and Start Point chainage; and
A described End Point and End Point chainage.
The highway definition is composed of all of the items that are required to
uniquely identify a roadway segment within the Province:
Route Number – designated route or road number (e.g. Route 97 or 16)
Route Aux ID – auxiliary identifier (e.g. Route 97B or 3A)
Contract Area – Ministry designated maintenance contract area
District Management Area – Ministry designated maintenance sub-area
Direction – cardinal direction assigned within RPMS for the route / road
Each of fields above has been defined for all highways and side roads within the
province and is to be used for pavement surface condition surveys.
2016 PAVEMENT SURFACE CONDITION RATING MANUAL
CONSTRUCTION AND MAINTENANCE BRANCH 55
For Primary or Secondary Highways, the Contract Area is always 00 (zero zero)
unless otherwise specified. No Primary or Secondary Highways bear the District
Management Area Designation - this data field is to be left blank.
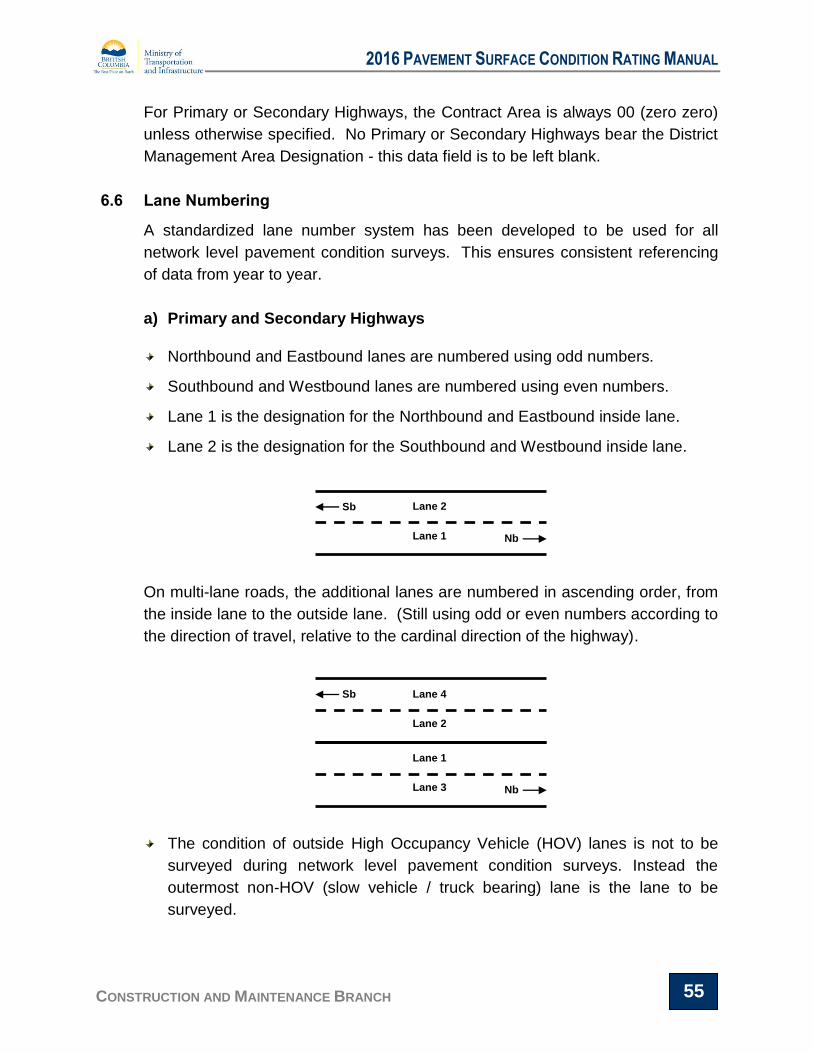
6.6 Lane Numbering
A standardized lane number system has been developed to be used for all
network level pavement condition surveys. This ensures consistent referencing
of data from year to year.
a) Primary and Secondary Highways
Northbound and Eastbound lanes are numbered using odd numbers.
Southbound and Westbound lanes are numbered using even numbers.
Lane 1 is the designation for the Northbound and Eastbound inside lane.
Lane 2 is the designation for the Southbound and Westbound inside lane.
On multi-lane roads, the additional lanes are numbered in ascending order, from
the inside lane to the outside lane. (Still using odd or even numbers according to
the direction of travel, relative to the cardinal direction of the highway).
The condition of outside High Occupancy Vehicle (HOV) lanes is not to be
surveyed during network level pavement condition surveys. Instead the
outermost non-HOV (slow vehicle / truck bearing) lane is the lane to be
surveyed.
Lane 4
Lane 2
Sb
Lane 1
Lane 3 Nb
Lane 2
Lane 1 Nb
Sb

2016 PAVEMENT SURFACE CONDITION RATING MANUAL
CONSTRUCTION AND MAINTENANCE BRANCH 56
Where inside HOV or bus only lanes exist, they are considered Lane 1 or 2
depending upon the direction of the highway.
b) Side Roads
Each side road is assigned a cardinal direction. That direction is noted in the
digital mapping / RPMS and the landmark chainage should correlate with the
cardinal direction. In the event that they do not correlate, please contact your
contract administrator for direction.
When travelling in the assigned cardinal direction, from the defined start point to
the defined end point; the inside lane in that direction of travel, is lane 1. The
inside lane in the opposite direction of travel is lane 2. The chainage will always
increase, when travelling from the defined start point to the defined end point.
Should it ever be required to survey in the opposite direction of travel - from the
defined end point to the defined start point, the lane numbering will not change,
but the chainage of the survey findings will decrease as one travels from the
defined end point, to the defined start point at km 0.000.
6.7 Divided Highways
The above lane numbering scheme is also applicable to divided highways. While a divided highway may have different suffixes for the opposite directions of travel (e.g. Hwy 1E and Hwy 1W), and while the pavement surface condition data for each direction of travel is to be collected and submitted separately; the “EB” and “NB” lanes will always bear odd numbers, and the “WB” and “SB” lanes will always bear even numbers.”
6.8 Lane Location Referencing
When referencing passing lanes, the survey data corresponds to the full lane
width from the end of entrance taper to beginning of exit taper.
Mapping and RPMS Defined
Cardinal Direction
Desired Survey Direction
Lane 1 if the inside Xb lane
Chainage Ascends when Travelling
Chainage Descends when Travelling
North NB NB NB SB
East EB EB EB WB
South SB SB SB NB
West WB WB WB EB
2016 PAVEMENT SURFACE CONDITION RATING MANUAL
CONSTRUCTION AND MAINTENANCE BRANCH 57
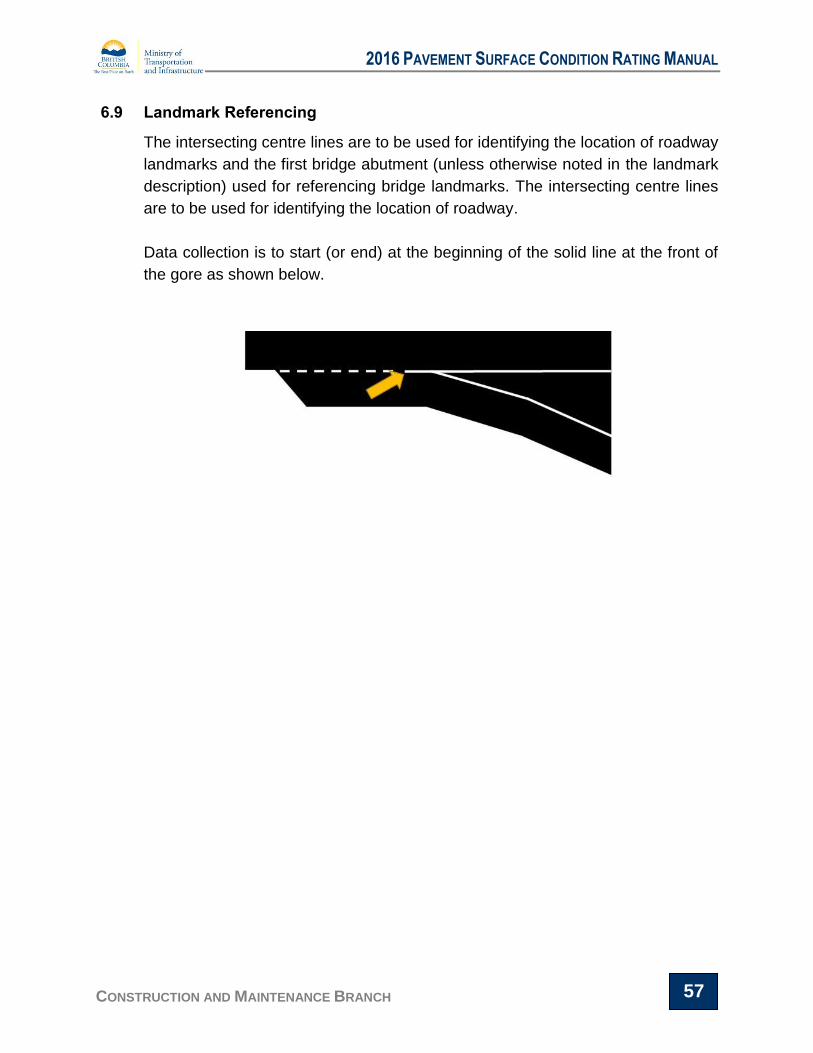
6.9 Landmark Referencing
The intersecting centre lines are to be used for identifying the location of roadway
landmarks and the first bridge abutment (unless otherwise noted in the landmark
description) used for referencing bridge landmarks. The intersecting centre lines
are to be used for identifying the location of roadway.
Data collection is to start (or end) at the beginning of the solid line at the front of
the gore as shown below.

2016 PAVEMENT SURFACE CONDITION RATING MANUAL
CONSTRUCTION AND MAINTENANCE BRANCH 58
7 Network Level Surveys QA Specifications
This chapter describes the Quality Assurance specifications that are applied by
the Ministry for network level surveys.
7.1 Introduction
Quality assurance (QA) plays a critical role ensuring that the data is collected
accurately and is repeatable from year to year. The Ministry has developed and
implemented QA procedures that consist of three levels of testing: (a) initial QA
tests completed before the surveys commence, (b) monitoring during the field
survey / distress rating processes, and (c) assessing submitted data files. The
following sections describe each.
7.2 Initial Quality Assurance Tests
The initial QA tests are used to ensure that the contractor’s roughness / rut-depth
instrumentation is operating properly and they are correctly applying the BCMoT
pavement surface distress rating methodology before authorization is given to
begin with these data collection activities.
7.2.1 Site Selection
Four test sites, each 500 metres in length are used for the initial QA. The sites
are intended to exhibit a representative variety of distress types, range in
pavement deterioration and surface types that ae representative of the actual
survey conditions.
7.2.2 Advance Manual Surveys
Manual surface distress, roughness and rut depth surveys are conducted at all of
the test sites in advance of the initial QA testing.
Class I Roughness Survey
Manual Distress Survey
Rut Depth Survey

2016 PAVEMENT SURFACE CONDITION RATING MANUAL
CONSTRUCTION AND MAINTENANCE BRANCH 59
Visual distress ratings are conducted for each 50 metre segment. Manual
transverse profile measurements are recorded in each wheel path at 10 metre
intervals and the IRI measured for each wheel path using a Class 1 profiler.
7.2.3 Roughness and Rut Depth Tests
The roughness and rut depth testing consists of validating the contractor's
instrumentation by field comparisons to the known longitudinal and transverse
profiles at each test site. The survey vehicle completes a series of five runs over
each site to assess both accuracy and repeatability. The contractor is required to
produce a report with their on-board software that specifies the IRI and rutting
values for each wheel path at 50 metre intervals as shown below.
The outside wheel path data is used for the IRI assessment and the average
wheel path rut depth for the rutting assessment.
7.2.4 Surface Distress Rating Tests
During the on-site roughness/rutting assessments, the contractor also acquires
the necessary information for conducting the surface distress ratings according to
their distress rating methodology (i.e. either video-based or LCMS). This
information is subsequently used lduring post processing by the contractor to
produce surface distress ratings for each test site. The results are submitted to
the Ministry in a prescribed spreadsheet format, as shown below.
Chainage (m) IRI Left IRI Right Rut Left Rut Right
0-50 2.11 2.16 5 9
50-100 2.11 2.15 7 13
100-150 2.10 2.13 6 12
150-200 2.00 2.11 8 9
200-250 2.12 2.11 8 10
250-300 2.20 2.18 7 11
300-350 2.16 2.15 10 10
350-400 2.17 2.22 11 10
400-450 2.12 2.24 12 12
450-500 2.21 2.23 9 12
Average 2.13 2.17 8 11
2016 PAVEMENT SURFACE CONDITION RATING MANUAL
CONSTRUCTION AND MAINTENANCE BRANCH 60
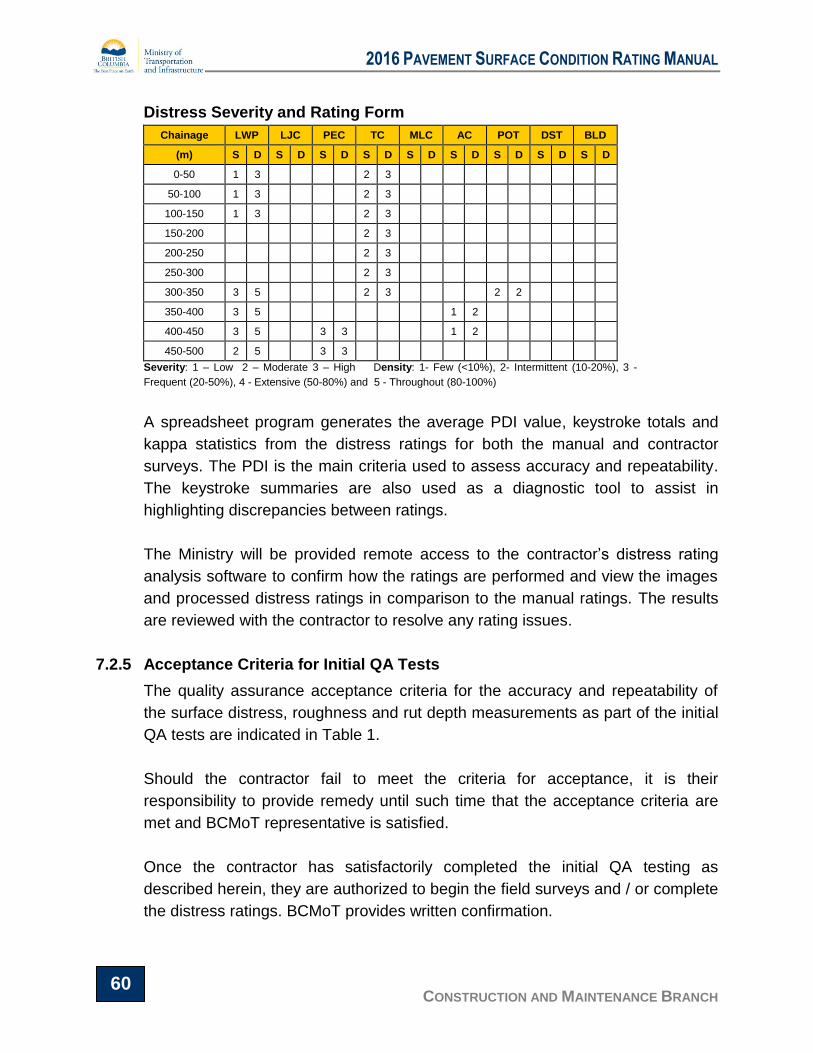
Distress Severity and Rating Form
Chainage LWP LJC PEC TC MLC AC POT DST BLD
(m) S D S D S D S D S D S D S D S D S D
0-50 1 3 2 3
50-100 1 3 2 3
100-150 1 3 2 3
150-200 2 3
200-250 2 3
250-300 2 3
300-350 3 5 2 3 2 2
350-400 3 5 1 2
400-450 3 5 3 3 1 2
450-500 2 5 3 3
Severity: 1 – Low 2 – Moderate 3 – High Density: 1- Few (<10%), 2- Intermittent (10-20%), 3 -
Frequent (20-50%), 4 - Extensive (50-80%) and 5 - Throughout (80-100%)
A spreadsheet program generates the average PDI value, keystroke totals and
kappa statistics from the distress ratings for both the manual and contractor
surveys. The PDI is the main criteria used to assess accuracy and repeatability.
The keystroke summaries are also used as a diagnostic tool to assist in
highlighting discrepancies between ratings.
The Ministry will be provided remote access to the contractor’s distress rating
analysis software to confirm how the ratings are performed and view the images
and processed distress ratings in comparison to the manual ratings. The results
are reviewed with the contractor to resolve any rating issues.
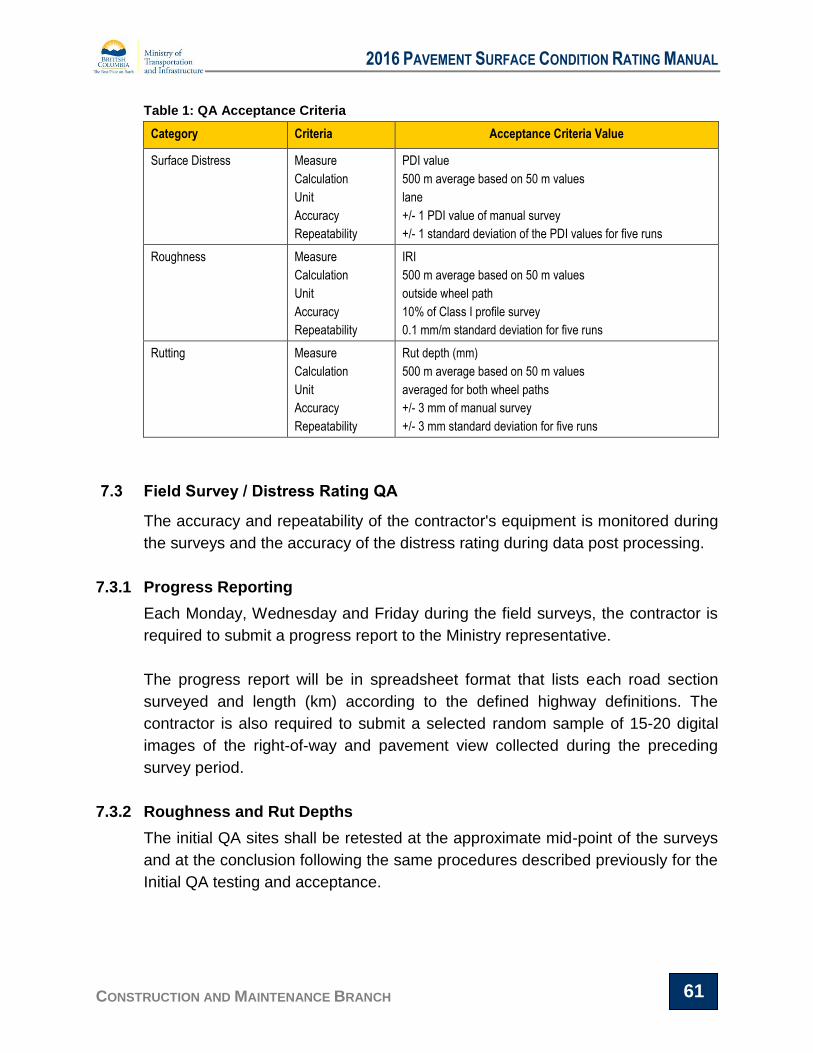
7.2.5 Acceptance Criteria for Initial QA Tests
The quality assurance acceptance criteria for the accuracy and repeatability of
the surface distress, roughness and rut depth measurements as part of the initial
QA tests are indicated in Table 1.
Should the contractor fail to meet the criteria for acceptance, it is their
responsibility to provide remedy until such time that the acceptance criteria are
met and BCMoT representative is satisfied.
Once the contractor has satisfactorily completed the initial QA testing as
described herein, they are authorized to begin the field surveys and / or complete
the distress ratings. BCMoT provides written confirmation.
2016 PAVEMENT SURFACE CONDITION RATING MANUAL
CONSTRUCTION AND MAINTENANCE BRANCH 61
Table 1: QA Acceptance Criteria
Category Criteria Acceptance Criteria Value
Surface Distress
Measure
Calculation
Unit
Accuracy
Repeatability
PDI value
500 m average based on 50 m values
lane
+/- 1 PDI value of manual survey
+/- 1 standard deviation of the PDI values for five runs
Roughness Measure
Calculation
Unit
Accuracy
Repeatability
IRI
500 m average based on 50 m values
outside wheel path
10% of Class I profile survey
0.1 mm/m standard deviation for five runs
Rutting Measure
Calculation
Unit
Accuracy
Repeatability
Rut depth (mm)
500 m average based on 50 m values
averaged for both wheel paths
+/- 3 mm of manual survey
+/- 3 mm standard deviation for five runs
7.3 Field Survey / Distress Rating QA
The accuracy and repeatability of the contractor's equipment is monitored during
the surveys and the accuracy of the distress rating during data post processing.
7.3.1 Progress Reporting
Each Monday, Wednesday and Friday during the field surveys, the contractor is
required to submit a progress report to the Ministry representative.
The progress report will be in spreadsheet format that lists each road section
surveyed and length (km) according to the defined highway definitions. The
contractor is also required to submit a selected random sample of 15-20 digital
images of the right-of-way and pavement view collected during the preceding
survey period.
7.3.2 Roughness and Rut Depths
The initial QA sites shall be retested at the approximate mid-point of the surveys
and at the conclusion following the same procedures described previously for the
Initial QA testing and acceptance.

2016 PAVEMENT SURFACE CONDITION RATING MANUAL
CONSTRUCTION AND MAINTENANCE BRANCH 62
7.3.3 Surface Distress
The following processes are used to assess the contractor’s surface distress
ratings:
a) Blind sites situated along various highways that have been manually
surveyed in advance and are of unknown location to the contractor; and
b) Comparison to previously collected data at selected test sites.
The number and location of the blind sites is defined based on the annual survey
schedule. Manual surface distress surveys are conducted for the blind sites and
assessed as described previously.
The second QA process involves comparing the PDI and individual distress
ratings for selected test sites (5 km in length). The sites are selected based on
their current condition profile and evaluated using the prior cycle condition data.
The contractor is required to submit their distress ratings in the prescribed format
previously noted. The results are reviewed with the contractor to resolve any
rating issues. The Ministry will also be provided remote access to the contractor’s
distress rating analysis software to confirm how the ratings are performed and
view the images and processed distress ratings in comparison to the manual
ratings.
7.3.4 Acceptance Criteria for Survey QA Tests
The quality assurance acceptance criteria for the surface distress, roughness
and rut depth measurements for blind site QA are listed in Table 1. Should the
contractor fail to meet the criteria for acceptance, it is their responsibility to
provide remedy until such time that the acceptance criteria are met and BCMoT
representative is satisfied.
7.4 Submitted Data Quality Assurance
Quality assurance assessment of submitted data is considered an integral part of
the overall survey QA process. The Ministry uses both manual and system
checks to assess submitted surface distress, roughness and rut depth data files.

2016 PAVEMENT SURFACE CONDITION RATING MANUAL
CONSTRUCTION AND MAINTENANCE BRANCH 63
7.4.1 Manual Review
The first step consists of conducting a thorough manual review of the submitted
data files and includes verifying the following:
Data exists for all road segments;
Highway traversal definitions for all road segments;
Correct data file structure;
Start and end boundaries for all road segments;
All lane references and chainages according to provided data files;
Screening all data for null and negative values; and
Screening all data according to max/min tolerance parameters.
The initial QA results are summarized and provided to the contractor for
correction.
7.4.2 PMS Data Upload Tests
The final step then involves uploading the distress, roughness and rut depth data
to the Ministry’s corporate pavement management system. The system includes
functionality that conduct internal standardized and user defined verification
tests. Afterwards, the PMS generates a log report listing all discrepancies which
can be reviewed, confirmed and input data corrected and reloaded as required.
All of this is documented on file as well for future reference.
7.5 Data File Specifications
The following tables describe the file format specifications for RPMS pavement condition data files. All files are to be provided in DBF and CSV formats.
7.6 File Examples
The following are examples of network level surface distress and pavement roughness / rut depth RPMS input data files.

2016 PAVEMENT SURFACE CONDITION RATING MANUAL
CONSTRUCTION AND MAINTENANCE BRANCH 64
Distress Data File
Description Field Name Units Type Width Decimal
Route Type ROUTE_TYPE - C 2 0
Route Number HIWY_ID - N 5 0
Route Aux ID AUX_ID - C 1 0
Contract Area CA - N 2 0
Direction DIRECTION - C 1 0
Area Manager (Area) and Sub Area AMSA - C 2 0
From Distance START_KM km N 8 3
To Distance END_KM km N 8 3
Lane ID LANE 1-10 N 1 0
Survey Date SURVEY_DAT yyyymmdd D 8 0
Pavement Type (Asphalt =1) PAVE_TYPE - N 1 0
% Longitudinal Wheel Path Crack Low Severity LNGC_L % N 3 0
% Longitudinal Wheel Path Crack Moderate Severity LNGC_M % N 3 0
% Longitudinal Wheel Path Crack High Severity LNGC_H % N 3 0
% Longitudinal Joint Crack Low Severity LCJT_L % N 3 0
% Longitudinal Joint Crack Moderate Severity LCJT_M % N 3 0
% Longitudinal Joint Crack High Severity LCJT_H % N 3 0
% Pavement Edge Crack Low Severity EDGE_L % N 3 0
% Pavement Edge Crack Moderate Severity EDGE_M % N 3 0
% Pavement Edge Crack High Severity EDGE_H % N 3 0
% Transverse Cracking Low Severity TRNC_L % N 3 0
% Transverse Cracking Moderate Severity TRNC_M % N 3 0
% Transverse Cracking High Severity TRNC_H % N 3 0
% Meandering Longitudinal Crack Low Severity MEAN_L % N 3 0
% Meandering Longitudinal Crack Moderate Severity MEAN_M % N 3 0
% Meandering Longitudinal Crack High Severity MEAN_H % N 3 0
% Alligator Cracking Moderate Severity ALGC_M % N 3 0
% Alligator Cracking High Severity ALGC_H % N 3 0
% Rutting Low Severity RUTT_L % N 3 0
% Rutting Moderate Severity RUTT_M % N 3 0
% Rutting High Severity RUTT_H % N 3 0
% Potholes Low Severity POTH_L % N 3 0
% Potholes Moderate Severity POTH_M % N 3 0
% Potholes High Severity POTH_H % N 3 0
% Bleeding Moderate Severity BLDG_M % N 3 0
% Bleeding High Severity BLDG_H % N 3 0
Corporate Performance Measure CPM - C 2 0
Latitude –NAD83(CSRS) LATITUDE Decimal degrees C 10 6
Latitude Direction LATDIR N C 1 0
Longitude - NAD83(CSRS) LONGITUDE Decimal degrees C 11 6
Longitude Direction LONGDIR W C 1 0
Elevation ELEVATION metres N 9 1
Notes:
• Route Type: Primary Highway = P, Secondary Highway = S, Side Road = SR, IRI & Images Only = I
• See Chapter 6 for further explanation of the Route Number, Route Aux ID, Contract Area, Direction, Area
Manager Area and Lane ID fields shown above.
• Pavement Type: Asphalt =1
• Corporate Performance Measure: Network Level (NL) and Project Level (PL)
• The latitude and longitude coordinates correspond to the From Distance chainage point
• Longitude values shall be prefixed with a negative sign ( - )
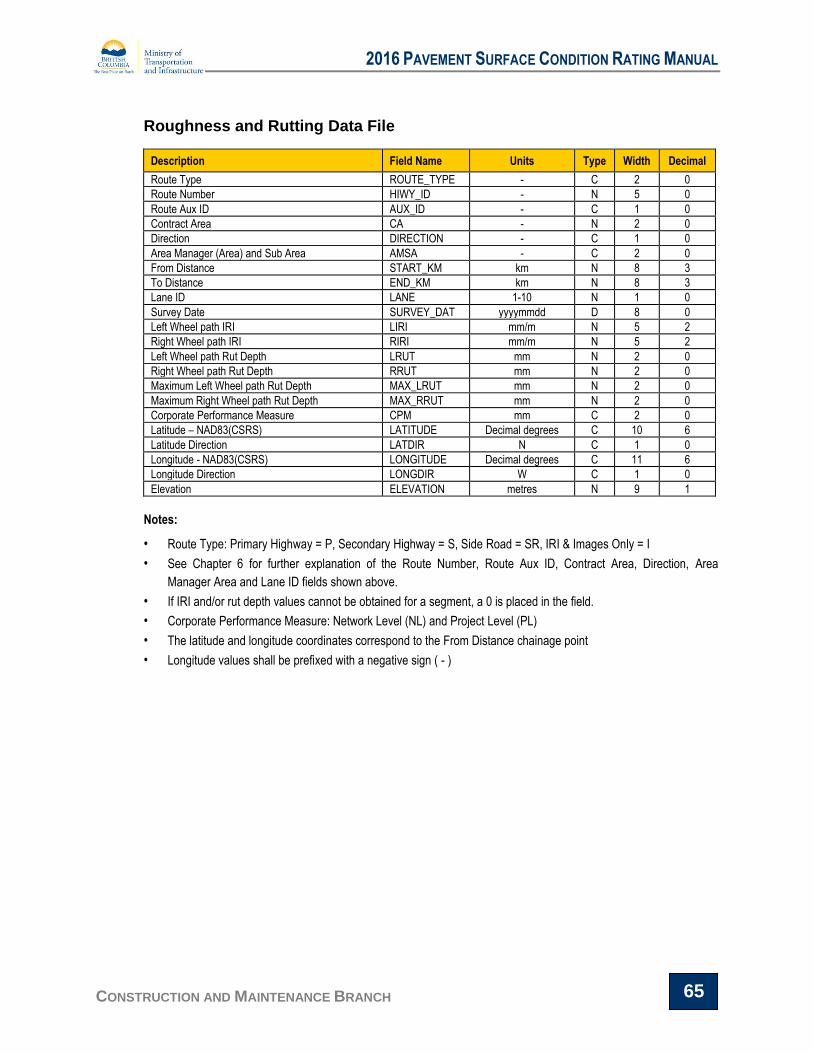
2016 PAVEMENT SURFACE CONDITION RATING MANUAL
CONSTRUCTION AND MAINTENANCE BRANCH 65
Roughness and Rutting Data File
Description Field Name Units Type Width Decimal
Route Type ROUTE_TYPE - C 2 0
Route Number HIWY_ID - N 5 0
Route Aux ID AUX_ID - C 1 0
Contract Area CA - N 2 0
Direction DIRECTION - C 1 0
Area Manager (Area) and Sub Area AMSA - C 2 0
From Distance START_KM km N 8 3
To Distance END_KM km N 8 3
Lane ID LANE 1-10 N 1 0
Survey Date SURVEY_DAT yyyymmdd D 8 0
Left Wheel path IRI LIRI mm/m N 5 2
Right Wheel path IRI RIRI mm/m N 5 2
Left Wheel path Rut Depth LRUT mm N 2 0
Right Wheel path Rut Depth RRUT mm N 2 0
Maximum Left Wheel path Rut Depth MAX_LRUT mm N 2 0
Maximum Right Wheel path Rut Depth MAX_RRUT mm N 2 0
Corporate Performance Measure CPM mm C 2 0
Latitude – NAD83(CSRS) LATITUDE Decimal degrees C 10 6
Latitude Direction LATDIR N C 1 0
Longitude - NAD83(CSRS) LONGITUDE Decimal degrees C 11 6
Longitude Direction LONGDIR W C 1 0
Elevation ELEVATION metres N 9 1
Notes:
• Route Type: Primary Highway = P, Secondary Highway = S, Side Road = SR, IRI & Images Only = I
• See Chapter 6 for further explanation of the Route Number, Route Aux ID, Contract Area, Direction, Area
Manager Area and Lane ID fields shown above.
• If IRI and/or rut depth values cannot be obtained for a segment, a 0 is placed in the field.
• Corporate Performance Measure: Network Level (NL) and Project Level (PL)
• The latitude and longitude coordinates correspond to the From Distance chainage point
• Longitude values shall be prefixed with a negative sign ( - )

2016 PAVEMENT SURFACE CONDITION RATING MANUAL
CONSTRUCTION AND MAINTENANCE BRANCH 66
Surface Distress

2016 PAVEMENT SURFACE CONDITION RATING MANUAL
CONSTRUCTION AND MAINTENANCE BRANCH 67
Roughness and Rutting

2016 PAVEMENT SURFACE CONDITION RATING MANUAL
CONSTRUCTION AND MAINTENANCE BRANCH 68
7.7 Right of Way Digital Image Specifications
The following section describes the right of way digital image specifications for
network level pavement surface condition surveys. They are based on using a
single high resolution camera mounted onto the vehicle to record the right of way
view of the pavement surface.
7.7.1 View
Right-of-Way (ROW) view - continuous images of the full pavement width,
shoulders and roadside features such as signs, structures and guardrails. The
horizon line shall be at approximately 80 percent of the way up the frame.
7.7.2 Image Resolution
The minimum image resolution is to be a minimum 1300 x 1030 colour image.
7.7.3 Media and Format
The recording media is to be digital and provide a minimum 12 bit color images in
JPEG format. The desired image file size is 100 to 150 kbytes. The equipment is
to be capable of delivering quality images, during all of the various conditions that
the Production Survey may be undertaken. The equipment is to be progressive
scan, or equivalent to yield clear images from a moving vehicle. Images will be
taken at 10 metre intervals.
7.7.4 Review of Trial Images
During the initial QA testing, the camera angles and magnification will be
adjusted and defined by a series of test runs with the Ministry representative to
determine the appropriate views. Once the appropriate view has been
established, the contractor must take all necessary measures to ensure that the
image angle and magnification remain consistent throughout the Production
Surveys, and brightness settings are constantly adjusted to yield high quality
images. This is particularly critical if the recording system requires camera to be
dismounted and remounted each day.
7.7.5 Quality Assurance
During the Production Surveys, the contractor will be required to provide the
Ministry Representative with a sample copy from the ongoing survey for review
based on the blind site QA survey limits. A 500 metre sample of digital images

2016 PAVEMENT SURFACE CONDITION RATING MANUAL
CONSTRUCTION AND MAINTENANCE BRANCH 69
shall be provided electronically to the Ministry representative for review. The
overall quality of the image must be acceptable as well as the composition of the
images. This review will ensure that the correct camera positions and field of
view are being captured as well as general adherence to the specifications. The
survey crew shall be notified of any changes required.
7.7.6 Folder Naming Convention
The digital images are to be delivered in electronic format, using the following
folder naming convention.
Primary and Secondary Highways
For Primary and Secondary Highways, the images shall be place in folders
named as follows. These folders shall be within a folder named “YYYY Highway
Images” - where YYYY is the year the images were taken (Note: each
information item immediately follows the preceding item, no spaces):
The single character H;
The numeric highway number – variable # of characters up to a maximum of
four;
The highways single alpha suffix if applicable (no placeholder needed if not
applicable);
An underscore (_);
The single character alpha cardinal direction of the highway;
An underscore (_);
The two digit numeric Contract Area if applicable (used when another non-
contiguous highway with the same number exists in a different Contract Area
– 00 placeholder needed if NA);
An underscore (_);
For Project Level Survey data only, the letter ‘L’ followed by the single digit
numeric lane number that Project Level images are for;
An underscore (_);
The two letters ‘km’; and
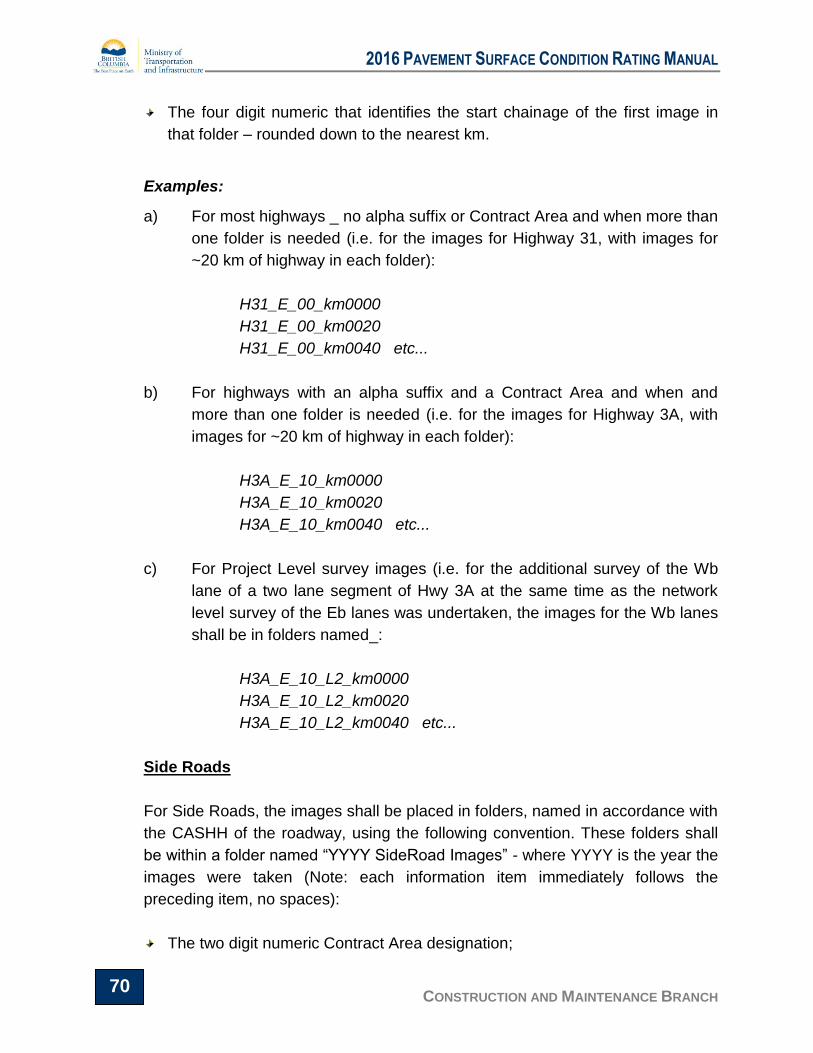
2016 PAVEMENT SURFACE CONDITION RATING MANUAL
CONSTRUCTION AND MAINTENANCE BRANCH 70
The four digit numeric that identifies the start chainage of the first image in
that folder – rounded down to the nearest km.
Examples:
a) For most highways _ no alpha suffix or Contract Area and when more than
one folder is needed (i.e. for the images for Highway 31, with images for
~20 km of highway in each folder):
H31_E_00_km0000
H31_E_00_km0020
H31_E_00_km0040 etc...
b) For highways with an alpha suffix and a Contract Area and when and
more than one folder is needed (i.e. for the images for Highway 3A, with
images for ~20 km of highway in each folder):
H3A_E_10_km0000
H3A_E_10_km0020
H3A_E_10_km0040 etc...
c) For Project Level survey images (i.e. for the additional survey of the Wb
lane of a two lane segment of Hwy 3A at the same time as the network
level survey of the Eb lanes was undertaken, the images for the Wb lanes
shall be in folders named_:
H3A_E_10_L2_km0000
H3A_E_10_L2_km0020
H3A_E_10_L2_km0040 etc...
Side Roads
For Side Roads, the images shall be placed in folders, named in accordance with
the CASHH of the roadway, using the following convention. These folders shall
be within a folder named “YYYY SideRoad Images” - where YYYY is the year the
images were taken (Note: each information item immediately follows the
preceding item, no spaces):
The two digit numeric Contract Area designation;
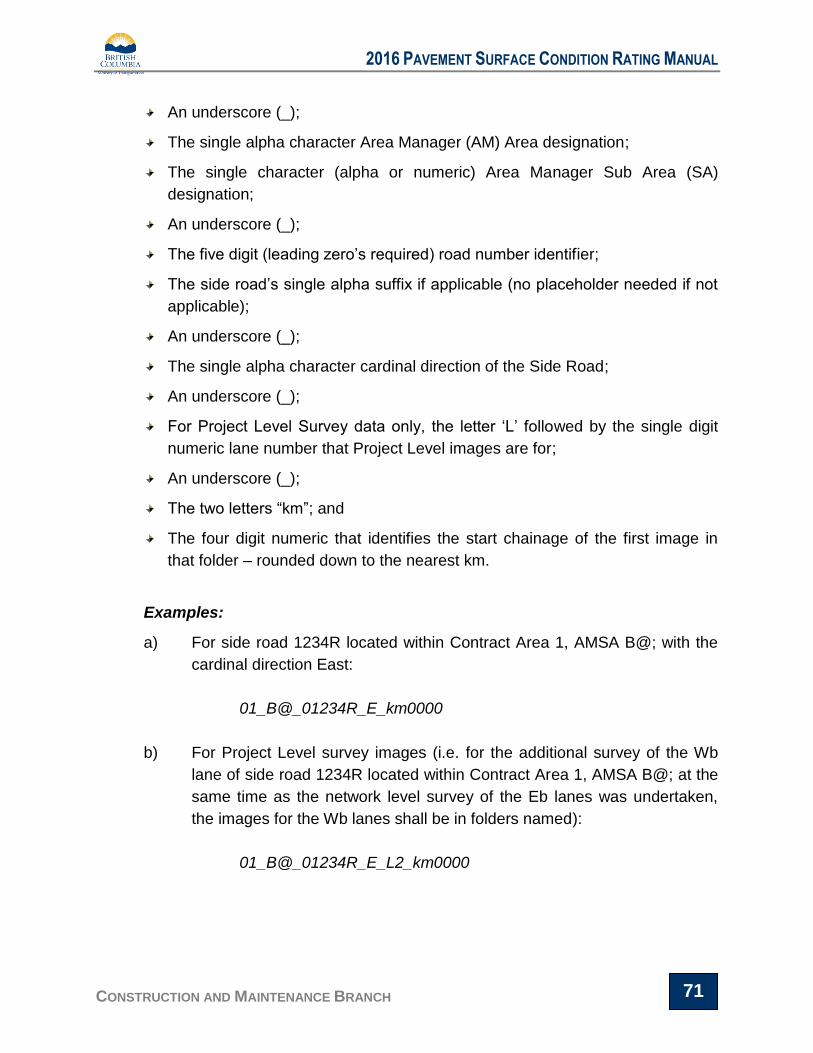
2016 PAVEMENT SURFACE CONDITION RATING MANUAL
CONSTRUCTION AND MAINTENANCE BRANCH 71
An underscore (_);
The single alpha character Area Manager (AM) Area designation;
The single character (alpha or numeric) Area Manager Sub Area (SA)
designation;
An underscore (_);
The five digit (leading zero’s required) road number identifier;
The side road’s single alpha suffix if applicable (no placeholder needed if not
applicable);
An underscore (_);
The single alpha character cardinal direction of the Side Road;
An underscore (_);
For Project Level Survey data only, the letter ‘L’ followed by the single digit
numeric lane number that Project Level images are for;
An underscore (_);
The two letters “km”; and
The four digit numeric that identifies the start chainage of the first image in
that folder – rounded down to the nearest km.
Examples:
a) For side road 1234R located within Contract Area 1, AMSA B@; with the
cardinal direction East:
01_B@_01234R_E_km0000
b) For Project Level survey images (i.e. for the additional survey of the Wb
lane of side road 1234R located within Contract Area 1, AMSA B@; at the
same time as the network level survey of the Eb lanes was undertaken,
the images for the Wb lanes shall be in folders named):
01_B@_01234R_E_L2_km0000

2016 PAVEMENT SURFACE CONDITION RATING MANUAL
CONSTRUCTION AND MAINTENANCE BRANCH 72
7.7.7 Image Naming Convention
The digital images are to be delivered in electronic format, using the following
image naming convention.
For Primary Highways, Secondary Highways, and for Side Roads – The image
names shall duplicate the folder names, but the characters following “km” shall
be the driven distance along each highway that the image was taken at.
Examples:
a) For the first image along Highway 1 Eb, at Km 0.000
H1_E_00_km0000.000
b) For the image taken 12.345 kilometres along Highway 3A in CA 10 - Eb,
H3A_E_10_km0012.345
c) For the image taken 1.230 km along side road 1234R located within
Contract Area 1, AMSA B@; with the cardinal direction East:
01_B@_01234R_E_km0001.230
d) For the ‘Project Level’ Survey images taken at km 1.230 of the westbound
lanes of side road 1234R located within Contract Area 1, AMSA B@ - with
the cardinal direction East:
01_B@_01234R_E_L2_km0001.230
7.7.8 Image Header
Each image, shall contain a header showing:
Left side of Header:
Date and time image taken;
For Primary and Secondary Highways - The Traversal Code;
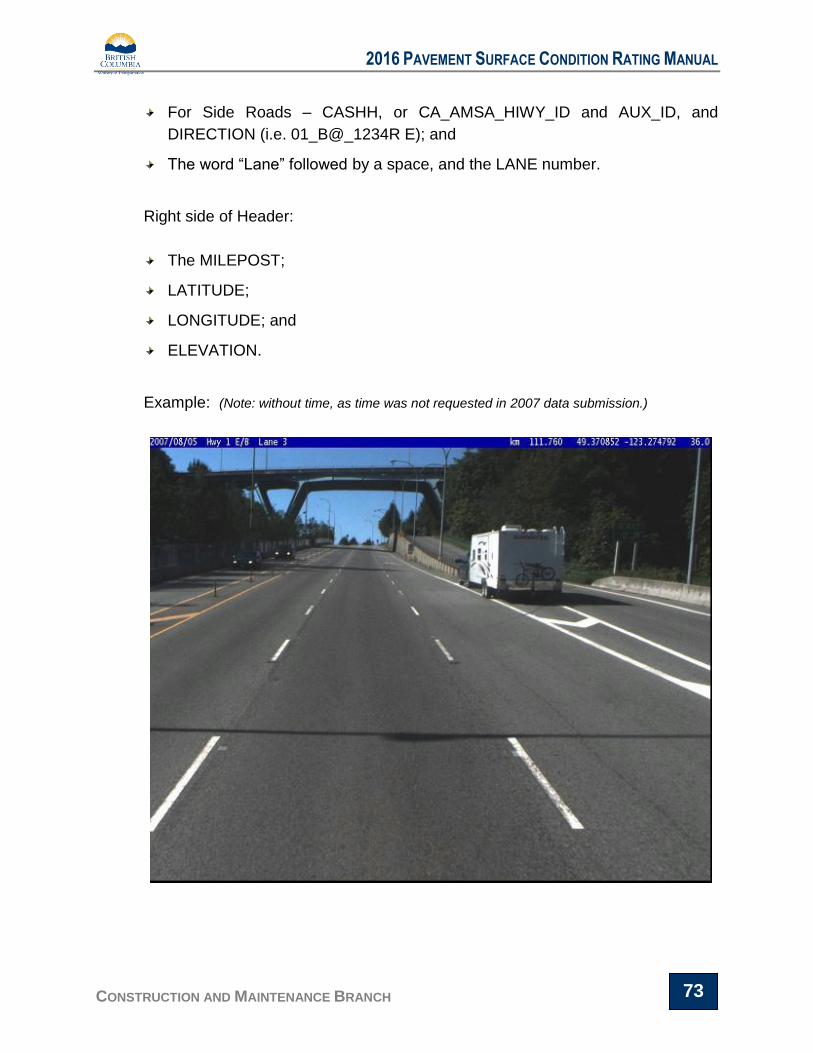
2016 PAVEMENT SURFACE CONDITION RATING MANUAL
CONSTRUCTION AND MAINTENANCE BRANCH 73
For Side Roads – CASHH, or CA_AMSA_HIWY_ID and AUX_ID, and
DIRECTION (i.e. 01_B@_1234R E); and
The word “Lane” followed by a space, and the LANE number.
Right side of Header:
The MILEPOST;
LATITUDE;
LONGITUDE; and
ELEVATION.
Example: (Note: without time, as time was not requested in 2007 data submission.)
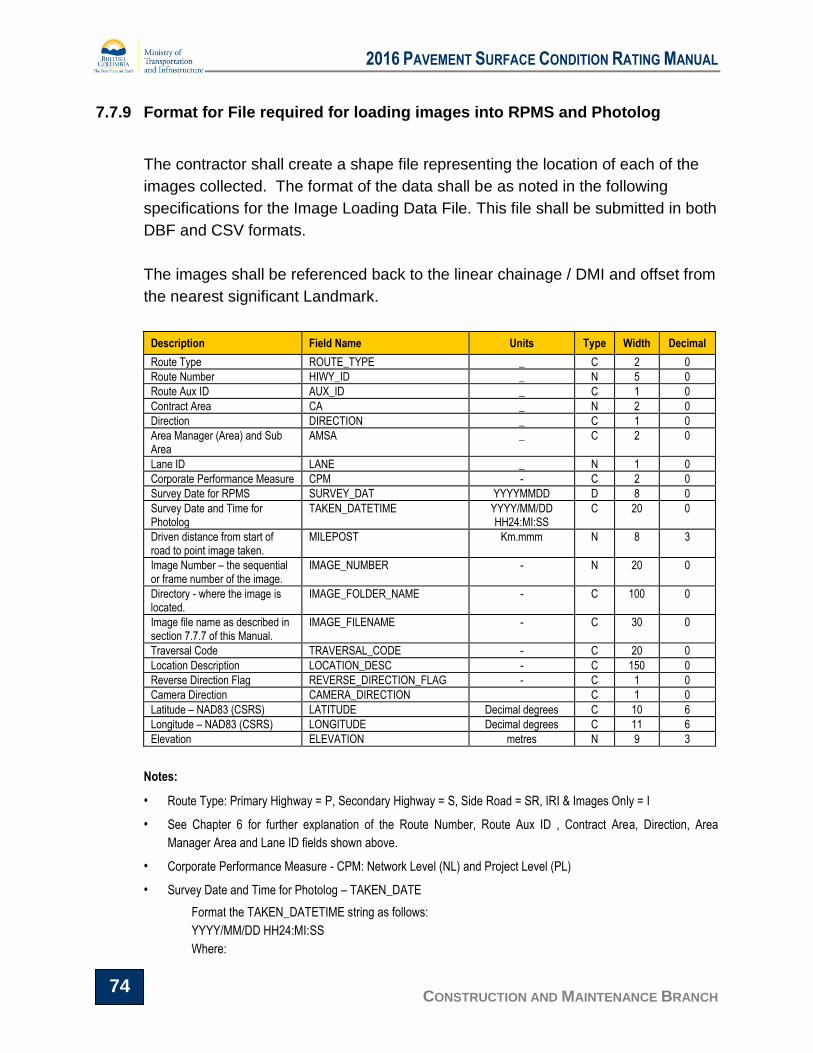
2016 PAVEMENT SURFACE CONDITION RATING MANUAL
CONSTRUCTION AND MAINTENANCE BRANCH 74
7.7.9 Format for File required for loading images into RPMS and Photolog
The contractor shall create a shape file representing the location of each of the
images collected. The format of the data shall be as noted in the following
specifications for the Image Loading Data File. This file shall be submitted in both
DBF and CSV formats.
The images shall be referenced back to the linear chainage / DMI and offset from
the nearest significant Landmark.
Description Field Name Units Type Width Decimal
Route Type ROUTE_TYPE _ C 2 0
Route Number HIWY_ID _ N 5 0
Route Aux ID AUX_ID _ C 1 0
Contract Area CA _ N 2 0
Direction DIRECTION _ C 1 0
Area Manager (Area) and Sub Area
AMSA _ C 2 0
Lane ID LANE _ N 1 0
Corporate Performance Measure CPM - C 2 0
Survey Date for RPMS SURVEY_DAT YYYYMMDD D 8 0
Survey Date and Time for Photolog
TAKEN_DATETIME YYYY/MM/DD HH24:MI:SS
C 20 0
Driven distance from start of road to point image taken.
MILEPOST Km.mmm N 8 3
Image Number – the sequential or frame number of the image.
IMAGE_NUMBER - N 20 0
Directory - where the image is located.
IMAGE_FOLDER_NAME - C 100 0
Image file name as described in section 7.7.7 of this Manual.
IMAGE_FILENAME - C 30 0
Traversal Code TRAVERSAL_CODE - C 20 0
Location Description LOCATION_DESC - C 150 0
Reverse Direction Flag REVERSE_DIRECTION_FLAG - C 1 0
Camera Direction CAMERA_DIRECTION C 1 0
Latitude – NAD83 (CSRS) LATITUDE Decimal degrees C 10 6
Longitude – NAD83 (CSRS) LONGITUDE Decimal degrees C 11 6
Elevation ELEVATION metres N 9 3
Notes:
• Route Type: Primary Highway = P, Secondary Highway = S, Side Road = SR, IRI & Images Only = I
• See Chapter 6 for further explanation of the Route Number, Route Aux ID , Contract Area, Direction, Area
Manager Area and Lane ID fields shown above.
• Corporate Performance Measure - CPM: Network Level (NL) and Project Level (PL)
• Survey Date and Time for Photolog – TAKEN_DATE
Format the TAKEN_DATETIME string as follows:
YYYY/MM/DD HH24:MI:SS
Where:

2016 PAVEMENT SURFACE CONDITION RATING MANUAL
CONSTRUCTION AND MAINTENANCE BRANCH 75
YYYY is the year including century
MM is the month 01 for January, 12 for December
DD is the day of the month
HH24 is the hour in 24 hour notation. Must be in the range 0 - 23
MI are the minutes. Must be in the range 0 - 59
SS are the seconds. Must be in the range 0 - 59
Examples: 2009/04/29 06:20:45
2009/04/30 23:59:59
• Directory - where the image is located. Does not include drive letter and must have a backslash at the end (i.e.
“2005 SIDE ROAD Images\Folder Name\” where Folder Name is as described in section 7.7.6 of this Manual).
• Traversal Code – A compilation of:
For Primary and Secondary Highways:
the prefix ‘H’
The Route Number
The Route Aux ID
An Underscore (_)
Direction
For Side Roads:
the prefix ‘SR’
the Contract Area
an Underscore (_)
the AMSA
an Underscore (_)
the Route Number
The Route Aux ID
An Underscore (_)
Direction
• Location Description – A description of the road the image was taken on, comprised of: ,<direction of travel>,
<Traversal Code>, <driven distance>, past <last significant RPMS landmark>, <general geographic location
description>.
Example: Nb H5 E, 1.403 km past intersection with Vavenby Bridge Road, East of 100 Mile House.
• Reverse Direction Flag
N is for images taken with increasing driven distances, and
Y if for images taken with decreasing driven distances
• Camera Direction - The direction the camera faces, relative to the vehicle.
F = Forward
R = Reverse
Will only be needed if we require a forward facing and a rear facing camera to capture signs etc. in opposite
direction of travel.
• The latitude and longitude coordinates shall record the GPS Coordinate position of the survey vehicle at the time
each image was captured.

2016 PAVEMENT SURFACE CONDITION RATING MANUAL
CONSTRUCTION AND MAINTENANCE BRANCH 76
This page has been left intentionally blank.

2016 PAVEMENT SURFACE CONDITION RATING MANUAL
CONSTRUCTION AND MAINTENANCE BRANCH 77
8 Miscellaneous Ratings
In addition to the distress types described previously, there are some other
related defects that can be rated during pavement surface condition surveys.
This includes the following:
Drainage Conditions;
Crack Sealing; and
Patching.
Please note that these additional defects are not included in the network level
pavement surface conditions surveys.
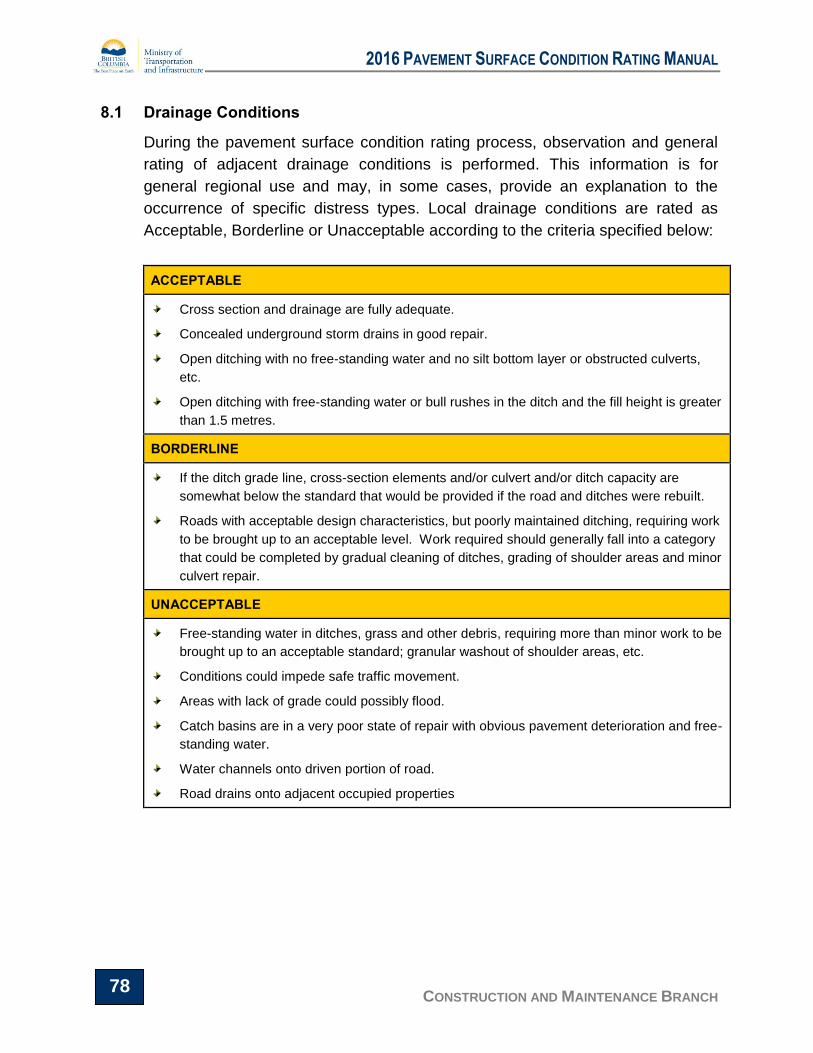
2016 PAVEMENT SURFACE CONDITION RATING MANUAL
CONSTRUCTION AND MAINTENANCE BRANCH 78
8.1 Drainage Conditions
During the pavement surface condition rating process, observation and general
rating of adjacent drainage conditions is performed. This information is for
general regional use and may, in some cases, provide an explanation to the
occurrence of specific distress types. Local drainage conditions are rated as
Acceptable, Borderline or Unacceptable according to the criteria specified below:
ACCEPTABLE
Cross section and drainage are fully adequate.
Concealed underground storm drains in good repair.
Open ditching with no free-standing water and no silt bottom layer or obstructed culverts,
etc.
Open ditching with free-standing water or bull rushes in the ditch and the fill height is greater
than 1.5 metres.
BORDERLINE
If the ditch grade line, cross-section elements and/or culvert and/or ditch capacity are
somewhat below the standard that would be provided if the road and ditches were rebuilt.
Roads with acceptable design characteristics, but poorly maintained ditching, requiring work
to be brought up to an acceptable level. Work required should generally fall into a category
that could be completed by gradual cleaning of ditches, grading of shoulder areas and minor
culvert repair.
UNACCEPTABLE
Free-standing water in ditches, grass and other debris, requiring more than minor work to be
brought up to an acceptable standard; granular washout of shoulder areas, etc.
Conditions could impede safe traffic movement.
Areas with lack of grade could possibly flood.
Catch basins are in a very poor state of repair with obvious pavement deterioration and free-
standing water.
Water channels onto driven portion of road.
Road drains onto adjacent occupied properties

2016 PAVEMENT SURFACE CONDITION RATING MANUAL
CONSTRUCTION AND MAINTENANCE BRANCH 79
Figure 41 – Acceptable Drainage
Figure 42 – Unacceptable Drainage
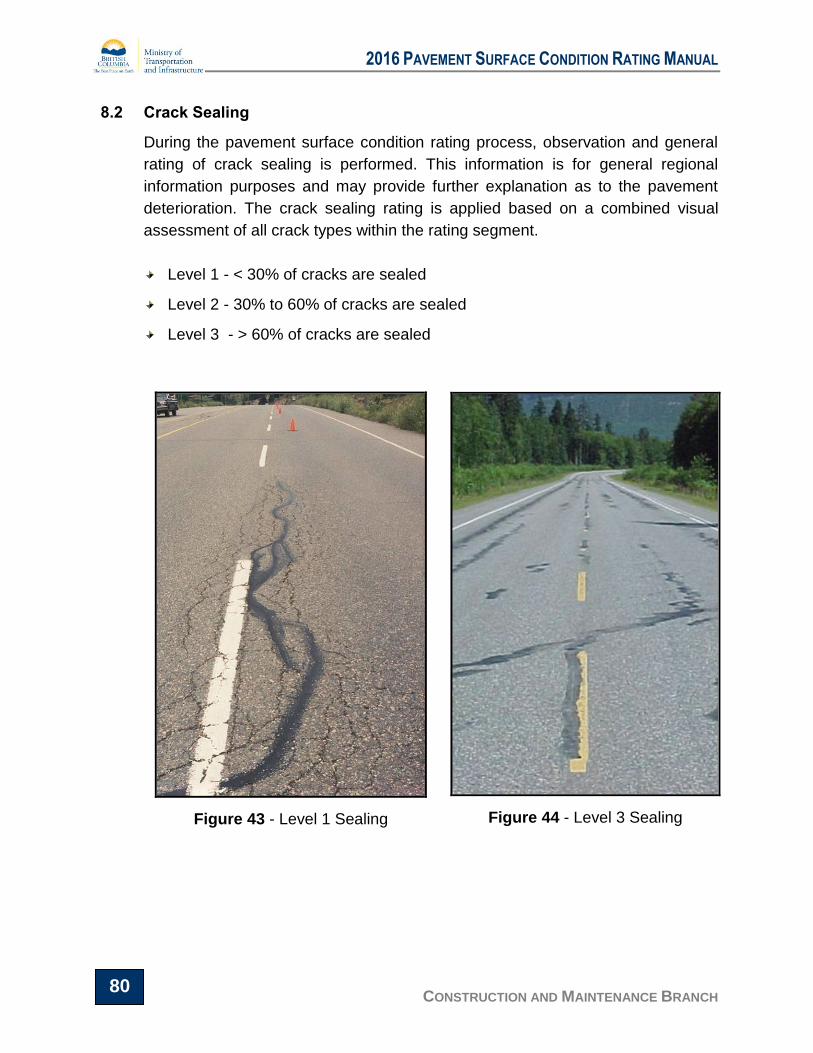
2016 PAVEMENT SURFACE CONDITION RATING MANUAL
CONSTRUCTION AND MAINTENANCE BRANCH 80
8.2 Crack Sealing
During the pavement surface condition rating process, observation and general
rating of crack sealing is performed. This information is for general regional
information purposes and may provide further explanation as to the pavement
deterioration. The crack sealing rating is applied based on a combined visual
assessment of all crack types within the rating segment.
Level 1 - < 30% of cracks are sealed
Level 2 - 30% to 60% of cracks are sealed
Level 3 - > 60% of cracks are sealed
Figure 43 - Level 1 Sealing
Figure 44 - Level 3 Sealing
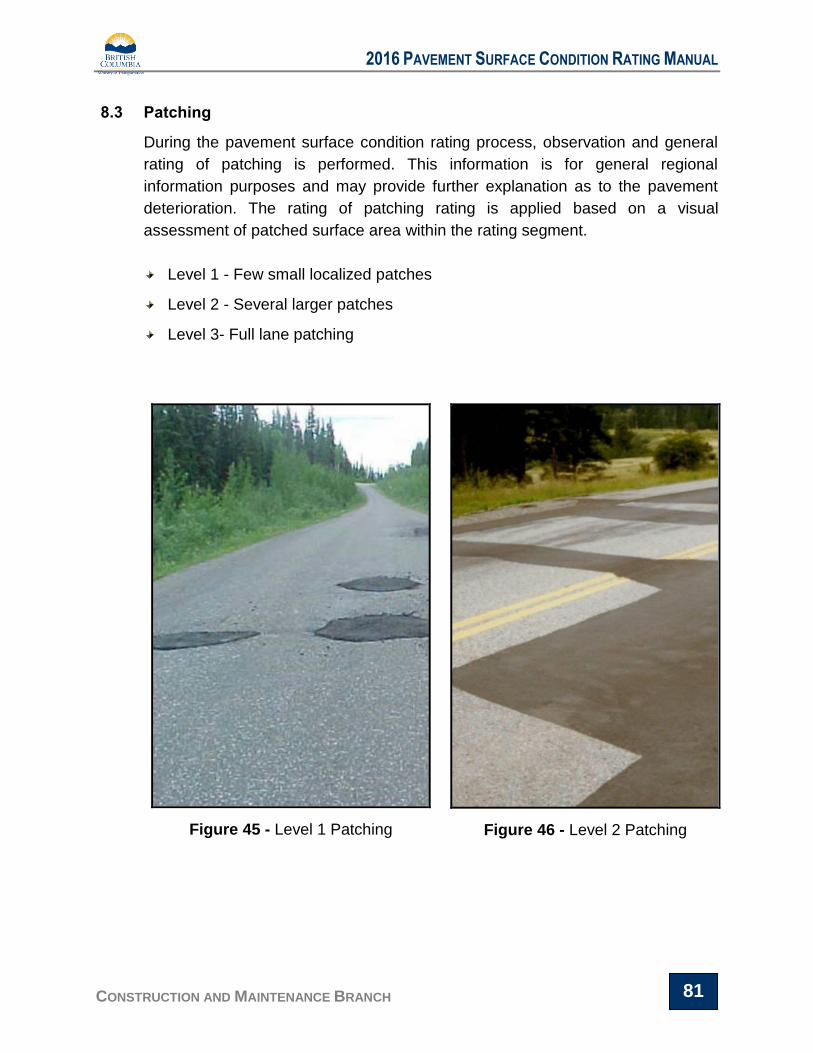
2016 PAVEMENT SURFACE CONDITION RATING MANUAL
CONSTRUCTION AND MAINTENANCE BRANCH 81
8.3 Patching
During the pavement surface condition rating process, observation and general
rating of patching is performed. This information is for general regional
information purposes and may provide further explanation as to the pavement
deterioration. The rating of patching rating is applied based on a visual
assessment of patched surface area within the rating segment.
Level 1 - Few small localized patches
Level 2 - Several larger patches
Level 3- Full lane patching
Figure 45 - Level 1 Patching
Figure 46 - Level 2 Patching

2016 PAVEMENT SURFACE CONDITION RATING MANUAL
CONSTRUCTION AND MAINTENANCE BRANCH 82
This page has been left intentionally blank.

2016 PAVEMENT SURFACE CONDITION RATING MANUAL
CONSTRUCTION AND MAINTENANCE BRANCH 83
9 Pavement Condition Forms
The following forms are provided for reference purposes and for conducting
manual surface distress rating surveys:
Pavement Distress Rating System – Severity Levels
Pavement Distress Rating System – Density Levels
Pavement Distress Survey – Evaluation Form
Pavement Distress Survey – Crack Mapping Form
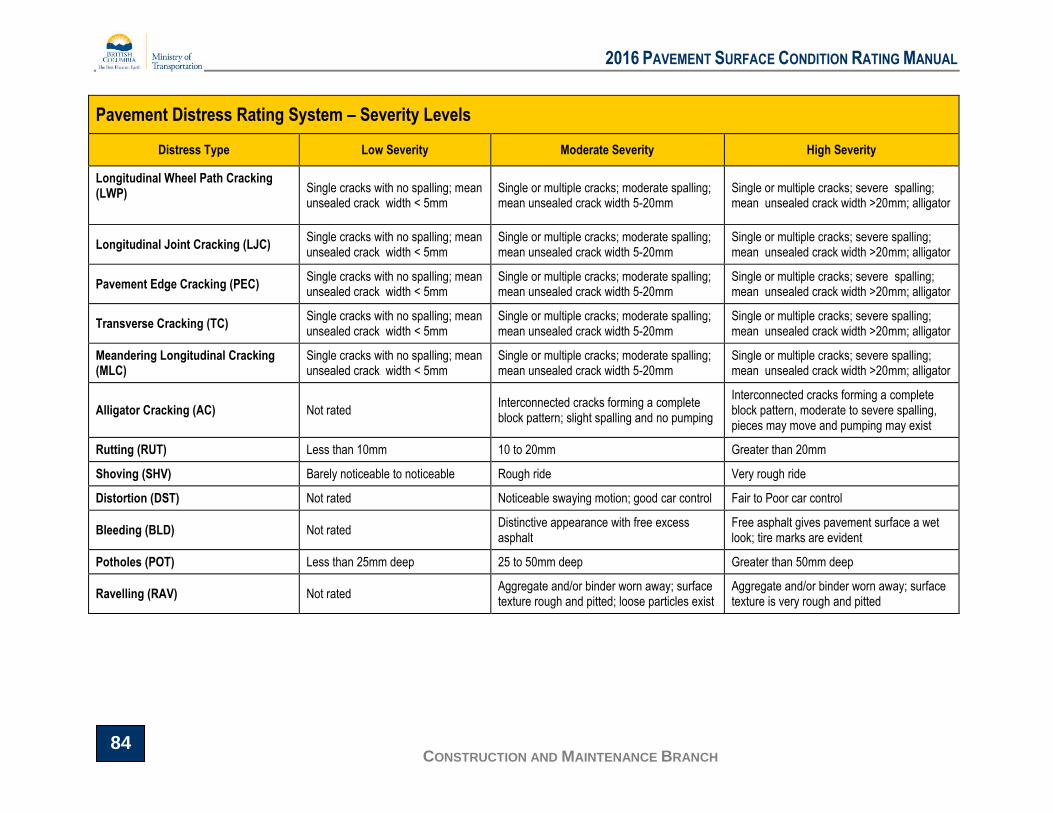
2016 PAVEMENT SURFACE CONDITION RATING MANUAL
CONSTRUCTION AND MAINTENANCE BRANCH 84
Pavement Distress Rating System – Severity Levels
Distress Type Low Severity Moderate Severity High Severity
Longitudinal Wheel Path Cracking (LWP)
Single cracks with no spalling; mean unsealed crack width < 5mm
Single or multiple cracks; moderate spalling; mean unsealed crack width 5-20mm
Single or multiple cracks; severe spalling; mean unsealed crack width >20mm; alligator
Longitudinal Joint Cracking (LJC) Single cracks with no spalling; mean unsealed crack width < 5mm
Single or multiple cracks; moderate spalling; mean unsealed crack width 5-20mm
Single or multiple cracks; severe spalling; mean unsealed crack width >20mm; alligator
Pavement Edge Cracking (PEC) Single cracks with no spalling; mean unsealed crack width < 5mm
Single or multiple cracks; moderate spalling; mean unsealed crack width 5-20mm
Single or multiple cracks; severe spalling; mean unsealed crack width >20mm; alligator
Transverse Cracking (TC) Single cracks with no spalling; mean unsealed crack width < 5mm
Single or multiple cracks; moderate spalling; mean unsealed crack width 5-20mm
Single or multiple cracks; severe spalling; mean unsealed crack width >20mm; alligator
Meandering Longitudinal Cracking (MLC)
Single cracks with no spalling; mean unsealed crack width < 5mm
Single or multiple cracks; moderate spalling; mean unsealed crack width 5-20mm
Single or multiple cracks; severe spalling; mean unsealed crack width >20mm; alligator
Alligator Cracking (AC) Not rated Interconnected cracks forming a complete block pattern; slight spalling and no pumping
Interconnected cracks forming a complete block pattern, moderate to severe spalling, pieces may move and pumping may exist
Rutting (RUT) Less than 10mm 10 to 20mm Greater than 20mm
Shoving (SHV) Barely noticeable to noticeable Rough ride Very rough ride
Distortion (DST) Not rated Noticeable swaying motion; good car control Fair to Poor car control
Bleeding (BLD) Not rated Distinctive appearance with free excess asphalt
Free asphalt gives pavement surface a wet look; tire marks are evident
Potholes (POT) Less than 25mm deep 25 to 50mm deep Greater than 50mm deep
Ravelling (RAV) Not rated Aggregate and/or binder worn away; surface texture rough and pitted; loose particles exist
Aggregate and/or binder worn away; surface texture is very rough and pitted
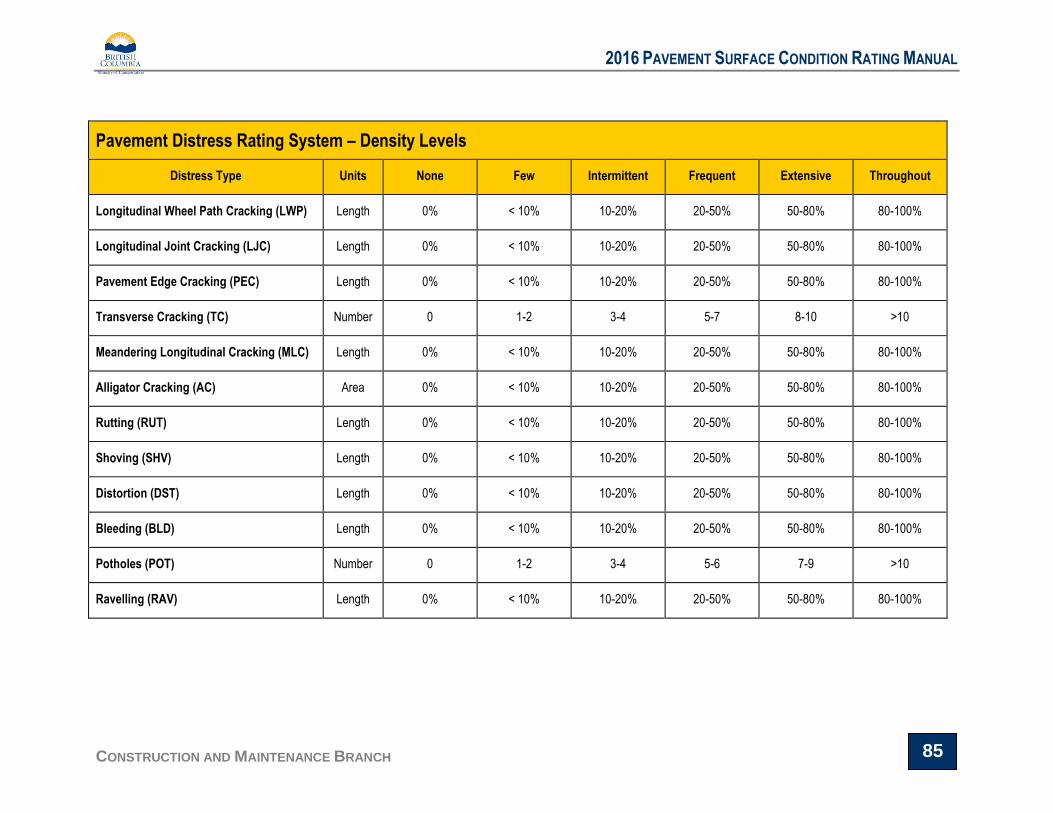
2016 PAVEMENT SURFACE CONDITION RATING MANUAL
CONSTRUCTION AND MAINTENANCE BRANCH 85
Pavement Distress Rating System – Density Levels
Distress Type Units None Few Intermittent Frequent Extensive Throughout
Longitudinal Wheel Path Cracking (LWP) Length 0% < 10% 10-20% 20-50% 50-80% 80-100%
Longitudinal Joint Cracking (LJC) Length 0% < 10% 10-20% 20-50% 50-80% 80-100%
Pavement Edge Cracking (PEC) Length 0% < 10% 10-20% 20-50% 50-80% 80-100%
Transverse Cracking (TC) Number 0 1-2 3-4 5-7 8-10 >10
Meandering Longitudinal Cracking (MLC) Length 0% < 10% 10-20% 20-50% 50-80% 80-100%
Alligator Cracking (AC) Area 0% < 10% 10-20% 20-50% 50-80% 80-100%
Rutting (RUT) Length 0% < 10% 10-20% 20-50% 50-80% 80-100%
Shoving (SHV) Length 0% < 10% 10-20% 20-50% 50-80% 80-100%
Distortion (DST) Length 0% < 10% 10-20% 20-50% 50-80% 80-100%
Bleeding (BLD) Length 0% < 10% 10-20% 20-50% 50-80% 80-100%
Potholes (POT) Number 0 1-2 3-4 5-6 7-9 >10
Ravelling (RAV) Length 0% < 10% 10-20% 20-50% 50-80% 80-100%
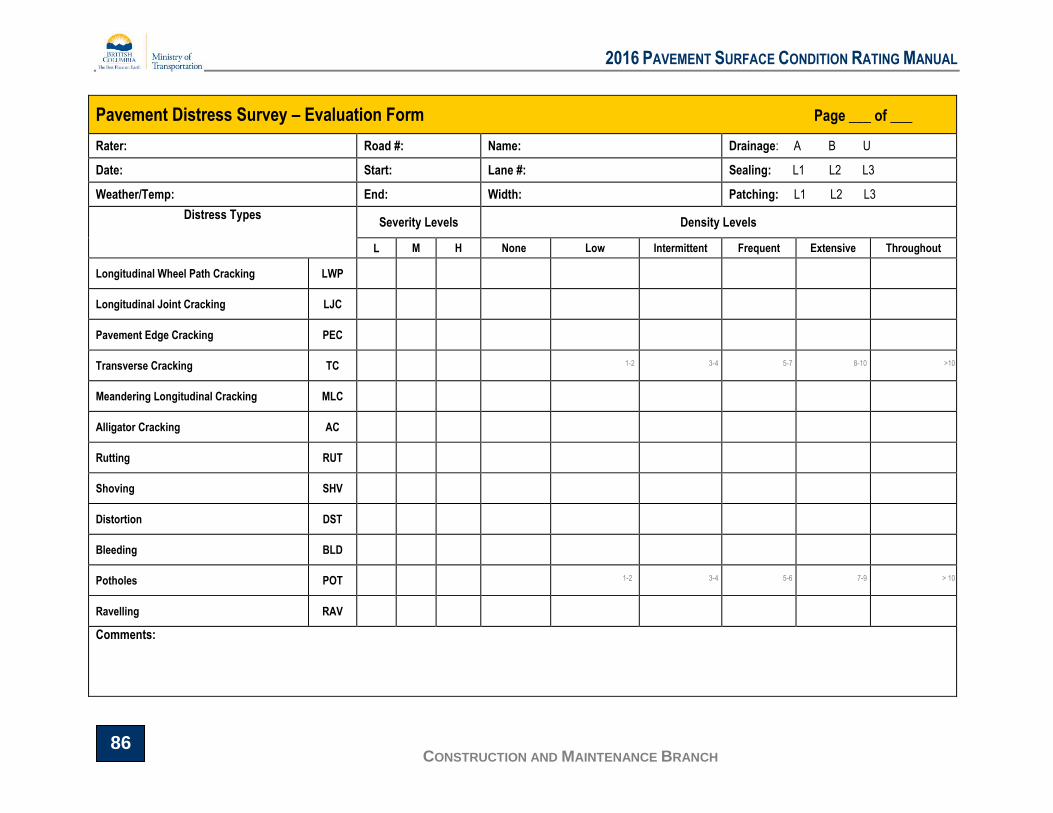
2016 PAVEMENT SURFACE CONDITION RATING MANUAL
CONSTRUCTION AND MAINTENANCE BRANCH 86
Pavement Distress Survey – Evaluation Form Page ___ of ___
Rater: Road #: Name: Drainage: A B U
Date: Start: Lane #: Sealing: L1 L2 L3
Weather/Temp: End: Width: Patching: L1 L2 L3
Distress Types Severity Levels Density Levels
L M H None Low Intermittent Frequent Extensive Throughout
Longitudinal Wheel Path Cracking LWP
Longitudinal Joint Cracking LJC
Pavement Edge Cracking PEC
Transverse Cracking TC 1-2 3-4 5-7 8-10 >10
Meandering Longitudinal Cracking MLC
Alligator Cracking AC
Rutting RUT
Shoving SHV
Distortion DST
Bleeding BLD
Potholes POT 1-2 3-4 5-6 7-9 > 10
Ravelling RAV
Comments:

2016 PAVEMENT SURFACE CONDITION RATING MANUAL
CONSTRUCTION AND MAINTENANCE BRANCH 87
Pavement Distress Survey – Crack Mapping Form
Road #: Name: Dir: N S E W
IWP OWP 50m
40 m
30 m
20 m
10 m
0 m
Start Km: Lane# Page ____ of ____