PAVEMENT SURFACE CHARACTERISTICS OF …s/Izevbekhai.pdfPAVEMENT SURFACE CHARACTERISTICS OF NEW...
42
PAVEMENT SURFACE CHARACTERISTICS OF NEW CONCRETE Bernard Igbafen Izevbekhai, P.E. MnDOT Concrete Research Engineer (Principal Investigator) [email protected]
Transcript of PAVEMENT SURFACE CHARACTERISTICS OF …s/Izevbekhai.pdfPAVEMENT SURFACE CHARACTERISTICS OF NEW...
PAVEMENT SURFACE CHARACTERISTICS OF NEW
CONCRETE
Bernard Igbafen Izevbekhai, P.E.
MnDOT Concrete Research Engineer
(Principal Investigator)
This study creates various new textures and
examines /monitors them over time with a
litany of standard tests. Simultaneously and
Subsequently certain analytic initiatives are
performed towards deployment of new and
improvement of current Practices
RAISON D’ETRE
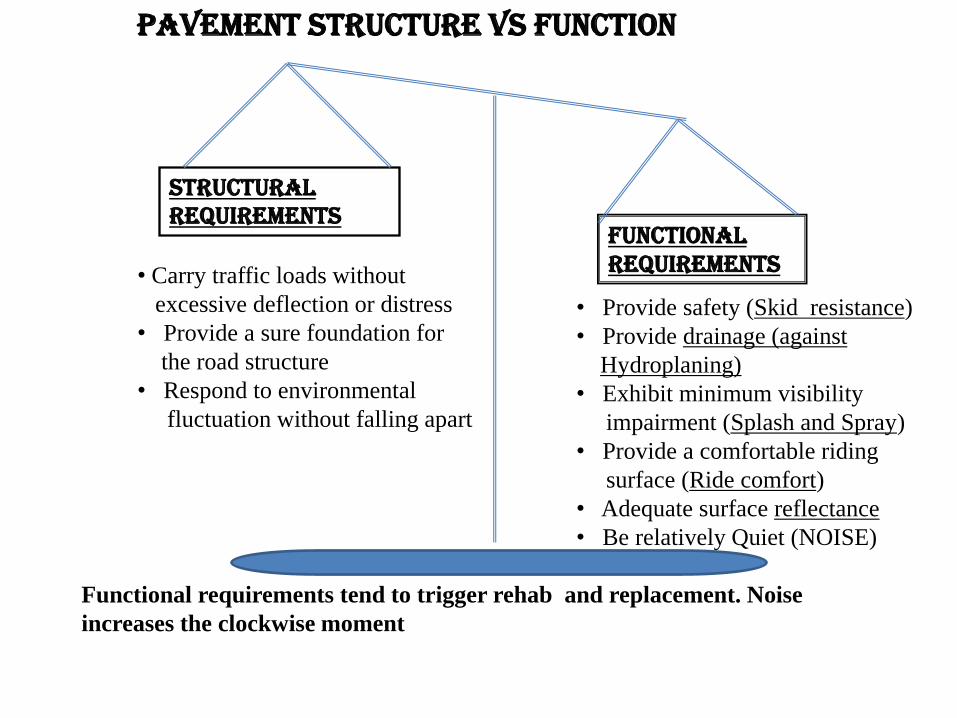
PAVEMENT STRUCTURE VS FUNCTION
• Provide safety (Skid resistance)
• Provide drainage (against
Hydroplaning)
• Exhibit minimum visibility
impairment (Splash and Spray)
• Provide a comfortable riding
surface (Ride comfort)
• Adequate surface reflectance
• Be relatively Quiet (NOISE)
• Carry traffic loads without
excessive deflection or distress
• Provide a sure foundation for
the road structure
• Respond to environmental
fluctuation without falling apart
Functional requirements tend to trigger rehab and replacement. Noise
increases the clockwise moment
Structural Requirements
Functional Requirements
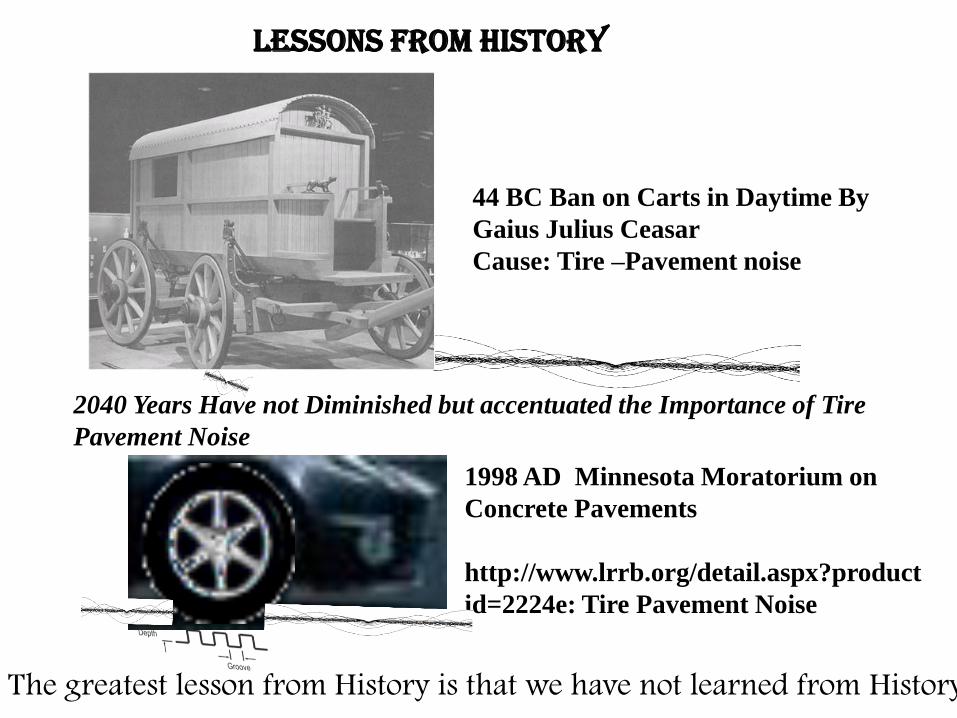
44 BC Ban on Carts in Daytime By
Gaius Julius Ceasar
Cause: Tire –Pavement noise
1998 AD Minnesota Moratorium on
Concrete Pavements
http://www.lrrb.org/detail.aspx?product
id=2224e: Tire Pavement Noise
2040 Years Have not Diminished but accentuated the Importance of Tire
Pavement Noise
LESSONS FROM HISTORY
The greatest lesson from History is that we have not learned from History
OBJECTIVES • Demystify “Variable” Version
of this puzzle
• Ascertain intrinsic features that govern the
Contribution of Variables to Surface
Characteristics
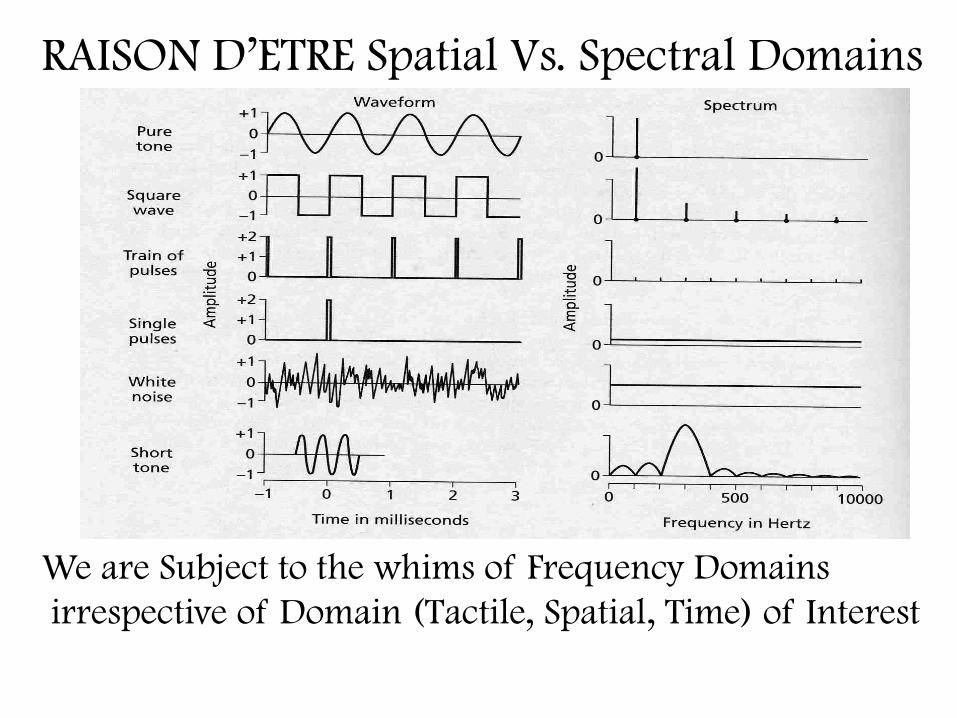
RAISON D’ETRE Spatial Vs. Spectral Domains
We are Subject to the whims of Frequency Domains
irrespective of Domain (Tactile, Spatial, Time) of Interest
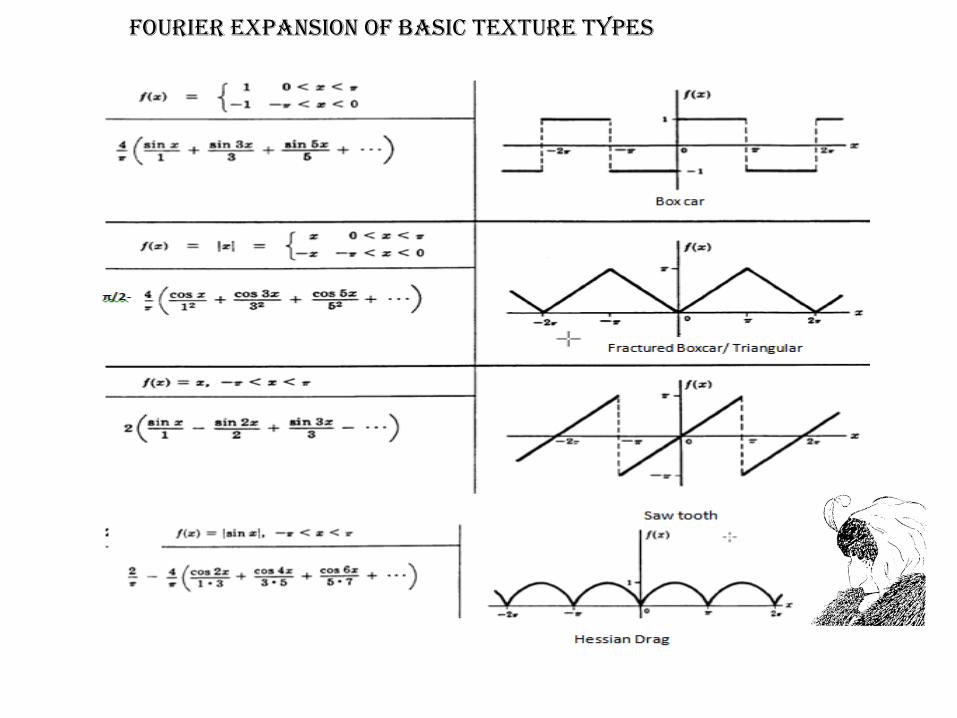
FOURIER EXPANSION OF BASIC TEXTURE TYPES
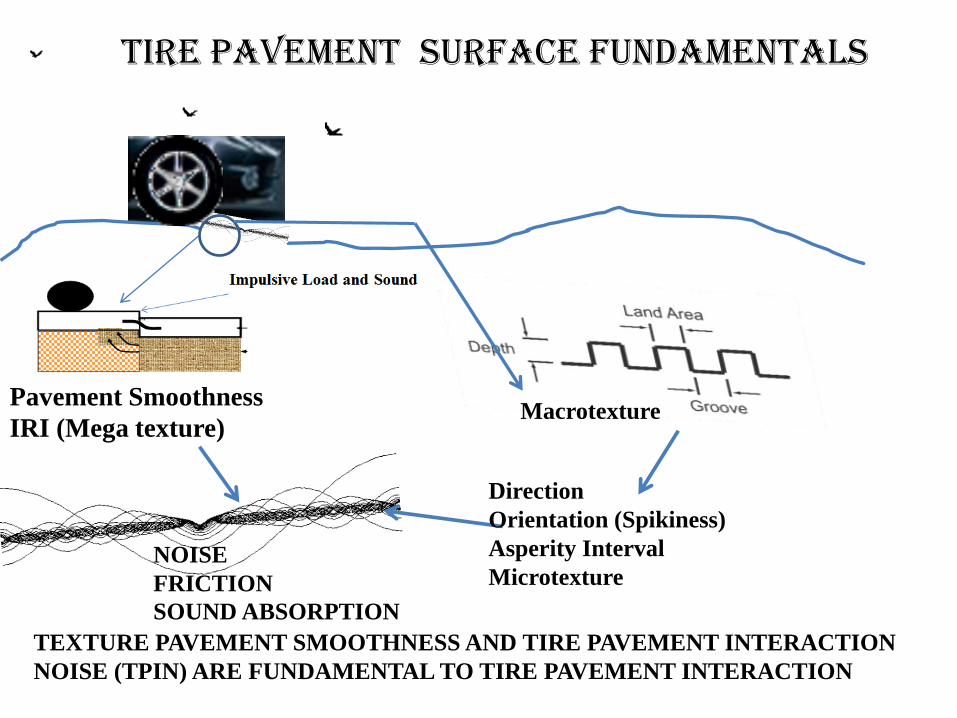
TIRE PAVEMENT SURFACE FUNDAMENTALS
NOISE
FRICTION
SOUND ABSORPTION
Pavement Smoothness
IRI (Mega texture)
TEXTURE PAVEMENT SMOOTHNESS AND TIRE PAVEMENT INTERACTION
NOISE (TPIN) ARE FUNDAMENTAL TO TIRE PAVEMENT INTERACTION
Macrotexture
Direction
Orientation (Spikiness)
Asperity Interval
Microtexture
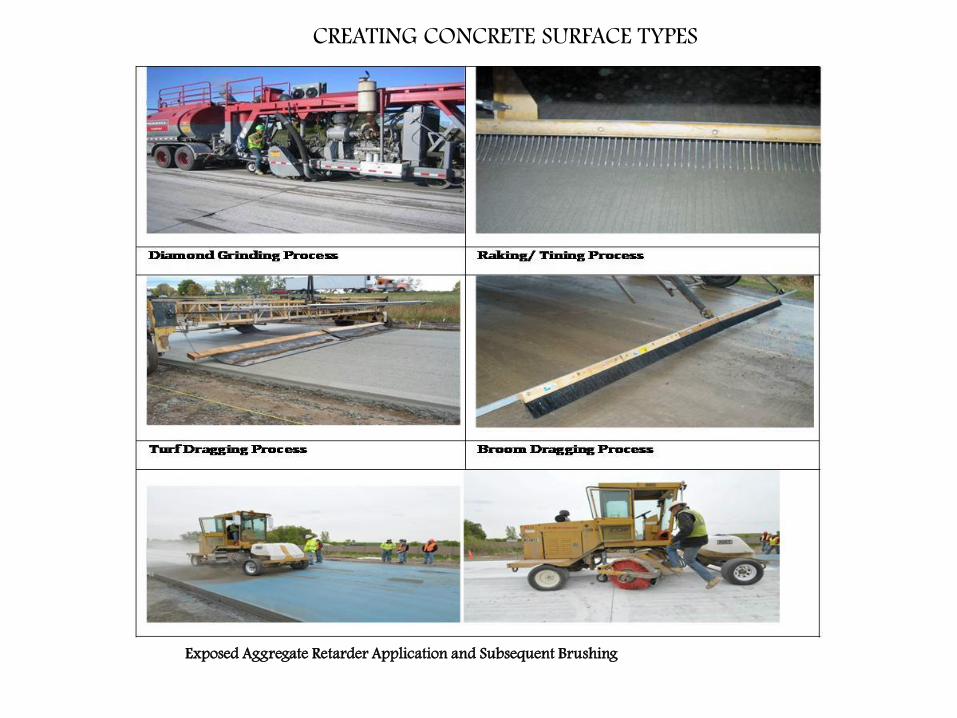
CREATING CONCRETE SURFACE TYPES
Exposed Aggregate Retarder Application and Subsequent Brushing
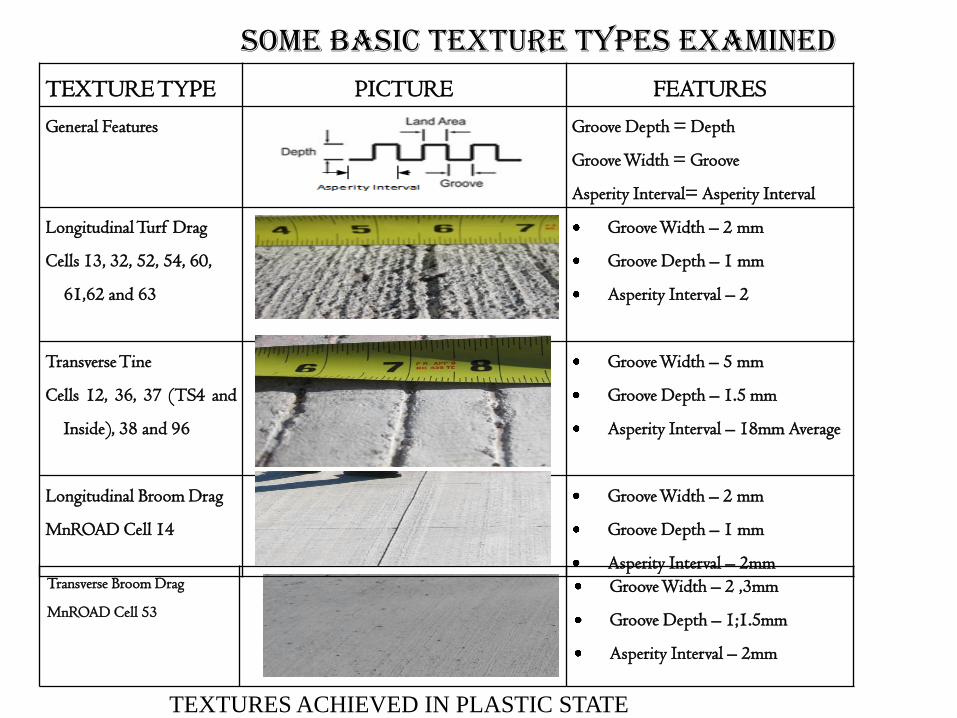
SOME BASIC TEXTURE TYPES EXAMINED
Transverse Broom Drag
MnROAD Cell 53
Groove Width – 2 ,3mm
Groove Depth – 1;1.5mm
Asperity Interval – 2mm
TEXTURE TYPE PICTURE FEATURES
General Features Groove Depth = Depth
Groove Width = Groove
Asperity Interval= Asperity Interval
Longitudinal Turf Drag
Cells 13, 32, 52, 54, 60,
61,62 and 63
Groove Width – 2 mm
Groove Depth – 1 mm
Asperity Interval – 2
Transverse Tine
Cells 12, 36, 37 (TS4 and
Inside), 38 and 96
Groove Width – 5 mm
Groove Depth – 1.5 mm
Asperity Interval – 18mm Average
Longitudinal Broom Drag
MnROAD Cell 14
Groove Width – 2 mm
Groove Depth – 1 mm
Asperity Interval – 2mm
TEXTURES ACHIEVED IN PLASTIC STATE
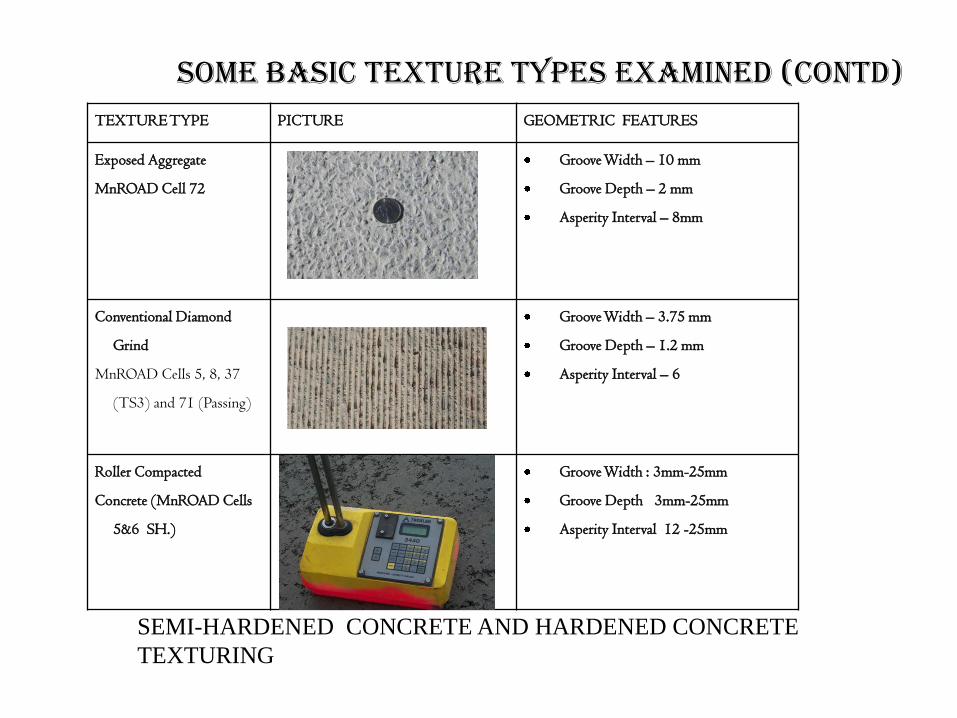
TEXTURE TYPE PICTURE GEOMETRIC FEATURES
Exposed Aggregate
MnROAD Cell 72
Groove Width – 10 mm
Groove Depth – 2 mm
Asperity Interval – 8mm
Conventional Diamond
Grind
MnROAD Cells 5, 8, 37
(TS3) and 71 (Passing)
Groove Width – 3.75 mm
Groove Depth – 1.2 mm
Asperity Interval – 6
Roller Compacted
Concrete (MnROAD Cells
5&6 SH.)
Groove Width : 3mm-25mm
Groove Depth 3mm-25mm
Asperity Interval 12 -25mm
SOME BASIC TEXTURE TYPES EXAMINED (CONTD)
SEMI-HARDENED CONCRETE AND HARDENED CONCRETE
TEXTURING
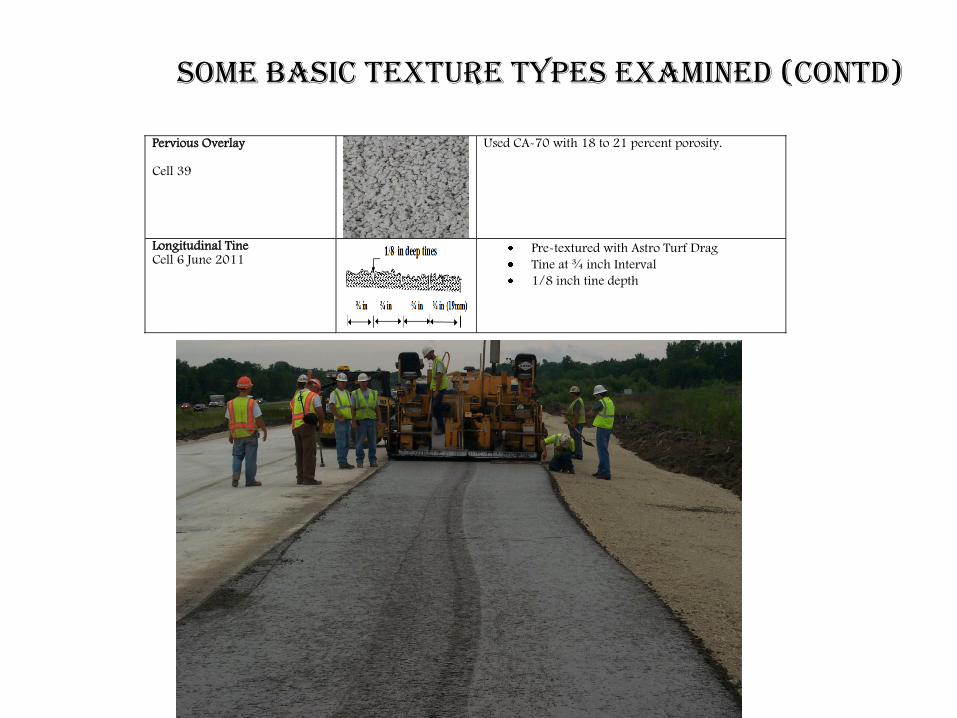
Pervious Overlay Cell 39
Used CA-70 with 18 to 21 percent porosity.
Longitudinal Tine Cell 6 June 2011
Pre-textured with Astro Turf Drag
Tine at ¾ inch Interval
1/8 inch tine depth
SOME BASIC TEXTURE TYPES EXAMINED (CONTD)
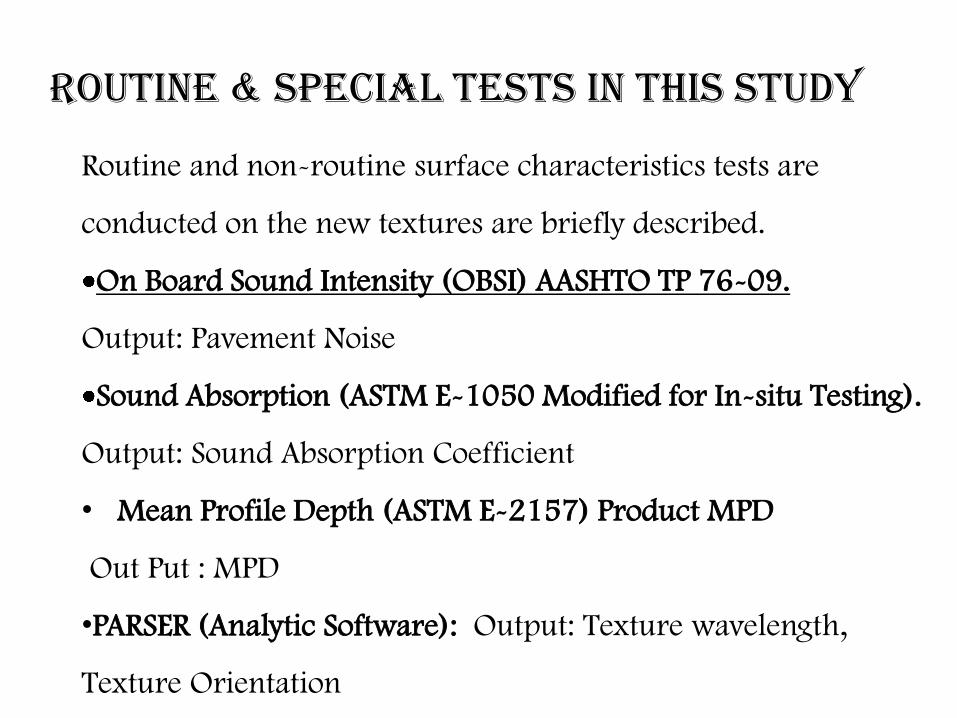
Routine and non-routine surface characteristics tests are
conducted on the new textures are briefly described.
On Board Sound Intensity (OBSI) AASHTO TP 76-09.
Output: Pavement Noise
Sound Absorption (ASTM E-1050 Modified for In-situ Testing).
Output: Sound Absorption Coefficient
• Mean Profile Depth (ASTM E-2157) Product MPD
Out Put : MPD
•PARSER (Analytic Software): Output: Texture wavelength,
Texture Orientation
ROUTINE & SPECIAL TESTS IN THIS STUDY
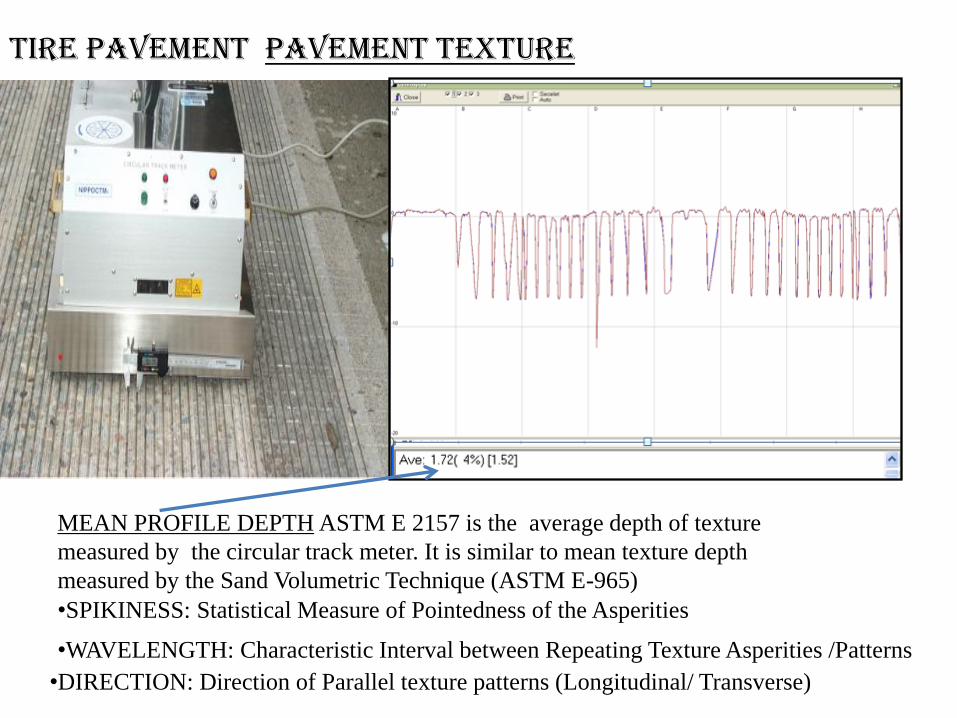
TIRE PAVEMENT PAVEMENT TEXTURE
MEAN PROFILE DEPTH ASTM E 2157 is the average depth of texture
measured by the circular track meter. It is similar to mean texture depth
measured by the Sand Volumetric Technique (ASTM E-965)
•SPIKINESS: Statistical Measure of Pointedness of the Asperities
•WAVELENGTH: Characteristic Interval between Repeating Texture Asperities /Patterns
•DIRECTION: Direction of Parallel texture patterns (Longitudinal/ Transverse)
0
0.05
0.1
0.15
0.2
0.25
0.3
400 500 630 800 1000 1250 1600
Sou
nd
Ab
sor
pt
ion
Frequency, Hz
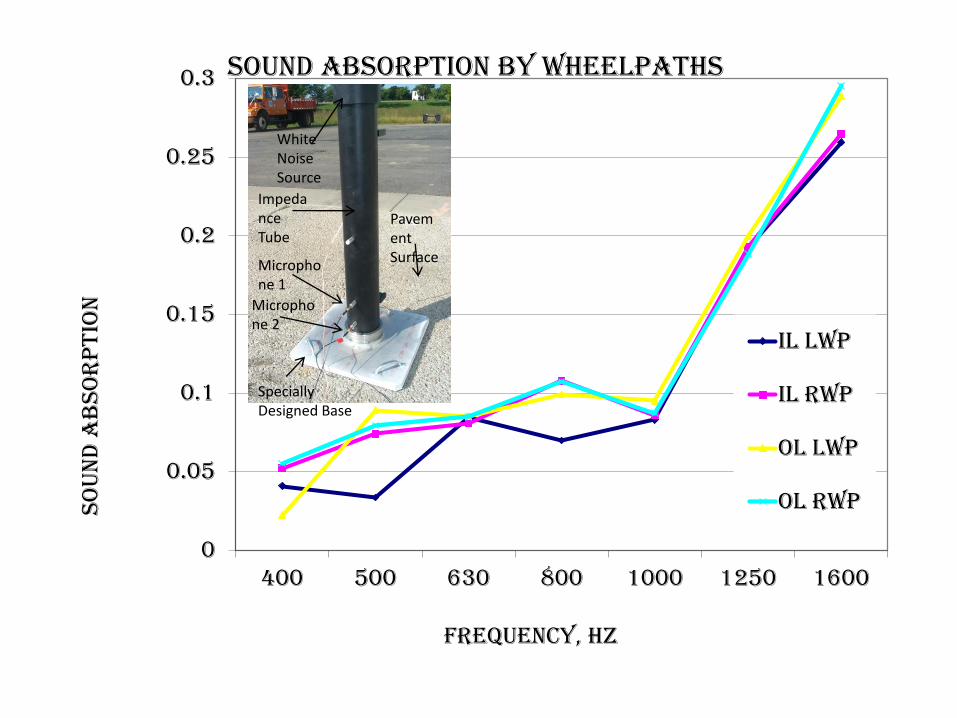
Sound Absorption by Wheelpaths
IL LWP
IL RWP
OL LWP
OL RWP
White Noise Source
Impedance Tube
Pavement Surface
Microphone 2
Microphone 1
Specially Designed Base
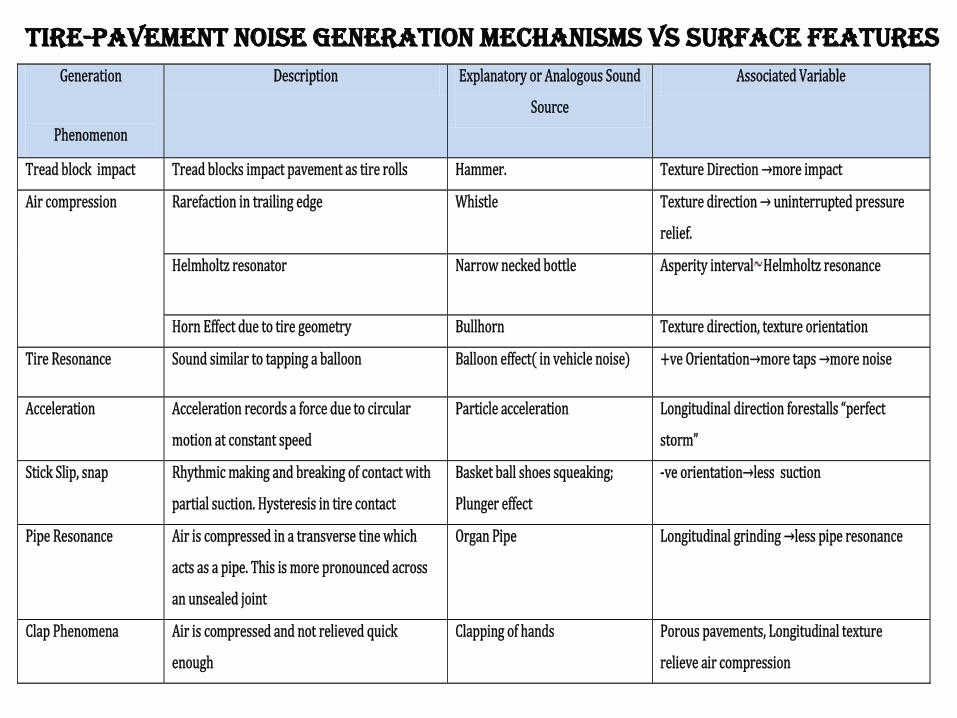
Generation
Phenomenon
Description Explanatory or Analogous Sound
Source
Associated Variable
Tread block impact Tread blocks impact pavement as tire rolls Hammer. Texture Direction →more impact
Air compression Rarefaction in trailing edge Whistle Texture direction → uninterrupted pressure
relief.
Helmholtz resonator Narrow necked bottle Asperity interval Helmholtz resonance
Horn Effect due to tire geometry Bullhorn Texture direction, texture orientation
Tire Resonance Sound similar to tapping a balloon Balloon effect( in vehicle noise) +ve Orientation→more taps →more noise
Acceleration Acceleration records a force due to circular
motion at constant speed
Particle acceleration Longitudinal direction forestalls “perfect
storm”
Stick Slip, snap Rhythmic making and breaking of contact with
partial suction. Hysteresis in tire contact
Basket ball shoes squeaking;
Plunger effect
-ve orientation→less suction
Pipe Resonance Air is compressed in a transverse tine which
acts as a pipe. This is more pronounced across
an unsealed joint
Organ Pipe Longitudinal grinding →less pipe resonance
Clap Phenomena Air is compressed and not relieved quick
enough
Clapping of hands Porous pavements, Longitudinal texture
relieve air compression
TIRE-PAVEMENT NOISE GENERATION MECHANISMS VS SURFACE FEATURES
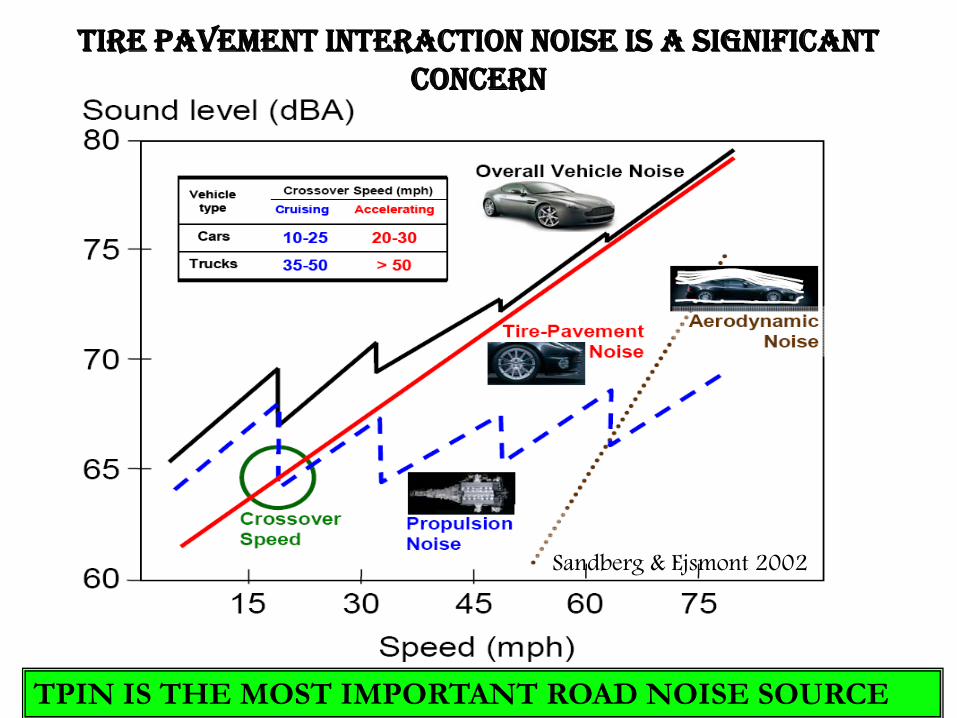
TIRE PAVEMENT INTERACTION NOISE IS A SIGNIFICANT CONCERN
TPIN IS THE MOST IMPORTANT ROAD NOISE SOURCE
Sandberg & Ejsmont 2002
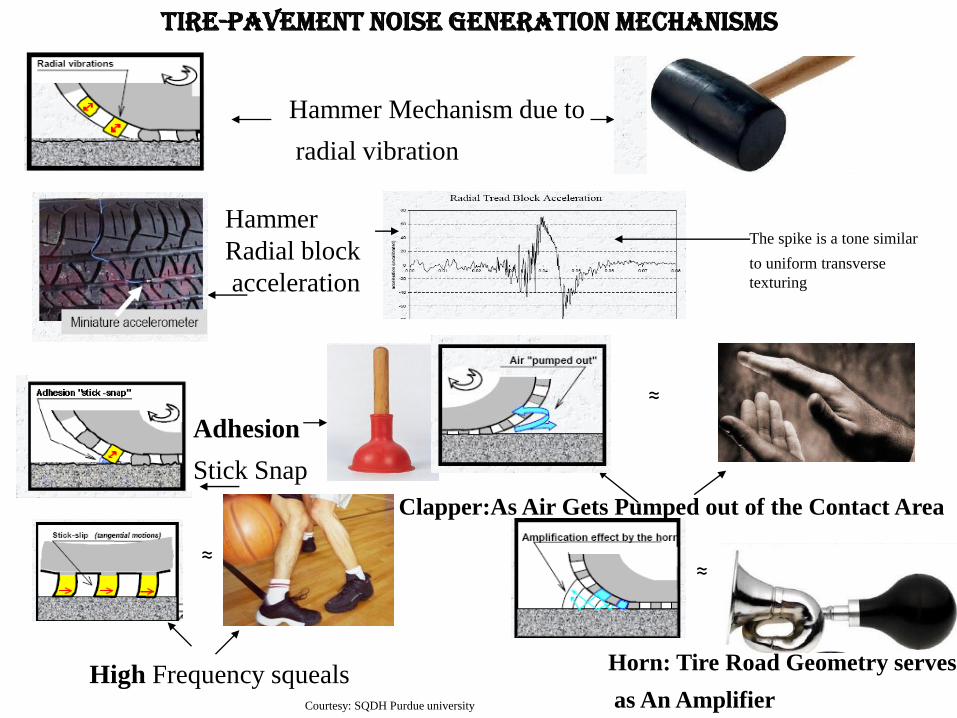
Hammer Mechanism due to
radial vibration
Hammer
Radial block
acceleration
Adhesion
Stick Snap
High Frequency squeals
Clapper:As Air Gets Pumped out of the Contact Area
Horn: Tire Road Geometry serves
as An Amplifier Courtesy: SQDH Purdue university
TIRE-PAVEMENT NOISE GENERATION MECHANISMS
The spike is a tone similar
to uniform transverse
texturing
≈
≈
≈
Friction using Lock wheel Skid Tester ASTM E-274 Ribbed Tire &
Smooth Tire ASTM E501 Output: FN (Ribbed) FN Smooth
Pavement Smoothness using Lightweight Profiler ASTM E 950
Output: International Roughness index (IRI), RN
Pavement Smoothness using Pathways Surface Van ASTM E950
Output: International Roughness index (IRI), RN, Rut Depth, Faulting
• Rolling Resistance: Rolling Resistance
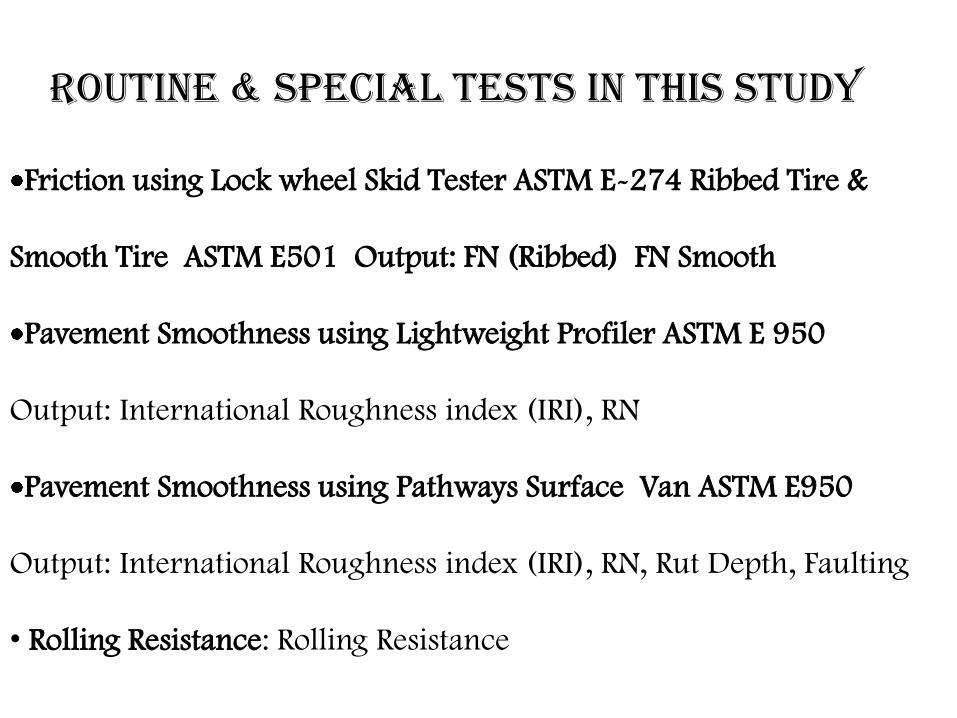
ROUTINE & SPECIAL TESTS IN THIS STUDY
Friction using Lock wheel Skid Tester ASTM E-274 Ribbed Tire &
Smooth Tire ASTM E501 Output: FN (Ribbed) FN Smooth
Pavement Smoothness using Lightweight Profiler ASTM E 950
Output: International Roughness index (IRI), RN
Pavement Smoothness using Pathways Surface Van ASTM E950
Output: International Roughness index (IRI), RN, Rut Depth, Faulting
• Rolling Resistance: Output:Rolling Resistance
ROUTINE & SPECIAL TESTS IN THIS STUDY
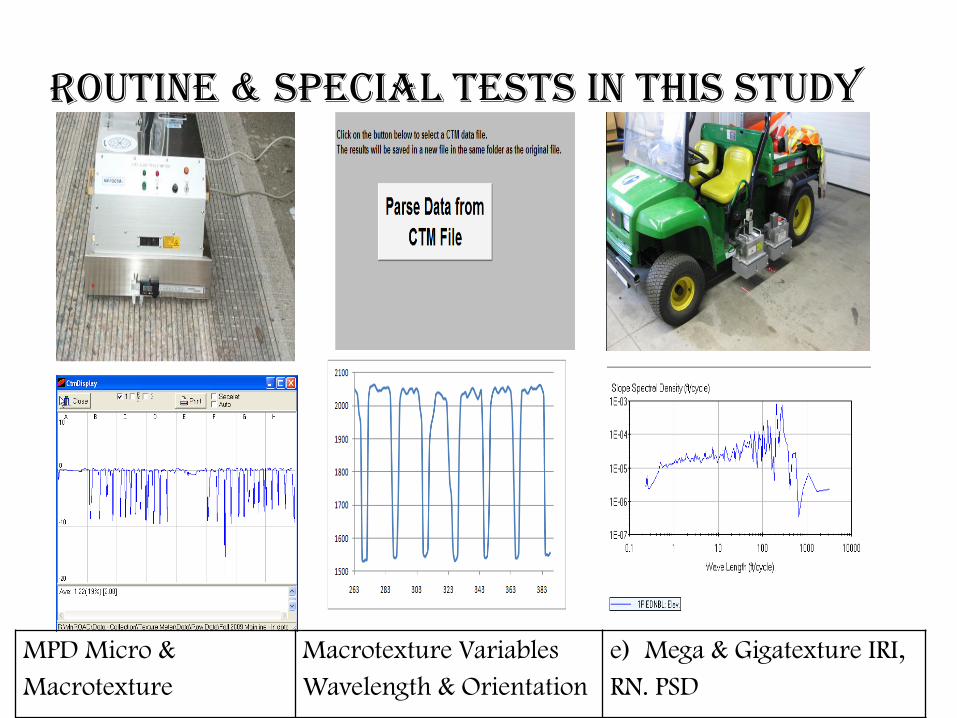
ROUTINE & SPECIAL TESTS IN THIS STUDY
Lightweight profiler Profilogram and Gain Algorithm
Interval (ft) IRI (in/mi)
0 to 528 130.8
528 to 1056 191.4
1056 to 1584 168.2
1,584 to 2112 116.3
2112 to 2640 140.8
2640 to 3168 125.8
3168 to 3241 113.1
Power Spectrum Density
MPD Micro &
Macrotexture
Macrotexture Variables
Wavelength & Orientation
e) Mega & Gigatexture IRI,
RN. PSD
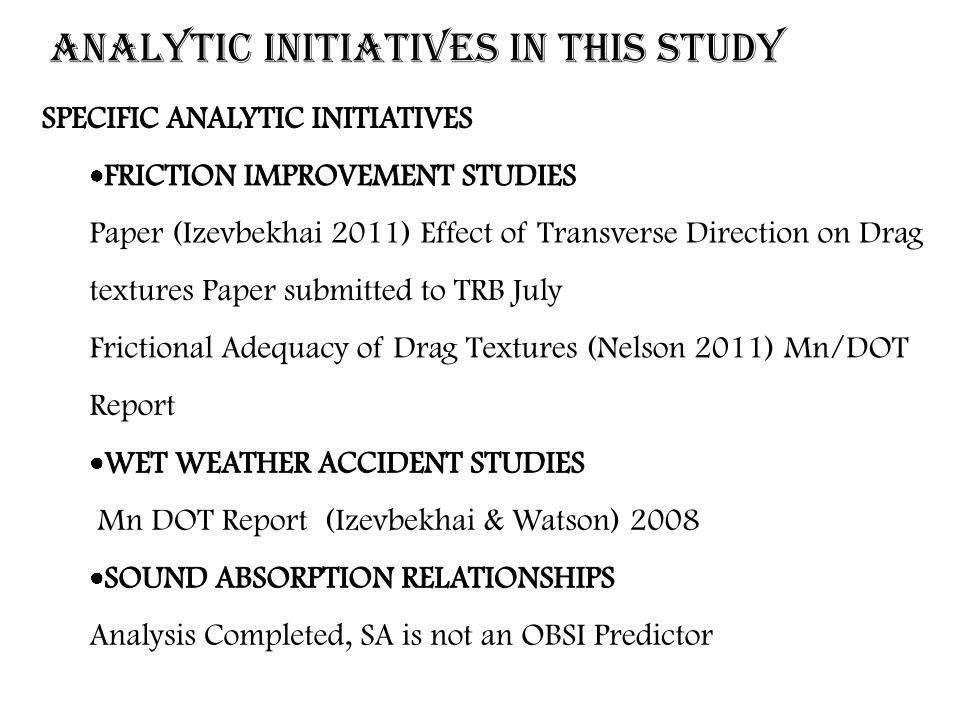
ANALYTIC INITIATIVES IN THIS STUDY
SPECIFIC ANALYTIC INITIATIVES
FRICTION IMPROVEMENT STUDIES
Paper (Izevbekhai 2011) Effect of Transverse Direction on Drag
textures Paper submitted to TRB July
Frictional Adequacy of Drag Textures (Nelson 2011) Mn/DOT
Report
WET WEATHER ACCIDENT STUDIES
Mn DOT Report (Izevbekhai & Watson) 2008
SOUND ABSORPTION RELATIONSHIPS
Analysis Completed, SA is not an OBSI Predictor
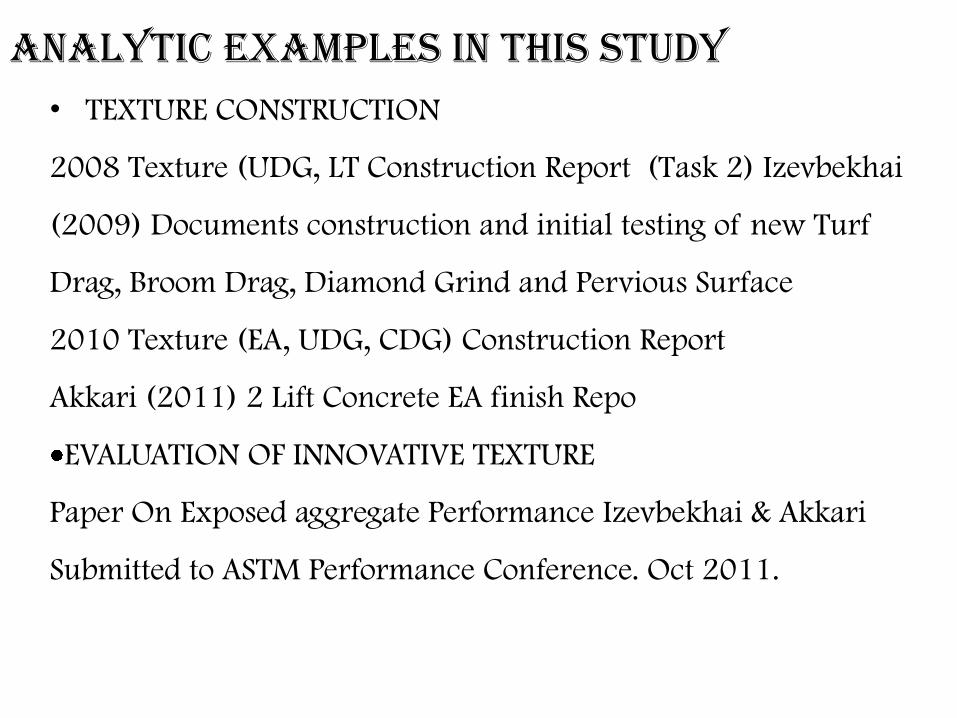
ANALYTIC EXAMPLES IN THIS STUDY • TEXTURE CONSTRUCTION
2008 Texture (UDG, LT Construction Report (Task 2) Izevbekhai
(2009) Documents construction and initial testing of new Turf
Drag, Broom Drag, Diamond Grind and Pervious Surface
2010 Texture (EA, UDG, CDG) Construction Report
Akkari (2011) 2 Lift Concrete EA finish Repo
EVALUATION OF INNOVATIVE TEXTURE
Paper On Exposed aggregate Performance Izevbekhai & Akkari
Submitted to ASTM Performance Conference. Oct 2011.
ANALYTIC EXAMPLES IN THIS STUDY
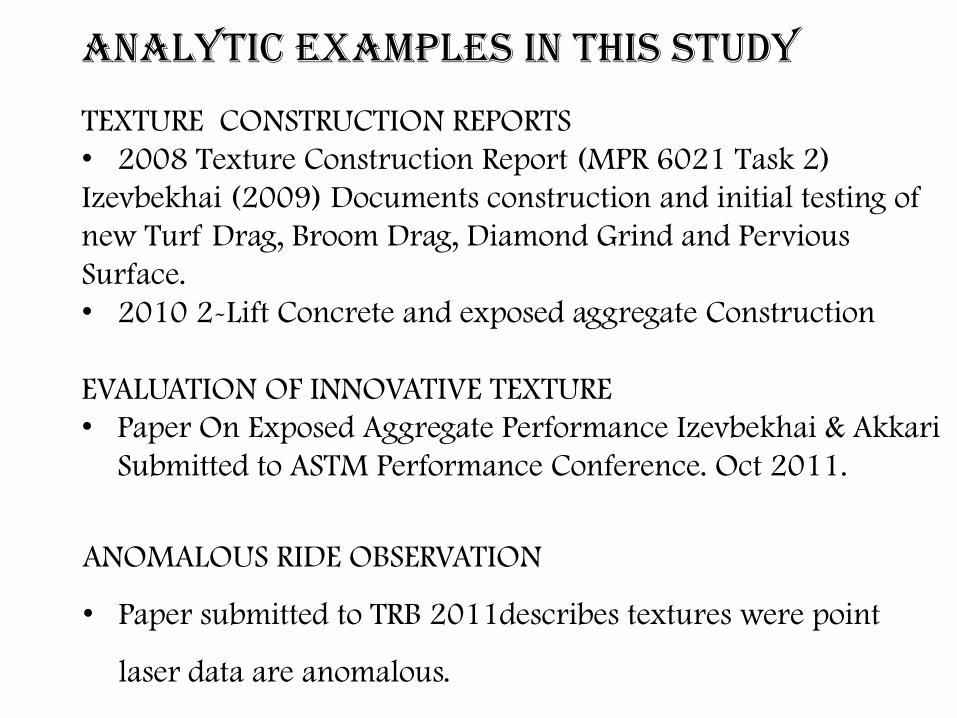
TEXTURE CONSTRUCTION REPORTS
• 2008 Texture Construction Report (MPR 6021 Task 2)
Izevbekhai (2009) Documents construction and initial testing of
new Turf Drag, Broom Drag, Diamond Grind and Pervious
Surface.
• 2010 2-Lift Concrete and exposed aggregate Construction
EVALUATION OF INNOVATIVE TEXTURE
• Paper On Exposed Aggregate Performance Izevbekhai & Akkari
Submitted to ASTM Performance Conference. Oct 2011.
ANOMALOUS RIDE OBSERVATION
• Paper submitted to TRB 2011describes textures were point
laser data are anomalous.
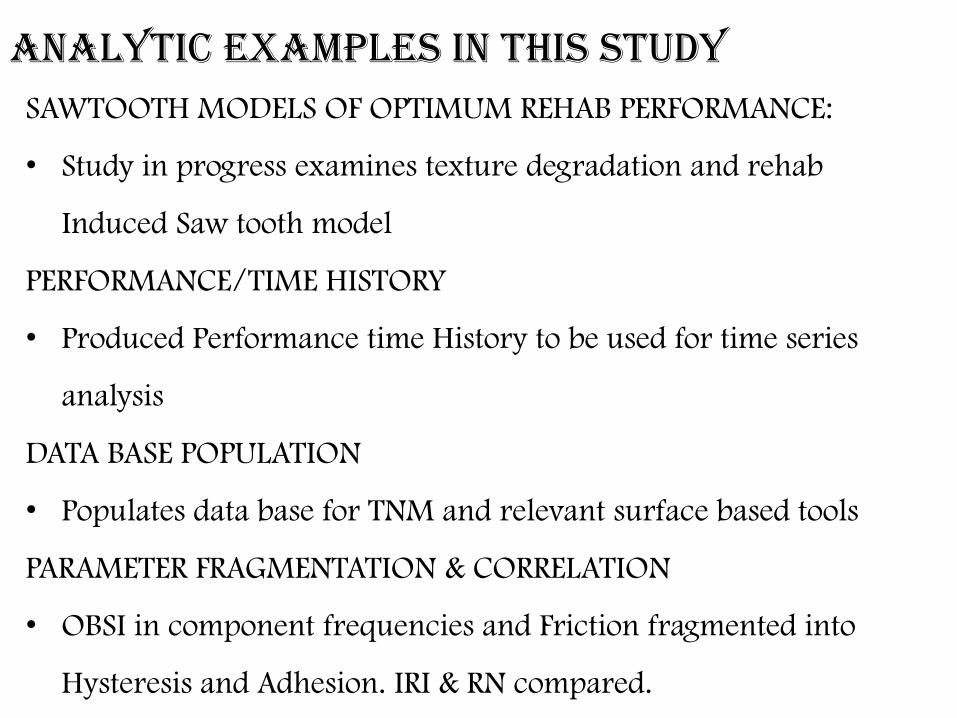
SAWTOOTH MODELS OF OPTIMUM REHAB PERFORMANCE:
• Study in progress examines texture degradation and rehab
Induced Saw tooth model
PERFORMANCE/TIME HISTORY
• Produced Performance time History to be used for time series
analysis
DATA BASE POPULATION
• Populates data base for TNM and relevant surface based tools
PARAMETER FRAGMENTATION & CORRELATION
• OBSI in component frequencies and Friction fragmented into
Hysteresis and Adhesion. IRI & RN compared.
ANALYTIC EXAMPLES IN THIS STUDY
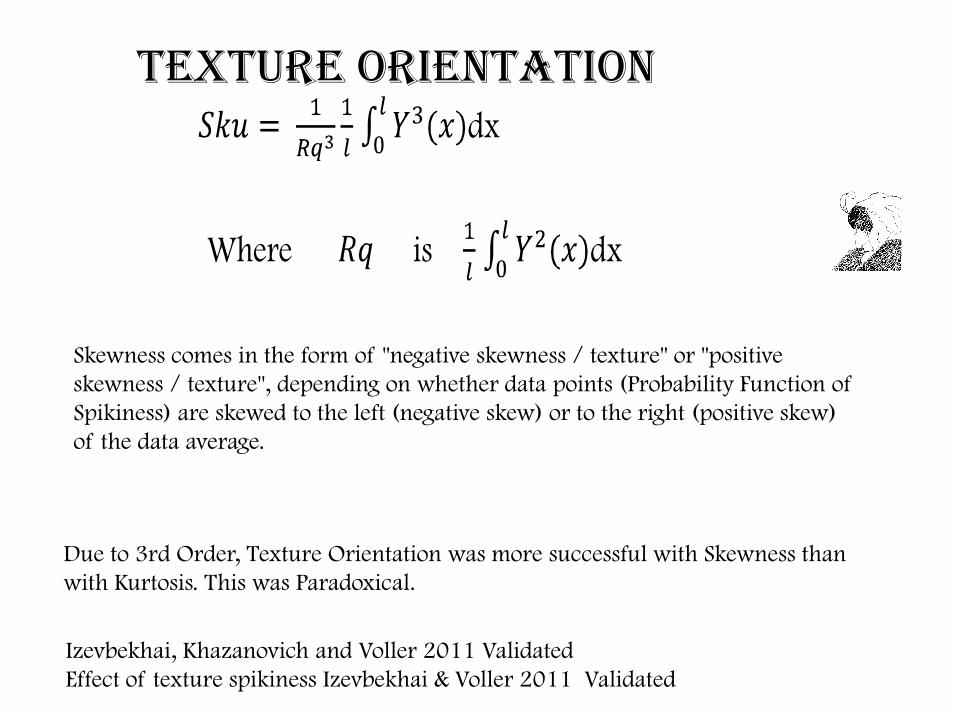
TEXTURE ORIENTATION dx ()
Where is dx
Due to 3rd Order, Texture Orientation was more successful with Skewness than
with Kurtosis. This was Paradoxical.
Izevbekhai, Khazanovich and Voller 2011 Validated
Effect of texture spikiness Izevbekhai & Voller 2011 Validated
Skewness comes in the form of "negative skewness / texture" or "positive
skewness / texture", depending on whether data points (Probability Function of
Spikiness) are skewed to the left (negative skew) or to the right (positive skew)
of the data average.
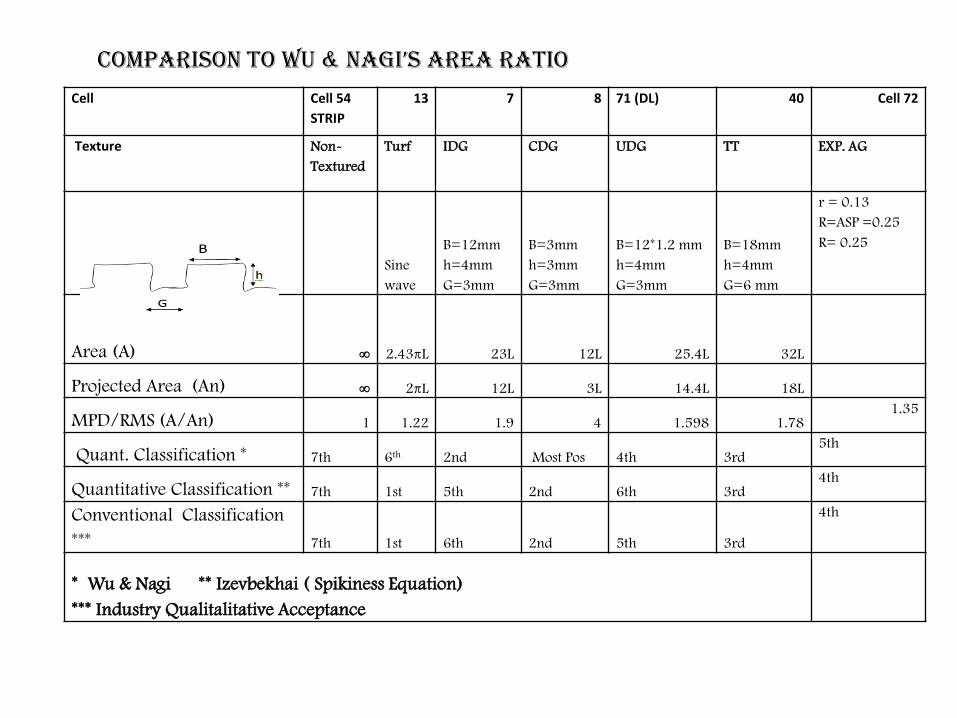
Cell Cell 54
STRIP
13 7 8 71 (DL) 40 Cell 72
Texture Non-
Textured
Turf IDG CDG UDG TT EXP. AG
Sine
wave
B=12mm
h=4mm
G=3mm
B=3mm
h=3mm
G=3mm
B=12*1.2 mm
h=4mm
G=3mm
B=18mm
h=4mm
G=6 mm
r = 0.13
R=ASP =0.25
R= 0.25
Area (A) ∞ 2.43πL 23L 12L 25.4L 32L
Projected Area (An) ∞ 2πL 12L 3L 14.4L 18L
MPD/RMS (A/An) 1 1.22 1.9 4 1.598 1.78 1.35
Quant. Classification * 7th 6th 2nd Most Pos 4th 3rd 5th
Quantitative Classification ** 7th 1st 5th 2nd 6th 3rd 4th
Conventional Classification
*** 7th 1st 6th 2nd 5th 3rd
4th
* Wu & Nagi ** Izevbekhai ( Spikiness Equation)
*** Industry Qualitalitative Acceptance
COMPARISON TO WU & NAGI’S AREA RATIO
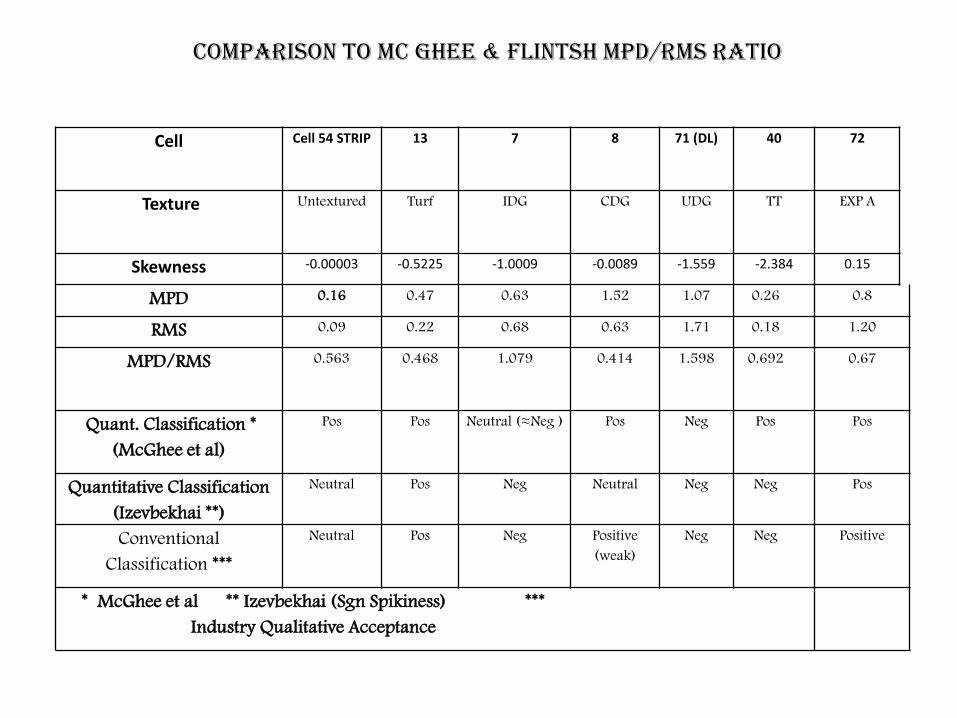
Cell Cell 54 STRIP 13 7 8 71 (DL) 40 72
Texture Untextured Turf IDG CDG UDG TT EXP A
Skewness -0.00003 -0.5225 -1.0009 -0.0089 -1.559 -2.384 0.15
MPD 0.16 0.47 0.63 1.52 1.07 0.26 0.8
RMS 0.09 0.22 0.68 0.63 1.71 0.18 1.20
MPD/RMS 0.563 0.468 1.079 0.414 1.598 0.692 0.67
Quant. Classification *
(McGhee et al)
Pos Pos Neutral (≈Neg ) Pos Neg Pos Pos
Quantitative Classification
(Izevbekhai **)
Neutral Pos Neg Neutral Neg Neg Pos
Conventional
Classification ***
Neutral Pos Neg Positive
(weak)
Neg Neg Positive
* McGhee et al ** Izevbekhai (Sgn Spikiness) ***
Industry Qualitative Acceptance
COMPARISON TO Mc GhEe & FLINTSH MPD/RMS RATIO
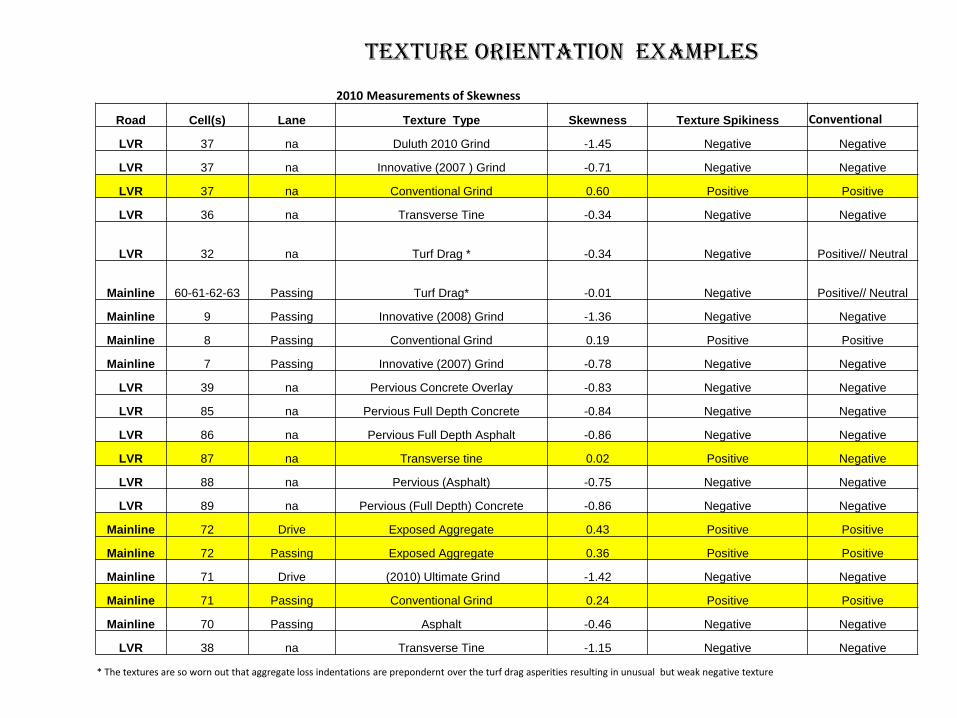
2010 Measurements of Skewness
Road Cell(s) Lane Texture Type Skewness Texture Spikiness Conventional
LVR 37 na Duluth 2010 Grind -1.45 Negative Negative
LVR 37 na Innovative (2007 ) Grind -0.71 Negative Negative
LVR 37 na Conventional Grind 0.60 Positive Positive
LVR 36 na Transverse Tine -0.34 Negative Negative
LVR 32 na Turf Drag * -0.34 Negative Positive// Neutral
Mainline 60-61-62-63 Passing Turf Drag* -0.01 Negative Positive// Neutral
Mainline 9 Passing Innovative (2008) Grind -1.36 Negative Negative
Mainline 8 Passing Conventional Grind 0.19 Positive Positive
Mainline 7 Passing Innovative (2007) Grind -0.78 Negative Negative
LVR 39 na Pervious Concrete Overlay -0.83 Negative Negative
LVR 85 na Pervious Full Depth Concrete -0.84 Negative Negative
LVR 86 na Pervious Full Depth Asphalt -0.86 Negative Negative
LVR 87 na Transverse tine 0.02 Positive Negative
LVR 88 na Pervious (Asphalt) -0.75 Negative Negative
LVR 89 na Pervious (Full Depth) Concrete -0.86 Negative Negative
Mainline 72 Drive Exposed Aggregate 0.43 Positive Positive
Mainline 72 Passing Exposed Aggregate 0.36 Positive Positive
Mainline 71 Drive (2010) Ultimate Grind -1.42 Negative Negative
Mainline 71 Passing Conventional Grind 0.24 Positive Positive
Mainline 70 Passing Asphalt -0.46 Negative Negative
LVR 38 na Transverse Tine -1.15 Negative Negative
* The textures are so worn out that aggregate loss indentations are prepondernt over the turf drag asperities resulting in unusual but weak negative texture
TEXTURE ORIENTATION EXAMPLES
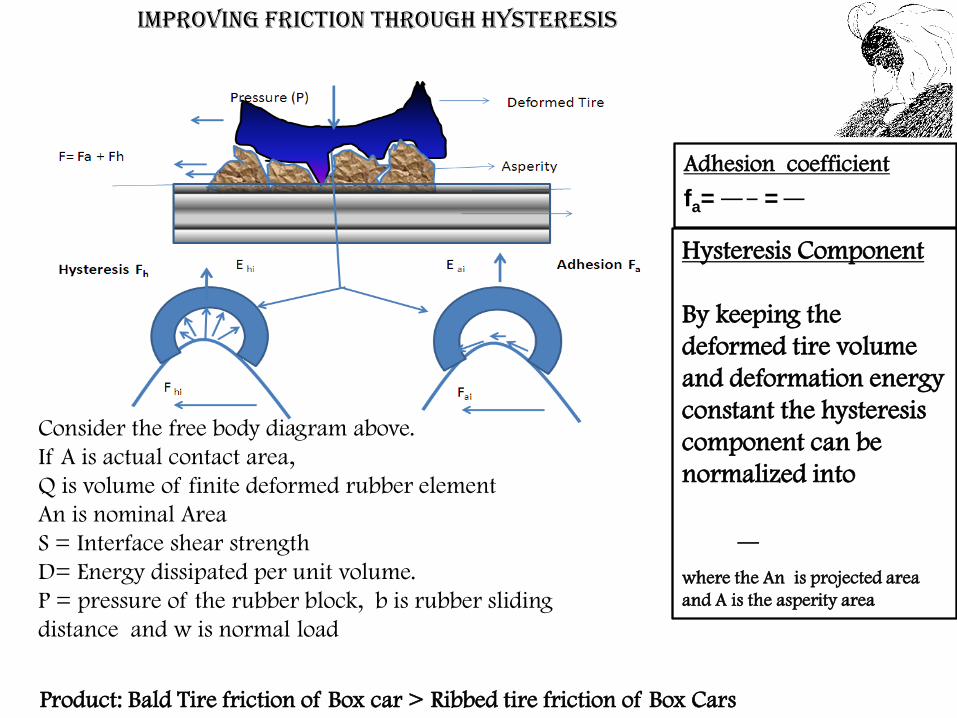
IMPROVING FRICTION THROUGH HYSTERESIS
Consider the free body diagram above.
If A is actual contact area,
Q is volume of finite deformed rubber element
An is nominal Area
S = Interface shear strength
D= Energy dissipated per unit volume.
P = pressure of the rubber block, b is rubber sliding
distance and w is normal load
Adhesion coefficient
fa=
=
Hysteresis Component
By keeping the
deformed tire volume
and deformation energy
constant the hysteresis
component can be
normalized into
where the An is projected area
and A is the asperity area
Product: Bald Tire friction of Box car > Ribbed tire friction of Box Cars
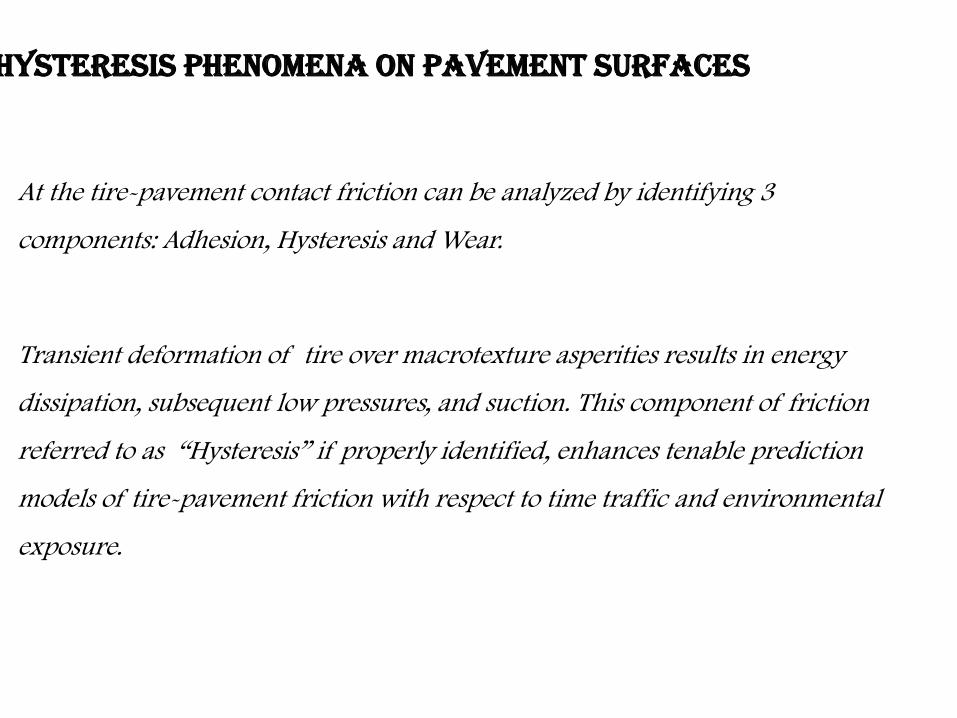
HYSTERESIS PHENOMENA ON PAVEMENT SURFACES
At the tire-pavement contact friction can be analyzed by identifying 3
components: Adhesion, Hysteresis and Wear.
Transient deformation of tire over macrotexture asperities results in energy
dissipation, subsequent low pressures, and suction. This component of friction
referred to as “Hysteresis” if properly identified, enhances tenable prediction
models of tire-pavement friction with respect to time traffic and environmental
exposure.
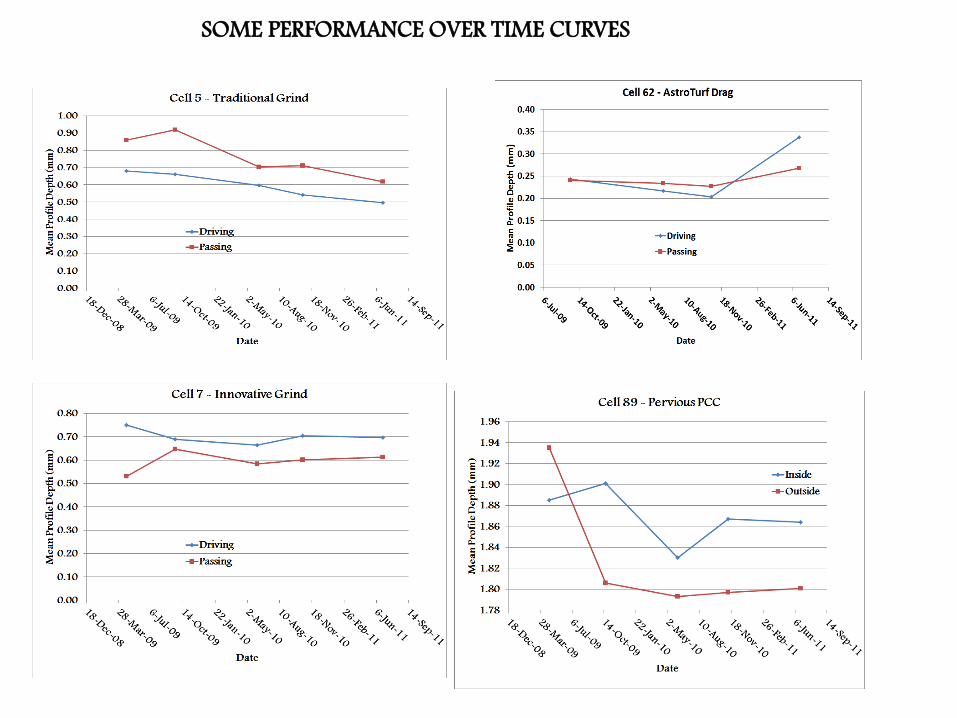
SOME PERFORMANCE OVER TIME CURVES
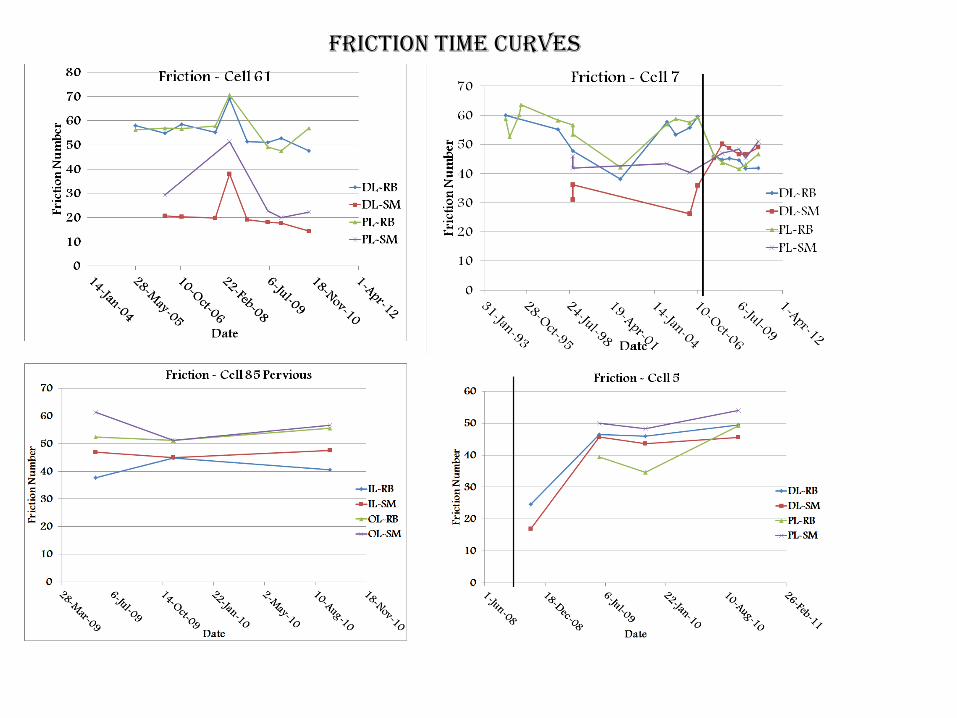
FRICTION TIME CURVES
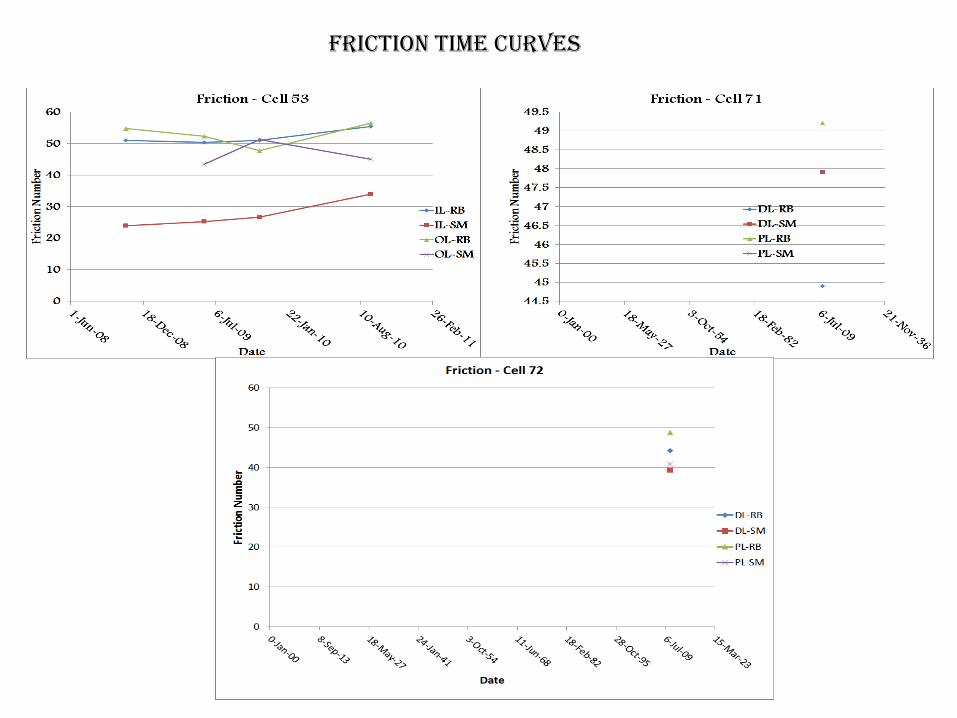
FRICTION TIME CURVES
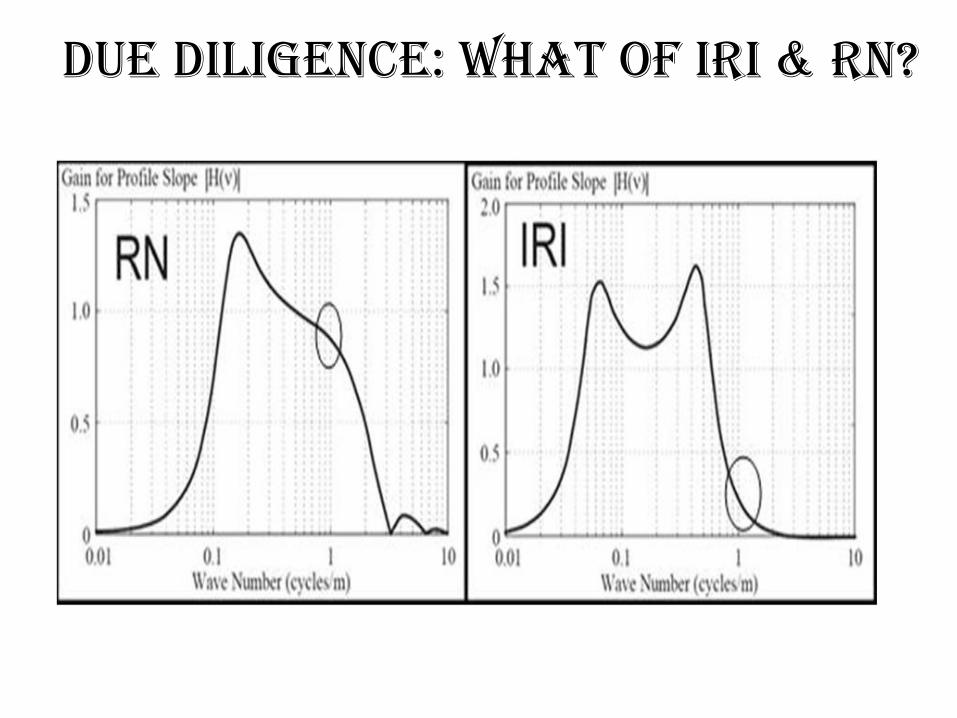
DUE DILIGENCE: What of IRI & RN?
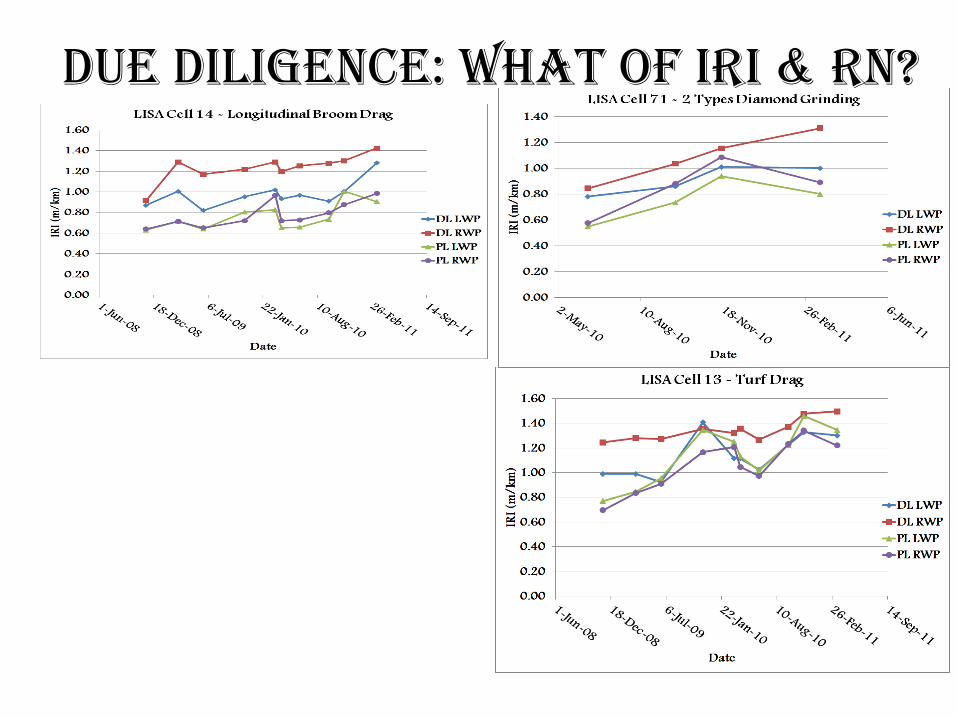
DUE DILIGENCE: What of IRI & RN?
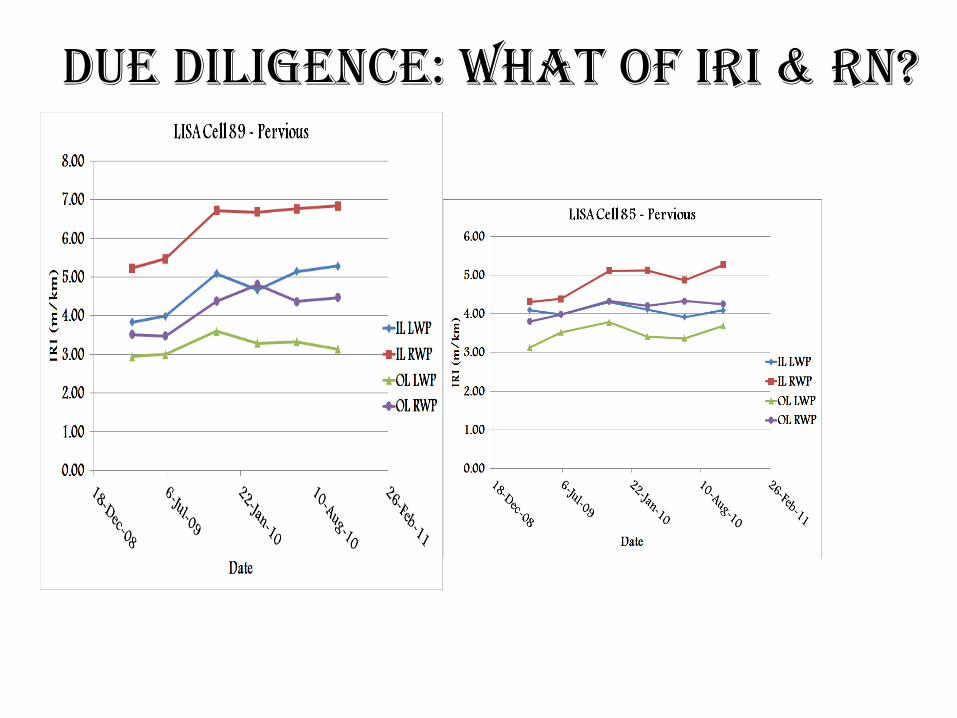
DUE DILIGENCE: What of IRI & RN?
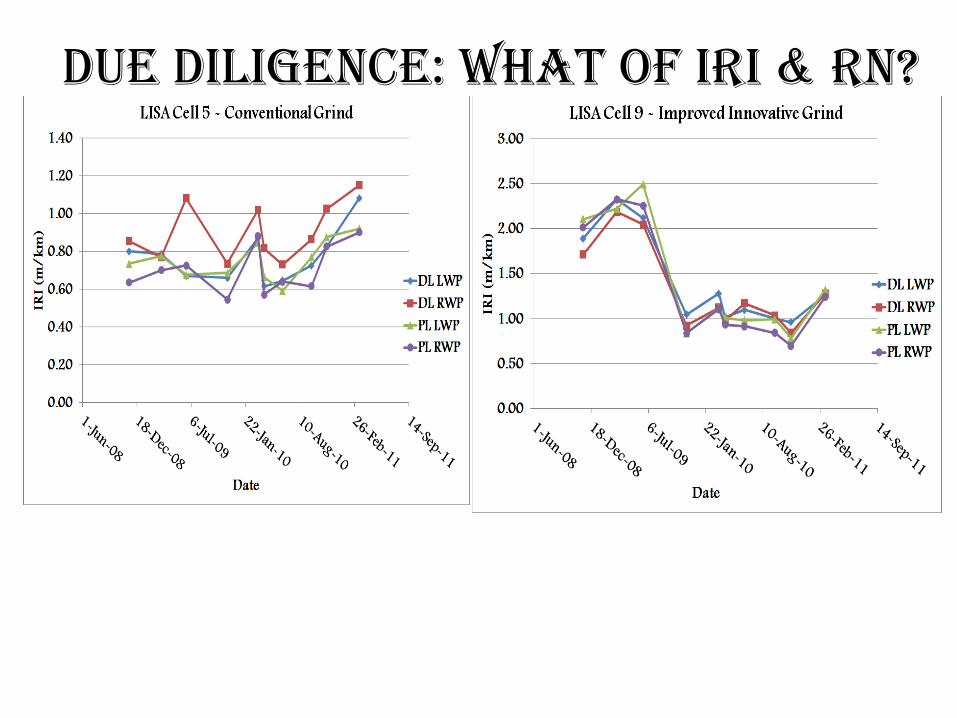
DUE DILIGENCE: What of IRI & RN?
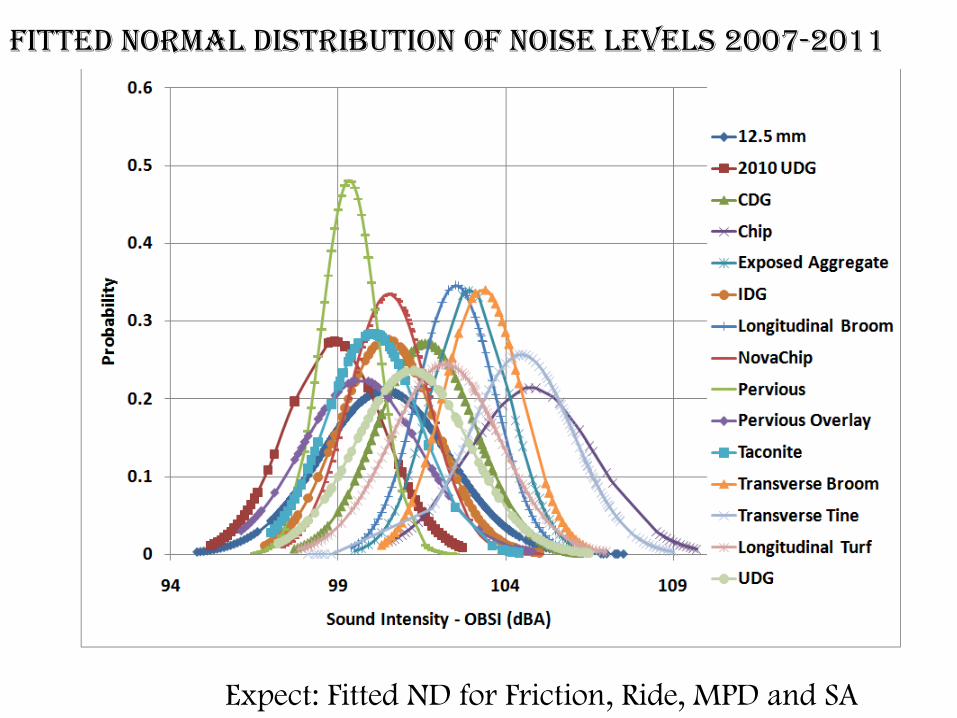
FITTED NORMAL DISTRIBUTION OF NOISE LEVELS 2007-2011
Expect: Fitted ND for Friction, Ride, MPD and SA
EXPECT MORE !!!!!!!!
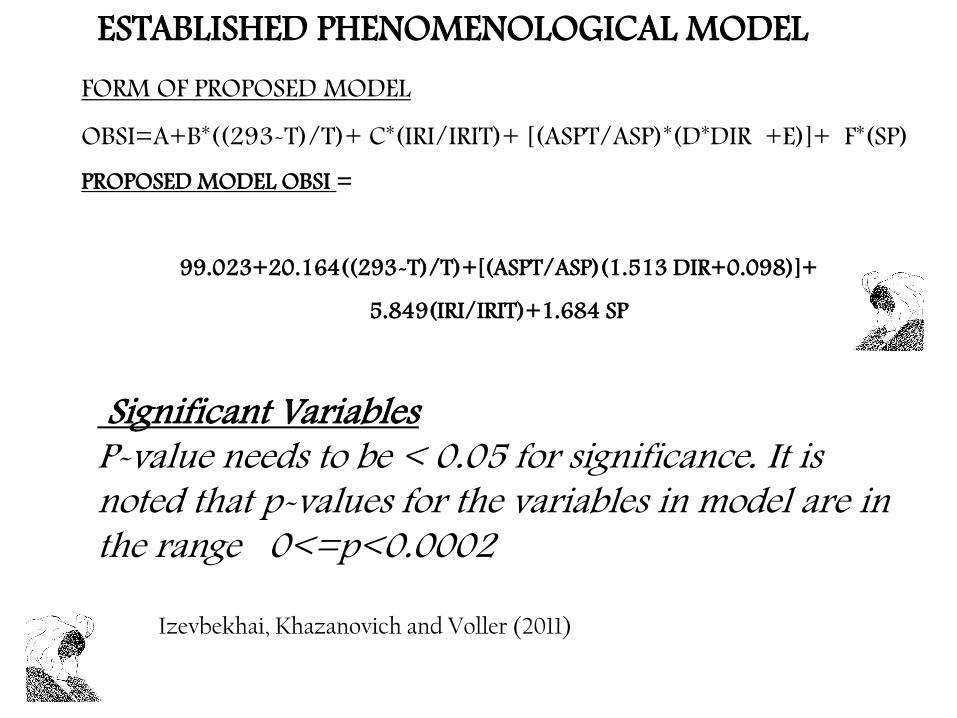
ESTABLISHED PHENOMENOLOGICAL MODEL
FORM OF PROPOSED MODEL
OBSI=A+B*((293-T)/T)+ C*(IRI/IRIT)+ [(ASPT/ASP)*(D*DIR +E)]+ F*(SP)
PROPOSED MODEL OBSI =
99.023+20.164((293-T)/T)+[(ASPT/ASP)(1.513 DIR+0.098)]+
5.849(IRI/IRIT)+1.684 SP
Significant Variables P-value needs to be < 0.05 for significance. It is noted that p-values for the variables in model are in the range 0<=p<0.0002
Izevbekhai, Khazanovich and Voller (2011)
QUESTIONS