Pavement Evaluation 2014 Virginia Tech
44
Pavement Evaluation 2014 Virginia Tech September 15 – 18, 2014 Resource International, Inc. Presented by: Todd Majidzadeh Julie Miller, PE Cherif Amer-Yahia, PhD, PE
Transcript of Pavement Evaluation 2014 Virginia Tech

Pavement Evaluation 2014 Virginia Tech
September 15 – 18, 2014 Resource International, Inc.
Presented by: Todd Majidzadeh
Julie Miller, PE Cherif Amer-Yahia, PhD, PE

• Rii was retained by the Client to perform GPR scans for use in pavement rehabilitation program on major toll road (AADT = 250,000) – Locate areas of high moisture content – Determine thickness of existing layers – Identify/locate voids – Detect areas of stripping
• Used non-contact horn antenna with center frequency of 1 GHz
• Data collected from right wheel path of each lane • Project included 44.71 Km of toll road with up to 8 to 10 lanes
of traffic
GPR for Pavement Rehabilitation

GPR System Used During Data Collection

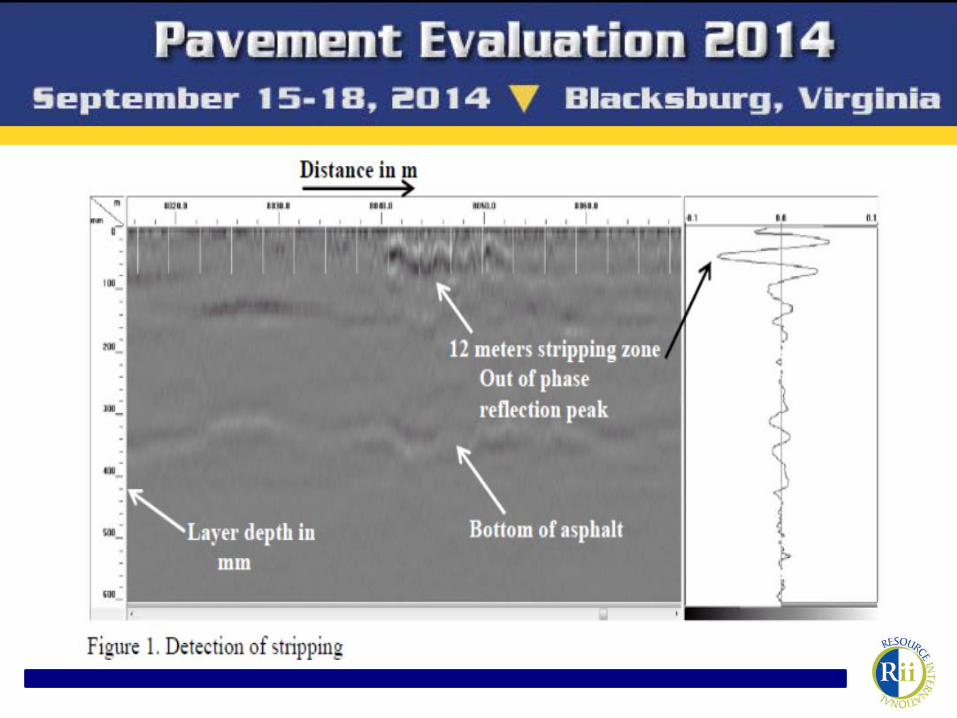
• Rii determined that the existing asphalt was severely stripped in many areas indicated by out-of-phase reflection peak – Radar wave travels from higher to lower dielectric
material – Low dielectric a function of low density of the
stripped material
GPR Findings

• As a result of the GPR findings, the Client further retained Rii to evaluate premature pavement failure of recent rehabilitation
Premature Pavement Failure

• The Client began to report premature pavement failures within two (2) to three (3) months following the final pavement placement
• Potholes, delamination, and staining reported • Failures continued to occur
Premature Pavement Failure

The Client began to report premature pavement failures within two (2) to three (3) months following the final pavement placement
Premature Pavement Failure

Potholes, delamination, and staining reported
Premature Pavement Failure

Potholes, delamination, and staining reported
Pavement Staining

• Review construction, materials, and testing records
• Site visit and interviews with owner and consultants
• Obtain pavement cores and test for specific parameters – Conformance to mix design – Potential for stripping
Rii’s Investigative Approach

• Three types of treatments – Cold milling and overlay (2”) – used most extensively
throughout the project – Cold milling and overlay with geogrid (3”) – Full depth repair and overlay
• Most work performed at night • Tropical climate (rain, high temps, humidity) • Warm Mix Asphalt
– Rediset® WMX with anti-stripping agent • Construction August 2012 – March 2013
Construction Review
• Construction records indicate there were areas of unsound pavement after cold milling – These were addressed by additional milling
• Milled pavement left open to traffic for up to 25 days (3 to 5 typical)
• Surface cleaned and tacked prior to paving – tack pick up noted in project photos
• MTV used with standard paver- most work at night • Mix temps were within specification • Rain reported in 10 of 41 paving lots
Construction Review
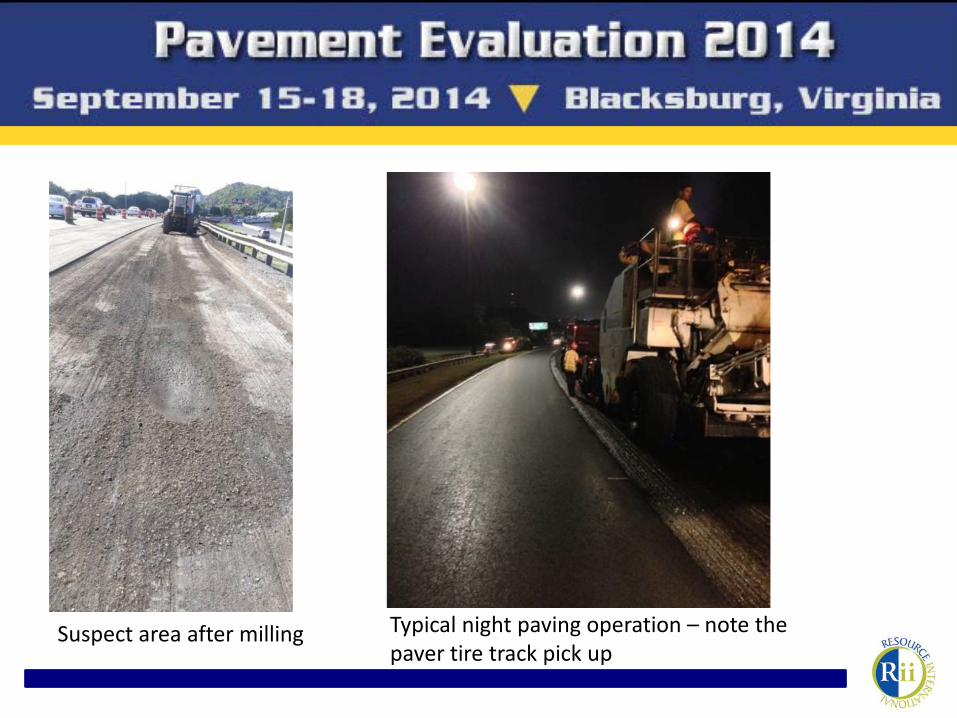
Suspect area after milling Typical night paving operation – note the paver tire track pick up


• Generally the mix was reported as acceptable in field • Air voids were reported to generally be in specification
– Ave. in-place compaction of 92 to 97% met in all but 2 lots
– Some individual in-place compaction less than spec
Construction Review


• Contractor performed testing of pavement cores • Determined:
– Permeability of overlay was very low – Saturation of cores 58 to 75% in new surface and
existing asphalt in distressed areas – Potential for stripping based on TSR was low (AASHTO
T-283) in new overlay with no distress; but high in areas of distress
Post Construction Testing Review

• Contractor in-situ moisture (% Saturation) was inconsistent with the results of the GPR testing performed by Rii
• Rii evaluated the dielectric constants in two (2) distressed areas to assess moisture conditions in the asphalt layers
Post Construction Testing Review

• Overall the GPR test data indicated that the asphalt material (new and existing) generally had low moisture content and the aggregate base material was generally dry
Post Construction Testing Review

• Contractor determined: – Water was infiltrating up through base material from
bottom or sides and through cracks in the old asphalt – Temperature fluctuations and traffic action caused
pore water pressure in old damaged asphalt to fracture the asphalt-aggregate bond in the new overlay
Post Construction Testing Review

• Potholes were observed in lower elevation areas and at higher elevations such as on ramp embankments
• Many potholes appeared in wheel paths • Potholes appeared to be depth of overlay
– Overlay material appeared delaminated from the milled surface with loose material in the associated pothole
– Distresses appeared consistent with stripping, either a cohesion failure between the aggregate surface and asphalt binder; or an adhesion failure within the asphalt binder itself.
• Project area is in coastal plane • During rainfall event lower elevation areas showed
evidence of ponding water in ditches.
Site Visit - Observations

• Cores obtained from 1 production lot represented distressed and non-distressed areas: – Area A with visible distress at a relatively low
pavement elevation area. – Area B with visible distress at a relatively higher
pavement elevation area. – Area C without visible distress.
Rii Testing

• Gradation & Percent passing sieve #200 • Percent binder (asphalt) content • In-place air void content • Moisture susceptibility testing (AASHTO T 283),Tensile
Splitting Ratio (TSR)
Rii Testing

AREA A
AREA B AREA C

A. Area with visible distress at a relatively low pavement elevation area.
Cold mill to ~3” inches; ~1-inch WMA leveling course; geogrid; and ~2” inches of WMA surface course.

A. Area with visible distress at a relatively low pavement elevation area.
Cold mill to ~3” inches; ~1-inch WMA leveling course; geogrid; and ~2” inches of WMA surface course.

B. Area with visible distress at a relatively higher pavement elevation area.
Cold mill to ~3” inches; ~1-inch WMA leveling course; geogrid; and ~2” inches of WMA surface course.

B. Area with visible distress at a relatively higher pavement elevation area.
Cold mill to ~3” inches; ~1-inch WMA leveling course; geogrid; ~2” inches of WMA surface course.

C. Area without visible distress. Cold mill and place ~2” of WMA surface course.
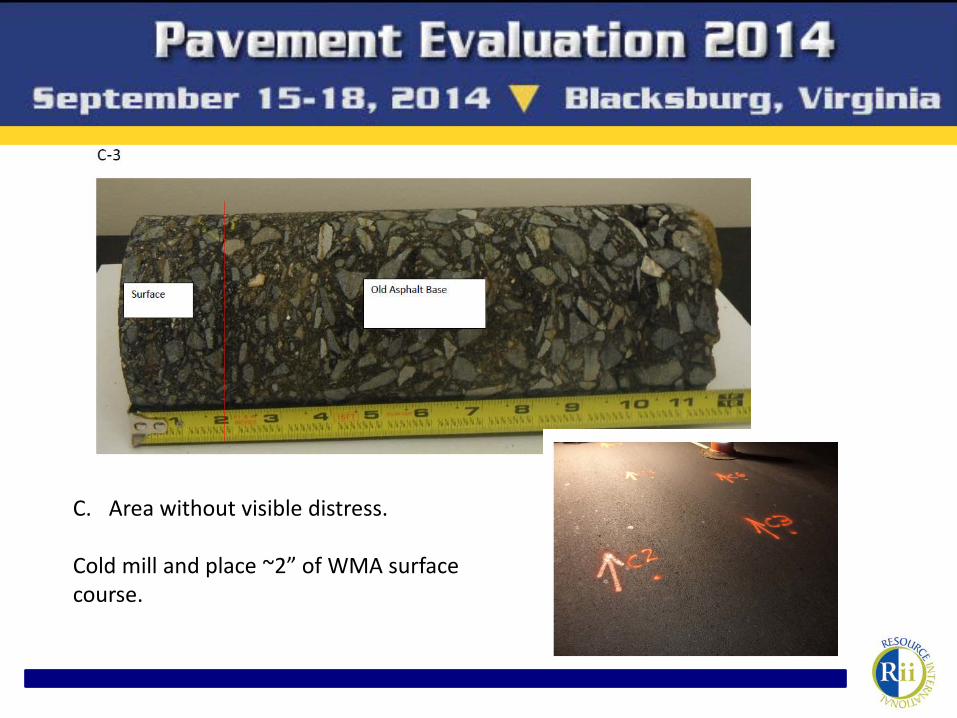
C. Area without visible distress. Cold mill and place ~2” of WMA surface course.

Rii testing Gradation
• Gradation tests indicated that the mixes in all three areas (A, B and C) had similar gradation characteristics with little or no variability
• There was not excessive material passing the #200 sieve
Rii Testing - Gradation

• Percent Binder (Asphalt) Content of the new surface mix ranged from 5.9 to 6.7 as compared to the JMF of 5.52
Rii Testing – Binder Content

• Average percent air voids ranged from 4.823 to 6.421 – Area A with visible failures and relatively low elevation
had lowest average air voids (highest average in-place compaction of 95.2%)
– Area C with no visible failures had the highest average air voids (lowest average in-place compaction of 93.6%)
– All within specification and not statistically different
Rii Testing – In place AVs – New Surface Course

• Average percent air voids ranged from 10.125 to 6.284 (89.9 % to 93.7% average in-place compaction) – Area A with visible failures had the lowest average in-
place compaction of 89.9% – Area C with no visible failures had the highest average
in-place compaction of 93.7%.
Rii Testing – In place AVs – Existing Asphalt Base Course

Test Area Average Strength,
Unconditioned (Dry) Samples, psi
Average Strength, Conditioned (Wet)
Samples, psi Strength Ratio
A-Top 120.5 105.1 0.87
B-Top 104.5 77.5 0.74
C-Top 104.2 87.5 0.84
JMF 130.9 130.7 0.969
Spec 80 80 0.75
A-Bottom 126.6 71.55 0.56
B- Bottom 121.3 77.44 0.64
C- Bottom 153.4 102.97 0.67
Contractor’s testing of new surface had TSR results of 0.33 to 0.51 in distressed area; and 0.96 to 1.05 in non-distressed area; and TSR of 0.75 of existing asphalt for both distressed and non-distressed areas
Rii Testing - TSR

• Mix was not the issue; the new asphalt overlay – was within specification for gradation, binder content,
TSR – Field compaction was within specification
• Existing asphalt had areas of stripping – Evidenced using GPR and confirmed with cores
Rii Determination

• Construction practices suspect – Cold milled surface left open to rain and traffic – LPN 15 left open from 6 to 11 days
Rii Determination

• Water entered old stripped asphalt matrix and was trapped when overlay was placed
• Trapped water can condense causing pressure in matrix in turn causing potholes in new asphalt course
Rii Determination

AREA A
Pink highlights indicate areas of stripping detected by GPR
Rii Determination

AREA B AREA C
Pink highlights indicate areas of stripping detected by GPR
Rii Determination

TACK PICK UP
• Tack pick up during paving operation can contribute to pavement delamination
Rii Determination

• Rii determined mechanisms of premature failure were: – Milled surface open to rain and traffic for long periods
coupled with questionable structural integrity of existing asphalt
– Additional Delamination/de-bonding due to tack placement issues
– Could not corroborate that moisture was coming from subgrade
– The use of GPR was very effective in determining stripped areas that likely contributed to premature failure
Summary

www.ResourceInternational.com
Julia Miller, PE Director – CM of Infrastructure Services [email protected]
Todd Majidzadeh Executive Vice President [email protected]
Thank You
Cherif Amer-Yahia, PhD, PE Director – NDE & Technology Division [email protected]


![Composite Pavement Virginia Tech 09 Cr2[1]](https://static.fdocuments.in/doc/165x107/577d36c61a28ab3a6b93fd5c/composite-pavement-virginia-tech-09-cr21.jpg)